distribution of the burden of new york city’s...
TRANSCRIPT
S T A T E O F N E W Y O R K C I T Y ’ S H O U S I N G & N E I G H B O R H O O D S 2 0 1 1 7
Distribution of the Burden of
New York City’s Property Tax
This section examines how different types of property are assessed in the city, and finds significant disparities in the effective tax rates of single family homes versus large rental apartment buildings.

8 T H E F U R M A N C E N T E R F O R R E A L E S T A T E & U R B A N P O L I C Y8 T H E F U R M A N C E N T E R F O R R E A L E S T A T E & U R B A N P O L I C Y
P roperty owners are not the only people or businesses that pay property taxes. Although homeowners, utility companies, and commer-cial and residential landlords receive the bills,
they do not bear the economic cost of the property tax alone. Instead, the property tax burden is distrib-uted widely and paid in a variety of ways, some more visible than others. A portion of the rent paid by com-mercial tenants goes towards the building’s property taxes. When taxes go up, commercial rents are likely to rise, which in turn places upward pressure on the prices those businesses charge for their goods and ser-vices, and puts downward pressure on the wages they pay their employees and the profits they return to their owners. A portion of the purchase price of every good sold in New York likely goes towards the property tax expense borne by the good’s manufacturer, distribu-tor, and/or seller. Like their commercial counterparts, residential landlords are likely to pass on at least some of their property tax expenses, along with all the other expenses associated with running a building, to their tenants through rents.
Although the burden of the property tax is spread widely, it is not distributed equally. As the rest of this chapter demonstrates, New York City’s property tax system provides for radically different tax treatment of equally valuable properties, depending on the use of the property and the form in which it is owned. This inequality is especially pronounced in the preferential treatment shown to homeowners at the expense of resi-dential landlords and their tenants.
Many of the inequities and peculiarities of New York City’s property tax are well-documented. In 2006, on the 25th anniversary of the legislation establishing the cur-rent system, the city’s Independent Budget Office (IBO) published a comprehensive report that analyzed changes in property tax burdens since 1981 and described the his-torical and political context of the city’s tax regime.1 Over the years, there has been a great deal of commentary by governmental and non-governmental organizations such as the IBO,2 the New York Public Interest Research
1 IBO (2006).
2 See, e.g., IBO (2011).
Group,3 the 1993 Real Property Tax Reform Commission,4 and the Manhattan Institute5 addressing some of the issues we raise in this chapter.
It is worth revisiting some of these issues, because many neighborhoods in the city have seen dramatic declines in property values since 2006 that have altered some of the patterns identified in earlier reports. In addi-tion, the property tax was in the news in 2011 more than usual. In January, the city’s publication of the tentative assessment roll for fiscal year 2012 sparked an uproar. Sharp increases in the assessed values of certain co-ops in Queens, later explained as a correction to systematic under-assessment in previous years, led to an accusation that the assessment increases were “an assault by the Bloomberg administration on the middle class.”6 Then, in July, in the wake of the financial crisis, the State Leg-islature passed a new cap limiting annual property tax increases to two percent or the rate of inflation, which-ever is less.7 Although the cap was warmly received by many taxpayers, it exacerbated the difficulties of munici-palities already struggling with their budgets.8 While New York City is exempt from the new cap, its passage is indicative of the frustration that taxpayers feel when faced with growing tax bills emanating from a system they struggle to understand. Homeowners have been especially dismayed by assessments that rose even as the values of their homes fell, leading a Staten Island coun-cilman to ask whether “we owe it to the public to explain to them just exactly how we are picking their pockets.”9 Despite the valiant efforts of academics, journalists, and the Department of Finance (DOF) itself, “the average New Yorker surely finds [the city’s property tax] as mys-tifying as ever.”10
This chapter has two primary goals. The first is to demystify the operation of New York City’s property tax system. We offer a thorough yet intelligible case study of how the tax bill for both a single-family home and a
3 NYPIRG (1981).
4 NYC RPTRC (1993).
5 Scanlon and Cohen (2009).
6 Bilefksy (2011).
7 See N.Y. EDUC. LAW § 2023-A.
8 Kaplan (2011).
9 Hennelly (2012).
10 Scanlon and Cohen (2009).
S T A T E O F N E W Y O R K C I T Y ’ S H O U S I N G & N E I G H B O R H O O D S 2 0 1 1 9
rental apartment building would be calculated under current law. Our choice of properties for the case study furthers our second goal: to highlight the unfavorable tax treatment of larger rental buildings when compared to smaller homes, co-ops and condos. In the wake of the foreclosure crisis, many New Yorkers find themselves facing a daunting rental market: decreased production of rental units accompanied by an increased demand for those units. At the same time, the crisis has precipitated a re-examination of the extraordinary benefits provided to homeowners through tax and regulatory policies. In this context, the inequitable tax treatment of rental buildings demands scrutiny. Below we explain the causes and possi-ble consequences of this inequity and suggest ways to get the conversation about property tax reform started again.
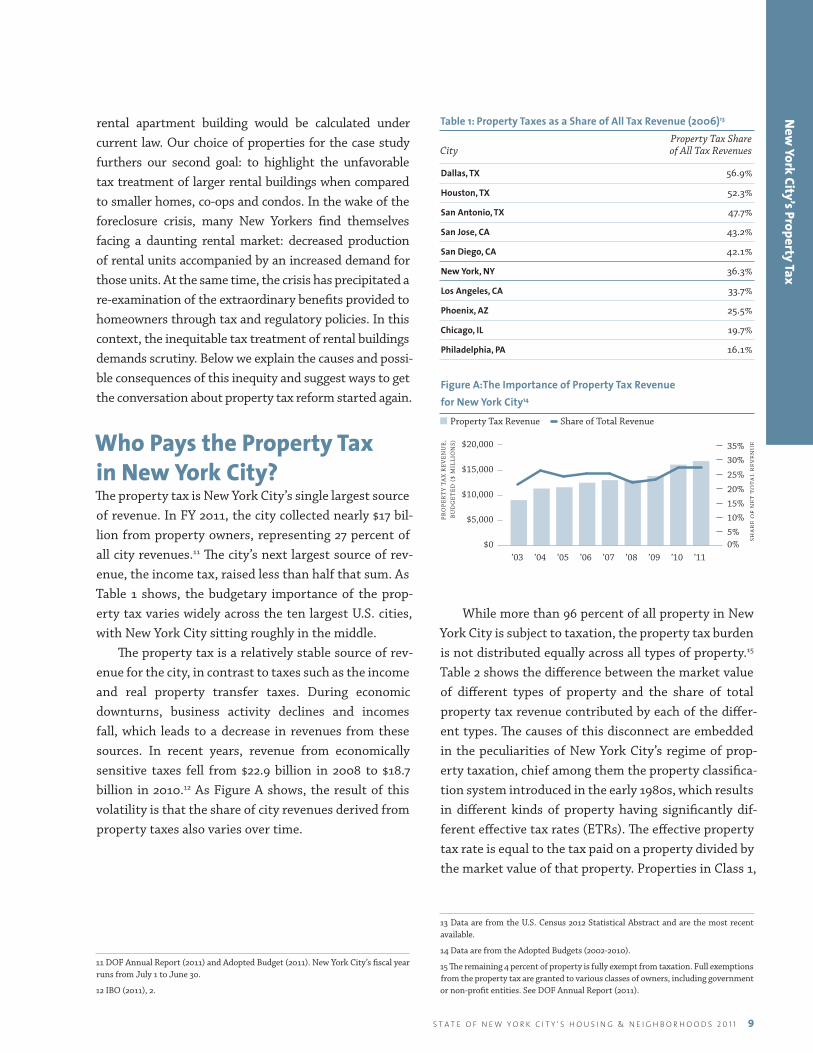
Who Pays the Property Tax in New York City?The property tax is New York City’s single largest source of revenue. In FY 2011, the city collected nearly $17 bil-lion from property owners, representing 27 percent of all city revenues.11 The city’s next largest source of rev-enue, the income tax, raised less than half that sum. As Table 1 shows, the budgetary importance of the prop-erty tax varies widely across the ten largest U.S. cities, with New York City sitting roughly in the middle.
The property tax is a relatively stable source of rev-enue for the city, in contrast to taxes such as the income and real property transfer taxes. During economic downturns, business activity declines and incomes fall, which leads to a decrease in revenues from these sources. In recent years, revenue from economically sensitive taxes fell from $22.9 billion in 2008 to $18.7 billion in 2010.12 As Figure A shows, the result of this volatility is that the share of city revenues derived from property taxes also varies over time.
11 DOF Annual Report (2011) and Adopted Budget (2011). New York City’s fiscal year runs from July 1 to June 30.
12 IBO (2011), 2.
Table 1: Property Taxes as a Share of All Tax Revenue (2006)13 Property Tax Share City of All Tax Revenues
Dallas, TX 56.9%
Houston, TX 52.3%
San Antonio, TX 47.7%
San Jose, CA 43.2%
San Diego, CA 42.1%
New York, NY 36.3%
Los Angeles, CA 33.7%
Phoenix, AZ 25.5%
Chicago, IL 19.7%
Philadelphia, PA 16.1%
Figure A:The Importance of Property Tax Revenue for New York City14
n Property Tax Revenue Share of Total Revenue
$0
$5,000
$10,000
$15,000
$20,000
’03 ’04 ’05 ’06 ’07 ’08 ’09 ’10 ’110%5%
10%
15%
20%
25%
30%
35%P
RO
PE
RT
Y T
AX
RE
VE
NU
E,
BU
DG
ET
ED
($
MIL
LIO
NS)
SHA
RE
OF
NE
T T
OTA
L R
EV
EN
UE
While more than 96 percent of all property in New York City is subject to taxation, the property tax burden is not distributed equally across all types of property.15 Table 2 shows the difference between the market value of different types of property and the share of total property tax revenue contributed by each of the differ-ent types. The causes of this disconnect are embedded in the peculiarities of New York City’s regime of prop-erty taxation, chief among them the property classifica-tion system introduced in the early 1980s, which results in different kinds of property having significantly dif-ferent effective tax rates (ETRs). The effective property tax rate is equal to the tax paid on a property divided by the market value of that property. Properties in Class 1,
13 Data are from the U.S. Census 2012 Statistical Abstract and are the most recent available.
14 Data are from the Adopted Budgets (2002-2010).
15 The remaining 4 percent of property is fully exempt from taxation. Full exemptions from the property tax are granted to various classes of owners, including government or non-profit entities. See DOF Annual Report (2011).
New
York City’s Property Tax

1 0 T H E F U R M A N C E N T E R F O R R E A L E S T A T E & U R B A N P O L I C Y1 0 T H E F U R M A N C E N T E R F O R R E A L E S T A T E & U R B A N P O L I C Y
which includes most residential property of up to three units and most condominiums under four stories, are, by a large margin, taxed at the lowest effective rate. Class 2 includes larger condominium buildings, most coopera-tive buildings, and larger rental buildings. Some Class 2 properties, namely co-ops and condos, are taxed at an effective rate generally comparable to Class 1 properties. Larger rental buildings, however, along with utilities (Class 3), and commercial/industrial properties (Class 4), are taxed at far higher effective rates and therefore bear a disproportionate share of the overall tax burden. Table 2 shows that Class 1 properties account for only 15 percent of the city’s property tax revenue but nearly 50 percent of the market value of all taxable property. But Class 2 properties, which provide 36 percent of property tax revenues, account for only 24 percent of the aggre-gate market value.16 These differences suggest the stark disparity in ETRs across the two classes reported in the third column. Whereas the ETR on Class 1 properties is 0.67 percent, the ETR for Class 2 is 3.31 percent, nearly five times the rate of Class 1. Figure B depicts examples of properties in each of the four classes.
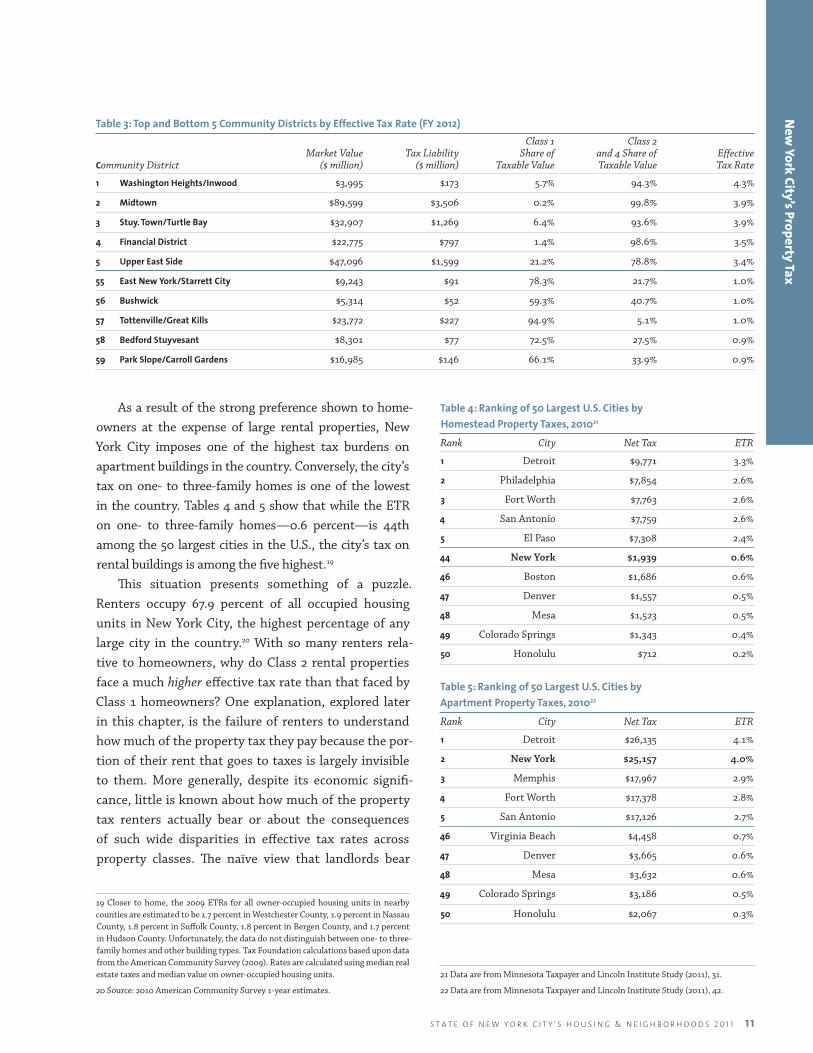
Because of the wide disparities in ETRs across classes, the distribution of property types across classes in a neighborhood directly affects the ETR in that neighbor-hood. Table 3 lists the community districts with the five highest and five lowest ETRs, calculated after excluding properties that are fully tax-exempt. The neighborhoods with the very lowest ETRs are those with a relatively larger share (by market value) of Class 1 properties such as one- to three-family homes while, by comparison, those community districts with the highest ETRs are those with larger shares of Class 2 and Class 4 proper-ties, such as large rental buildings and commercial prop-erties. In Washington Heights/ Inwood, for example, 75 percent of the value of taxable real property belongs to Class 2 and another 19 percent belongs to Class 4.
16 In this chapter we use DOF estimates of market value. For Class 2 condos and co-ops these are underestimates of true market value that will cause our estimates of the ETRs on these properties to be overstatements. The IBO (2006) report used DOF estimates of market value for commercial, utility, and large rental buildings and IBO-generated estimates of market value for other properties. Because of data limitations and our focus on large rental buildings within Class 2 we do not perform the same exercise in this chapter.
Table 2: Market Values and Tax Liabilities by Property Class (FY 2011)17 Share of Share of Citywide Citywide Effective Market Value Revenues18 Tax Rate
Class 1 49% 15% 0.67%
Class 2 24% 36% 3.31%
Class 3 3% 8% 5.49%
Class 4 24% 42% 3.85%
Figure B: Example of Properties for Each Tax Class
Class 1
Class 2
Class 3
Class 4
17 DOF Annual Report (2011).
18 This column reports the share of the “net levy billed” to each class of property. It will differ from actual revenues to the extent that some of the net levy billed goes uncollected.
S T A T E O F N E W Y O R K C I T Y ’ S H O U S I N G & N E I G H B O R H O O D S 2 0 1 1 1 1
As a result of the strong preference shown to home-owners at the expense of large rental properties, New York City imposes one of the highest tax burdens on apartment buildings in the country. Conversely, the city’s tax on one- to three-family homes is one of the lowest in the country. Tables 4 and 5 show that while the ETR on one- to three-family homes—0.6 percent—is 44th among the 50 largest cities in the U.S., the city’s tax on rental buildings is among the five highest.19
This situation presents something of a puzzle. Renters occupy 67.9 percent of all occupied housing units in New York City, the highest percentage of any large city in the country.20 With so many renters rela-tive to homeowners, why do Class 2 rental properties face a much higher effective tax rate than that faced by Class 1 homeowners? One explanation, explored later in this chapter, is the failure of renters to understand how much of the property tax they pay because the por-tion of their rent that goes to taxes is largely invisible to them. More generally, despite its economic signifi-cance, little is known about how much of the property tax renters actually bear or about the consequences of such wide disparities in effective tax rates across property classes. The naïve view that landlords bear
19 Closer to home, the 2009 ETRs for all owner-occupied housing units in nearby counties are estimated to be 1.7 percent in Westchester County, 1.9 percent in Nassau County, 1.8 percent in Suffolk County, 1.8 percent in Bergen County, and 1.7 percent in Hudson County. Unfortunately, the data do not distinguish between one- to three-family homes and other building types. Tax Foundation calculations based upon data from the American Community Survey (2009). Rates are calculated using median real estate taxes and median value on owner-occupied housing units.
20 Source: 2010 American Community Survey 1-year estimates.
Table 4: Ranking of 50 Largest U.S. Cities by Homestead Property Taxes, 201021
Rank City Net Tax ETR
1 Detroit $9,771 3.3%
2 Philadelphia $7,854 2.6%
3 Fort Worth $7,763 2.6%
4 San Antonio $7,759 2.6%
5 El Paso $7,308 2.4%
44 New York $1,939 0.6%
46 Boston $1,686 0.6%
47 Denver $1,557 0.5%
48 Mesa $1,523 0.5%
49 Colorado Springs $1,343 0.4%
50 Honolulu $712 0.2%
Table 5: Ranking of 50 Largest U.S. Cities by Apartment Property Taxes, 201022
Rank City Net Tax ETR
1 Detroit $26,135 4.1%
2 New York $25,157 4.0%
3 Memphis $17,967 2.9%
4 Fort Worth $17,378 2.8%
5 San Antonio $17,126 2.7%
46 Virginia Beach $4,458 0.7%
47 Denver $3,665 0.6%
48 Mesa $3,632 0.6%
49 Colorado Springs $3,186 0.5%
50 Honolulu $2,067 0.3%
21 Data are from Minnesota Taxpayer and Lincoln Institute Study (2011), 31.
22 Data are from Minnesota Taxpayer and Lincoln Institute Study (2011), 42.
New
York City’s Property Tax
Table 3: Top and Bottom 5 Community Districts by Effective Tax Rate (FY 2012) Class 1 Class 2 Market Value Tax Liability Share of and 4 Share of Effective Community District ($ million) ($ million) Taxable Value Taxable Value Tax Rate
1 Washington Heights/Inwood $3,995 $173 5.7% 94.3% 4.3%
2 Midtown $89,599 $3,506 0.2% 99.8% 3.9%
3 Stuy. Town/Turtle Bay $32,907 $1,269 6.4% 93.6% 3.9%
4 Financial District $22,775 $797 1.4% 98.6% 3.5%
5 Upper East Side $47,096 $1,599 21.2% 78.8% 3.4%
55 East New York/Starrett City $9,243 $91 78.3% 21.7% 1.0%
56 Bushwick $5,314 $52 59.3% 40.7% 1.0%
57 Tottenville/Great Kills $23,772 $227 94.9% 5.1% 1.0%
58 Bedford Stuyvesant $8,301 $77 72.5% 27.5% 0.9%
59 Park Slope/Carroll Gardens $16,985 $146 66.1% 33.9% 0.9%
1 2 T H E F U R M A N C E N T E R F O R R E A L E S T A T E & U R B A N P O L I C Y1 2 T H E F U R M A N C E N T E R F O R R E A L E S T A T E & U R B A N P O L I C Y
the entire burden of the property tax in the form of reduced profits is almost certainly wrong, and it is impossible to evaluate the efficiency or fairness of the property tax without thinking about who else bears the cost (see sidebar on Tax Incidence).
The difficulty of understanding who bears the burden of the property tax is aggravated by the byzantine pro-cess used to determine property tax liabilities. This pro-cess causes distortions and disparities in the allocation of the property tax burden that calls into question both its efficiency and its fairness. After briefly reviewing the his-tory of the property tax in New York, we present a case study of a hypothetical property owner. We walk through the calculations and show that our hypothetical owner’s single-family home would be taxed at one percent of its value, while his rental apartment building would be taxed at more than four times that rate, because of disparities in the taxation of different classes of property. We pro-vide a more detailed discussion of the implications the inequities of the property tax burden have for renters at the end of the chapter. Although the precise magnitudes of the inequities we describe are difficult to estimate, we are confident that they are substantial and, accordingly, that the current tax system unfairly subsidizes home-ownership at the expense of rental building owners and, likely, their tenants. Before examining this and other con-sequences of the unequal distribution of the tax burden, we turn first to the origin of the inequities in the political and legal history of the property tax in New York.
A Brief History of the Property Tax In New York CityAncient CustomsFor more than 200 years, New York State’s property assessment process allowed local assessors to assess property values “as they deemed proper”, despite Sec-tion 306 of New York’s Real Property Tax Law23 which mandated that municipal authorities assess all real prop-erty at full fair market value.24 Contrary to the law, the
23 N.Y. REAL PROP. TAX LAW § 306 (McKinney), repealed by Act of Dec. 3, 1981, ch. 1057, § 1, 1981 N.Y. Laws 219 (McKinney) (codified at N.Y. REAL PROP. TAX LAW § 305 (McKinney)).
24 Hellerstein v. Islip, 37 N.Y.2d 1 (1975).
Tax Incidence Understanding exactly how taxes change behavior is com-plicated by the fact that the people who actually bear the economic burden of a tax are not necessarily the same ones that are responsible for paying it to the government. Imposing a tax on a commodity changes its price, setting off a chain reaction of adjustments by both buyers and sell-ers in the economy. The effect of a tax will often reverberate not only in the market for the taxed commodity, but in all of the other markets that rely on it. Consumers will respond to the higher price by buying less of the taxed good and more of things that are its close substitutes. Producers receiving a lower price (after paying for the increased tax) are forced to change the number of people they employ, the wages they pay, the profits they return to shareholders, as well as the amount of all of the other things that they use to pro-duce the taxed good. Incidence analysis is the study of how the effects of taxes percolate throughout the economy in this manner, sometimes in unexpected ways. Understand-ing these effects is crucial to evaluating the efficiency, as well as fairness, of a tax.
S T A T E O F N E W Y O R K C I T Y ’ S H O U S I N G & N E I G H B O R H O O D S 2 0 1 1 1 3
discretion given to local assessors resulted in assess-ments of residential property that routinely amounted to less than one-third of market value.25
This practice, known as “fractional assessment,” continued largely unimpeded until 1975, when the Court of Appeals heard a challenge by a law professor and his wife demanding that the Town of Islip void its assessment roll and reassess all real property at full value. Full value assessments would not necessarily mean a uniform increase in tax bills. Because tax rev-enue depends upon both the tax assessment and the tax rate, municipalities make up for the undervaluation brought on by fractional assessment by increasing the tax rate to satisfy their revenue needs.26 Indeed, some commentators have suggested that the historical per-sistence of the practice of fractional assessment may be due in part to the “gullibility” of taxpayers who asso-ciate a smaller assessed value with a smaller tax bill, regardless of the actual rate.27 The challengers, Jerome and Pauline Hellerstein, were not primarily concerned that Islip was failing to capture revenue, but rather that undervaluation was not uniform—potentially result-ing in an unfair distribution of the tax burden.
New York’s highest court sided with the Hellersteins. In its opinion the court expressed concern that patterns of undervaluation might fail to be uniform and instead reflect the “incompetence, favoritism, or corruption”28 of local officials. The court relied on the plain language of Section 306 to order an end to the practice of frac-tional assessment. Acknowledging, however, the “fiscal chaos”29 that might result from the immediate upending of this centuries-old assessment practice, the Hellerstein court allotted what it saw as a reasonable time period for orderly compliance, requiring Islip to reassess all its properties at full value within 36 months.
Panic in AlbanyThe State Legislature granted itself a four year exten-sion of the court’s order, believing it needed more time to sort out what it understood was a politically danger-
25 Id. at 15.
26 Id. at 12.
27 Id. at 11.
28 Id. at 13.
29 Id.
ous situation. A 1979 State Assembly Task Force report found that the Hellerstein mandate would lead to the doubling of property tax bills for homeowners in Brook-lyn, Queens, and Staten Island.30 As homeowners (who are more likely to vote than renters)31 began to voice their concerns, members of the New York Senate and Assembly concluded that the change ordered by the Hell-erstein court was not politically viable.
After granting itself several additional extensions to study the issue, the Legislature passed a tax reform bill known as S7000A in 1981.32 S7000A allowed all munici-palities, aside from New York City and municipalities in Nassau County, to continue to indulge in the “ancient custom”33 of fractional assessment.34 New York City and Nassau County, however, were subjected to a novel property classification scheme; S7000A set up distinct classes for one- to three-family homes, larger residential buildings, utilities, and commercial property. S7000A was intended to keep the share of the total property tax levy paid by each property class roughly at its 1981 level.35 This decision proved very advantageous to Class 1 property owners. Under the earlier fractional assess-ment regime, properties from all classes were assessed well under their market value. Some classes, however, were more undervalued than others. Most significantly, one- to three-family homes tended to receive a much larger “assessment discount” than that afforded to other property classes. By using 1981 valuations as a baseline, S7000A preserved the favorable tax treatment of small residential properties in New York City.
Under S7000A, these “class shares” were to be adjusted every two years based on changes in the total market value of properties in each class (includ-ing adjustments for new construction and demolition).
30 New York State Assembly Task Force on School Finance and Real Property Taxation (1979).
31 Donovan et. al. (2010).
32 Act of Dec. 3, 1981, ch. 1057, 1981 N.Y. Laws 219 (McKinney). The governor vetoed the proposed legislation. Governor’s Veto Memorandum I 15, reprinted in 1981 N.Y. LEGIS. ANN. 622, but the legislature overrode the veto and adopted the measure. Id.
33 Hellerstein, supra note 1 at 8.
34 In New York State full value assessments were mandated by statute, but not enshrined in the State’s Constitution. See N.Y. REAL PROP. TAX LAW, supra note 25 at § 306; Hellerstein, supra note 26 at 1. This allowed the Legislature to avoid the Hellerstein decision simply by modifying New York’s Property Tax Law to allow for fractional assessment, as it did with S7000A.
35 IBO (2006).
New
York City’s Property Tax

1 4 T H E F U R M A N C E N T E R F O R R E A L E S T A T E & U R B A N P O L I C Y1 4 T H E F U R M A N C E N T E R F O R R E A L E S T A T E & U R B A N P O L I C Y
By 1989, however, no market value adjustments had actually been implemented. Despite the rapid apprecia-tion of Class 1 property values between 1981 and 1989, Class 1’s contribution to the citywide property tax levy was still based on 1981 market values. Had the state actually adjusted the class shares in 1989, Class 1 prop-erty owners would have seen their tax bills rise dramati-cally.36 In an effort to avoid that outcome, the Mayor and City Council again turned to the State Legislature.
The Legislature responded by setting the base class shares at 1990 levels, which were effectively the 1981 shares,37 because the shares had never been adjusted for market value. Resetting the class shares in this manner effectively prevented the substantial market value gains experienced by Class 1 properties in the 1980s from being reflected in the property tax bills of their own-ers. The Legislature also capped adjustments to the class shares due to changes in market value at five percent annually. Taken together, these changes ensured that the effective tax rate on Class 1 property would remain well below that of other classes for a long time.38
The Tax TodaySince 1989, the most significant legislative change affect-ing class tax disparities was the creation of the Coop-erative and Condominium Property Tax Abatement Program in 1996. The abatement was created largely in response to complaints from co-op and condo owners that their homes were taxed at several times the rate of one- to three-family homes.39 Tax abatements provide a dollar for dollar reduction of a property owner’s final tax liability. The co-op/condo abatement provides signifi-cant relief to eligible owners, effectively reducing their taxes by 17.5 or 25 percent.40
36 The City estimated Class 1 liability would have grown by approximately 42 percent See City of New York Tax Study Commission (December 1989), 139.
37 See N.Y. REAL PROP. TAX LAW §§ 1803, 1803-a, 1803-b. (McKinney). In fact the new base shares may have been lower than the 1981 shares, given that from 1983 to 1991, the City Council used its discretionary powers under S7000A to lower Class 1’s share. The 1989 legislation limited the Council’s discretion to adjust class shares to five percent annually. See IBO (2006), 20-21.
38 Moreover, it has become common practice for the City Council to annually request that the Legislature lower the class share adjustment cap to 2.5 percent, only further slowing the adjustment of the class shares to more accurately reflect market values across the city. Id. 39 Id.
40 The size of the abatement is based on the average assessed value per unit in the building. Buildings with an average assessed unit value of $15,000 or less are granted
The way the city values cooperative and condomin-ium buildings and units grants them an additional tax advantage. Prior to 1964, the value of units in coopera-tive and condominium buildings was assessed in the same manner as one- to three-family homes—by look-ing to recent sales of comparable units. In 1964, how-ever, the Legislature declared that the city must value co-op and condo buildings as if they were rental apart-ment buildings.41 To do this, DOF seeks out “compara-ble” rental buildings (based on such factors as location, amenities, and size) and uses the net rental income of these buildings as the basis for valuing co-ops and con-dos. Since these properties are not truly comparable to the properties being valued, this method likely under-states the fair market value. A property’s fair market value is essential to determining its tax liability, so the unusual valuation method the city applies to co-ops and condos ends up lowering the effective tax rate imposed on these units.42 Because some co-ops and condos are most “comparable” (with respect to age and location) to rent-regulated buildings, many of the city’s most valu-able residential properties are especially undervalued.43 Indeed, some of the city’s most exclusive apartment buildings contain individual units with asking prices nearly equal to the entire building’s official valuation.44
In addition to the special treatment granted to co-op and condo buildings, the city has introduced vari-ous programs to provide relief to particular classes of individuals, or to serve broader policy goals, such as encouraging the development of affordable housing. Currently, the tax law contains exemptions for disabled persons, seniors, and veterans, among others.45 These exemptions allow eligible taxpayers to deduct a certain amount from the assessed value of their homes, reduc-ing their annual tax liability. The city has also introduced
a 25 percent abatement; buildings with an average assessed unit value of over $15,000 are granted a 17.5 percent abatement. See N.Y. REAL PROP. TAX LAW § 467-A.
41 See N.Y. REAL PROP. TAX LAW § 581-A.
42 The IBO estimated that, in 2007, the special valuation method applied to co-ops and condos resulted in an average market value discount of 77.6 percent See IBO (2006),
43 32-33. Id. at 17.
44 For example, DOF values the cooperative 740 Park Avenue at $62.7 million. A single apartment in the building was recently listed with an asking price of $60 million. Abelson (2008).
45 See N.Y. REAL PROP. TAX LAW §§ 459, 467, 458.

S T A T E O F N E W Y O R K C I T Y ’ S H O U S I N G & N E I G H B O R H O O D S 2 0 1 1 1 5
Table 7: Real Property Tax Expenditures (FY 2012)*
Number of Exemptions Exempt Assessed Tax Expenditure and Abatements Value ($ millions)
HOUSING DEVELOPMENT
J-51 Exemption 21,454 1,243.6 166.8
J-51 Abatement 133,188 – 87.8
421-a New Multiple Dwellings 64,252 7,743.2 1,032.7
421-b New Private Housing 8,991 86.4 15.7
HPD Division of Alternative Management 979 159.0 21.4
Lower Manhattan Conversion 3,550 325.2 43.2
420-c Low-Income Housing 1,032 590.7 76.3
INDIVIDUAL ASSISTANCE
Senior Citizen Homeowner Exemption 52,104 612.0 104.6
Senior Citizen Rent Increase Exemption 47,475 – 95.6
Disabled Person Rent Increase Exemption 6,009 – 11.6
Veterans Exemption 64,024 363.3 21.3
Low Income Disabled Homeowner Exemption 4,896 58.9 10.0
Physically Disabled Crime Victims Exemption 6 0.1 0.0
Co-op/Condo Abatement 364,761 – 443.8
ECONOMIC DEVELOPMENT
Industrial and Commercial Incentive Program 7,311 6,607.0 681.6
Industrial and Commercial Abatement Program 35 – 2.8
Other Commercial and Industrial Programs 907 149.0 28.2
Other 1,247 187.3 20.2
TOTAL 782,221 18,125.6 2,863.4
*DOF Tax Expenditures (2012).
several much larger tax incentives, most notably the 421-a and J-51 programs. These programs were initially created to spur housing development (421-a) and reha-bilitation (J-51). By the mid-1980s, however, advocates began to argue that the programs had become unneces-sary subsidies to the developers of luxury housing, espe-cially in Manhattan. Both programs were subsequently reformed to encourage the development of affordable housing by making participation contingent on the inclusion of affordable units, and in the case of rental properties, rent-stabilization.46
46 As of 2006, the 421-a “Geographic Exclusion Area” (areas where use of the incen-tive requires affordable housing concessions) was expanded to include all of Manhat-tan as well as select neighborhoods in Brooklyn, Queens, the Bronx, and Staten Island.
These programmatic exemptions are often described as “tax expenditures”—they reduce the tax revenue col-lected by the city, so their ultimate effect on the budget is similar to grants or other affirmative expenditures. The role that these various tax expenditures play in the determination of an owner’s tax liability is discussed in the case study that follows. The 421-a, J-51 and co-op/condo abatement programs all represent significant tax expenditures. As Table 7 shows, the 421-a and J-51 programs together are the largest FY2011 tax expendi-ture, worth over $1.3 billion last fiscal year alone. The condo/co-op abatement is the third largest individual tax expenditure, valued at over $400 million.
New
York City’s Property Tax
1 6 T H E F U R M A N C E N T E R F O R R E A L E S T A T E & U R B A N P O L I C Y1 6 T H E F U R M A N C E N T E R F O R R E A L E S T A T E & U R B A N P O L I C Y
To understand the effective tax rate disparities among classes of property in New York City it is necessary to understand in more detail how a property’s tax bill is calculated. The process of
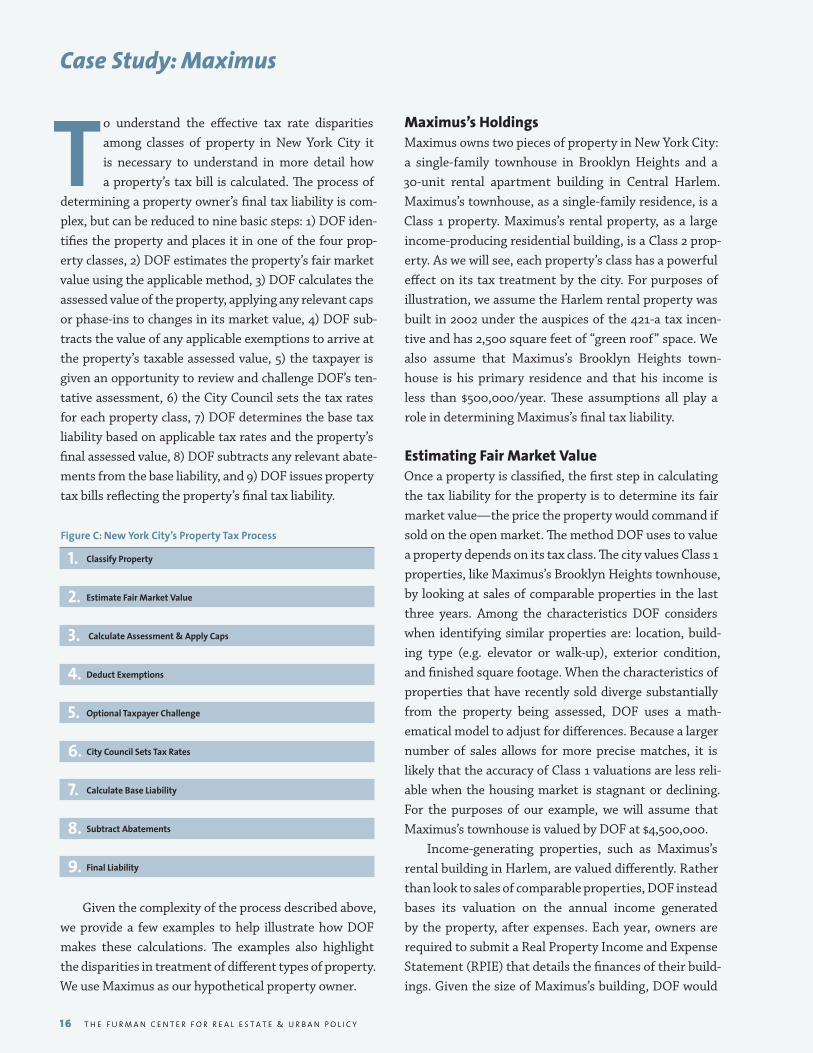
determining a property owner’s final tax liability is com-plex, but can be reduced to nine basic steps: 1) DOF iden-tifies the property and places it in one of the four prop-erty classes, 2) DOF estimates the property’s fair market value using the applicable method, 3) DOF calculates the assessed value of the property, applying any relevant caps or phase-ins to changes in its market value, 4) DOF sub-tracts the value of any applicable exemptions to arrive at the property’s taxable assessed value, 5) the taxpayer is given an opportunity to review and challenge DOF’s ten-tative assessment, 6) the City Council sets the tax rates for each property class, 7) DOF determines the base tax liability based on applicable tax rates and the property’s final assessed value, 8) DOF subtracts any relevant abate-ments from the base liability, and 9) DOF issues property tax bills reflecting the property’s final tax liability.
Figure C: New York City’s Property Tax Process
1. Classify Property
2. Estimate Fair Market Value
3. Calculate Assessment & Apply Caps
4. Deduct Exemptions
5. Optional Taxpayer Challenge
6. City Council Sets Tax Rates
7. Calculate Base Liability
8. Subtract Abatements
9. Final Liability
Given the complexity of the process described above, we provide a few examples to help illustrate how DOF makes these calculations. The examples also highlight the disparities in treatment of different types of property. We use Maximus as our hypothetical property owner.
Maximus’s HoldingsMaximus owns two pieces of property in New York City: a single-family townhouse in Brooklyn Heights and a 30-unit rental apartment building in Central Harlem. Maximus’s townhouse, as a single-family residence, is a Class 1 property. Maximus’s rental property, as a large income-producing residential building, is a Class 2 prop-erty. As we will see, each property’s class has a powerful effect on its tax treatment by the city. For purposes of illustration, we assume the Harlem rental property was built in 2002 under the auspices of the 421-a tax incen-tive and has 2,500 square feet of “green roof” space. We also assume that Maximus’s Brooklyn Heights town-house is his primary residence and that his income is less than $500,000/year. These assumptions all play a role in determining Maximus’s final tax liability.
Estimating Fair Market ValueOnce a property is classified, the first step in calculating the tax liability for the property is to determine its fair market value—the price the property would command if sold on the open market. The method DOF uses to value a property depends on its tax class. The city values Class 1 properties, like Maximus’s Brooklyn Heights townhouse, by looking at sales of comparable properties in the last three years. Among the characteristics DOF considers when identifying similar properties are: location, build-ing type (e.g. elevator or walk-up), exterior condition, and finished square footage. When the characteristics of properties that have recently sold diverge substantially from the property being assessed, DOF uses a math-ematical model to adjust for differences. Because a larger number of sales allows for more precise matches, it is likely that the accuracy of Class 1 valuations are less reli-able when the housing market is stagnant or declining. For the purposes of our example, we will assume that Maximus’s townhouse is valued by DOF at $4,500,000.
Income-generating properties, such as Maximus’s rental building in Harlem, are valued differently. Rather than look to sales of comparable properties, DOF instead bases its valuation on the annual income generated by the property, after expenses. Each year, owners are required to submit a Real Property Income and Expense Statement (RPIE) that details the finances of their build-ings. Given the size of Maximus’s building, DOF would
Case Study: Maximus

S T A T E O F N E W Y O R K C I T Y ’ S H O U S I N G & N E I G H B O R H O O D S 2 0 1 1 1 7
require him to submit the property’s full “rent roll”—i.e., the gross rental income generated by the building for the fiscal year. Maximus would also include the total fis-cal year expenses associated with the property, allowing DOF to calculate the annual net income of the building.47
Below is a simplified version of the RPIE state-ment that Maximus might submit to DOF regarding his Harlem property:
Rental Property Income & Expense Statement FY2011
Units 30
Gross Annual Income $802,000
Annual Expenses $343,000
Net Operating Income $459,000
There are a number of techniques for estimating the value of a future income stream like net operat-ing income. DOF uses the rate of return it believes an investor would demand on his/her money when consid-ering purchasing the building in question to estimate the price an investor would be willing to pay, assuming stable net operating income. For FY2011, DOF set this rate (the “base capitalization rate”) at approximately 7.5 percent and the “overall capitalization rate” at 13.5 per-cent (the overall rate factors in the annual property tax burden associated with the building).48
We can see from our sample RPIE that Maximus’s building had net operating income of $459,000. By divid-ing this number by the overall capitalization rate of 13.5 percent, DOF arrives at the maximum price it believes a typical investor would be willing to pay Maximus for his property: $3,400,000. In summary:
Fair Market Value of Maximus’s Portfolio
Townhouse Rental Building
Valuation Method Comparable Sales Capitalized Rental Income
Fair Market Value $4,500,000 $3,400,000
47 Not all expenses qualify, however. Debt service on a mortgage, for instance, is not taken into account by DOF when calculating net income.
48 DOF uses a “band of investment” methodology for determining capitalization rates. This requires DOF to estimate three things: 1) the prevailing loan-to-value ratio for properties, 2) mortgage interest rates, and 3) the expected return on equity. Expected return on equity is estimated by looking at the rate for a safe investment (such as a treasury note) and adjusting that rate for risk (both inherent in property ownership and varied depending on neighborhood, illiquidity, and management).
Calculating Assessed ValueThe next step in determining Maximus’s tax liability is to determine the “actual assessed value” of his properties. We cannot just use the figures calculated above, because property in New York State is not taxed on its fair mar-ket value. Each year, DOF sets a “target assessment ratio” for each of the four different classes of property in New York City. Class 1 properties are assessed at six percent of their fair market value, while all other classes are assessed at 45 percent.49 Applying these ratios to Maximus’s properties gives the following results:
Actual Assessed Value of Maximus’s Portfolio
Townhouse Rental Building
Fair Market Value $4,500,000 $3,400,000
Target Assessment Ratio 6% 45%
Actual Assessed Value $270,000 $1,530,000
Despite its name, the “actual assessed value” is not in fact the amount on which Maximus’s property will actu-ally be taxed. To find that figure, we must first apply any statutory assessment caps or phase-ins, as well as any applicable exemptions. The statutory caps and phase-ins aim to protect property owners from rapid apprecia-tion in market value that is not necessarily accompanied by a concomitant increase in income.
For the purposes of our example, we assume that in the previous fiscal year (FY2010), Maximus’s townhouse was valued at $4,100,000. Given the six percent assessment ratio, Maximus’s townhouse has a FY2010 assessed value of $246,000. Under the statutory cap, the assessed value of a Class 1 property cannot increase by more than six per-cent in a given year (or by more than 20 percent over five years). Thus, the FY2011 assessment of Maximus’s town-house cannot exceed $260,760 (an increase of six percent over the FY2010 assessment), despite an increase in mar-ket value that would otherwise result in a FY2011 assess-ment of $270,000. Had Maximus’s townhouse appreciated even more in value from FY2010 to FY2011, the cap would have resulted in even greater savings for Maximus (see sidebar on page 18 on Assessment Caps).
49 DOF’s assessment ratios for all property classes have decreased since 1981. For instance, the target ratio for Class 1 under S7000A was originally 20 percent and for Class 2 it was 60 percent. The effect of these changes on effective tax rates is minimal, however, given the class share system described in more detail below.
New
York City’s Property Tax
1 8 T H E F U R M A N C E N T E R F O R R E A L E S T A T E & U R B A N P O L I C Y1 8 T H E F U R M A N C E N T E R F O R R E A L E S T A T E & U R B A N P O L I C Y
Assessment CapsOne effect of the caps on assessment increases is that two properties, identical in every respect, including their mar-ket value and eligibility for exemptions, can have differ-ent effective tax rates depending upon how quickly their property values appreciated in prior years. In its 2006 report, the IBO documented the effects that differential appreciation rates for one- to three-family homes across neighborhoods between fiscal years 1984 and 2007 had on the ETRs for those properties. Housing price apprecia-tion during this period was highest in census tracts that were comparatively low-income in 1980, resulting in sig-nificantly lower ETRs in FY 2007 for those tracts, relative to tracts that were high-income in 1980.50
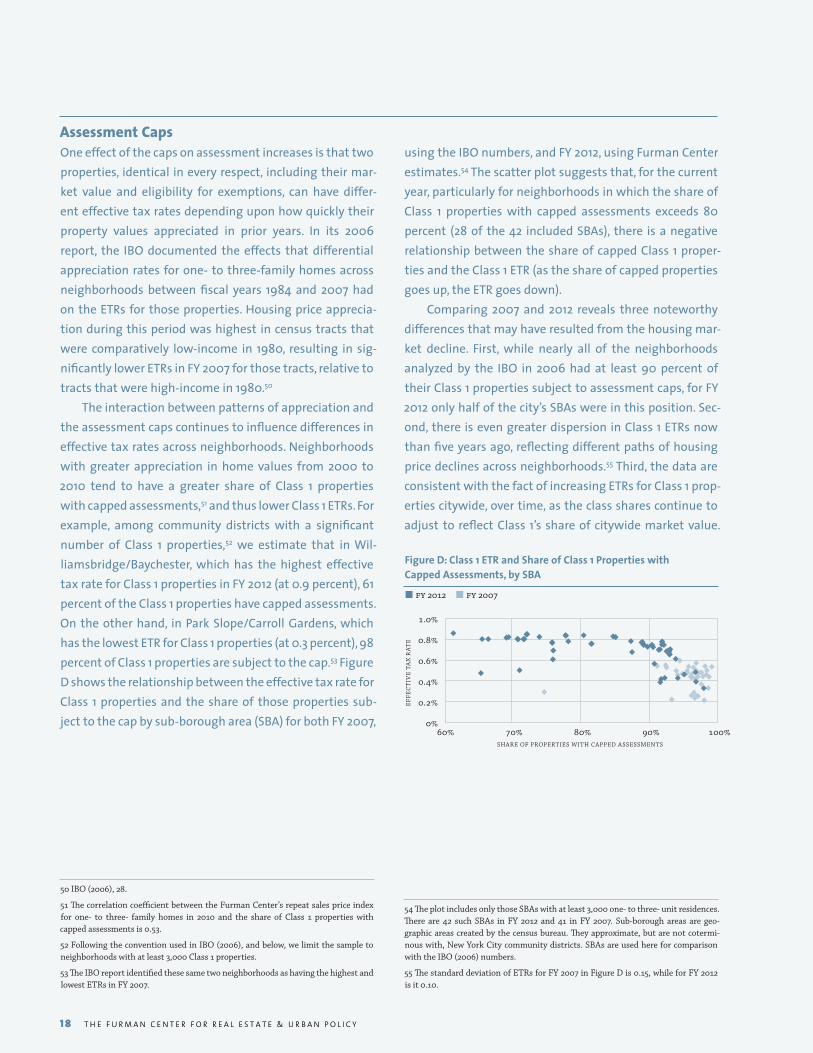
The interaction between patterns of appreciation and the assessment caps continues to influence differences in effective tax rates across neighborhoods. Neighborhoods with greater appreciation in home values from 2000 to 2010 tend to have a greater share of Class 1 properties with capped assessments,51 and thus lower Class 1 ETRs. For example, among community districts with a significant number of Class 1 properties,52 we estimate that in Wil-liamsbridge/Baychester, which has the highest effective tax rate for Class 1 properties in FY 2012 (at 0.9 percent), 61 percent of the Class 1 properties have capped assessments. On the other hand, in Park Slope/Carroll Gardens, which has the lowest ETR for Class 1 properties (at 0.3 percent), 98 percent of Class 1 properties are subject to the cap.53 Figure D shows the relationship between the effective tax rate for Class 1 properties and the share of those properties sub-ject to the cap by sub-borough area (SBA) for both FY 2007,
50 IBO (2006), 28.
51 The correlation coefficient between the Furman Center’s repeat sales price index for one- to three- family homes in 2010 and the share of Class 1 properties with capped assessments is 0.53.
52 Following the convention used in IBO (2006), and below, we limit the sample to neighborhoods with at least 3,000 Class 1 properties.
53 The IBO report identified these same two neighborhoods as having the highest and lowest ETRs in FY 2007.
using the IBO numbers, and FY 2012, using Furman Center estimates.54 The scatter plot suggests that, for the current year, particularly for neighborhoods in which the share of Class 1 properties with capped assessments exceeds 80 percent (28 of the 42 included SBAs), there is a negative relationship between the share of capped Class 1 proper-ties and the Class 1 ETR (as the share of capped properties goes up, the ETR goes down).
Comparing 2007 and 2012 reveals three noteworthy differences that may have resulted from the housing mar-ket decline. First, while nearly all of the neighborhoods analyzed by the IBO in 2006 had at least 90 percent of their Class 1 properties subject to assessment caps, for FY 2012 only half of the city’s SBAs were in this position. Sec-ond, there is even greater dispersion in Class 1 ETRs now than five years ago, reflecting different paths of housing price declines across neighborhoods.55 Third, the data are consistent with the fact of increasing ETRs for Class 1 prop-erties citywide, over time, as the class shares continue to adjust to reflect Class 1’s share of citywide market value.
Figure D: Class 1 ETR and Share of Class 1 Properties with Capped Assessments, by SBA
n fy 2012 n fy 2007
54 The plot includes only those SBAs with at least 3,000 one- to three- unit residences. There are 42 such SBAs in FY 2012 and 41 in FY 2007. Sub-borough areas are geo-graphic areas created by the census bureau. They approximate, but are not cotermi-nous with, New York City community districts. SBAs are used here for comparison with the IBO (2006) numbers.
55 The standard deviation of ETRs for FY 2007 in Figure D is 0.15, while for FY 2012 is it 0.10.
0.6 0.8 1.00.000
0.002
0.004
0.006
0.008
0.010
0.6 0.8 0.90.7 1.00%
.2%
.4%
.6%
.8%
1%
SHARE OF CL ASS 1 PROPERTIES WITH CAPPED ASSESSMENTS
EF
FE
CT
IVE
TA
X R
AT
E F
OR
CL
ASS
1
60% 70% 80% 90% 100%0%
0.2%
0.4%
0.6%
0.8%
1.0%
EFF
EC
TIV
E T
AX
RA
TE
SHARE OF PROPERTIES WITH CAPPED ASSESSMENTS
S T A T E O F N E W Y O R K C I T Y ’ S H O U S I N G & N E I G H B O R H O O D S 2 0 1 1 1 9
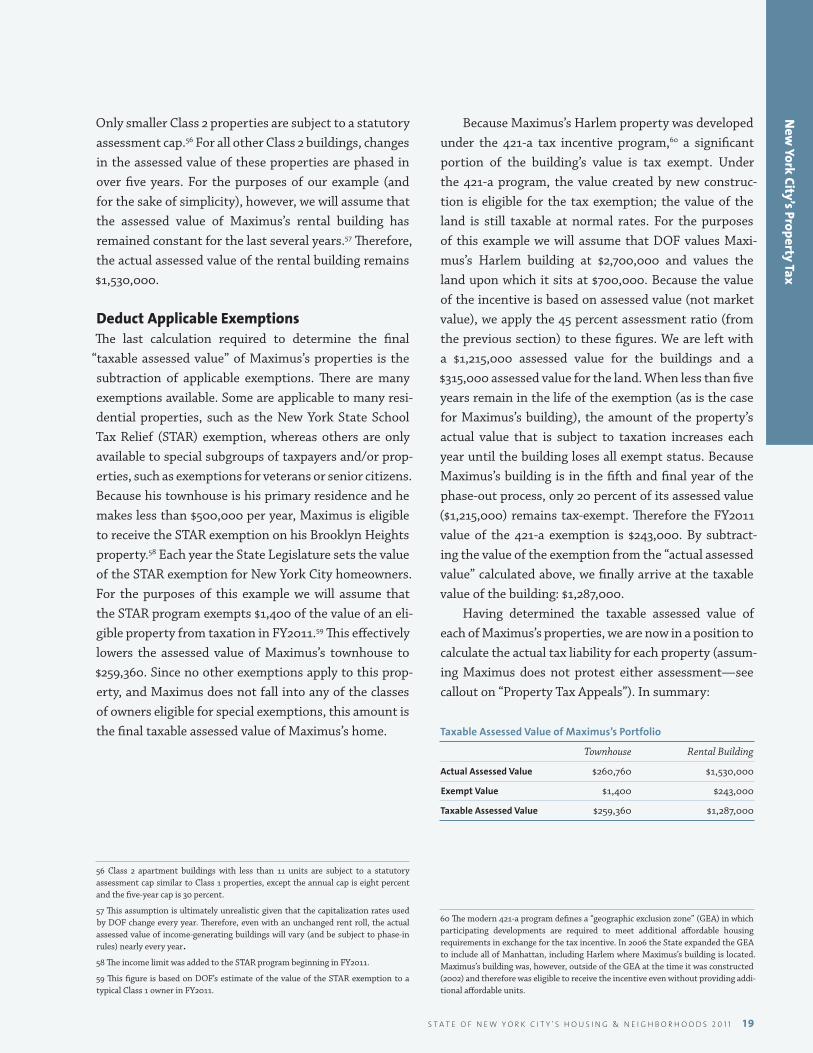
Only smaller Class 2 properties are subject to a statutory assessment cap.56 For all other Class 2 buildings, changes in the assessed value of these properties are phased in over five years. For the purposes of our example (and for the sake of simplicity), however, we will assume that the assessed value of Maximus’s rental building has remained constant for the last several years.57 Therefore, the actual assessed value of the rental building remains $1,530,000.
Deduct Applicable ExemptionsThe last calculation required to determine the final
“taxable assessed value” of Maximus’s properties is the subtraction of applicable exemptions. There are many exemptions available. Some are applicable to many resi-dential properties, such as the New York State School Tax Relief (STAR) exemption, whereas others are only available to special subgroups of taxpayers and/or prop-erties, such as exemptions for veterans or senior citizens. Because his townhouse is his primary residence and he makes less than $500,000 per year, Maximus is eligible to receive the STAR exemption on his Brooklyn Heights property.58 Each year the State Legislature sets the value of the STAR exemption for New York City homeowners. For the purposes of this example we will assume that the STAR program exempts $1,400 of the value of an eli-gible property from taxation in FY2011.59 This effectively lowers the assessed value of Maximus’s townhouse to $259,360. Since no other exemptions apply to this prop-erty, and Maximus does not fall into any of the classes of owners eligible for special exemptions, this amount is the final taxable assessed value of Maximus’s home.
56 Class 2 apartment buildings with less than 11 units are subject to a statutory assessment cap similar to Class 1 properties, except the annual cap is eight percent and the five-year cap is 30 percent.
57 This assumption is ultimately unrealistic given that the capitalization rates used by DOF change every year. Therefore, even with an unchanged rent roll, the actual assessed value of income-generating buildings will vary (and be subject to phase-in rules) nearly every year.58 The income limit was added to the STAR program beginning in FY2011.
59 This figure is based on DOF’s estimate of the value of the STAR exemption to a typical Class 1 owner in FY2011.
Because Maximus’s Harlem property was developed under the 421-a tax incentive program,60 a significant portion of the building’s value is tax exempt. Under the 421-a program, the value created by new construc-tion is eligible for the tax exemption; the value of the land is still taxable at normal rates. For the purposes of this example we will assume that DOF values Maxi-mus’s Harlem building at $2,700,000 and values the land upon which it sits at $700,000. Because the value of the incentive is based on assessed value (not market value), we apply the 45 percent assessment ratio (from the previous section) to these figures. We are left with a $1,215,000 assessed value for the buildings and a $315,000 assessed value for the land. When less than five years remain in the life of the exemption (as is the case for Maximus’s building), the amount of the property’s actual value that is subject to taxation increases each year until the building loses all exempt status. Because Maximus’s building is in the fifth and final year of the phase-out process, only 20 percent of its assessed value ($1,215,000) remains tax-exempt. Therefore the FY2011 value of the 421-a exemption is $243,000. By subtract-ing the value of the exemption from the “actual assessed value” calculated above, we finally arrive at the taxable value of the building: $1,287,000.
Having determined the taxable assessed value of each of Maximus’s properties, we are now in a position to calculate the actual tax liability for each property (assum-ing Maximus does not protest either assessment—see callout on “Property Tax Appeals”). In summary:
Taxable Assessed Value of Maximus’s Portfolio
Townhouse Rental Building
Actual Assessed Value $260,760 $1,530,000
Exempt Value $1,400 $243,000
Taxable Assessed Value $259,360 $1,287,000
60 The modern 421-a program defines a “geographic exclusion zone” (GEA) in which participating developments are required to meet additional affordable housing requirements in exchange for the tax incentive. In 2006 the State expanded the GEA to include all of Manhattan, including Harlem where Maximus’s building is located. Maximus’s building was, however, outside of the GEA at the time it was constructed (2002) and therefore was eligible to receive the incentive even without providing addi-tional affordable units.
New
York City’s Property Tax
2 0 T H E F U R M A N C E N T E R F O R R E A L E S T A T E & U R B A N P O L I C Y2 0 T H E F U R M A N C E N T E R F O R R E A L E S T A T E & U R B A N P O L I C Y
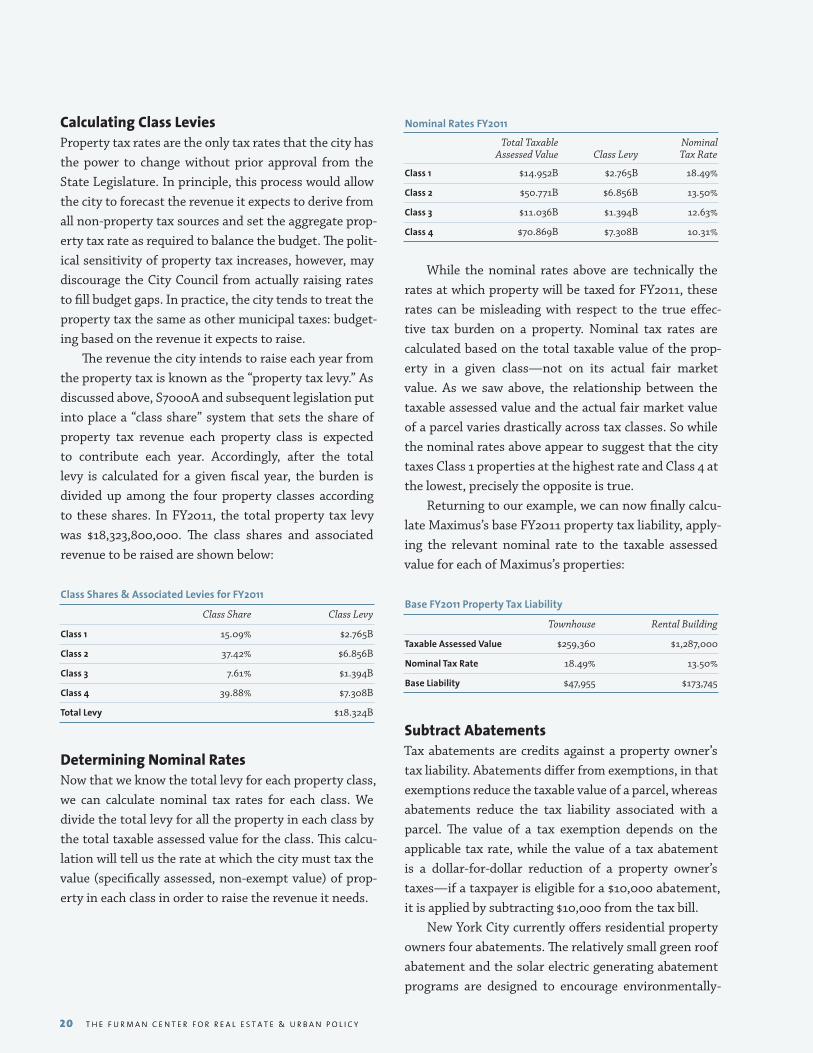
Calculating Class LeviesProperty tax rates are the only tax rates that the city has the power to change without prior approval from the State Legislature. In principle, this process would allow the city to forecast the revenue it expects to derive from all non-property tax sources and set the aggregate prop-erty tax rate as required to balance the budget. The polit-ical sensitivity of property tax increases, however, may discourage the City Council from actually raising rates to fill budget gaps. In practice, the city tends to treat the property tax the same as other municipal taxes: budget-ing based on the revenue it expects to raise.
The revenue the city intends to raise each year from the property tax is known as the “property tax levy.” As discussed above, S7000A and subsequent legislation put into place a “class share” system that sets the share of property tax revenue each property class is expected to contribute each year. Accordingly, after the total levy is calculated for a given fiscal year, the burden is divided up among the four property classes according to these shares. In FY2011, the total property tax levy was $18,323,800,000. The class shares and associated revenue to be raised are shown below:
Class Shares & Associated Levies for FY2011
Class Share Class Levy
Class 1 15.09% $2.765B
Class 2 37.42% $6.856B
Class 3 7.61% $1.394B
Class 4 39.88% $7.308B
Total Levy $18.324B
Determining Nominal RatesNow that we know the total levy for each property class, we can calculate nominal tax rates for each class. We divide the total levy for all the property in each class by the total taxable assessed value for the class. This calcu-lation will tell us the rate at which the city must tax the value (specifically assessed, non-exempt value) of prop-erty in each class in order to raise the revenue it needs.
Nominal Rates FY2011
Total Taxable Nominal Assessed Value Class Levy Tax Rate
Class 1 $14.952B $2.765B 18.49%
Class 2 $50.771B $6.856B 13.50%
Class 3 $11.036B $1.394B 12.63%
Class 4 $70.869B $7.308B 10.31%
While the nominal rates above are technically the rates at which property will be taxed for FY2011, these rates can be misleading with respect to the true effec-tive tax burden on a property. Nominal tax rates are calculated based on the total taxable value of the prop-erty in a given class—not on its actual fair market value. As we saw above, the relationship between the taxable assessed value and the actual fair market value of a parcel varies drastically across tax classes. So while the nominal rates above appear to suggest that the city taxes Class 1 properties at the highest rate and Class 4 at the lowest, precisely the opposite is true.
Returning to our example, we can now finally calcu-late Maximus’s base FY2011 property tax liability, apply-ing the relevant nominal rate to the taxable assessed value for each of Maximus’s properties:
Base FY2011 Property Tax Liability
Townhouse Rental Building
Taxable Assessed Value $259,360 $1,287,000
Nominal Tax Rate 18.49% 13.50%
Base Liability $47,955 $173,745
Subtract AbatementsTax abatements are credits against a property owner’s tax liability. Abatements differ from exemptions, in that exemptions reduce the taxable value of a parcel, whereas abatements reduce the tax liability associated with a parcel. The value of a tax exemption depends on the applicable tax rate, while the value of a tax abatement is a dollar-for-dollar reduction of a property owner’s taxes—if a taxpayer is eligible for a $10,000 abatement, it is applied by subtracting $10,000 from the tax bill.
New York City currently offers residential property owners four abatements. The relatively small green roof abatement and the solar electric generating abatement programs are designed to encourage environmentally-

S T A T E O F N E W Y O R K C I T Y ’ S H O U S I N G & N E I G H B O R H O O D S 2 0 1 1 2 1
Figure E: Calculating Maximus’s Property Taxes
Maximus’s PortfolioTownhouse (Class 1) Rental Building (Class 2) 1. Determine Fair Market Value Comparable Sales: $4.5M Capitalized Income: $3.4M
2. Multiply FMV by Assessment Ratio 6% of 4.5M = $270K 45% of 3.4M = $1.53M
3. Apply Caps/Phase-Ins $260K (due to cap) $1.53M (no phase-in applicable)
4. Subtract Exempt Value $1,400 (STAR) $243K (421-a)
5. Taxable Assessed Value $259K $1.28M
6. Multiply by Nominal Rate 18.49% of $259K 13.50% of $1.28M
7. Base Liability $48K $173K
8. Subtract Abatements N/A $11K (Green Roof)
9. Final Liability $48K $162K
10. Effective Tax Rate 1.07% 4.78%
friendly building upgrades. The J-51 and co-op/condo abatement programs, described previously, are larger and represent a significant reduction in the yearly tax revenue collected by the city.
Returning to our example, Maximus’s townhouse is not eligible for any abatements, so the figure above rep-resents the final tax bill associated with that property. Maximus’s Harlem building, however, has a planted
“green roof” and is therefore eligible for the city’s green roof abatement. Under the green roof program, Maxi-mus is eligible for a $4.50 tax abatement for every square foot of green roof installed. Given that his Harlem build-ing has 2,500 square feet of green roof, Maximus is eli-gible for an $11,250 abatement. We apply this abatement by subtracting it from the tax liability calculated previ-ously, leaving us with a final tax bill of $162,495 for Maxi-mus’s Harlem rental building.
Summary and Effective Tax RatesFigure E summarizes the steps we took to calculate Max-imus’s FY2011 property tax liability.
The “Final Liability” number above is the amount that will appear on Maximus’s tax bill for each property. We can see that the bill for Maximus’s rental building is more than three times as large as the bill for his town-house, despite the fact that the rental building has a sig-nificantly lower market value. The best way to capture the true tax burden on each property is to calculate its effective tax rate. As noted above, the effective tax rate on a piece of property is the final tax liability divided by the property’s fair market value. So while the nominal tax rate on Maximus’s rental building is well below the nominal rate on his townhouse (13.50 percent vs. 18.49 percent), the effective tax rate on Maximus’s rental building is more than four times the rate on his town-house (4.78 percent vs. 1.07 percent). In other words, for every $1,000 of market value on his townhouse, Maximus pays the city about $10.07. For every $1,000 of market value on his rental building, however, Maximus pays the city $47.80. This difference is almost entirely due to the disparate tax treatment of Class 1 versus Class 2 buildings in New York City.61 Class 2 buildings are assessed at a higher ratio (45 percent vs. 6 percent), rapid appreciation is phased-in rather than capped, and state law severely constrains the share of property tax revenue that can be derived from Class 1 properties. A discussion of the consequences of these distortions, and others, follows.
61 In comparing DOF’s valuation of income-generating properties to actual sales of those properties, the IBO found DOF’s valuation to be, on average, 28 percent below the sale price. If DOF’s Class 2 valuations are in fact somewhat depressed, the true disparity in effective tax rate between Class 1 and Class 2 properties would be reduced. IBO’s estimate of a 28 percent undervaluation of Class 2 properties, however, would have a relatively small effect. In our example above, if Maximus’ rental building was in fact worth 28 percent more than DOF estimates, its effective tax rate would be reduced to 3.75 percent, still 3.5 times that of his townhouse.
New
York City’s Property Tax

2 2 T H E F U R M A N C E N T E R F O R R E A L E S T A T E & U R B A N P O L I C Y2 2 T H E F U R M A N C E N T E R F O R R E A L E S T A T E & U R B A N P O L I C Y
Property Tax AppealsBy January 15 of each year, the city publishes a tentative assessment roll for all properties in the city, showing each property’s tax class, assessed value, and portion of any such value that is exempt from property tax.62 Prop-erty owners who disagree with their assessments can file applications for review with the New York City Tax Com-mission (the Commission) until March 15 for Class 1 prop-erties and March 1 for all other properties.63
A taxpayer may seek review of her assessment for the current and prior fiscal years on any of four grounds: (1) misclassification (the property was assessed in the wrong tax class); (2) excessiveness (the property is either entitled to an exemption that is not reflected in the assessment or a cap has been exceeded); (3) inequality (the property has been assessed at a rate higher than the assessment ratio for its class); and (4) unlawfulness (the property is fully exempt).64 The typical application is for a reduction in the property’s assessed value based on a claim of inequality.65 Proving such a claim usually involves demonstrating that DOF has overstated the property’s market value, causing the assessed value to be more than six percent (in the case of a class 1 property) of its true market value. The bur-den of showing that an assessment is improper is on the taxpayer.66 DOF’s assessment is presumed correct, and it typically relies on this presumption during the review pro-cess. Taxpayers may request in-person hearings as part of their applications and more than 98 percent of applicants are represented by a tax professional.
The Commission may offer the following remedies: an assessment reduction, a change of tax class, or an exemp-tion. While the Commission cannot increase an assess-ment, it has a policy of advising DOF “of clear instances of apparent underassessment for appropriate consider-ation in the next year.” Thus, the process is mostly, but not entirely, without risk to the taxpayer. After the Com-mission has made an offer to reduce a property’s assess-
62 Tax Commission (2012b). Property owners are also mailed a Notice of Proposed Value with this and much other information.
63 Other persons with legal standing to contest include a lessee of the entire parcel who is responsible for paying the taxes. Tax Commission (2012a). City of New York Tax Commission, 2010 Annual Report.
64 Tax Commission (2012b)
65 Id.
66 Tax Commission (2012a)
ment, the adjustment is only made if it is accepted by the taxpayer on the condition that she also consents to with-draw any other judicial and administrative proceedings related to assessments for prior years. The final tax roll is published on May 25. If the Commission’s offer is accepted before the assessment roll is finalized the final roll will reflect the adjustment. If the offer is not accepted by that time, or if the offer pertains to a prior year, DOF will recal-culate the property tax liability for the property and issue a refund or credit to the taxpayer. Taxpayers who do not accept an offer made by the Commission may seek judi-cial review of their assessments by filing a petition in the New York State Supreme Court.67
In 2011, the Commission received 50,249 applications for review, covering 184,100 separate tax lots.68 The Com-mission conducted 25,064 hearings and granted $6.1 bil-lion in assessment reductions, equivalent to $542,799,712 in tax liability.69 As Figure F shows, the large majority of the reduction in assessed value was granted to Class 2 and Class 4 properties, and a (relatively) insignificant amount resulted from Class 1 protests.
Figure F: Reductions in Assessed Value Offered by the Tax Commission ($ billion)
n Class 1 n Class 2 n Class 3 n Class 4
$0$1$2$3$4$5$6$7$8
010002000300040005000600070008000
010002000300040005000600070008000
2006 2007 2008 2009 2010 2011
It is important to note that the effect of the tax appeals process is largely to change the distribution of property taxes within each class, and it does not serve to reduce the overall tax burden on any particular class. Because the share of the real property tax levy that must be collected from each class is fixed under the class share system, reductions in assessed value resulting from the tax appeals process necessarily affect the nominal rates for each class set by the City Council. Successful tax
67 Tax Commission (2011b).
68 Id.
69 Id.

S T A T E O F N E W Y O R K C I T Y ’ S H O U S I N G & N E I G H B O R H O O D S 2 0 1 1 2 3
appeals lead to increases in nominal rates that offset the effect of the reductions in assessed value, in the aggre-gate, but that shift the allocation of the property tax bur-den away from those who successfully appeal to those who do not. As has been noted, the magnitude of these shifts can be significant, and so differences in appeals rates and appeals-success rates warrant close examina-tion to ensure that the process is operating to address overassessment in an equitable manner.
Focusing on class 2 properties, Figure G illustrates wide disparities between large rental buildings and con-dos and co-ops in both the rate at which the Commission offers reductions and the average reduction in assessed value that is offered. The purpose of the appeals process is to correct overassessments, and differences in the valu-ation of large rental properties and condos and co-ops are undoubtedly one of the significant factors behind these disparities. As discussed above, while condos and co-ops are not income producing properties, they must be valued as such by looking at the income and expenses of compara-ble properties. Rental buildings, on the other hand, can be valued by looking at their actual income and expenses. The
“income” approach to valuation is likely to be much more accurate for these rental properties, which could explain the lower appeals success rate for these buildings. It is less clear why the average reduction in assessed value is greater for condos and co-ops than rentals. One possibil-ity is that overassessments tend to be greater for more
valuable properties. For FY 2011 DOF estimated that, on a per unit basis, the average market value of large condo and co-op properties is approximately $119,411 while the average market value of large rental buildings is $62,760.70 Given the significant role that the appeals process plays in allocating the property tax burden, more research is needed to understand this and other questions about who appeals their property taxes, who succeeds in obtain-ing a reduction, and why.
Figure G: Tax Appeals Win-Rates and Average Reduction Offered for Class 2 Properties
Condos and Co-ops Condos and Co-ops Rental Apartments Rental Apartments
0%
5%
10%
15%
20%
25%
30%
35%
0100200300400500600700800
20
40
60
80
100
120
2004 2005 2006 2007 2008 2009 2010
2006 2007 2008 2009 2010 2011
SHA
RE
OF
AP
PE
AL
S G
RA
NT
ED
A
RE
DU
CT
ION
OF
FE
R (
SOL
ID L
INE
S)
AV
ER
AG
E A
SSE
SSE
D V
ALU
E
RE
DU
CT
ION
OFF
ER
ED
(D
ASH
ED
LIN
ES)
0.20
0.25
0.30
0.35
0.20
0.25
0.30
0.35
400
600
800
1000
70 DOF Annual Report (2011). The analysis excludes buildings with fewer than 11 units because the Tax Commission’s annual report does not detail which of these are rentals and which are condos or co-ops. Average market values are the total market value for all properties of that kind divided by the number of units.
New
York City’s Property Tax
2 4 T H E F U R M A N C E N T E R F O R R E A L E S T A T E & U R B A N P O L I C Y2 4 T H E F U R M A N C E N T E R F O R R E A L E S T A T E & U R B A N P O L I C Y
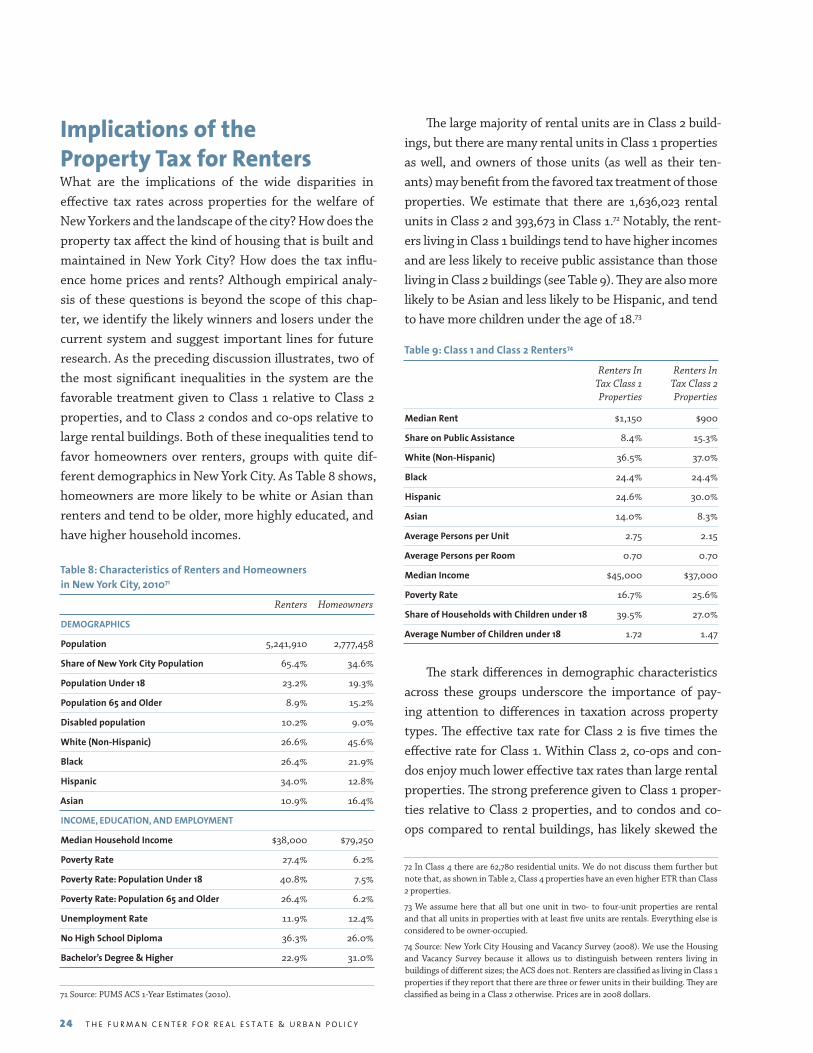
Implications of the Property Tax for RentersWhat are the implications of the wide disparities in effective tax rates across properties for the welfare of New Yorkers and the landscape of the city? How does the property tax affect the kind of housing that is built and maintained in New York City? How does the tax influ-ence home prices and rents? Although empirical analy-sis of these questions is beyond the scope of this chap-ter, we identify the likely winners and losers under the current system and suggest important lines for future research. As the preceding discussion illustrates, two of the most significant inequalities in the system are the favorable treatment given to Class 1 relative to Class 2 properties, and to Class 2 condos and co-ops relative to large rental buildings. Both of these inequalities tend to favor homeowners over renters, groups with quite dif-ferent demographics in New York City. As Table 8 shows, homeowners are more likely to be white or Asian than renters and tend to be older, more highly educated, and have higher household incomes.
Table 8: Characteristics of Renters and Homeowners in New York City, 201071 Renters Homeowners
DEMOGRAPHICS
Population 5,241,910 2,777,458
Share of New York City Population 65.4% 34.6%
Population Under 18 23.2% 19.3%
Population 65 and Older 8.9% 15.2%
Disabled population 10.2% 9.0%
White (Non-Hispanic) 26.6% 45.6%
Black 26.4% 21.9%
Hispanic 34.0% 12.8%
Asian 10.9% 16.4%
INCOME, EDUCATION, AND EMPLOYMENT
Median Household Income $38,000 $79,250
Poverty Rate 27.4% 6.2%
Poverty Rate: Population Under 18 40.8% 7.5%
Poverty Rate: Population 65 and Older 26.4% 6.2%
Unemployment Rate 11.9% 12.4%
No High School Diploma 36.3% 26.0%
Bachelor’s Degree & Higher 22.9% 31.0%
71 Source: PUMS ACS 1-Year Estimates (2010).
The large majority of rental units are in Class 2 build-ings, but there are many rental units in Class 1 properties as well, and owners of those units (as well as their ten-ants) may benefit from the favored tax treatment of those properties. We estimate that there are 1,636,023 rental units in Class 2 and 393,673 in Class 1.72 Notably, the rent-ers living in Class 1 buildings tend to have higher incomes and are less likely to receive public assistance than those living in Class 2 buildings (see Table 9). They are also more likely to be Asian and less likely to be Hispanic, and tend to have more children under the age of 18.73
Table 9: Class 1 and Class 2 Renters74
Renters In Renters In Tax Class 1 Tax Class 2 Properties Properties
Median Rent $1,150 $900
Share on Public Assistance 8.4% 15.3%
White (Non-Hispanic) 36.5% 37.0%
Black 24.4% 24.4%
Hispanic 24.6% 30.0%
Asian 14.0% 8.3%
Average Persons per Unit 2.75 2.15
Average Persons per Room 0.70 0.70
Median Income $45,000 $37,000
Poverty Rate 16.7% 25.6%
Share of Households with Children under 18 39.5% 27.0%
Average Number of Children under 18 1.72 1.47
The stark differences in demographic characteristics across these groups underscore the importance of pay-ing attention to differences in taxation across property types. The effective tax rate for Class 2 is five times the effective rate for Class 1. Within Class 2, co-ops and con-dos enjoy much lower effective tax rates than large rental properties. The strong preference given to Class 1 proper-ties relative to Class 2 properties, and to condos and co-ops compared to rental buildings, has likely skewed the
72 In Class 4 there are 62,780 residential units. We do not discuss them further but note that, as shown in Table 2, Class 4 properties have an even higher ETR than Class 2 properties.
73 We assume here that all but one unit in two- to four-unit properties are rental and that all units in properties with at least five units are rentals. Everything else is considered to be owner-occupied.
74 Source: New York City Housing and Vacancy Survey (2008). We use the Housing and Vacancy Survey because it allows us to distinguish between renters living in buildings of different sizes; the ACS does not. Renters are classified as living in Class 1 properties if they report that there are three or fewer units in their building. They are classified as being in a Class 2 otherwise. Prices are in 2008 dollars.
New
York City’s Property Tax
S T A T E O F N E W Y O R K C I T Y ’ S H O U S I N G & N E I G H B O R H O O D S 2 0 1 1 2 5
composition of the residential housing stock away from Class 2 and toward Class 1 properties, and away from rent-als and toward condos and co-ops within Class 2, although further research is needed to estimate just how large the effects might be. When something is taxed, the economy tends to produce less of it, and this general result is likely as true in the city’s housing market as in other markets.
The IBO’s 2006 study suggested that, at that time, a shift to a property tax with just a single effective rate applicable to all properties (and that also eliminated the requirement that condos and co-ops be valued as rental buildings) would have increased the levy on Class 1 properties by $3.6 billion (or approximately $5,200 per unit) as the Class 1 share of the levy jumped from 13.9 percent to 40.8 percent (commensurate with its share of citywide market value at that time).75 They predicted that under such a new regime, elevator and walk-up rental buildings would have seen their annual taxes cut by $1,513 and $1,042 per unit, respectively, while condos and co-op units in large buildings would have seen their taxes increase by $4,501 and $2,482 per unit, respectively. Such shifts in tax liability would mitigate the disincen-tive to devote land to rental housing and, to the extent zoning allowed, almost certainly shift land use in the city away from one- to three-family homes (Class 1) and condominiums and co-ops towards rental buildings.
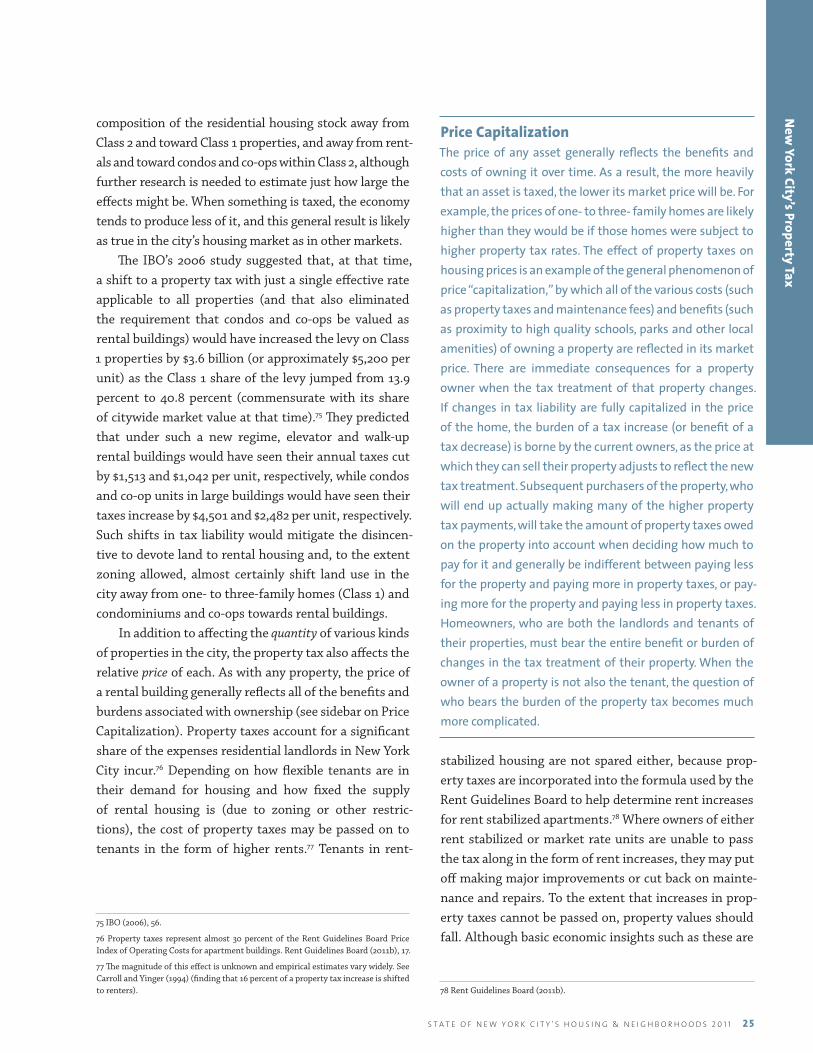
In addition to affecting the quantity of various kinds of properties in the city, the property tax also affects the relative price of each. As with any property, the price of a rental building generally reflects all of the benefits and burdens associated with ownership (see sidebar on Price Capitalization). Property taxes account for a significant share of the expenses residential landlords in New York City incur.76 Depending on how flexible tenants are in their demand for housing and how fixed the supply of rental housing is (due to zoning or other restric-tions), the cost of property taxes may be passed on to tenants in the form of higher rents.77 Tenants in rent-
75 IBO (2006), 56.
76 Property taxes represent almost 30 percent of the Rent Guidelines Board Price Index of Operating Costs for apartment buildings. Rent Guidelines Board (2011b), 17.
77 The magnitude of this effect is unknown and empirical estimates vary widely. See Carroll and Yinger (1994) (finding that 16 percent of a property tax increase is shifted to renters).
Price CapitalizationThe price of any asset generally reflects the benefits and costs of owning it over time. As a result, the more heavily that an asset is taxed, the lower its market price will be. For example, the prices of one- to three- family homes are likely higher than they would be if those homes were subject to higher property tax rates. The effect of property taxes on housing prices is an example of the general phenomenon of price “capitalization,” by which all of the various costs (such as property taxes and maintenance fees) and benefits (such as proximity to high quality schools, parks and other local amenities) of owning a property are reflected in its market price. There are immediate consequences for a property owner when the tax treatment of that property changes. If changes in tax liability are fully capitalized in the price of the home, the burden of a tax increase (or benefit of a tax decrease) is borne by the current owners, as the price at which they can sell their property adjusts to reflect the new tax treatment. Subsequent purchasers of the property, who will end up actually making many of the higher property tax payments, will take the amount of property taxes owed on the property into account when deciding how much to pay for it and generally be indifferent between paying less for the property and paying more in property taxes, or pay-ing more for the property and paying less in property taxes. Homeowners, who are both the landlords and tenants of their properties, must bear the entire benefit or burden of changes in the tax treatment of their property. When the owner of a property is not also the tenant, the question of who bears the burden of the property tax becomes much more complicated.
stabilized housing are not spared either, because prop-erty taxes are incorporated into the formula used by the Rent Guidelines Board to help determine rent increases for rent stabilized apartments.78 Where owners of either rent stabilized or market rate units are unable to pass the tax along in the form of rent increases, they may put off making major improvements or cut back on mainte-nance and repairs. To the extent that increases in prop-erty taxes cannot be passed on, property values should fall. Although basic economic insights such as these are
78 Rent Guidelines Board (2011b).

2 6 T H E F U R M A N C E N T E R F O R R E A L E S T A T E & U R B A N P O L I C Y
important for predicting the possible hidden effects of the property tax on renters, further research is required to draw any strong inferences for policy, especially given the complexity of the city’s regulatory environment and of its housing market.
While further research about the effects of the disparities we’ve highlighted is necessary, the existing evidence suggests an urgent need for debate over the desirability of substantive policy reforms, such as over-hauling the class share system and limiting or abolishing the condo/co-op abatement, as steps toward a more uni-form rate of taxation across properties. The IBO’s 2006 study provides an analysis of some of the more drastic proposals that might be considered. The extraordinary political difficulties of making any changes to the system stymie efforts to have the necessary debate, to be sure. But the complexity of the system, along with naïvete about who actually bears the cost of property taxes, has limited discussions about how to make the property tax regime more efficient and fair. A significant first step to promoting renewed debate would be to make the property tax more transparent and salient to rent-ers, by encouraging or requiring landlords to disclose to their tenants the share of the landlords’ expenses that goes toward property taxes, or at least the building’s tax assessment, an idea suggested by former Finance Com-missioner Carol O’Cleireacain.79 In the case of tenants in rent stabilized apartments, the Rent Guidelines Board could provide rent stabilized tenants with an annual simplified summary of the effect of the property tax on the maximum allowable rent increase. While the Rent Guidelines Board already makes available on its web-site detailed information about its estimates of land-lords’ costs (including the property tax component) and how these costs factor into permitted rent increases, a summary document for tenants could make the infor-mation more accessible. Being aware of the potential
79 Scanlon and Cohen (2009).
relationship between property taxes and their rents might inspire more tenants to join the debate, allow them to be more informed participants in the discussion, and pro-mote a more robust and productive effort to seriously consider the costs and benefits of the existing system and of proposed reforms.
Such a discussion is especially timely now, as poli-cymakers across the country reconsider housing policy in the aftermath of the financial crisis. Falling home prices have destroyed trillions of dollars of home equity, with disastrous consequences for families whose homes were their primary vehicle for savings. Foreclosure rates reached levels not seen since the Great Depression, with devastating effects on families and communities. The foreclosure crisis, along with ballooning budget deficits, has provoked fresh scrutiny from across the political spec-trum of the enormous subsidies provided at all levels of government for homeownership. Congressional Republi-cans have called for privatization and “eventual elimina-tion” of Fannie Mae and Freddie Mac.80 The Center for American Progress, a progressive think tank, has sharply criticized the IRS rule allowing taxpayers to deduct taxes (including the property tax) paid to state and local gov-ernments.81 The bipartisan Simpson-Bowles Commis-sion has recommended a significant curtailment of the mortgage-interest tax deduction.82 The consequences of any one of these changes would be far-reaching.
As policymakers begin to rethink government’s role in encouraging homeownership, they must not forget that policies affecting homeowners will tend to have a corresponding impact on renters as well. The politi-cal history and current disparities of New York City’s property tax are a testament to this reality. In the wake of the Great Recession and housing market collapse, the time is ripe to reconsider New York City’s policies toward renters, and property taxes should be a part of that discussion.
80 House Budget Committee (2012).
81 The Center for American Progress (2011)
82 The National Commission on Fiscal Responsibility and Reform (2010).

New
York City’s Property Tax
S T A T E O F N E W Y O R K C I T Y ’ S H O U S I N G & N E I G H B O R H O O D S 2 0 1 1 2 7
References
Abelson, Max. 2008. Courtney Sale Ross’ Glorious 740 Park Duplex Very, Very Quietly Asking ‘Over $60 Million’, New York Observer, October 22, 2008. Available at http://www.observer.com/2008/10/court-ney-sale-ross-glorious-740-park-duplex-very-very-quietly-asking-over-60-million/.
Bilefsky, Dan. 2011. A Sharp Increase in Appraisals for Queens Co-ops Brings Protests, New York Times, May 10, 2011.
Carroll, Robert J. and John Yinger. 1994. Is the Prop-erty Tax a Benefit Tax? The Case of Rental Housing, 47 National Tax Journal 2.
The City of New York. Adopted Budget Fiscal Year 2011. June 2010. Available at http://www.nyc.gov/html/omb/html/publications/publications.shtml.
The City of New York Department of Finance, Office of Tax Policy. February 2012. Annual Report on Tax Expenditures FY 2011.
The City of New York Department of Finance, Office of Tax Policy. August 2011. Annual Report on the NYC Property Tax FY 2011.
The City of New York Tax Commission. 2012a. How to Appeal a Tentative Assessment. Available at http://www.nyc.gov/html/taxcomm/downloads/pdf/tc600.pdf.
The City of New York Tax Commission. 2012b. 2011 Annual Report.
Donovan, Todd, Christopher Z. Mooney, Daniel A. Smith. 2010. State and Local Politics: Institutions and Reform.
Hanlon, Seth. February 2, 2011. Tax Expenditure of the Week: State and Local Tax Deduction. Available at http://www.americanprogress.org/issues/2011/02/te020211.html.
Hennelly, Bob. 2012. Tight Financial Times Have More City Homeowners Appealing Tax Bills, WNYC News. Available at http://www.wnyc.org/articles/wnyc-news/2012/mar/15/tight-financial-times-have-more-city-home-owners-appealing-tax-bills/.
House Budget Committee. 2012. The Path to Prosperity: A Blueprint for American Renewal.
Kaplan, Thomas. 2011. Upset at Cuomo’s Property- Tax Cap, Communities Move to Get Around It, New York Times, October 24, 2011.
Minnesota Taxpayers Association and Lincoln Institute of Land Policy. April, 2011. 50-State Property Tax Comparison Study.
The National Commission on Fiscal Responsibility and Reform. December 2010. The Moment of Truth: Report of The National Commission on Fiscal Responsibility and Reform.
New York City Independent Budget Office. February 2011. How Assessment Phase Ins and Caps Affect the City’s Property Tax.
New York City Independent Budget Office. December 5, 2006. Twenty-Five Years After S7000A: How Property Tax Burdens Have Shifted in New York City.
New York (N.Y.). Real Property Tax Reform Commis-sion, Stanley E. Grayson, New York (N.Y.). Dept. of Finance, New York (N.Y.). December 30, 1993. Final Report as approved by the New York City Real Property Tax Reform Commission. City Council. Finance Division.
New York City Rent Guidelines Board. April 14, 2011a. 2011 Income and Expense Study.
New York City Rent Guidelines Board. April 14, 2011b. 2011 Price Index of Operating Costs.

2 8 T H E F U R M A N C E N T E R F O R R E A L E S T A T E & U R B A N P O L I C Y
New York Public Interest Research Group. February 1981. City of Unequal Neighbors: A Study of Residential Property Tax Assessments in New York City.
New York State Assembly Task Force on School Finance and Real Property Taxation. 1979. The Legisla-tive Response to the Property Tax Crisis: An Analysis of Public Policy Approaches to Classification.
New York University, Graduate School of Public Admin-istration (Dick Netzer, Project Director). December 31, 1980. Real Property Tax Policy for New York City.
Scanlon, Rosemary and Hope Cohen. March/April 2009. Assessing New York City’s Property Tax—Yet Again. Available at http://www.manhattan-institute.org/email/crd_newsletter04-09.html.