distribution, status, and likely future trends of bull
TRANSCRIPT

i\i>nh American Journal t>f Fisheries Management 1 7 : 1 1 1 1 - 1 1 2 5 , 1American Fisheries Society 1997
Distribution, Status, and Likely Future Trends ofBull Trout within the Columbia River and
Klamath River BasinsBRUCE E. RIEMAN, ' DANNY C LEE, AND RUSSELL F. THUROW
U.S. Forest Sen'ice, Rocky Mountain Research Station316 East Myrtle Street. Boise, Idaho 83702. USA
Abstract.—We summari/ed existing knowledge regarding the distribution and status of bull troutSalvelimts confluentus across 4,462 subwatersheds of the interior Columbia River basin in Oregon,Washington. Idaho, Montana, and Nevada and of the Klamath River basin in Oregon, a regionthat represents about 20% of the species' global range. We used classification trees and the patternsof association between known distributions and landscape characteristics to predict the likelydistribution of bull trout in unsampled subwatersheds. Bul l trout are more likely to occur and thepopulations are more likely to be strong in colder, higher-elevation, low- to mid-order watershedswith lower road densities. Our results show that bull trout remain widely distributed and occur inmost of the subbasins representing the potential range. Some strong and relatively secure popu-lations exist. In general, bull trout are better represented in the region as a whole than many othernative species. Important declines in distribution and status are evident, although the extent ofchange is clouded by uncertainties in the historical distribution. Despite the broad distribution,much of the current range is poorly represented by strong or protected populations. The southernmargins of the range are a particular concern and could be an important priority for conservationmanagement. Continued habitat loss associated with disruptive land use practices threatens re-maining bull trout populations. Even with no further habitat loss, existing fragmentation couldcontribute to continuing local extinctions aggravated by the expansion of introduced species andthe effects of climate change.
Many biologists have expressed concern thatbull trout Salvelinus confluentus are in trouble. De-clining populations may be threatened with ex-tinction through habitat loss and fragmentation,introduced species, and overfishing (e.g., Mongillo1992; Ratliff and Howell 1992; Thomas 1992; Rie-man and Mclntyre 1993; Henjum et al. 1994; Ja-kober 1995). Petitions for listing under the U.S.Endangered Species Act culminated in a 1994 de-cision by the U.S. Fish and Wildlife Service thatlisting was warranted but precluded because ofother priorities (U.S. Office of the Federal Register[June 10, 1994]:30254). That decision was con-tinued in 1995 (U.S. Office of the Federal Register[June 12, 1995]:30825). Despite the attention, un-certainty and debate regarding the status of bulltrout remain.
A growing body of work suggests many bulltrout populations are at risk. Migratory life his-tories have been restricted or lost entirely (Ratliffand Howell 1992; Rieman and Mclntyre 1993;Goetz 1994; Jakober 1995). There is evidence ofdeclining trend in some populations (Mauser ct.al. 1988; Weaver 1992; Rieman and Mclntyre1996; Rieman and Myers 1997) and local extinc-
1 Corresponding author: brieman/int—[email protected]
tions have been reported across the species' range(Mongillo 1992; Ratliff and Howell 1992; Thomas1992; Goetz 1994). Population declines are attrib-uted largely to the effects of land management anddevelopment (Ratliff and Howell 1992; Riemanand Mclntyre 1993; Henjum et al. 1994), but theexpansion of exotic species (Donald and Alger1992; Markel 1992; Ziller 1992; Leary et al. 1993)and the isolation of habitats by dams, diversions,or other barriers (Ratliff and Howell 1992; Jakober1995 ) also appear important.
The present distribution and status of bull troutare poorly defined in many areas. Attempts toquantify extinctions are limited by a lack of his-torical information. Status reviews have been com-pleted by each of the states with populations, buta comprehensive and consistent picture across thespecies' range has yet to emerge. In their reviewfor the proposed endangered species listing, theU.S. Fish and Wildlife Service was limited pre-dominantly to gray and anecdotal literature. A use-ful "meta-analysis" has been limited by an in-consistent methodology, scale, and updating ofavailable information. A comprehensive picture islimited by the lack of sampling across a substantialportion of the species' potential distribution.
A recent assessment by the Forest Service and
1111
This file was created by scanning the printed publication.Errors identified by the software have been corrected;
however, some errors may remain.

1112 RIKMAN ET AL.
FIGURK 1.—Interior Columbia River basin within the United States and part of the Klamath River basin representedin this study. Ecological reporting units (ERU) used to summarize information across broad regions of similarbiophysical characteristics are also shown.
Bureau of Land Management of ecological sys-tems throughout the interior Columbia River basinwithin the United States and portions of the Klam-ath River and Great basins (Quiglcy and Arbclbidc1997) provided the opportunity for a more com-plete picture. The project was an attempt to char-acterize large regions from a number of perspec-tives, and thus it provided the opportunity to lookat fishes in a broad landscape context. In this paperwe focus on the results of our work with bull trout;a general look at other salmonids is provided byThurow et al. (1997, this issue).
Our objective is to describe the distribution andstatus of bull trout across a major part of the spe-cies* range. Our approach was based on a summaryof current knowledge provided by more than 150biologists working throughout the study area. Weextrapolated to unsampled areas with classificationmodels based on associations of known occur-rences with landscape characteristics. We use ourresults to describe current (or recent) conditionsand to consider factors that are likely to influencethe distribution of the species in the future.
Background and Study AreaThe study area included all lands in the Colum-
bia River basin east of the Cascade Mountain crestwithin the United States and those portions of theKlamath River basin and Great Basin in Oregon(Figure 1). The area includes over 58.3 x 10⁶ hain Idaho, Montana, Nevada, Oregon, Washington,and Wyoming. The Klamath basin within the studyarea comprises 1.5 X 10⁶ ha. Bull trout do notoccur in the Great Basin, so that area was excludedfrom analysis for this paper.
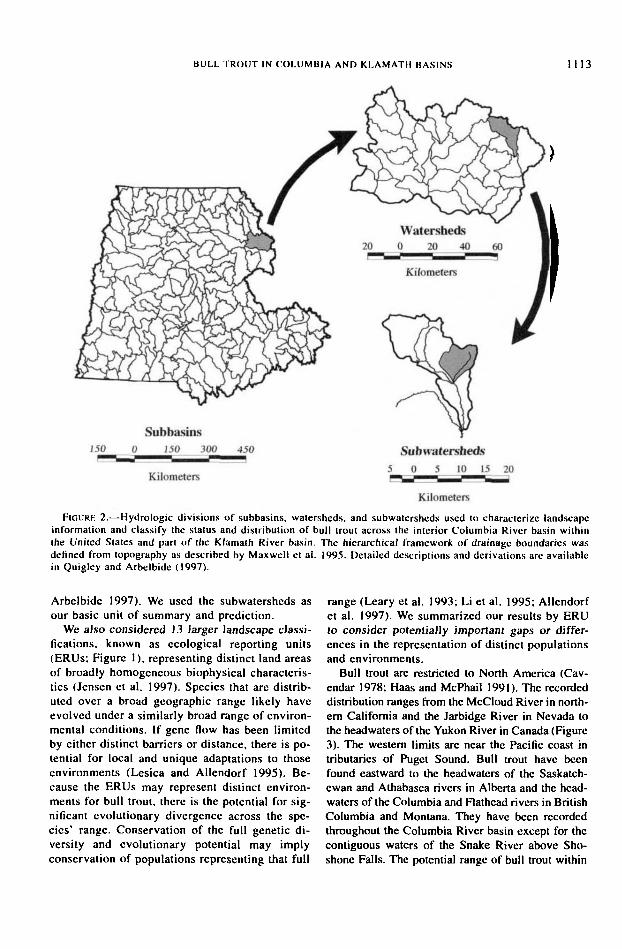
Topography was used to define a hierarchicalsystem of subbasins, watersheds, and subwater-sheds. Within the study area, 164 large subbasinswere defined (Figure 2). The subbasins were fur-ther divided into watersheds, which average about22,820 ha in surface area. The watersheds weredivided into 7,498 subwatersheds averaging 7,800ha each. The hydrologic divisions follow the hi-erarchical framework of aquatic ecological unitsdescribed by Maxwell et al. (1995). The delinea-tions and map coverages were provided for ouruse by the Columbia Basin Project (Quigley and
BULL TROUT IN COLUMBIA AND KLAMATH BASINS 1 1 1 3
20 0 20 40 60
Subbasins150 0 J5Q 300
Kilometers
450 Subwatersheds5 05 10 15 20
KilometersFIGURK 2.—Hydrologic divisions of subbasins, watersheds, and subwatershcds used to characterize landscape
information and classify the status and distribution of bull trout across the interior Columbia River basin withinthe United States and part of (he K/amath River basin. The hierarchical framework of drainage boundaries wasdefined from topography as described by Maxwell et al. 1995. Detailed descriptions and derivations are availablein Quigley and Arbelbide (1997).
Arbelbide 1997). We used the subwatersheds asour basic unit of summary and prediction.
We also considered 13 larger landscape classi-fications, known as ecological reporting units(ERUs; Figure 1), representing distinct land areasof broadly homogeneous biophysical characteris-tics (Jensen ct al. 1997). Species that are distrib-uted over a broad geographic range likely haveevolved under a similarly broad range of environ-mental conditions. If gene flow has been limitedby either distinct barriers or distance, there is po-tential for local and unique adaptations to thoseenvironments (Lesica and Allendorf 1995). Be-cause the ERUs may represent distinct environ-ments for bull trout, there is the potential for sig-nificant evolutionary divergence across the spe-cies' range. Conservation of the full genetic di-versity and evolutionary potential may implyconservation of populations representing that full
range (Leary et al. 1993; Li et al. 1995; Allendorfct al. 1997). We summarized our results by ERUto consider potenliaJJy important gaps or differ-ences in the representation of distinct populationsand environments.
Bull trout are restricted to North America (Cav-endar 1978; Haas and McPhail 1991). The recordeddistribution ranges from the McCloud River in north-ern California and the Jarbidge River in Nevada tothe headwaters of the Yukon River in Canada (Figure3). The western limits are near the Pacific coast intributaries of Puget Sound. Bull trout have beenfound eastward to the headwaters of the Saskatch-ewan and Athabasca rivers in Alberta and the head-waters of the Columbia and Flathead rivers in BritishColumbia and Montana. They have been recordedthroughout the Columbia River basin except for thecontiguous waters of the Snake River above Sho-shone Falls. The potential range of bull trout within

1114 R1EMAN ET AL.
FiGi'Ri- 3.—Global range of bull iroul and ihe area( w i t h i n the heavy lines) of this study. Our representationof the complete distribution was adapted from Cavendar(1978) and Haas and McPhail (1991).
our study area represents about 20% of the species'global range (Figure 3).
Bull trout are believed to be a glacial relict(McPhail and Lindsey 1986), and the broad dis-tribution probably has contracted and expandedperiodically with natural climate changes (Wil-liams et al. 1997). Patterns of genetic variationsuggest an extended and evolutionarily importantisolation between populations in the Klamath andMalheur river basins of Oregon and those in theColumbia River basin (Leary et al. 1993). Currentwork may extend the inference of that isolation toother basins in Oregon as well (P. Spruell, Uni-versity of Montana, personal communication).Populations throughout the Columbia River basinappear more closely allied and may have expandedfrom common glacial refugia or maintained highlevels of gene flow among populations in recentevolutionary time (Williams et al. 1997).
Bull trout primarily inhabit colder streams (Pratt
1984, 1992; Henjum el al. 1994; Rieman andMclntyre 1995), although individuals have beenobserved in larger rivers throughout the ColumbiaRiver Basin (anecdotal accounts include the mainstems of the Columbia and Snake rivers near theirconfluence and upstream). Juveniles inhabit natalstreams for one to three years (Shepard et al. 1984;Pratt 1992); older fish may remain in those streamsfor life, or they may range over entire river basins( Pratt 1992; Jakober 1995; Swanbcrg 1996).
MethodsKnown status and distribution.—Through a se-
ries of workshops in early 1995, we asked state,federal, tribal, and privately employed biologiststo characterize the status of bull trout in all of thesubwatersheds of the study area. More than 150biologists from across the region participated inthe project by summarizing available information.At a first level of resolution, bull trout occurrencein each subwatershed was characterized as present,absent, or unknown. When bull trout were present,additional information (when available) was usedto characterize a subwatershed as predominantlyspawning and rearing habitat, or as supportinghabitat used only seasonally (i.e., as migratory cor-ridors, wintering, or staging areas). Populations inspawning and rearing areas were further classifiedas strong or depressed depending on abundance,current trends in abundance, and the full expres-sion of potential life histories (Table 1). Biologistswere asked to rely on biological information andnot to make judgements regarding status from hab-itat or environmental conditions.
We submitted the original classifications to re-view by others familiar with the area in questionwhenever possible and attempted to use only themost current information. We summarized bulltrout distribution information from existing statedatabases to validate and augment presence or ab-sence classifications. We restricted our use to da-tabases that had been created or updated after1993. In general, biologists provided informationin addition to and directly supporting that alreadyavailable from the databases. Whenever a conflictoccurred between any two sources that could notbe resolved with current information, the subwa-tershed population was classified as "unknown."
Despite the criteria provided for classification,an element of subjectivity remains in the data.Most of the information represented by the clas-sifications is not published or peer reviewed. In-consistencies probably occur in classifications, andthe quality of available information may vary. It

BULL TROUT IN COLUMBIA AND K L A M A T H B A S I N S 1115
TABLH 1.—Guidelines for biologists' classifications ofthe occurrence and status of bull trout in subwatersheds ofthe interior Columbia River basin and part of the Klamathbasin.
Populationstatus Population characteristics in the suhwatershed
Strong A strong population meets all of the followingcriteria• Spawning and rearing occur within the sub-
watershed• All major life history forms that once oc-
curred are still present in the subwatershed• Abundance is stable or increasing• The population, or melapopulation of which
this subwatershed population is a part, sup-ports an average of 5.(KK) individuals or 5(H)adults
Depressed A depressed population meets at least one of thefollowing criteria• A major life history component has been
eliminated• Numbers within the subwatershed are declin-
ing, or bull trout occur in less than half ofthe historical habitat, or numbers are lessthan half of what the watershed supportedhistorically
• Total abundance for the population or meta-population within the subwatershed. or thelarger region of which this subwatershcd is apart, is less than 5.(HH) individuals or 5<X)adults
Absent A population is absent if both the following cri-teria are met• The species is either extinct or has never oc-
cupied the subwatershed• The subwalershed is w i thin the natural range
of the species and coloni/ation of the subwa-tershed was historically possible
Transient The subwatershed does not support spawning orextended rearing and functions only as a mi-gralional corridor or a.s a seasonal staging andwintering area for migrating fish
Present The species occurs in the subwalershed but notenough is known to classify type of use orstatus
Unknown No information is available regarding the currentpresence or absence of the species in the sub-walershed
is impossible, however, to generate a comprehen-sive and current view of any species distributionand status without relying on this kind of infor-mation. Recognizing the potential for errors, webelieve these data represent as complete a sum-mary of the current (or recent), collective knowl-edge of bull trout as is possible.
We also note that the resolution of our data mayproduce more optimistic estimates of current dis-tributions than work based on length or area ofstreams. That is, if bull trout occurred anywhere
in a subwatershed, they were considered presentin the entire subwatershed. Analysis at the sub-watershed level of resolution was necessary sim-ply because of logistical and computational con-straints imposed by the scale of our study. Webelieve, however, that because of the patchy natureof bull trout distributions, the potential for ex-tended movement and dispersal, and the substruc-turing of regional populations apparent at roughlythis scale (sensu Rieman and Mclntyre 1995), sub-watersheds actually are the most appropriate levelfor our analysis. In essence we, believe that sub-watersheds best approximate the distributions ofpotentially discrete groups or local populations,and thus represent a better summary unit thanstream reaches. To minimize any potential bias, allestimates of the distributions were based on thenumber of subwatcrsheds and not area,
Potential historical range.—We defined the po-tential historical range for bull trout as those wa-ters either at least temporarily occupied by, or di-rectly accessible to, the species within the studyarea prior to European settlement. Our estimate ofthat range was inferred from the historical distri-butions summarized for Washington (Mongillo1992), Montana (Thomas 1992). Idaho (Idaho De-partment of Fish and Game, unpublished bull troutmanagement plan) and Oregon (Ratliff and Howell1992), the current distribution, and any additionalhistorical accounts (e.g., Hubbs and Miller 1948).Sampling reports and anecdotal accounts indicatethat bull trout still occur, at least occasionally, inthe main-stem Columbia and Snake rivers. Bulltrout often move throughout the river systems con-necting subbasins and more localized spawningand rearing habitats (Bjornn and Mallet 1964; Ja-kober 1995; Swanberg 1996). Genetic work in-dicates substantial gene flow has occurred amongsubbasins in recent evolutionary time (Leary et al.1993; Williams et al. 1997). For these reasons, weincluded all subwatersheds that were directly ac-cessible according to the known current and his-torical occurrences as part of the potential histor-ical range (hereafter referred to as potential range).Even in pristine environments, the distribution ofbull trout is patchy (Rieman and Mclntyre 1993,1995), and it seems unlikely that bull trout oc-cupied all of the waters of the potential range atany one time. However, because this species hasranged widely and still does so, we believe it likelythat bull trout have occurred throughout the area.
Predictive models.—The influence of the bio-physical environment and land management on thestatus and distribution of bull trout was explored

1116 RIKMAN ET AL.
by means of statistical models known as classifi-cation trees (Breiman et al. 1984). Our primaryobjective in this analysis was to predict fish pres-ence and status using landscape features and man-agement history, and to identify the elements thatare associated most prominently with bull troutdistributions. Tree-based models represent a non-parametric alternative to conventional linear mod-els that have more constraining assumptions aboutdata structure (see Breiman ct al. 1984; Clark andPregibon 1992; Crawford and Fung 1992; Taylorand Silverman 1993). Tree-based models offer sev-eral advantages. First, where the set of predictorvariables includes both continuous and discretevariables, tree-based models may be easier to in-terpret. Second, tree-based models are insensitiveto monotonic transformations of the predictor vari-ables, relying solely on the rank ordering of vari-ables. Third, tree-based models are better at cap-turing nonadditive behavior. The disadvantage oftree-based models is that they arc of limited utilityfor drawing statistical inferences. Thus, their pri-mary uses are for building predictive models, dataexploration, and hypothesis generation, rather thantesting specific hypotheses.
For categorical response variables, such as spe-cies' presence or absence, tree-based models resultin classification trees, so named because of thebranching diagrams often used to display the mod-els. Classification trees consist of a dichotomousrule set that is generated through a process of re-cursive partitioning. Recursive partitioning in-volves sequentially splitting the data set into morehomogeneous units, relative to the response vari-able, until a predefined measure of homogeneityis reached, or until no further subdivision is de-sired or feasible. Data are split at each juncturebased on a single predictor variable that producesthe greatest differences between the two resultantgroups of observations. Predictor variables can bereused at subsequent splits. The objective of theclassification algorithm is to derive a terminal setof nodes, each containing a subset of the originaldata, where the distribution of the response vari-able is independent of the predictor variables tothe greatest extent possible. Details of the algo-rithm used to build the classification trees can befound in Clark and Prcgibon (1992) and StatisticalSciences (1993).
All analyses involving classification trees wereperformed with the Splus2 programming language.
2 The use of trade or firm names in this paper is forreader information only and does not imply endorsementby the U.S. Department of Agriculture of any productor service.
following the procedures outlined in Clark andPregibon (1992). We summarized 28 potential pre-dictor variables (other than ERUs; Table 2) frommore than 200 coverages representing landscapecharacteristics across the study area. We limitedour variables to those with potential influence onaquatic ecosystems and generally eliminated manyof those that were strongly correlated with or di-rectly derived from others (Lee et al. 1997). Thevariables were both categorical and continuous andrepresented vegetative communities, climate, ge-ology, landform and erosive potential, and pastmanagement or relative intensity of human dis-turbance (Table 2). Detailed descriptions of thecomplete landscape coverages, variables, and theirderivations can be found in Quigley and Arbelbide(1997) and Lee et al. (1997). We developed twoseparate classification trees. In the first, known bulltrout status was reduced to a binomial variable bycombining present-strong, present-depressed, ormigration corridor, into a single classification ofpresent. A second tree was constructed with a tri-nomial response to distinguish spawning and rear-ing areas (present-strong or -depressed) from ar-eas that are not used, or used only as migratorycorridors or seasonal habitats. Present-strong andpresent-depressed were retained as separate re-sponses, while migration corridor and absent werecombined in the third permissible response. Bothtrees were optimized for fit using the cross vali-dation and pruning routines described by Breimanet al. (1984) and Clark and Pregibon (1992). Thefinal trees were used to estimate the probability ofpresence or absence of bull trout in subwatershedsclassified as unknown and to predict status in sub-watersheds classified as unknown or present un-known. All estimates and predictions were limitedto the potential range.
Summary.—We summarized both the known andpredicted information by ERU and across the studyarea. To estimate how much of the current distri-bution was protected by special land use desig-nations, we also summarized the number of oc-cupied subwatersheds within designated wilder-ness or National Park Service lands. Bull troutdistributions were mapped using geographic in-formation systems (GIS). The GIS coverages de-picting the subwatersheds, land ownership, andmanagement status were developed as part of thelandscape information noted above (Quigley andArbelbide 1997).
ResultsThe estimated potential range for bull trout, in-
cluding main-stem corridors, represented about

BULL TROUT IN COLUMBIA AND KLAMATH BASINS 1117
TABLH 2.—Descriptions of landscape variables used tobuild classification trees in the analysis of bull trout dis-tribution and status in the Columbia River and Klamathbasins. All values for physiographic, geophysical and veg-etation variables were summari/cd for subwatcrsheds fromcomplete coverages with a pixel resolution of I km2. Allvalues expressed as percentages refer to the percent areaof the subwaicrshcd. Detailed descriptions and derivationsarc described in Quigley and Arbelbide (1997).
Variablename Description
HRU
slope
slope2
con Icon2u>n3sdtl
.sdt2
sdt3
alsilalsi2alsi3alsi4pprecip
clevmtemp
solar
streams
drndenanadachucorder
hkhaseero
bank
vmf
vegclus
roaddn
mgclus
Ecological reporting unit (see text and Figure I )
Physiographic and geophysicalArea weighted average midslopc based on 90-m
digital elevation mapsPercent of area in slope class 2 (slopes >!()%.
Percent weakly consolidated lithologiesPercent moderately consolidated lithologiesPercent strongly consolidated liihologiesPercent lithologies that produce coarse-tcxlurcd
sedimentsPercent lithologies that produce medium-textured
sedimentsPercent lithologies that produce fine-textured sedi-
mentsPercent felsic lithologiesPercent intermediate aluminosilicaled lithologiesPercent mafic lilhologicsPercent carbonate lithologiesMean annual precipitation extrapolated to com-
plete coverage using a regional climate simula-tion model
Mean elevationMean annual air temperature extrapolated to com-
plete coverage using a regional climate simula-tion model
Mean annual solar radiation based on topographicshading, latitude, and aspect
Total length of streams within subwatcrshed basedon 1:100.000 scale hydrography
Drainage density (stream length/watershed area)Access for anadromous fish (0 = no, 1 - yes)Number of upstream subwatersheds tributary to
the watershed of interest (0 designates a head-water subwa(crshcd)
Soil texture coefficientBase erosion index representing relative surface
erodability without vegetationSurface erosion ha/ard, a derived variable based
on baseero and other modifying factorsSircambunk erosion ha/ard. a derived variable
representing relative bank stabilities
VegetationVegetation amelioration factor, a derived variable
representing the relative amount of ground cov-er in vegetation
Current vegetation class (12 possible types) basedon structure and composition
Ownership and managementEstimated road density class (5 classes: none-very
high)Management class ( 10 possible types, intense
commodity extraction-wilderness) based onownership and management emphasis
70% of the subwatersheds in the study area (Table3). Bull troul probably occurred throughout muchof the Klamath and the Columbia River basins withthe exception of a portion of the Columbia Plateauand the upper reaches of the Snake River basin inIdaho and Wyoming (Figure 4). Bull trout arc re-ported from the geologically isolated sink drain-ages of the upper Snake River Basin (Hubbs andMiller 1948), but not from other waters of theSnake River basin above Shoshonc Falls. Bulltrout were reported as present in about 36% of thesubwatcrsheds within the potential range. In about28% of the potential range, bull trout presence wasunknown or unclassified; in another 10% bull troutwere known to be present but their status unknown(Table 3).
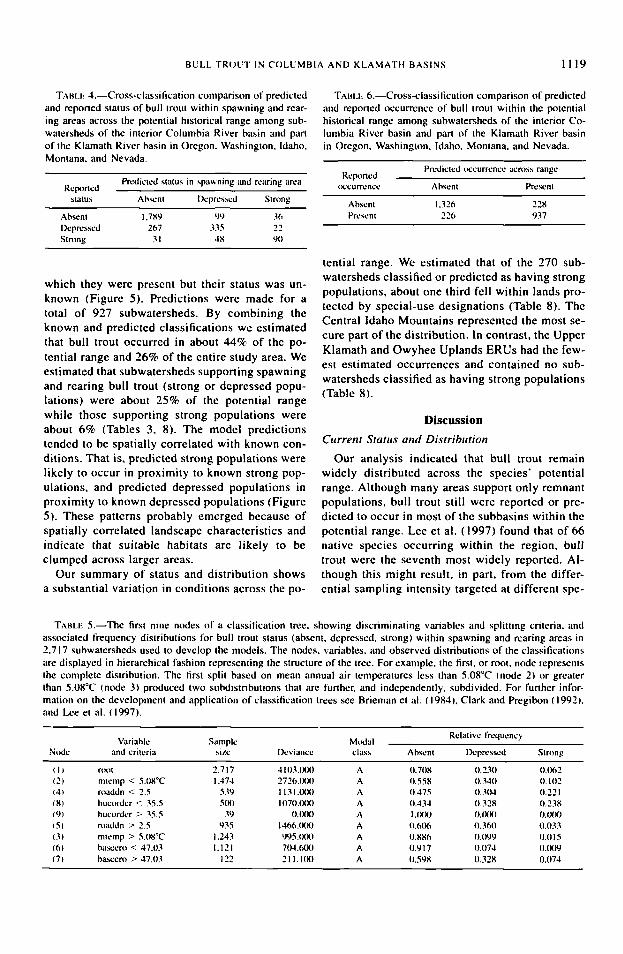
Both classification models were developed from2,717 subwatersheds with complete landscape in-formation and known status. The model that waslimited to status in spawning and rearing areas(i.e., strong, depressed, absent) had an overall clas-sification success rate of about 82% (Table 4). Themodel was most successful predicting subwater-sheds where bull trout were absent (86%) and per-formed less well predicting the occurrence ofstrong (61%) and depressed (70%) populations(Table 4). We used 21 variables, but a major por-tion of the deviance (a measure of variation incategorical variables) was explained by mean an-nual air temperature (mtemp), road density(roaddn), and watershed order (hucorder) (Table5). Bull trout were more likely to occur in coldersubwatersheds with lower road densities, and in amidorder to headwater context. For example, bulltrout were four times more likely to be present(spawning and rearing) and populations were morethan six times more likely to be classified as strongin subwatersheds with a mean annual air temper-ature less than 5.1°C, than in warmer areas (i.e.,the frequency of strong populations was 0.102where temperatures were below 5.08°C and 0.015where they exceeded 5.08°C; Table 5). Over 80%of the reported spawning and rearing areas werein the colder subwatersheds. Within the colder sub-watersheds, bull trout populations were reportedas strong nearly seven times more frequently inthose with less than 2.5 miles of road per squaremile than those with more (Table 5).
The more general model that was used to predictpresence (including transient occupation of sea-sonal habitats) and absence had a slightly betteroverall classification success rate (83%; Table 6).We included 19 variables in this model, but theprincipal variables explaining most of the deviance

1118 RIF.MAN KT AL.
TABI.I-: 3.—Summary of classifications (number of subwatershcds) of occurrence and status for bull trout within theinterior Columbia River basin and part of the Klamath River basin in Oregon. Washington. Idaho, Montana, and Nevada.
Ideologicalreporting unit
Northern CaseadesSouthern CascadesUpper KlamathColumbia PlateauBlue MountainsNorthern Glaciated MountainsLower Clark ForkUpper Clark ForkOwyhee UplandsCentral Idaho Mountains
Entire assessment area
Total
340141175
1.089695955415306956
1.232
6,304
Potentialhistorical
range
3198073
551442955415306174
1.147
4.462
Status where present
Totalpresent
144329
59163316166145
7567
1.608
Strong
101003
23264
2i0
72169
Depressed
2269
1972
12575
1092
186
625
Unknown
9090
17317746
51
167
443
Trans-ient
2270
20378841104
142
371
Absent
844048
21717733516084
102360
1.607
Unknownor no
classifi-cation
918
16275102304897765
220
1.247
were subwatershed slope (slope), order (hucorder),and mean elevation (elev). Bull trout were reportedmore frequently in steeper, higher-elevation wa-tersheds, but were less likely in the lowest-order(i.e., headwater) than in larger streams (Table 7).This indicates that bull trout occur commonlythroughout larger stream and river systems, even
though they are not found in all of the headwatertributaries.
We used the models to estimate the probabilityof occurrence of bull trout in subwatersheds inwhich bull trout presence was unknown (Figure 4)and to predict the status of bull trout in watershedsin which bull trout presence was unknown or in
Absent0.009 - 0.3330.333 - 0.6570.657 -Present
0.98
FIGURF 4.—Classified presence, absence, and estimated probability of occurrence of bull trout across the interiorColumbia River basin within the United States and part of the Klamath River basin. Areas not shaded representsubwatersheds outside the potential range.
BULL TROUT IN COLUMBIA AND KLAMATH BASINS 1119
TABU-: 4.—Cross-classification comparison of predictedand reported status of bull trout within spawning and rear-ing areas across the potential historical range among sub-watersheds of the interior Columbia River basin and partof the Klamath River basin in Oregon. Washington, Idaho,Montana, and Nevada.
Reportedstatus
AbsentDepressedStrong
Predicted status in spawning and rearing area
Absenl
1.789267
31
Depressed
9933548
Strong
362290
which they were present but their status was un-known (Figure 5). Predictions were made for atotal of 927 subwatersheds. By combining theknown and predicted classifications we estimatedthat bull trout occurred in about 44% of the po-tential range and 26% of the entire study area. Weestimated that subwatersheds supporting spawningand rearing bull trout (strong or depressed popu-lations) were about 25% of the potential rangewhile those supporting strong populations wereabout 6% (Tables 3, 8). The model predictionstended to be spatially correlated with known con-ditions. That is, predicted strong populations werelikely to occur in proximity to known strong pop-ulations, and predicted depressed populations inproximity to known depressed populations (Figure5). These patterns probably emerged because ofspatially correlated landscape characteristics andindicate that suitable habitats are likely to beclumped across larger areas.
Our summary of status and distribution showsa substantial variation in conditions across the po-
TABLI-; 6.—Cross-classification comparison of predictedand reported occurrence of bull trout within the potentialhistorical range among subwatersheds of the interior Co-lumbia River basin and pan of the Klamath River basinin Oregon, Washington, Idaho. Montana, and Nevada.
Reportedoccurrence
AbsentPresent
Predicted occurrence across range
Absent
1,326226
Present
228937
tential range. We estimated that of the 270 sub-watersheds classified or predicted as having strongpopulations, about one third fell within lands pro-tected by special-use designations (Table 8). TheCentral Idaho Mountains represented the most se-cure part of the distribution. In contrast, the UpperKlamath and Owyhee Uplands ERUs had the few-est estimated occurrences and contained no sub-watersheds classified as having strong populations(Table 8).
DiscussionCurrent Status and Distribution
Our analysis indicated that bull trout remainwidely distributed across the species* potentialrange. Although many areas support only remnantpopulations, bull trout still were reported or pre-dicted to occur in most of the subbasins within thepotential range. Lee et al. (1997) found that of 66native species occurring within the region, bulltrout were the seventh most widely reported. Al-though this might result, in part, from the differ-ential sampling intensity targeted at different spe-
TABLK 5.—The first nine nodes of a classification tree, showing discriminating variables and splitting criteria, andassociated frequency distributions for bull trout status (absent, depressed, strong) within spawning and rearing areas in2.717 subwalcrsheds used to develop the models. The nodes, variables, and observed distributions of the classificationsare displayed in hierarchical fashion representing the structure of the tree. For example, the first, or root, node representsthe complete distribution. The first split based on mean annual air temperatures less than 5.08°C (node 2) or greaterthan 5.08°C (node 3) produced two subdistributions that are further, and independently, subdivided. For further infor-mation on the development and application of classification trees see Brieman et al. (1984), Clark and Pregibon (1992).and Lee et al. (1997).
Node
( 1 )(2)(4)(8)f9)(5)(3)(6)(7)
Variableand criteria
rootmtemp < 5.08°Croaddn < 2.5hucorder < 35.5hue-order > 35.5roaddn > 2.5miemp > 5.08°Cbaseero < 47.03bascero > 47.03
Samplesixc
2.7171.474
5395(X)39
9351 .2431.121
122
Deviance
41()3.(XX)2726.(XX)1131. (XX)1070.000
0.0001466.(XXJ995. (XX)704.600211. 100
Modalclass
AAAAAAAAA
Relative frequency
Absent
0.7080.5580.4750.434J.(XX)0.6060.8860.9170.598
Depressed
0.2300.3400.3040.328O.fXX)0.3600.0990.0740.328
Strong
0.0620.1020.2210.238O.fXX)0.0330.0150.0090.074

1120 RIEMAN ET AL.
TABU- 7.—The first nine nodes of a classification tree showing discriminating variables and associated frequencydistributions for bull trout presence or absence in 2,717 subwatershcds used to develop the models. The nodes, variables,and observed distributions of the classifications are displayed in hierarchical fashion representing the structure of thetree.
Node
( 1 )(2)(4)(H)(9)(5)(3)(6)(7)
Variable
rtx>tslope < 20.68hucorder < 0.5eiev < 5.449 mclcv > 5.449 mhucorder > 0.5slope > 20.68hucorder < 1.5hucorder > 1.5
Samplesixe
2.7171.325
621495126704
1.392857535
Deviance
3.710.0001,467.000
420.600192.100160.400921.800
1,868.0001.187.000
527.000
Modalclass
AAAAAAPAP
Relative frequency
Absent
0.5720.7580.8940.9510.6670.6380.3950.5200.194
Present
0.4280.2420.1060.0480.3330.3620.6050.4800.806
cies, even accounting for such a bias bull troutappear to be distributed far more widely than manynative fishes.
A broad distribution does not mean there havenot been important declines. We estimated thatstrong populations occur in only 6% of the poten-tial range, or about 24% of the estimated spawningand rearing sub watersheds (i.e., strong + de-
pressed). If we consider all of the subwatershcdsin the historical range with an estimated mean an-nual air temperature (mtemp) less than 5.1°C (i.e.,the subwatersheds supporting most of the identi-fied spawning and rearing) as the historical spawn-ing and rearing habitat, bull trout were estimatedas strong in 12% and present in 44% of subwa-tersheds. We cannot estimate the actual decline in
mm Depressed•• "i. i • Predicted Depressed•• Predicted Strong1̂ 1 Strong
FKJURH 5.—Known and predicted classifications of status of bull trout within spawning and rearing areas andthe potential range across the interior Columbia River basin within the United Stales and part of the Klamath Riverbasin.

BULL TROUT IN COLUMBIA AND KLAMATH BASINS 1121
TABU-; 8.—Summary of total known plus predicted classifications (number of subwatershcds) of occurrence and statusof bull trout across all subwatersheds and "protected lands" of the interior Columbia River basin and part of theKlamath River basin in Oregon, Washington, Idaho, Montana, and Nevada. The number of subwatershcds where theclassification was predicted is shown in parentheses.
Known + predictedwithin "protected
{geologicalreporting unil
Northern CascadesSouthern CascadesUpper KlamathColumbia PlateauBlue MountainsNorthern Glaciated MountainsLower Clark ForkUpper Clark ForkOwyhee UplandsCentral Idaho MountainsHntire assessment area"
Present
172(28)33(1)16(7)
124(65)200 (37)365 (49)197(31)197(52)
7(0)654 (87)
1,965(357)
Known •+
Strong
10(0)14(4)03(0)
28 (5)38(12)8(4)
26(5)0
143(71)270(101)
predicted8
Depressed
34(12)6 (0)
14(5)22(2)83(11)
156(31)107(32)128(19)
2(0)261 (75)813(187)
lands"
Absent
144(60)47(7)57 (9)
426 (209)242 (65)582 (247)218(58)109(25)167(65)492(132)
2.484 (877)
Present
49210
35751426
2175379
Strong
8100
1518260
3989
4 Thirteen .subwatershcds within the potential historical range arc omitted because of incomplete information.
the distribution of bull trout because we do notknow how much of the potential range was oc-cupied. Bull trout distributions arc patchy even inpristine environments (Rieman and Mclntyre1993) and it is unlikely that all of the availablehabitat was ever occupied at any one time (Riemanand Mclntyre 1995). More refined predictions ofsuitable habitats are needed to clarify the magni-tude of change.
Despite the uncertainty, these and other resultssuggest important declines have occurred. First,depressed classifications were three times morecommon than strong. Second, the association be-tween bull trout occurrence and estimated roaddensity suggests a trend of environmental disrup-tion and biological response. Because human dis-ruption and roads arc widespread, such effects maybe widespread as well. Third, as noted earlier, otherwork at finer scales of resolution showed localdeclines in abundance, local extinctions, and lossof migratory life histories.
A general goal in the conservation of any spe-cies is to maintain a broad representation of viablepopulations across both local and regional scalesto conserve both biological diversity and adaptivecapacity (Leary el al. 1993; Lesica and Allendorf1995; Li et al. 1995; Noss et al. 1995; Allendorfet al. 1997), and to minimize the risks of local andregional extinctions (Rieman and Mclntyre 1993).The current distribution suggests that bull trouthave fared better and are currently more secure insome areas than in others. For example, we notedthat bull trout are very poorly represented in theUpper Klamath and Owyhee Uplands ERUs. Be-cause these two regions represent the extreme
southern margins of the species range, the popu-lations here may be adapted to unique environ-ments and may represent a disproportionate panof the total diversity within the species (Scuddcr1989; Lesica and Allendorf 1995). From a broadconservation perspective, these two areas could beparticularly important.
There are sound reasons for concern about otherregions as well. General criteria for evaluating pri-orities in conservation have been based on rarityat the particular scales of interest (e.g., Noss et al.1995) and on gaps in protection across a range(e.g., Kicstcr et al. 1996). For example, NatureConservancy standards consider regions support-ing fewer than six "viable elements" to be thehighest level of concern, those supporting 6—20elements at the second level, and those supportingmore than 100 to be "apparently secure'* (Noss etal. 1995). Subwatersheds of the size we used ap-proximate the boundaries of local populations ofbull trout (see Rieman and Mclntyre 1995). If weconsider only those classified or predicted as hav-ing strong populations, or only those falling withinprotected lands to be viable elements, in either caseonly the Central Idaho Mountains ERU could beconsidered secure (Table 8).
Future TrendsWe suggest three factors arc likely to influence
the future trends in bull trout distribution and sta-tus: further habitat degradation, the expansion ofexotic species, and existing and future habitat frag-mentation.
Habitat degradation.—Bull trout appear sensi-tive to habitat changes associated with land use

1122 R I H M A N ET AL.
management and other effects on channel condi-tions, water quality, and water temperature (Shep-ard et al. 1984: Bond 1992: Henjum el al. 1994;Dambacher and Jones 1997). Disruptive land usesthreaten many stream fishes (see papers in Saloand Cundy 1987 and in Meehan 1991) in ways thatwe may or may not mitigate with more carefulmanagement (Frissell and Baylcs 1996). Becausebull trout appear to have relatively specific habitatrequirements (Rieman and Mclntyre 1993), theymay be particularly sensitive to land managementactivities. Human populations and demands forforest-based commodities and recreational accessare expected to increase, not decrease, in the fu-ture. We could anticipate increasing risks for bulltrout as well.
Introduced species.—There are now at least 30introduced species within the range of bull troutin our study area (Lee et al. J997). Although anumber of these may interact with bull trout, thereis particular concern that lake trout Salvelinus nam-aycush and brook trout Salvelinus fontinalis canand have displaced bull trout in lakes (Donald andAlger 1992) and streams (Leary et al. 1993), re-spectively. Brook trout, in particular, are nowwidely distributed in the region and have been re-ported from most of the watersheds within the cur-rent distribution of bull trout (see Thurow et al.1997). Although brook trout may not invade allwaters important to bull trout, the potential forinteraction across much if not most of the rangeis clear.
Fragmentation.—Fragmentation of habitat andpopulations is a growing issue in the conservationmanagement of many species (Gilpin 1987; Sim-berloff 1988: Mangel et al. 1996), including bulltrout and other fishes (Rieman and Mclntyre 1993,1995; Li et al. 1995; Reeves ct al. 1995; Schlosserand Angcrmcier 1995; Dunham ct al. 1997, thisissue). In general, as populations are restricted tosmaller and more isolated habitats, the risks ofboth local and regional extinctions are expected toincrease. The loss in distribution likely will not bedirectly proportional to the loss of habitat area.Rather, further loss of habitat could acceleraterates of extinction above the rate of habitat loss(Rieman and Mclntyre 1995). Existing fragmen-tation may be a particularly relevant issue to con-servation of bull trout. Barriers (i.e., dams, waterwithdrawals) and habitat degradation in river cor-ridors have affected migratory patterns, either iso-lating remnant nonmigratory populations or re-stricting movements to smaller areas (Ratliff andHowcll 1992: Ziller 1992; Rieman and Mclntyre
1993; Jakober 1995; Swanberg 1996). Loss of hab-itat and a progression of local extinctions may havecreated a similar effect through a patchwork ofremnant populations that have become progres-sively more isolated by distance (Frissell et al.1993). Our analysis showed that much of the rangeis represented by patchy or disjunct distribution(Figures 4, 5). Other trends may aggravate thatpattern. Expansion of brook trout and other speciesinto bull trout habitats can lead to greater isolation(Ziller 1992; Adams 1994). The association of bulltrout distributions with temperature leads us to an-ticipate a similar effect with climate change (forsimilar discussions regarding other native Salvel-inus populations, see Meisner 1990; Flebbc 1993;Nakano et al. 1996).
Regardless of whether the patterns of fragmen-tation result from natural or anthropogenic effects,the smaller and more isolated parts of the rangelikely face higher risks in the long term. Localextinctions through stochastic processes are nat-ural, even common, events for many species, andperhaps for bull trout (Rieman and Mclntyre 1993,1995). Where regional populations lack the re-dundancy and connectivity to refound or supportlocal populations prone to extinction, such lossesrepresent an uncompensated, incremental drift to-ward regional extinction. Even with no furtherhabitat loss, local extinctions and erosion of thebroad distribution may continue.
ConclusionsBull trout occur widely across a major portion
of the potential range. At the broad scale, they arebetter represented than some other native fishes,and populations in some parts of the range arerelatively secure. Despite the broad distribution,however, declines and local extinctions have oc-curred. Current patterns in the distribution and oth-er empirical evidence, when interpreted in view ofemerging conservation theory, lead us to believethat further declines and extinctions are likely. Be-cause of a strong association with colder environ-ments (and the potential for climate change) andthe pervasive occurrence of introduced fishes,rates of loss could accelerate in the future. Bulltrout are not currently threatened with extinctionacross all of the range, but effective conservationmanagement will be necessary to preempt that out-come.
AcknowledgmentsThis work would not have been possible without
the participation and support of more than 150

BULL TROL'T IN COLUMBIA AND KLAMATH BASINS 1123
professional biologists working throughout the re-gion. The complete list of people providing dataand technical review for this analysis is availablein Lee et al. (1997). Particularly important help indata development was provided by P. Howell, T.Shuda, L. Ulmer, K. MacDonald, K. Overton, J.Gebhards, L. Leatherbury, and D. Heller. Elec-tronic data attributed to river reaches was madeavailable by P. Hahn, Washington Department ofFish and Wildlife, Olympia; J. Decker-Hess andB. Shepard, Montana Department of Fish Wildlifeand Parks, Kalispell; K. Jones, Oregon Departmentof Fish and Wildlife, CorvaJlis; and B. Butterfield,J. Hall-Griswold, J. Hanscn, and S. Gebhards (re-tired). Idaho Department of Fish and Game, Boise.D. Myers and G. Chandler provided support in datasummary, manipulation and mapping, and manu-script preparation. Map coverages and develop-ment of landscape information was supported byB. Gravenmeier, G. Stoddard, W. Hann, J. Clayton,C. Lorimar, S. McKinney, and K. Geier-Hayes. R.Gresswell, R. Hughes, R. White, D. Buchanan, P.Howell, K. Pratl, and D. Myers provided helpfulreview of the manuscript.
ReferencesAdams. S. 1994. Bull trout distribution and habitat use
in ihe Weiser River drainage. Idaho. Master's thesis.University of Idaho, Moscow.
Allendorf, F. W.. and nine coauthors. 1997. Prioriti/ingPacific salmon stocks for conservation. Conserva-tion Biology 11:140-152.
Bjornn, T. C., and J. Mallet. 1964. Movements of plantedand wild trout in an Idaho river system. Transactionsof the American Fisheries Society 93:70-76.
Bond. C. E. 1992. Notes on nomenclature and distri-bution of the bull trout and the effects of humanactivity on the species. Pages 1-4 in Howell andBuchanan (1992).
Breiman. L.. J. H. Friedman. R. Olshen, and C. J. Stone.1984. Classification and regression trees. Wads-worth, Belmont. California.
Cavendar. T. M. 1978. Taxonomy and distribution of thebull trout (Salvelinus confluentus} from the Ameri-can northwest. California Fish and Game 64:139-174.
Clark, L. A., and D. Pregihon. 1992. Tree based models.Pages 377-419 in J. M. Chambers and T. J. Hastie.editors. Statistical models. Wadsworth and Brooks/Cole, South Pacific Grove, California.
Crawford. S. L., and R. M. Fung. 1992. An analysis oftwo probabilistic model induction techniques. Sta-tistics and Computing 2:83-90.
Dambacher. J. M.. and K. K. Jones. 1997. Stream habitatphysiography of juvenile bull trout populations inOregon and benchmarks for habitat quali ty. Pages353-360 1/1 W. C. MacKay. M. K. Brewin, and M.Monia. editors. Friends of the bull trout conference
proceedings. Bul l Trout Task Force (Alberta) .(Avai lable from Trout Unlimited Canada. Calgary.Alberta.)
Donald. D. B.. and D. J. Alger. 1992. Geographic dis-tribution, species displacement, and niche overlapfor lake trout and bull trout in mountain lakes. Ca-nadian Journal of Zoology 71:238-247.
Dunham, J. B.. G. L. Vinyard, and B. E. Ricman. 1997.Habitat fragmentation and ext inct ion risk of La-hontan cutthroat trout. North American Journal ofFisheries Management 17:1 126-1133.
Flebbe. P. A. 1993. Comment on Meisner < 1990): effectof climatic warming on the southern margins of thenative range of brook trout. Salvelinus fontinulis.Canadian Journal of Fisheries and Aquatic Sciences50:883-884.
Frissell. C. A., and D. Bayles. 1996. Ecosystem man-agement and the conservation of aquatic biodiver-sity and ecological integrity. Water Resources Bul-let in 32:229-240.
Frissell, C. A., W. J. Liss, and D. W. Bayles. 1993. Anintegrated, biophysical strategy for ecological res-toration of large watersheds. Pages 449-456 in D.Potts, editor. Proceedings of the symposium onchanging roles in water resources management andpolicy. American Water Resources Association,Herndon. Virginia.
Gilpin, M. E. 1987. Spatial structure and population vu l -nerability. Pages 125-139 in M. E. Soule, editor.Viable populations for conservation. CambridgeUniversi ty Press. New York.
Goeu. F. A. 1994. Distribution and juveni le ecology ofbull trout (Salvelinus confluentus) in the CascadeMountains. Master's thesis. Oregon Slate Univer-sity. Corvallis.
Haas, G. R., and J. D. McPhail. 1991. Systematics anddistribution of Dolly Varden (Salvelinus malnui) andbull trout (Salvelinus ctmjluenius) in North America.Canadian Journal of Fisheries and Aquatic Sciences48:2191-2211.
Henjum. M. G.. and seven coauthors. 1994. Interim pro-tection for late-successional forests, fisheries, andwatersheds. National forests cast of the CascadeCrest, Oregon and Washington. The Wildlife So-ciety. Bethesda. Maryland.
Howell, P. J.. and D. V. Buchanan. editors. 1992. Pro-ceedings of the Gearhart Mountain bull trout work-shop. American Fisheries Society, Oregon Chapter,Corvallis.
Hubbs, C. L., and R. R. Miller. 1948. Correlation be-tween fish distribution and hydrologic history in thedesert basins of western United States. Univers i tyof Utah Biological Series IO(7):77-I66.
Jakober, M. J. 1995. Influence of stream si/.e and mor-phology on the seasonal dis tr ibut ion and habitat useof resident bull trout and westslope cutthroat troutin Montana. Master's thesis. Montana State Uni-versity. Bozeman.
Jensen. M. E.. and rive coauthors. 1997. Biophysicalenvironments of the basin. U.S. Forest Service Gen-eral Technical Report PNW-405(volume I ) : 101-335.

1124 R I H M A N KT AL.
Kiester, A. R.. and six coauthors. 1996. Conservationprioritization using GAP data. Conservation Biol-ogy 10:1332-1342.
Leary. R. E, F. W. Allendorf. and S. H. Forhes. 1993.Conservation genetics of bull trout in the Columbiaand Klamath river drainages. Conservation Biology7:856-865.
Lee, D. C.. J. Sedell. B. Rieman. R. Thurow. and J.Williams. 1997. Broad scale assessment of aquaticspecies and habitats. U.S. Forest Service GeneralTechnical Report, PNW-405( volume 3): 1057-1496.
Lesica, P.. and F. W. Allendorf. 1995. When are periph-eral populations valuable for conservation? Con-servation Biology 9:753-760.
Li, H. W., and 12 coauthors. 1995. Safe havens: refugesand evolutionary significant units. Pages 371-380in J. L. Ncilsen, editor. Evolution and the aquaticecosystem: defining unique units in population con-servation. American Fisheries Society, Symposium17. Bethesda. Maryland.
Mangel, M., and 41 coauthors. 1996. Principles for theconservation of wild l iving resources. EcologicalApplications 6:338-362.
Markel. D. F. 1992. Evidence of bul l trout x brook trouthybrids in Oregon. Pages 58-67 in Howell and Bu-chanan (1992).
Mauser, G. R., R. W. Vogelsang. and C. L. Smith. 1988.Enhancement of trout in large north Idaho lakes.Idaho Department of Fish and Game, Federal Aidin Sport Fish Restoration. Project F-73-R-IO. Com-pletion Report, Boise
Maxwell, J. R., and five coauthors. 1995. A hierarchicalframework of aquatic ecological units in NorthAmerica (Nearctic Zone). U.S. Forest Service Gen-eral Technical Report NC-176.
McPhail, J. D.. and C. C. Lindsey. 1986. Zoogeographyof the freshwater fishes of Cascadia (the Columbiasystem and rivers north to the Stikine). Pages 615-638 in C. H. Hocutl and E. O. Wiley, editors. Thezoogeography of North American freshwater fishes.Wiley. New York.
Mechan, W. R., editor. 1991. Influences of forest andrangcland management on salmonid fishes and theirhabitats. American Fisheries Society. Special Pub-lication 19. Bethesda, Maryland.
Meisner. J. D. 1990. Effect of climatic warming on thesouthern margins of the native range of brook trout,Salvelinus fontinaUs. Canadian Journal of Fisheriesand Aquatic Sciences 47:1065-1070.
Mongillo, P. 1992. Distribution and status of bull trout/Dolly Varden in Washington state. Bull trout/DollyVarden management and recovery plan. WashingtonDepartment of Wildlife. Fisheries Management Di-vision Report 92-22, Olympia.
Nakano, S., F. Kitano, and K. Maekawa. 1996. Potentialfragmentation and loss of thermal habitats forcharrsin the Japanese archipelago due to climatic warm-ing. Freshwater Biology 36:711-722.
Noss, R. F, E. T. Laroe. and J. M. Scott. 1995. Endan-gered ecosystems of the United States: a prelimi-nary assessment of loss and degradation. BiologicalScience Report 28.
Pratt. K. L. 1984. Habitat use and species interactionsof juvenile cutthroat trout (Sulnw clurki lewisi) andbull trout (Salvelinus conjiuenius) in the upper Flat-head River basin. Master's thesis. University of Ida-ho. Moscow.
Pratt, K. L. 1992. A review of bull trout life history.Pages 5-9 in Howell and Buchanan (1992).
Quigley, T. M., and S. J. Arbelbide, editors. 1997. Anassessment of ecosystem components in the interiorColumbia basin and portions of the Klamath andGreat basins. LLS. Forest Service General TechnicalReport PNW-405(volumes 1-4).
Ratliff , D. E., and P. J. Howell. 1992. The status of bulltrout populations in Oregon. Pages 10-17 in Howelland Buchanan (1992).
Reeves, G. H., L. E. Benda, K. M. Burnett, P. A. Bisson.and J. R. Sedell. 1995. A disturbance-based eco-system approach to maintaining and restoring fresh-water habitats of cvoluiionarily significant units ofanadromous salmonids in the Pacific Northwest.Pages 334-349 in J. L. Neilscn. editor. Evolutionand the aquatic ecosystem: defining unique units inpopulation conservation. American Fisheries So-ciety. Symposium 17. Bethesda. Maryland.
Rieman, B. E., and J. D. Mclntyre. 1993. Demographicand habitat requirements of bull trout Salvelinuaconfluentus. U.S. Forest Service General TechnicalReport INT-302.
Rieman, B. E., and J. D. Mclntyre. 1995. Occurrence ofbull trout in naturally fragmented habitat patches ofvaried size. Transactions of the American FisheriesSociety 124:285-296.
Rieman, B. E.. and J. D. Mclnlyrc. 1996. Spatial andtemporal variability in bull trout redd counts. NorthAmerican Journal of Fisheries Management 16:132-141.
Rieman. B. E., and D. L. Myers. 1997. Use of reddcounts to detect trends in bull trout populations.Conservation Biology 11:1015-1018.
Salo, E. O., and T. W. Cundy. editors. 1987. Streamsidemanagement: forestry and fishery interactions. Uni-versity of Washington, Institute of Forest Re-sources, Contribution 57. Seattle.
Schlosscr, I. J., and P. L. Angermeier. 1995. Spatial vari-ation in demographic processes of lotic fishes: con-ceptual models, empirical evidence, and implica-tions for conservation. Pages 392-401 in J. L. Neil-sen. editor. Evolution and the aquatic ecosystem:defining unique uni ts in population conservation.American Fisheries Society, Symposium 17. Be-thesda. Maryland.
Scudder. G. G. E. 1989. The adaptive significance ofmarginal populations: a general perspective. Ca-nadian Special Publication of Fisheries and Aquatic-Sciences 105:180-185.
Shcpard. B., K. Pratt, and P. Graham. 1984. Life historiesof wcstslope cutthroat and bull trout in the upperFlathcad River basin. Montana. Report (ContractR008224-01-J) of Montana Department of Fish.Wildlife and Parks to U.S. Environmental Protec-tion Agency, Helena.
Simberloff, D. 1988. The contribution of population and

BULL TROUT IN COLUMBIA AND KLAMATH BASINS 1125
community biology to conservation science. AnnualReview of Ecology and Systcmalics 19:473-51 I .
Statistical Sciences. 1993. S-PLUS guide to statisticaland mathematical analysis, version 3.2. Mathsoft,Inc., Seattle, Washington.
Swanherg, T. 1996. The movement and habitat use offluvial bull trout in the Upper Clark Fork Riverdrainage. Master's thesis. University of Montana.Missoula.
Taylor. P. C.. and B. W. Silverman. 1993. Block diagramsand spli t t ing criteria for classification trees. Statis-tics and Computing 3:147-161.
Thomas, G. 1992. Status report: bull trout in Montana.Montana Department of Fish, Wildlife, and Parks,Helena.
Thurow, R. F. D. C. Lee, and B. E. Rieman. 1997. Dis-tribution and status of seven native salmonids in the
interior Columbia River basin and portions of theKlamath River and Great basins. North AmericanJournal of Fisheries Management 17:1094-1110.
Weaver, T. M. 1992. Coal Creek fisheries monitoringstudy No. X and forest-wide fisheries monitoring—1991. Montana Department of Fish, Wildlife, andParks, Special Projects Report, Kalispell.
Williams, R. N., R. P. Evans, and D. K. Shiozawa. 1997.Mitochondria! DNA diversity patterns of bull troutin the upper Columbia River basin. Pages 283-298in W. C. MacKay, M. K. Brewin, and M. Monia,editors. Friends of the bull trout conference pro-ceedings. Bull Trout Task Force (Alberta). (Avail-able from Trout Unlimited Canada, Calgary, Al-berta.)
Zillcr, J. S. 1992. Distribution and relative abundanceof bull trout in the Spraguc River subbasin, Oregon.Pages 18-29 in Howell and Buchanan (1992).