distribution system security primer for water utilities
TRANSCRIPT
Subject Area:Infrastructure Reliability
Distribution System SecurityPrimer for Water Utilities


Distribution System SecurityPrimer for Water Utilities
©2005 AwwaRF. All rights reserved.
About the Awwa Research Foundation
The Awwa Research Foundation (AwwaRF) is a member-supported, international, nonprofitorganization that sponsors research to enable water utilities, public health agencies, and otherprofessionals to provide safe and affordable drinking water to consumers.
The Foundation's mission is to advance the science of water to improve the quality of life. Toachieve this mission, the Foundation sponsors studies on all aspects of drinking water, includingsupply and resources, treatment, monitoring and analysis, distribution, management, and healtheffects. Funding for research is provided primarily by subscription payments from approximately1,000 utilities, consulting firms, and manufacturers in North America and abroad. Additionalfunding comes from collaborative partnerships with other national and international organizations,allowing for resources to be leveraged, expertise to be shared, and broad-based knowledge tobe developed and disseminated. Government funding serves as a third source of researchdollars.
From its headquarters in Denver, Colorado, the Foundation's staff directs and supports theefforts of more than 800 volunteers who serve on the board of trustees and various committees.These volunteers represent many facets of the water industry, and contribute their expertise toselect and monitor research studies that benefit the entire drinking water community.
The results of research are disseminated through a number of channels, including reports, theWeb site, conferences, and periodicals.
For subscribers, the Foundation serves as a cooperative program in which water suppliers uniteto pool their resources. By applying Foundation research findings, these water suppliers cansave substantial costs and stay on the leading edge of drinking water science and technology.Since its inception, AwwaRF has supplied the water community with more than $300 million inapplied research.
More information about the Foundation and how to become a subscriber is available on the Webat www.awwarf.org.
©2005 AwwaRF. All rights reserved.
Distribution System SecurityPrimer for Water Utilities
Prepared by:Brian M. MurphyHDR, Inc.101 SW 5th Avenue; Suite 1800, Portland, OR 97204
Lori L. RadderEconomic and Engineering Services, Inc.10900 NE 4th Street; Suite 1110, Bellevue, WA 98004and
Gregory J. KirmeyerHDR, Inc.500 108th Avenue NE; Suite 1200, Bellevue, WA 98004
Jointly sponsored by:Awwa Research Foundation6666 West Quincy Avenue, Denver, CO 80235-3098and
U.S. Environmental Protection AgencyWashington D.C.
Published by:
©2005 AwwaRF. All rights reserved.

DISCLAIMER
This study was jointly funded by the Awwa Research Foundation (AwwaRF) and the U.S. EnvironmentalProtection Agency (USEPA) under Cooperative Agreement No. R829679-01. AwwaRF and USEPA assume no
responsibility for the content of the research study reported in this publication or for the opinions or statements offact expressed in the report. The mention of trade names for commercial products does not represent or imply the
approval or endorsement of AwwaRF or USEPA. This report is presented solely for informational purposes.
Copyright © 2005by Awwa Research Foundation
All Rights Reserved
Printed in the U.S.A.
©2005 AwwaRF. All rights reserved.
v
CONTENTS
LIST OF TABLES................................................................................................................... ix LIST OF FIGURES ................................................................................................................. xi FOREWORD ........................................................................................................................... xiii ACKNOWLEDGMENTS ....................................................................................................... xv EXECUTIVE SUMMARY ..................................................................................................... xvii CHAPTER 1: IDENTIFICATION OF DISTRIBUTION SYSTEM COMPONENTS
AND RECENT THREATS .......................................................................... 1 Introduction............................................................................................................... 1 Physical Elements ..................................................................................................... 2 Piping (Transmission mains, distribution mains, and service lines)................ 2 Finished Water Storage Facilities .................................................................... 4 Hydropneumatic Pressure Tank....................................................................... 7 Surge Tank....................................................................................................... 8 Finished Water Storage Reservoir Cleaning Appurtenances........................... 9 Access Hatches/Inspection Manholes.............................................................. 9 Reservoir Air Vents ......................................................................................... 10 Vaults ............................................................................................................... 11 Sample Taps..................................................................................................... 11 Repair/Installation Sites ................................................................................... 11 Interdependencies ............................................................................................ 11 Mechanical Elements ................................................................................................ 11 Reservoir Inlets/Outlets ................................................................................... 11 Pump Booster Stations..................................................................................... 12 Pump Station Primary and Back-up Power (transformers, switchgear, connections) . 12 System Valves.................................................................................................. 12 Blow-offs ......................................................................................................... 15 Hydrants........................................................................................................... 16 Backflow Prevention Devices.......................................................................... 16 Interties ............................................................................................................ 18 Meters .............................................................................................................. 18 Fire Suppression Sprinklers ............................................................................. 19 Treatment Elements .................................................................................................. 19 Chemical Injection and Storage Systems......................................................... 19 Chemical Delivery ........................................................................................... 21 Control Elements ...................................................................................................... 22 Reported and Potential Intentional and Accidental Distribution System Intrusions......................................................................................................... 22
©2005 AwwaRF. All rights reserved.
vi
Summary ................................................................................................................... 26 CHAPTER 2: IDENTIFICATION AND DEFINITION OF POTENTIAL
VULNERABILITIES ................................................................................... 27 Introduction and Definition of Vulnerability Categories.......................................... 27 Cyber Intrusion Vulnerability .......................................................................... 27 Insider Intrusion Vulnerability......................................................................... 29 Outsider Intrusion Vulnerability ...................................................................... 29 Physical Access Vulnerability ......................................................................... 29 Vehicle Access Vulnerability .......................................................................... 29 Air Access Vulnerability.................................................................................. 29 Public Access Vulnerability............................................................................. 29 Limited Intrusion Response Vulnerability....................................................... 30 Limited Detection Capability Vulnerability .................................................... 30 Vulnerability-Consequence Matrix Method for Assessing Distribution System Component Risk............................................................................................... 30 Developing the Potential Vulnerability Scoring Matrix .................................. 31 Developing the Consequence Calculation Matrix ........................................... 31 Developing a Vulnerability-Consequence Matrix ........................................... 33 CHAPTER 3: APPLICATION OF HYDRAULIC MODELS TO ASSIST IN
VULNERABILITY DETERMINATION .................................................... 35 Introduction............................................................................................................... 35 Modeling Approach .................................................................................................. 35 Model Capabilities ........................................................................................... 35 Simulated Water System Description .............................................................. 36 Modeled Scenarios and Modeling Results................................................................ 39 Modeling Conclusions .............................................................................................. 46 Summary ................................................................................................................... 48 CHAPTER 4: SHORT-TERM, LONG-TERM AND FUTURE DISTRIBUTION SYSTEM
FACILITY SECURITY PRIORITIES ......................................................... 49 Introduction............................................................................................................... 49 Methods to Improve Distribution System Security in the Short-term ...................... 49 Methods to Improve Distribution System Security in the Long-term ...................... 57 Security Recommendations for New Distribution System Components.................. 67 Access Control ................................................................................................. 69 Strategic Operational Planning ........................................................................ 80 Progressive Security Solutions ........................................................................ 82 Summary ................................................................................................................... 85 CHAPTER 5: SUMMARY AND CONCLUSIONS.............................................................. 89
©2005 AwwaRF. All rights reserved.

vii
REFERENCES……… ............................................................................................................ 95 LIST OF ABBREVATIONS AND ACRONYMS.................................................................. 97 APPENDIX: MATRICES OF VULNERABILITY (ON CD-ROM PACKAGED ONLY WITH
THE PRINTED REPORT.) .......................................................................... 97
©2005 AwwaRF. All rights reserved.

©2005 AwwaRF. All rights reserved.

ix
TABLES ES.1 Vulnerable points in water distribution systems expert workshop participants ....... xxv 1.1 Potentially vulnerable distribution system components ........................................... 2 1.2 Types of utilities reporting unauthorized intrusions ................................................. 23 1.3 Attacker types associated with water system intrusions ........................................... 24 1.4 Mode of attack classifications of intruders ............................................................... 24 1.5 Water system intruder target assets........................................................................... 25 3.1 Simulated distribution system reservoir characteristics............................................ 36 3.2 Simulated distribution system well characteristics ................................................... 36 4.1 Prioritized short-term security enhancements for existing distribution system components ...................................................................................................... 56 4.2 Considerations for physical security enhancements ................................................. 59 4.3 Prioritized long-term security enhancements for existing distribution system
components ...................................................................................................... 66 4.4 Future facility security considerations ...................................................................... 68 4.5 Prioritized security enhancements for future distribution system components ........ 86 5.1 Summary of priority short-term, long-term, and future facility security enhancement activities ..................................................................................... 91 5.2 Summary of potential security options for distribution system element vulnerabilities................................................................................................... 93
©2005 AwwaRF. All rights reserved.

x
©2005 AwwaRF. All rights reserved.
xi
FIGURES ES.1 Trident Approach to short-term, long-term, and future water distribution system
security enhancement.................................................................................... xxii 1.1 Examples of elevated storage.................................................................................... 5 1.2 Example of at-grade storage ..................................................................................... 6 1.3 Example of multiple-use finished water storage reservoir ....................................... 8 1.4 Example of hydropneumatic tank ............................................................................. 8 1.5 Examples of unsecured appurtenances on finished water storage reservoirs ........... 9 1.6 Examples of unsecured reservoir vents..................................................................... 10 1.7 Example of unsecured remote pump station primary power supply......................... 13 1.8 Types of water utility valves..................................................................................... 14 2.1 Example of a vulnerable remote component due to difficulty in timely response to an intrusion....................................................................................................... 30 2.2 Potential vulnerabilities scoring matrix .................................................................... 32 2.3 Consequence calculation matrix ............................................................................... 33 2.4 Vulnerability-consequence matrix ............................................................................ 34 3.1 Simulated water system diurnal curve ...................................................................... 37 3.2 Modeled simulated distribution system map ............................................................ 38 3.3 Reservoir No. 5 water levels over 48 hour simulation.............................................. 40 3.4 Percent contamination at point one mile west of Reservoir No. 5............................ 40 3.5 Percent contamination at point one mile south of Reservoir No. 5 .......................... 41 3.6 Percent contamination at point three miles south of Reservoir No. 5 ...................... 41 3.7 Volume of water in Reservoir No. 3 over time......................................................... 43 3.8 Percentage of Reservoir No. 3 water at node approximately 1 mile northeast of
Reservoir No. 3 ............................................................................................. 43 3.9 Percentage of Reservoir No. 3 water at node approximately 1 mile northwest of
Reservoir No. 3 ............................................................................................. 44 3.10 Percentage of injected water at the end of the dead-end line (injection point)......... 45 3.11 Percentage of injected water ½ mile south of injection point................................... 45 3.12 Model results used to determine a contamination source ......................................... 47 4.1 Trident Approach to short-term, long-term, and future water distribution system
security enhancement.................................................................................... 50 4.2 Examples of enclosures to secure distribution system elements .............................. 60 4.3 Examples of methods to project overflow outlets in existing finished water storage
reservoirs....................................................................................................... 61 4.4 Examples for securing circular and elliptical manways with covers........................ 62 4.5 Access ladder anti-climb plate .................................................................................. 63 4.6 Dome reservoir hatch security strap ......................................................................... 63 4.7 Security vent and secure vent enclosure design........................................................ 64 4.8 Gooseneck vent and screen for finished water storage reservoirs ............................ 65 4.9 Examples of biometric access control technologies ................................................. 70 4.10a Cyber Locks smartkey system .................................................................................. 71 4.10b Example of keyless entry card and reader ................................................................ 71 4.11 Examples of flawed or damaged perimeter fencing ................................................. 73 4.12 Adequate chain-link fence design with razor wire and 12” buried fabric ................ 74
©2005 AwwaRF. All rights reserved.
xii
4.13 Retrofit enhancement of existing fence by burying fabric and weaving to existing fabric ................................................................................................................ 74 4.14 Examples of Secure-Mesh perimeter fence installation and retrofit......................... 75 4.15a-d Alternative perimeter fence designs and fabrics....................................................... 75 4.16 Example of typical distribution system facility access vehicle access gate.............. 77 4.17 Examples of hardened security gates........................................................................ 78 4.18 Examples of secured reservoir vents......................................................................... 79 4.19 External hydrant security device............................................................................... 79 4.20 Example of hydrant internal magnetic locking system............................................. 80 4.21 Exercising an underground fire hydrant ................................................................... 83
©2005 AwwaRF. All rights reserved.
xiii
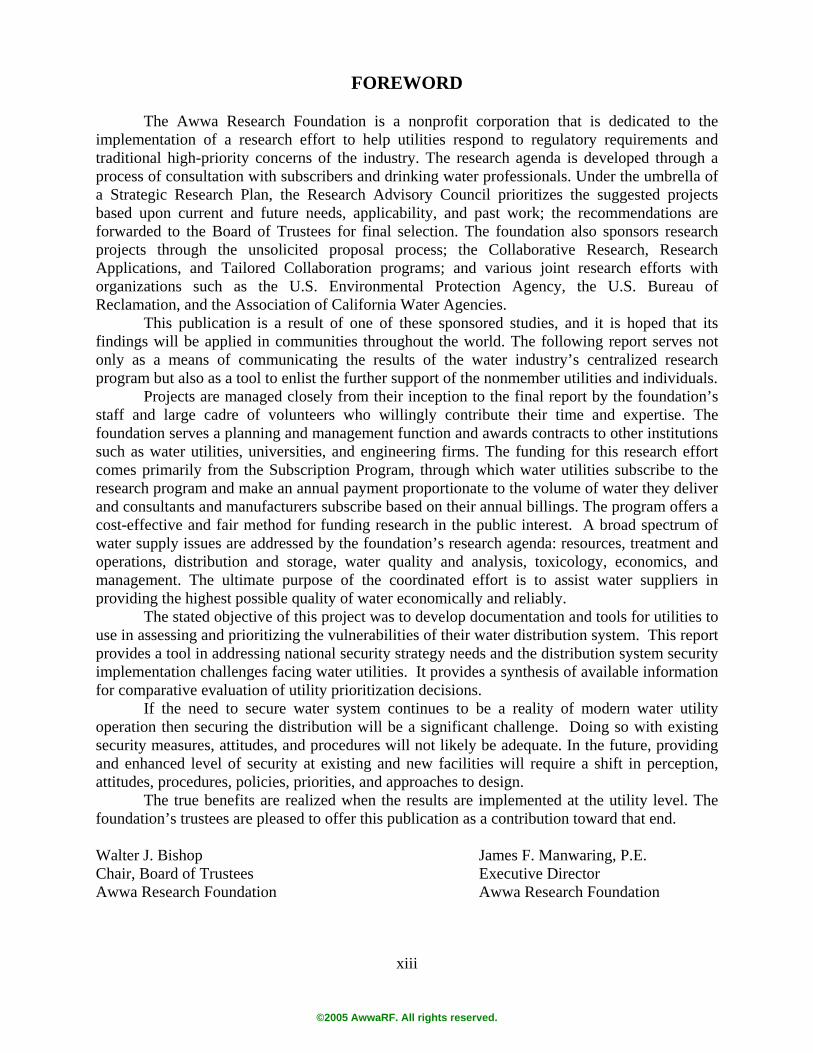
FOREWORD
The Awwa Research Foundation is a nonprofit corporation that is dedicated to the implementation of a research effort to help utilities respond to regulatory requirements and traditional high-priority concerns of the industry. The research agenda is developed through a process of consultation with subscribers and drinking water professionals. Under the umbrella of a Strategic Research Plan, the Research Advisory Council prioritizes the suggested projects based upon current and future needs, applicability, and past work; the recommendations are forwarded to the Board of Trustees for final selection. The foundation also sponsors research projects through the unsolicited proposal process; the Collaborative Research, Research Applications, and Tailored Collaboration programs; and various joint research efforts with organizations such as the U.S. Environmental Protection Agency, the U.S. Bureau of Reclamation, and the Association of California Water Agencies.
This publication is a result of one of these sponsored studies, and it is hoped that its findings will be applied in communities throughout the world. The following report serves not only as a means of communicating the results of the water industry’s centralized research program but also as a tool to enlist the further support of the nonmember utilities and individuals.
Projects are managed closely from their inception to the final report by the foundation’s staff and large cadre of volunteers who willingly contribute their time and expertise. The foundation serves a planning and management function and awards contracts to other institutions such as water utilities, universities, and engineering firms. The funding for this research effort comes primarily from the Subscription Program, through which water utilities subscribe to the research program and make an annual payment proportionate to the volume of water they deliver and consultants and manufacturers subscribe based on their annual billings. The program offers a cost-effective and fair method for funding research in the public interest. A broad spectrum of water supply issues are addressed by the foundation’s research agenda: resources, treatment and operations, distribution and storage, water quality and analysis, toxicology, economics, and management. The ultimate purpose of the coordinated effort is to assist water suppliers in providing the highest possible quality of water economically and reliably.
The stated objective of this project was to develop documentation and tools for utilities to use in assessing and prioritizing the vulnerabilities of their water distribution system. This report provides a tool in addressing national security strategy needs and the distribution system security implementation challenges facing water utilities. It provides a synthesis of available information for comparative evaluation of utility prioritization decisions.
If the need to secure water system continues to be a reality of modern water utility operation then securing the distribution will be a significant challenge. Doing so with existing security measures, attitudes, and procedures will not likely be adequate. In the future, providing and enhanced level of security at existing and new facilities will require a shift in perception, attitudes, procedures, policies, priorities, and approaches to design.
The true benefits are realized when the results are implemented at the utility level. The foundation’s trustees are pleased to offer this publication as a contribution toward that end. Walter J. Bishop James F. Manwaring, P.E. Chair, Board of Trustees Executive Director Awwa Research Foundation Awwa Research Foundation
©2005 AwwaRF. All rights reserved.

xiv
©2005 AwwaRF. All rights reserved.
xv
ACKNOWLEDGMENTS
The authors would like to acknowledge the gracious support of the Awwa Research Foundation (AwwaRF) and the United States Environmental Protection Agency (USEPA) without whose support, this project would not have been possible.
The authors wish to extend their thanks and appreciation to Stephanie Passarelli, AwwaRF Project Manager, and the following AwwaRF Project Advisory Committee members for their expertise and constructive guidance and contributions throughout the project:
Robin Halperin, Risk Manager, City of Cleveland Division of Water Jim Zewlewski, Water Distribution Supervisor, City of Milwaukee Yakir Hasit, PhD, PE, Principal Project Manager, CH2M HILL John Cicmanec, DVM, MS, Veterinary Medical Officer, United States Environmental Protection Agency
Several utilities, agencies, and consultants from across the country provided significant time, staff, and expertise, as participants in the project’s Expert Workshop. The authors gratefully acknowledge their efforts:
Tim Tayne, Senior Water Quality Program Specialist, City of Olympia Water Department Mike Jackman, Drinking Water Program Manager, Bellevue Utilities Department Gavin Patterson, Engineer Assistant, Seattle Public Utilities Yeongho Lee, Engineer, Greater Cincinnati Water Works Steve Wieneke, Utility Manager, Firgrove Mutual Water Company Mike Nadeau, Utility Manager, South Berwick Water Department Mark Arenberg, Utility Trustee, South Berwick Water Department Thomas Rothermich, Water Distribution Executive, City of St. Louis Water Division Bruce Aptowicz, Water Engineering Assistant Manager, Philadelphia Water Department Jeff Danneels, Security Systems and Technology Center Manager, Sandia National Laboratories Jeff Slotnick, Regional Director, National Wilderness Training Center Scott Decker, Security Coordinator, Washington State Department of Health Christine Seifert, Special Agent, Federal Bureau of Investigation Kathy Martel P.E., Senior Engineer, Economic and Engineering Services Frank Blaha, Project Manager, AwwaRF Gregory Welter, Technical Director, O’Brien & Gere Engineers Westin Engineering
Finally, the authors wish to thank Druann O’Connor and Betsy Leatham, Economic and
Engineering Services Administrative Assistants, for their efforts in bringing this work together into its final form.
©2005 AwwaRF. All rights reserved.

xvi
©2005 AwwaRF. All rights reserved.
xvii
EXECUTIVE SUMMARY
INTRODUCTION
The United States has entered an indefinite period of heightened national security. This new “security culture”, visible or transparent, reaches every aspect of life, and as such, security has become an element of water utility management, operation and planning. The unique challenge of protecting water quality and water utility assets results from the two characteristic necessities of modern utility operation: decentralization of utility facilities and increasingly centralized, remote control. This inherent structure of utility operations results in a multitude of physical access points, as well as, a single target for cyber intrusions. Nowhere in the water utility operations is this security challenge more apparent than in the distribution system. Consider that even if all of a utility’s distribution system components were buried at secured, single use sites, the connection at which each and every customer is served is a potential point of entry to the distribution system. In reality, not only is every customer hose bib a vulnerable point, but so are multiple use, public access facilities; chemical treatment/storage facilities; finished water storage reservoirs; major valves; transmission mains, etc.
Every element of the distribution system has some level of vulnerability associated with it, and concurrently, a consequence associated with its loss. These vulnerabilities and consequences can run from “very low”, such as a redundant pump in a highly secured facility to “critical to achieving the utility mission”, such as a single, centralized storage facility in an unsecured multiple use location.
No distribution system can be made 100% secure, but there are actions that can be taken to enhance security and reduce risk. The challenge for the water industry and utilities is to develop methods for addressing security needs in a manner that provides the appropriate level of security based on risk, available capital and operation and maintenance considerations.
Utilities across the country have completed vulnerability assessments of their water systems and are beginning to wrestle with balancing vulnerability, consequence, liability, and the apportioning of capital and operation and maintenance resources. The completed Vulnerability Assessments (VAs), due to methodology, time, and resources did not typically address the vulnerability of the distribution system components such as pipes, valves, hydrants, customer connections, etc. In most cases, critical assets considered in VAs included facilities beginning with raw water intakes and wells, through treatment, pumping, storage, and possibly booster stations in the distribution system. Because of the resources expended in addressing these high priority facilities, little attention has been given to the vulnerabilities associated with components beginning with finished water storage through customer taps. These potential distribution system vulnerabilities, while potentially affecting a smaller number of customers, are much more decentralized, and in some cases completely outside of utility control.
If the need to secure water systems continues to be a reality of modern water utility operation then securing the distribution will be a significant challenge. Doing so with existing security measures, attitudes, and procedures will not likely be adequate. In the future, providing an enhanced level of security at existing and new facilities will require a shift in perception, attitudes, procedures, policies, priorities, and approaches to design.
©2005 AwwaRF. All rights reserved.

xviii
PROJECT APPROACH
This project was designed to synthesize the existing industry knowledge by focusing the input provided by a wide range of utility and security experts in order to provide guidance to utilities in analyzing and identifying vulnerabilities within the distribution system.
The project’s research team conducted a review of pertinent industry literature to develop a comprehensive inventory of water distribution system physical, mechanical, treatment, and control elements. In addition to a cataloging of the distribution system elements, the project team reviewed the available literature pertaining to known malicious intrusions into water systems. This information was used to provide historical reference for potential vulnerabilities of distribution system elements. Using the findings of the literature review, a list of vulnerabilities was developed and defined.
Evaluative matrices were developed to enable a utility to identify a vulnerability score defined in terms of the type of potential access to a facility and the consequence of intrusion occurring at that component.
The project team used an idealized distribution system to demonstrate the use of hydraulic modeling capabilities as a vulnerability and consequence assessment tool. The project team developed scenarios to represent malevolent acts perpetrated by “Insiders” and “Outsiders.” System modeling was then conducted under the resulting parameters and the impact of the event was characterized in terms of loss of water quality, and potential contaminant dispersal.
The project team conducted an expert workshop with the objective of bringing together utility and security experts to exchange information and develop recommendations for addressing security enhancements for the short-term and in the long-term, for existing components, and design considerations of future components. The workshop generated recommendations including, but not limited to:
• Physical security • SCADA security and operational back-up • Policy modifications • Facility and site design • De-centralized redundancy • Operational flexibility • Regional, inter-utility, and inter-agency cooperation
PROJECT OUTCOMES AND APPLICABILITY What is the objective of this project?
The stated objective of this project was “To develop methods for utilities to use in assessing and prioritizing the vulnerabilities of their water distribution system to intentional and accidental intrusions and provide a means of addressing security needs.”
As water utilities have undoubtedly discovered in assessing the security of their systems, viewing a water system from a security perspective requires the interaction, cooperation, and understanding of professionals across fields of expertise not historically convened in the water industry. The heart of this project was a two-day Expert Workshop carefully formulated to bring together subject matter experts from fields of utility operation, distribution system optimization,
©2005 AwwaRF. All rights reserved.
xix
critical related research, federal and State regulation, SCADA design, security, threat assessment, national security, law enforcement, and national infrastructure protection. These experts provided insight into:
• Identifying points of potential intrusion, • Integrating the evaluation of consequences of contamination or component
destruction into determination of vulnerability, • Recommending enhancements to improve security of existing components, and • Recommending design security considerations for future components. In order to meet the project objectives, this report provides utilities with tools and
recommendations that: • Provide a systematic approach to prioritizing distribution system elements based on a
vulnerability-consequence assessment • Illustrate the application and usefulness of distribution system vulnerability modeling
using a commercially available distribution system hydraulic model • Provide guidance for addressing short-term security improvements at existing
components • Provide guidance for addressing long-term security improvements at existing
components • Provide security considerations for future components including site design, location,
accessibility, ingress and egress, etc. What can a utility do about assessing distribution system vulnerabilities and risks?
Water distribution systems are unique. While there are parts of the distribution system that can be consistently identified as potentially vulnerable, such as finished water storage facilities or hydrants, attempting to prioritize all distribution system elements in a manner to be applicable for all, or even most utilities, is not practical. This report has developed a matrix approach as a tool to enable utilities to evaluate the specific vulnerabilities of their system, establish importance of components based on achieving utility criteria, and determine vulnerability based on both factors. This approach includes The Potential Vulnerability Scoring Matrix, Consequence Calculation Matrix, and Vulnerability-Consequence Matrix. The simplicity of the matrix tool enables a utility to easily evaluate multiple variable scenarios and compare changing priorities. The Appendix containing electronic versions of these matrices is on CD at the back of the report. How can a utility use an existing hydraulic model as a tool to proactively address and respond to contamination, disruption, and emergency events?
The results of applying existing hydraulic modeling software, and feedback from the project’s workshop participants demonstrated that a utility may, in at least limited fashion, benefit from a properly calibrated, accurate, and up-to-date hydraulic model in preparing for, and responding to, an intrusion into the distribution system. Using a hydraulic model in this way does not attempt to ascertain the concentration of a contaminant but enhances understanding of
©2005 AwwaRF. All rights reserved.
xx
an area of potential impact. The exercise demonstrated in this report showed, for example, that if the point of contamination is known (a storage reservoir) and the operating conditions are known (fill/draw cycles, demands, valving conditions, etc) a profile can be established as to where that water, and potentially the contaminant, may be at a given time. Conducting scenarios as a planning exercise can provide additional information as to facility vulnerability and when those components may be most vulnerable. This type of information can also be used following an intrusion event to isolate the system. What are the cyber intrusion risks to the distribution system?
The objective of SCADA systems in modern distribution systems is to centralize control operations. However, this centralization and integration with communication pathways provides a central point of access if not properly secured. SCADA systems monitor the mechanical, physical, and water quality parameters such as water levels, pump status points, chemical feed operation, energy consumption, pressures, flows, chlorine residual levels, pH levels, temperature, conductance, and turbidity. Additionally, security information, such as the triggering of an alarm, can be recorded through a SCADA system. Hacking into a utility’s SCADA network can enable an adversary to malevolently operate, or prevent utility staff from operating any or all components of the system remotely. Securing the SCADA network includes physical protection and network access protection. This report identified the following modes of attack that can be used to gain access and control of inadequately secured SCADA networks:
• War-Dialing • Wireless Attack • Buffer-Overflow • Malformed Packet • Denial of Service • Trojan Injection • Man-in-the-Middle
What is the best approach to securing a SCADA system from intrusion?
Securing a utility’s SCADA system can range from conducting basic network maintenance and updating of system patches and operational and policy changes to complete overhaul of an obsolete system to one that is technically supported. This report identifies security activities for both the short- and long-term as well as future planning. The following are key short-term activities for securing a SCADA system:
• Identify outside interdependency and potential connections • Perform testing of system security • Identify and install appropriate access controls on intranet and internet • Establish (if needed) and enforce SCADA/IT policies related to security • Install access control programs • Secure all remote communications including modems, attached computers such as
laptops and home computers • Encrypt wireless connections
©2005 AwwaRF. All rights reserved.
xxi
• Develop plan to physically protect SCADA/IT systems How can a utility begin to organize a comprehensive security approach to address short- and long-term security at existing facilities as well as future facilities?
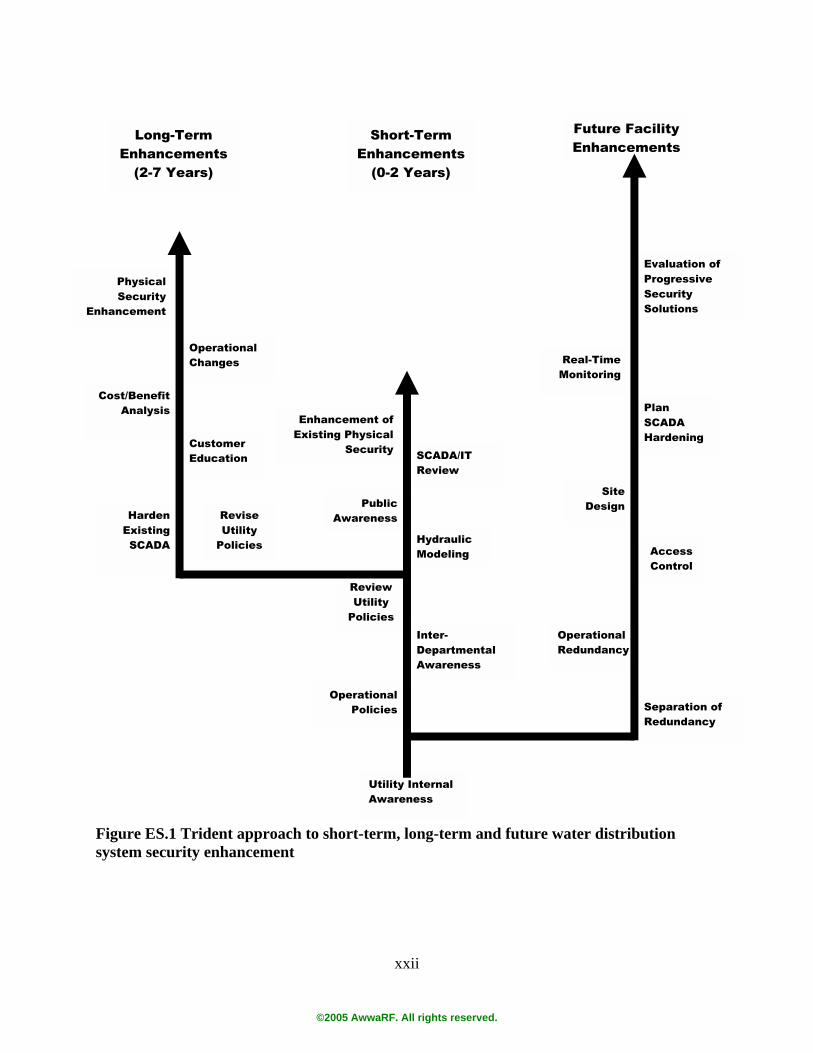
This report presents the Trident Approach of Short-term, Long-term, and Future Security Enhancements. These activities range from creating an awareness of security to implementation of physical security features into the planning and design of new facilities. Figure ES.1 shows the Trident Approach structure. What activities can a utility undertake in the short-term to reduce distribution system vulnerability and risk?
In the short-term, this report has identified eight categories of activities that a utility can implement over an initial two-year period to begin to enhance security, in some cases significantly. These short-term activities can be described as raising awareness and maximizing existing security technology tools and policies. These activities are designed to bring security to the forefront, immediately increase at least security awareness, and provide an accurate security baseline from which to plan long-term activities. The activities of the short-term phase of the Trident Approach can be categorized as:
• Develop internal awareness • Implement physical security improvements • Review of SCADA/ IT security • Develop contractor security policies • System hydraulic modeling • Implement operational security practices • Develop public awareness • Raise municipal inter-departmental
awareness What activities can a utility undertake in the long-term to reduce vulnerability and risk?
The long-term enhancement phase of the Trident Approach is designed for implementation between years 2-7 of a distribution system security plan. The activities presented in this report include implementation of changes identified in the first two years, strategic planning, cost-benefit analysis, development and implementation of missing security components and the hardening of components. The activities have been categorized as:
• Develop utility and customer
understanding of costs • Implement internal hiring background
check policy • Hardening of SCADA/IT security • Implement physical security measures • Implement operational changes for
normal and emergency operating conditions
©2005 AwwaRF. All rights reserved.
xxii
Figure ES.1 Trident approach to short-term, long-term and future water distribution system security enhancement
Short-Term Enhancements
(0-2 Years)
Enhancement of Existing Physical
Security
Utility Internal Awareness
Future Facility Enhancements
Long-Term Enhancements
(2-7 Years)
SCADA/IT Review
Cost/Benefit Analysis
Operational Changes
Site Design
Harden Existing SCADA
Customer Education
Operational Policies
Inter-Departmental Awareness
Hydraulic Modeling
Plan SCADA Hardening
Separation of Redundancy
Physical Security
Enhancement
Access Control
Operational Redundancy
Real-Time Monitoring
Evaluation of Progressive Security Solutions
Public Awareness
Review Utility
Policies
Revise Utility
Policies
©2005 AwwaRF. All rights reserved.
xxiii
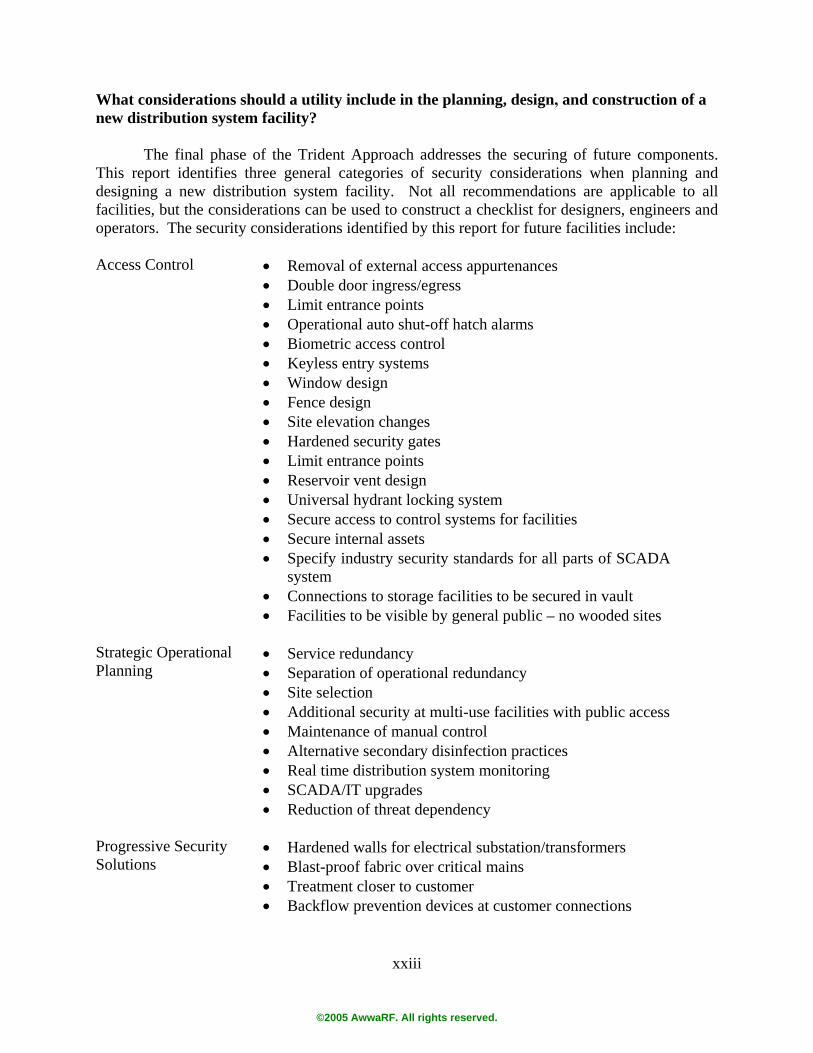
What considerations should a utility include in the planning, design, and construction of a new distribution system facility? The final phase of the Trident Approach addresses the securing of future components. This report identifies three general categories of security considerations when planning and designing a new distribution system facility. Not all recommendations are applicable to all facilities, but the considerations can be used to construct a checklist for designers, engineers and operators. The security considerations identified by this report for future facilities include: Access Control • Removal of external access appurtenances
• Double door ingress/egress • Limit entrance points • Operational auto shut-off hatch alarms • Biometric access control • Keyless entry systems • Window design • Fence design • Site elevation changes • Hardened security gates • Limit entrance points • Reservoir vent design • Universal hydrant locking system • Secure access to control systems for facilities • Secure internal assets • Specify industry security standards for all parts of SCADA
system • Connections to storage facilities to be secured in vault • Facilities to be visible by general public – no wooded sites
Strategic Operational Planning
• Service redundancy • Separation of operational redundancy • Site selection • Additional security at multi-use facilities with public access • Maintenance of manual control • Alternative secondary disinfection practices • Real time distribution system monitoring • SCADA/IT upgrades • Reduction of threat dependency
Progressive Security Solutions
• Hardened walls for electrical substation/transformers • Blast-proof fabric over critical mains • Treatment closer to customer • Backflow prevention devices at customer connections
©2005 AwwaRF. All rights reserved.
xxiv
• Uni-directional meters (UDM) • Utilities bottling water • Removal of free standing fire hydrants • Remotely operated in-line valves • Remotely operated valve boxes at customer • Development and installation of “Smart pipe”
What are the priority elements of a Trident Approach to securing the distribution system?
Not all security issues can be addressed at once, nor do they need to be. In addition to identifying activities to enhance security, this report has identified priority activities for each phase of the Trident Approach that utilities should consider foremost in order to maximize security earmarked resources. Table ES.1 is a compilation of the priority activities associated with each phase of the trident.
©2005 AwwaRF. All rights reserved.

xxv
Table ES. 1 Summary of priority short-term, long-term, and future facility security enhancement activities
Type of Activity Priority Security Activity
Planning Communication Training/ Education
Physical Enhancement Operational
Short-term Activities Staff awareness and training ● Development of public awareness ● Develop an Emergency Response and Communications Plan ● ● Installation of tamper seals on fire hydrants ● ● Develop means of internal and external two-way exchange of threat information
● Establish, implement and enforce SCADA/IT policies ● ● ● Develop an Intrusion Incident Response Plan with local fire/police ● ● ● Formalize and conduct equipment inspection and exercising ● Reduce excess chemical storage in the distribution system ● Develop an accurate system hydraulic model for use under emergency response scenarios
● ● Long-term Activities
Conduct detailed cost-benefit risk analysis ● ● Formalize emergency communications ● Functionalize Emergency Response and Communications Plan ● ● ● Develop system operational baseline ● Implement physical security enhancements ●
Future Facility Activities Operational/Physical Redundancy ● ● ● ● Access Control ● Design/Site Selection ● ● ● ● Progressive Security Measures ● ● ● ● ●
©2005 AwwaRF. All rights reserved.

©2005 AwwaRF. All rights reserved.
1
CHAPTER 1 IDENTIFICATION OF DISTRIBUTION SYSTEM COMPONENTS
AND RECENT THREATS
INTRODUCTION
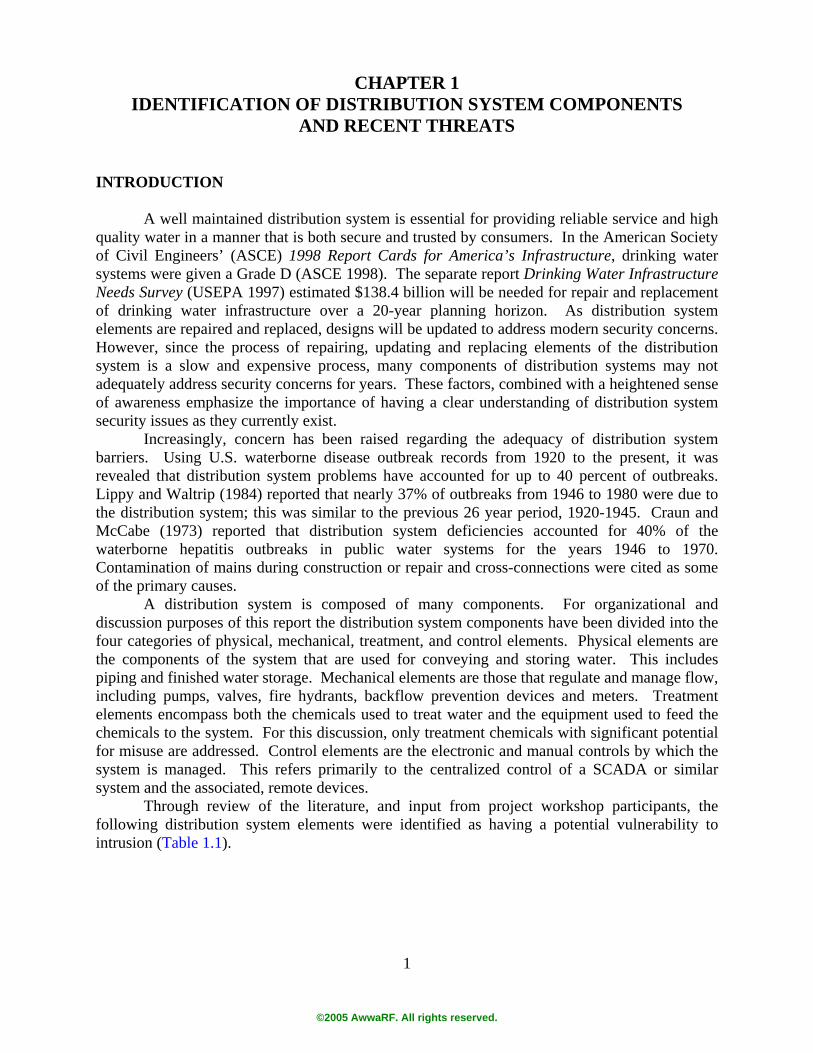
A well maintained distribution system is essential for providing reliable service and high quality water in a manner that is both secure and trusted by consumers. In the American Society of Civil Engineers’ (ASCE) 1998 Report Cards for America’s Infrastructure, drinking water systems were given a Grade D (ASCE 1998). The separate report Drinking Water Infrastructure Needs Survey (USEPA 1997) estimated $138.4 billion will be needed for repair and replacement of drinking water infrastructure over a 20-year planning horizon. As distribution system elements are repaired and replaced, designs will be updated to address modern security concerns. However, since the process of repairing, updating and replacing elements of the distribution system is a slow and expensive process, many components of distribution systems may not adequately address security concerns for years. These factors, combined with a heightened sense of awareness emphasize the importance of having a clear understanding of distribution system security issues as they currently exist.
Increasingly, concern has been raised regarding the adequacy of distribution system barriers. Using U.S. waterborne disease outbreak records from 1920 to the present, it was revealed that distribution system problems have accounted for up to 40 percent of outbreaks. Lippy and Waltrip (1984) reported that nearly 37% of outbreaks from 1946 to 1980 were due to the distribution system; this was similar to the previous 26 year period, 1920-1945. Craun and McCabe (1973) reported that distribution system deficiencies accounted for 40% of the waterborne hepatitis outbreaks in public water systems for the years 1946 to 1970. Contamination of mains during construction or repair and cross-connections were cited as some of the primary causes.
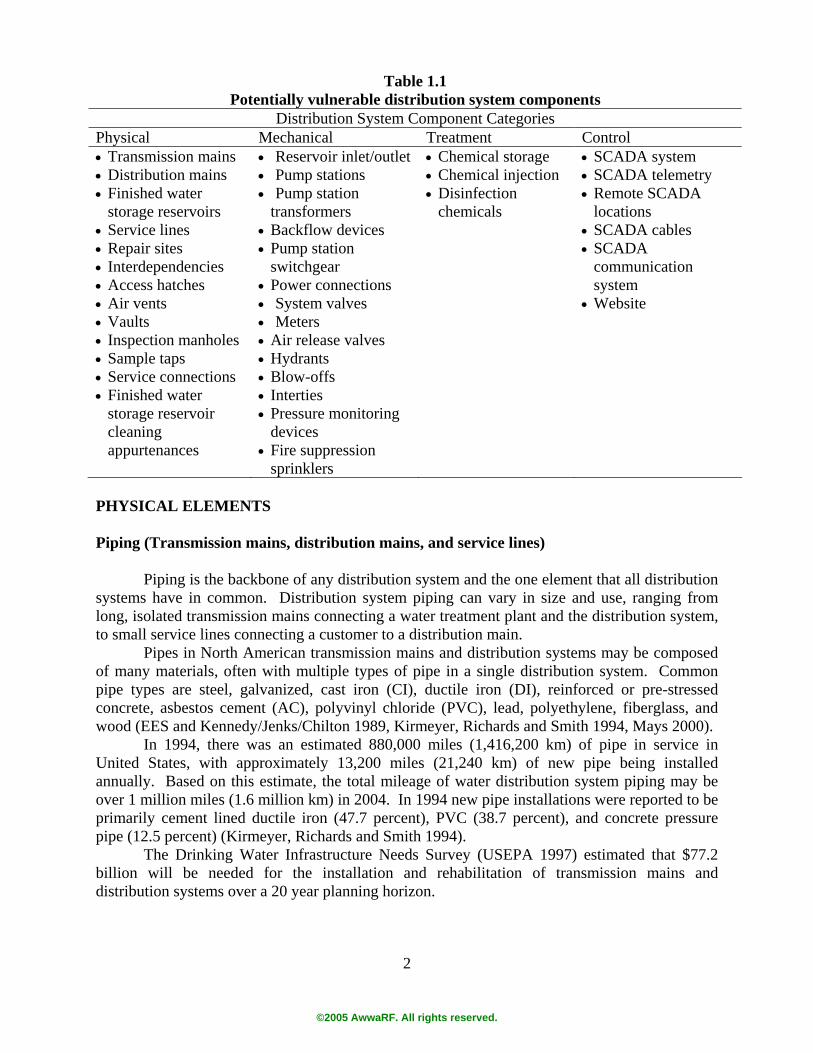
A distribution system is composed of many components. For organizational and discussion purposes of this report the distribution system components have been divided into the four categories of physical, mechanical, treatment, and control elements. Physical elements are the components of the system that are used for conveying and storing water. This includes piping and finished water storage. Mechanical elements are those that regulate and manage flow, including pumps, valves, fire hydrants, backflow prevention devices and meters. Treatment elements encompass both the chemicals used to treat water and the equipment used to feed the chemicals to the system. For this discussion, only treatment chemicals with significant potential for misuse are addressed. Control elements are the electronic and manual controls by which the system is managed. This refers primarily to the centralized control of a SCADA or similar system and the associated, remote devices.
Through review of the literature, and input from project workshop participants, the following distribution system elements were identified as having a potential vulnerability to intrusion (Table 1.1).
©2005 AwwaRF. All rights reserved.
2
Table 1.1 Potentially vulnerable distribution system components
Distribution System Component Categories Physical Mechanical Treatment Control • Transmission mains • Reservoir inlet/outlet • Chemical storage • SCADA system • Distribution mains • Finished water
storage reservoirs
• Pump stations • Pump station
transformers
• Chemical injection • Disinfection
chemicals
• SCADA telemetry • Remote SCADA
locations • Service lines • Repair sites • Interdependencies • Access hatches
• Backflow devices • Pump station
switchgear • Power connections
• SCADA cables • SCADA
communication system
• Air vents • System valves • Website • Vaults • Meters • Inspection manholes • Sample taps
• Air release valves • Hydrants
• Service connections • Blow-offs • Finished water
storage reservoir cleaning appurtenances
• Interties • Pressure monitoring
devices • Fire suppression
sprinklers
PHYSICAL ELEMENTS
Piping (Transmission mains, distribution mains, and service lines)
Piping is the backbone of any distribution system and the one element that all distribution
systems have in common. Distribution system piping can vary in size and use, ranging from long, isolated transmission mains connecting a water treatment plant and the distribution system, to small service lines connecting a customer to a distribution main.
Pipes in North American transmission mains and distribution systems may be composed of many materials, often with multiple types of pipe in a single distribution system. Common pipe types are steel, galvanized, cast iron (CI), ductile iron (DI), reinforced or pre-stressed concrete, asbestos cement (AC), polyvinyl chloride (PVC), lead, polyethylene, fiberglass, and wood (EES and Kennedy/Jenks/Chilton 1989, Kirmeyer, Richards and Smith 1994, Mays 2000).
In 1994, there was an estimated 880,000 miles (1,416,200 km) of pipe in service in United States, with approximately 13,200 miles (21,240 km) of new pipe being installed annually. Based on this estimate, the total mileage of water distribution system piping may be over 1 million miles (1.6 million km) in 2004. In 1994 new pipe installations were reported to be primarily cement lined ductile iron (47.7 percent), PVC (38.7 percent), and concrete pressure pipe (12.5 percent) (Kirmeyer, Richards and Smith 1994).
The Drinking Water Infrastructure Needs Survey (USEPA 1997) estimated that $77.2 billion will be needed for the installation and rehabilitation of transmission mains and distribution systems over a 20 year planning horizon.
©2005 AwwaRF. All rights reserved.
3
Transmission Mains Transmission mains are generally characterized as being long, large diameter pipelines
operated at high hydraulic heads and absent of service connections. Transmission mains are commonly between 24-inches (60 cm) and several feet (meters) in diameter. Primary uses are conveying water from the source to the water treatment plant and from the water treatment plant to the distribution system or wholesale customers (Kirmeyer et al 2000, Mays 2000). Large transmission mains are commonly constructed of reinforced or pre-stressed concrete or steel (AWWA 1996). Transmission mains are located in significantly more isolated regions than other types of pipes, as they primarily located outside the service area.
Depending on the topography and the distance covered by the transmission main, stretches of the main may alternate from buried, exposed, suspended or elevated. Stretches of exposed transmission main pose a particular vulnerability to physical, vehicle, and outsider access. Access to water in transmission mains can also occur through air- and pressure-relief valves when exposed. Distribution Mains
Distribution mains convey water from the transmission main to service lines (Kirmeyer et
al 2000), and typically range from 4 to 24 inches (10-60 cm) in diameter (Kirmeyer Richards and Smith 1994). Because distribution mains are located within the service area, they are typically buried, and not exposed. Occasionally, larger diameter sections of distribution mains may be elevated or suspended on bridges in order to cross physical barriers. Distribution mains are rarely exposed at ground level. Distribution mains are generally less vulnerable to physical disruption than transmission mains because of their limited exposure. Distribution mains generally have numerous connections and many access points into the transmission main. Access to the distribution mains can occur at fire hydrants, air-relief valves, storage or surge tanks, pump stations, or pressure-relief valves. Access through fire hydrants provides a potential means of contamination to particular service areas. Critical, larger diameter portions of the distribution system piping can be critical to service, or result in loss of service to a sub-service area but complete disruption of service would be difficult by disruption of a single section of distribution main.
Service Lines
The function of service lines is to convey water from distribution mains to customer
meters (Kirmeyer et al 2000). Service lines end at the customer and therefore flow to the termination points of the system. Typical service line diameters range from ¾” to 1½” (9 to 38 mm).
Because of the termination of service lines at the customer, service lines, although buried, provide the first point of access under customer control. This access can occur at the meter or customer taps. This customer access results in a common point of cross-connection that can contaminate a localized area of the distribution system. Depending on the nature of the customer (residential, commercial, etc.) the types of potential cross-connections differ. Residential customers may have cross-connections such as chemical dispensers on garden hoses, water softeners (drain connected to sewer), sprinkler systems, submerged garden hoses (such as filling
©2005 AwwaRF. All rights reserved.

4
a pool or hot tub) or taps (particularly those extended with hoses), etc. Commercial customers may have cross-connections such as cooking vessels, chemical reaction tanks, photographic developers, laboratory washing equipment, etc (AWWA 1996). In addition to accidental contamination, service lines provide a means of intentional contamination. Intentional contamination can occur using commonly available equipment to overcome service pressures and pump a contaminant into the distribution system.
Finished Water Storage Facilities
Finished water storage facilities serve multiple purposes within a distribution system.
The main purposes of finished water storage as summarized in Water Transmission and Distribution (AWWA 1996):
• Equalizing supply and demand • Increasing operating convenience • Leveling out pump requirements • Decreasing power costs • Providing water during power source or pump failure • Providing large quantities of water to meet fire demands • Providing surge relief • Increasing detention times • Blending water sources There are many styles and construction materials for storage facilities. Selection of type
and construction material are generally based on hydraulic considerations and cost (Kirmeyer et al 2000). Storage facilities, depending on design can provide direct access to treated water as in open reservoirs or through hatches and vents as in closed reservoirs. Buried reservoirs are also susceptible to ground water intrusion, however, this is not a viable means of intentional contamination. Depending on the size and design of the distribution system, finished water storage reservoirs can present a single point of failure or contamination or, to a lesser extent, disruption or contamination to particular portions of the service area. Historically, storage facility location has been driven by hydraulic needs, not security needs. Security needs have been of minor concern. As a result, facilities are located in isolated areas, or when located in more residential areas landscaping has been designed and maintained to obstruct views of facilities and grounds.
According to the Drinking Water Infrastructure Needs Survey (USEPA 1997), over a 20 year planning horizon, $12.1 billion will be needed for the maintenance and upgrades for new and existing finished water storage facilities. This accounts for approximately 9% of total infrastructure needs.
Elevated Storage
Elevated storage tanks are primarily steel tanks which are supported on one or more
pedestals (Mays 2000). Elevated storage provides a supply for peak demands, including emergencies, and is beneficial in equalizing system pressures. For non-gravity feed systems, elevated storage can be used to reduce pumping requirements and can temporarily provide
©2005 AwwaRF. All rights reserved.
5
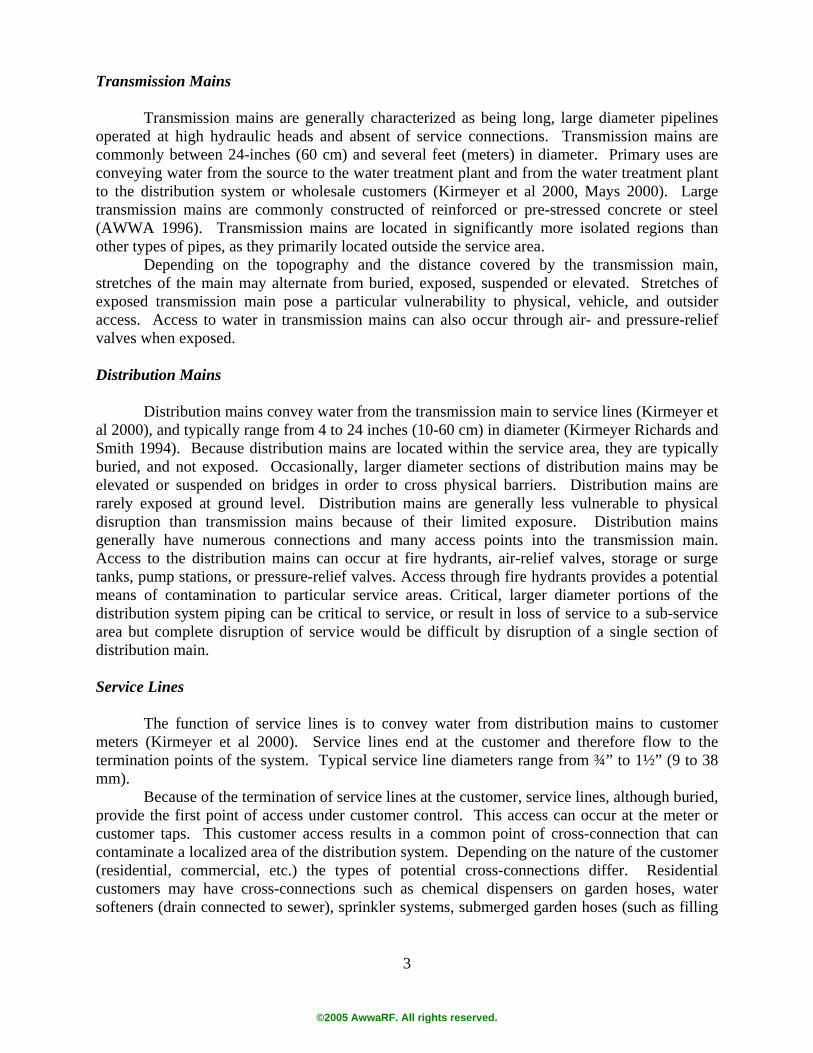
additional pressure if pumps are out of service, such as during repairs or a power outage (Kirmeyer et al 1999). Of all storage facilities, elevated tanks typically provide the greatest level of protection against direct access to stored water. While designs vary, access to hatches, vents, and the water is relatively difficult.
Elevated tanks comprised approximately 24% of the 10,000 facilities surveyed for the 1992 Water Industry Database, making them the second most common type of storage facility. Of the elevated tanks in the survey, approximately 97% were steel and 3% were concrete (AWWA and AwwaRF 1992). Figure 1.1 is an example of an elevated storage facility.
Courtesy of TNEMEC Company, Inc. Figure 1.1 Examples of elevated storage At-Grade Storage
At-grade storage facilities are tanks, which are constructed with their base at finished
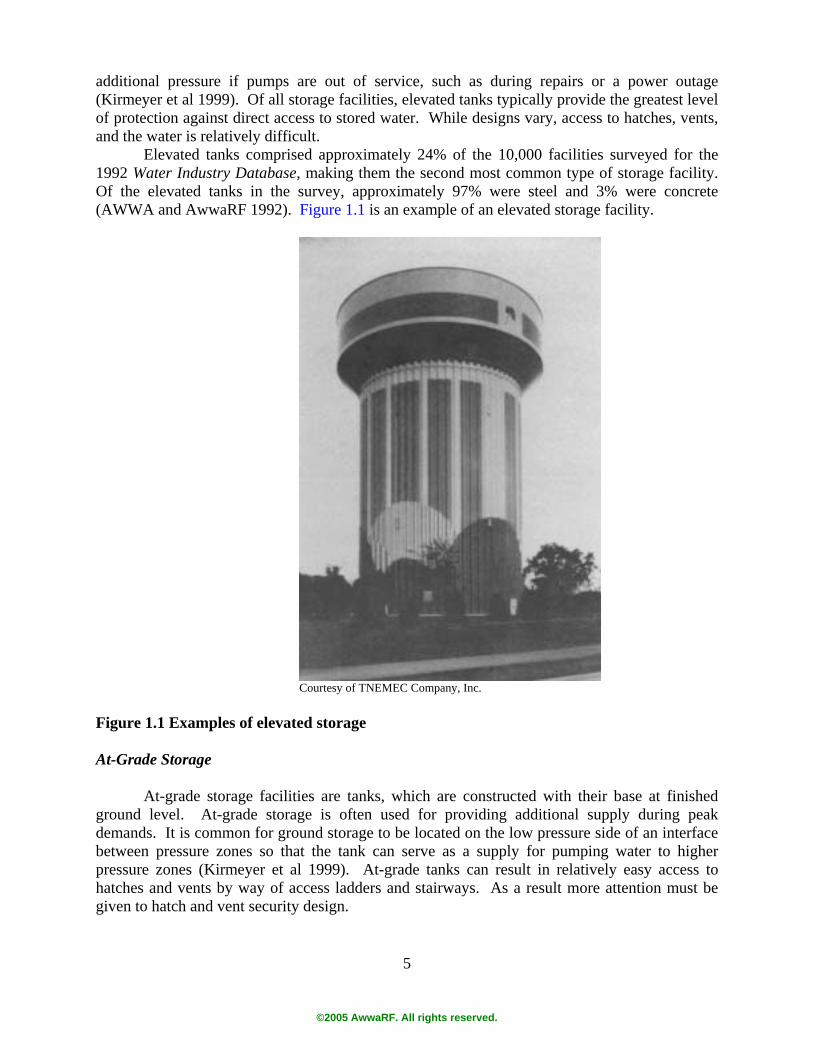
ground level. At-grade storage is often used for providing additional supply during peak demands. It is common for ground storage to be located on the low pressure side of an interface between pressure zones so that the tank can serve as a supply for pumping water to higher pressure zones (Kirmeyer et al 1999). At-grade tanks can result in relatively easy access to hatches and vents by way of access ladders and stairways. As a result more attention must be given to hatch and vent security design.
©2005 AwwaRF. All rights reserved.
6
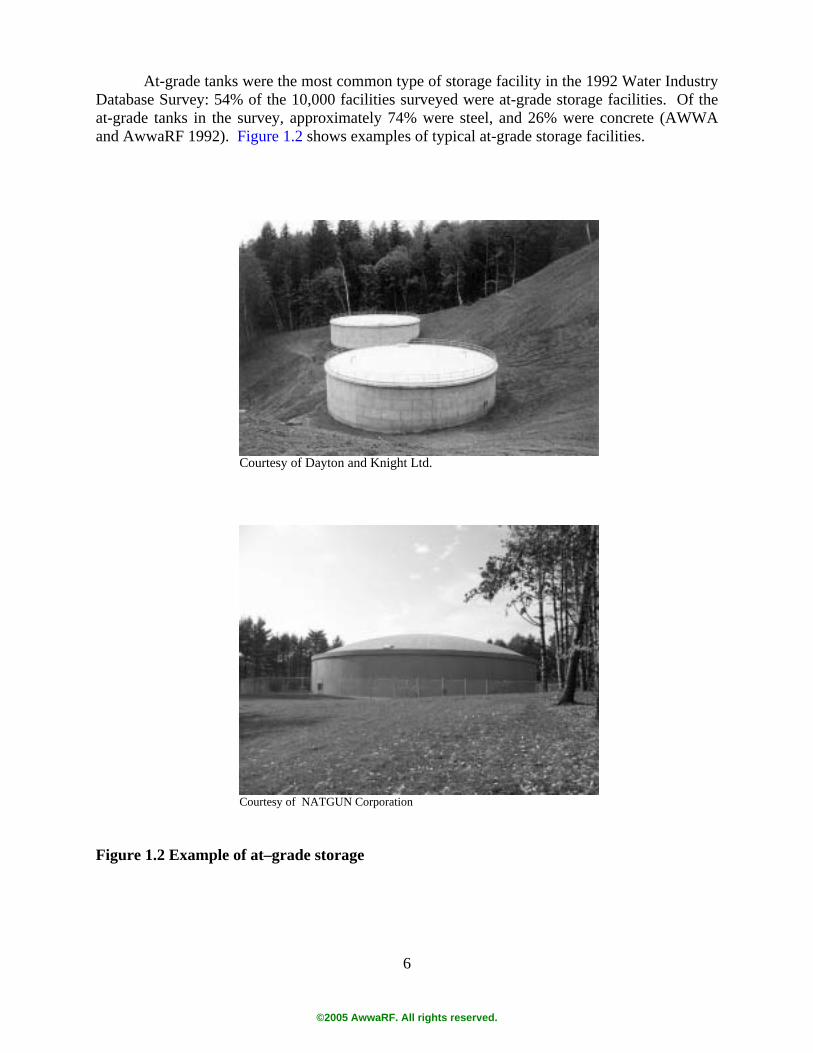
At-grade tanks were the most common type of storage facility in the 1992 Water Industry Database Survey: 54% of the 10,000 facilities surveyed were at-grade storage facilities. Of the at-grade tanks in the survey, approximately 74% were steel, and 26% were concrete (AWWA and AwwaRF 1992). Figure 1.2 shows examples of typical at-grade storage facilities.
Courtesy of Dayton and Knight Ltd.
Courtesy of NATGUN Corporation Figure 1.2 Example of at–grade storage
©2005 AwwaRF. All rights reserved.
7
Below-Grade Storage Below-grade storage facilities can take the form of a partially buried tank or an open or
covered reservoir. Concrete reservoirs are generally not built deeper than 20 to 25 feet below grade level (Kirmeyer et al 1999). A below-grade storage facility may or may not have an associated pump station. Often, in discussions, below-grade storage facilities are lumped together with either ground storage or buried storage. Below-grade facilities present the easiest access the hatches and vents in the cases of closed tanks as often no climbing is needed to access tank roofs. Open reservoirs and covered below grade reservoirs can result in direct access treated water. Open and covered below-grade types of reservoirs can require a high level of multiple barrier security and intrusion verification. Buried Storage
Buried storage facilities are located completely underground. Treated water can be
accessed only through hatches or vents. Buried storage facilities are sometimes located at multiple use sites. While the treated water is fully enclosed, access to hatches and vents can allow an intruder to obtain direct access to the water, therefore, careful attention should be paid to securing access appurtenances. Buried tanks comprised approximately 19% of 10,000 facilities surveyed for the Water Industry Database (AWWA and AwwaRF 1992). Multiple-Use Sites
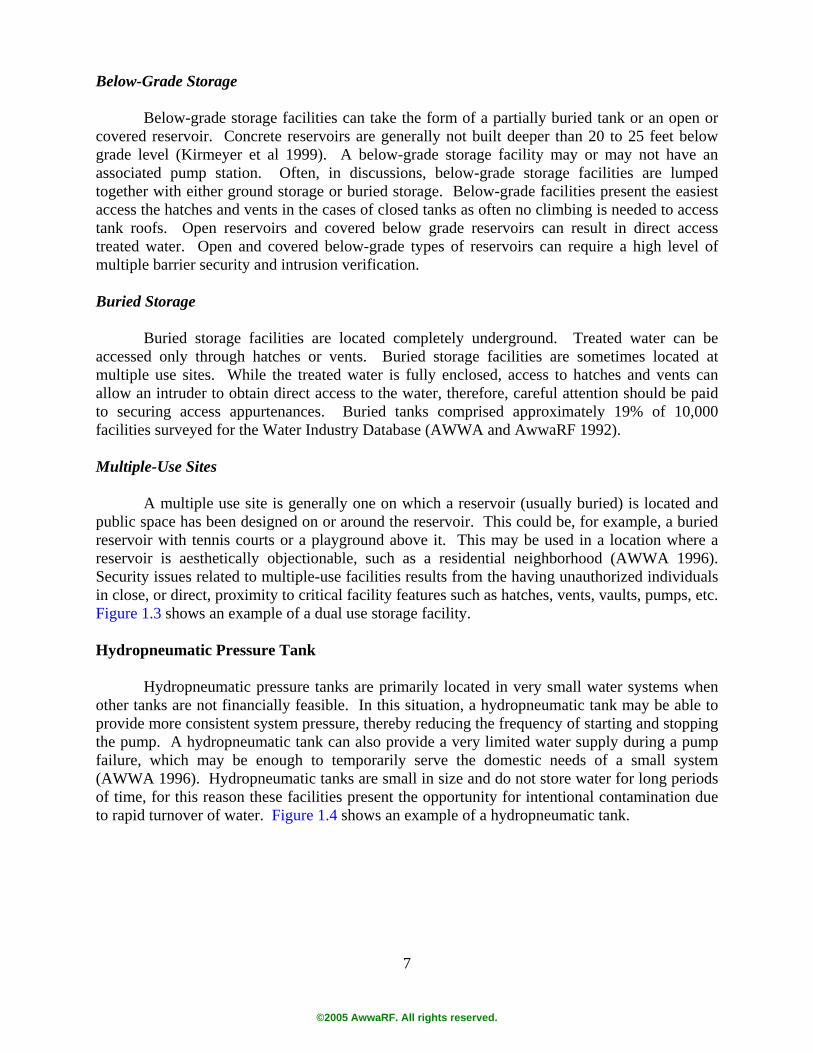
A multiple use site is generally one on which a reservoir (usually buried) is located and
public space has been designed on or around the reservoir. This could be, for example, a buried reservoir with tennis courts or a playground above it. This may be used in a location where a reservoir is aesthetically objectionable, such as a residential neighborhood (AWWA 1996). Security issues related to multiple-use facilities results from the having unauthorized individuals in close, or direct, proximity to critical facility features such as hatches, vents, vaults, pumps, etc. Figure 1.3 shows an example of a dual use storage facility.
Hydropneumatic Pressure Tank
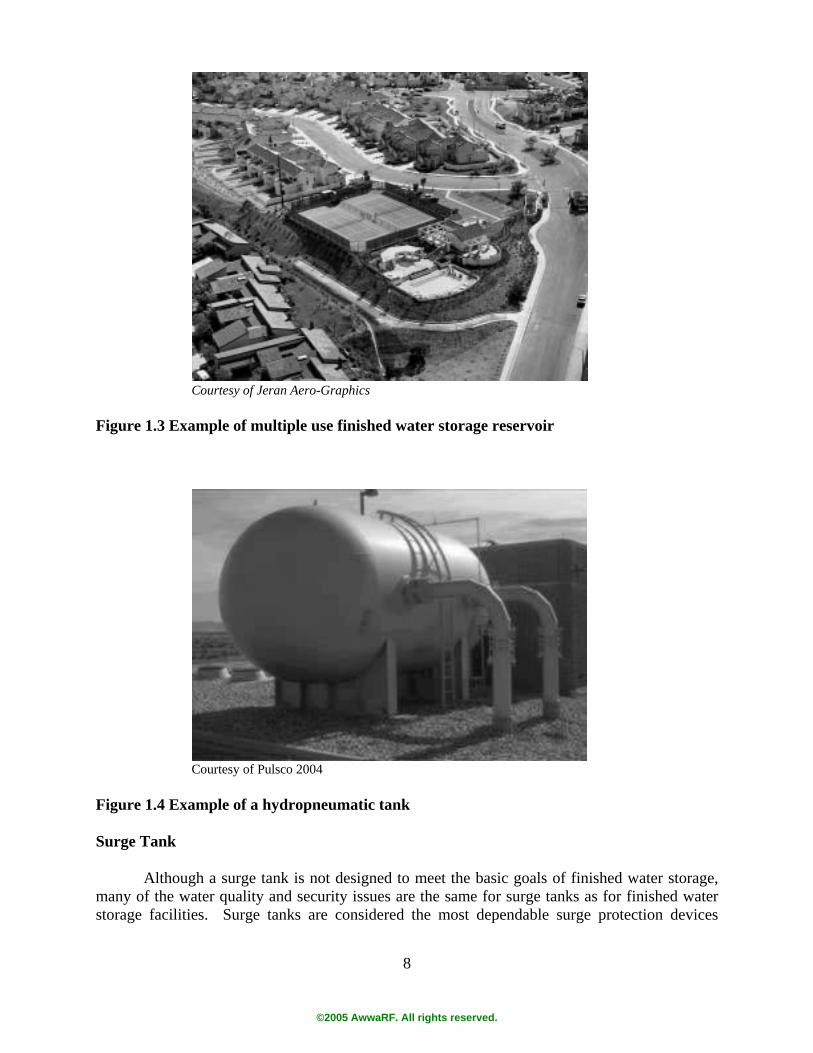
Hydropneumatic pressure tanks are primarily located in very small water systems when
other tanks are not financially feasible. In this situation, a hydropneumatic tank may be able to provide more consistent system pressure, thereby reducing the frequency of starting and stopping the pump. A hydropneumatic tank can also provide a very limited water supply during a pump failure, which may be enough to temporarily serve the domestic needs of a small system (AWWA 1996). Hydropneumatic tanks are small in size and do not store water for long periods of time, for this reason these facilities present the opportunity for intentional contamination due to rapid turnover of water. Figure 1.4 shows an example of a hydropneumatic tank.
©2005 AwwaRF. All rights reserved.
8
Courtesy of Jeran Aero-Graphics Figure 1.3 Example of multiple use finished water storage reservoir
Courtesy of Pulsco 2004
Figure 1.4 Example of a hydropneumatic tank Surge Tank
Although a surge tank is not designed to meet the basic goals of finished water storage,
many of the water quality and security issues are the same for surge tanks as for finished water storage facilities. Surge tanks are considered the most dependable surge protection devices
©2005 AwwaRF. All rights reserved.
9
because they are already online when a surge occurs. Surge tanks are generally open to atmosphere to allow overflowing in the event of an upsurge (AWWA 1996). Surge tanks may also be constructed of brick and mortar or pre-cast concrete with only a manhole cover for security. Surge tanks can present a security vulnerability because they may be open to the atmosphere. Since they do not store water, the facilities may not be visited as regularly as storage facilities. Unsecured surge tanks present the potential for introduction of a contaminant while the tank is not in use and introduction to the distribution system when the tank fills at a later time. Finished Water Storage Reservoir Cleaning Appurtenances
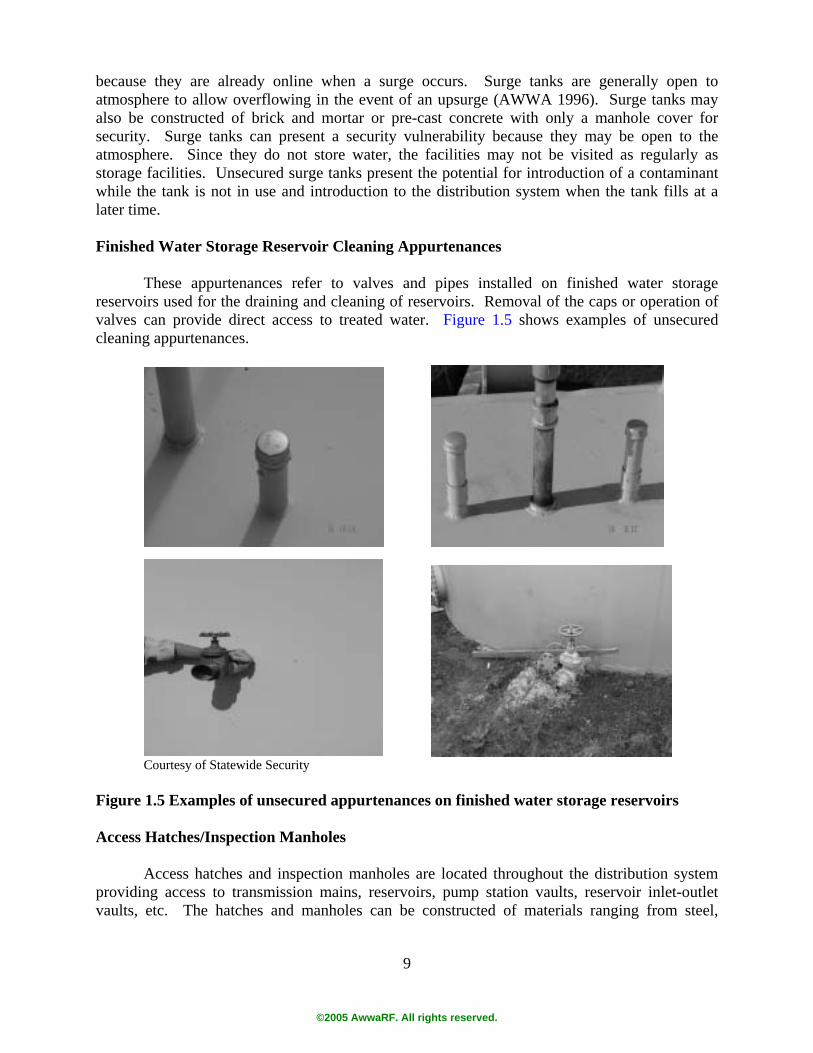
These appurtenances refer to valves and pipes installed on finished water storage reservoirs used for the draining and cleaning of reservoirs. Removal of the caps or operation of valves can provide direct access to treated water. Figure 1.5 shows examples of unsecured cleaning appurtenances.
Courtesy of Statewide Security
Figure 1.5 Examples of unsecured appurtenances on finished water storage reservoirs Access Hatches/Inspection Manholes Access hatches and inspection manholes are located throughout the distribution system providing access to transmission mains, reservoirs, pump station vaults, reservoir inlet-outlet vaults, etc. The hatches and manholes can be constructed of materials ranging from steel,
©2005 AwwaRF. All rights reserved.

10
aluminum, and fiberglass. Often these appurtenances are equipped with minimal security in the form of simple padlocks or hex bolts. Depending on the asset being protected by access hatches and manholes, techniques are available to enhance security delay, detection, and verification measures. Reservoir Air Vents
Reservoir air vents are designed to provide the free flow of air in the storage reservoirs during filling and draining cycles. Depending on the design of the reservoir these vents may be directly accessible or accessible only by climbing the reservoir. Regardless of accessibility, traditional vents, typically protected by a simple mesh screen, designed to deter birds or other wildlife, provide direct access to treated water. Evolving vent designs are attempting to decrease the ease in which access can be achieved. Figure 1.6 shows examples of unsecured reservoir vents.
Courtesy of Statewide Security Figure 1.6 Examples of unsecured reservoir vents
©2005 AwwaRF. All rights reserved.
11
Vaults
Vaults used to house below grade facilities such booster pump stations, reservoir inlet/outlet plumbing, booster disinfection, system interties, connections to transmission, etc. are not of themselves a security vulnerability. While these facilities are vulnerable because of their location and ease of access; the vulnerability exists at the access point to these vaults in the form of access hatches and manholes. Sample Taps
Sample taps are located at monitoring points in the distribution system and at storage reservoirs to provide samples for typical water quality monitoring. As distribution system monitoring becomes more prevalent the installation of sample taps may increase. These taps, if not adequately secured and equipped with a backflow prevention devices, can provide an introduction point for intentional contamination. Repair/Installation Sites
Locations where distribution system components, typically distribution piping, are being repaired or installed provide access to the distribution system and an avenue for intentional or accidental contamination. Intentional activities may include introduction of contaminants into exposed pipes, introduction of materials or substances in a manner that would result in delayed contamination, or tampering with materials and pipe waiting to be installed. Steps can be taken to monitor installation sites; construction activities can be scheduled so materials and system access are eliminated at days end; and periodic security inspections can be conducted to insure security of installations. Interdependencies
Interdependencies with other utilities, typically electric, present a vulnerability to distribution system operation. While water utilities cannot control the security of dependent utilities, they can take steps to secure the connections necessary for these utilities in order to reduce overall dependency such as establishing adequate back-up power generation. MECHANICAL ELEMENTS
The mechanical elements of the distribution system discussed below are those components of the system that are found within, or used to operate, the physical elements of the distribution system. The disruption of mechanical elements typically does not result in contamination of the distribution system but an inability to effectively operate the system or respond to a contamination, emergency water delivery or intrusion event. Reservoir Inlets/Outlets
A reservoir’s inlet/outlet represents a single point of failure in operating the reservoir. Whether the inlet/outlet is common or separate, disruption of any inlet or outlet function can
©2005 AwwaRF. All rights reserved.
12
result in loss of that facility for a potentially significant length of time. Inlets and outlets are commonly located in a vault or above-ground at the base of the reservoir. Vaulted facilities can be addressed by access control. Special consideration must be given to protecting above ground inlets and outlets with increasing importance based on the criticality and redundancy associated with the reservoir. Pump Booster Stations
Pump (booster) stations move water from lower to higher pressure zones. There are two primary types of booster stations: in-line booster stations that take water from an incoming pipeline, pressurize it, and pump it into another pipeline; and distribution booster stations that primarily draw water from a finished water storage tank and pump to a higher pressure zone (Sanks et al 1998). In systems that are not gravity fed, pumps are critical to providing water to customers and for fire flow.
Rechlorination or rechloramination facilities and water quality monitoring may also occur at booster stations. Generally the booster pumps are accompanied by standby or emergency pumps that run if the primary pump is shut down or damaged and during fire flows. Many times, emergency pumps are configured to run off a generator in the event of a power failure (Kirmeyer et al 2000).
The criticality of pumping stations is recognized by appropriate design and is addressed by providing redundant pumping capabilities. While redundancy has historically been addressed from an operational standpoint, little consideration has been given to redundancy from a security perspective. The critical security feature associated with pump stations is the separation of redundancy so that the physical vulnerability is not directly related to operational vulnerability. Pump Station Primary and Back-up Power (transformers, switchgear, connections) Properly designed pumping operations will have adequate back-up power capabilities in the event that the primary power source should go off-line. Often, the securing of primary power facilities will be outside the control of the water utility. However, a utility can, and it is recommended they do, work with power providers to develop a Memorandum of Understanding (MOU) regarding the provision of power under water and power emergency situations. While this exercise may not result in a guarantee of power, it provides the utility a scenario for evaluating back-up power needs.
On-site, it is important for a utility not to overlook the security of back-up generators, power connections, etc. Something as simple as damage to one of these features may render the facility inoperable in an emergency situation. Figure 1.7 shows an unsecured remote pump station primary power supply.
System Valves
Multiple types of valves, serving multiple purposes, are found in every distribution system. Types of valves which may be found within a distribution system include (AWWA 1996, Kirmeyer et al 2000):
©2005 AwwaRF. All rights reserved.

13
Courtesy of Statewide Security
Figure 1.7 Example of unsecured remote pump station primary power supply
• air/vacuum-relief valves • ball valves • butterfly valves • check valves • control valves • diaphragm valves • gate valves • globe valves • needle valves • pinch valves • plug valves • pressure relief valves
Of these, the gate valve is the most common (AWWA 1996). Valves serve many purposes in the distribution system, including regulating or shutting-
off flow, releasing pressure or air, allowing air to enter the system, preventing flow reversals, separating zones of different pressures and regulating tank levels. Valves do not typically present an avenue for introduction of contaminant into the distribution system. The value of distribution system valves is their function in operating the system in the event of an emergency. These uses are discussed in the following paragraphs. Figure 1.8 illustrates some typical valve types. Distribution System Isolation Valves
Distribution system isolation valves are used to isolate specific sections of the
distribution system or a transmission main. Isolation valves are typically gate or butterfly valves.
©2005 AwwaRF. All rights reserved.

14
Courtesy of Valve Manufacturers Association of America
Figure 1.8 Types of water utility valves Butterfly valves are generally preferred for needs 12-inches or larger (Kirmeyer et al 2000). Properly designed distribution system isolation valves are spaced approximately 500 feet apart in commercial districts and no more than 800 ft apart or one block apart in residential areas. (Great Lakes Upper Mississippi River Board of State Public Health and Environmental Managers 1997). Air/Vacuum Relief Valves
Air-relief valves are commonly located at high points in transmission pipelines, in order
to release the generally small amounts of air that accumulates at these locations. Air/vacuum-relief valves may be installed instead of air-relief valves. These valves allow
both a greater volume of air to be released, such as when filling lines, and air to be admitted when draining the pipeline (Reves et al 1996). As with pressure release valves, tampered air-relief or air/vacuum relief valves provide points for contaminant introduction.
©2005 AwwaRF. All rights reserved.
15
Altitude valves
Altitude valves are primarily used on the inlet lines to storage tanks and standpipes.
These valves are used to prevent overflows by shutting off flow to the tank when it approaches the overflow level (AWWA 1996, Kirmeyer et al 2000). Altitude valves are common on ground level reservoirs and may sometimes be located on elevated storage tanks if the tank is not designed to operate at full system pressure (AWWA 1996). The potential consequence resulting from the loss of an altitude valve is typically low. The result of losing an altitude valve would be the overflowing of a reservoir and possible minor flooding.
Check Valves
Check valves are used to prevent flow reversal in a pipe. A common location for check
valves is on the discharge side of a pump (AWWA 1996, Kirmeyer et al 2000). A check valve will prevent flow reversal when a pump is turned off. A type of check valve, called a foot valve, may be installed at the pump suction so a pump does not lose its prime when turned off (AWWA 1996). An unrestrained check valve can create problems with water hammer due to the valve slamming shut. Properly maintained and operating system check valves can help prevent the spread of an intentional or accidental contamination event. Pressure-Relief Valves
Pressure-relief valves discharge water from the system when the maximum desired
pressure is exceeded, such as during a water hammer event. Pressure-relief valves are often installed on the low pressure side of pressure reducing valves (PRVs) to serve as a backup in the event of a PRV failure (Kirmeyer et al 2000). In terms of security, a tampered pressure relief valve provides a means of contaminant introduction into the distribution system. Pressure Reducing Valves
Pressure reducing valves (PRVs) are used in the distribution system to manage water
flow between a higher pressure zone and a lower pressure zone. This type of valve manages the flow in a pipe so that a minimum pressure is maintained on the lower pressure side of the PRV (Kirmeyer et al 2000). Depending on the pressure differential between the two pressure zones served by the PRV, the loss of the PRV can potentially have operational and system integrity ramifications. Blow-offs
Blow-offs are small diameter pipes (2 to 4 inches, or 50 to 100 mm) extending from a pipeline to above the ground surface. Often they are located at distribution system dead ends and at low points for sediment removal, and are used to flush water mains where there is not a hydrant (Great Lakes Upper Mississippi River Board of State Public Health and Environmental Managers 1997, Mays 2000). At the surface, a valve is installed to be turned on to remove water
©2005 AwwaRF. All rights reserved.
16
from the system (Mays 2000). Blow-offs are a direct point of access for injection of a contaminant into the distribution system. Hydrants
Fire hydrants are typically located at street intersections or intermediate points as recommended by a state’s Insurance Services Office (Kirmeyer et al 2000). There are two types of hydrants commonly in use – dry and wet barrel. A dry barrel hydrant has a main valve located at the base of the hydrant. When the hydrant is not in use and the valve is closed, water is drained or is pumped from the barrel. Wet barrel hydrants do not have a main valve and the barrel is full of water at distribution system pressures (AWWA 1989). The Research Agenda Survey estimated that an average of 25 hydrants exist per 1000 people.
Regardless of the type, hydrants are the most readily accessible elements of the distribution system that provide the opportunity for the introduction of contaminant directly into the distribution system.
Backflow Prevention Devices
Backflow prevention devices are designed to prevent cross connections from water
reversing direction in the pipes due to back-siphoning and backpressure. Back-siphoning is the drawing of water into the distribution system due to the creation of negative pressures up-flow from the point of backflow. Backpressure occurs when a non-potable supply, located down-flow, operates under a higher pressure than the potable water, and forcing flow into the distribution system. This could describe a non-potable source that has a higher pressure due to pumping, elevation differences, air or steam pressure, etc. (AWWA 1990)
Burlingame and Choi (1998) identified fire hydrants as a potential location of cross-contamination. During the time that fire trucks are connected to the open hydrant, a low pressure within the system could siphon contaminants into the system. For example, in 1997, an accident occurred in which firefighting foam backflowed into a distribution system (Welter et. al. 2003).
Hose bibs and customer taps are one of the most common locations for a cross connection to occur; often because unknowingly the air gap is eliminated. At a private residence, when a running garden hose is attached to a chemical dispenser, or left submerged in a pool or bin of water, a cross-connection exists. In the event of backsiphonage, chemicals or contaminants could be sucked back into the residential plumbing or service lines, causing contamination of the water (AWWA 1996). A similar cross-connection could exist at an indoor tap if a hose is attached to a faucet, allowing for the tap to be effectively submerged. Hose bibs also provide the opportunity for active intentional contamination by backpressuring.
A broken, malfunctioning, or tampered with back-flow prevention device can also be a potential location of a cross-connection.
Backflow prevention devices are most commonly installed where the potential for cross connection readily exists (Kirmeyer et al 2000). Examples where backflow preventers are installed include hospitals, restaurants, industrial sites, construction sites, medical offices, fire suppression and landscape sprinkler systems, shipyards, tanker trucks that obtain water from hydrants, etc. The intentional disabling of a backflow prevention device provides a means of direct introduction of a contaminant into the distribution system. The most common backflow
©2005 AwwaRF. All rights reserved.
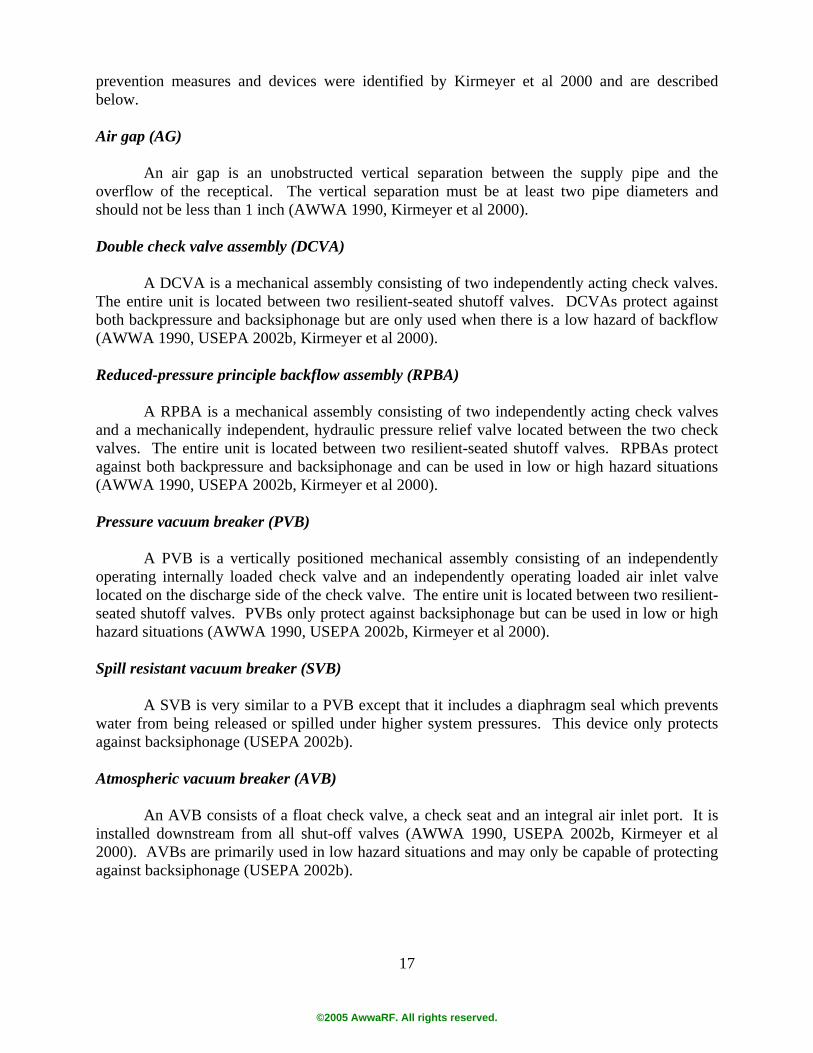
17
prevention measures and devices were identified by Kirmeyer et al 2000 and are described below. Air gap (AG)
An air gap is an unobstructed vertical separation between the supply pipe and the
overflow of the receptical. The vertical separation must be at least two pipe diameters and should not be less than 1 inch (AWWA 1990, Kirmeyer et al 2000). Double check valve assembly (DCVA)
A DCVA is a mechanical assembly consisting of two independently acting check valves. The entire unit is located between two resilient-seated shutoff valves. DCVAs protect against both backpressure and backsiphonage but are only used when there is a low hazard of backflow (AWWA 1990, USEPA 2002b, Kirmeyer et al 2000). Reduced-pressure principle backflow assembly (RPBA)
A RPBA is a mechanical assembly consisting of two independently acting check valves and a mechanically independent, hydraulic pressure relief valve located between the two check valves. The entire unit is located between two resilient-seated shutoff valves. RPBAs protect against both backpressure and backsiphonage and can be used in low or high hazard situations (AWWA 1990, USEPA 2002b, Kirmeyer et al 2000). Pressure vacuum breaker (PVB)
A PVB is a vertically positioned mechanical assembly consisting of an independently operating internally loaded check valve and an independently operating loaded air inlet valve located on the discharge side of the check valve. The entire unit is located between two resilient-seated shutoff valves. PVBs only protect against backsiphonage but can be used in low or high hazard situations (AWWA 1990, USEPA 2002b, Kirmeyer et al 2000). Spill resistant vacuum breaker (SVB)
A SVB is very similar to a PVB except that it includes a diaphragm seal which prevents water from being released or spilled under higher system pressures. This device only protects against backsiphonage (USEPA 2002b). Atmospheric vacuum breaker (AVB)
An AVB consists of a float check valve, a check seat and an integral air inlet port. It is installed downstream from all shut-off valves (AWWA 1990, USEPA 2002b, Kirmeyer et al 2000). AVBs are primarily used in low hazard situations and may only be capable of protecting against backsiphonage (USEPA 2002b).
©2005 AwwaRF. All rights reserved.

18
Interties
For this report interties have been defined has physical connections with another utility operated as a continuous, seasonal, or emergency source of supply. The potential vulnerability associated with an intertie is closely related to its function as described above. All interties present a location, albeit limited, for assessing the distribution system. If an intertie functions as a continuous source of supply the loss may have significant consequences for meeting demand. The disabling of a seasonal supply intertie is less critical, at least for the season it is not in use. In such cases inspection should occur before seasonal activation of the intertie. Finally, the consequence of tampering with an emergency intertie while minimal with regards to immediate contamination or impact on demand, requires regular and continuous inspection since the timing of its need is unknown. Meters
Distribution system meters can be classified as one of three types: master, large customer, and residential as described below. Water meters are designed to measure the volume of water flowing through a pipe. Water meters are useful in monitoring the inflow to the system and customer usage. Master Meters
Master meters are used to measure the flowrate of water entering the distribution system
from treatment or wholesale suppliers; coordinate distribution system needs; to determine treatment chemical feed rates; to calculate detention times, especially for virus inactivation; to compare treatment flow rates with customer data to determine water losses; to determine pump efficiency, to determine volumes pumped from sources (particularly wells); and to record flow rates for state agencies’ records (AWWA 1995). Master meters are not readily accessible to outsiders and the opportunity for tampering is less than other meters. Large Customer Meters
For this report, a large customer is designated as any user other than residential and low
water usage businesses (which would be metered similarly to residential customers). Large customers may include apartment buildings, office buildings, golf courses, large public buildings and industrial buildings. There are multiple types of meters that are commonly used by large customers; compound meters, current meters, and detector-check meters (AWWA 1996). Large customer meters provide a point of significant potential intrusion, especially in abandoned buildings.
Residential Meters
Residential meters are used to determine individual customer water usage and are
primarily 5/8-in. (16mm) meters for use on a standard 3/4-in. (19mm) residential connection (AWWA 1986, Kirmeyer et al 2000). Most small water meters manufactured in the U.S. after
©2005 AwwaRF. All rights reserved.
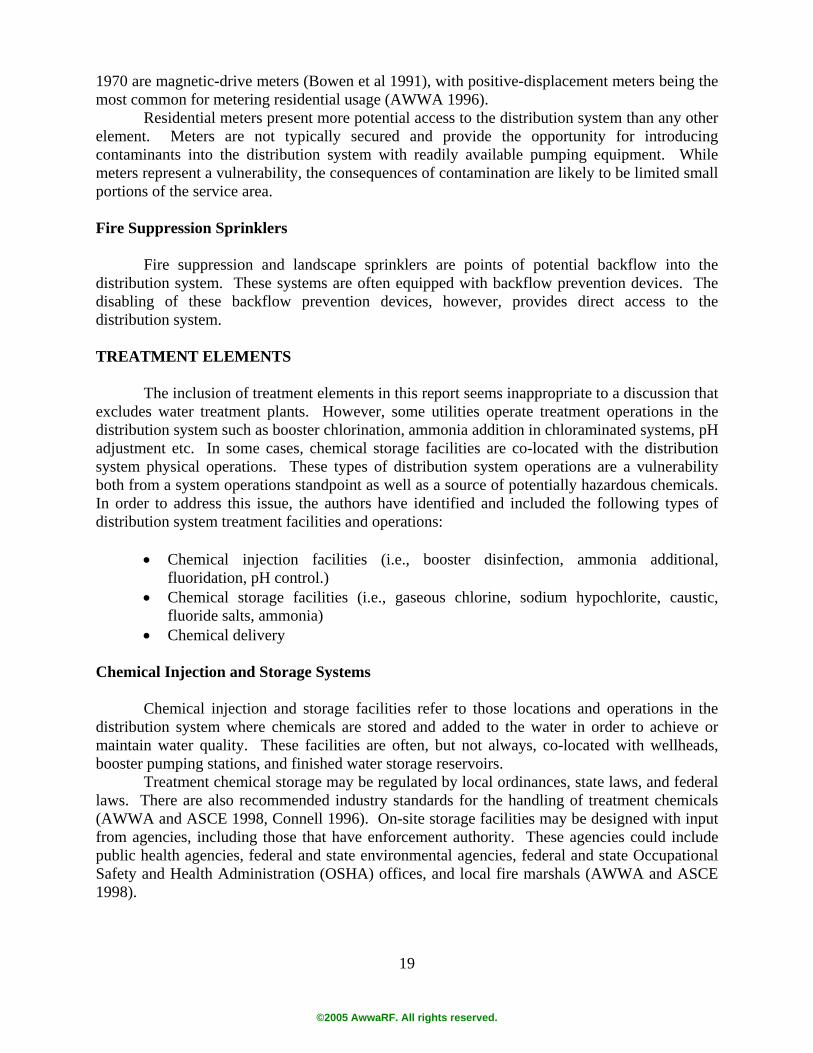
19
1970 are magnetic-drive meters (Bowen et al 1991), with positive-displacement meters being the most common for metering residential usage (AWWA 1996).
Residential meters present more potential access to the distribution system than any other element. Meters are not typically secured and provide the opportunity for introducing contaminants into the distribution system with readily available pumping equipment. While meters represent a vulnerability, the consequences of contamination are likely to be limited small portions of the service area. Fire Suppression Sprinklers
Fire suppression and landscape sprinklers are points of potential backflow into the
distribution system. These systems are often equipped with backflow prevention devices. The disabling of these backflow prevention devices, however, provides direct access to the distribution system. TREATMENT ELEMENTS
The inclusion of treatment elements in this report seems inappropriate to a discussion that excludes water treatment plants. However, some utilities operate treatment operations in the distribution system such as booster chlorination, ammonia addition in chloraminated systems, pH adjustment etc. In some cases, chemical storage facilities are co-located with the distribution system physical operations. These types of distribution system operations are a vulnerability both from a system operations standpoint as well as a source of potentially hazardous chemicals. In order to address this issue, the authors have identified and included the following types of distribution system treatment facilities and operations:
• Chemical injection facilities (i.e., booster disinfection, ammonia additional, fluoridation, pH control.)
• Chemical storage facilities (i.e., gaseous chlorine, sodium hypochlorite, caustic, fluoride salts, ammonia)
• Chemical delivery
Chemical Injection and Storage Systems Chemical injection and storage facilities refer to those locations and operations in the distribution system where chemicals are stored and added to the water in order to achieve or maintain water quality. These facilities are often, but not always, co-located with wellheads, booster pumping stations, and finished water storage reservoirs.
Treatment chemical storage may be regulated by local ordinances, state laws, and federal laws. There are also recommended industry standards for the handling of treatment chemicals (AWWA and ASCE 1998, Connell 1996). On-site storage facilities may be designed with input from agencies, including those that have enforcement authority. These agencies could include public health agencies, federal and state environmental agencies, federal and state Occupational Safety and Health Administration (OSHA) offices, and local fire marshals (AWWA and ASCE 1998).
©2005 AwwaRF. All rights reserved.
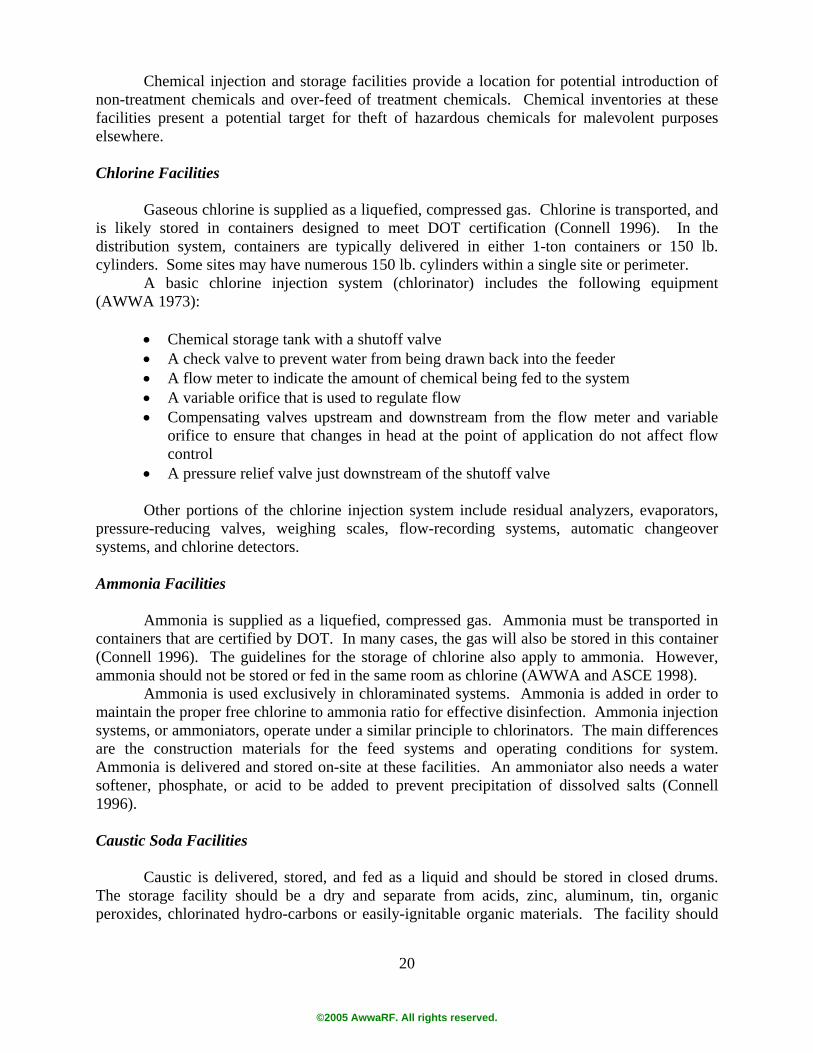
20
Chemical injection and storage facilities provide a location for potential introduction of non-treatment chemicals and over-feed of treatment chemicals. Chemical inventories at these facilities present a potential target for theft of hazardous chemicals for malevolent purposes elsewhere. Chlorine Facilities
Gaseous chlorine is supplied as a liquefied, compressed gas. Chlorine is transported, and is likely stored in containers designed to meet DOT certification (Connell 1996). In the distribution system, containers are typically delivered in either 1-ton containers or 150 lb. cylinders. Some sites may have numerous 150 lb. cylinders within a single site or perimeter.
A basic chlorine injection system (chlorinator) includes the following equipment (AWWA 1973):
• Chemical storage tank with a shutoff valve • A check valve to prevent water from being drawn back into the feeder • A flow meter to indicate the amount of chemical being fed to the system • A variable orifice that is used to regulate flow • Compensating valves upstream and downstream from the flow meter and variable
orifice to ensure that changes in head at the point of application do not affect flow control
• A pressure relief valve just downstream of the shutoff valve Other portions of the chlorine injection system include residual analyzers, evaporators,
pressure-reducing valves, weighing scales, flow-recording systems, automatic changeover systems, and chlorine detectors.
Ammonia Facilities
Ammonia is supplied as a liquefied, compressed gas. Ammonia must be transported in
containers that are certified by DOT. In many cases, the gas will also be stored in this container (Connell 1996). The guidelines for the storage of chlorine also apply to ammonia. However, ammonia should not be stored or fed in the same room as chlorine (AWWA and ASCE 1998).
Ammonia is used exclusively in chloraminated systems. Ammonia is added in order to maintain the proper free chlorine to ammonia ratio for effective disinfection. Ammonia injection systems, or ammoniators, operate under a similar principle to chlorinators. The main differences are the construction materials for the feed systems and operating conditions for system. Ammonia is delivered and stored on-site at these facilities. An ammoniator also needs a water softener, phosphate, or acid to be added to prevent precipitation of dissolved salts (Connell 1996).
Caustic Soda Facilities
Caustic is delivered, stored, and fed as a liquid and should be stored in closed drums. The storage facility should be a dry and separate from acids, zinc, aluminum, tin, organic peroxides, chlorinated hydro-carbons or easily-ignitable organic materials. The facility should
©2005 AwwaRF. All rights reserved.
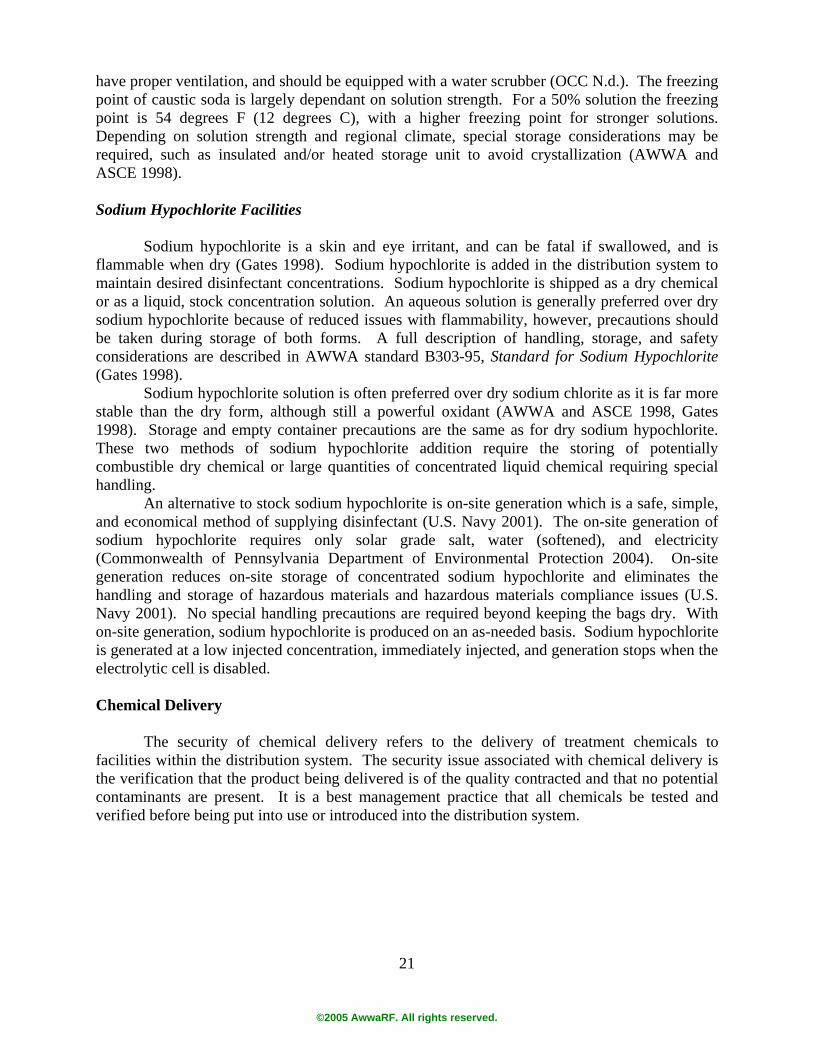
21
have proper ventilation, and should be equipped with a water scrubber (OCC N.d.). The freezing point of caustic soda is largely dependant on solution strength. For a 50% solution the freezing point is 54 degrees F (12 degrees C), with a higher freezing point for stronger solutions. Depending on solution strength and regional climate, special storage considerations may be required, such as insulated and/or heated storage unit to avoid crystallization (AWWA and ASCE 1998).
Sodium Hypochlorite Facilities
Sodium hypochlorite is a skin and eye irritant, and can be fatal if swallowed, and is
flammable when dry (Gates 1998). Sodium hypochlorite is added in the distribution system to maintain desired disinfectant concentrations. Sodium hypochlorite is shipped as a dry chemical or as a liquid, stock concentration solution. An aqueous solution is generally preferred over dry sodium hypochlorite because of reduced issues with flammability, however, precautions should be taken during storage of both forms. A full description of handling, storage, and safety considerations are described in AWWA standard B303-95, Standard for Sodium Hypochlorite (Gates 1998).
Sodium hypochlorite solution is often preferred over dry sodium chlorite as it is far more stable than the dry form, although still a powerful oxidant (AWWA and ASCE 1998, Gates 1998). Storage and empty container precautions are the same as for dry sodium hypochlorite. These two methods of sodium hypochlorite addition require the storing of potentially combustible dry chemical or large quantities of concentrated liquid chemical requiring special handling.
An alternative to stock sodium hypochlorite is on-site generation which is a safe, simple, and economical method of supplying disinfectant (U.S. Navy 2001). The on-site generation of sodium hypochlorite requires only solar grade salt, water (softened), and electricity (Commonwealth of Pennsylvania Department of Environmental Protection 2004). On-site generation reduces on-site storage of concentrated sodium hypochlorite and eliminates the handling and storage of hazardous materials and hazardous materials compliance issues (U.S. Navy 2001). No special handling precautions are required beyond keeping the bags dry. With on-site generation, sodium hypochlorite is produced on an as-needed basis. Sodium hypochlorite is generated at a low injected concentration, immediately injected, and generation stops when the electrolytic cell is disabled. Chemical Delivery
The security of chemical delivery refers to the delivery of treatment chemicals to facilities within the distribution system. The security issue associated with chemical delivery is the verification that the product being delivered is of the quality contracted and that no potential contaminants are present. It is a best management practice that all chemicals be tested and verified before being put into use or introduced into the distribution system.
©2005 AwwaRF. All rights reserved.
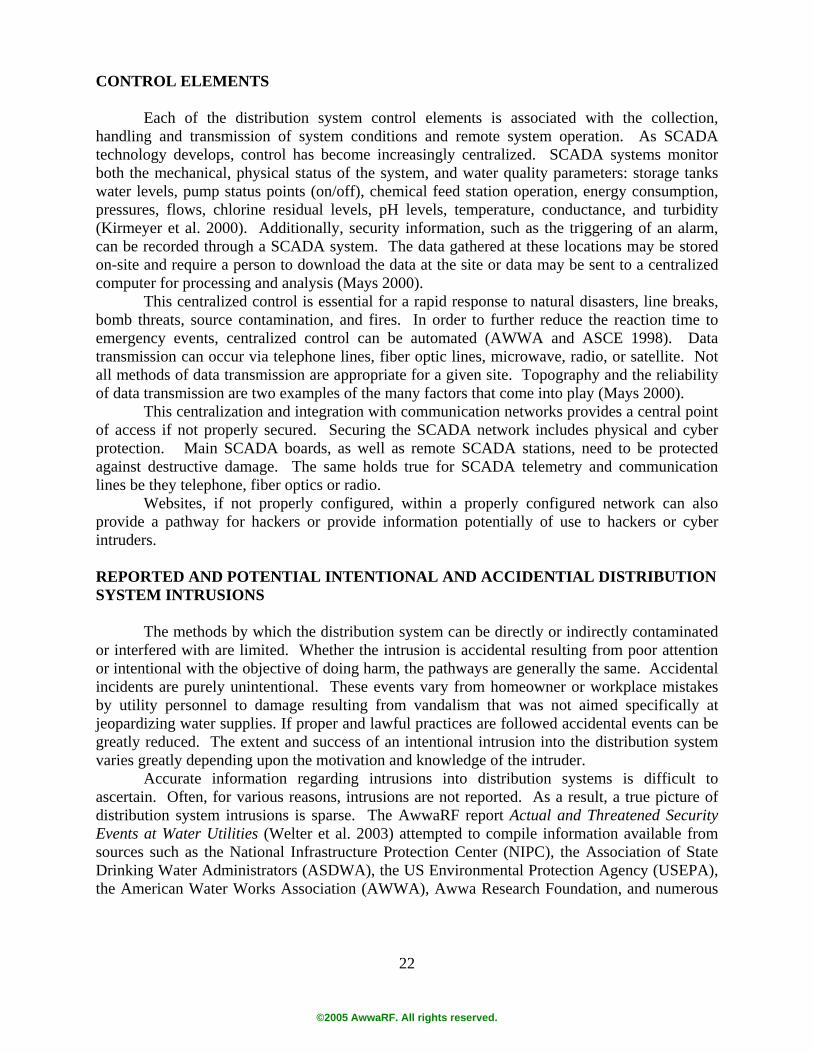
22
CONTROL ELEMENTS Each of the distribution system control elements is associated with the collection,
handling and transmission of system conditions and remote system operation. As SCADA technology develops, control has become increasingly centralized. SCADA systems monitor both the mechanical, physical status of the system, and water quality parameters: storage tanks water levels, pump status points (on/off), chemical feed station operation, energy consumption, pressures, flows, chlorine residual levels, pH levels, temperature, conductance, and turbidity (Kirmeyer et al. 2000). Additionally, security information, such as the triggering of an alarm, can be recorded through a SCADA system. The data gathered at these locations may be stored on-site and require a person to download the data at the site or data may be sent to a centralized computer for processing and analysis (Mays 2000).
This centralized control is essential for a rapid response to natural disasters, line breaks, bomb threats, source contamination, and fires. In order to further reduce the reaction time to emergency events, centralized control can be automated (AWWA and ASCE 1998). Data transmission can occur via telephone lines, fiber optic lines, microwave, radio, or satellite. Not all methods of data transmission are appropriate for a given site. Topography and the reliability of data transmission are two examples of the many factors that come into play (Mays 2000).
This centralization and integration with communication networks provides a central point of access if not properly secured. Securing the SCADA network includes physical and cyber protection. Main SCADA boards, as well as remote SCADA stations, need to be protected against destructive damage. The same holds true for SCADA telemetry and communication lines be they telephone, fiber optics or radio.
Websites, if not properly configured, within a properly configured network can also provide a pathway for hackers or provide information potentially of use to hackers or cyber intruders.
REPORTED AND POTENTIAL INTENTIONAL AND ACCIDENTIAL DISTRIBUTION SYSTEM INTRUSIONS
The methods by which the distribution system can be directly or indirectly contaminated
or interfered with are limited. Whether the intrusion is accidental resulting from poor attention or intentional with the objective of doing harm, the pathways are generally the same. Accidental incidents are purely unintentional. These events vary from homeowner or workplace mistakes by utility personnel to damage resulting from vandalism that was not aimed specifically at jeopardizing water supplies. If proper and lawful practices are followed accidental events can be greatly reduced. The extent and success of an intentional intrusion into the distribution system varies greatly depending upon the motivation and knowledge of the intruder.
Accurate information regarding intrusions into distribution systems is difficult to ascertain. Often, for various reasons, intrusions are not reported. As a result, a true picture of distribution system intrusions is sparse. The AwwaRF report Actual and Threatened Security Events at Water Utilities (Welter et al. 2003) attempted to compile information available from sources such as the National Infrastructure Protection Center (NIPC), the Association of State Drinking Water Administrators (ASDWA), the US Environmental Protection Agency (USEPA), the American Water Works Association (AWWA), Awwa Research Foundation, and numerous
©2005 AwwaRF. All rights reserved.
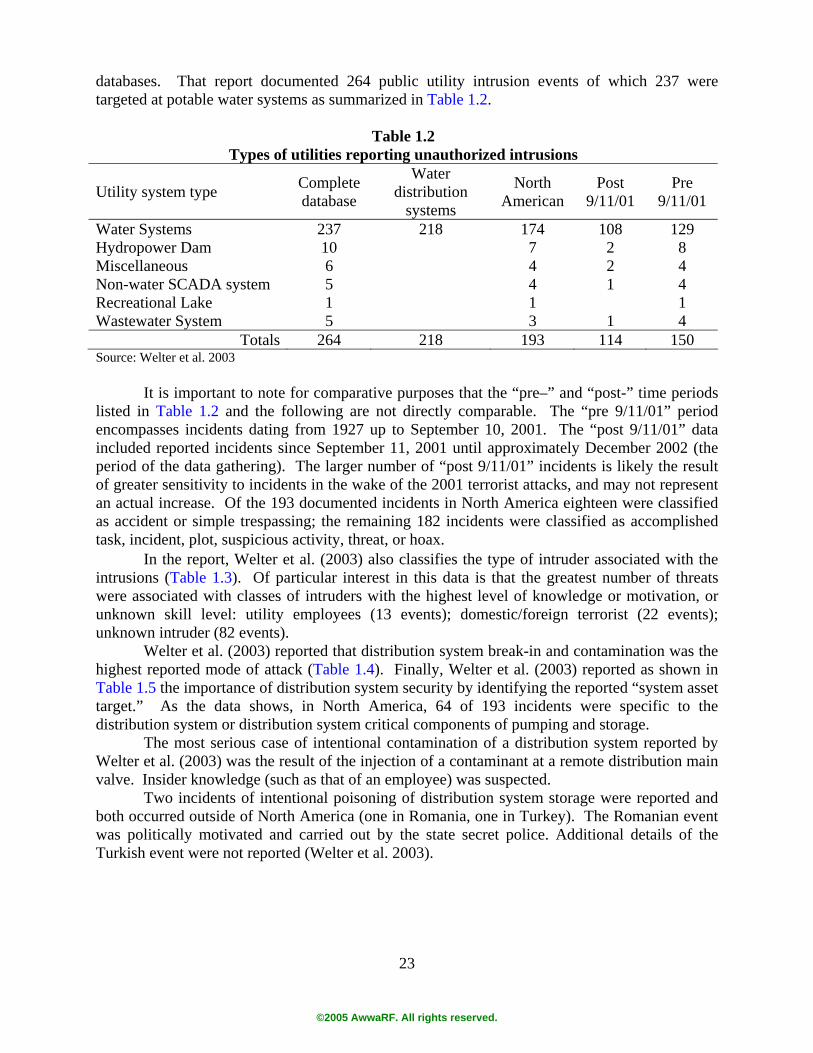
23
databases. That report documented 264 public utility intrusion events of which 237 were targeted at potable water systems as summarized in Table 1.2.
Table 1.2 Types of utilities reporting unauthorized intrusions
Utility system type Complete database
Water distribution
systems
North American
Post 9/11/01
Pre 9/11/01
Water Systems 237 218 174 108 129 Hydropower Dam 10 7 2 8 Miscellaneous 6 4 2 4 Non-water SCADA system 5 4 1 4 Recreational Lake 1 1 1 Wastewater System 5 3 1 4
Totals 264 218 193 114 150 Source: Welter et al. 2003 It is important to note for comparative purposes that the “pre–” and “post-” time periods listed in Table 1.2 and the following are not directly comparable. The “pre 9/11/01” period encompasses incidents dating from 1927 up to September 10, 2001. The “post 9/11/01” data included reported incidents since September 11, 2001 until approximately December 2002 (the period of the data gathering). The larger number of “post 9/11/01” incidents is likely the result of greater sensitivity to incidents in the wake of the 2001 terrorist attacks, and may not represent an actual increase. Of the 193 documented incidents in North America eighteen were classified as accident or simple trespassing; the remaining 182 incidents were classified as accomplished task, incident, plot, suspicious activity, threat, or hoax.
In the report, Welter et al. (2003) also classifies the type of intruder associated with the intrusions (Table 1.3). Of particular interest in this data is that the greatest number of threats were associated with classes of intruders with the highest level of knowledge or motivation, or unknown skill level: utility employees (13 events); domestic/foreign terrorist (22 events); unknown intruder (82 events).
Welter et al. (2003) reported that distribution system break-in and contamination was the highest reported mode of attack (Table 1.4). Finally, Welter et al. (2003) reported as shown in Table 1.5 the importance of distribution system security by identifying the reported “system asset target.” As the data shows, in North America, 64 of 193 incidents were specific to the distribution system or distribution system critical components of pumping and storage.
The most serious case of intentional contamination of a distribution system reported by Welter et al. (2003) was the result of the injection of a contaminant at a remote distribution main valve. Insider knowledge (such as that of an employee) was suspected.
Two incidents of intentional poisoning of distribution system storage were reported and both occurred outside of North America (one in Romania, one in Turkey). The Romanian event was politically motivated and carried out by the state secret police. Additional details of the Turkish event were not reported (Welter et al. 2003).
©2005 AwwaRF. All rights reserved.
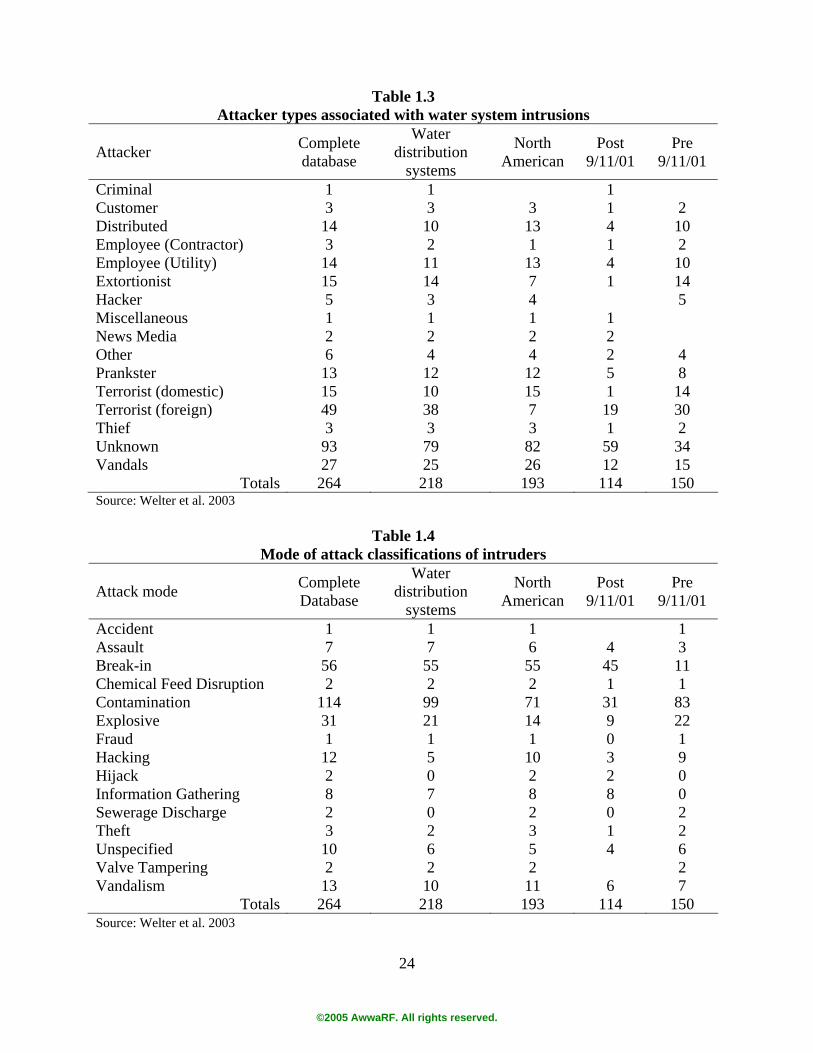
24
Table 1.3
Attacker types associated with water system intrusions
Attacker Complete database
Water distribution
systems
North American
Post 9/11/01
Pre 9/11/01
Criminal 1 1 1 Customer 3 3 3 1 2 Distributed 14 10 13 4 10 Employee (Contractor) 3 2 1 1 2 Employee (Utility) 14 11 13 4 10 Extortionist 15 14 7 1 14 Hacker 5 3 4 5 Miscellaneous 1 1 1 1 News Media 2 2 2 2 Other 6 4 4 2 4 Prankster 13 12 12 5 8 Terrorist (domestic) 15 10 15 1 14 Terrorist (foreign) 49 38 7 19 30 Thief 3 3 3 1 2 Unknown 93 79 82 59 34 Vandals 27 25 26 12 15
Totals 264 218 193 114 150 Source: Welter et al. 2003
Table 1.4 Mode of attack classifications of intruders
Attack mode Complete Database
Water distribution
systems
North American
Post 9/11/01
Pre 9/11/01
Accident 1 1 1 1 Assault 7 7 6 4 3 Break-in 56 55 55 45 11 Chemical Feed Disruption 2 2 2 1 1 Contamination 114 99 71 31 83 Explosive 31 21 14 9 22 Fraud 1 1 1 0 1 Hacking 12 5 10 3 9 Hijack 2 0 2 2 0 Information Gathering 8 7 8 8 0 Sewerage Discharge 2 0 2 0 2 Theft 3 2 3 1 2 Unspecified 10 6 5 4 6 Valve Tampering 2 2 2 2 Vandalism 13 10 11 6 7
Totals 264 218 193 114 150 Source: Welter et al. 2003
©2005 AwwaRF. All rights reserved.
25
Table 1.5 Water system intruder target assets
System asset target Complete database
Water distribution system
North American
Post 9/11/01
Pre 9/11/01
Control/Information System 9 3 7 1 8 Customers 4 3 4 2 2 Dam 14 2 8 4 10 Distribution System 19 19 10 5 14 Employee(s) 5 5 5 3 2 Groundwater Supply (Wells) 3 3 3 2 1 Hazard chemical 1 0 1 1 0 Miscellaneous 10 6 6 7 3 Pump Station 3 2 3 3 0 Storage Facilities 61 55 51 36 25 Surface Source Supply 20 18 15 10 10 Wastewater System 4 0 3 1 3 Water System 93 86 61 30 63 Water truck tank 1 0 1 0 1 Water Treatment Facilities 17 16 15 9 8
Totals 264 218 193 114 150 Source: Welter et al. 2003
Incidents involving finished water storage facilities accounted for approximately 23% of the total reported incidents. Storage facility break-ins included broken or open hatches with the locks removed. Also common were reports of floating reservoir covers being intentionally slashed (Welter et al. 2003).
Fourteen cases were reported that involved SCADA or other computer control systems. Three of these incidents were both intentional and performed with insider knowledge or access (Welter et al. 2003).
In addition to numerous reports of general vandalism, some vandalism incidents resulted in extensive damage to water quality and the distribution system. In 1981, a teenager tampered with a blow-off valve, thereby leading to the undermining and loss of two major transmission mains. In 1979, a fluoride feed pump was vandalized, resulting in an overfeed of fluoride in a small system serving an elementary school. It was not believed that this was the intentional goal of the vandalism (Welter et al. 2003).
Welter et al. (2003) also identified two incidents of unintentional contamination events resulting from the erroneous delivery of treatment chemicals. In the first of these incidents, aluminum sulfate was directly pumped into a clearwell by an unsupervised evening delivery person. In the second incident, chemicals were delivered and subsequently introduced into the distribution systems that were “not consistent with the order or delivery manifest” (Welter et al. 2003).
The events summarized by Welter et al. (2003) demonstrate the lack of reporting and detailed information regarding the water system and distribution system intrusions and the vulnerability of the distribution system as a preferable target.
©2005 AwwaRF. All rights reserved.
26
SUMMARY The distribution system provides a variety of potential access points. The differing functions of the distribution system elements provide intruders the opportunity to disrupt water service through direct contact and contamination of the water or by disrupting the ability to operate the system through physical damage or loss of automated control. A utility’s control over the distribution system elements ranges from complete control (such as storage and pumping facilities co-located with another utility staffed facility), to no control or ability to monitor (such as backflow devices, meters, and customer taps). As water moves farther into the distribution system the number of customers that can potentially be impacted decreases, however, the potential to do greater harm to fewer customers increases. The water distribution system is a target for unlawful activity. As evidenced by the incomplete records of intrusions, adversaries have, or have shown plans to use the water distribution system for malevolent purposes. Further, records of more “casual” intrusions demonstrate the potential for more serious adversaries. Because of the varied access points, variable levels of potential malevolent activity, the demonstrated potential to use water distribution systems to cause harm, and the inverse relationship between the ability to secure elements of distribution and the number of customers that can be harmed, utilities are, or will be faced with difficult questions in determining how much security is adequate or reasonable.
©2005 AwwaRF. All rights reserved.
27
CHAPTER 2 IDENTIFICATION AND DEFINITION OF POTENTIAL VULNERABILITIES
INTRODUCTION AND DEFINITION OF VULNERABILITY CATEGORIES
The project team used the findings of the literature review, professional experience and records of past intrusions into water systems to develop and define a list of potential vulnerabilities. It was realized that specific vulnerabilities result from the uniqueness of each and every distribution system facility, its function, and location. It would be impossible to address potential vulnerabilities in such a manner. The project team’s objective was, therefore, to develop generalized vulnerabilities that could be used by utilities to develop a vulnerability-consequence score in order to prioritize facilities by type for further assessment in their own system.
The project team identified nine general types of vulnerabilities that distribution system elements may be potentially susceptible to as:
• Cyber intrusion • Air access • Insider intrusion • Public access • Outsider intrusion • Limited intrusion response capabilities • Physical access • Limited detection capabilities • Vehicle access
Each of these potential vulnerabilities are defined below.
Cyber Intrusion Vulnerability Cyber intrusion is a concern to distribution system components that are susceptible to control or disruption through remote computer access. This vulnerability would be a characteristic hacker event where network security is compromised, a facility is shut down, utility remote access is disabled, operations are controlled and the facility operated outside of normal parameters. This type of vulnerability is only possible for facilities with remote operation capabilities. Techniques that an adversary may use to gain access may include:
War-Dialing
War dialing is an old, but not obsolete, method of detecting computer networks that are using modems. The process entails a computer hooked up to a modem dialing thousands of numbers in blocks. When a computer modem answers, the application makes note of the number for the user, and either moves on to the next block of numbers or tries to run an automated attack. War dialing can call thousands of numbers in an hour. Often the results of these scans are posted in hacker sites for other users to see. Once a network has been detected, it becomes vulnerable to direct attacks and intrusion attempts.
©2005 AwwaRF. All rights reserved.

28
Wireless Attack
Wireless attack is a new method of gaining access to wireless networks by “sniffing” the perimeters of buildings for wireless signals and attacking the security, which is weaker than standard network security. Wireless attack requires close proximity (200 meters or less) for any degree of success. Buffer-Overflow
Buffer overflow attacks exploit flaws within application code to “overflow” the application with data requests. Many applications if attacked in this method will provide an attacker full access to the application or system. In the case of the modem RAS software, the buffer-overflow attack will allow an intruder to gain access to the system without having to log on. Unlike a brute-force attack, using a buffer-overflow attack requires a detailed knowledge of the system that will be compromised. As a result, only highly skilled hackers will even attempt this type of system infiltration. However, security experts are seeing a growing trend, where less sophisticated hackers are now arming themselves with “tool-kits” that can auto-sense vulnerabilities and deploy exploits of the attacker’s choosing with the click of a button. This will enable lesser skilled intruders the ability to compromise a system. Malformed Packet
Malformed packet attacks utilize application flaws by inserting malicious code into data requests to gain access to systems or run code of their choice. Typically, the goal of this type of attack is to shut down or disable applications and services. However, detected vulnerabilities in the systems will enable malformed packet attacks to “elevate” the security privileges of an attacker, giving him a greater ability to control or compromise the system. Denial of Service
Denial of service attacks block or disable applications and machines on the network. They can also cause workstations to restart, shut down, or lock up the processes until the units are all manually restarted. It is possible to set in motion a chain of events where each workstation would continuously restart until ALL of them have been manually shut down. This is the simplest of attacks and exploits available to an attacker. Trojan Injection
This intrusion places a malicious application (or Trojan horse) onto a machine inside the network. This application can perform a variety of tasks such as keystroke logging, network scanning and coordinated denial of service attacks. Its purpose is primarily to collect information, perform tasks and await further commands.
©2005 AwwaRF. All rights reserved.
29
Man-in-the-Middle
This attack uses a periphery network device (workstation, laptop, etc) as the initial target; the intent being to completely take over the device. Once the target machine (or machines) has been taken over, a more complex attack will be launched against the SCADA system, which was the primary goal. An advantage of this type of attack is that it may gain more access to the SCADA system through indirect routes then through a directed attack against the SCADA server, as the server will not allow secondary applications to run, but the XP machines can.
Insider Intrusion Vulnerability Insider intrusion vulnerable facilities are characterized as components that are vulnerable to attacks by current or former utility employees. Depending on the level of authority and necessity to conduct work at a utility, facilities susceptible could range from all facilities to select facilities. Outsider Intrusion Vulnerability An outsider intrusion vulnerability is characterized as facilities susceptible to attack by an adversary not employed by the utility or municipality who does not possess facility information typically available to an employee. Except in a rare instance, virtually every water system distribution component is susceptible to outsider intrusion. Physical Access Vulnerability A physical access vulnerability is defined as a distribution system component to which there is direct physical access by non-utility personnel such as dual-use reservoirs or vaults without secured perimeters. Vehicle Access Vulnerability Vehicle access vulnerable elements are defined as distribution system component that are directly accessible by non-utility vehicles. Air Access Vulnerability Air access vulnerable elements are defined as a distribution system component that can be directly impacted from the air such as an open finished water reservoir. Public Access Vulnerability Public access vulnerable facilities are those that are co-located with public facilities such as recreation areas, ballparks, etc. to which the public has access to or conducts activities in close proximity.
©2005 AwwaRF. All rights reserved.
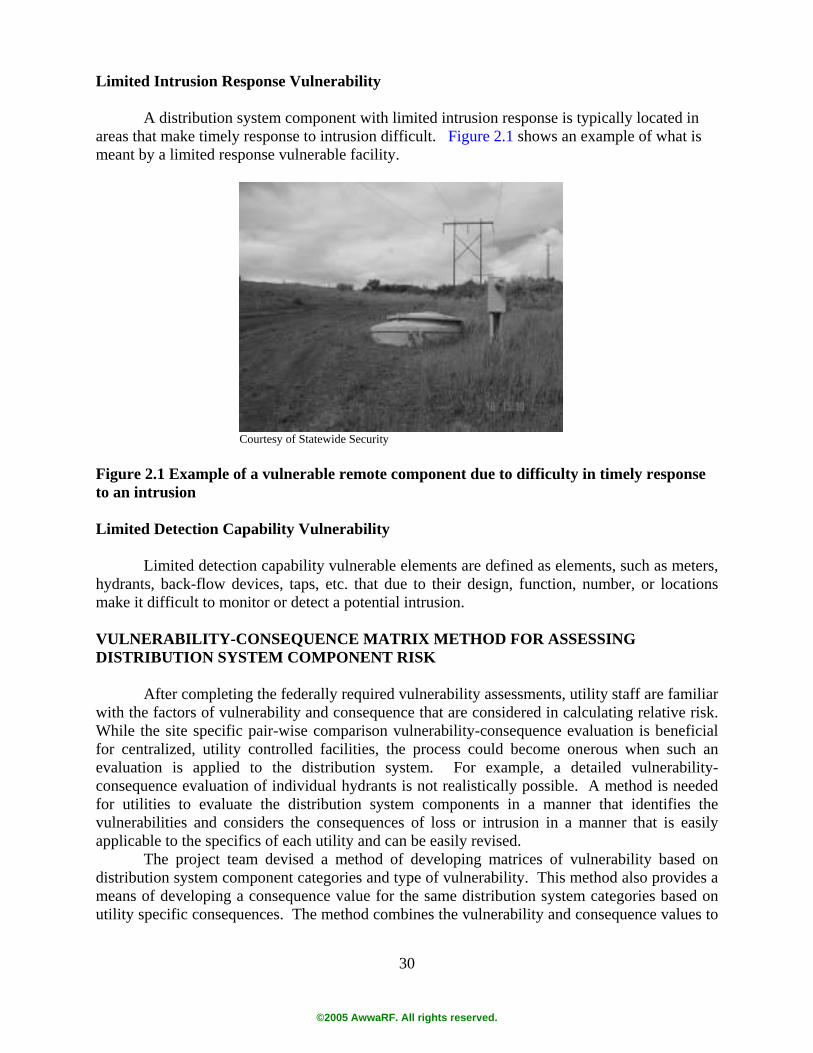
30
Limited Intrusion Response Vulnerability A distribution system component with limited intrusion response is typically located in areas that make timely response to intrusion difficult. Figure 2.1 shows an example of what is meant by a limited response vulnerable facility.
Courtesy of Statewide Security
Figure 2.1 Example of a vulnerable remote component due to difficulty in timely response to an intrusion Limited Detection Capability Vulnerability Limited detection capability vulnerable elements are defined as elements, such as meters, hydrants, back-flow devices, taps, etc. that due to their design, function, number, or locations make it difficult to monitor or detect a potential intrusion.
VULNERABILITY-CONSEQUENCE MATRIX METHOD FOR ASSESSING DISTRIBUTION SYSTEM COMPONENT RISK
After completing the federally required vulnerability assessments, utility staff are familiar
with the factors of vulnerability and consequence that are considered in calculating relative risk. While the site specific pair-wise comparison vulnerability-consequence evaluation is beneficial for centralized, utility controlled facilities, the process could become onerous when such an evaluation is applied to the distribution system. For example, a detailed vulnerability-consequence evaluation of individual hydrants is not realistically possible. A method is needed for utilities to evaluate the distribution system components in a manner that identifies the vulnerabilities and considers the consequences of loss or intrusion in a manner that is easily applicable to the specifics of each utility and can be easily revised.
The project team devised a method of developing matrices of vulnerability based on distribution system component categories and type of vulnerability. This method also provides a means of developing a consequence value for the same distribution system categories based on utility specific consequences. The method combines the vulnerability and consequence values to
©2005 AwwaRF. All rights reserved.
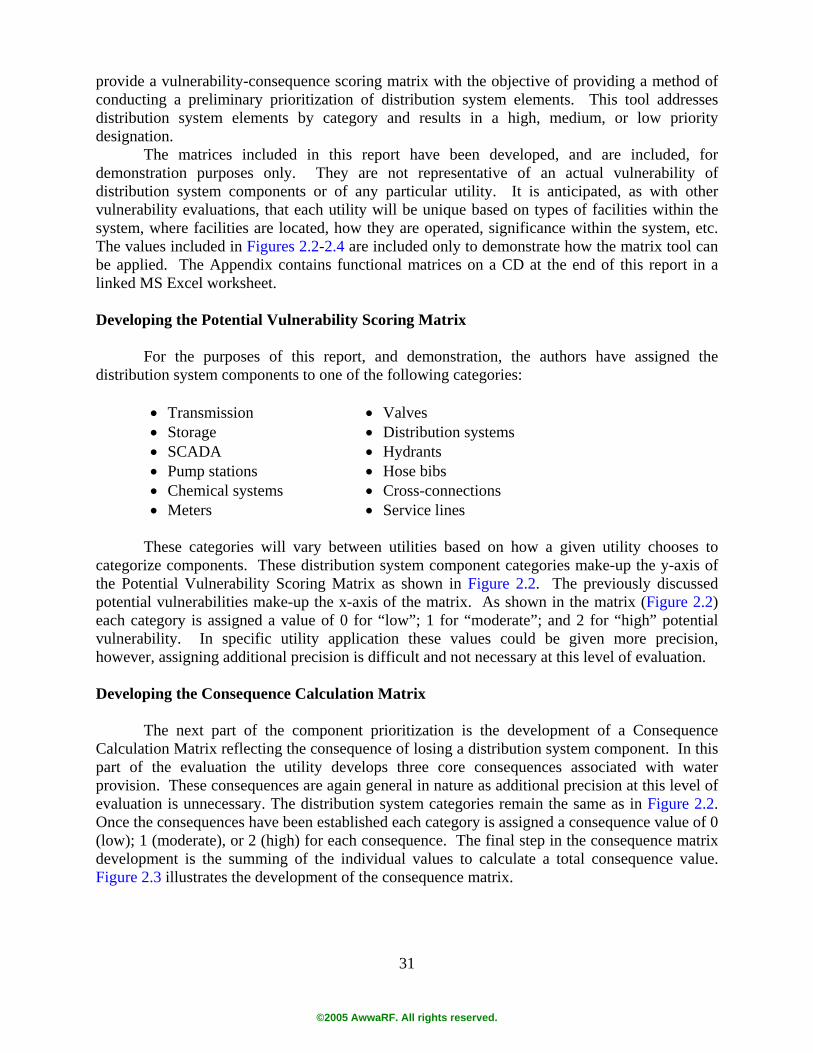
31
provide a vulnerability-consequence scoring matrix with the objective of providing a method of conducting a preliminary prioritization of distribution system elements. This tool addresses distribution system elements by category and results in a high, medium, or low priority designation.
The matrices included in this report have been developed, and are included, for demonstration purposes only. They are not representative of an actual vulnerability of distribution system components or of any particular utility. It is anticipated, as with other vulnerability evaluations, that each utility will be unique based on types of facilities within the system, where facilities are located, how they are operated, significance within the system, etc. The values included in Figures 2.2-2.4 are included only to demonstrate how the matrix tool can be applied. The Appendix contains functional matrices on a CD at the end of this report in a linked MS Excel worksheet.
Developing the Potential Vulnerability Scoring Matrix
For the purposes of this report, and demonstration, the authors have assigned the
distribution system components to one of the following categories: • Transmission • Valves • Storage • Distribution systems • SCADA • Hydrants • Pump stations • Hose bibs • Chemical systems • Cross-connections • Meters • Service lines
These categories will vary between utilities based on how a given utility chooses to
categorize components. These distribution system component categories make-up the y-axis of the Potential Vulnerability Scoring Matrix as shown in Figure 2.2. The previously discussed potential vulnerabilities make-up the x-axis of the matrix. As shown in the matrix (Figure 2.2) each category is assigned a value of 0 for “low”; 1 for “moderate”; and 2 for “high” potential vulnerability. In specific utility application these values could be given more precision, however, assigning additional precision is difficult and not necessary at this level of evaluation. Developing the Consequence Calculation Matrix
The next part of the component prioritization is the development of a Consequence
Calculation Matrix reflecting the consequence of losing a distribution system component. In this part of the evaluation the utility develops three core consequences associated with water provision. These consequences are again general in nature as additional precision at this level of evaluation is unnecessary. The distribution system categories remain the same as in Figure 2.2. Once the consequences have been established each category is assigned a consequence value of 0 (low); 1 (moderate), or 2 (high) for each consequence. The final step in the consequence matrix development is the summing of the individual values to calculate a total consequence value. Figure 2.3 illustrates the development of the consequence matrix.
©2005 AwwaRF. All rights reserved.
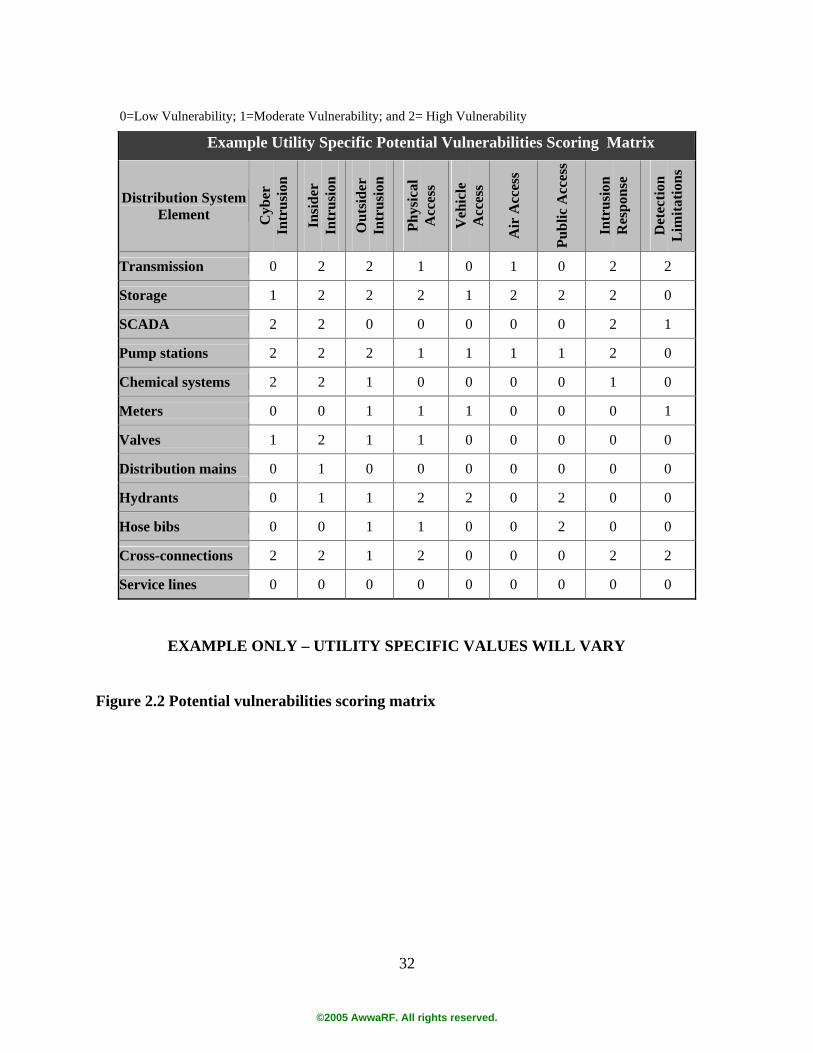
32
0=Low Vulnerability; 1=Moderate Vulnerability; and 2= High Vulnerability
EXAMPLE ONLY – UTILITY SPECIFIC VALUES WILL VARY
Figure 2.2 Potential vulnerabilities scoring matrix
Example Utility Specific Potential Vulnerabilities Scoring Matrix
Distribution System Element C
yber
In
trus
ion
Insi
der
Intr
usio
n
Out
side
r In
trus
ion
Phys
ical
A
cces
s
Veh
icle
A
cces
s
Air
Acc
ess
Publ
ic A
cces
s
Intr
usio
n R
espo
nse
Det
ectio
n L
imita
tions
Transmission 0 2 2 1 0 1 0 2 2
Storage 1 2 2 2 1 2 2 2 0
SCADA 2 2 0 0 0 0 0 2 1
Pump stations 2 2 2 1 1 1 1 2 0
Chemical systems 2 2 1 0 0 0 0 1 0
Meters 0 0 1 1 1 0 0 0 1
Valves 1 2 1 1 0 0 0 0 0
Distribution mains 0 1 0 0 0 0 0 0 0
Hydrants 0 1 1 2 2 0 2 0 0
Hose bibs 0 0 1 1 0 0 2 0 0
Cross-connections 2 2 1 2 0 0 0 2 2
Service lines 0 0 0 0 0 0 0 0 0
©2005 AwwaRF. All rights reserved.
33
0=Low Vulnerability; 1=Moderate Vulnerability; and 2= High Vulnerability
EXAMPLE ONLY – UTILITY SPECIFIC VALUES WILL VARY
Figure 2.3 Consequence calculation matrix
Developing a Vulnerability-Consequence Matrix Once the values of vulnerability and consequence have been determined, the final step is
the combination of the two values for an overall Vulnerability-Consequence Matrix used to identify high, moderate, and low risk distribution system components. In this step the consequence value for each distribution system element, functioning as a weighting factor, is multiplied by each vulnerability value for the same element. The outcome, using the values established for this report, included in software worksheets at the back of the report, provide a value between 0 and 12. These values have been categorized and color coded as low priority (0-3.99, green); moderate priority (4.00-7.99, yellow); and high priority (8.00-12.00, red). The illustrative results of the Vulnerability-Consequence Matrix exercise are shown in Figure 2.4.
Example Utility Specific Consequence Calculation Matrix
Consequences Distribution
System Element Loss of Ability to Provide Reliable
Service
Loss of Ability to Provide Adequate
Public Safety
Loss of Ability to Provide Safe
Water Total Score
Transmission 2 1 2 5 Storage 1 2 1 4 SCADA 1 0 1 1 Pump stations 2 2 1 5 Chemical systems 1 0 2 3 Meters 0 0 0 0 Valves 1 2 1 4 Distribution mains 2 1 0 3 Hydrants 0 2 0 2 Hose bibs 0 0 0 0 Cross-connections 0 2 2 4 Service lines 2 0 1 3
©2005 AwwaRF. All rights reserved.

34
EXAMPLE ONLY – UTILITY SPECIFIC VALUES WILL VARY Figure 2.4 Vulnerability-consequence matrix The software included in this report provides Figures 2.2-2.4 in a functional, linked MS
Excel format. The software is designed to automatically complete the final color-coded Vulnerability-Consequence matrix when values are entered into the first two matrices.
This spreadsheet tool is designed to assist utilities as a starting point in prioritizing the multitude of vulnerable points in the distribution that will be unique in their importance within each system.
Example Utility Specific Vulnerability-Consequence Matrix
Vulnerability
Distribution System Element
Cyb
er
Intr
usio
n
Insi
der
Intr
usio
n
Out
side
r In
trus
ion
Phys
ical
A
cces
s
Veh
icle
A
cces
s
Veh
icle
A
cces
s
Air
Acc
ess
Publ
ic
Acc
ess
Det
ectio
n L
imita
tions
Transmission 0 10 10 5 0 5 0 10 10
Storage 4 8 8 8 4 8 8 8 0
SCADA 2 2 0 0 0 0 0 2 1
Pump stations 10 10 10 5 5 5 5 10 0
Chemical systems 6 6 3 0 0 0 0 3 0
Meters 0 0 0 0 0 0 0 0 0
Valves 4 8 4 4 0 0 0 0 0
Distribution mains 0 3 0 0 0 0 0 0 0
Hydrants 0 2 2 2 4 0 4 0 0
Hose bibs 0 0 0 0 0 0 0 0 0
Cross-connections 8 8 4 0 0 8 4 8 8
Service lines 0 0 0 0 0 0 0 0 0 Vulnerability-Consequence Ranking Low Moderate High 0.0-3.99 4.0-7.99 8.0-12.0
©2005 AwwaRF. All rights reserved.
35
CHAPTER 3 APPLICATION OF HYDRAULIC MODELS TO ASSIST IN
VULNERABILITY DETERMINATION
INTRODUCTION
It is widely accepted that hydraulic modeling can be used to determine flow, system pressures, and dispersion of treatment chemicals. However, the analysis of model results as a means for predicting the spread of intentional contamination has not been widely used due partially to the limitations of existing models.
For this report, a hypothetical system was generated and five contamination scenarios were modeled. For the purposes of this project, the authors used existing and commercially available distribution system modeling software (WaterCAD V.3.1). The authors realized there are numerous subtle physical and chemical variables that determine the actual dispersal of a contaminant within a closed hydraulic system and that achieving such level of detail and accuracy was beyond the scope of this project. Therefore, the objective of the application of the modeling software was to determine if such a model, typically used by utilities could provide a tool to track the potential extent of a contamination event and provide a worst case scenario of contaminant spread within the system. This investigation was not intended to be an evaluation and recommendation of all software packages or even a rigorous examination of a single software package. The modeling conducted for this project was intended to reflect the type of use that would be realistic for a system operator using an existing hydraulic model immediately after becoming aware of a contamination event or using an existing model as a predictive tool for emergency response planning. The primary assumption made in this exercise was that a utility will have a current and calibrated model available.
MODELING APPROACH Model Capabilities
Modeling was completed for this project using WaterCAD by Haestad Methods, version
3.1. This software operates in the AutoCAD environment so that the operator can see the layout of the distribution system in a scaled plan view. The software has the capability of simulating the continuous operation of a distribution system including the following specific activities that are of interest in this analysis:
• Simulation a change in demands at individual nodes to match a diurnal curve. • Simulation the changing water levels in reservoirs as demands change. • Simulation the starting and stopping of well pumps and booster pump stations based
on system pressures. • Ability to track flows from specific locations and calculate the percentage of water in
a pipe that comes from that source. Through the use of these features, contamination events within a water distribution
system can be simulated and the overall impact of a single event could be identified.
©2005 AwwaRF. All rights reserved.
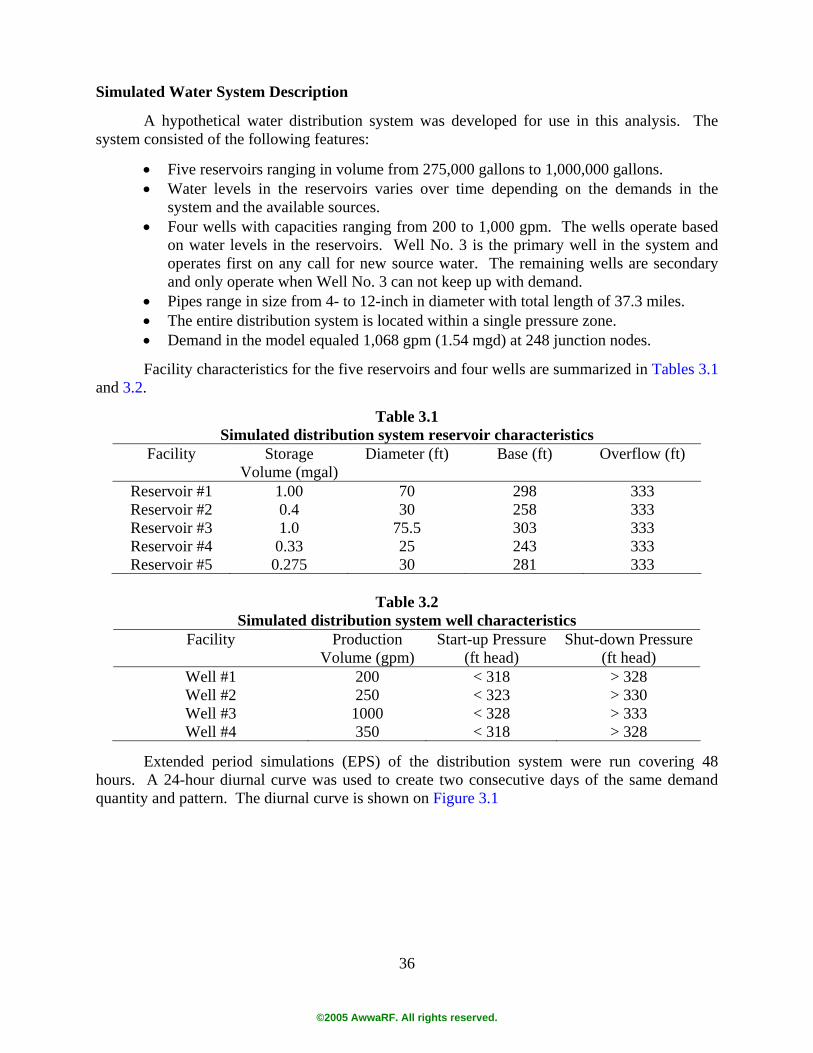
36
Simulated Water System Description
A hypothetical water distribution system was developed for use in this analysis. The
system consisted of the following features: • Five reservoirs ranging in volume from 275,000 gallons to 1,000,000 gallons. • Water levels in the reservoirs varies over time depending on the demands in the
system and the available sources. • Four wells with capacities ranging from 200 to 1,000 gpm. The wells operate based
on water levels in the reservoirs. Well No. 3 is the primary well in the system and operates first on any call for new source water. The remaining wells are secondary and only operate when Well No. 3 can not keep up with demand.
• Pipes range in size from 4- to 12-inch in diameter with total length of 37.3 miles. • The entire distribution system is located within a single pressure zone. • Demand in the model equaled 1,068 gpm (1.54 mgd) at 248 junction nodes. Facility characteristics for the five reservoirs and four wells are summarized in Tables 3.1
and 3.2.
Table 3.1 Simulated distribution system reservoir characteristics
Facility Storage Volume (mgal)
Diameter (ft) Base (ft) Overflow (ft)
Reservoir #1 1.00 70 298 333 Reservoir #2 0.4 30 258 333 Reservoir #3 1.0 75.5 303 333 Reservoir #4 0.33 25 243 333 Reservoir #5 0.275 30 281 333
Table 3.2
Simulated distribution system well characteristics Facility Production
Volume (gpm) Start-up Pressure
(ft head) Shut-down Pressure
(ft head) Well #1 200 < 318 > 328 Well #2 250 < 323 > 330 Well #3 1000 < 328 > 333 Well #4 350 < 318 > 328
Extended period simulations (EPS) of the distribution system were run covering 48
hours. A 24-hour diurnal curve was used to create two consecutive days of the same demand quantity and pattern. The diurnal curve is shown on Figure 3.1
©2005 AwwaRF. All rights reserved.
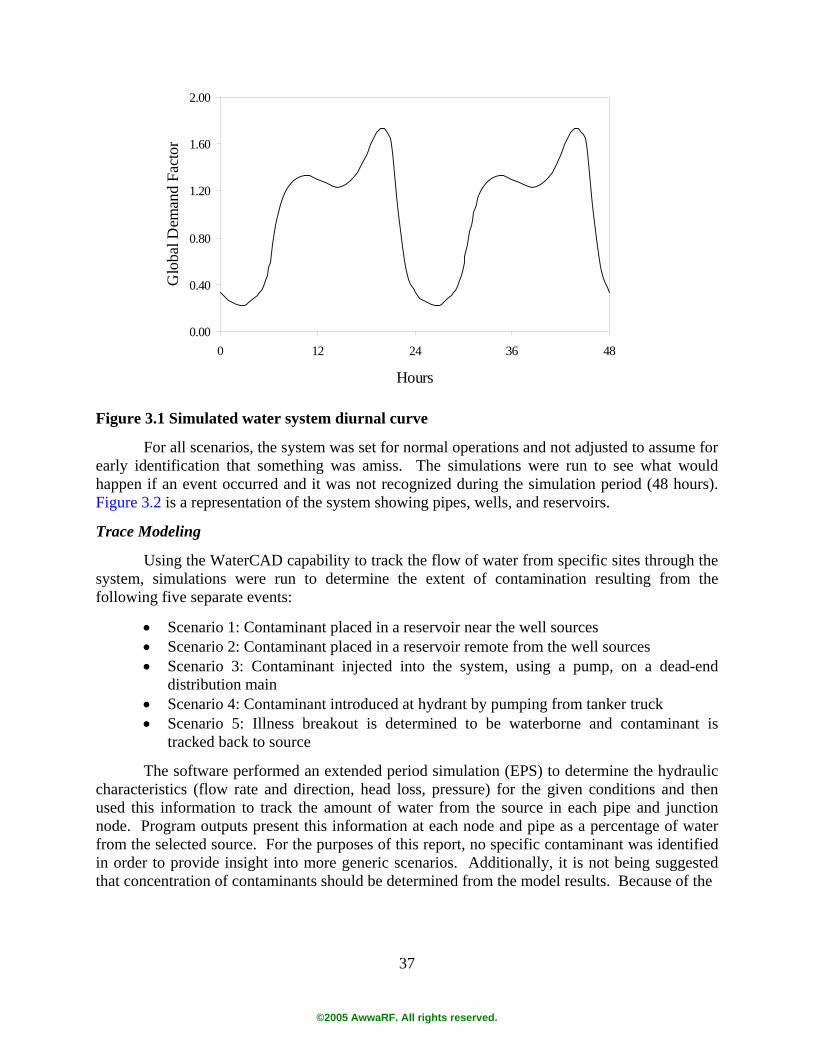
37
0.00
0.40
0.80
1.20
1.60
2.00
0 12 24 36 48
Hours
Glo
bal D
eman
d Fa
ctor
Figure 3.1 Simulated water system diurnal curve
For all scenarios, the system was set for normal operations and not adjusted to assume for
early identification that something was amiss. The simulations were run to see what would happen if an event occurred and it was not recognized during the simulation period (48 hours). Figure 3.2 is a representation of the system showing pipes, wells, and reservoirs.
Trace Modeling
Using the WaterCAD capability to track the flow of water from specific sites through the
system, simulations were run to determine the extent of contamination resulting from the following five separate events:
• Scenario 1: Contaminant placed in a reservoir near the well sources • Scenario 2: Contaminant placed in a reservoir remote from the well sources • Scenario 3: Contaminant injected into the system, using a pump, on a dead-end
distribution main • Scenario 4: Contaminant introduced at hydrant by pumping from tanker truck • Scenario 5: Illness breakout is determined to be waterborne and contaminant is
tracked back to source The software performed an extended period simulation (EPS) to determine the hydraulic
characteristics (flow rate and direction, head loss, pressure) for the given conditions and then used this information to track the amount of water from the source in each pipe and junction node. Program outputs present this information at each node and pipe as a percentage of water from the selected source. For the purposes of this report, no specific contaminant was identified in order to provide insight into more generic scenarios. Additionally, it is not being suggested that concentration of contaminants should be determined from the model results. Because of the
©2005 AwwaRF. All rights reserved.
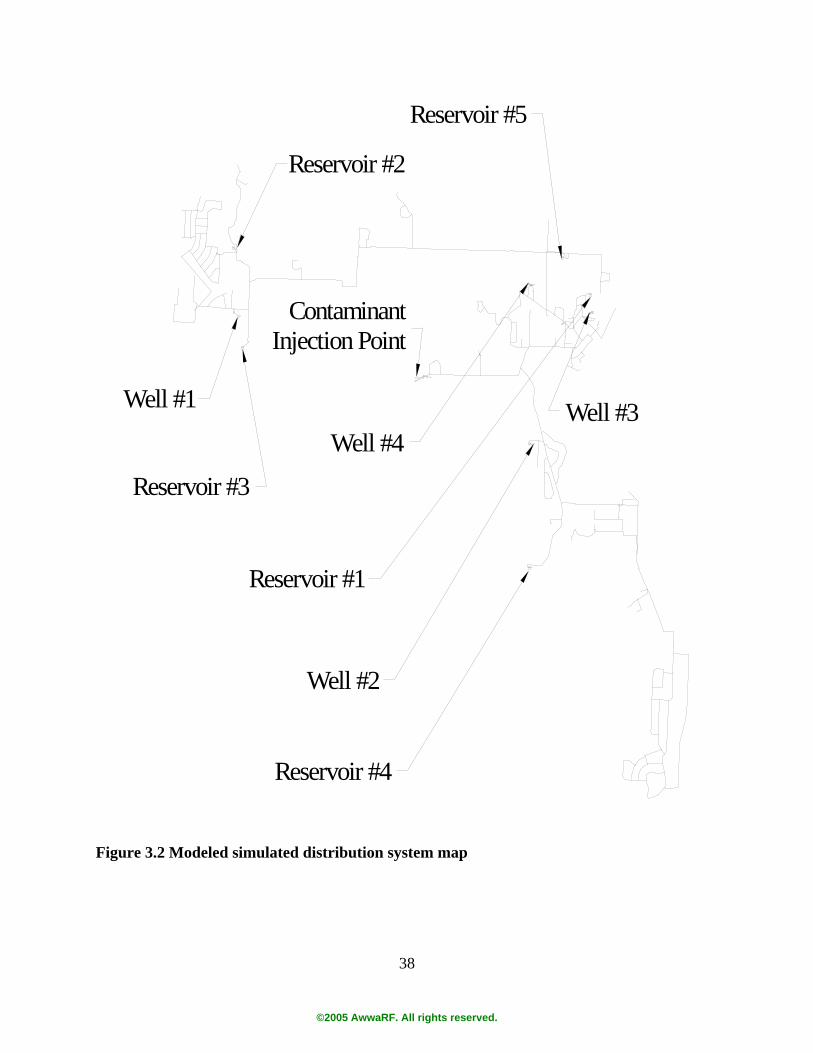
38
Reservoir #3
Reservoir #5
Reservoir #1
Reservoir #4
Well #1
Well #4Well #3
Well #2
Reservoir #2
Contaminant Injection Point
Figure 3.2 Modeled simulated distribution system map
©2005 AwwaRF. All rights reserved.
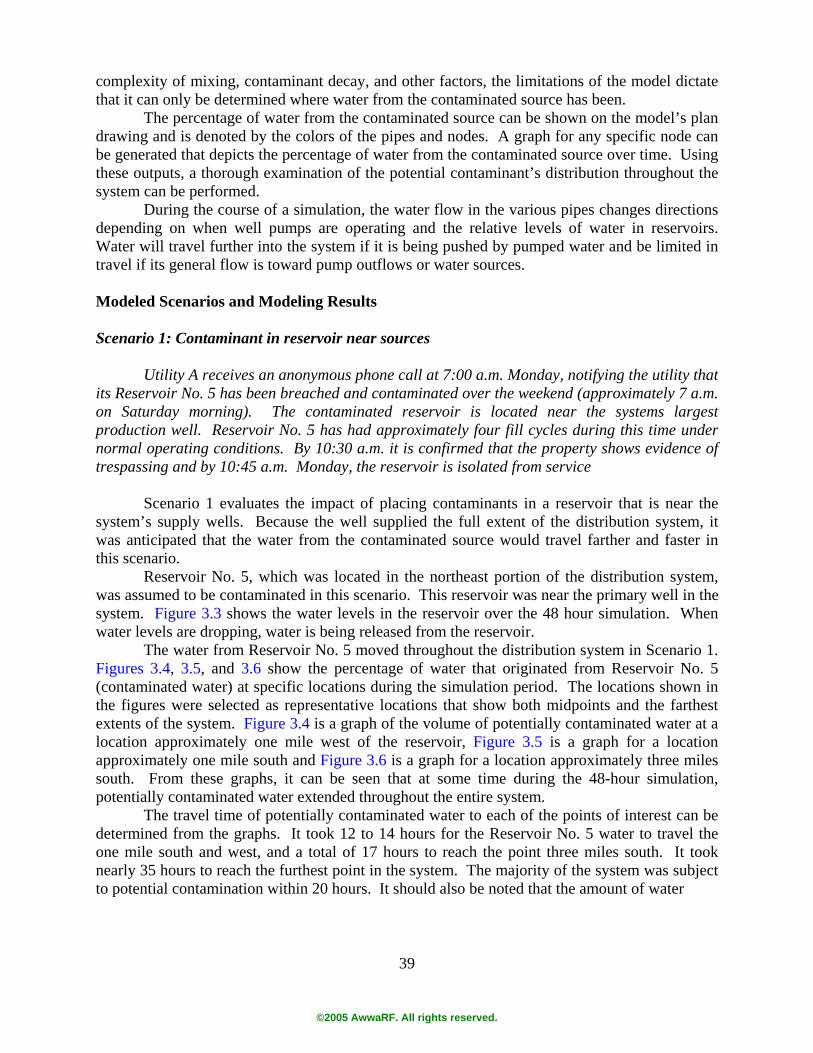
39
complexity of mixing, contaminant decay, and other factors, the limitations of the model dictate that it can only be determined where water from the contaminated source has been.
The percentage of water from the contaminated source can be shown on the model’s plan drawing and is denoted by the colors of the pipes and nodes. A graph for any specific node can be generated that depicts the percentage of water from the contaminated source over time. Using these outputs, a thorough examination of the potential contaminant’s distribution throughout the system can be performed.
During the course of a simulation, the water flow in the various pipes changes directions depending on when well pumps are operating and the relative levels of water in reservoirs. Water will travel further into the system if it is being pushed by pumped water and be limited in travel if its general flow is toward pump outflows or water sources. Modeled Scenarios and Modeling Results
Scenario 1: Contaminant in reservoir near sources
Utility A receives an anonymous phone call at 7:00 a.m. Monday, notifying the utility that its Reservoir No. 5 has been breached and contaminated over the weekend (approximately 7 a.m. on Saturday morning). The contaminated reservoir is located near the systems largest production well. Reservoir No. 5 has had approximately four fill cycles during this time under normal operating conditions. By 10:30 a.m. it is confirmed that the property shows evidence of trespassing and by 10:45 a.m. Monday, the reservoir is isolated from service
Scenario 1 evaluates the impact of placing contaminants in a reservoir that is near the
system’s supply wells. Because the well supplied the full extent of the distribution system, it was anticipated that the water from the contaminated source would travel farther and faster in this scenario.
Reservoir No. 5, which was located in the northeast portion of the distribution system, was assumed to be contaminated in this scenario. This reservoir was near the primary well in the system. Figure 3.3 shows the water levels in the reservoir over the 48 hour simulation. When water levels are dropping, water is being released from the reservoir.
The water from Reservoir No. 5 moved throughout the distribution system in Scenario 1. Figures 3.4, 3.5, and 3.6 show the percentage of water that originated from Reservoir No. 5 (contaminated water) at specific locations during the simulation period. The locations shown in the figures were selected as representative locations that show both midpoints and the farthest extents of the system. Figure 3.4 is a graph of the volume of potentially contaminated water at a location approximately one mile west of the reservoir, Figure 3.5 is a graph for a location approximately one mile south and Figure 3.6 is a graph for a location approximately three miles south. From these graphs, it can be seen that at some time during the 48-hour simulation, potentially contaminated water extended throughout the entire system.
The travel time of potentially contaminated water to each of the points of interest can be determined from the graphs. It took 12 to 14 hours for the Reservoir No. 5 water to travel the one mile south and west, and a total of 17 hours to reach the point three miles south. It took nearly 35 hours to reach the furthest point in the system. The majority of the system was subject to potential contamination within 20 hours. It should also be noted that the amount of water
©2005 AwwaRF. All rights reserved.

40
Time(hr)
(ft)
Hyd
raul
ic G
rade
325.0
326.0
327.0
328.0
329.0
330.0
331.0
332.0
333.0
0.0 5.0 10.0 15.0 20.0 25.0 30.0 35.0 40.0 45.0 50.0
Figure 3.3 Reservoir No. 5 water levels over 48 hour simulation Figure 3.4 Percent of potentially contaminated water at point one mile west of Reservoir No. 5
Time(hr)
(%)
Trac
e
0.0
0.5
1.0
1.5
2.0
2.5
3.0
3.5
4.0
4.5
5.0
5.5
6.0
0.0 5.0 10.0 15.0 20.0 25.0 30.0 35.0 40.0 45.0 50.0
©2005 AwwaRF. All rights reserved.
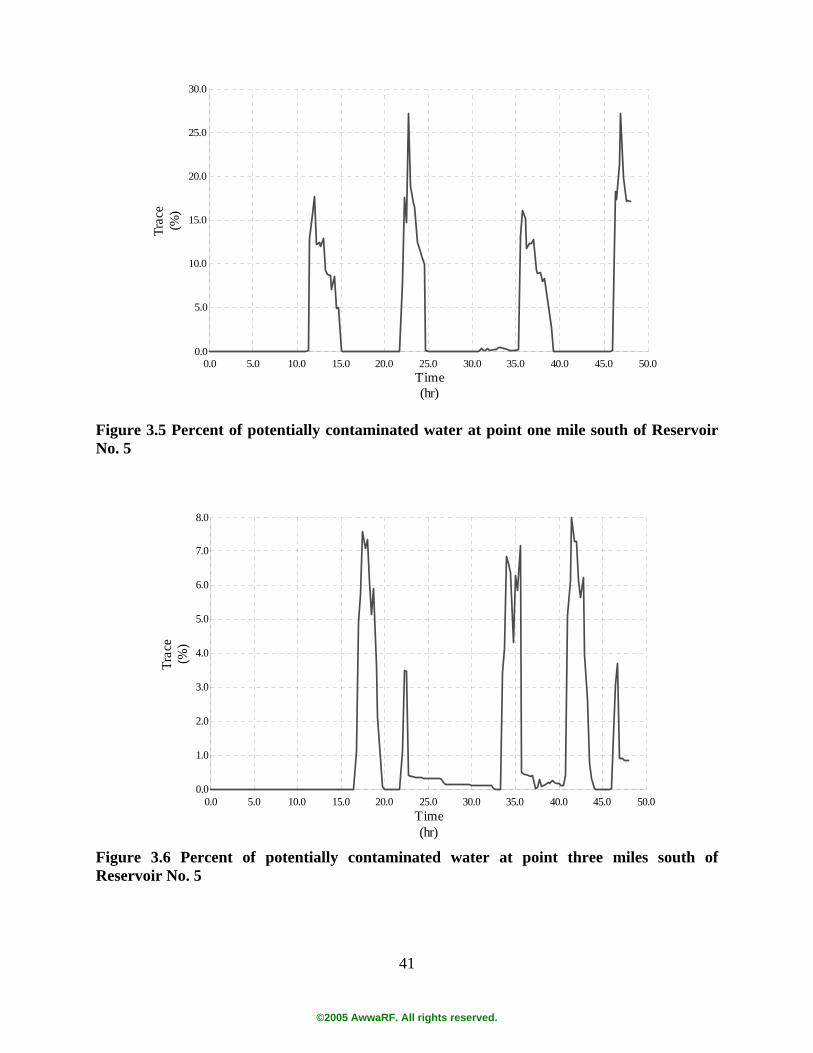
41
Figure 3.5 Percent of potentially contaminated water at point one mile south of Reservoir No. 5
Time(hr)
(%)
Trac
e
0.0
1.0
2.0
3.0
4.0
5.0
6.0
7.0
8.0
0.0 5.0 10.0 15.0 20.0 25.0 30.0 35.0 40.0 45.0 50.0
Figure 3.6 Percent of potentially contaminated water at point three miles south of Reservoir No. 5
Time(hr)
(%)
Trac
e
0.0
5.0
10.0
15.0
20.0
25.0
30.0
0.0 5.0 10.0 15.0 20.0 25.0 30.0 35.0 40.0 45.0 50.0
©2005 AwwaRF. All rights reserved.
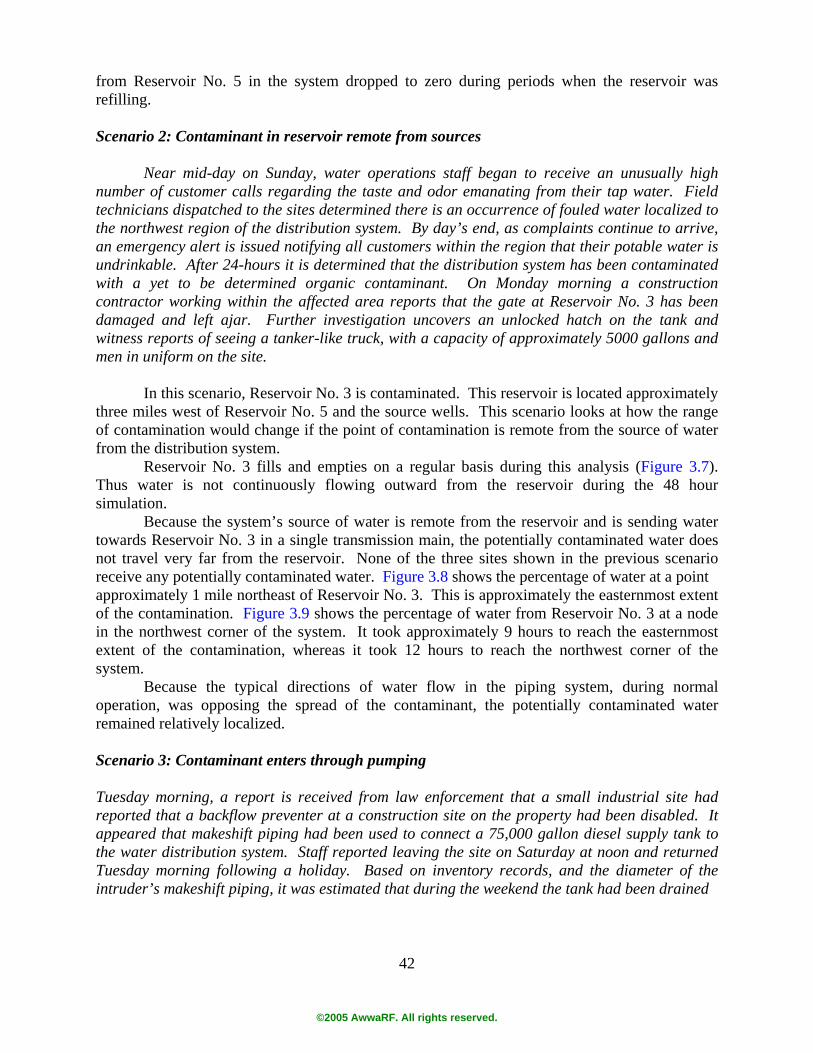
42
from Reservoir No. 5 in the system dropped to zero during periods when the reservoir was refilling. Scenario 2: Contaminant in reservoir remote from sources
Near mid-day on Sunday, water operations staff began to receive an unusually high number of customer calls regarding the taste and odor emanating from their tap water. Field technicians dispatched to the sites determined there is an occurrence of fouled water localized to the northwest region of the distribution system. By day’s end, as complaints continue to arrive, an emergency alert is issued notifying all customers within the region that their potable water is undrinkable. After 24-hours it is determined that the distribution system has been contaminated with a yet to be determined organic contaminant. On Monday morning a construction contractor working within the affected area reports that the gate at Reservoir No. 3 has been damaged and left ajar. Further investigation uncovers an unlocked hatch on the tank and witness reports of seeing a tanker-like truck, with a capacity of approximately 5000 gallons and men in uniform on the site.
In this scenario, Reservoir No. 3 is contaminated. This reservoir is located approximately
three miles west of Reservoir No. 5 and the source wells. This scenario looks at how the range of contamination would change if the point of contamination is remote from the source of water from the distribution system.
Reservoir No. 3 fills and empties on a regular basis during this analysis (Figure 3.7). Thus water is not continuously flowing outward from the reservoir during the 48 hour simulation.
Because the system’s source of water is remote from the reservoir and is sending water towards Reservoir No. 3 in a single transmission main, the potentially contaminated water does not travel very far from the reservoir. None of the three sites shown in the previous scenario receive any potentially contaminated water. Figure 3.8 shows the percentage of water at a point approximately 1 mile northeast of Reservoir No. 3. This is approximately the easternmost extent of the contamination. Figure 3.9 shows the percentage of water from Reservoir No. 3 at a node in the northwest corner of the system. It took approximately 9 hours to reach the easternmost extent of the contamination, whereas it took 12 hours to reach the northwest corner of the system.
Because the typical directions of water flow in the piping system, during normal operation, was opposing the spread of the contaminant, the potentially contaminated water remained relatively localized.
Scenario 3: Contaminant enters through pumping Tuesday morning, a report is received from law enforcement that a small industrial site had reported that a backflow preventer at a construction site on the property had been disabled. It appeared that makeshift piping had been used to connect a 75,000 gallon diesel supply tank to the water distribution system. Staff reported leaving the site on Saturday at noon and returned Tuesday morning following a holiday. Based on inventory records, and the diameter of the intruder’s makeshift piping, it was estimated that during the weekend the tank had been drained
©2005 AwwaRF. All rights reserved.
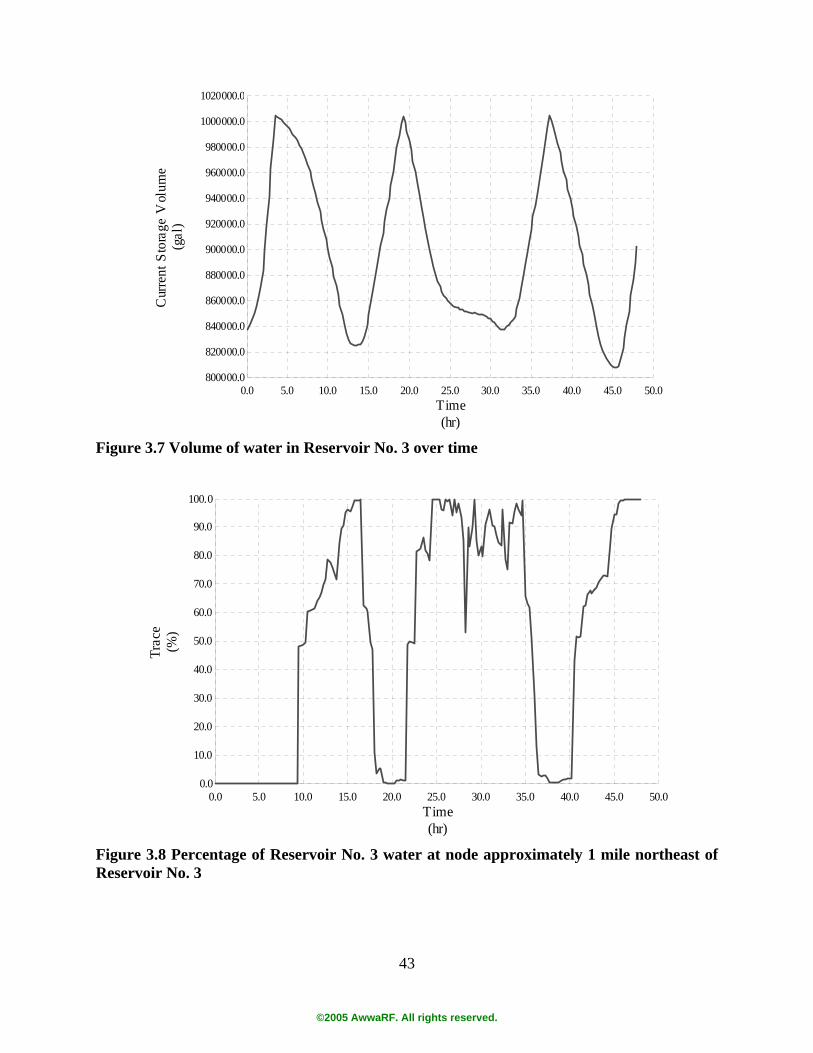
43
Time(hr)
(gal
)C
urre
nt S
tora
ge V
olum
e
800000.0
820000.0
840000.0
860000.0
880000.0
900000.0
920000.0
940000.0
960000.0
980000.0
1000000.0
1020000.0
0.0 5.0 10.0 15.0 20.0 25.0 30.0 35.0 40.0 45.0 50.0
Figure 3.7 Volume of water in Reservoir No. 3 over time
Time(hr)
(%)
Trac
e
0.0
10.0
20.0
30.0
40.0
50.0
60.0
70.0
80.0
90.0
100.0
0.0 5.0 10.0 15.0 20.0 25.0 30.0 35.0 40.0 45.0 50.0
Figure 3.8 Percentage of Reservoir No. 3 water at node approximately 1 mile northeast of Reservoir No. 3
©2005 AwwaRF. All rights reserved.
44
Time(hr)
(%)
Trac
e
0.0
10.0
20.0
30.0
40.0
50.0
60.0
70.0
80.0
90.0
100.0
0.0 5.0 10.0 15.0 20.0 25.0 30.0 35.0 40.0 45.0 50.0
Figure 3.9 Percentage of Reservoir No. 3 water at node approximately 1 mile northwest of Reservoir No. 3 at a rate of 100 gpm. Since approximately 3000 gallons of diesel fuel remained in the tank it was believed that the connection was made on Monday evening.
In this scenario, a contaminant enters the distribution system at a tampered industrial backflow prevention devise used to connect to the system. This scenario assumes that contaminant is drained into the system for a total of 12 hours at a rate of 100 gpm. The industrial site is on the end of a dead-end line that has few customers and is located south of the well sources.
Since the potential contaminant is being drained into the system for a limited period of time, the contaminant is expected to initially move into the system radiating from the point of injection and then mix throughout the system as flows dictate.
Figure 3.10 shows the percentage of contaminated water where the dead-end line (on which the contaminant was introduced) connects to the distributions system. Figure 3.11 shows the percentage of contaminated water ½ mile south of the introduction point.
Contaminant introduced into the distribution system does not flow to the north from the connection point due to the operation of the wells and the reservoirs around the wells. Thus, the extent of the potential contamination is limited to the region south of the introduction point. In addition, because the introduction period stopped after 12 hours, the potentially contaminated water is taken up by the customers and is out of the system (except at some dead ends) before the end of the simulation. The contaminant flows through the distribution system as a plug flow.
©2005 AwwaRF. All rights reserved.
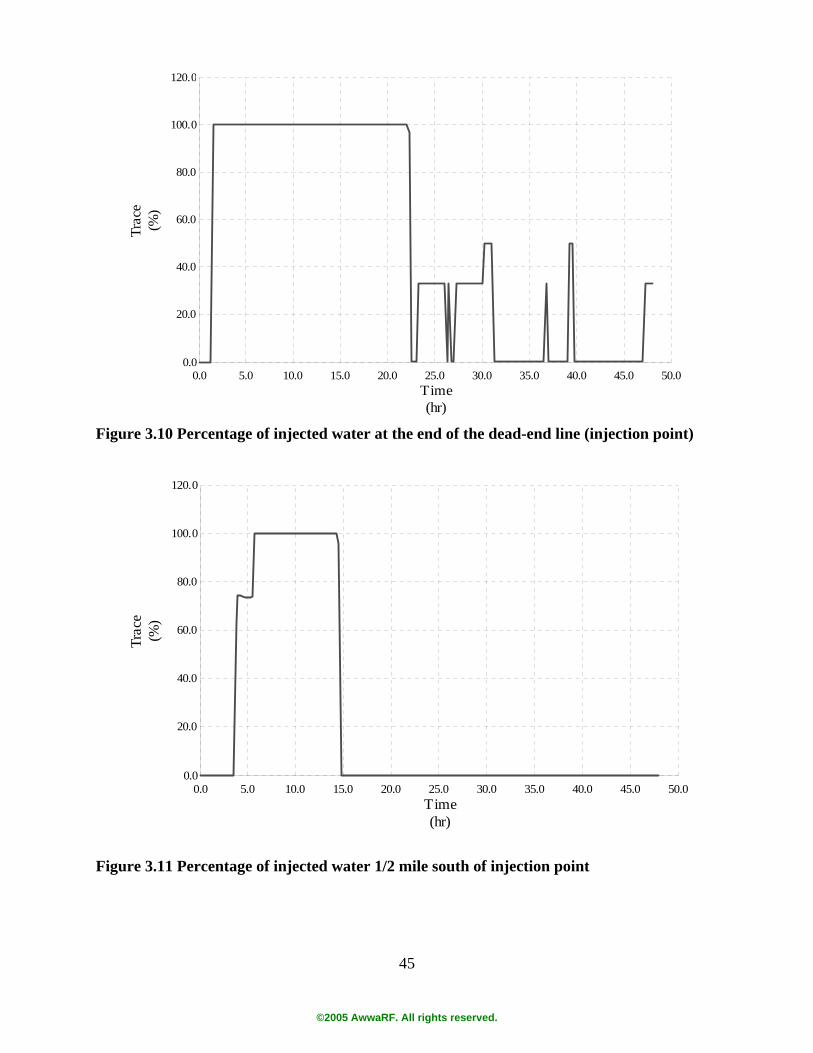
45
Figure 3.10 Percentage of injected water at the end of the dead-end line (injection point)
Time(hr)
(%)
Trac
e
0.0
20.0
40.0
60.0
80.0
100.0
120.0
0.0 5.0 10.0 15.0 20.0 25.0 30.0 35.0 40.0 45.0 50.0
Figure 3.11 Percentage of injected water 1/2 mile south of injection point
Time(hr)
(%)
Trac
e
0.0
20.0
40.0
60.0
80.0
100.0
120.0
0.0 5.0 10.0 15.0 20.0 25.0 30.0 35.0 40.0 45.0 50.0
©2005 AwwaRF. All rights reserved.

46
Scenario 4: Contaminant enters through pumping from tanker truck Tuesday morning, a call comes in reporting an unmarked tanker pumping into a hydrant on a quiet dead end road. An individual was seen attaching the tanker to a hydrant and then pumping an unknown liquid into the hydrant the night before. The liquid is still being pumped into the hydrant in the morning, but the individual is gone. The contents of the tank were being pumped into the system at 10 gpm for approximately 12 hours before utility personnel arrived to detach it.
Modeling Scenario 4, the injection of 10 gpm failed to generate detectable flow in the distribution system due to the volume of water already in the pipe and flow coming into the area. This result points out an interesting limitation of using a hydraulic model in this manner. The model used by the authors was not contaminant specific so the 10 gpm flow into the system was simply evaluated as water flow by the model. The contaminant is obviously in the distribution system at some concentration and is likely appearing at customer taps in the immediate vicinity of the contamination point. Due to demand assumptions made in the model and the non-specific contaminant limitations of the model the results indicate no dispersion. This example points out that if a model is used, common sense must also be applied when evaluating the results.
Scenario 5: Illness determined to be waterborne is traced back to potential sources
Utility A is notified by its local Health Department that a recent outbreak of illness has been identified as being of waterborne origin. The cause of the illness is unknown and attributable cases appear to have occurred during a 24-hour period. Utility A has been provided with estimated locations of exposure. Utility staff are faced with identifying the potential point of contamination, or at least eliminating locations, using modeling software.
Figure 3.12 shows the percentage of water at a particular point within the distribution system that has been provided from a specific source. The point within the distribution system used in this example is located approximately 1 mile south of Reservoir No. 5 and was used in the earlier analysis.
Figure 3.12 can be used to determine how much of the water in the distribution system at any point in time came from a particular source. For example, at thirteen hours, 100% of the water came from Well No. 4 and after twenty hours 100% came from Well No. 3. The primary use of this information is to eliminate some sources. Knowing these percentages and the amount of contaminant in the system, the source of the contamination could be identified.
The capability of hydraulic models to recreate a contamination event and identify the actual point of contamination is limited. The above scenario provides only a basic approach for getting at such a determination. To accurately determine the actual point of contamination is a very complex task and beyond the scope of this investigation. Modeling Conclusions
By modeling a few generic scenarios, generalizations about the flow of water and spread of contamination can be made that may help the utility decide how best to allocate security and capital improvements for the prevention and mitigation of contamination events. For example,
©2005 AwwaRF. All rights reserved.
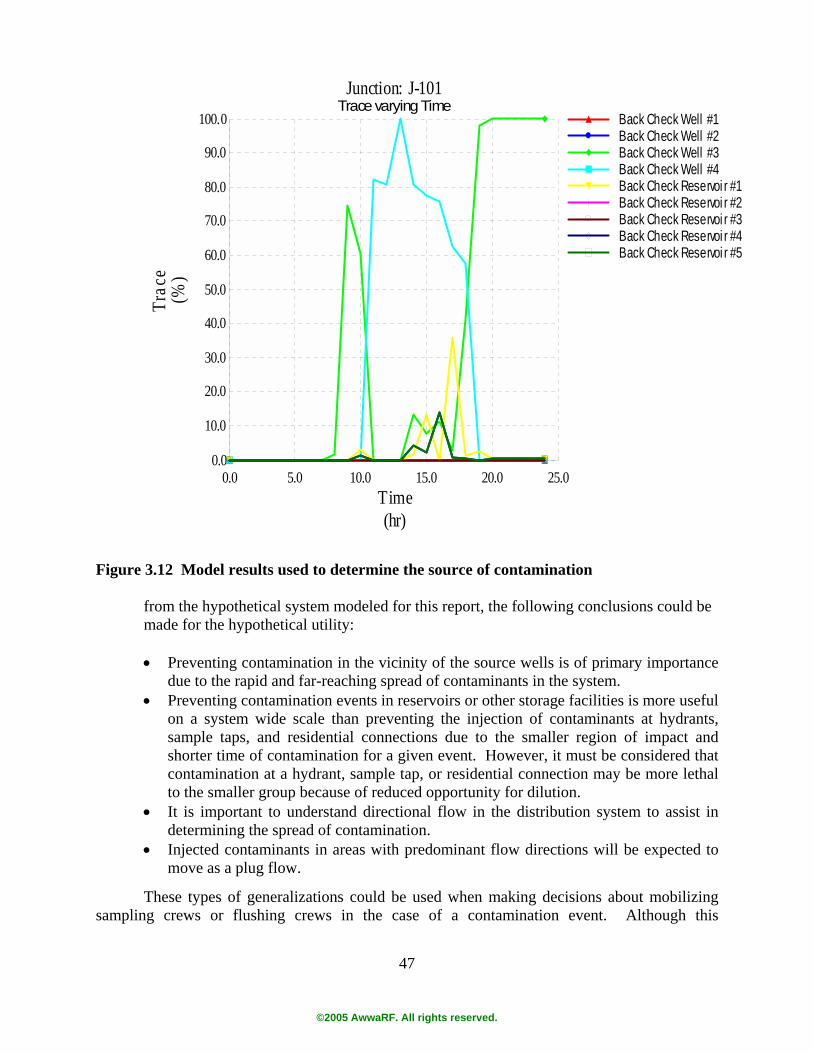
47
Trace varying TimeJunction: J-101
Time(hr)
(%)
Trac
e
0.0
10.0
20.0
30.0
40.0
50.0
60.0
70.0
80.0
90.0
100.0
0.0 5.0 10.0 15.0 20.0 25.0
Back Check Well #1Back Check Well #2Back Check Well #3Back Check Well #4Back Check Reservoi r #1Back Check Reservoi r #2Back Check Reservoi r #3Back Check Reservoi r #4Back Check Reservoi r #5
Figure 3.12 Model results used to determine the source of contamination from the hypothetical system modeled for this report, the following conclusions could be made for the hypothetical utility: • Preventing contamination in the vicinity of the source wells is of primary importance
due to the rapid and far-reaching spread of contaminants in the system. • Preventing contamination events in reservoirs or other storage facilities is more useful
on a system wide scale than preventing the injection of contaminants at hydrants, sample taps, and residential connections due to the smaller region of impact and shorter time of contamination for a given event. However, it must be considered that contamination at a hydrant, sample tap, or residential connection may be more lethal to the smaller group because of reduced opportunity for dilution.
• It is important to understand directional flow in the distribution system to assist in determining the spread of contamination.
• Injected contaminants in areas with predominant flow directions will be expected to move as a plug flow.
These types of generalizations could be used when making decisions about mobilizing
sampling crews or flushing crews in the case of a contamination event. Although this
©2005 AwwaRF. All rights reserved.
48
information could potentially be used to refine customer notification and boil water or do not use orders, it does not seem to be a prudent idea since most utilities would prefer to err on the side of safety and hard to predict flow patterns and dispersion may begin to occur during the unusual demands of an emergency.
SUMMARY The components of the distribution system are vulnerable to intrusion from a variety of different avenues. These intrusions can be perpetrated by either an insider or outsider and include cyber intrusion, gaining physical and/or vehicle access, access by air, or vulnerability due to use as a shared public facility. Distribution system components may also be vulnerable because their location makes it difficult to respond to in a timely manner or a components design, function or location makes it difficult or onerous to monitor. Distribution systems are unique even though they consist of the same general components and perform the same general function. The vulnerability of a distribution system is a function of the system’s component functions, overall operational role in the system, potential for operational or water quality impact, utility risk perception among other utility specific issues. Therefore, it is not possible to determine a standard vulnerability for individual distribution system components that can be applied to all, or even a majority of utilities. Utilities need a tool that allows them to evaluate the vulnerability of their specific distribution system components based on utility specific operational, financial, planning and philosophical considerations. The Vulnerability-Consequence Matrix approach developed in this project provides utilities with a method to identify and prioritize distribution system components based on utility criteria. The tool also enables utility managers to compare different or evolving criteria scenarios.
It is the conclusion of this report that modeling the distribution system can provide a useful example of methods by which hypothetical modeling can be performed to provide guidance for the response to contamination events. By modeling their systems, utilities can obtain information about where to sample in the event of a suspected contamination, which areas should receive priority treatment during contamination events, and which locations of potential contamination are likely to cause the most damage.
©2005 AwwaRF. All rights reserved.
49
CHAPTER 4 SHORT-TERM, LONG-TERM, AND FUTURE DISTRIBUTION SYSTEM
FACILITY SECURITY PRIORITIES
INTRODUCTION The nature of water distribution systems is not one of high turnover or rapid wholesale
change. As evidenced by the experiences of some of the oldest public water utilities in the U.S., distribution system components may be in use for more than half a century, some pipe may serve over a hundred years. Therefore, utilities do not have the “luxury” of designing security features into new facilities with the objective of achieving a secure distribution system through construction of new facilities. In the reality of public and private utilities, water professionals must find ways to secure facilities built over decades during which time drastic changes have occurred in architectural styles, attitudes towards public facilities, incorporation of facilities into surroundings, and finally the view of these facilities as potential strategic targets.
The authors developed a Trident Approach to security activities to assist utilities in establishing a security program that addresses short-term, long-term, and future facility solutions, while accounting for the reality of utility constraints. This approach enables utilities to take actions in the short-term (0-2 years) and implement activities that are relatively inexpensive and often procedural and policy in nature to maximize the security tools currently available. The long-term (2-7 years) objectives enable utilities to evaluate security, redirect resources, change perceptions and institute new approaches and security technologies that will provide a higher level of security adequate for today’s potential threats. The final phase of the Trident Approach addresses future facilities. The objective of this phase is to track development in security technologies; architectural design; construction materials; and the integration of security early in the planning, site selection, design and construction phases of development resulting in a facility secured against design threats. Figure 4.1 illustrates the security Trident Approach.
In order to develop the objectives and elements of the Trident Approach the Project Team convened a two-day Expert Workshop of twenty-two utility security personnel, managers, and operators, security professionals, federal law enforcement, cyber security experts, and security technology experts. The workshop was designed to bring together the vision and reality of distribution security through the exchange of experiences and ideas. The desired outcome of the workshop was the development of objectives and outcomes for improving short-term and long-term security needs at existing facilities and outlining considerations, technologies and strategies for future facilities.
METHODS TO IMPROVE DISTRIBUTION SYSTEM SECURITY IN THE SHORT-TERM
Phase 1 of the Trident Approach addresses activities and improvements that can be
implemented in an initial two-year time frame while maximizing available tools, resources, technologies, policies and procedures to improve security with minimal capital investment. It is anticipated that short-term improvements would be financially feasible within existing utility budgets. Many of the activities included in Phase 1 are planning, awareness building and educational in nature. Some of the activities implemented in these enhancements are multi-
©2005 AwwaRF. All rights reserved.
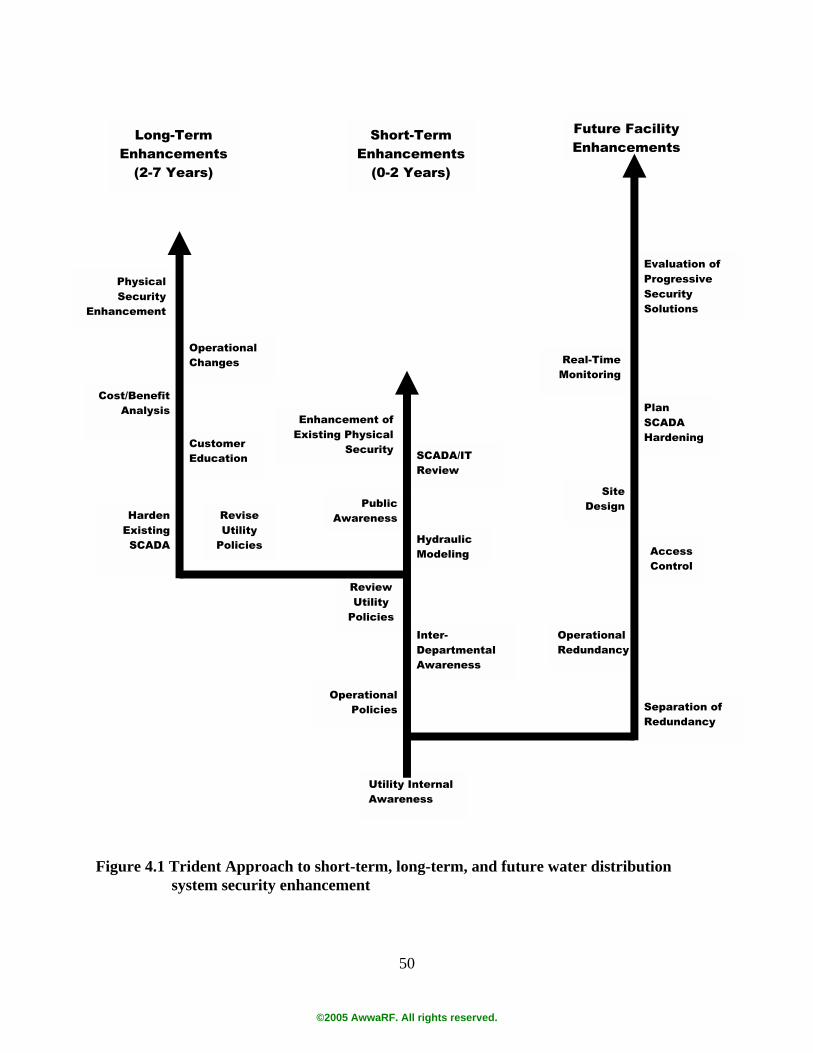
50
Figure 4.1 Trident Approach to short-term, long-term, and future water distribution
system security enhancement
Short-Term Enhancements
(0-2 Years)
Enhancement of Existing Physical
Security
Utility Internal Awareness
Future Facility Enhancements
Long-Term Enhancements
(2-7 Years)
SCADA/IT Review
Cost/Benefit Analysis
Operational Changes
Site Design
Harden Existing SCADA
Customer Education
Operational Policies
Inter-Departmental Awareness
Hydraulic Modeling
Plan SCADA Hardening
Separation of Redundancy
Physical Security
Enhancement
Access Control
Operational Redundancy
Real-Time Monitoring
Evaluation of Progressive Security Solutions
Public Awareness
Review Utility
Policies
Revise Utility
Policies
©2005 AwwaRF. All rights reserved.
51
phased and designed to begin in Phase 1 and to be completed in Phases 2 and 3. These general areas of activity include:
Develop Internal Awareness The completion of federally mandated vulnerability assessments began a serious discussion of water utility security. Utilities can build upon that by raising awareness throughout all levels of the utility.
Review of SCADA/IT Security SCADA systems have been identified as vulnerable points within water utilities. Often security of SCADA systems can be significantly improved by creating a formalized procedure for updating the system through installation of patches against known intrusion methods and proper system configuration.
Conduct System Hydraulic Modeling An accurate and up-to-date hydraulic model can provide valuable planning and response information in the event of a contamination event.
Develop Public Awareness In the past quarter century utilities have done their best to make facilities unobtrusive. This has resulted in public unawareness of facilities, their function or criticality. Utilities can benefit from raising awareness of facility activities with the public to reduce unauthorized access and increase informal observation and reporting of unusual activities.
Raise Municipal Inter-Departmental Awareness
Municipalities can benefit across the utility by raising interdepartmental awareness. The result is not only water department personnel watching water utilities, but all other municipal employees such as wastewater, parks, roads, police, and fire personnel providing facility observation during the course of the work day.
Develop Contractor Security Policies A utility can begin controlling activities of non-utility personnel on-site by implementing policies controlling contractor staff through verified employee background checks, requirements for notification of on-site visitation, and restricted access without utility personnel.
©2005 AwwaRF. All rights reserved.
52
Implement Information and Document Control
Utilities can begin to more tightly control and monitor access to utility information through procedures to limit review, handling, and access to sensitive information.
Implement Operational Security Practices
Even well operated utilities may lack an adequate valve location and exercise program. Knowing the location and condition of system control valves can be an important tool in controlling a contamination event.
Implement Physical Security Improvements
Minor physical security improvements within existing operation and maintenance budgets can increase short-term security simply by repairing damaged security measures and maximizing available tools.
Develop Internal Awareness – Security requirements for the future will be different than
they have been in the past. To be effective this shift in priority will require a shift in perception towards security throughout a utility. Any implemented security enhancements, be they physical, policy/procedural, or operational will only be as effective as the attitudes of personnel working with the enhancements. If the value of security is not communicated, and developed with input from all levels, the success of the enhancements will range from inefficient to failure.
The new security environment requires education and acceptance at all levels. Phase 1 of the Trident Approach therefore identifies the need to build support for the necessity of security enhancements before any other activities are undertaken. The activities associated with the development of internal acceptance were identified as including:
• Building staff awareness of the need for increased security through training and emergency response table-top exercises
• Developing a security plan outlining the objectives for the first twenty-four months • Develop and implement alarm response guidelines for staff and law enforcement • Develop a functional Emergency Response Plan • Document existing distribution system security guidelines • Develop and implement human resource policies regarding employee separation,
changing of passwords, de-activation of access cards and/or key collection • Develop outline and objectives for the long-term security plan Review SCADA/ IT Security – SCADA and IT systems have been identified as critical
security concerns. This potential security weakness results from SCADA systems not being designed with the robustness of other computing systems, the lack of system maintenance, slack operational security practices, etc. Methods for enhancing SCADA/IT security can range from complete replacement of a system because it is obsolete and no longer supported, to simply remaining current on weekly updates of security patches and anti-virus and similar preventative maintenance.
©2005 AwwaRF. All rights reserved.
53
SCADA/IT security in Phase 1 of the Trident Approach is designed to identify early, and plan for capital improvements or develop an immediate plan for addressing potentially significant, but relatively inexpensive fixes to operational and policy weaknesses.
The following outline was developed to assist utilities in conducting a Phase 1 assessment of the SCADA/IT networks:
• Identify outside interdependency and potential connections ! System access by, and through, vendors or contractors ! Key staff on-site and remote access ! Perform security background checks of each of the above
• Perform testing of system security ! Conduct in-depth cyber vulnerability assessment including network scans ! Conduct password audits ! Conduct penetration tests
• Identify and install appropriate access controls on intranet and internet ! Evaluate web pages of vendors, other municipality functions, other
municipalities, contractors, file transfer protocol sites for plans and specification sharing.
• Establish, if needed, and enforce, SCADA/IT policies ! Establish secure password policy including use of robust passwords ! Formalize procedure for regular system maintenance and patch installation ! Update virus protection regularly ! Develop and test disaster recovery facilities (off-site back-ups)
• Install access control programs ! Program firewalls ! Install, test and monitor intrusion detection systems ! Initiate two factor authentication
• Secure all remote communications including modems, attached computers such as laptops and home computers
• Encrypt wireless connections • Develop plan to physically protect SCADA/IT assets using card key access systems
and intrusion switches Conduct Emergency Response Drills and Hydraulic Modeling – Emergency response
drills and hydraulic modeling activities are recommended to enable the utility to refine emergency response responsibilities under various scenarios. The activities also enable the utility to establish an operational baseline for the operating the distribution system under potential contamination events or loss of facilities. Utilities that have not conducted emergency response drills or developed appropriate emergency response structure may consider implementing the National Response Team’s Incident Command System/Unified Command (ICS/UC) Approach (NRT, 2004).
A recent example demonstrating the importance and value of an accurate, functional and drilled emergency response plan (ERP) occurred during the August 14, 2003 blackout in the northeastern United States. A consultant to the Cleveland Division of Water had completed a new ERP two weeks prior. During the blackout the utility experienced a 12-16 hour power outage to the whole of their 100% pumped distribution system. At the time of the blackout the
©2005 AwwaRF. All rights reserved.
54
ERP was determined to be poorly organized and not functional under emergency conditions. The utility was faced with managing the crisis “on the fly” without the benefit of a structured communication network or drilled responses. The Cleveland Division of Water successfully weathered the blackout due to the experience and dedication of the staff who demonstrated the necessary expertise in the absence of formal documentation. This utility experience stresses the criticality of a functional, implemented and practiced ERP organized in clear, concise format.
Build Public Awareness – When utility personnel make security changes within the distribution system, customer questions may arise. Additionally, if the utility undertakes capital security enhancements rates may be impacted. Through public awareness programs, utilities may also benefit from reducing low level criminal activity associated vandalism and curiosity trespassing. In order to achieve the objectives of building public awareness, the utility may undertake activities such as:
• Security related bill inserts • Educating customers regarding the appearance of employees and vehicles in the field • Posting of security related information on the utility Web page • Conducting door to door informational visits in areas with a history of unauthorized
activity at the facility • High school/grade school education programs • Presentation at neighborhood/community meetings • Educating law enforcement and fire department/personnel Develop Inter-Departmental and Inter-Utility Awareness – Prevention and response to
water distribution system emergencies, depending on the scale, can require varying levels of involvement from other nearby public works departments or neighboring water utilities. Advance activity planning can enhance the efficiency, type, and level of support should it be needed. This awareness can be begun with the following activities:
• Development, and/or participation in, a regional Water Informational Security
Activity Clearinghouse (ISAC) in order to better coordinate regional activities and potential pertinent threats
• Establish cooperative assistance agreements with other utility departments and neighboring utilities
• Identify utility inter-connections and interdependencies Develop Policy for Contractor and Vendor Background Checks – Utilities typically allow
contractor and vendor personnel on-site, often unsupervised, without knowing the background of these individuals. While a utility cannot directly conduct background checks on these individuals, through contract requirements the utility may be able to impose background check verification requirements on contracts.
Restrict Access to Sensitive Information and Documents - Often documents such as system mapping, as-built drawings, network structure, and operational data are available to contractors, vendors, consultants, and developers upon request or through utility staff for project purposes. Commonly, these documents are not returned or tracked by the utility. To increase security of these documents a utility can implement a program defining how and where the
©2005 AwwaRF. All rights reserved.
55
documents are available for viewing, restrictions on copying and the tracking and return of all sensitive information provided for project procedures.
Develop Program to Inspect and Exercise Distribution System Valves - Events occur in the distribution system that can impact the utilities ability to operate the distribution system effectively in the event of an emergency. Utilities routinely visit critical distribution system components such as storage reservoirs, pump stations, booster disinfection facilities, etc. However, the regular locating, inspection, and exercising of distribution system valves can be less than adequate. In conjunction with hydraulic modeling exercises it is recommended that utilities formalize a plan to regularly locate, inspect, maintain and exercise distribution system valves. This activity will enable utilities to efficiently operate the distribution in the event of an emergency.
Implement Physical Security – The final distribution system protection element identified for consideration as a Phase 1 activity was the implementation of physical security enhancements. These activities can be described as low level, basic security measures designed minimally to delay intruders. These basic security items, that if already in place should have their functionality verified:
• Install tamper seals on hydrants • Install hydrant locks • Install locks on valves/PRVs • Install locks on vaults • Provide security notice on sites • Install locks on reservoir air vents/hatches • Repair damaged perimeter fencing • Remove ladders from tanks • Harden chemical booster facilities • Begin to back-up pumps and other key equipment (power and redundancy) • Special consideration of dual-use/public access facilities
Phase 1 short-term activities also include preliminary planning and evaluation activities
for possible implementation in Phase 2. These activities include: • Begin to research alternative, more secure hydrant designs • Identify locations for future real-time water quality/contaminant monitoring • Evaluate the hydraulic and operational potential for rapid isolation of finished water
storage reservoirs • Evaluate the possibility for reducing excess chemical storage by moving to “just-in-
time” deliveries or on-site generation • Evaluate chemical/disinfection alternatives to remove hazardous chemicals from the
distribution system • Review chemical delivery specifications, and revise as necessary, to reflect new
security concerns The authors and workshop panelists were conscious that even in the short-term a given
utility may not be able to address all issues outlined for maximizing security in Phase 1.
©2005 AwwaRF. All rights reserved.

56
Therefore, considering the political ramifications, institutional resistance and limitations on resources, the specific short-term activities were prioritized to enable utilities to realize maximum benefit from activities that could be undertaken. These priorities were organized to provide the most improvement to system security in the shortest time possible within existing budgets. The recommended priorities for short-term security enhancements within a water distribution system are outlined in Table 4.1.
Table 4.1. Prioritized short-term security enhancements for existing distribution system components
Type of Activity Priority Activity
Planning Communication Training/ Education
Physical Enhancement Operational
1. Promote staff awareness of heightened security level " 2. Promote public awareness of utility facility activity and security
"
3. Conduct Emergency Response and Communications Planning " " 4. Install of tamper seals on fire hydrants " " 5. Develop means of internal and external (including local and federal law enforcement) two-way exchange of threat information
"
6. Establish, implement and enforce SCADA/IT policies " " " 7. Develop an Intrusion Incident Response Plan in coordination with local fire/police
" " "
8. Formalize and conduct equipment inspection and exercising
"
9. Reduce excess chemical storage in the distribution system " 10. Develop and be familiar with an accurate system hydraulic model for use under emergency response scenarios
" "
As Table 4.1 shows the emphasis of short-term activities is not the immediate
implementation of physical security fixes but on planning, training/education, and operational knowledge.
It was the consensus of the workshop panelists that the most important and immediate security improvement that could be made was the proper training of staff so that personnel understand the importance of the heightened security and the need to address potential security issues. Training of this nature could include:
©2005 AwwaRF. All rights reserved.
57
• Key handling • Response to vandalism or suspected intrusion • Reporting of all evidence of site intrusions • Actively question and verify authorization of non-utility personnel on site. No longer
assume someone else has provided permission • Familiarity with available emergency resources, such as emergency response plans,
water system plans, and vulnerability assessments Public awareness was identified as the second most important and immediate security
improvement to be made. This included public education programs such as education of students of the consequences of vandalizing and trespassing on water utility properties. This may also include the organization of neighborhood watch programs in the vicinity of water facilities or the education of the public as to how to identify water utility employees and what to do in the event of a witnessed trespass or intrusion.
The third most important security improvement on the prioritized list was Emergency Response and Communications Planning (ERCP). The development of an ERCP is essential in the response to any contamination, intrusion, disruption, or other emergency event. The existence of an ERCP is a critical tool in clarifying roles, responsibilities, and activities during time sensitive events.
METHODS TO IMPROVE DISTRIBUTION SYSTEM SECURITY IN THE LONG-TERM
Activities addressing existing distribution system components that can be implemented in
the longer-term comprise the Phase 2 prong of the distribution system security Trident Approach. These activities and/or improvements are envisioned to take place during years 2-7 because they could not be completed in the time frame for short-term activities and/or the activities require greater resource allocation and potentially inclusion in capital improvement planning.
The activities of Phase 2 can be categorized as:
Implement operational changes for normal and emergency operating conditions
With the development of a functional ERCP utilities can establish operational baselines and develop response scenarios that can mitigate distribution system intrusions.
Develop utility and customer understanding of costs
Physically securing distribution system components can potentially be a large capital expenditure with impact to customers. Utilities need to develop an understanding of these capital and operation and maintenance costs and then educate customers about the rate implications associated with increased security.
Implement internal hiring background check and site visitation policies
A utility policy of new hire background checks is implemented to complement the previously implemented contractor background checks.
©2005 AwwaRF. All rights reserved.

58
Implement physical security measures During the long-term phase of security enhancement utilities begin to implement physical security enhancements beginning with utility specific priorities.
Harden SCADA/IT security SCADA/IT systems are hardened against attack, intrusion detection capabilities are activated, and issues of encryption, authentication, back-up communications, and elimination of single points of failure are identified.
Implement Operational Standards for Normal and Emergency Scenarios – The
implementation of operational enhancements to enable a utility to better protect the distribution system or respond to an emergency is a central activity in Phase 2 of the Trident Approach. The operational activities are varied and activities in addition to those listed here may be identified for a given utility.
• Implement real-time monitoring for residual disinfectant levels at critical points in the distribution system including finished water storage reservoirs
• Develop adequate power and communications back-up • Develop ability to bring disinfection resources to contaminated areas • Clarify emergency response communication protocols with utility personnel and
authorities • Develop and implement security and operational “security culture” training similar to
safety programs • Make operational changes to increase ability to wheel water • Develop baseline understanding of water quality in the distribution system Develop Understanding of Cost – Utilities are now aware of the capital security needs
following completion of their vulnerability assessments. Utilities can now begin to evaluate the real cost of enhancements and develop a well-stated risk based cost/benefit understanding of “security” for their water distribution system. Once this understanding is developed, a utility can begin to involve the community in discussions regarding acceptable level of protection, costs of associated enhancements and the societal changes related to those enhancements.
Develop Internal Background Check Policies – Background checks of utility personnel will be a more sensitive issue than requiring background checks of vendor and contractor personnel. However, implementing a policy of background checks at the time of hiring could be a valuable tool especially for larger utilities with larger staffs and diverse responsibilities. Additionally, utilities may also consider periodic background checks on current employees.
Implement Personnel On-site Policies – While pre-hiring background checks provide an indication of past behavior they are not a guarantee or predictor of future behavior and attitudes. To address personnel activity in the field, on an on-going basis the utility may consider a “two-man rule” for site visitations. This type of policy would require that at least two personnel be present during any site visitations or activities.
©2005 AwwaRF. All rights reserved.
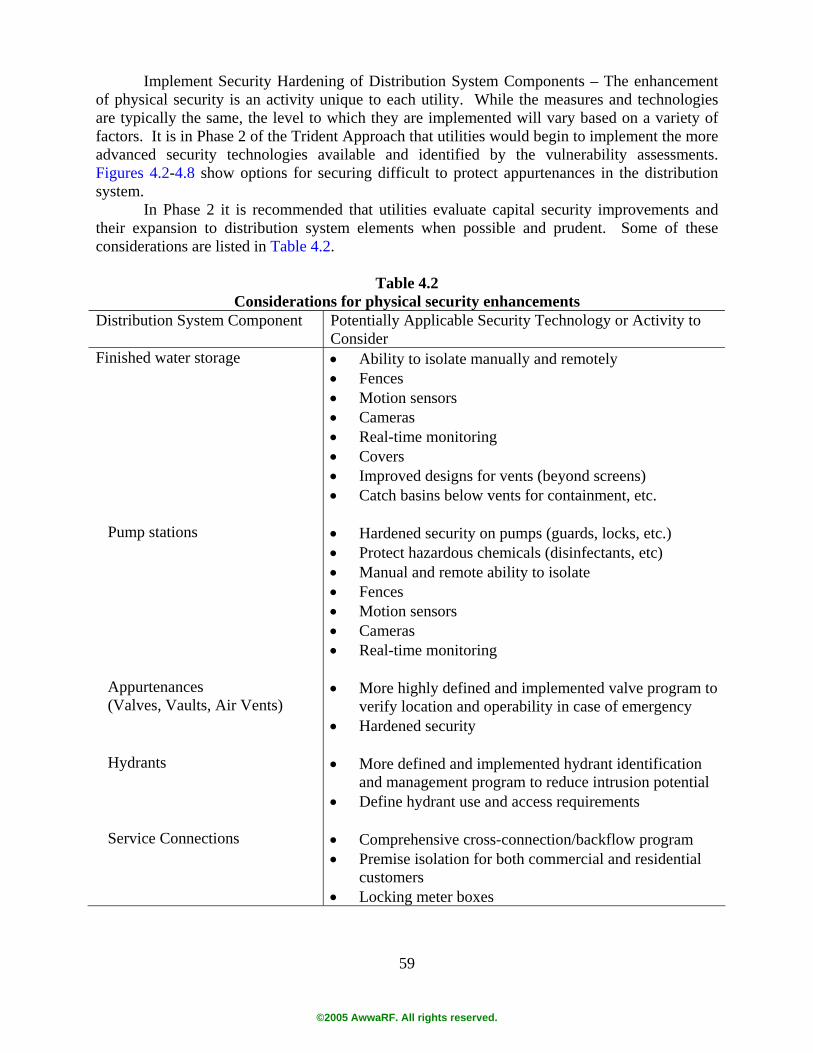
59
Implement Security Hardening of Distribution System Components – The enhancement of physical security is an activity unique to each utility. While the measures and technologies are typically the same, the level to which they are implemented will vary based on a variety of factors. It is in Phase 2 of the Trident Approach that utilities would begin to implement the more advanced security technologies available and identified by the vulnerability assessments. Figures 4.2-4.8 show options for securing difficult to protect appurtenances in the distribution system.
In Phase 2 it is recommended that utilities evaluate capital security improvements and their expansion to distribution system elements when possible and prudent. Some of these considerations are listed in Table 4.2.
Table 4.2 Considerations for physical security enhancements
Distribution System Component
Potentially Applicable Security Technology or Activity to Consider
Finished water storage
• Ability to isolate manually and remotely • Fences • Motion sensors • Cameras • Real-time monitoring • Covers • Improved designs for vents (beyond screens) • Catch basins below vents for containment, etc.
Pump stations
• Hardened security on pumps (guards, locks, etc.) • Protect hazardous chemicals (disinfectants, etc) • Manual and remote ability to isolate • Fences • Motion sensors • Cameras • Real-time monitoring
Appurtenances (Valves, Vaults, Air Vents)
• More highly defined and implemented valve program to verify location and operability in case of emergency
• Hardened security
Hydrants
• More defined and implemented hydrant identification and management program to reduce intrusion potential
• Define hydrant use and access requirements
Service Connections • Comprehensive cross-connection/backflow program • Premise isolation for both commercial and residential
customers • Locking meter boxes
©2005 AwwaRF. All rights reserved.
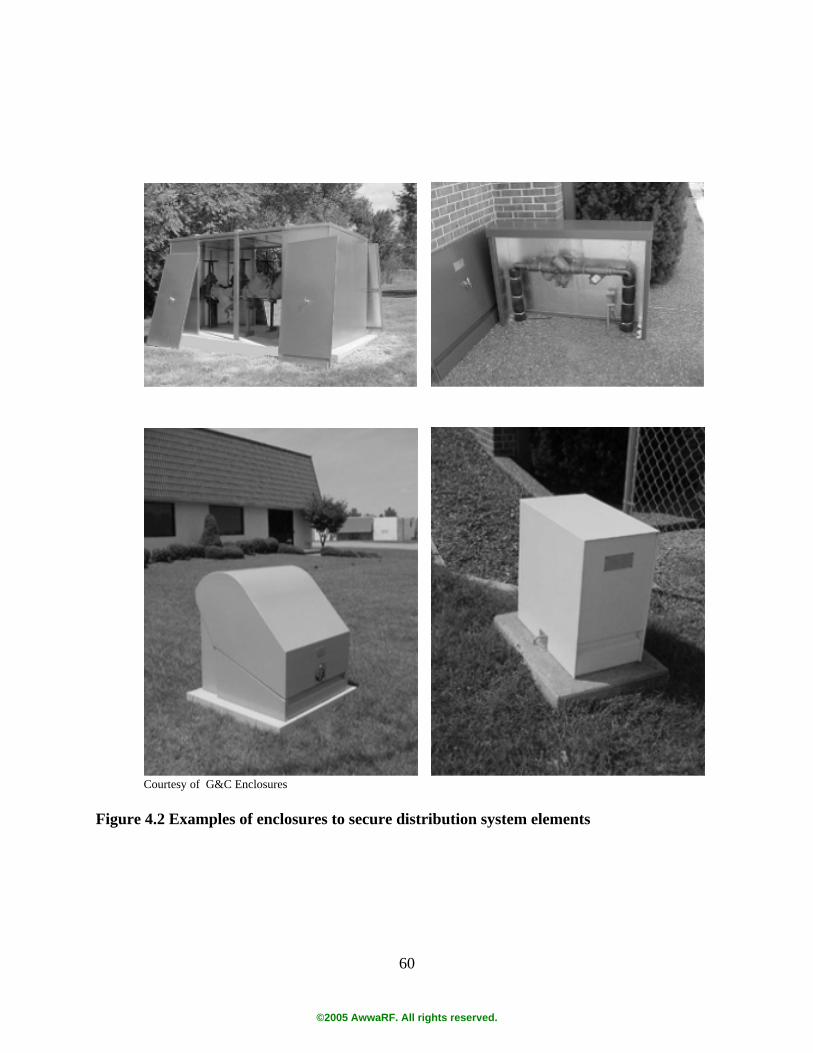
60
Courtesy of G&C Enclosures
Figure 4.2 Examples of enclosures to secure distribution system elements
©2005 AwwaRF. All rights reserved.
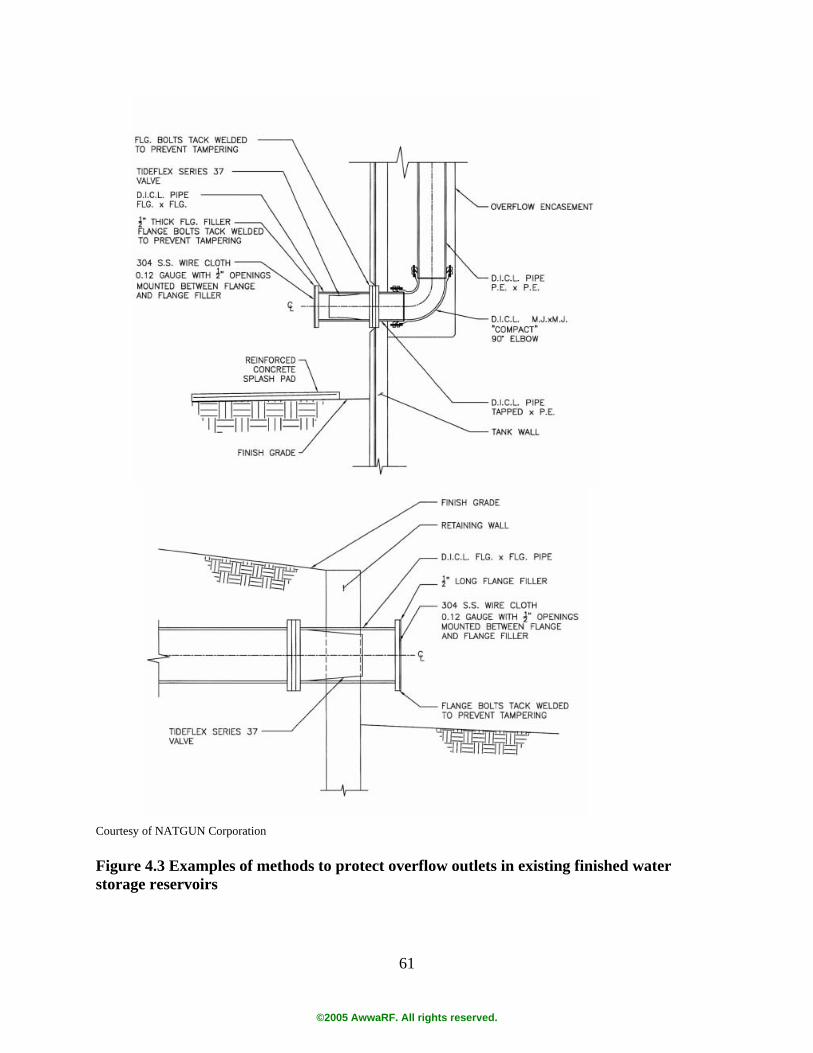
61
Courtesy of NATGUN Corporation Figure 4.3 Examples of methods to protect overflow outlets in existing finished water storage reservoirs
©2005 AwwaRF. All rights reserved.
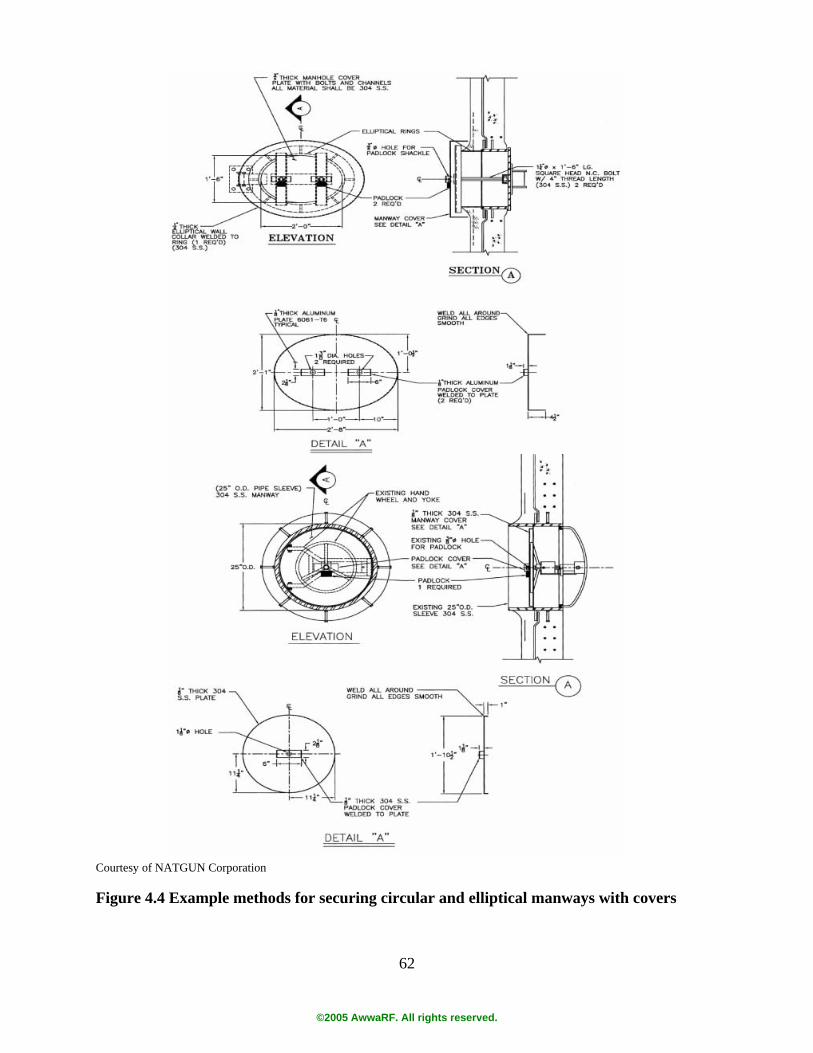
62
Courtesy of NATGUN Corporation Figure 4.4 Example methods for securing circular and elliptical manways with covers
©2005 AwwaRF. All rights reserved.
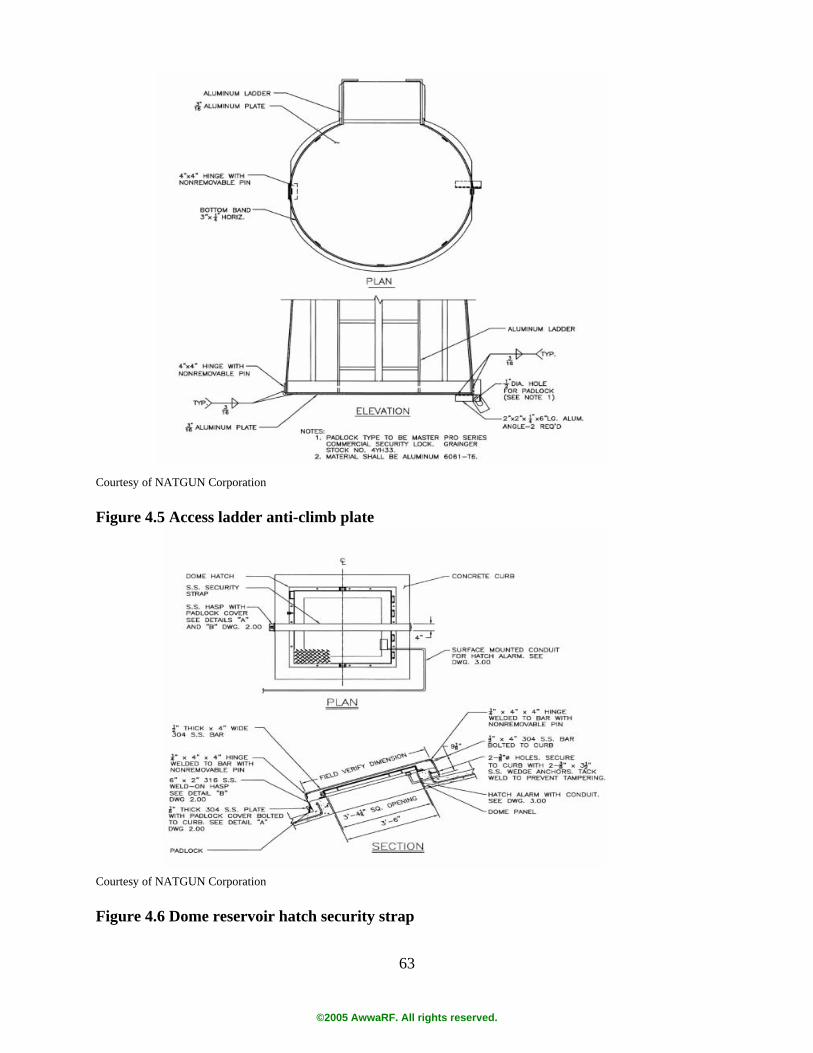
63
Courtesy of NATGUN Corporation Figure 4.5 Access ladder anti-climb plate Courtesy of NATGUN Corporation Figure 4.6 Dome reservoir hatch security strap
©2005 AwwaRF. All rights reserved.

64
Courtesy of NATGUN Corporation Figure 4.7 Security vent and secure vent enclosure design
©2005 AwwaRF. All rights reserved.
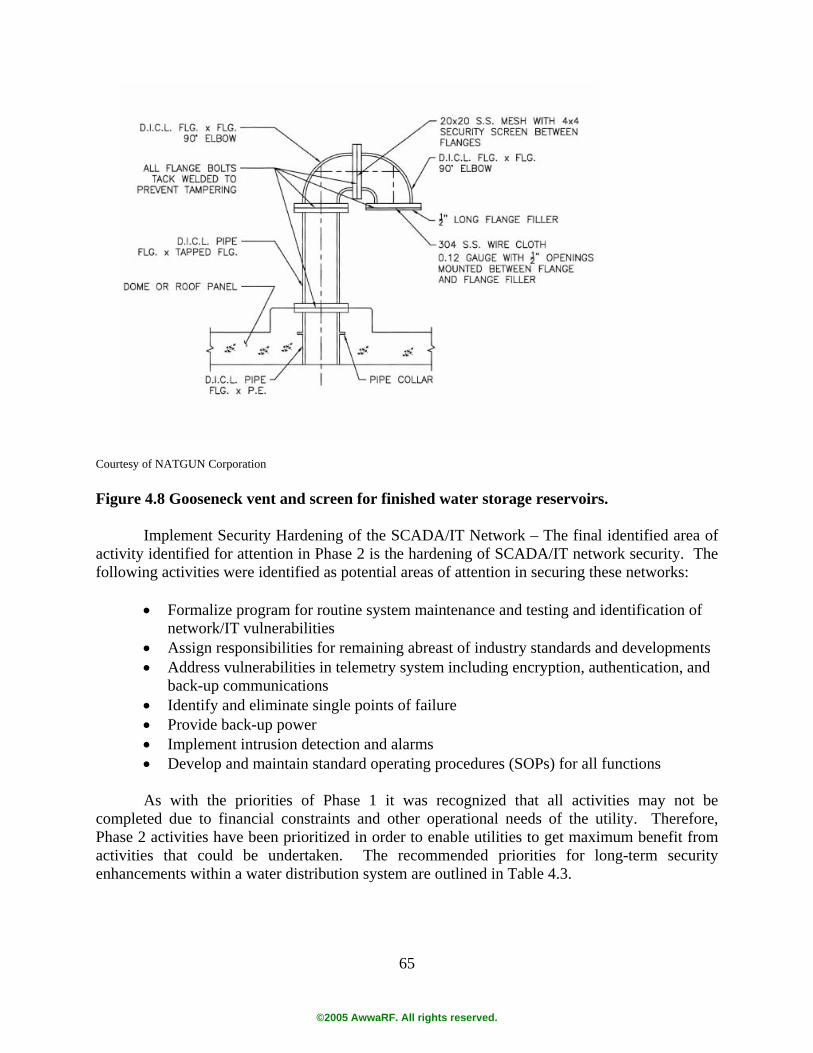
65
Courtesy of NATGUN Corporation Figure 4.8 Gooseneck vent and screen for finished water storage reservoirs.
Implement Security Hardening of the SCADA/IT Network – The final identified area of activity identified for attention in Phase 2 is the hardening of SCADA/IT network security. The following activities were identified as potential areas of attention in securing these networks:
• Formalize program for routine system maintenance and testing and identification of
network/IT vulnerabilities • Assign responsibilities for remaining abreast of industry standards and developments • Address vulnerabilities in telemetry system including encryption, authentication, and
back-up communications • Identify and eliminate single points of failure • Provide back-up power • Implement intrusion detection and alarms • Develop and maintain standard operating procedures (SOPs) for all functions As with the priorities of Phase 1 it was recognized that all activities may not be
completed due to financial constraints and other operational needs of the utility. Therefore, Phase 2 activities have been prioritized in order to enable utilities to get maximum benefit from activities that could be undertaken. The recommended priorities for long-term security enhancements within a water distribution system are outlined in Table 4.3.
©2005 AwwaRF. All rights reserved.
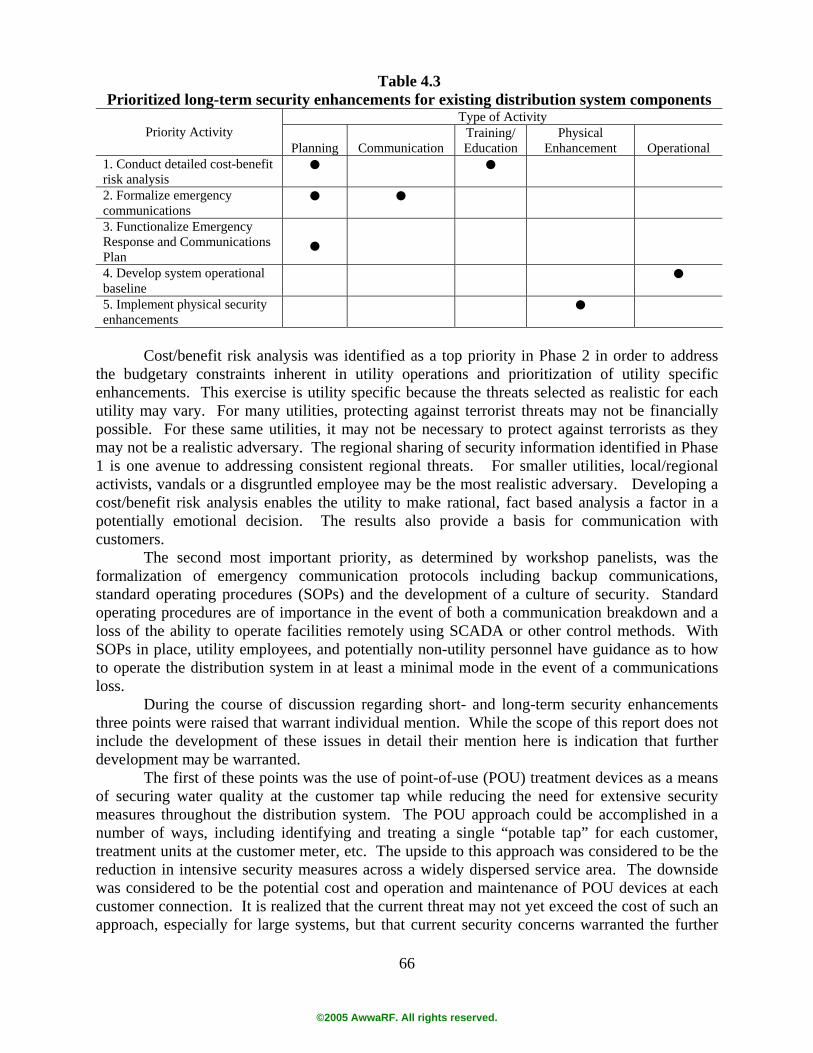
66
Table 4.3 Prioritized long-term security enhancements for existing distribution system components
Type of Activity Priority Activity
Planning Communication Training/ Education
Physical Enhancement Operational
1. Conduct detailed cost-benefit risk analysis
" "
2. Formalize emergency communications
" "
3. Functionalize Emergency Response and Communications Plan
"
4. Develop system operational baseline
"
5. Implement physical security enhancements
"
Cost/benefit risk analysis was identified as a top priority in Phase 2 in order to address
the budgetary constraints inherent in utility operations and prioritization of utility specific enhancements. This exercise is utility specific because the threats selected as realistic for each utility may vary. For many utilities, protecting against terrorist threats may not be financially possible. For these same utilities, it may not be necessary to protect against terrorists as they may not be a realistic adversary. The regional sharing of security information identified in Phase 1 is one avenue to addressing consistent regional threats. For smaller utilities, local/regional activists, vandals or a disgruntled employee may be the most realistic adversary. Developing a cost/benefit risk analysis enables the utility to make rational, fact based analysis a factor in a potentially emotional decision. The results also provide a basis for communication with customers.
The second most important priority, as determined by workshop panelists, was the formalization of emergency communication protocols including backup communications, standard operating procedures (SOPs) and the development of a culture of security. Standard operating procedures are of importance in the event of both a communication breakdown and a loss of the ability to operate facilities remotely using SCADA or other control methods. With SOPs in place, utility employees, and potentially non-utility personnel have guidance as to how to operate the distribution system in at least a minimal mode in the event of a communications loss.
During the course of discussion regarding short- and long-term security enhancements three points were raised that warrant individual mention. While the scope of this report does not include the development of these issues in detail their mention here is indication that further development may be warranted.
The first of these points was the use of point-of-use (POU) treatment devices as a means of securing water quality at the customer tap while reducing the need for extensive security measures throughout the distribution system. The POU approach could be accomplished in a number of ways, including identifying and treating a single “potable tap” for each customer, treatment units at the customer meter, etc. The upside to this approach was considered to be the reduction in intensive security measures across a widely dispersed service area. The downside was considered to be the potential cost and operation and maintenance of POU devices at each customer connection. It is realized that the current threat may not yet exceed the cost of such an approach, especially for large systems, but that current security concerns warranted the further
©2005 AwwaRF. All rights reserved.
67
examination of utility owned and maintained POUs. For smaller systems, a POU security approach may be more realistic, especially if customer concern is high.
The second issue identified for further investigation was the development of water industry SCADA security standards. Currently, the water industry lacks standards for securing SCADA systems. Such an undertaking would require input from utilities, SCADA vendors, and security professionals amongst others.
The final outstanding security issue was defined as the need for the development of security technologies to meet the specific needs of the water industry. The heightened sense of security needs was unexpected, if not by the water industry as a whole, at least by individual utilities. In an effort to provide increased security, utilities have applied general security techniques and techniques of other industries to water facilities. While this practice has largely served to meet immediate security needs there are some unique aspects of water facilities that may be better addressed by development of security measures specialized for water utility application, such as storage access, venting and other appurtenances, monitoring, surveillance, and perimeter control. To address this issue and begin to develop applicable security measures, if necessary, a formalized effort could be undertaken to bring together appropriate security and utility professionals to identify needs. The objective would be to get in front of development to enable manufacturers to provide what is needed by utilities. The outcome would be functional, specialized security technologies for utilities and focused product development targets for manufacturers. SECURITY RECOMMENDATIONS FOR NEW DISTRIBUTION SYSTEM COMPONENTS
Phase 3 of the security Trident Approach addresses the enhancement of future
components with the objective of making them more secure against intrusion. While Phases 1 and 2 addressed the sequential priorities of addressing existing components during the initial two year period and then the following five year period, Phase 3 is designed to be an on-going process beginning immediately, and concurrent with Phases 1 and 2.
The workshop panelists were instructed to open up to all possibilities and not be limited by traditional conventions. The only constraint was that recommendations should be developed to address security concerns as they are currently understood. The panelists were instructed to develop recommendations on the premise that finance and time constraints were not of primary concern.
The recommendations developed during the workshop address security enhancements that can be implemented during the replacement/refurbishment of existing facilities or the construction of new facilities. The recommendations range from far-reaching to available today; controversial to widely accepted practice; planning to on-the-ground improvements. The recommendations can be generally organized under three categories:
• Access control • Strategic operational planning • Progressive security solutions
Table 4.4 summarizes the features of these future facility security categories.
©2005 AwwaRF. All rights reserved.
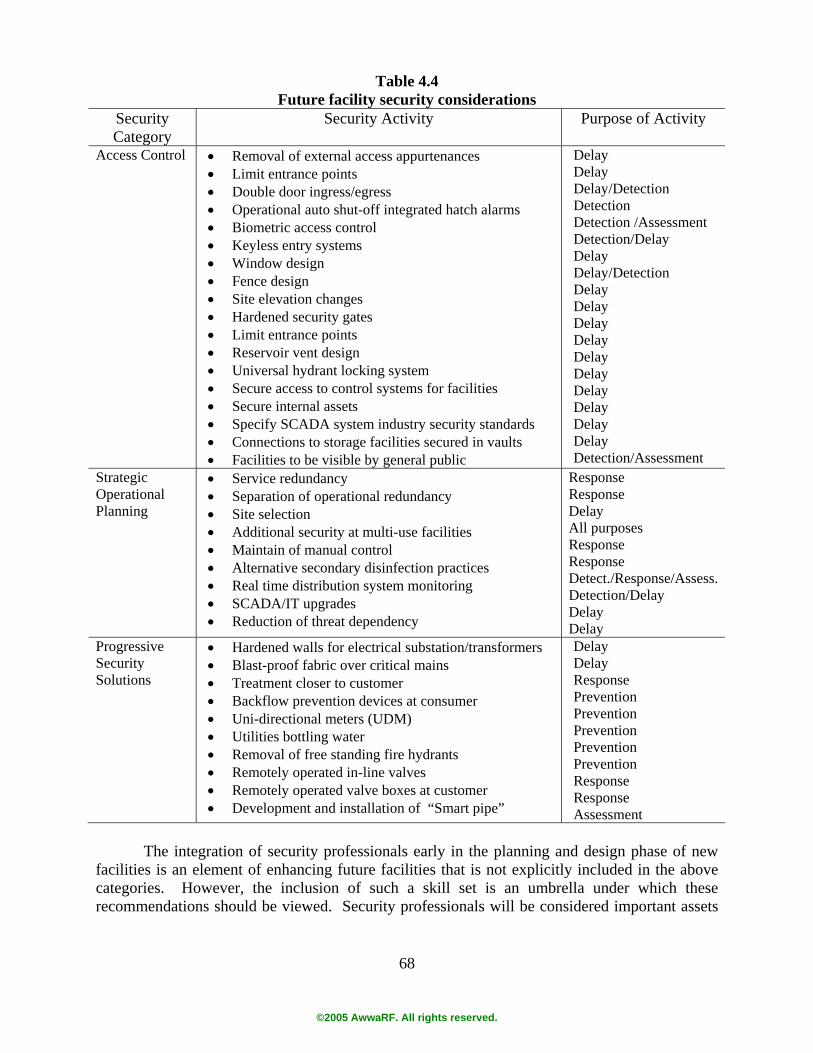
68
Table 4.4 Future facility security considerations
Security Category
Security Activity Purpose of Activity
Access Control • Removal of external access appurtenances • Limit entrance points • Double door ingress/egress • Operational auto shut-off integrated hatch alarms • Biometric access control • Keyless entry systems • Window design • Fence design • Site elevation changes • Hardened security gates • Limit entrance points • Reservoir vent design • Universal hydrant locking system • Secure access to control systems for facilities • Secure internal assets • Specify SCADA system industry security standards • Connections to storage facilities secured in vaults • Facilities to be visible by general public
Delay Delay Delay/Detection Detection Detection /Assessment Detection/Delay Delay Delay/Detection Delay Delay Delay Delay Delay Delay Delay Delay Delay Delay Detection/Assessment
Strategic Operational Planning
• Service redundancy • Separation of operational redundancy • Site selection • Additional security at multi-use facilities • Maintain of manual control • Alternative secondary disinfection practices • Real time distribution system monitoring • SCADA/IT upgrades • Reduction of threat dependency
Response Response Delay All purposes Response Response Detect./Response/Assess. Detection/Delay Delay Delay
Progressive Security Solutions
• Hardened walls for electrical substation/transformers • Blast-proof fabric over critical mains • Treatment closer to customer • Backflow prevention devices at consumer • Uni-directional meters (UDM) • Utilities bottling water • Removal of free standing fire hydrants • Remotely operated in-line valves • Remotely operated valve boxes at customer • Development and installation of “Smart pipe”
Delay Delay Response Prevention Prevention Prevention Prevention Prevention Response Response Assessment
The integration of security professionals early in the planning and design phase of new
facilities is an element of enhancing future facilities that is not explicitly included in the above categories. However, the inclusion of such a skill set is an umbrella under which these recommendations should be viewed. Security professionals will be considered important assets
©2005 AwwaRF. All rights reserved.
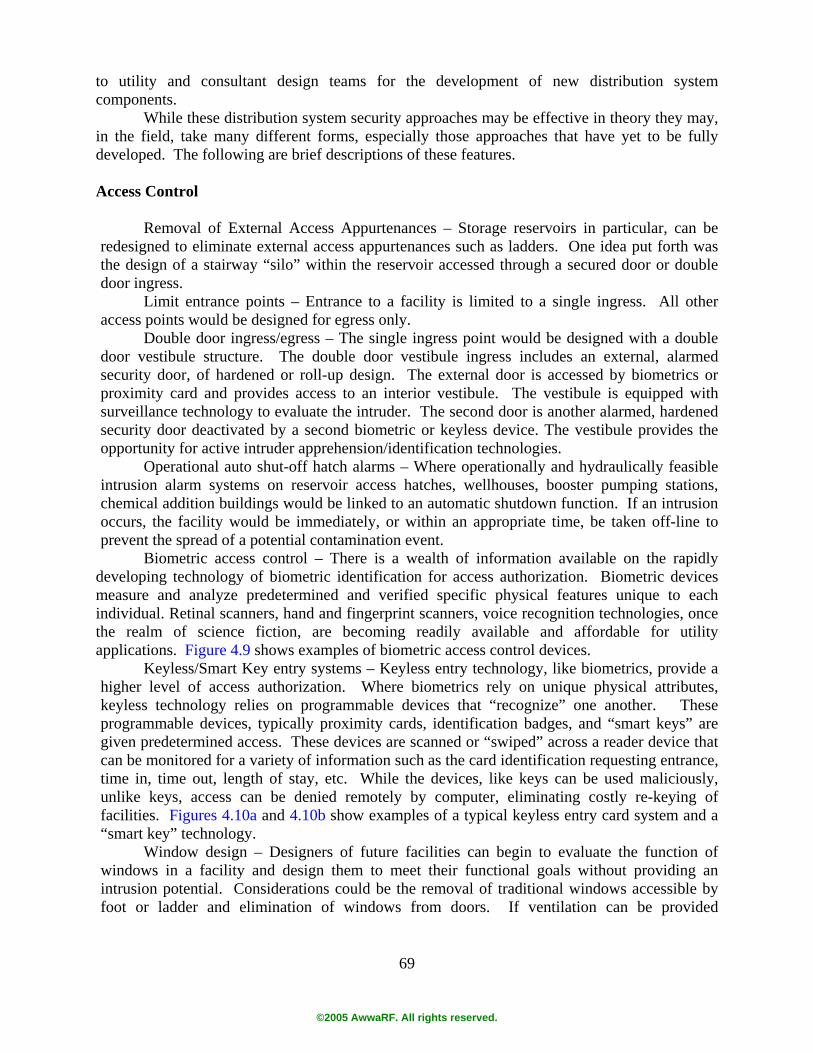
69
to utility and consultant design teams for the development of new distribution system components.
While these distribution system security approaches may be effective in theory they may, in the field, take many different forms, especially those approaches that have yet to be fully developed. The following are brief descriptions of these features. Access Control
Removal of External Access Appurtenances – Storage reservoirs in particular, can be
redesigned to eliminate external access appurtenances such as ladders. One idea put forth was the design of a stairway “silo” within the reservoir accessed through a secured door or double door ingress.
Limit entrance points – Entrance to a facility is limited to a single ingress. All other access points would be designed for egress only.
Double door ingress/egress – The single ingress point would be designed with a double door vestibule structure. The double door vestibule ingress includes an external, alarmed security door, of hardened or roll-up design. The external door is accessed by biometrics or proximity card and provides access to an interior vestibule. The vestibule is equipped with surveillance technology to evaluate the intruder. The second door is another alarmed, hardened security door deactivated by a second biometric or keyless device. The vestibule provides the opportunity for active intruder apprehension/identification technologies.
Operational auto shut-off hatch alarms – Where operationally and hydraulically feasible intrusion alarm systems on reservoir access hatches, wellhouses, booster pumping stations, chemical addition buildings would be linked to an automatic shutdown function. If an intrusion occurs, the facility would be immediately, or within an appropriate time, be taken off-line to prevent the spread of a potential contamination event.
Biometric access control – There is a wealth of information available on the rapidly developing technology of biometric identification for access authorization. Biometric devices measure and analyze predetermined and verified specific physical features unique to each individual. Retinal scanners, hand and fingerprint scanners, voice recognition technologies, once the realm of science fiction, are becoming readily available and affordable for utility applications. Figure 4.9 shows examples of biometric access control devices.
Keyless/Smart Key entry systems – Keyless entry technology, like biometrics, provide a higher level of access authorization. Where biometrics rely on unique physical attributes, keyless technology relies on programmable devices that “recognize” one another. These programmable devices, typically proximity cards, identification badges, and “smart keys” are given predetermined access. These devices are scanned or “swiped” across a reader device that can be monitored for a variety of information such as the card identification requesting entrance, time in, time out, length of stay, etc. While the devices, like keys can be used maliciously, unlike keys, access can be denied remotely by computer, eliminating costly re-keying of facilities. Figures 4.10a and 4.10b show examples of a typical keyless entry card system and a “smart key” technology.
Window design – Designers of future facilities can begin to evaluate the function of windows in a facility and design them to meet their functional goals without providing an intrusion potential. Considerations could be the removal of traditional windows accessible by foot or ladder and elimination of windows from doors. If ventilation can be provided
©2005 AwwaRF. All rights reserved.
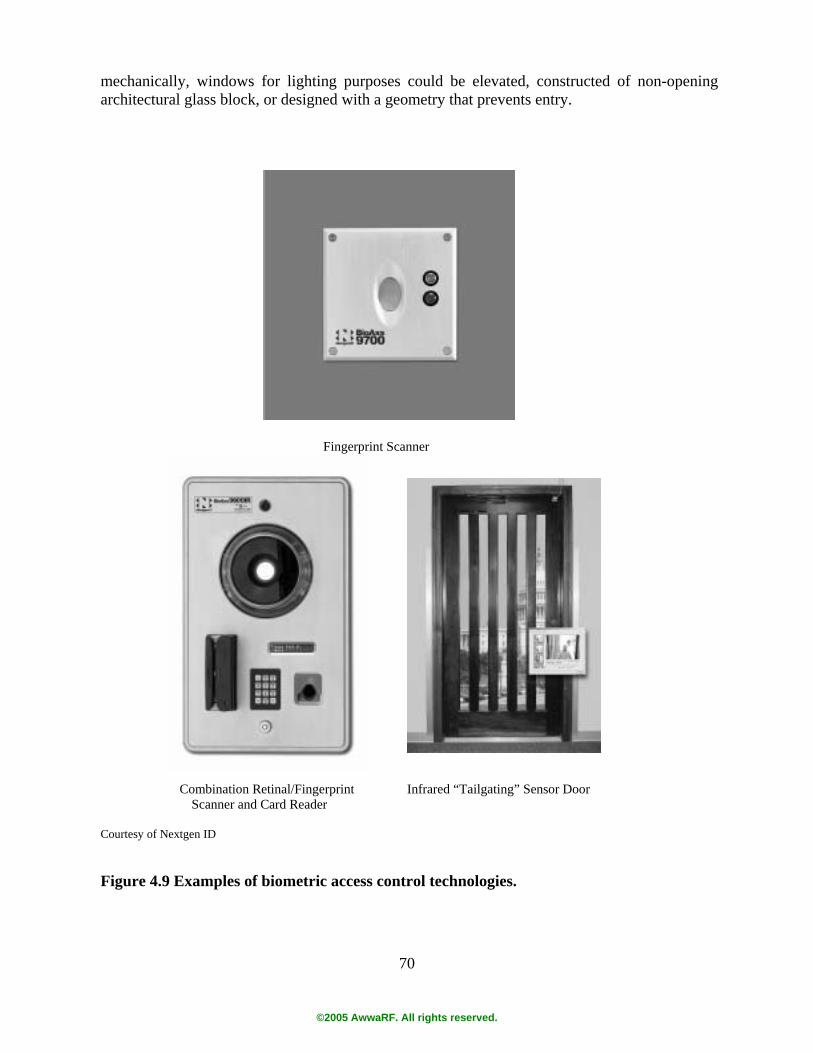
70
mechanically, windows for lighting purposes could be elevated, constructed of non-opening architectural glass block, or designed with a geometry that prevents entry. Fingerprint Scanner Combination Retinal/Fingerprint Infrared “Tailgating” Sensor Door Scanner and Card Reader Courtesy of Nextgen ID Figure 4.9 Examples of biometric access control technologies.
©2005 AwwaRF. All rights reserved.
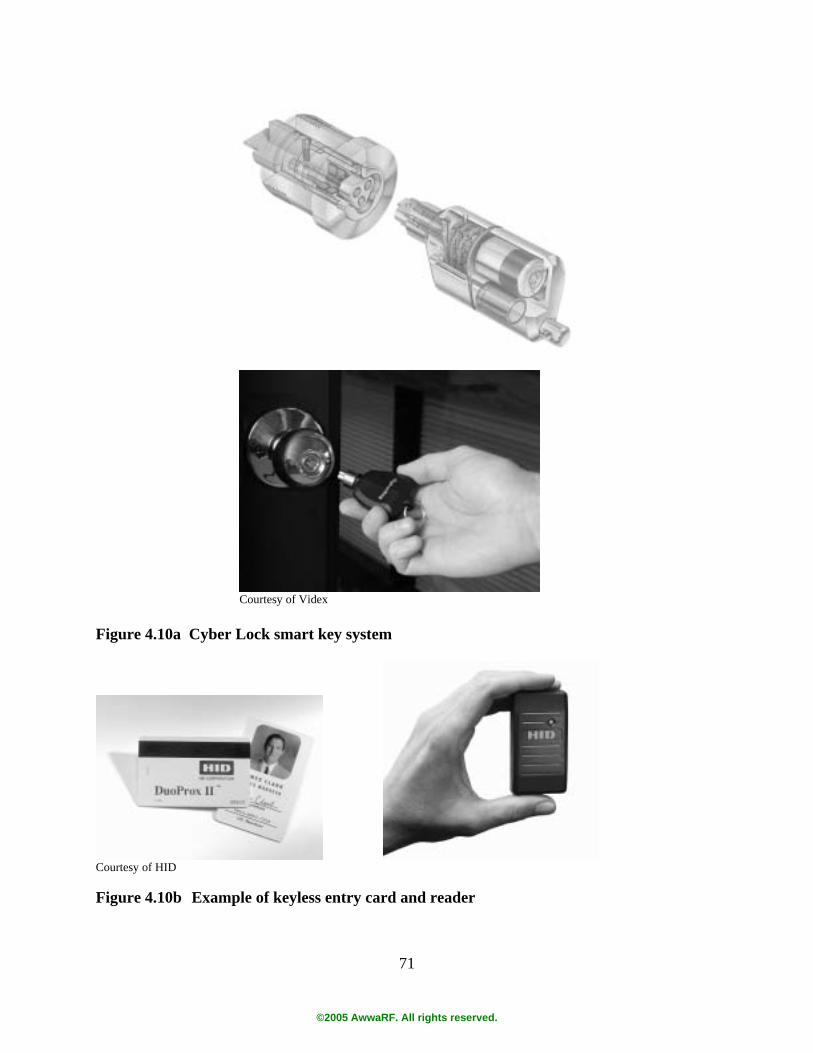
71
Courtesy of Videx
Figure 4.10a Cyber Lock smart key system
Courtesy of HID Figure 4.10b Example of keyless entry card and reader
©2005 AwwaRF. All rights reserved.
72
Fence design – Fence design, primarily for perimeter control, if used, should be designed with both security objectives and fence design capabilities in mind to achieve objectives and aesthetics. Perimeter fencing is available in a variety of different styles and functions. Figure 4.11 shows examples of flawed and inadequate perimeter control. Figure 4.12 shows an example of an adequate perimeter fence installation. Figure 4.13 demonstrates a fabric weaving and burial retrofit solution. Figures 4.14 and 4.15a-d show examples of perimeter control enhancements and alternative fabrics.
Site elevation changes – A simple security technique that can be used at distribution system facilities such as tanks or buildings is a change in elevation to prevent vehicle accessibility directly adjacent to a structure.
Hardened security gates – Gates typically provide access through perimeter security, but still need to provide adequate security. Security gates, like perimeter fencing, are available in a variety of designs and features. Figure 4.16 shows an example of a typical chain-link distribution system facility vehicle access gate. Figure 4.17 shows examples of hardened security gates.
Reservoir vent design – Reservoir vents are an operational necessity, but they provide direct access to stored water. A variety of security vent designs are available and evolving. Figure 4.18 shows two examples of a secured reservoir vent design.
Hydrant locking system – Addressing hydrant security was identified as an issue in the short- and long-term as well as for future installations. Internal and external locking mechanisms are available today and continue to evolve. Figure 4.19 shows an external strapping device to secure hydrants and Figure 4.20 shows a hydrant internal magnetic locking system. It should be noted that changes to hydrant security needs to be coordinated with local fire departments.
Securing internal assets – Measures should be taken to physically secure critical assets such as SCADA, switchgears, controls, etc., within a facility, assuming that perimeter or ingress security, if present, is compromised. This can be accomplished by using appropriate lockboxes and access control technologies.
Specification of industry security standards for all parts of SCADA system – SCADA systems are a critical asset for modern water utility operation. In this age of accelerating computer system expertise, these systems can be a security liability if not properly configured and updated. The addition of SCADA to any distribution system facility should be specifically configured according to acceptable industry standards as they exist at the time.
Securing storage reservoir piping in vaults – The protection of plumbing elements can be difficult because of location, site terrain, etc. However, storage reservoir inlets and outlets are accessible, operational pinch points. Whenever possible the inlets and outlets should optimally be secured in underground vaults; or at a minimum, located within secured enclosures.
Facilities to be visible by general public – Water utilities have spent a half-century hiding, disguising, and blending utility facilities from public view, and the practice has been very successful. However, from a security perspective this has resulted in facilities that can not be readily observed or conveniently accessed. For security reasons, facility landscapes should be opened up to eliminate obstructed views.
©2005 AwwaRF. All rights reserved.
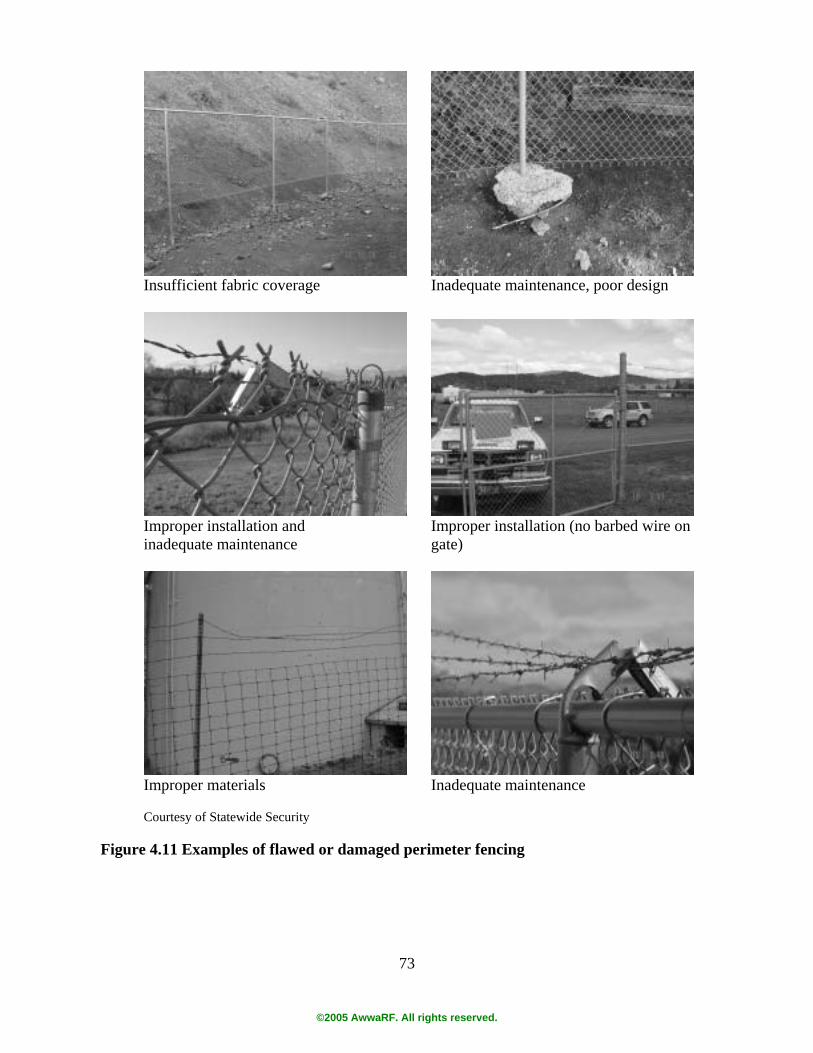
73
Insufficient fabric coverage Inadequate maintenance, poor design
Improper installation and Improper installation (no barbed wire on
inadequate maintenance gate)
Improper materials Inadequate maintenance
Courtesy of Statewide Security Figure 4.11 Examples of flawed or damaged perimeter fencing
©2005 AwwaRF. All rights reserved.
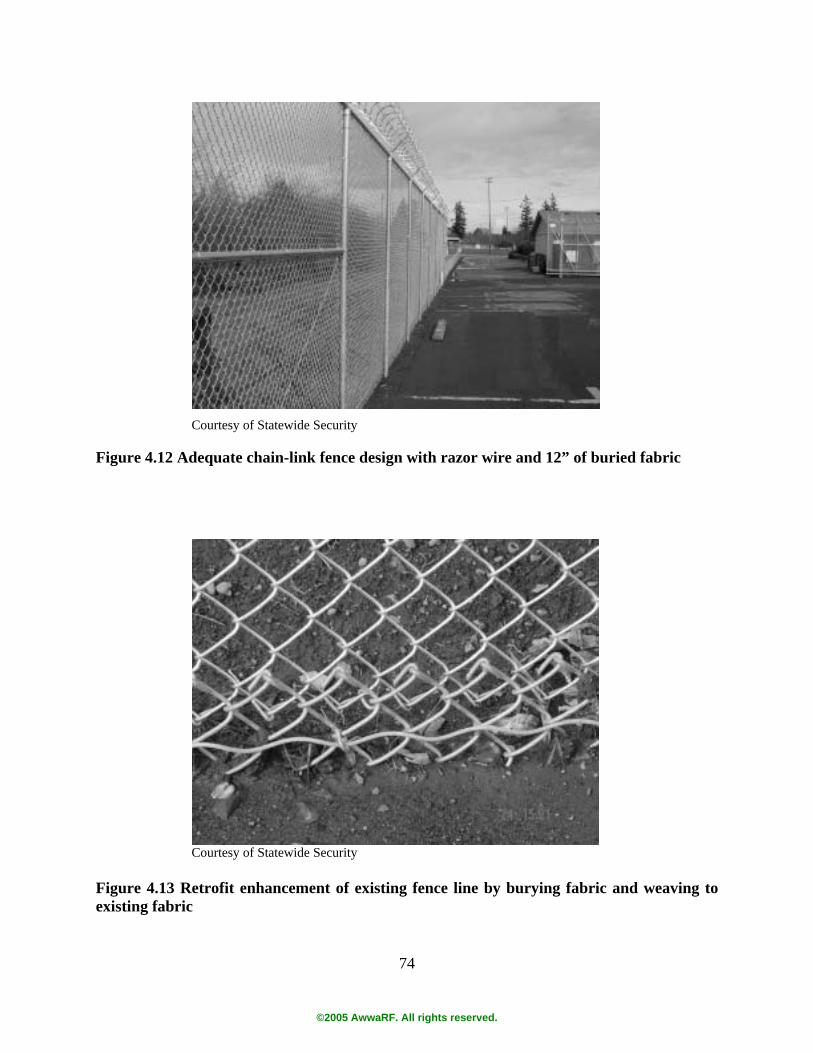
74
Courtesy of Statewide Security
Figure 4.12 Adequate chain-link fence design with razor wire and 12” of buried fabric
Courtesy of Statewide Security
Figure 4.13 Retrofit enhancement of existing fence line by burying fabric and weaving to existing fabric
©2005 AwwaRF. All rights reserved.
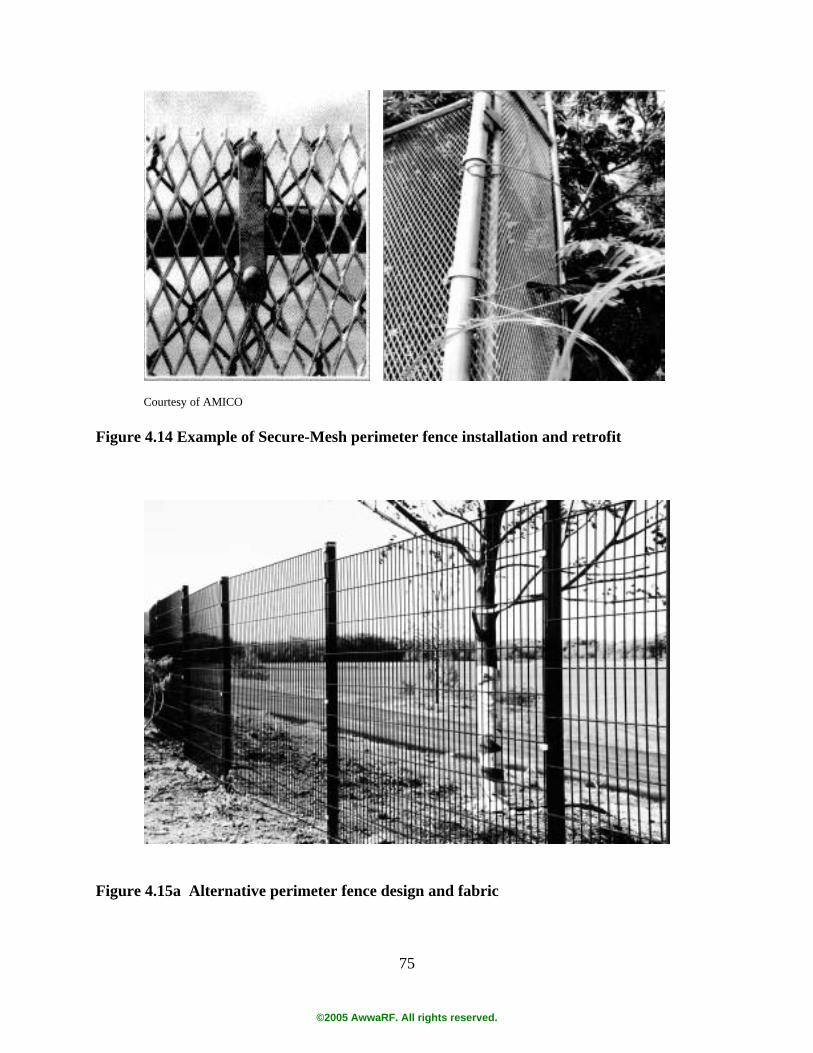
75
Courtesy of AMICO Figure 4.14 Example of Secure-Mesh perimeter fence installation and retrofit
Figure 4.15a Alternative perimeter fence design and fabric
©2005 AwwaRF. All rights reserved.
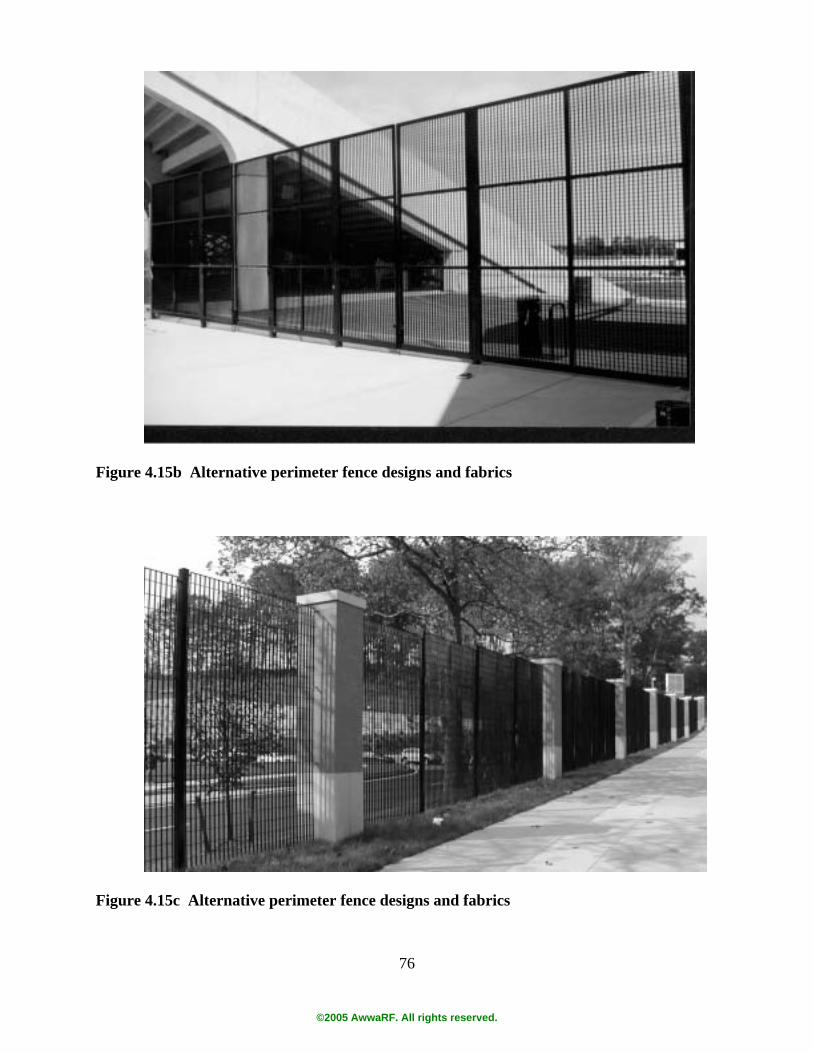
76
Figure 4.15b Alternative perimeter fence designs and fabrics
Figure 4.15c Alternative perimeter fence designs and fabrics
©2005 AwwaRF. All rights reserved.
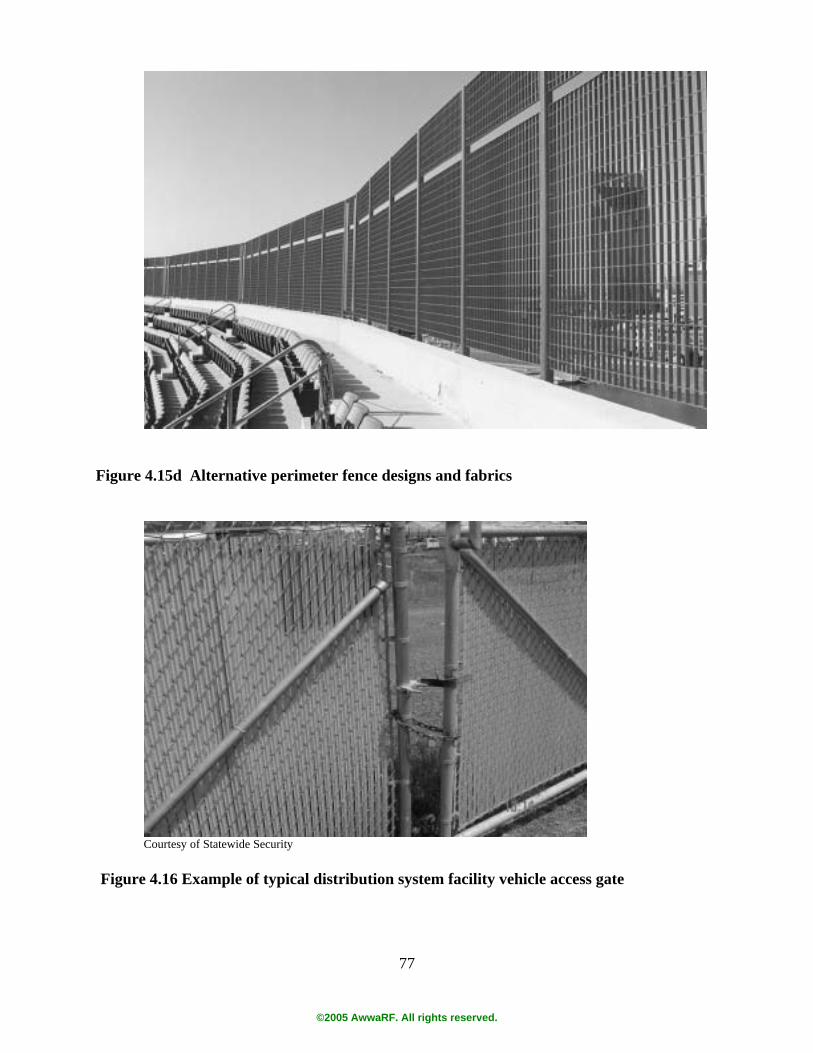
77
Figure 4.15d Alternative perimeter fence designs and fabrics
Courtesy of Statewide Security Figure 4.16 Example of typical distribution system facility vehicle access gate
©2005 AwwaRF. All rights reserved.
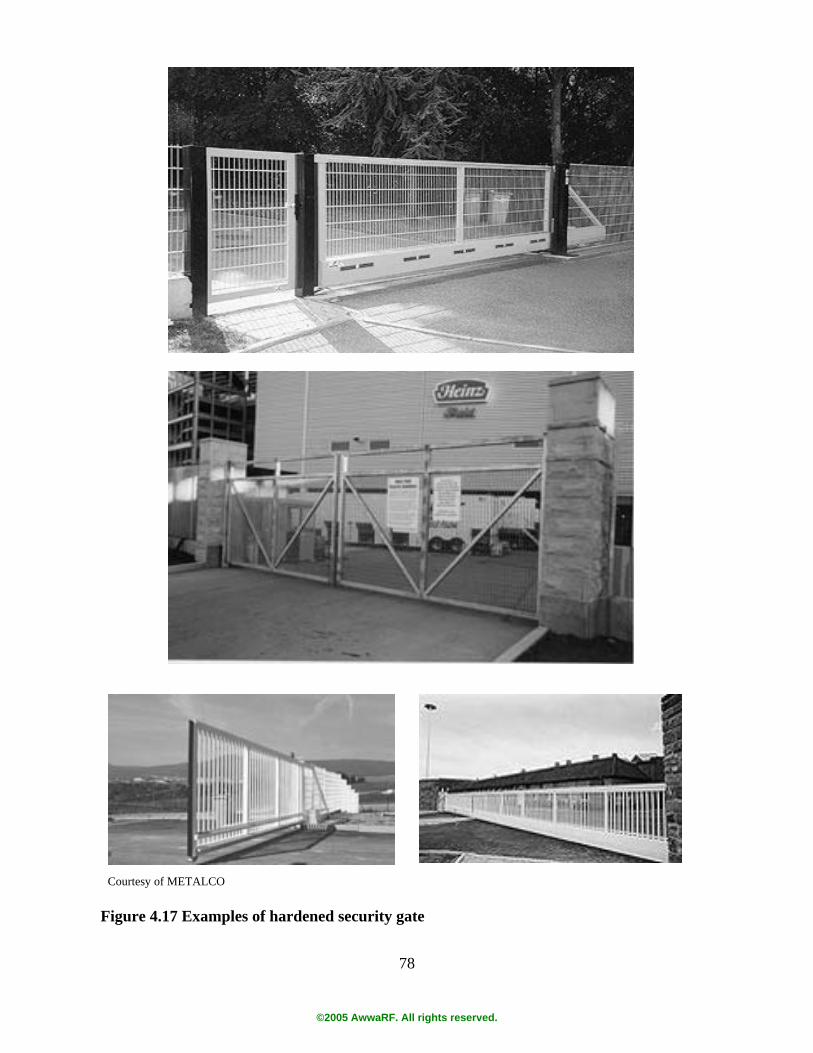
78
Courtesy of METALCO
Figure 4.17 Examples of hardened security gate
©2005 AwwaRF. All rights reserved.
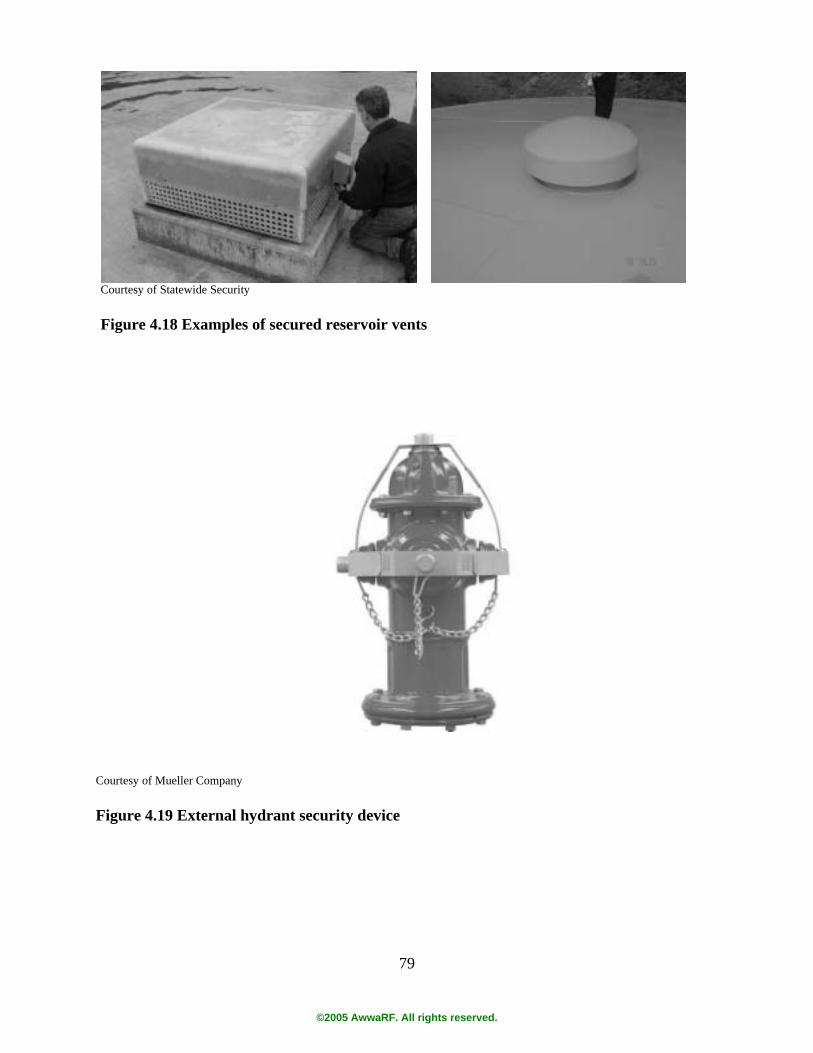
79
Courtesy of Statewide Security Figure 4.18 Examples of secured reservoir vents
Courtesy of Mueller Company Figure 4.19 External hydrant security device
©2005 AwwaRF. All rights reserved.

80
Courtesy of Hydra Shield Figure 4.20 Example of hydrant internal magnetic locking system Strategic Operational Planning
Service redundancy – Service redundancy refers to distribution system design that provides for system looping to eliminate dead-ends, isolated service areas, and difficult operating conditions. The objective is to provide optimal operational flexibility in order to best address or respond to a contamination event.
Separation of operational redundancy – Design and operational redundancy in water distribution systems is professionally prudent and the only means of providing reliable service to customers. Generally, this practice is adhered to by water utilities. However, historically, utilities have addressed redundancy from the perspective of convenience and simplicity of design and operation and maintenance. This is illustrated by the example of a booster pumping station designed with a primary pump and two back-up pumps, all side-by side. The same examples can be found in treatment, storage and transmission facilities. Operationally, this is fully redundant; from a security perspective there is zero redundancy. The three pumps in the example provide a single target. To secure current and future facilities, utilities need to consider physical separation of redundancy by separation with solid walls or even separation into separate buildings; separation of twin transmission lines; or physical or operational separation of twin storage facilities on the same sites.
Site selection – In the future, water distribution facilities may look very different through site selection. In order to minimize security issues, utilities may consider sites where all facilities can be buried upon completion. This provides increased security, but can mean costly construction. Another option is co-locating water distribution facilities with other public utilities such as electrical substations. This joint facility approach allows for the sharing of
©2005 AwwaRF. All rights reserved.
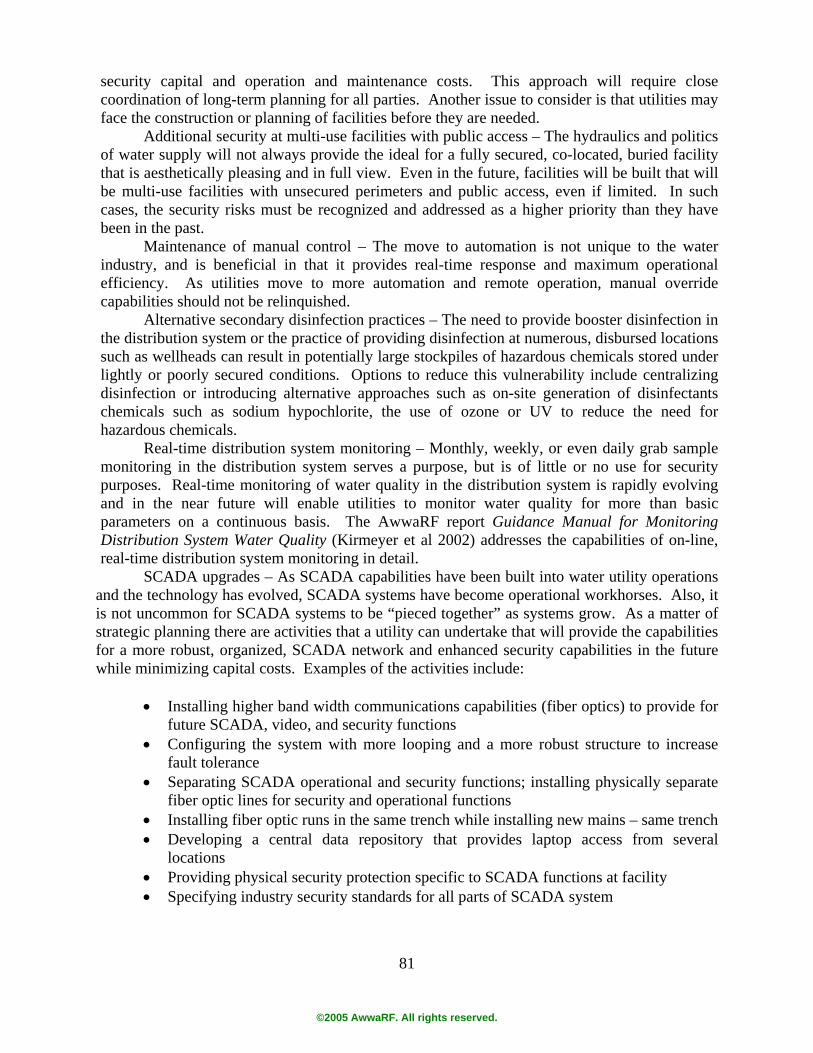
81
security capital and operation and maintenance costs. This approach will require close coordination of long-term planning for all parties. Another issue to consider is that utilities may face the construction or planning of facilities before they are needed.
Additional security at multi-use facilities with public access – The hydraulics and politics of water supply will not always provide the ideal for a fully secured, co-located, buried facility that is aesthetically pleasing and in full view. Even in the future, facilities will be built that will be multi-use facilities with unsecured perimeters and public access, even if limited. In such cases, the security risks must be recognized and addressed as a higher priority than they have been in the past.
Maintenance of manual control – The move to automation is not unique to the water industry, and is beneficial in that it provides real-time response and maximum operational efficiency. As utilities move to more automation and remote operation, manual override capabilities should not be relinquished.
Alternative secondary disinfection practices – The need to provide booster disinfection in the distribution system or the practice of providing disinfection at numerous, disbursed locations such as wellheads can result in potentially large stockpiles of hazardous chemicals stored under lightly or poorly secured conditions. Options to reduce this vulnerability include centralizing disinfection or introducing alternative approaches such as on-site generation of disinfectants chemicals such as sodium hypochlorite, the use of ozone or UV to reduce the need for hazardous chemicals.
Real-time distribution system monitoring – Monthly, weekly, or even daily grab sample monitoring in the distribution system serves a purpose, but is of little or no use for security purposes. Real-time monitoring of water quality in the distribution system is rapidly evolving and in the near future will enable utilities to monitor water quality for more than basic parameters on a continuous basis. The AwwaRF report Guidance Manual for Monitoring Distribution System Water Quality (Kirmeyer et al 2002) addresses the capabilities of on-line, real-time distribution system monitoring in detail.
SCADA upgrades – As SCADA capabilities have been built into water utility operations and the technology has evolved, SCADA systems have become operational workhorses. Also, it is not uncommon for SCADA systems to be “pieced together” as systems grow. As a matter of strategic planning there are activities that a utility can undertake that will provide the capabilities for a more robust, organized, SCADA network and enhanced security capabilities in the future while minimizing capital costs. Examples of the activities include:
• Installing higher band width communications capabilities (fiber optics) to provide for future SCADA, video, and security functions
• Configuring the system with more looping and a more robust structure to increase fault tolerance
• Separating SCADA operational and security functions; installing physically separate fiber optic lines for security and operational functions
• Installing fiber optic runs in the same trench while installing new mains – same trench • Developing a central data repository that provides laptop access from several
locations • Providing physical security protection specific to SCADA functions at facility • Specifying industry security standards for all parts of SCADA system
©2005 AwwaRF. All rights reserved.

82
• Providing security measures to control and monitor access to, and activities in, SCADA control room
• Designing system with multiple control centers including a primary and a back-up
Reduction of threat dependency – A threat dependent facility is one with security measures that become less effective as the number of adversaries increases or changes. When designing new facilities it is recommended that utilities view prospective designs from a threat dependency perspective. One obvious means of reducing threat dependence is to locate facilities underground. In this way access is funneled through a single access point thereby negating the presence of multiple adversaries and maximizing intrusion task times. Progressive Security Solutions
The progressive solutions recommended by the workshop participants included
technologies and approaches that are available today, but typically not widely implemented in the water industry or in the United States. These distribution system security approaches will seem excessive and costly when viewed through the lens of historical attitudes about water distribution system security. They may, however, in some manner become a reality for future distribution system design and operation. While these progressive techniques may not be feasible for most utilities today, they should not be dismissed out-of-hand for the future.
Hardened structural walls – Advances in construction and materials and ballistic-proof technology will provide utilities with construction options that would protect assets from explosive blasts such as electrical substations that serve key facilities.
Blast-proof fabric over critical mains – Blast-proof fabrics are available that can be installed over the tops of critical buried transmission and service mains to protect against attack with explosives.
Treatment closer to customer – A potential approach to the challenge of attempting to protect water in a large distribution system is to reduce the size of the distribution system between treatment and customer. This could be accomplished by moving all, or a portion of treatment, into individual service areas, neighborhoods, or even to the individual customer using utility owned equipment in the home.
Backflow prevention devices at customer connections – A utility can take a variety of actions that protect water quality in distribution systems through utility owned facilities, but in reality every customer tap is a potential entry point. A potential solution to address the vulnerability of individual customer taps is the installation of a backflow prevention device at each customer service connection.
Uni-directional meter (UDM) – This new concept builds on the idea of individual customer backflow prevention. The development of a uni-directional meter would address the potential for backflow and provide for the ease of installation over service lines.
Utility production and distribution of bottled water – Potable water would be treated, bottled and distributed through a utility managed network. Non-potable water would continue to be provided through existing distribution systems.
Removal of permanent, free standing fire hydrants – Technology and equipment exists that allows for the elimination of accessible above–ground fire hydrants. Two potential approaches are locating hydrants in secured, sub-grade vaults or installing hydrant connections for fire department provided and controlled hydrants.
©2005 AwwaRF. All rights reserved.
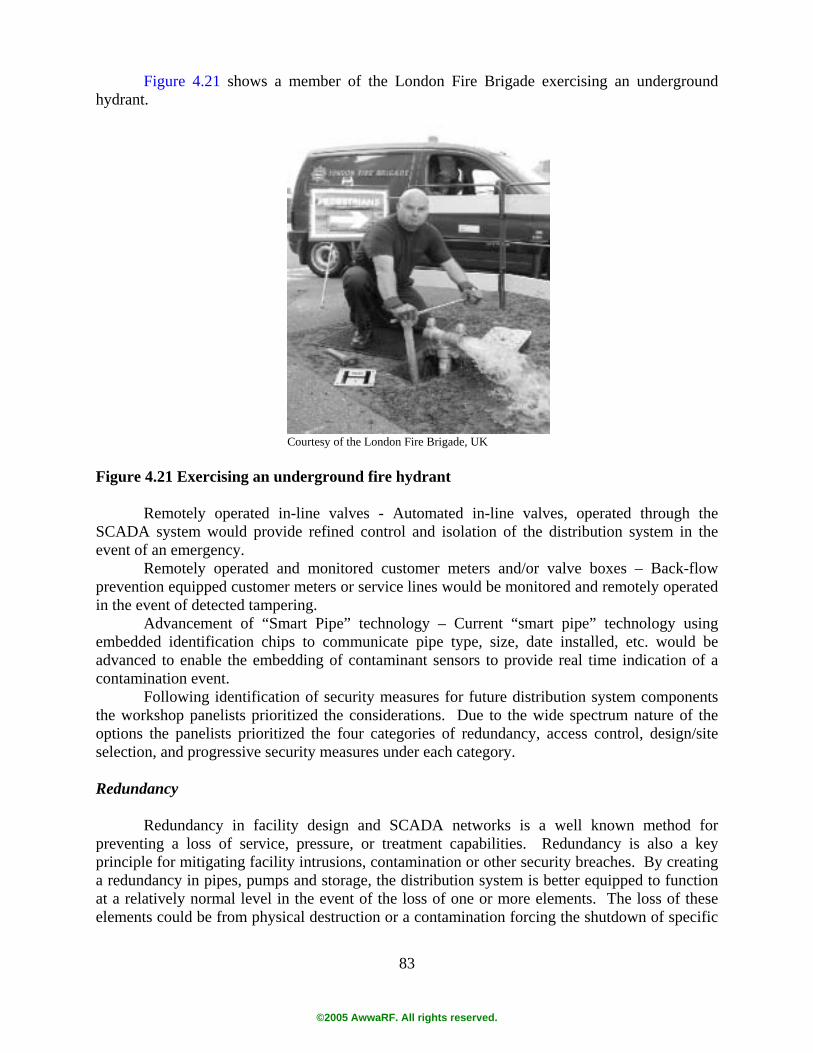
83
Figure 4.21 shows a member of the London Fire Brigade exercising an underground hydrant.
Courtesy of the London Fire Brigade, UK
Figure 4.21 Exercising an underground fire hydrant
Remotely operated in-line valves - Automated in-line valves, operated through the
SCADA system would provide refined control and isolation of the distribution system in the event of an emergency.
Remotely operated and monitored customer meters and/or valve boxes – Back-flow prevention equipped customer meters or service lines would be monitored and remotely operated in the event of detected tampering.
Advancement of “Smart Pipe” technology – Current “smart pipe” technology using embedded identification chips to communicate pipe type, size, date installed, etc. would be advanced to enable the embedding of contaminant sensors to provide real time indication of a contamination event.
Following identification of security measures for future distribution system components the workshop panelists prioritized the considerations. Due to the wide spectrum nature of the options the panelists prioritized the four categories of redundancy, access control, design/site selection, and progressive security measures under each category. Redundancy
Redundancy in facility design and SCADA networks is a well known method for
preventing a loss of service, pressure, or treatment capabilities. Redundancy is also a key principle for mitigating facility intrusions, contamination or other security breaches. By creating a redundancy in pipes, pumps and storage, the distribution system is better equipped to function at a relatively normal level in the event of the loss of one or more elements. The loss of these elements could be from physical destruction or a contamination forcing the shutdown of specific
©2005 AwwaRF. All rights reserved.

84
elements or portions of the system. Physical separation of redundant facilities serves to make it more difficult to interrupt water service by attacking facilities. If a facility is destroyed, but a redundant facility exists off-site, the second facility would have to be destroyed in a second attack in order to cause an immediate and significant effect on water service.
Access Control
1. Keyless and smart key entry control systems 2. Biometric access control 3. Limit access points (e.g., ladders, doors, windows, vents, etc.) 4. Removal of external access appurtenances 5. Vestibule ingress design 6. Secure access to control systems for facilities 7. Universal locking for hydrants The control of access to facilities must be performed on many levels. Control policies
and associated security measures must address outside attackers, inside attackers such as employees and former employees, and cyber attackers. Workshop panelists determined that the most significant priority for insuring access control was to improve the locking systems for utility facilities. Locking system improvements would likely include the removal of hard key or key pad locks and their replacement with keyless or smart key entry control system.
Biometrics, was also a top priority for the control panel access. Biometrics includes using physical identifiers, such as fingerprints, hand geometry and retinal scans or facial recognition, as a means for identifying personnel and granting access were recommended.
Design/Siting
1. Consider measures that make facility not as threat dependent 2. Co-locate facilities with other secure sites (police, fire, etc) 3. Locate facilities (pump, storage) underground, if possible 4. Make site visible to public or a multi-use facility (tennis courts) 5. Maintain manual control of system (as back-up) 6. Integrate water quality monitoring equipment 7. Blast-proof fabric over critical mains 8. Consider chlorination alternatives to reduce chemical storage on-site 9. Secure connections to facility by locating in secure vault 10. Install secure reservoir vents Incorporating security measures into facility design and siting characteristics may be
highly beneficial for the relative cost. This logic follows from the notion that it will likely be cheaper to design common sense features into the facility which have relatively low costs rather than retrofitting and adding security features after the facility is completed. The highest priority, as determined by workshop panelists, was the consideration of features to reduce the threat dependence of the facility. Reducing the threat dependence of the facility can include previously discussed security measures, such as redundancy, but may also include features such as valves for isolation of the facility from the system or off-site storage of chemicals.
©2005 AwwaRF. All rights reserved.
85
Progressive Security Solutions 1. Move treatment further into the distribution system and closer to customer 2. Remove permanent fire hydrants from system 3. Consider producing and bottling drinking water for distribution 4. Install “smart pipe” as distribution system grows or is replaced 5. Integration of intruder apprehension technologies Of the progressive security solutions that were developed, moving the treatment process
closer to the customer was prioritized to be the most important method for improvement of distribution system security. The suggestion promoted by the panelists was that by moving the treatment closer to the customer, the utility is not spending its security budget to protect the entire water supply, of which only a small percentage is actually used as drinking water by the customers. The number three progressive security solution was an echo of this, however in this case, it was suggested that drinking water could be treated at a central location by the water utility, then bottled and sold to the utility customers. Under this scenario, the utility could decide whether or not to treat the conventionally distributed water, but security throughout the distribution system could be reduced as the water would not be designated “drinking water.”
The second progressive security solution is to eliminate permanent fire hydrants, therefore removing a point of access for adversaries. A conventional fire hydrant would be replaced with a valve to which a portable hydrant (brought to the scene by fire fighters) could be attached. This is similar to the commercially available underground hydrants. Although rarely used in the United States, such hydrants are widely in use in some British and European cities.
The fourth and fifth progressive security solutions are items that could potentially be developed in the future. First, “smart pipe” is a pipe which has sensors embedded in the pipe wall. The “smart pipe” under development today includes sensors useful in both pipe locating and identifying characteristics of the pipe such as material, diameter, and age. Future designs may include water quality information.
The last identified progressive security solution is the integration of intruder apprehension technologies. These response technologies are designed to take security beyond delay, detection, verification and physical response to include non-lethal, immobilizing technologies integrated into site security systems to immediately respond to an intrusion and aid in intruder apprehension in advance of arrival of law enforcement.
Table 4.5 lists the future facility priorities and the type of activity associated with each recommendation.
SUMMARY
Addressing security in the distribution system will not be a simple, expedient, or
inexpensive undertaking by utilities. Enhancing security will require the evaluation of existing facility security and the establishment of additional considerations in the planning, siting, design and construction of new facilities.
Addressing existing facility issues can be accomplished by first establishing the importance of the need for security, optimizing existing security measures and laying the groundwork for later enhancements. Longer-term enhancements can be accomplished by
©2005 AwwaRF. All rights reserved.
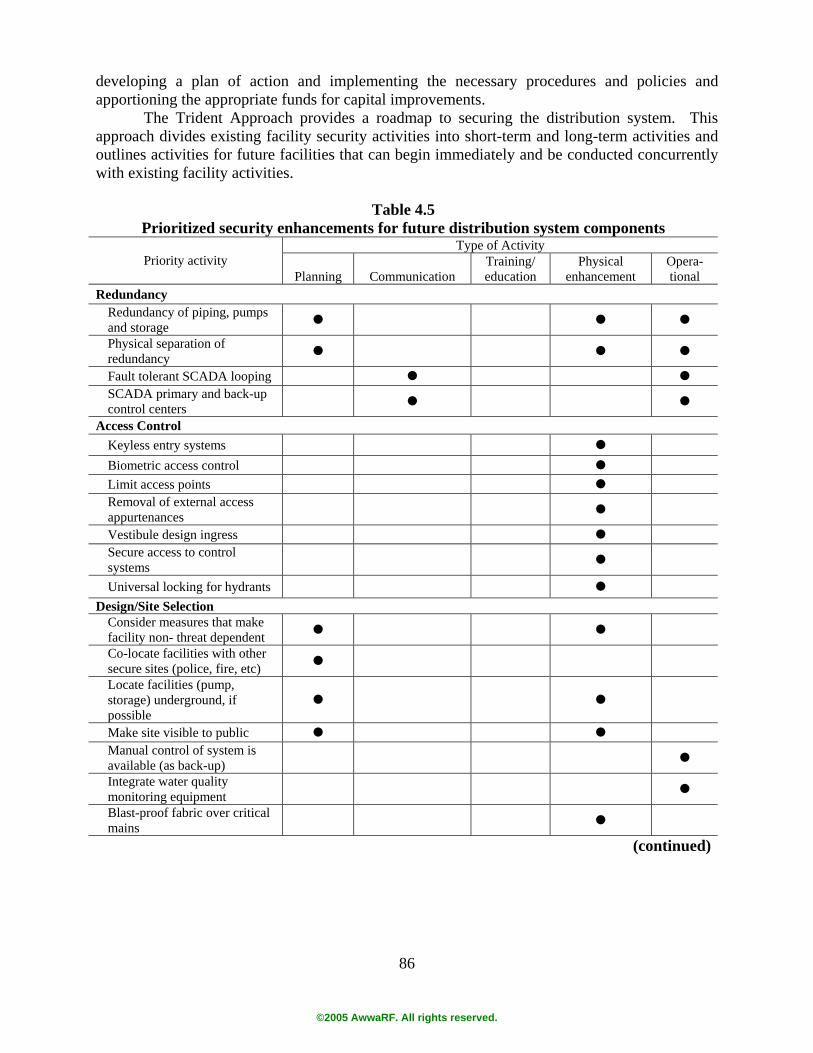
86
developing a plan of action and implementing the necessary procedures and policies and apportioning the appropriate funds for capital improvements.
The Trident Approach provides a roadmap to securing the distribution system. This approach divides existing facility security activities into short-term and long-term activities and outlines activities for future facilities that can begin immediately and be conducted concurrently with existing facility activities.
Table 4.5 Prioritized security enhancements for future distribution system components
Type of Activity Priority activity
Planning Communication Training/ education
Physical enhancement
Opera-tional
Redundancy Redundancy of piping, pumps and storage " " " Physical separation of redundancy " " " Fault tolerant SCADA looping " " SCADA primary and back-up control centers " "
Access Control Keyless entry systems " Biometric access control " Limit access points " Removal of external access appurtenances " Vestibule design ingress " Secure access to control systems " Universal locking for hydrants "
Design/Site Selection Consider measures that make facility non- threat dependent " " Co-locate facilities with other secure sites (police, fire, etc) " Locate facilities (pump, storage) underground, if possible
" "
Make site visible to public " " Manual control of system is available (as back-up) " Integrate water quality monitoring equipment " Blast-proof fabric over critical mains "
(continued)
©2005 AwwaRF. All rights reserved.
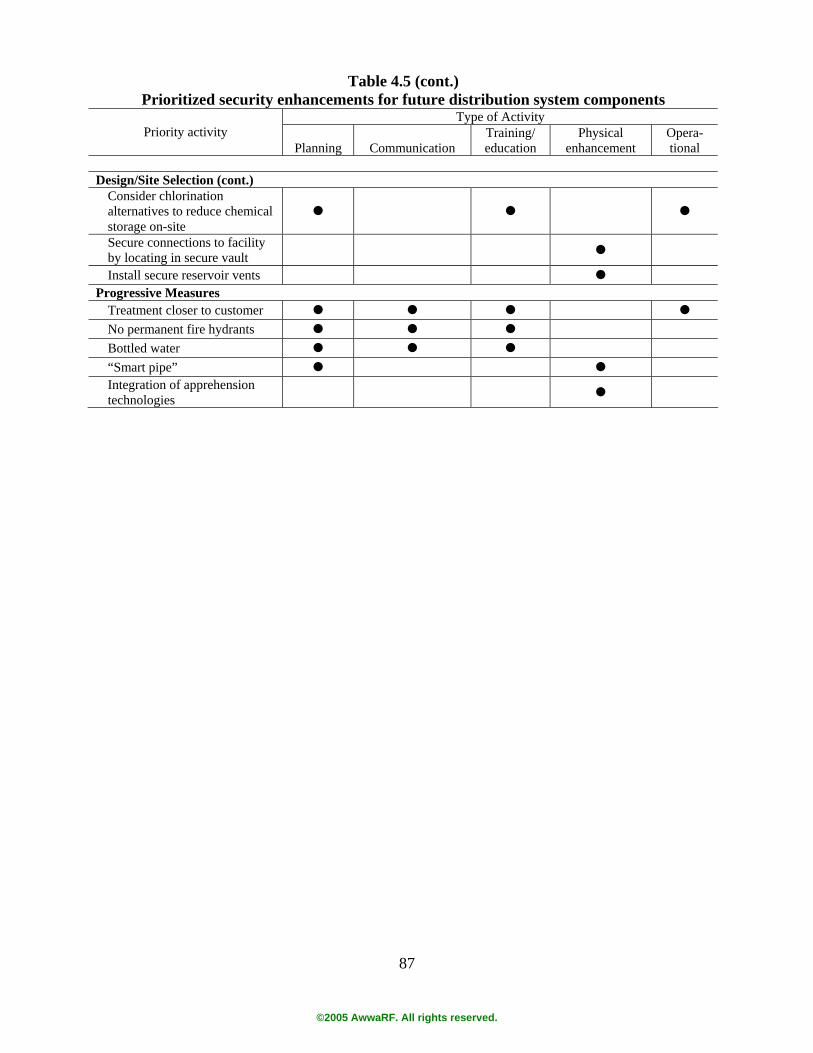
87
Table 4.5 (cont.) Prioritized security enhancements for future distribution system components
Type of Activity Priority activity
Planning Communication Training/ education
Physical enhancement
Opera-tional
Design/Site Selection (cont.)
Consider chlorination alternatives to reduce chemical storage on-site
" " "
Secure connections to facility by locating in secure vault " Install secure reservoir vents "
Progressive Measures Treatment closer to customer " " " " No permanent fire hydrants " " " Bottled water " " " “Smart pipe” " " Integration of apprehension technologies "
©2005 AwwaRF. All rights reserved.

©2005 AwwaRF. All rights reserved.
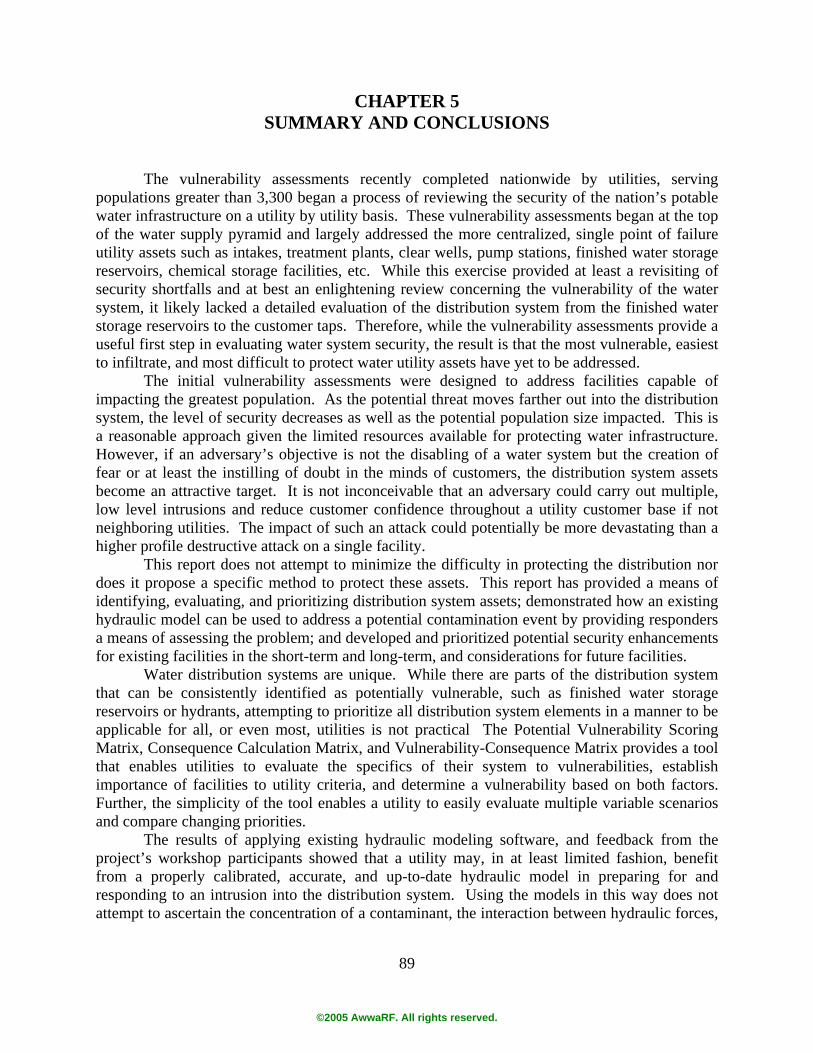
89
CHAPTER 5
SUMMARY AND CONCLUSIONS The vulnerability assessments recently completed nationwide by utilities, serving
populations greater than 3,300 began a process of reviewing the security of the nation’s potable water infrastructure on a utility by utility basis. These vulnerability assessments began at the top of the water supply pyramid and largely addressed the more centralized, single point of failure utility assets such as intakes, treatment plants, clear wells, pump stations, finished water storage reservoirs, chemical storage facilities, etc. While this exercise provided at least a revisiting of security shortfalls and at best an enlightening review concerning the vulnerability of the water system, it likely lacked a detailed evaluation of the distribution system from the finished water storage reservoirs to the customer taps. Therefore, while the vulnerability assessments provide a useful first step in evaluating water system security, the result is that the most vulnerable, easiest to infiltrate, and most difficult to protect water utility assets have yet to be addressed.
The initial vulnerability assessments were designed to address facilities capable of impacting the greatest population. As the potential threat moves farther out into the distribution system, the level of security decreases as well as the potential population size impacted. This is a reasonable approach given the limited resources available for protecting water infrastructure. However, if an adversary’s objective is not the disabling of a water system but the creation of fear or at least the instilling of doubt in the minds of customers, the distribution system assets become an attractive target. It is not inconceivable that an adversary could carry out multiple, low level intrusions and reduce customer confidence throughout a utility customer base if not neighboring utilities. The impact of such an attack could potentially be more devastating than a higher profile destructive attack on a single facility.
This report does not attempt to minimize the difficulty in protecting the distribution nor does it propose a specific method to protect these assets. This report has provided a means of identifying, evaluating, and prioritizing distribution system assets; demonstrated how an existing hydraulic model can be used to address a potential contamination event by providing responders a means of assessing the problem; and developed and prioritized potential security enhancements for existing facilities in the short-term and long-term, and considerations for future facilities.
Water distribution systems are unique. While there are parts of the distribution system that can be consistently identified as potentially vulnerable, such as finished water storage reservoirs or hydrants, attempting to prioritize all distribution system elements in a manner to be applicable for all, or even most, utilities is not practical The Potential Vulnerability Scoring Matrix, Consequence Calculation Matrix, and Vulnerability-Consequence Matrix provides a tool that enables utilities to evaluate the specifics of their system to vulnerabilities, establish importance of facilities to utility criteria, and determine a vulnerability based on both factors. Further, the simplicity of the tool enables a utility to easily evaluate multiple variable scenarios and compare changing priorities.
The results of applying existing hydraulic modeling software, and feedback from the project’s workshop participants showed that a utility may, in at least limited fashion, benefit from a properly calibrated, accurate, and up-to-date hydraulic model in preparing for and responding to an intrusion into the distribution system. Using the models in this way does not attempt to ascertain the concentration of a contaminant, the interaction between hydraulic forces,
©2005 AwwaRF. All rights reserved.
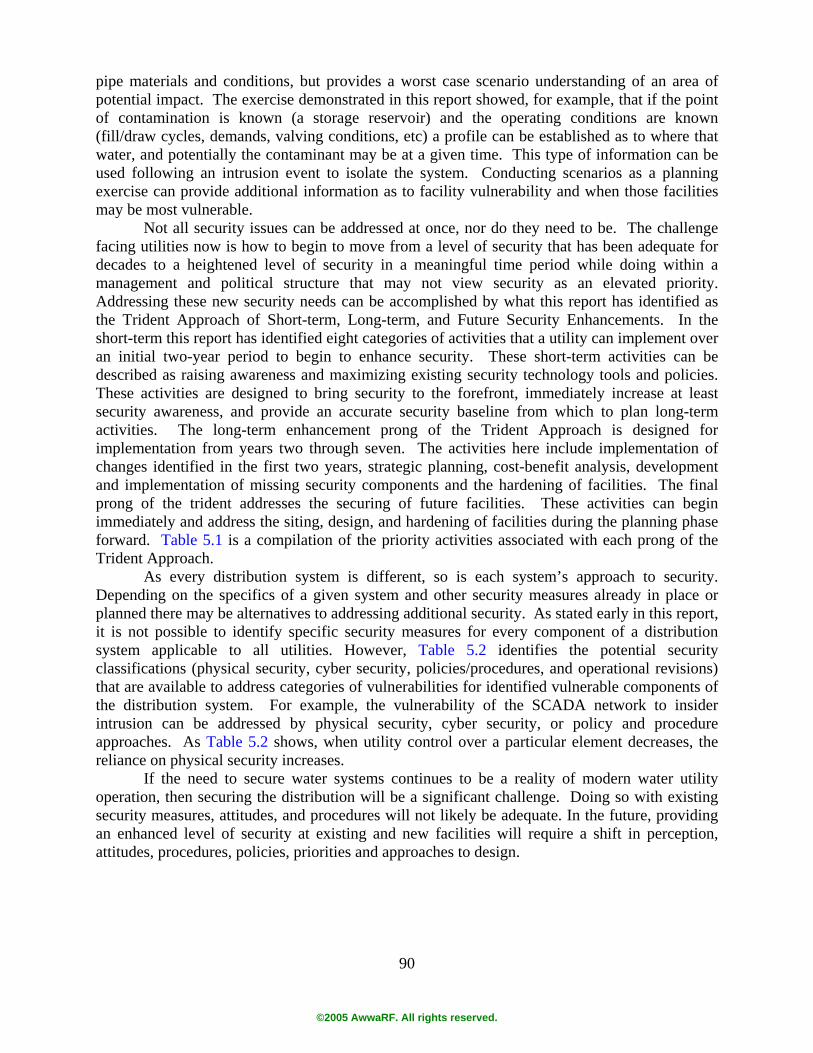
90
pipe materials and conditions, but provides a worst case scenario understanding of an area of potential impact. The exercise demonstrated in this report showed, for example, that if the point of contamination is known (a storage reservoir) and the operating conditions are known (fill/draw cycles, demands, valving conditions, etc) a profile can be established as to where that water, and potentially the contaminant may be at a given time. This type of information can be used following an intrusion event to isolate the system. Conducting scenarios as a planning exercise can provide additional information as to facility vulnerability and when those facilities may be most vulnerable.
Not all security issues can be addressed at once, nor do they need to be. The challenge facing utilities now is how to begin to move from a level of security that has been adequate for decades to a heightened level of security in a meaningful time period while doing within a management and political structure that may not view security as an elevated priority. Addressing these new security needs can be accomplished by what this report has identified as the Trident Approach of Short-term, Long-term, and Future Security Enhancements. In the short-term this report has identified eight categories of activities that a utility can implement over an initial two-year period to begin to enhance security. These short-term activities can be described as raising awareness and maximizing existing security technology tools and policies. These activities are designed to bring security to the forefront, immediately increase at least security awareness, and provide an accurate security baseline from which to plan long-term activities. The long-term enhancement prong of the Trident Approach is designed for implementation from years two through seven. The activities here include implementation of changes identified in the first two years, strategic planning, cost-benefit analysis, development and implementation of missing security components and the hardening of facilities. The final prong of the trident addresses the securing of future facilities. These activities can begin immediately and address the siting, design, and hardening of facilities during the planning phase forward. Table 5.1 is a compilation of the priority activities associated with each prong of the Trident Approach.
As every distribution system is different, so is each system’s approach to security. Depending on the specifics of a given system and other security measures already in place or planned there may be alternatives to addressing additional security. As stated early in this report, it is not possible to identify specific security measures for every component of a distribution system applicable to all utilities. However, Table 5.2 identifies the potential security classifications (physical security, cyber security, policies/procedures, and operational revisions) that are available to address categories of vulnerabilities for identified vulnerable components of the distribution system. For example, the vulnerability of the SCADA network to insider intrusion can be addressed by physical security, cyber security, or policy and procedure approaches. As Table 5.2 shows, when utility control over a particular element decreases, the reliance on physical security increases.
If the need to secure water systems continues to be a reality of modern water utility operation, then securing the distribution will be a significant challenge. Doing so with existing security measures, attitudes, and procedures will not likely be adequate. In the future, providing an enhanced level of security at existing and new facilities will require a shift in perception, attitudes, procedures, policies, priorities and approaches to design.
©2005 AwwaRF. All rights reserved.
91
Table 5.1 Summary of priority short-term, long-term, and future facility security enhancement activities
Type of activity Priority Activity
Planning Communication Training/ education
Physical enhancement Operational
Short-term Activities Staff awareness and training pertaining to heightened level of security
•
Development of public awareness of utility facility activity
•
Develop an Emergency Response and Communications Plan • •
Installation of tamper seals on fire hydrants
• • Develop means of internal and external (including local and federal law enforcement) two-way exchange of threat information
•
Establish, implement and enforce SCADA/IT policies
• • •
Develop an Intrusion Incident Response Plan in coordination with local fire/police • • •
Formalize and conduct equipment inspection and exercising
• Reduce excess chemical storage in the distribution system
• Develop and be familiar with an accurate system hydraulic model for use under emergency response scenarios
• •
Long-term Activities Conduct detailed cost-benefit risk analysis • •
Formalize emergency communications •
Functionalize Emergency Response Plan • • •
Develop system operational baseline •
Implement physical security enhancements
•
Future Facility Activities Operation Redundancy and Separation of Redundancy • • • • Access Control
• Design/Site Selection • • • • Progressive Security Measures • • • • •
©2005 AwwaRF. All rights reserved.

92
©2005 AwwaRF. All rights reserved.
93
Table 5.2 Summary of potential security options for distribution system component vulnerabilities.
Physical Security Options Cyber Security Options Policy/Procedure Security Options Operational Revision Options▼
Distribution System Component
Typ
e of
Vul
nera
bilit
y or
Lim
itatio
n
Ope
n re
serv
oirs
Cov
ered
rese
rvoi
rs
Air
vent
s
Res
ervo
ir in
lets
/out
lets
Acc
ess h
atch
es
Sam
ple
taps
Pres
sure
mon
itorin
g de
vice
s
SCA
DA
Net
wor
k
SCA
DA
cab
les
SCA
DA
tele
met
ry
Rem
ote
SCA
DA
ope
ratio
ns
Util
ity W
ebsi
te
Dis
infe
ctio
n sy
stem
s
Che
mic
al st
orag
e fa
cilit
ies
Che
mic
al in
ject
ion
syst
ems
Pum
p st
atio
ns
Pum
p st
atio
n sw
itchg
ear
Pum
p st
atio
n tra
nsfo
rmer
s
Pow
er su
pplie
s
Pow
er c
onne
ctio
ns
Expo
sed
trans
mis
sion
and
di
strib
utio
n cr
ossi
ngs
Tran
smis
sion
mai
ns
Hyd
rant
s
Blo
w-o
ffs
Air
valv
es
Mai
n V
alve
s
Serv
ice
conn
ectio
ns
Serv
ice
met
ers
Bac
kflo
w d
evic
es
Sprin
kler
syst
ems
Dis
tribu
tion
syst
em
docu
men
ts/m
aps
Dis
tribu
tion
cons
truct
ion
and
repa
ir si
tes
Vau
lts
Util
ity in
terd
epen
danc
ies
Inte
rties
Com
mun
icat
ion
Syst
ems
Cyber Intrusion
NA NA NA
NA NA
NA
NA NA
NA NA NA NA NA NA NA NA NA NA NA NA NA NA NA
Insider Intrusion
Outsider Intrusion
▼
▼
▼
Physical Access
▼
▼
▼
Vehicle Access
NA NA NA NA NA NA NA NA NA NA
Air Access
NA NA NA NA NA NA NA NA NA NA NA NA NA NA NA NA NA NA NA NA NA NA NA NA NA NA NA NA NA
Public Access
NA NA NA NA NA NA NA NA
NA NA NA
Detection/Response Limitation
▼
▼
▼
▼
▼
▼
▼ ▼
▼ ▼ ▼ ▼ ▼ ▼ ▼ ▼ ▼ ▼ ▼ ▼ ▼ ▼ ▼ ▼ ▼ ▼ ▼ ▼
▼ NA
▼
▼
▼
▼
▼
©2005 A
ww
aRF
. All rig
hts reserved
.

94
©2005 A
ww
aRF
. All rig
hts reserved
.
95
REFERENCES
American Society of Civil Engineers. 1998. Report Card for America’s Infrastructure.
Washington, D.C.: ASCE. American Water Works Association. 1973. AWWA Manual M20 – Water Chlorination
Principles and Practices. Denver, CO: AWWA. American Water Works Association. 1986. AWWA Manual M6 – Water Meters-Selection,
Installation, Testing, and Maintenance. Denver, CO: AWWA. American Water Works Association. 1989. AWWA Manual M17 – Installation, Field Testing,
and Maintenance of Fire Hydrants. Denver, CO: AWWA. American Water Works Association. 1990. AWWA Manual M14 – Recommended Practice for
Backflow Prevention and Cross-Connection Control. Denver, CO: AWWA. American Water Works Association and American Water Works Association Research
Foundation. 1992. Water Industry Database: Utility Profiles. Denver, CO: AWWA. American Water Works Association. 1995. Water Treatment. Denver, CO: AWWA. American Water Works Association. 1996. Water Transmission and Distribution. Denver, CO:
AWWA. American Water Works Association and American Society of Civil Engineers. 1998. Water
Treatment Plant Design. Denver, CO: AWWA. American Water Works Association and Economic and Engineering Services. 2002. Distribution
System White Papers - Finished Water Storage Facilities (Covered Storage). Available: www.epa.gov/safewater/tcr/tcr.html#distribution [cited September 1, 2003]
Bowen, Paul T., J.F. Harp, J.M. Entwistle,, Jr., J.E. Hendricks and M. Shoeleh. 1991. Evaluating Residential Water Meter Performance. Denver, CO: AwwaRF and AWWA.
Burlingame, G.A., and J.J. Choi. 1998. Philadelphia's Guidelines for Obtaining Representative Samples From Throughout Drinking Water Systems. In Proc. of the 1998 Water Quality Technology Conference. Denver, Colo.: AWWA.
Connell, G.F. 1996. The Chlorination/Chloramination Handbook. American Water Works Association. Denver, CO: AWWA.
Commonwealth of Pennsylvania Department of Environmental Protection. 2004. Small Drinking Water Systems Technology Report: On-Site Sodium Hypochlorite Generation. Fact Sheet 2708.
Craun G. F. and L.J. McCabe. 1973. Review of the Causes of Waterborne Disease Outbreaks. Jour. AWWA 65(1):74-84.
Economic and Engineering Services and Kennedy/Jenks/Chilton. 1989. Economics of Internal Corrosion Control. Denver, CO: AWWA and AwwaRF.
Friedman, M., L. Radder, S. Harrison, D. Howie, M. Britton, G. Boyd, H. Wang, R. Gullick, M. LeChevallier, D. Wood and J. Funk. 2003. Verification and Control of Pressure Transients and Intrusion in Distribution Systems. Denver, CO: AwwaRF.
Gates, Don. 1998. The Chlorine Dioxide Handbook. Denver, CO: AWWA. Great Lakes Upper Mississippi River Board of State Public Health and Environmental Managers.
1997. Recommended Standards for Water Works. Albany, NY: Health Education Services.
Kirmeyer, Gregory J., W. Richards, and C.D. Smith. 1994. An Assessment of Water Distribution System and Associated Research Needs. Denver, CO: AWWA and AwwaRF.
©2005 AwwaRF. All rights reserved.
96
Kirmeyer, Gregory J., L. Kirby, B. Murphy, P. Noran, K. Martel. T. Lund, J. Anderson, and R. Medhurst. 1999. Maintaining Water Quality in Finished Water Storage Facilities. Denver, CO: AWWA and AwwaRF.
Kirmeyer, G.J., M. Friedman, J. Clement, A. Sandvig, P.F. Noran, K. Martel, D. Smith, M. LeChevallier, C. Volk, E. Antoun, D. Hiltebrand, J. Dykesen, and R. Cushing. 2000. Guidance Manual to Maintain Distribution System Water Quality. Denver, Colo.: AwwaRF and AWWA.
Kirmeyer, G.K., M. LeChevallier, M. Friedman, K. Martel, D. Howie, M. Abbaszadegan, M. Karim, J. Funk, and J. Harbour. 2001. Pathogen Intrusion into the Distribution System. AwwaRF and AWWA, Denver CO.
Kirmeyer, G.J., M. Friedman, K. Martel, G. Thompson, A. Sandvig, J. Clement, and M. Frey, 2002. Guidance Manual for Monitoring Distribution System Water Quality. Denver, Colo.: AwwaRF and AWWA.
LeChevallier, M.W., R.W. Gullick, M. Karim. 2002. Distribution System White Papers - The Potential for Health Risks from Intrusion of Contaminants into the Distribution System from Pressure Transients (Intrusion). Available: www.epa.gov/safewater/tcr/tcr.html#distribution [cited September 1, 2003]
Lippy E.C. and S.C. Waltrip. 1984. Waterborne Disease Outbreaks, 1946-1980: a Thirty-five Year Perspective. Jour. AWWA 76(2), 60-67.
Mays, Larry W. 2000. Water Distribution Systems Handbook. McGraw Hill, New York. National Response Team (NRT). 2004. ICS/UC Technical Assistance Document. Washington,
D.C.: USEPA National Response Team Committee. Occidental Chemical Corporation. N.d. Product Information Manual – Caustic Soda. Niagara
Falls, NY: Occidental Chemical Corporation. Pierson, G., K. Martel, A. Hill, G. Burlingame, A. Godfree. 2001. Practices to Prevent
Microbiological Contamination of Water Mains. Denver, CO: AwwaRF and AWWA. Philadelphia Water Department. 1991. Internal memorandum from E. Poaches to J. Choi. Reves, D.M., J.E. Funk, D.J. McClain, and D.B. Montgomery. 1996. The Effect of Air Valve
Sizing on Hydraulic Transients: Long Standing Problem Solved With the Use of Computerized Surge Model. Proceedings from the AWWA Distribution System Symposium. Denver, CO: AWWA.
Sanks, Robert L., G. Tchobanoglous, B. Bosserman II, G. Jones. 1998. Pumping Station Design. Boston, Mass: Butterworth Heinemann.
United States Navy, Environmental Program. June 2001. Navy Environmental Quality Fact Sheet: Do you use chlorine gas or bulk sodium hypochlorite for disinfection?
U.S. Environmental Protection Agency. 1997. Drinking Water Infrastructure Needs Survey – First Report to Congress. Washington D.C.: USEPA Office of Water.
U.S. Environmental Protection Agency. 2002a. Long Term 1 Enhanced Surface Water Treatment Rule. Federal Register – January 14, 2002. USEPA.
U.S. Environmental Protection Agency. 2002b. Potential Contamination Due to Cross-Connection and Backflow and the Associated Health Risks. Washington D.C.: USEPA Office of Ground Water and Drinking Water.
Welter, Gregory J. George B. Rest, Karen L. Moran. 2003. Actual and Threatened Security Events at Water Utilities. Denver, CO: AwwaRF.
©2005 AwwaRF. All rights reserved.

97
ABBREVIATIONS and ACRONYMS
AC Asbestos cement AG Air gap ASCE American Society of Civil Engineers ASDWA Association of State Drinking Water Administrators AVB Atmospheric vacuum breaker AWWA American Water Works Association AwwaRF Awwa Research Foundation CI Cast Iron DCVA Double check valve assembly DI Ductile Iron DOT Department of Transportation EPS Extended period simulation ERCP Emergency Response and Communications Plan FBI Federal Bureau of Investigation gal gallon gpm gallon per minute HACCP Hazard Analysis of Critical Control Points ICS/UC Incident Command System/ Unified Command ISAC Informational Security Activity Clearinghouse IT information technology km kilometer mgd million gallons per day mi mile mm millimeter NIPC National Infrastructure Protection Center OSHA Occupational Safety and Health Administration PDD-63 Presidential Decision Directive 63 POU point-of-use PRV Pressure reducing valve PVB Pressure vacuum breaker PVC Polyvinyl chloride
©2005 AwwaRF. All rights reserved.
98
RAS Remote access service RPBA Reduced-pressure principle backflow assembly SCADA System Control and Data Analysis SOP Standard Operating Procedures SVB Spill-resistant vacuum breaker UDM Uni-directional Meter USEPA United States Environmental Protection Agency VA Vulnerability Assessment
©2005 AwwaRF. All rights reserved.

6666 West Quincy AvenueDenver, CO 80235-3098 USAP 303.347.6100www.awwarf.orgemail: [email protected]
Sponsors Research
Develops Knowledge
Promotes Collaboration
1P-8C-91066F-05/05-CM