district mission: flood risk management (added benefits
TRANSCRIPT
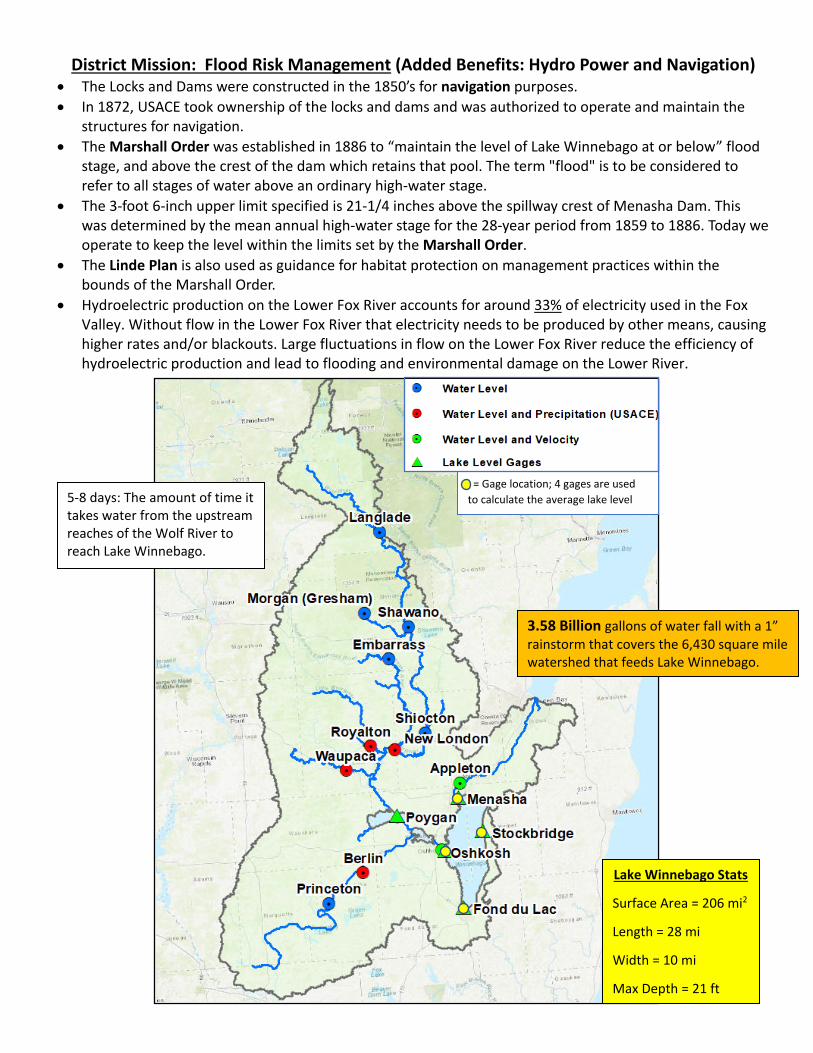
= Gage location; 4 gages are used to calculate the average lake level
3.58 Billion gallons of water fall with a 1” rainstorm that covers the 6,430 square mile watershed that feeds Lake Winnebago.
5‐8 days: The amount of time it takes water from the upstream reaches of the Wolf River to reach Lake Winnebago.
Lake Winnebago Stats
Surface Area = 206 mi2
Length = 28 mi
Width = 10 mi
Max Depth = 21 ft
District Mission: Flood Risk Management (Added Benefits: Hydro Power and Navigation) The Locks and Dams were constructed in the 1850’s for navigation purposes. In 1872, USACE took ownership of the locks and dams and was authorized to operate and maintain the
structures for navigation. The Marshall Order was established in 1886 to “maintain the level of Lake Winnebago at or below” flood
stage, and above the crest of the dam which retains that pool. The term "flood" is to be considered to refer to all stages of water above an ordinary high‐water stage.
The 3‐foot 6‐inch upper limit specified is 21‐1/4 inches above the spillway crest of Menasha Dam. This was determined by the mean annual high‐water stage for the 28‐year period from 1859 to 1886. Today we operate to keep the level within the limits set by the Marshall Order.
The Linde Plan is also used as guidance for habitat protection on management practices within the bounds of the Marshall Order.
Hydroelectric production on the Lower Fox River accounts for around 33% of electricity used in the Fox Valley. Without flow in the Lower Fox River that electricity needs to be produced by other means, causing higher rates and/or blackouts. Large fluctuations in flow on the Lower Fox River reduce the efficiency of hydroelectric production and lead to flooding and environmental damage on the Lower River.

FALL DRAWDOWN Fall drawdown of the lake has historically began on September 1st. In more recent years, the drawdown has officially begun on October 1st. This was based on input received from stakeholders to allow for more recreation use of the lake in September. A gradual drawdown is done based upon the input from the DNR for habitat protection.
WINTER POOL In January/February, basin conditions (snow pack, soil conditions, river levels, etc.) and the spring weather outlook are reviewed. A drawdown target is agreed upon with stakeholders and held until ice‐out is achieved. This is done to mitigate springtime flooding, ice‐shoves, and shoreline erosion. “Ice‐out“ has occurred anywhere from March 17th to April 20th in the past 15 years.
SPRING FILL The spring fill is attempted to be done at a slow, gradual rate which are key components for improving water quality and habitat. Spring rainstorms can often pop‐up and/or be more intense than expected. Therefore, to the best our ability, the lake is maintained within the strategy band. A target of 2.5 is set for May 1st with another gradual increase to 2.9 by June 15th.
SUMMER POOL Once summer pool is achieved it is held, to the best of our ability, within the strategy band. As summer storms occur, gate movements are made in effort to maintain the level within the strategy band. Gradual flow changes are made throughout the regulation year. Large flow changes cause localized flooding, erosion, and ecological damage on the Lower Fox River
LAKE WINNEBAGO REGULATION STRATEGY Over 80% of the year the water level is attempted to be maintained within a very tight window of 2 3/8 inches. 21 ½ inches is the maximum water level change from “Summer Pool” to the lowest “Winter
Drawdown” level.
*Oshkosh Datum
is th
e he
ight re
lativ
e to th
e spillway crest
elevation at th
e Men
asha
Dam
. The crest e
levatio
n of th
e dam is
equal to 1.68
’. The
summer poo
l level of 2
.9’ is e
qual to
1’‐2
5/8”
above the dam crest
*
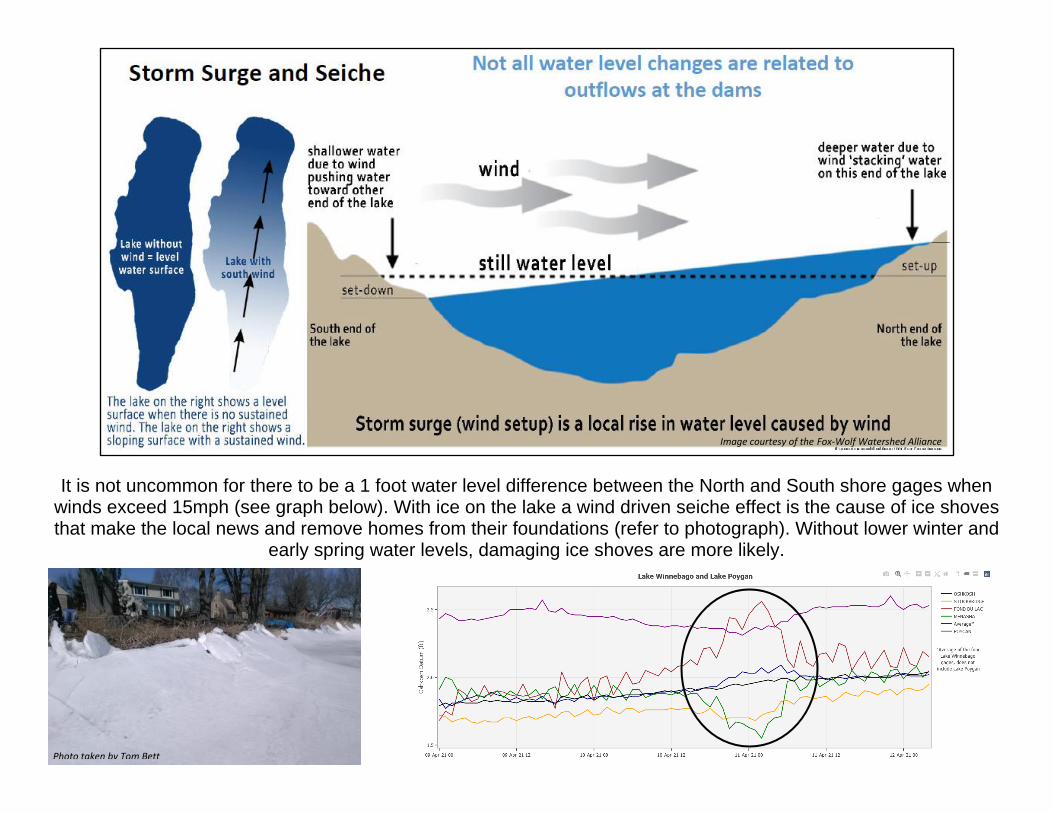
It is not uncommon for there to be a 1 foot water level difference between the North and South shore gages when winds exceed 15mph (see graph below). With ice on the lake a wind driven seiche effect is the cause of ice shoves that make the local news and remove homes from their foundations (refer to photograph). Without lower winter and
early spring water levels, damaging ice shoves are more likely.
Image courtesy of the Fox-Wolf Watershed Alliance
Photo taken by Tom Bett
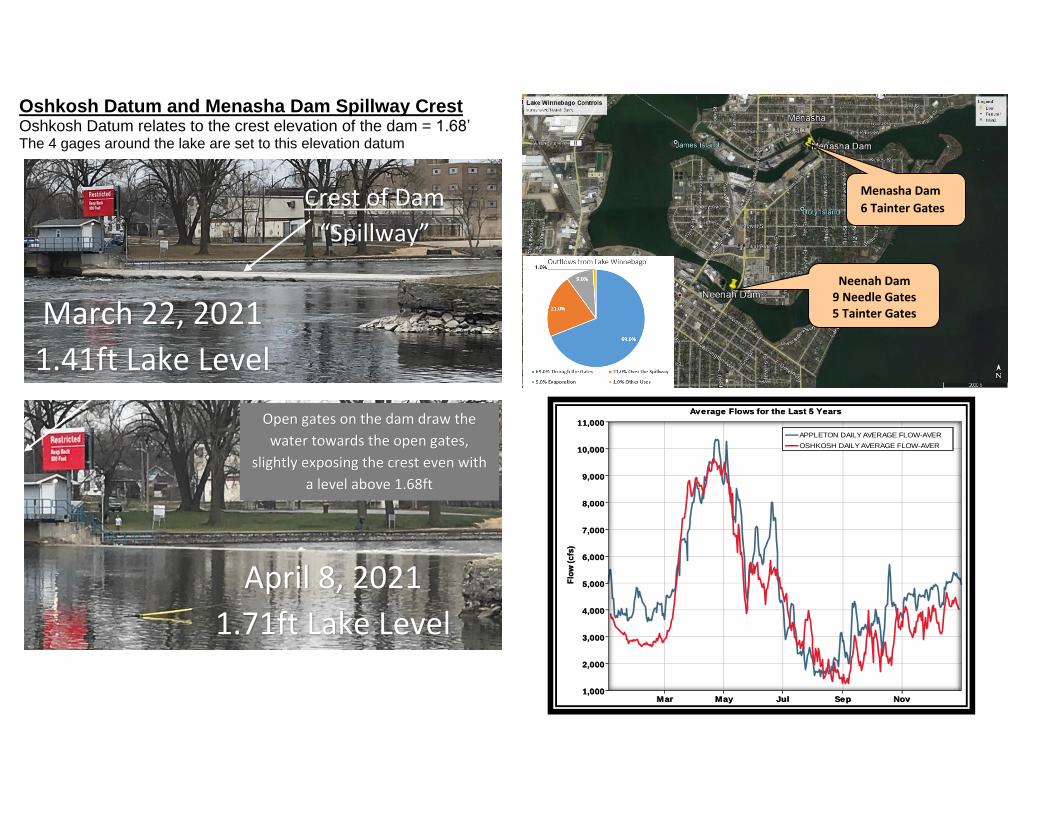
Oshkosh Datum and Menasha Dam Spillway Crest Oshkosh Datum relates to the crest elevation of the dam = 1.68’ The 4 gages around the lake are set to this elevation datum
APPLETON DAILY AVERAGE FLOW-AVER
OSHKOSH DAILY AVERAGE FLOW-AVER
Mar May Jul Sep Nov
3000
Flo
w (
cfs
)
1,000
2,000
3,000
4,000
5,000
6,000
7,000
8,000
9,000
10,000
11,000
Average Flows for the Last 5 Years
March 22, 2021
1.41ft Lake Level
April 8, 2021
1.71ft Lake Level
Menasha Dam
6 Tainter Gates
Neenah Dam 9 Needle Gates 5 Tainter Gates
Crest of Dam
“Spillway”
Open gates on the dam draw the
water towards the open gates,
slightly exposing the crest even with
a level above 1.68ft