district progress report fall … · 2017-11-08 · district progress report fall 2017 staying...
TRANSCRIPT

DISTRICT PROGRESS REPORTFALL 2017
Staying focu
sed on
What is most
important
This year, our district launched an ambitious effort with our community to identify what is working, what is not, and where we need to go for the NEXT 5 years in Natomas Unified School District. There have been a lot of successes in NUSD, but there is still work to do. Today, we are proud to share our first District Progress Report which is like a checkup to see how we are doing along the way to achieve our district goals through 28 strategic directions.
This District Progress Report is a snapshot of our daily work as we prepare all of our students to graduate as college and career ready, productive, responsible, and engaged global citizens. It keeps us focused on supporting all of our students with particular attention on our English Learners, students of poverty, students of color, and foster students. It also provides consistency and reassurance that we will monitor our strategic directions, and share our progress twice a year.
www.natomasunified.org/dpr

Message from the Superintendent
This is Natomas Unified’s first District Progress Report. This progress report puts the various state and local measures of student success in one place, continuing our theme of transparency. In these pages, we show where we are succeeding, where we are making progress, and where we need to improve. This data is reviewed in principal meetings, staff meetings, and within the Boardroom. In this booklet, it is available for all to see. These aren’t final “grades;” these are works in progress. It’s a progress report like we had when we were in school. We will celebrate the good news and take actions to address the areas of need. I take great pride in our efforts. We have a great staff, strong Board leadership, and a wonderful community. We also have more work to do and the sense of urgency to prepare all of our students to graduate as college and career ready, productive, responsible, and engaged global citizens. Moving forward, we have efforts in place to engage our community in which other metrics for success can be included in our elementary schools. Right now, our progress report is secondary school “heavy.” Please take the time to look through this and talk to your school principals about your school and what this means for your student and community.
- Chris Evans, Superintendent
Message from the Board President
Every family in Natomas Unified has a stake in this District Progress Report because it provides valuable insight into our district’s performance and student learning. Data is tracked annually over three years, making it easier to spot trends. This report also reflects our commitment to keep you informed of progress toward meeting community priorities listed in “The Next 5” strategic plan. We look forward to continuing our work with you to ensure that all students graduate from high school prepared for a bright future in college and/or a career. We’re honored to serve you and pleased to provide this report.
- Lisa Kaplan, NUSD Board President
BOARD OF TRUSTEES
Lisa KaplanPresident
Dr. Susan HerediaVice President
Micah GrantClerk
B. Teri BurnsMember
Scott DosickMember
SUPERINTENDENTChris Evans
OTHER INFORMATION301
● Throughout this report, on each of the metrics, some of the actions that are underway in NUSD to supportour students, staff, and school are listed. For an explanation of how we’re addressing metrics in red, and toview some other actions in place, visit our NUSD LCAP at: www.natomasunified.org/lcfflcap
● Current status indicators and colors for high, medium, and low performance were selected based on: 1)comparisons to State and other local districts, 2) using research in K-12 education, and/or 3) comparisons toprevious performance in Natomas Unified School District.
● Unless otherwise noted on the bottom of individual pages, the data on those pages include results from allNUSD schools, including independent charter schools.
● Data in this report are drawn from the most up-to-date resources available in NUSD at the time of printing.The data in this report do not necessarily match data on the California School Dashboard or CaliforniaDepartment of Education website because in some cases, those websites present data that are one or twoyears old, and may include charter school results.
● Data are presented for the four largest student groups in NUSD: African American, Asian, Hispanic, & White.
● Some data charts may not add up to 100% because American Indian/Alaska Native, Native Hawaiian orOther Pacific Islander, Students with Two or More Races, and Students without a reported Race are includedin the overall data but do not have individual graphs.
● Visit our website to learn more about NUSD & the District Progress Report: www.natomasunified.org/dpr

All NUSD students
graduate as college
and career ready,
productive,
responsible, and
engaged global
citizens
VISION
SOME ACTIONS IN PROGRESS
TARGETALL STUDENTS
Asian
African American Hispanic/Latino
White
English Learners
Foster
Low Income
Students with Disabilities
100%
80%
60%
40%
20%
0%
100%
50%
0%
100%
50%
0%
100%
50%
0%
100%
50%
0%
100%
50%
0%
100%
50%
0%
100%
50%
0%
100%
50%
0%
English Learner Redesignation Rate is the total number of English Learner (EL) Students who were redesignated between the last two annual census dates (first week of October) divided by the total number of English Learners at the first of those two census dates. Know that after a student is redesignated, we continue to monitor their progress for four additional years, and provide support as needed. Some of the metrics in this report show lower performance for EL Students in part because once a student demonstrates higher academic performance they may also redesignate to Fluent English Proficient. Note that there are very few African American EL Students, fewer than 20 of the 2,000 EL students, therefore redesignation rates for that group can change dramatically from year to year.
Natomas Unified School District Successes
Building on a commitment to excellence and achievement, the District Progress Report measures our progress over time to achieve our district vision and goals. Over the past five years, some of our successes include:
● Increased enrollment to 15,000students
● Increased graduation rates andlowered dropout rates
● Became a Sacramento Countyleader in the percentage ofgraduates meeting requirements toenroll in the University of Californiaor California State Universitysystems
● Became the first school districtcountywide to offer an InternationalBaccalaureate continuum fromTransitional Kindergarten through12th grade
● Expanded Career TechnicalEducation opportunities, includingCulinary Arts, Auto Technology,Broadcast Media, and EmergencyMedical Technician
● Expanded access to Gifted andTalented Education (GATE)
● Won national recognition by theCollege Board for AdvancedPlacement (AP) course access andsuccess
● Launched the academicallyrigorous AP Capstone Diplomaprogram at Natomas High School
● Received statewide recognition by theCalifornia Department of Education forexemplary practices at multiple schools
● Implemented a California Early CollegeAcademy, which allows high schoolstudents to earn college credits atAmerican River College while attendinghigh school
● Won voter passage of Measure J, a $129million school bond directed to fundcampus construction, renovation,security and other projects
● Opened the B. Teri Burns Health Clinicat Natomas High School to providebasic care, vaccinations, flu shots, andinformational workshops
● Launched an elementary school sportsprogram to promote studentengagement, school spirit, health andwellness
● Launched a free, on-campus ACTcollege admissions test program for alleleventh graders, with over 90%participation
● Received statewide awards for bestpractices in Constituent and CustomerServices and K-12 Continuum ofSocial-Emotional Support for students'behavioral and mental health needs
15%or higher
Designated English Language Development
WIN time for elementary students
EL training for teachers and Specially Designed Academic Instruction in English (SDAIE) training for MS and HS teachers
Site support data analysis
Parent University
District English Language Advisory Committee (DELAC) workshops
Note: These graphs do not include Natomas Charter School students. The redesignation rates displayed above are reported from the year the student was redesignated. This is different than the State of California, which reports the rate during the following year.
2015 2016 2017 2015 2016 2017
2015 2016 2017
2015 2016 2017
2015 2016 20172015 2016 2017
2015 2016 20172015 2016 2017
2015 2016 2017
16%5% 6%
24% 15%29%
13% 9%25%
21% 12%17% 10%18%
18% 12%
18%
5% 4% 6%
NA: fewer than 10 students
18% 12% 21%
NUSD has the highest A-G rate in SacramentoCounty, and the highestA-G rate for Asian,African American, Hispanic/Latino, White,English Learners, andlow income students.
21%
ENGLISH LEARNER REDESIGNATION RATE DISTRICT SUCCESSES - THE PAST FIVE YEARS229

SOME ACTIONS IN PROGRESS
TARGETALL STUDENTS
Asian
African American Hispanic/Latino
White
English Learners
Foster
Low Income
Students with Disabilities
100%
80%
60%
40%
20%
0%
100%
50%
0%
100%
50%
0%
100%
50%
0%
100%
50%
0%
100%
50%
0%
100%
50%
0%
100%
50%
0%
100%
50%
0%
ABOUT THE DISTRICT PROGRESS REPORT ENGLISH LEARNER PROGRESS
The District Progress Report is a snapshot of our efforts to prepare all of our students to graduate as college and career ready, productive, responsible, and engaged global citizens. It keeps us focused on supporting all our students with attention on specific groups of students, and it provides consistency and reassurance that these priorities will be monitored and our progress will be shared regularly.
The District Progress Report is a tool for measuring our progress aligned to our Theory of Action for Student Success, a Board adopted policy that states:
This report is a tool for parents, teachers, students, and community members to monitor our performance and our progress. Continuous Improvement does not mean that scores will improve every year. There may be little growth some years, significant improvement other years, and some years there may be declines in our performance. Successful school districts, just like successful companies, may have years without growth, or even declines. Like other successful organizations, we can learn from mistakes, celebrate successes, and make continuous improvement over time.
With that in mind, the metrics on the following pages provide both a snapshot of current data, as well as progress over time. Each metric has an identified target and some of the actions that are currently in progress to support students in that area of work.
The Board of Trustees believes that “progress over time” is more essential than a snapshot in time of student achievement results. The Board of Trustees will monitor student and staff progress over time following the Cycle of Continuous Learning and Improvement (CCLI) for these Theory of Action elements to make policy and budgeting decisions to ensure that student success remains the primary focus of the Natomas Unified staff.
283
70%
Designated English Language Development
WIN time for elementary students
EL training for teachers and Specially Designed Academic Instruction in English (SDAIE) training for MS and HS teachers
Site support data analysis
Parent University
District English Language Advisory Committee (DELAC) workshops
English Learner Progress is the total number of English Learners who improve one level or more on the Annual State test for English Learners or remain at one of the top two levels divided by the total number of English Learners who took the annual state test for English Learners. The State of California is changing annual tests from the CELDT to the ELPAC. NUSD will make this shift with our metrics in 2018 and 2019. The California State Dashboard reports EL Progress as a combination of test progress and redesignation rate, but NUSD reports these metrics separately.
Note: Data on this page does not include results from NUSD independent charter schools.
2015 2016 20172015 2016 2017
2015 2016 2017
2015 2016 2017
2015 2016 20172015 2016 2017
2015 2016 20172015 2016 2017
2015 2016 2017
67% 65%
27%
64% 71%
70% 68% 71%
66% 63% 64%
63%81% 71%
67% 63% 64%
33%38%
52%
67% 65% 66%
NA: fewer than 10 students
66%
SOME ACTIONS IN PROGRESS
TARGET
SOME ACTIONS IN PROGRESS
TARGETALL STUDENTS
Asian
African American Hispanic/Latino
White
English Learners
Foster
Low Income
Students with Disabilities
100%
80%
60%
40%
20%
0%
100%
50%
0%
100%
50%
0%
100%
50%
0%
100%
50%
0%
100%
50%
0%
100%
50%
0%
100%
50%
0%
100%
50%
0%
AP/IB PASS RATE ENGAGEMENT - ACCESS AND READINESS
Students at NHS, DHS, IHS, LGA studetns in 1617 who took at AP or IB class (includes IB SL and HL) with an S1 or S2 grade
Divided by students in grades 9-12 at those schools enrolled at CBEDS
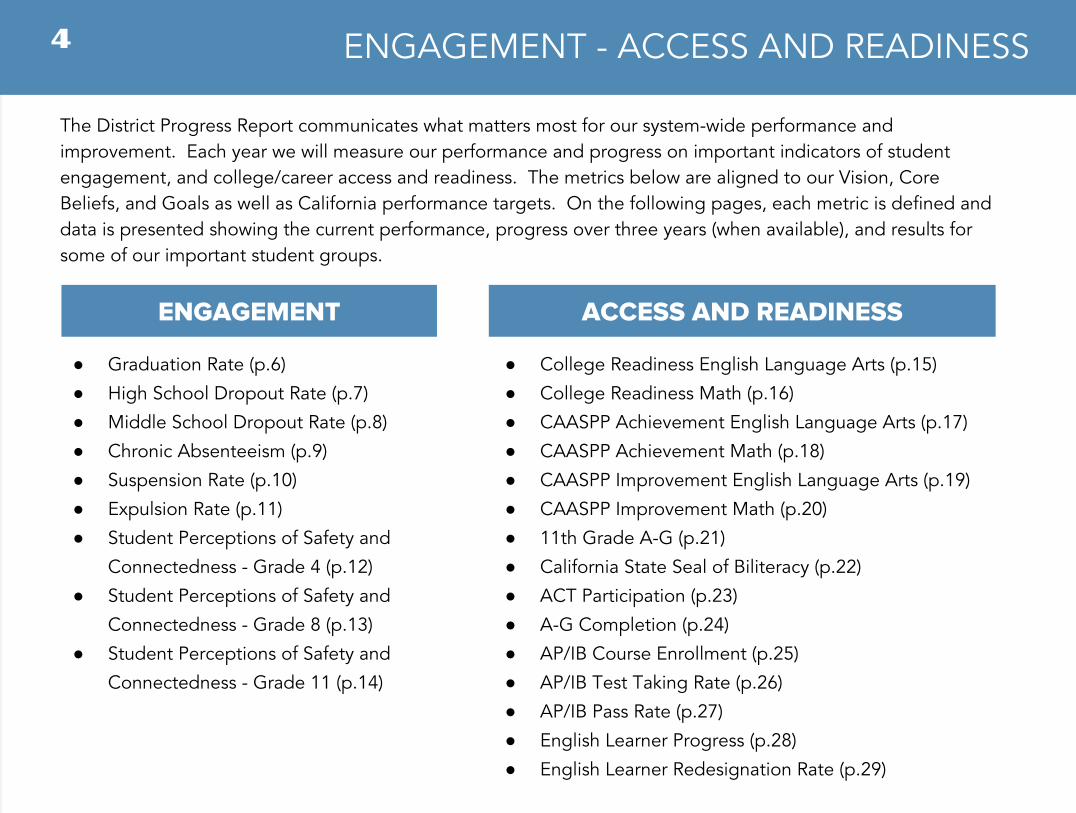
ENGAGEMENT ACCESS AND READINESS
● Graduation Rate (p.6)
● High School Dropout Rate (p.7)
● Middle School Dropout Rate (p.8)
● Chronic Absenteeism (p.9)
● Suspension Rate (p.10)
● Expulsion Rate (p.11)
● Student Perceptions of Safety and
Connectedness - Grade 4 (p.12)
● Student Perceptions of Safety and
Connectedness - Grade 8 (p.13)
● Student Perceptions of Safety and
Connectedness - Grade 11 (p.14)
● College Readiness English Language Arts (p.15)
● College Readiness Math (p.16)
● CAASPP Achievement English Language Arts (p.17)
● CAASPP Achievement Math (p.18)
● CAASPP Improvement English Language Arts (p.19)
● CAASPP Improvement Math (p.20)
● 11th Grade A-G (p.21)
● California State Seal of Biliteracy (p.22)
● ACT Participation (p.23)
● A-G Completion (p.24)
● AP/IB Course Enrollment (p.25)
● AP/IB Test Taking Rate (p.26)
● AP/IB Pass Rate (p.27)
● English Learner Progress (p.28)
● English Learner Redesignation Rate (p.29)
The District Progress Report communicates what matters most for our system-wide performance and improvement. Each year we will measure our performance and progress on important indicators of student engagement, and college/career access and readiness. The metrics below are aligned to our Vision, Core Beliefs, and Goals as well as California performance targets. On the following pages, each metric is defined and data is presented showing the current performance, progress over three years (when available), and results for some of our important student groups.
427
40%
Increased access to AP/IB courses
Offering AP/IB exams at no cost for our students
Increased co-curricular programs, such as study sessions and practice tests to prepare students
AP/IB Pass Rate is the total number of students who pass an AP or IB exam divided by the total number of test takers. NUSD measures the student pass rate, rather than the test pass rate, because our intention is to give as many students as possible the opportunity to take an advanced course and pass a college level exam. In the 2017 school year, we expanded access to AP classes and testing in large numbers. It is normal when expanding access to see a slight drop in the overall pass rate. At both Leroy Greene Academy and Natomas High School, test taking as well as pass rates increased in 2017. The total number of English Learners passing an AP/IB exam has grown each of the past three years, but the number of test takers more than tripled in 2017, leading to a drop from 60% to 24%.
2015 2016 2017 2015 2016 2017
2015 2016 2017
2015 2016 2017
2015 2016 20172015 2016 2017
2015 2016 20172015 2016 2017
2015 2016 2017
Note: Data on this page does not include results from NUSD independent charter schools.
9%23% 19%
24%39%
31%32% 39% 33%
24%35%
50%60%
35%40% 39%
26% 36%
33%
24%
NA: fewer than 10 students
NA: fewer than 10 students
32%

SOME ACTIONS IN PROGRESS
TARGETALL STUDENTS
Asian
African American Hispanic/Latino
White
English Learners
Foster
Low Income
Students with Disabilities
100%
80%
60%
40%
20%
0%
100%
50%
0%
100%
50%
0%
100%
50%
0%
100%
50%
0%
100%
50%
0%
100%
50%
0%
100%
50%
0%
100%
50%
0%
ENG
AG
EMEN
TA
CCES
S &
REA
DIN
ESS
AP/IB Pass Rate
CAASPP ELA CAASPP Math CAASPP Improvement from Level 1 - ELA
CAASPP Improvement from Level 1 - Math
A-GCompletion
AP/IB Test Taking Rate
11th Grade A-G
AP/IB Course Enrollment
College Ready ELA
Graduation Rate High School Dropout Rate Suspension Rate
Expulsion Rate
Chronic Absentee Rate
ACT Participation
EL Redesignation Rate
CA State Seal of Biliteracy
English Learner Progress
College Ready Math
DISTRICT PROGRESS REPORT AP/IB TEST TAKING RATE
15%
33%
61%
26%
26%
32%
68%
43%
31%
44%
7.7%0.9%
92%
0.2% 11%95%
0.1%
29%
92%
66%
AP/IB Test Taking Rate is the total number of students taking at least one exam divided by the total number of students enrolled in grades 9-12 the first week of October that school year. This year, we saw a big increase in the number of students taking an exam. The Board of Education committed extra resources to ensure that all students who take an AP/IB class can also take the exam because NUSD pays for the AP/IB test fees. NUSD is also shrinking the gap on the percent of students enrolled in an AP/IB course and the percent taking the exam from a 12% gap in 2016 to a 5% gap in 2017.
21%
115
265
Note: Data on this page does not include results from NUSD independent charter schools.
2015 2016 2017 2015 2016 2017
2015 2016 2017
2015 2016 2017
2015 2016 20172015 2016 2017
2015 2016 20172015 2016 2017
2015 2016 2017
9% 15%
5% 8%16%
22%
42%61%
8%14%
22%
12% 17%31%
10% 15% 23%
0% 0% 1%
1% 1%5%
NA: fewer than 10 students
16%
Increased access to AP/IB courses
Offer AP/IB exams at no cost for our students
Increase information for AP/IB opportunities for students who are not typically enrolled in AP/IB courses
42%
11th Grade Perceptions of Safety & Connectedness
53%
Middle School Dropout Rate
8th Grade Perceptions of Safety & Connectedness
4th Grade Perceptions of Safety & Connectedness
Trend Indicators (arrows and lines designate change over time)No arrow or line means there was no data in the previous year to compare
Improved performance, or meets or exceeds target
Little or no change, or inconsistent
Declining performance
Current Performance Indicators
High performance
Medium performance
Low performance
Not yet able to determine
26%

SOME ACTIONS IN PROGRESS
TARGETALL STUDENTS
Asian
African American Hispanic/Latino
White
English Learners
Foster
Low Income
Students with Disabilities
100%
80%
60%
40%
20%
0%
100%
50%
0%
100%
50%
0%
100%
50%
0%
100%
50%
0%
100%
50%
0%
100%
50%
0%
100%
50%
0%
100%
50%
0%
ALL STUDENTS
Asian
African American Hispanic/Latino
White
English Learners
Foster
Low Income
Students with Disabilities
SOME ACTIONS IN PROGRESS
TARGET
100%
80%
60%
40%
20%
0%
100%
50%
0%
100%
50%
0%
100%
50%
0%
100%
50%
0%
100%
50%
0%
100%
50%
0%
100%
50%
0%
100%
50%
0%
AP/IB COURSE ENROLLMENT GRADUATION RATE
Students at NHS, DHS, IHS, LGA students in 1617 who took at AP or IB class (includes IB SL and HL) with an S1 or S2 grade
Divided by students in grade 11 enrolled on test date
AP/IB Course Enrollment is the number of students taking at least one Advanced Placement (AP) or International Baccalaureate (IB) course divided by the total number of students enrolled in grades 9-12. Research shows that students who enroll in rigorous college level course work, such as AP or IB, are more prepared for college even if they do not pass that AP/IB exam. Natomas Unified is the first district in the region to offer a TK to 12th grade IB program. Natomas High School is an AP Capstone school. Because of these expanded offerings, more than 50% of our students take an AP or IB class before graduation.
Graduation Rate is the percent of students who graduate divided by the total number of students who began 9th grade four years earlier. NUSD has a high graduation rate - above the county and state averages - and NUSD has increased the graduation rate more than 10% over the past five years. The State of California reports graduation rates the following year (2017 rates are not yet available) on two different websites. On the Dataquest website, the 2016 graduation rate is reported and includes charter schools, but the California School Dashboard website reports the 2015 graduation rate for only Inderkum and Natomas High Schools. The data below is based on all NUSD schools’ rate, including charter schools and Discovery High School, our continuation high school.
Increased access to AP/IB courses
AP/IB exams at no cost for our students
Increased information for AP/IB opportunities for students who are not typically enrolled in AP/IB courses
Academic counseling and intentional student placement
30%
Expanded course offerings during the school year and in the summer
Aligned high school course catalogue
Academic counseling and intentional student placement
College and Career Coordination Specialists
Parent University workshops
Data analysis to meet individual students’ needs
90% 88% 92%
2014 2015 2016
2014 2015 2016
2014 2015 2016
2014 2015 2016
2014 2015 2016
2014 2015 2016
2014 2015 2016
2014 2015 2016
2014 2015 2016
84% 89% 90%
89% 92% 94%
83%92% 96%
92% 91%99%
85%90% 94%
68% 77% 79%
68%85% 92%
625
Note: Data on this page does not include results from NUSD independent charter schools.
2015 2016 2017 2015 2016 2017
2015 2016 2017
2015 2016 2017
2015 2016 20172015 2016 2017
2015 2016 20172015 2016 2017
2015 2016 2017
23% 27%
15% 18% 24%
55% 54%59%
20% 26% 29%
29% 28% 31%
22%25% 29%
1% 1% 6%
3% 5%11%
5% 0%10%
NA: Data not available
31%
95%

SOME ACTIONS IN PROGRESS
TARGET
SOME ACTIONS IN PROGRESS
TARGETALL STUDENTS
Asian
African American Hispanic/Latino
White
English Learners
Foster
Low Income
Students with Disabilities
100%
80%
60%
40%
20%
0%
100%
50%
0%
100%
50%
0%
100%
50%
0%
100%
50%
0%
100%
50%
0%
100%
50%
0%
100%
50%
0%
100%
50%
0%
ALL STUDENTS
Asian
African American Hispanic/Latino
White
English Learners
Foster
Low Income
Students with Disabilities
100%
80%
60%
40%
20%
0%
100%
50%
0%
100%
50%
0%
100%
50%
0%
100%
50%
0%
100%
50%
0%
100%
50%
0%
100%
50%
0%
100%
50%
0%
HIGH SCHOOL DROPOUT RATE A-G COMPLETION
A-G Completion is the total number of graduates from the previous school year who completed the UC/CSU A-G requirements divided bythe total number of graduates from the previous school year. Data on this page reflect district-wide results, as reported by the CaliforniaDepartment of Education, and includes independent charter schools. The 2017 rates are projections. Although the graduating class of2017 finished school in May/June 2017, the official graduation and A-G rates will not be reported by the California Department of Educationuntil April/May 2018. NUSD has the highest a-g rate in Sacramento County, and the highest a-g rate for Asian, African American, Latino,White, English Learners, and low income students.
60%
Expanded Course Offerings including online, summer school, and middle school courses
Aligned Course Catalogue
College/Career Counseling services
College and Career Specialists
Parent University workshops
Data analysis to meet individual students’ needs
247
2%or lower
Attendance verification
Wellness checks when needed
Increased clerical attention for transferring districts, and move verifications
Counseling services, including academic and social emotional supports
Parent University workshops
High School Dropout Rate is the percent of students in grades 9-12 who drop out during a school year divided by the number of students enrolled in grades 9-12 the first week of October that school year. Having a high graduation rate and a low dropout rate is an important indicator of both the academic program as well as the school climate. NUSD’s dropout rate has remained under 1% for the past two years. In total, 42 students in grades 9-12 dropped out of school in 2015-2016, and though the rate is low at 0.9%, our intention is to further reduce this number.
2014 2015 2016 2014 2015 2016
2014 2015 2016
2014 2015 2016
2014 2015 20162014 2015 2016
2014 2015 20162014 2015 2016
2014 2015 2016
1.9% 1.1% 1.8%
1.5% 0% 0.2% 1.3% 0.5% 0.4%
6.7% 0.5%
2.5% 1% 1.3%
1.8% 0.8%
1.7%
51%59%
2015 2016 2017
2015 2016 2017
2015 2016 2017
2015 2016 2017
2015 2016 2017
2015 2016 2017
2015 2016 2017
2015 2016 2017
2015 2016 2017
42% 42% 43%
66%86% 76%
44% 44%56%
66% 72% 71%
46% 53% 56%
9%17% 27%
11%25% 31%
Note: 2017 rates are projections, official rates will be shared by CDE in the Spring of 2018.
NA: fewer than 10 students
0.9%
61%
NA: Data not available
NA: Data not available
NA: Data not available

SOME ACTIONS IN PROGRESS
TARGET
SOME ACTIONS IN PROGRESS
TARGETALL STUDENTS
Asian
African American Hispanic/Latino
White
English Learners
Foster
Low Income
Students with Disabilities
100%
80%
60%
40%
20%
0%
100%
50%
0%
100%
50%
0%
100%
50%
0%
100%
50%
0%
100%
50%
0%
100%
50%
0%
100%
50%
0%
100%
50%
0%
ALL STUDENTS
Asian
African American Hispanic/Latino
White
English Learners
Foster
Low Income
Students with Disabilities
100%
80%
60%
40%
20%
0%
100%
50%
0%
100%
50%
0%
100%
50%
0%
100%
50%
0%
100%
50%
0%
100%
50%
0%
100%
50%
0%
100%
50%
0%
ACT PARTICIPATION MIDDLE SCHOOL DROPOUT RATE
90%
Providing ACT free of charge for all 11th grade students
Opportunity for seniors to retake ACT if missed junior test
Letters to parents informing them about opportunity and value for college/career preparation
Principal communications
2%or lower
ACT Participation is the total number of 11th grade students who took the ACT test during the school day divided by the total number of 11th grade students enrolled on test day. NUSD provides this unique opportunity for our students to take the ACT free of charge, during the school day. By expanding access, more students can demonstrate that they are ready for college on this exam. Prior to this program, 169 students took the ACT in 2014. Four years later, in 2017, nearly 800 students took the test. Expanding access means that 212 students met the ACT benchmark on the ELA test, up from 86 students in 2014.
Middle School Dropout Rate is the percent of students in grades 7 and 8 who drop out during a school year divided by the number of students enrolled in grades 7 and 8 the first week of October that school year. Each year, very few students drop out of middle school, but it is still an important statewide indicator, and requirement to monitor as part of our Local Control and Accountability Plan. Our middle school dropout rate, at 0.18%, is lower than the State average of 0.27%.
Attendance verification
Home wellness checks when appropriate
Restorative Justice
Positive Behavior Intervention and Supports program (PBIS)
Middle School athletics, extracurricular activities, clubs and afterschool programs
WEB - Where Everyone Belongs
823
2014 2015 2016 2014 2015 2016
2014 2015 2016
2014 2015 2016
2014 2015 20162014 2015 2016
2014 2015 20162014 2015 2016
2014 2015 2016
0.2% 0% 0%
0.4% 0.1%
Note: Data on this page does not include results from NUSD independent charter schools.
2015 2016 2017 2015 2016 2017
2015 2016 2017
2015 2016 2017
2015 2016 20172015 2016 2017
2015 2016 20172015 2016 2017
2015 2016 2017
81% 86%
78% 80% 86%
90% 92% 95%
77% 86% 90%
90% 86%97%
83% 74% 91%
61% 62% 74%
65% 80% 77%
100%(N= 3)
100%(N= 1)
100%(N= 2)
0% 0% 0.3% 0.5% 0% 0%
0% 0.2% 0.3%
0% 0% 0%
0% 0.5% 0%
0.2% 0.2% 0%
92%
0.2%NA:
Data not available

SOME ACTIONS IN PROGRESS
TARGETALL STUDENTS
Asian
African American Hispanic/Latino
White
English Learners
Foster
Low Income
Students with Disabilities
100%
80%
60%
40%
20%
0%
100%
50%
0%
100%
50%
0%
100%
50%
0%
100%
50%
0%
100%
50%
0%
100%
50%
0%
100%
50%
0%
100%
50%
0%
ALL STUDENTS
Asian
African American Hispanic/Latino
White
English Learners
Foster
Low Income
Students with Disabilities
SOME ACTIONS IN PROGRESS
TARGET
CALIFORNIA STATE SEAL OF BILITERACY
1617 grads, get data from Lauren
California State Seal of Biliteracy is the total number of graduates from the previous school year who earned the CA State Seal of Biliteracy. One way to demonstrate college and career readiness is by demonstrating a high level of proficiency in speaking, reading, and writing in one or more languages in addition to English. There is no state dashboard or report to compare NUSD results with other school districts but the dramatic increase in the number of students earning the California State Seal of Biliteracy is a result of a district-wide commitment to support students.
229
11% or lower
by end of year
Communications for parents and students
Parent outreach
Attendance campaign, assemblies, rewards
Monitoring by site and Ed Center staff
New Attendance Handbook and continued training for school staff
Transportation services
CHRONIC ABSENTEE - FALL RATE
Chronic Absentee Rate is the percent of students who missed more than 10% of their enrolled school days, regardless of the reason. Unlike other metrics in this report that are reported annually, NUSD has real-time chronically absent student data, which can be viewed on a daily basis. NUSD has been monitoring chronic absenteeism for three years internally. This is the first year that the State of California will publish chronic absentee data for school districts and the first year we will be able to compare our rate to others to determine what high, medium, or lower performance means on this metric.
Fall 2015 Fall 2016 Fall 2017 2015 2016 2017
2015 2016 2017
2015 2016 2017
2015 2016 20172015 2016 2017
2015 2016 20172015 2016 2017
2015 2016 2017
13.5% 12.9%
19% 14% 14%
8% 10% 8%
14% 14% 12%
11% 14% 11%
14% 14% 11%
18% 16% 13%
14% 12% 12%
30%12% 19%
Note: Data on this page does not include results from NUSD independent charter schools.
34
92
1 4 6
823 31
2 7 9
3
5469
0 0 0
0 0 0
22
5469
2015 2016 2017
2015 2016 2017
2015 2016 2017
2015 2016 20172015 2016 2017
2015 2016 20172015 2016 2017
2015 2016 2017
54 of the 115 students were once English Learners. In order to earn the CA State Seal of Biliteracy an EL student must be redesignated
to Fluent English Proficient
Note: Data on this page does not include results from NUSD independent charter schools; but does include all students, regardless of their current enrollment status.
200
100
0
100
50
0
100
50
0
100
50
0
100
50
0
100
50
0
100
50
0
100
50
0
100
50
0
100 students or more
Spanish is offered in grades 6-12
Mandarin Chinese in grades 6-12
French in grades 9-12
AP and IB language course offerings
Testing offered to students at NUSD
115
2015 2016 2017
11.2%

SOME ACTIONS IN PROGRESS
TARGETALL STUDENTS
Asian
African American Hispanic/Latino
White
English Learners
Foster
Low Income
Students with Disabilities
100%
80%
60%
40%
20%
0%
100%
50%
0%
100%
50%
0%
100%
50%
0%
100%
50%
0%
100%
50%
0%
100%
50%
0%
100%
50%
0%
100%
50%
0%
ALL STUDENTS
Asian
African American Hispanic/Latino
White
English Learners
Foster
Low Income
Students with Disabilities
SOME ACTIONS IN PROGRESS
TARGET
100%
80%
60%
40%
20%
0%
100%
50%
0%
100%
50%
0%
100%
50%
0%
100%
50%
0%
100%
50%
0%
100%
50%
0%
100%
50%
0%
100%
50%
0%
11TH GRADE A-G
11th Grade A-G is the total number of 12th grade students who completed 11 or more A-G courses before the start of 12th grade divided by the total number of students enrolled in 12th grade the first week of October that year. College access begins long before graduation and NUSD is monitoring our students’ progress before their senior year to ensure they are on track. By aligning courses, our course catalogue, and expanding counseling services, more students than ever are on track to complete their A-G requirements.
70%
Expanded Course Offerings including online, summer school, and middle school courses
Aligned Course Catalogue
College/Career Counseling services & College and Career Specialists
Parent University workshops
Data analysis to meet each student’s individual needs
1021
7.6% or lower
SUSPENSION RATE
Suspension Rate is the total number of students suspended during the school year divided by the cumulative enrollment. The number of suspensions can drop but the rate can increase in part because of high mobility/transiency and because the rate is based on the number of individual students suspended, not the total number of suspensions. In 2017 the State of California reported suspension rate data on the California School Dashboard for the 2014-2015 school year. NUSD has more current data available and is reporting predicted suspension rates for 2015-2016 and 2016-2017 here, anticipating that the State will release these data 6-18 months from now.
Restorative Justice
Social emotional learning skills programs
Afterschool programs
Positive Behavior Interventions and Supports (PBIS)
For more information about how the district is addressing student suspensions, see the NUSD LCAP on our district website.
6.8% 8.6%
15% 18% 16%
2% 3% 2% 4% 5% 5%
8% 8% 7%
12% 12% 11%
4% 7% 5%
NA23% 17%
6% 7% 6%
2015 2016 2017 2015 2016 2017
2015 2016 2017
2015 2016 2017
2015 2016 20172015 2016 2017
2015 2016 20172015 2016 2017
2015 2016 2017
31%
61%
28%
47%59%
38%
80% 81%
34%
70% 80%
32%
60%69%
7%17%
33%
8%
38%26%
29%
58% 61%
2015 2016 2017 2015 2016 2017
2015 2016 2017
2015 2016 2017
2015 2016 20172015 2016 2017
2015 2016 20172015 2016 2017
2015 2016 2017
NA: fewer than 10 students
Note: Data on this page does not include results from NUSD independent charter schools.
68%
7.7%

SOME ACTIONS IN PROGRESS
TARGET
SOME ACTIONS IN PROGRESS
TARGETALL STUDENTS
Asian
African American Hispanic/Latino
White
English Learners
Foster
Low Income
Students with Disabilities
100%
80%
60%
40%
20%
0%
100%
50%
0%
100%
50%
0%
100%
50%
0%
100%
50%
0%
100%
50%
0%
100%
50%
0%
100%
50%
0%
100%
50%
0%
ALL STUDENTS
Asian
African American Hispanic/Latino
White
English Learners
Foster
Low Income
Students with Disabilities
2015 2016 2017 2015 2016 2017
2015 2016 2017
2015 2016 2017
2015 2016 20172015 2016 2017
2015 2016 20172015 2016 2017
2015 2016 2017
Not yet determined
Go Math Curriculum
CCSS Professional Development
Job-embedded PD in grades 3-8 focused on data driven instruction & new PD for grades PK-4
Increased instructional minutes
Common walk-through for lesson feedback to teachers
For additional actions, see our LCAP on our district website.
EXPULSION RATE
Below0.15%
Promise Program
Restorative Justice program
Positive Behavior Interventions and Supports (PBIS)
Social Emotional Support services
School athletics, extra curricular activities, clubs and afterschool programs
Expulsion Rate is the total number of students expelled during the school year divided by the cumulative enrollment. Natomas Unified remains committed to maintaining safe schools. Disciplinary actions, including expulsions are, at times, required or necessary. It is not the district’s goal to eliminate expulsions. It is the hope, that when viable, alternatives can be utilized, such as the Promise Program that was implemented in 2014.
CAASPP Improvement is the total number of students who scored at level 1 on the CAASPP Math test two years ago and scored at level 2, 3, or 4 on the CAASPP Math test the following school year divided by the total number of students who scored at level 1 on the CAASPP Math test two years ago. This metric was created to ensure we monitor the progress of students who score at the lowest CAASPP level to spotlight the needs of these students.
CAASPP IMPROVEMENT MATH INCREASING FROM LEVEL 1 TO LEVEL 2, 3, OR 4
2011
20%
10%
31% 26% 20%18%
19% 12%
6% 5%
20%12%
22% 13%
NA: fewer than 10 students
13%
2016 2017
2016 2017 2016 2017
2016 2017 2016 2017
2016 2017
2016 2017
2016 2017
2016 2017
.11% .09%
.25% .24% .09%
.00% .00% .00%
.11% .07% .21%
.04% .04% .08%
.11% .14% .17%
.07% .00% .05%
.15% .00% .05%
.00% .00% 1.1%
.12%
15%
100%
80%
60%
40%
20%
0%
100%
50%
0%
100%
50%
0%
100%
50%
0%
100%
50%
0%
100%
50%
0%
100%
50%
0%
100%
50%
0%
100%
50%
0%
SOME ACTIONS IN PROGRESS
TARGET
SOME ACTIONS IN PROGRESS
TARGETALL STUDENTS
Asian
African American Hispanic/Latino
White
English Learners
Foster
Low Income
Students with Disabilities
100%
80%
60%
40%
20%
0%
100%
50%
0%
100%
50%
0%
100%
50%
0%
100%
50%
0%
100%
50%
0%
100%
50%
0%
100%
50%
0%
100%
50%
0%
ALL STUDENTS
Asian
African American Hispanic/Latino
White
English Learners
Foster
Low Income
Students with Disabilities
100%
80%
60%
40%
20%
0%
100%
50%
0%
100%
50%
0%
100%
50%
0%
100%
50%
0%
100%
50%
0%
100%
50%
0%
100%
50%
0%
100%
50%
0%
CAASPP IMPROVEMENT ENGLISH LANGUAGE ARTS INCREASING FROM LEVEL 1 TO LEVEL 2, 3, OR 4
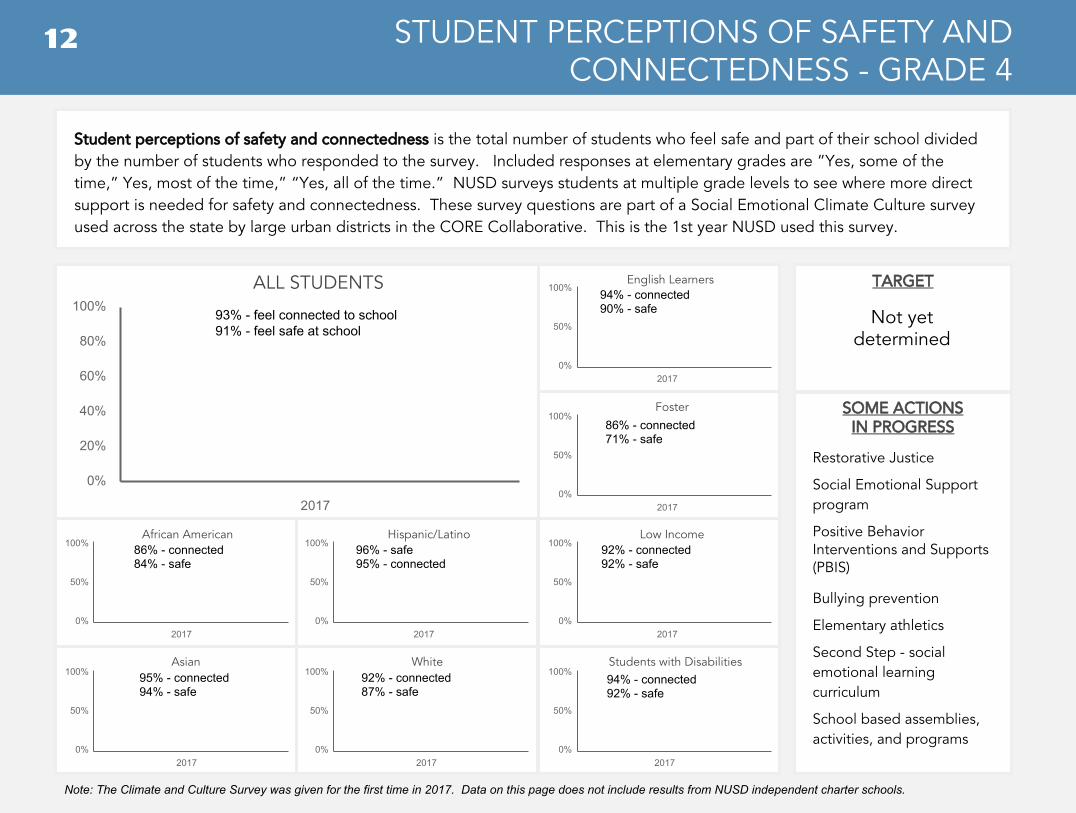
STUDENT PERCEPTIONS OF SAFETY AND CONNECTEDNESS - GRADE 4
Not yet determined
CCSS Professional Development; Job- embedded PD in grades 3-8 focused on data driven instruction & new PD for grades PK-4; Increased instructional minutes; Common Walk through for lesson feedback to teachers; Extended day supports for Teachers for English Learners and summer school for EL students
For additional actions, see our LCAP on our district website.
Not yet determined
CAASPP Improvement is the total number of students who scored at level 1 on the CAASPP ELA test two years ago and scored at level 2, 3, or 4 on the CAASPP ELA test the following school year divided by the total number of students who scored at level 1 on the CAASPP ELA test two years ago. This metric was created to ensure we monitor the progress of students who score at the lowest CAASPP level to spotlight the needs of these students.
Restorative Justice
Social Emotional Support program
Positive Behavior Interventions and Supports (PBIS)
Bullying prevention
Elementary athletics
Second Step - social emotional learning curriculum
School based assemblies, activities, and programs
Student perceptions of safety and connectedness is the total number of students who feel safe and part of their school divided by the number of students who responded to the survey. Included responses at elementary grades are ”Yes, some of the time,” Yes, most of the time,” “Yes, all of the time.” NUSD surveys students at multiple grade levels to see where more direct support is needed for safety and connectedness. These survey questions are part of a Social Emotional Climate Culture survey used across the state by large urban districts in the CORE Collaborative. This is the 1st year NUSD used this survey.
1219
2017
2017
2017
2017
2017
2017
2017
2017
2017
Note: The Climate and Culture Survey was given for the first time in 2017. Data on this page does not include results from NUSD independent charter schools.
93% - feel connected to school91% - feel safe at school
86% - connected84% - safe
96% - safe95% - connected
95% - connected94% - safe
92% - connected87% - safe
94% - connected90% - safe
86% - connected71% - safe
92% - connected92% - safe
94% - connected92% - safe
30%
17%
37% 38% 38%27%
25% 22%
13% 13%
26% 25%
30% 24%
NA: fewer than 10 students
2016 2017
2016 2017 2016 2017
2016 2017 2016 2017
2016 2017
2016 2017
2016 2017
2016 2017
18%
26%
SOME ACTIONS IN PROGRESS
TARGETALL STUDENTS
Asian
African American Hispanic/Latino
White
English Learners
Foster
Low Income
Students with Disabilities
100%
80%
60%
40%
20%
0%
100%
50%
0%
100%
50%
0%
100%
50%
0%
100%
50%
0%
100%
50%
0%
100%
50%
0%
100%
50%
0%
100%
50%
0%
ALL STUDENTS
Asian
African American Hispanic/Latino
White
English Learners
Foster
Low Income
Students with Disabilities
SOME ACTIONS IN PROGRESS
TARGET
100%
80%
60%
40%
20%
0%
100%
50%
0%
100%
50%
0%
100%
50%
0%
100%
50%
0%
100%
50%
0%
100%
50%
0%
100%
50%
0%
100%
50%
0%
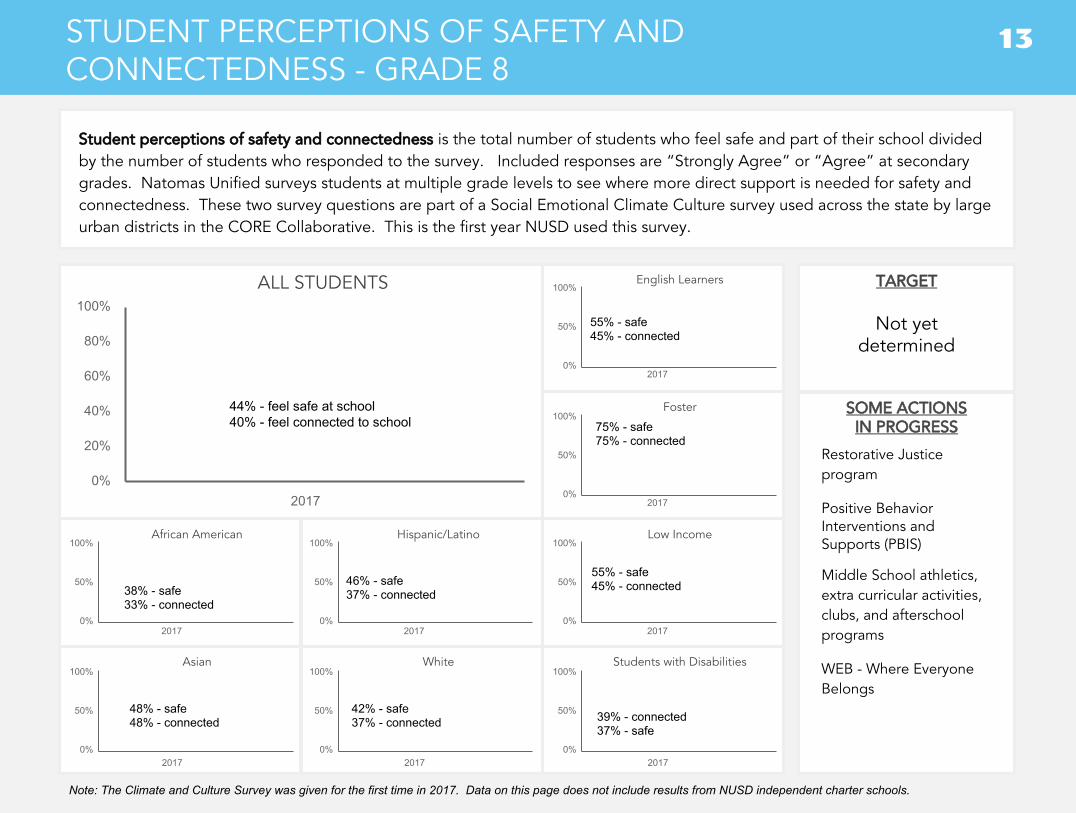
STUDENT PERCEPTIONS OF SAFETY AND CONNECTEDNESS - GRADE 8
Not yet determined
Restorative Justice program
Positive Behavior Interventions and Supports (PBIS)
Middle School athletics, extra curricular activities, clubs, and afterschool programs
WEB - Where Everyone Belongs
Student perceptions of safety and connectedness is the total number of students who feel safe and part of their school divided by the number of students who responded to the survey. Included responses are “Strongly Agree” or “Agree” at secondary grades. Natomas Unified surveys students at multiple grade levels to see where more direct support is needed for safety and connectedness. These two survey questions are part of a Social Emotional Climate Culture survey used across the state by large urban districts in the CORE Collaborative. This is the first year NUSD used this survey.
1813
35%
CAASPP ACHIEVEMENT - MATH
CAASPP Achievement is the total number of students who met or exceeded grade level standards on the CAASPP Math test in the spring of the previous school year divided by the total number of students who took the CAASPP Math test during the spring the previous year. *NUSD adopted CCSS aligned textbooks in 2016. This work is especially complicated in Natomas because of the high mobility rate of ourstudents (1 in 2 third graders attended kindergarten in our district, 4 in 5 sixth graders attended fifth grade in our district, and 3 in 4 ninthgraders stayed at the same high school through their senior year). This work, building an aligned instructional system, is important work forour staff to undertake to improve student achievement in NUSD.
CCSS Professional Development; Early release days; SDAIE job-embedded training for MS and HS teachers: ob-embedded PD by Teachers on Special Assignment; Increased instructional minutes; Special Education inclusion model; Continued support for EL teachers; Extended day supports for Teachers for English Learners and summer school for EL studentsFor additional actions, see our LCAP on our district website.
33% 35%
2015 2016 2017
2015 2016 2017
2015 2016 2017
2015 2016 2017
2015 2016 2017
2015 2016 2017
2015 2016 2017
2015 2016 2017
2015 2016 2017
16% 17% 14%
48% 52% 52%
24% 27% 24%
47% 49% 48%
22% 23% 21%
6% 6% 10%
14% 15% 13%
8% 13% 13%
2017
2017 2017 2017
2017
2017
44% - feel safe at school40% - feel connected to school
38% - safe33% - connected
46% - safe37% - connected
48% - safe48% - connected
42% - safe37% - connected
55% - safe45% - connected
75% - safe75% - connected
55% - safe45% - connected
39% - connected37% - safe
Note: The Climate and Culture Survey was given for the first time in 2017. Data on this page does not include results from NUSD independent charter schools.
33%
2017 2017 2017
SOME ACTIONS IN PROGRESS
TARGETALL STUDENTS
Asian
African American Hispanic/Latino
White
English Learners
Foster
Low Income
Students with Disabilities
100%
80%
60%
40%
20%
0%
100%
50%
0%
100%
50%
0%
100%
50%
0%
100%
50%
0%
100%
50%
0%
100%
50%
0%
100%
50%
0%
100%
50%
0%
ALL STUDENTS
Asian
African American Hispanic/Latino
White
English Learners
Foster
Low Income
Students with Disabilities
SOME ACTIONS IN PROGRESS
TARGET
100%
80%
60%
40%
20%
0%
100%
50%
0%
100%
50%
0%
100%
50%
0%
100%
50%
0%
100%
50%
0%
100%
50%
0%
100%
50%
0%
100%
50%
0%
CAASPP Achievement is the total number of students who met or exceeded grade level standards on the CAASPP ELA test in the spring of the previous school year divided by the total number of students who took the CAASPP ELA test during the spring the previous school year. NUSD is implementing a high quality academic program for all students at every school, aligning effective teaching with standards-based curriculum, and assessments that inform student learning. NUSD began training teachers on Common Core State Standards (CCSS) in 2013 and adopted new CCSS aligned English textbooks in 2015. (*continued on next page)
CCSS Professional Development; Early release days; SDAIE job-embedded training for MS and HS teachers; job-embedded PD by Teachers on Special Assignment; Increased instructional minutes; Special Education inclusion model; Continued support for EL teachers; Extended day supports for Teachers for English Learners and summer school for EL studentsFor additional actions, see our LCAP on our district website.
Not yet determined
STUDENT PERCEPTIONS OF SAFETY AND CONNECTEDNESS - GRADE 11
Student perceptions of safety and connectedness is the total number of students who feel safe and part of their school divided by the number of students who responded to the survey. Included responses are “Strongly Agree” or “Agree” at secondary grades. Natomas Unified surveys students at multiple grade levels to see where more direct support is needed for safety and connectedness. These two survey questions are part of a Social Emotional Climate Culture survey used across the state by large urban districts in the CORE Collaborative. This is the first year NUSD used this survey.
Restorative Justice program
Positive Behavior Interventions and Supports (PBIS)
Link Crew
High School athletics, extra curricular activities, clubs, and afterschool programs
1417CAASPP ACHIEVEMENT - ENGLISH LANGUAGE ARTS
45%
42% 44%
2015 2016 2017
2015 2016 2017
2015 2016 2017
2015 2016 2017
2015 2016 2017
2015 2016 2017
2015 2016 2017
2015 2016 2017
2015 2016 2017
25% 24% 24%
55% 56% 57%
32% 36% 35%
59% 60% 58%
30% 30% 30%
9% 9% 11%
14% 14% 10%
13% 19% 17%
2017
2017
2017
2017
2017
2017
2017
2017
2017
Note: The Climate and Culture Survey was given for the first time in 2017. Data on this page does not include results from NUSD independent charter schools.
55% - feel safe at school52% - feel connected to school
51% - connected50% - safe
61% - safe50% - connected
60% - safe58% - connected
58% - safe52% - connected
58% - safe53% - connected
NA: fewer than 10 students
59% - safe55% - connected
47% - safe40% - connected
43%

SOME ACTIONS IN PROGRESS
TARGET
SOME ACTIONS IN PROGRESS
TARGETALL STUDENTS
Asian
African American Hispanic/Latino
White
English Learners
Foster
Low Income
Students with Disabilities
100%
80%
60%
40%
20%
0%
100%
50%
0%
100%
50%
0%
100%
50%
0%
100%
50%
0%
100%
50%
0%
100%
50%
0%
100%
50%
0%
100%
50%
0%
ALL STUDENTS
Asian
African American Hispanic/Latino
White
English Learners
Foster
Low Income
Students with Disabilities
100%
80%
60%
40%
20%
0%
100%
50%
0%
100%
50%
0%
100%
50%
0%
100%
50%
0%
100%
50%
0%
100%
50%
0%
100%
50%
0%
100%
50%
0%
College Ready is the total number of graduates who completed 11th and 12th grade in NUSD and met the California State University (CSU) benchmark for college readiness in English using CAASPP, ACT, Advanced Placement, and senior English courses divided by the total number of students who completed both 11th and 12th grade in NUSD. NUSD uses the CSU measure of readiness which is higher than the ACT or College Board’s own benchmarks. In fact, this benchmark is higher than California’s K-12 benchmark because a student who “meets standards” on the 11th Grade CAASPP test is not “ready” for college according to California’s higher education system. (*continued on next page)
2016 2017
COLLEGE READY - ENGLISH LANGUAGE ARTS COLLEGE READY - MATH
50%
Increased access to AP/IB courses
ACT exam for 11th graders
ACT prep program
AP/IB budget for sites to increase student pass rates
PSAT exam for 10th graders
Expository Reading and Writing senior level course
College tours in grades 3, 6, 8, and 11
35%
College Ready is the total number of graduates who completed 11th and 12th grade in NUSD and met the California State University (CSU) benchmark for college readiness in Math using CAASPP, ACT, Advanced Placement, and senior Math courses divided by the total number of students who completed both 11th and 12th grade in NUSD. *Higher expectations ensure that our students can go to college without remediation.Through the intentional actions and hard work by ourstudents, teachers, counselors, and site leaders we increased the percent of students meeting the benchmark as juuniors from 18% in ELAand 6% in math to 44% in ELA and 29% in math by the time they completed their senior year.
Increased access to AP/IB courses
ACT exam for 11th graders
ACT prep program
AP/IB budget for sites to increase student pass rates
PSAT exam for 10th graders
Early Start Math course for seniors
College tours in grades 3, 6, 8, and 11
1615
Note: Data on this page does not include results from NUSD independent charter schools.
32%
2016 2017
2016 2017
18%27%
60% 58%
24%40%
35%53%
26%41%
5% 2%
NA: fewer than 10 students
2%
2016 2017
2016 2017 2016 2017
2016 2017
2016 2017
2016 20170%
Note: Data on this page does not include results from NUSD independent charter schools.
2016 2017
2016 2017
18%
6%18%
41% 44%
10%24%
30%38%
14%25%
2% 1%
NA: fewer than 10 students
0%
2016 2017
2016 2017 2016 2017
2016 2017
2016 2017
2016 2017
0%
44%
29%
2016 2017

SOME ACTIONS IN PROGRESS
TARGETALL STUDENTS
Asian
African American Hispanic/Latino
White
English Learners
Foster
Low Income
Students with Disabilities
100%
80%
60%
40%
20%
0%
100%
50%
0%
100%
50%
0%
100%
50%
0%
100%
50%
0%
100%
50%
0%
100%
50%
0%
100%
50%
0%
100%
50%
0%
ALL STUDENTS
Asian
African American Hispanic/Latino
White
English Learners
Foster
Low Income
Students with Disabilities
SOME ACTIONS IN PROGRESS
TARGET
100%
80%
60%
40%
20%
0%
100%
50%
0%
100%
50%
0%
100%
50%
0%
100%
50%
0%
100%
50%
0%
100%
50%
0%
100%
50%
0%
100%
50%
0%
CAASPP Achievement is the total number of students who met or exceeded grade level standards on the CAASPP ELA test in the spring of the previous school year divided by the total number of students who took the CAASPP ELA test during the spring the previous school year. NUSD is implementing a high quality academic program for all students at every school, aligning effective teaching with standards-based curriculum, and assessments that inform student learning. NUSD began training teachers on Common Core State Standards (CCSS) in 2013 and adopted new CCSS aligned English textbooks in 2015. (*continued on next page)
CCSS Professional Development; Early release days; SDAIE job-embedded training for MS and HS teachers; job-embedded PD by Teachers on Special Assignment; Increased instructional minutes; Special Education inclusion model; Continued support for EL teachers; Extended day supports for Teachers for English Learners and summer school for EL studentsFor additional actions, see our LCAP on our district website.
Not yet determined
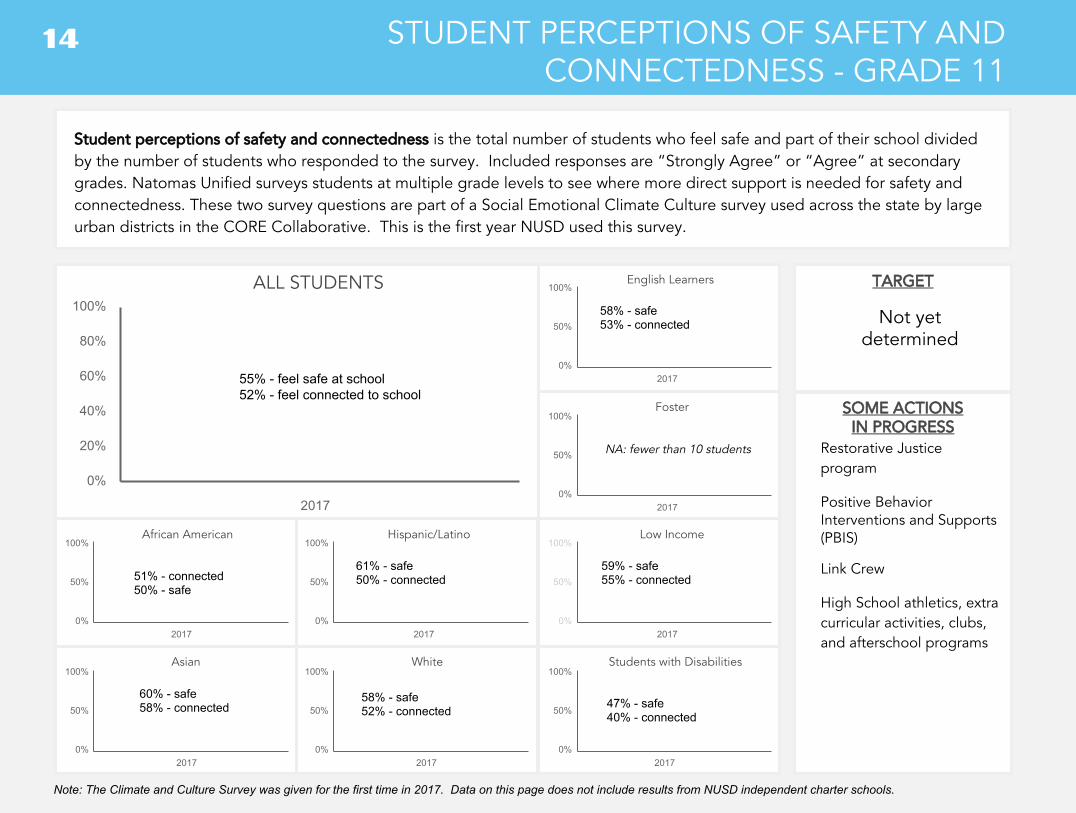
STUDENT PERCEPTIONS OF SAFETY AND CONNECTEDNESS - GRADE 11
Student perceptions of safety and connectedness is the total number of students who feel safe and part of their school divided by the number of students who responded to the survey. Included responses are “Strongly Agree” or “Agree” at secondary grades. Natomas Unified surveys students at multiple grade levels to see where more direct support is needed for safety and connectedness. These two survey questions are part of a Social Emotional Climate Culture survey used across the state by large urban districts in the CORE Collaborative. This is the first year NUSD used this survey.
Restorative Justice program
Positive Behavior Interventions and Supports (PBIS)
Link Crew
High School athletics, extra curricular activities, clubs, and afterschool programs
1417CAASPP ACHIEVEMENT - ENGLISH LANGUAGE ARTS
45%
42% 44%
2015 2016 2017
2015 2016 2017
2015 2016 2017
2015 2016 2017
2015 2016 2017
2015 2016 2017
2015 2016 2017
2015 2016 2017
2015 2016 2017
25% 24% 24%
55% 56% 57%
32% 36% 35%
59% 60% 58%
30% 30% 30%
9% 9% 11%
14% 14% 10%
13% 19% 17%
2017
2017
2017
2017
2017
2017
2017
2017
2017
Note: The Climate and Culture Survey was given for the first time in 2017. Data on this page does not include results from NUSD independent charter schools.
55% - feel safe at school52% - feel connected to school
51% - connected50% - safe
61% - safe50% - connected
60% - safe58% - connected
58% - safe52% - connected
58% - safe53% - connected
NA: fewer than 10 students
59% - safe55% - connected
47% - safe40% - connected
43%

SOME ACTIONS IN PROGRESS
TARGETALL STUDENTS
Asian
African American Hispanic/Latino
White
English Learners
Foster
Low Income
Students with Disabilities
100%
80%
60%
40%
20%
0%
100%
50%
0%
100%
50%
0%
100%
50%
0%
100%
50%
0%
100%
50%
0%
100%
50%
0%
100%
50%
0%
100%
50%
0%
ALL STUDENTS
Asian
African American Hispanic/Latino
White
English Learners
Foster
Low Income
Students with Disabilities
SOME ACTIONS IN PROGRESS
TARGET
100%
80%
60%
40%
20%
0%
100%
50%
0%
100%
50%
0%
100%
50%
0%
100%
50%
0%
100%
50%
0%
100%
50%
0%
100%
50%
0%
100%
50%
0%
STUDENT PERCEPTIONS OF SAFETY AND CONNECTEDNESS - GRADE 8
Not yet determined
Restorative Justice program
Positive Behavior Interventions and Supports (PBIS)
Middle School athletics, extra curricular activities, clubs, and afterschool programs
WEB - Where Everyone Belongs
Student perceptions of safety and connectedness is the total number of students who feel safe and part of their school divided by the number of students who responded to the survey. Included responses are “Strongly Agree” or “Agree” at secondary grades. Natomas Unified surveys students at multiple grade levels to see where more direct support is needed for safety and connectedness. These two survey questions are part of a Social Emotional Climate Culture survey used across the state by large urban districts in the CORE Collaborative. This is the first year NUSD used this survey.
1813
35%
CAASPP ACHIEVEMENT - MATH
CAASPP Achievement is the total number of students who met or exceeded grade level standards on the CAASPP Math test in the spring of the previous school year divided by the total number of students who took the CAASPP Math test during the spring the previous year. *NUSD adopted CCSS aligned textbooks in 2016. This work is especially complicated in Natomas because of the high mobility rate of ourstudents (1 in 2 third graders attended kindergarten in our district, 4 in 5 sixth graders attended fifth grade in our district, and 3 in 4 ninthgraders stayed at the same high school through their senior year). This work, building an aligned instructional system, is important work forour staff to undertake to improve student achievement in NUSD.
CCSS Professional Development; Early release days; SDAIE job-embedded training for MS and HS teachers: ob-embedded PD by Teachers on Special Assignment; Increased instructional minutes; Special Education inclusion model; Continued support for EL teachers; Extended day supports for Teachers for English Learners and summer school for EL studentsFor additional actions, see our LCAP on our district website.
33% 35%
2015 2016 2017
2015 2016 2017
2015 2016 2017
2015 2016 2017
2015 2016 2017
2015 2016 2017
2015 2016 2017
2015 2016 2017
2015 2016 2017
16% 17% 14%
48% 52% 52%
24% 27% 24%
47% 49% 48%
22% 23% 21%
6% 6% 10%
14% 15% 13%
8% 13% 13%
2017
2017 2017 2017
2017
2017
44% - feel safe at school40% - feel connected to school
38% - safe33% - connected
46% - safe37% - connected
48% - safe48% - connected
42% - safe37% - connected
55% - safe45% - connected
75% - safe75% - connected
55% - safe45% - connected
39% - connected37% - safe
Note: The Climate and Culture Survey was given for the first time in 2017. Data on this page does not include results from NUSD independent charter schools.
33%
2017 2017 2017

SOME ACTIONS IN PROGRESS
TARGET
SOME ACTIONS IN PROGRESS
TARGETALL STUDENTS
Asian
African American Hispanic/Latino
White
English Learners
Foster
Low Income
Students with Disabilities
100%
80%
60%
40%
20%
0%
100%
50%
0%
100%
50%
0%
100%
50%
0%
100%
50%
0%
100%
50%
0%
100%
50%
0%
100%
50%
0%
100%
50%
0%
ALL STUDENTS
Asian
African American Hispanic/Latino
White
English Learners
Foster
Low Income
Students with Disabilities
100%
80%
60%
40%
20%
0%
100%
50%
0%
100%
50%
0%
100%
50%
0%
100%
50%
0%
100%
50%
0%
100%
50%
0%
100%
50%
0%
100%
50%
0%
CAASPP IMPROVEMENT ENGLISH LANGUAGE ARTS INCREASING FROM LEVEL 1 TO LEVEL 2, 3, OR 4
STUDENT PERCEPTIONS OF SAFETY AND CONNECTEDNESS - GRADE 4
Not yet determined
CCSS Professional Development; Job- embedded PD in grades 3-8 focused on data driven instruction & new PD for grades PK-4; Increased instructional minutes; Common Walk through for lesson feedback to teachers; Extended day supports for Teachers for English Learners and summer school for EL students
For additional actions, see our LCAP on our district website.
Not yet determined
CAASPP Improvement is the total number of students who scored at level 1 on the CAASPP ELA test two years ago and scored at level 2, 3, or 4 on the CAASPP ELA test the following school year divided by the total number of students who scored at level 1 on the CAASPP ELA test two years ago. This metric was created to ensure we monitor the progress of students who score at the lowest CAASPP level to spotlight the needs of these students.
Restorative Justice
Social Emotional Support program
Positive Behavior Interventions and Supports (PBIS)
Bullying prevention
Elementary athletics
Second Step - social emotional learning curriculum
School based assemblies, activities, and programs
Student perceptions of safety and connectedness is the total number of students who feel safe and part of their school divided by the number of students who responded to the survey. Included responses at elementary grades are ”Yes, some of the time,” Yes, most of the time,” “Yes, all of the time.” NUSD surveys students at multiple grade levels to see where more direct support is needed for safety and connectedness. These survey questions are part of a Social Emotional Climate Culture survey used across the state by large urban districts in the CORE Collaborative. This is the 1st year NUSD used this survey.
1219
2017
2017
2017
2017
2017
2017
2017
2017
2017
Note: The Climate and Culture Survey was given for the first time in 2017. Data on this page does not include results from NUSD independent charter schools.
93% - feel connected to school91% - feel safe at school
86% - connected84% - safe
96% - safe95% - connected
95% - connected94% - safe
92% - connected87% - safe
94% - connected90% - safe
86% - connected71% - safe
92% - connected92% - safe
94% - connected92% - safe
30%
17%
37% 38% 38%27%
25% 22%
13% 13%
26% 25%
30% 24%
NA: fewer than 10 students
2016 2017
2016 2017 2016 2017
2016 2017 2016 2017
2016 2017
2016 2017
2016 2017
2016 2017
18%
26%

SOME ACTIONS IN PROGRESS
TARGET
SOME ACTIONS IN PROGRESS
TARGETALL STUDENTS
Asian
African American Hispanic/Latino
White
English Learners
Foster
Low Income
Students with Disabilities
100%
80%
60%
40%
20%
0%
100%
50%
0%
100%
50%
0%
100%
50%
0%
100%
50%
0%
100%
50%
0%
100%
50%
0%
100%
50%
0%
100%
50%
0%
ALL STUDENTS
Asian
African American Hispanic/Latino
White
English Learners
Foster
Low Income
Students with Disabilities
2015 2016 2017 2015 2016 2017
2015 2016 2017
2015 2016 2017
2015 2016 20172015 2016 2017
2015 2016 20172015 2016 2017
2015 2016 2017
Not yet determined
Go Math Curriculum
CCSS Professional Development
Job-embedded PD in grades 3-8 focused on data driven instruction & new PD for grades PK-4
Increased instructional minutes
Common walk-through for lesson feedback to teachers
For additional actions, see our LCAP on our district website.
EXPULSION RATE
Below0.15%
Promise Program
Restorative Justice program
Positive Behavior Interventions and Supports (PBIS)
Social Emotional Support services
School athletics, extra curricular activities, clubs and afterschool programs
Expulsion Rate is the total number of students expelled during the school year divided by the cumulative enrollment. Natomas Unified remains committed to maintaining safe schools. Disciplinary actions, including expulsions are, at times, required or necessary. It is not the district’s goal to eliminate expulsions. It is the hope, that when viable, alternatives can be utilized, such as the Promise Program that was implemented in 2014.
CAASPP Improvement is the total number of students who scored at level 1 on the CAASPP Math test two years ago and scored at level 2, 3, or 4 on the CAASPP Math test the following school year divided by the total number of students who scored at level 1 on the CAASPP Math test two years ago. This metric was created to ensure we monitor the progress of students who score at the lowest CAASPP level to spotlight the needs of these students.
CAASPP IMPROVEMENT MATH INCREASING FROM LEVEL 1 TO LEVEL 2, 3, OR 4
2011
20%
10%
31% 26% 20%18%
19% 12%
6% 5%
20%12%
22% 13%
NA: fewer than 10 students
13%
2016 2017
2016 2017 2016 2017
2016 2017 2016 2017
2016 2017
2016 2017
2016 2017
2016 2017
.11% .09%
.25% .24% .09%
.00% .00% .00%
.11% .07% .21%
.04% .04% .08%
.11% .14% .17%
.07% .00% .05%
.15% .00% .05%
.00% .00% 1.1%
.12%
15%
100%
80%
60%
40%
20%
0%
100%
50%
0%
100%
50%
0%
100%
50%
0%
100%
50%
0%
100%
50%
0%
100%
50%
0%
100%
50%
0%
100%
50%
0%

SOME ACTIONS IN PROGRESS
TARGETALL STUDENTS
Asian
African American Hispanic/Latino
White
English Learners
Foster
Low Income
Students with Disabilities
100%
80%
60%
40%
20%
0%
100%
50%
0%
100%
50%
0%
100%
50%
0%
100%
50%
0%
100%
50%
0%
100%
50%
0%
100%
50%
0%
100%
50%
0%
ALL STUDENTS
Asian
African American Hispanic/Latino
White
English Learners
Foster
Low Income
Students with Disabilities
SOME ACTIONS IN PROGRESS
TARGET
100%
80%
60%
40%
20%
0%
100%
50%
0%
100%
50%
0%
100%
50%
0%
100%
50%
0%
100%
50%
0%
100%
50%
0%
100%
50%
0%
100%
50%
0%
11TH GRADE A-G
11th Grade A-G is the total number of 12th grade students who completed 11 or more A-G courses before the start of 12th grade divided by the total number of students enrolled in 12th grade the first week of October that year. College access begins long before graduation and NUSD is monitoring our students’ progress before their senior year to ensure they are on track. By aligning courses, our course catalogue, and expanding counseling services, more students than ever are on track to complete their A-G requirements.
70%
Expanded Course Offerings including online, summer school, and middle school courses
Aligned Course Catalogue
College/Career Counseling services & College and Career Specialists
Parent University workshops
Data analysis to meet each student’s individual needs
1021
7.6% or lower
SUSPENSION RATE
Suspension Rate is the total number of students suspended during the school year divided by the cumulative enrollment. The number of suspensions can drop but the rate can increase in part because of high mobility/transiency and because the rate is based on the number of individual students suspended, not the total number of suspensions. In 2017 the State of California reported suspension rate data on the California School Dashboard for the 2014-2015 school year. NUSD has more current data available and is reporting predicted suspension rates for 2015-2016 and 2016-2017 here, anticipating that the State will release these data 6-18 months from now.
Restorative Justice
Social emotional learning skills programs
Afterschool programs
Positive Behavior Interventions and Supports (PBIS)
For more information about how the district is addressing student suspensions, see the NUSD LCAP on our district website.
6.8% 8.6%
15% 18% 16%
2% 3% 2% 4% 5% 5%
8% 8% 7%
12% 12% 11%
4% 7% 5%
NA23% 17%
6% 7% 6%
2015 2016 2017 2015 2016 2017
2015 2016 2017
2015 2016 2017
2015 2016 20172015 2016 2017
2015 2016 20172015 2016 2017
2015 2016 2017
31%
61%
28%
47%59%
38%
80% 81%
34%
70% 80%
32%
60%69%
7%17%
33%
8%
38%26%
29%
58% 61%
2015 2016 2017 2015 2016 2017
2015 2016 2017
2015 2016 2017
2015 2016 20172015 2016 2017
2015 2016 20172015 2016 2017
2015 2016 2017
NA: fewer than 10 students
Note: Data on this page does not include results from NUSD independent charter schools.
68%
7.7%

SOME ACTIONS IN PROGRESS
TARGETALL STUDENTS
Asian
African American Hispanic/Latino
White
English Learners
Foster
Low Income
Students with Disabilities
100%
80%
60%
40%
20%
0%
100%
50%
0%
100%
50%
0%
100%
50%
0%
100%
50%
0%
100%
50%
0%
100%
50%
0%
100%
50%
0%
100%
50%
0%
ALL STUDENTS
Asian
African American Hispanic/Latino
White
English Learners
Foster
Low Income
Students with Disabilities
SOME ACTIONS IN PROGRESS
TARGET
CALIFORNIA STATE SEAL OF BILITERACY
1617 grads, get data from Lauren
California State Seal of Biliteracy is the total number of graduates from the previous school year who earned the CA State Seal of Biliteracy. One way to demonstrate college and career readiness is by demonstrating a high level of proficiency in speaking, reading, and writing in one or more languages in addition to English. There is no state dashboard or report to compare NUSD results with other school districts but the dramatic increase in the number of students earning the California State Seal of Biliteracy is a result of a district-wide commitment to support students.
229
11% or lower
by end of year
Communications for parents and students
Parent outreach
Attendance campaign, assemblies, rewards
Monitoring by site and Ed Center staff
New Attendance Handbook and continued training for school staff
Transportation services
CHRONIC ABSENTEE - FALL RATE
Chronic Absentee Rate is the percent of students who missed more than 10% of their enrolled school days, regardless of the reason. Unlike other metrics in this report that are reported annually, NUSD has real-time chronically absent student data, which can be viewed on a daily basis. NUSD has been monitoring chronic absenteeism for three years internally. This is the first year that the State of California will publish chronic absentee data for school districts and the first year we will be able to compare our rate to others to determine what high, medium, or lower performance means on this metric.
Fall 2015 Fall 2016 Fall 2017 2015 2016 2017
2015 2016 2017
2015 2016 2017
2015 2016 20172015 2016 2017
2015 2016 20172015 2016 2017
2015 2016 2017
13.5% 12.9%
19% 14% 14%
8% 10% 8%
14% 14% 12%
11% 14% 11%
14% 14% 11%
18% 16% 13%
14% 12% 12%
30%12% 19%
Note: Data on this page does not include results from NUSD independent charter schools.
34
92
1 4 6
823 31
2 7 9
3
5469
0 0 0
0 0 0
22
5469
2015 2016 2017
2015 2016 2017
2015 2016 2017
2015 2016 20172015 2016 2017
2015 2016 20172015 2016 2017
2015 2016 2017
54 of the 115 students were once English Learners. In order to earn the CA State Seal of Biliteracy an EL student must be redesignated
to Fluent English Proficient
Note: Data on this page does not include results from NUSD independent charter schools; but does include all students, regardless of their current enrollment status.
200
100
0
100
50
0
100
50
0
100
50
0
100
50
0
100
50
0
100
50
0
100
50
0
100
50
0
100 students or more
Spanish is offered in grades 6-12
Mandarin Chinese in grades 6-12
French in grades 9-12
AP and IB language course offerings
Testing offered to students at NUSD
115
2015 2016 2017
11.2%

SOME ACTIONS IN PROGRESS
TARGET
SOME ACTIONS IN PROGRESS
TARGETALL STUDENTS
Asian
African American Hispanic/Latino
White
English Learners
Foster
Low Income
Students with Disabilities
100%
80%
60%
40%
20%
0%
100%
50%
0%
100%
50%
0%
100%
50%
0%
100%
50%
0%
100%
50%
0%
100%
50%
0%
100%
50%
0%
100%
50%
0%
ALL STUDENTS
Asian
African American Hispanic/Latino
White
English Learners
Foster
Low Income
Students with Disabilities
100%
80%
60%
40%
20%
0%
100%
50%
0%
100%
50%
0%
100%
50%
0%
100%
50%
0%
100%
50%
0%
100%
50%
0%
100%
50%
0%
100%
50%
0%
ACT PARTICIPATION MIDDLE SCHOOL DROPOUT RATE
90%
Providing ACT free of charge for all 11th grade students
Opportunity for seniors to retake ACT if missed junior test
Letters to parents informing them about opportunity and value for college/career preparation
Principal communications
2%or lower
ACT Participation is the total number of 11th grade students who took the ACT test during the school day divided by the total number of 11th grade students enrolled on test day. NUSD provides this unique opportunity for our students to take the ACT free of charge, during the school day. By expanding access, more students can demonstrate that they are ready for college on this exam. Prior to this program, 169 students took the ACT in 2014. Four years later, in 2017, nearly 800 students took the test. Expanding access means that 212 students met the ACT benchmark on the ELA test, up from 86 students in 2014.
Middle School Dropout Rate is the percent of students in grades 7 and 8 who drop out during a school year divided by the number of students enrolled in grades 7 and 8 the first week of October that school year. Each year, very few students drop out of middle school, but it is still an important statewide indicator, and requirement to monitor as part of our Local Control and Accountability Plan. Our middle school dropout rate, at 0.18%, is lower than the State average of 0.27%.
Attendance verification
Home wellness checks when appropriate
Restorative Justice
Positive Behavior Intervention and Supports program (PBIS)
Middle School athletics, extracurricular activities, clubs and afterschool programs
WEB - Where Everyone Belongs
823
2014 2015 2016 2014 2015 2016
2014 2015 2016
2014 2015 2016
2014 2015 20162014 2015 2016
2014 2015 20162014 2015 2016
2014 2015 2016
0.2% 0% 0%
0.4% 0.1%
Note: Data on this page does not include results from NUSD independent charter schools.
2015 2016 2017 2015 2016 2017
2015 2016 2017
2015 2016 2017
2015 2016 20172015 2016 2017
2015 2016 20172015 2016 2017
2015 2016 2017
81% 86%
78% 80% 86%
90% 92% 95%
77% 86% 90%
90% 86%97%
83% 74% 91%
61% 62% 74%
65% 80% 77%
100%(N= 3)
100%(N= 1)
100%(N= 2)
0% 0% 0.3% 0.5% 0% 0%
0% 0.2% 0.3%
0% 0% 0%
0% 0.5% 0%
0.2% 0.2% 0%
92%
0.2%NA:
Data not available

SOME ACTIONS IN PROGRESS
TARGET
SOME ACTIONS IN PROGRESS
TARGETALL STUDENTS
Asian
African American Hispanic/Latino
White
English Learners
Foster
Low Income
Students with Disabilities
100%
80%
60%
40%
20%
0%
100%
50%
0%
100%
50%
0%
100%
50%
0%
100%
50%
0%
100%
50%
0%
100%
50%
0%
100%
50%
0%
100%
50%
0%
ALL STUDENTS
Asian
African American Hispanic/Latino
White
English Learners
Foster
Low Income
Students with Disabilities
100%
80%
60%
40%
20%
0%
100%
50%
0%
100%
50%
0%
100%
50%
0%
100%
50%
0%
100%
50%
0%
100%
50%
0%
100%
50%
0%
100%
50%
0%
HIGH SCHOOL DROPOUT RATE A-G COMPLETION
A-G Completion is the total number of graduates from the previous school year who completed the UC/CSU A-G requirements divided bythe total number of graduates from the previous school year. Data on this page reflect district-wide results, as reported by the CaliforniaDepartment of Education, and includes independent charter schools. The 2017 rates are projections. Although the graduating class of2017 finished school in May/June 2017, the official graduation and A-G rates will not be reported by the California Department of Educationuntil April/May 2018. NUSD has the highest a-g rate in Sacramento County, and the highest a-g rate for Asian, African American, Latino,White, English Learners, and low income students.
60%
Expanded Course Offerings including online, summer school, and middle school courses
Aligned Course Catalogue
College/Career Counseling services
College and Career Specialists
Parent University workshops
Data analysis to meet individual students’ needs
247
2%or lower
Attendance verification
Wellness checks when needed
Increased clerical attention for transferring districts, and move verifications
Counseling services, including academic and social emotional supports
Parent University workshops
High School Dropout Rate is the percent of students in grades 9-12 who drop out during a school year divided by the number of students enrolled in grades 9-12 the first week of October that school year. Having a high graduation rate and a low dropout rate is an important indicator of both the academic program as well as the school climate. NUSD’s dropout rate has remained under 1% for the past two years. In total, 42 students in grades 9-12 dropped out of school in 2015-2016, and though the rate is low at 0.9%, our intention is to further reduce this number.
2014 2015 2016 2014 2015 2016
2014 2015 2016
2014 2015 2016
2014 2015 20162014 2015 2016
2014 2015 20162014 2015 2016
2014 2015 2016
1.9% 1.1% 1.8%
1.5% 0% 0.2% 1.3% 0.5% 0.4%
6.7% 0.5%
2.5% 1% 1.3%
1.8% 0.8%
1.7%
51%59%
2015 2016 2017
2015 2016 2017
2015 2016 2017
2015 2016 2017
2015 2016 2017
2015 2016 2017
2015 2016 2017
2015 2016 2017
2015 2016 2017
42% 42% 43%
66%86% 76%
44% 44%56%
66% 72% 71%
46% 53% 56%
9%17% 27%
11%25% 31%
Note: 2017 rates are projections, official rates will be shared by CDE in the Spring of 2018.
NA: fewer than 10 students
0.9%
61%
NA: Data not available
NA: Data not available
NA: Data not available

SOME ACTIONS IN PROGRESS
TARGETALL STUDENTS
Asian
African American Hispanic/Latino
White
English Learners
Foster
Low Income
Students with Disabilities
100%
80%
60%
40%
20%
0%
100%
50%
0%
100%
50%
0%
100%
50%
0%
100%
50%
0%
100%
50%
0%
100%
50%
0%
100%
50%
0%
100%
50%
0%
ALL STUDENTS
Asian
African American Hispanic/Latino
White
English Learners
Foster
Low Income
Students with Disabilities
SOME ACTIONS IN PROGRESS
TARGET
100%
80%
60%
40%
20%
0%
100%
50%
0%
100%
50%
0%
100%
50%
0%
100%
50%
0%
100%
50%
0%
100%
50%
0%
100%
50%
0%
100%
50%
0%
AP/IB COURSE ENROLLMENT GRADUATION RATE
Students at NHS, DHS, IHS, LGA students in 1617 who took at AP or IB class (includes IB SL and HL) with an S1 or S2 grade
Divided by students in grade 11 enrolled on test date
AP/IB Course Enrollment is the number of students taking at least one Advanced Placement (AP) or International Baccalaureate (IB) course divided by the total number of students enrolled in grades 9-12. Research shows that students who enroll in rigorous college level course work, such as AP or IB, are more prepared for college even if they do not pass that AP/IB exam. Natomas Unified is the first district in the region to offer a TK to 12th grade IB program. Natomas High School is an AP Capstone school. Because of these expanded offerings, more than 50% of our students take an AP or IB class before graduation.
Graduation Rate is the percent of students who graduate divided by the total number of students who began 9th grade four years earlier. NUSD has a high graduation rate - above the county and state averages - and NUSD has increased the graduation rate more than 10% over the past five years. The State of California reports graduation rates the following year (2017 rates are not yet available) on two different websites. On the Dataquest website, the 2016 graduation rate is reported and includes charter schools, but the California School Dashboard website reports the 2015 graduation rate for only Inderkum and Natomas High Schools. The data below is based on all NUSD schools’ rate, including charter schools and Discovery High School, our continuation high school.
Increased access to AP/IB courses
AP/IB exams at no cost for our students
Increased information for AP/IB opportunities for students who are not typically enrolled in AP/IB courses
Academic counseling and intentional student placement
30%
Expanded course offerings during the school year and in the summer
Aligned high school course catalogue
Academic counseling and intentional student placement
College and Career Coordination Specialists
Parent University workshops
Data analysis to meet individual students’ needs
90% 88% 92%
2014 2015 2016
2014 2015 2016
2014 2015 2016
2014 2015 2016
2014 2015 2016
2014 2015 2016
2014 2015 2016
2014 2015 2016
2014 2015 2016
84% 89% 90%
89% 92% 94%
83%92% 96%
92% 91%99%
85%90% 94%
68% 77% 79%
68%85% 92%
625
Note: Data on this page does not include results from NUSD independent charter schools.
2015 2016 2017 2015 2016 2017
2015 2016 2017
2015 2016 2017
2015 2016 20172015 2016 2017
2015 2016 20172015 2016 2017
2015 2016 2017
23% 27%
15% 18% 24%
55% 54%59%
20% 26% 29%
29% 28% 31%
22%25% 29%
1% 1% 6%
3% 5%11%
5% 0%10%
NA: Data not available
31%
95%

SOME ACTIONS IN PROGRESS
TARGETALL STUDENTS
Asian
African American Hispanic/Latino
White
English Learners
Foster
Low Income
Students with Disabilities
100%
80%
60%
40%
20%
0%
100%
50%
0%
100%
50%
0%
100%
50%
0%
100%
50%
0%
100%
50%
0%
100%
50%
0%
100%
50%
0%
100%
50%
0%
ENG
AG
EMEN
TA
CCES
S &
REA
DIN
ESS
AP/IB Pass Rate
CAASPP ELA CAASPP Math CAASPP Improvement from Level 1 - ELA
CAASPP Improvement from Level 1 - Math
A-GCompletion
AP/IB Test Taking Rate
11th Grade A-G
AP/IB Course Enrollment
College Ready ELA
Graduation Rate High School Dropout Rate Suspension Rate
Expulsion Rate
Chronic Absentee Rate
ACT Participation
EL Redesignation Rate
CA State Seal of Biliteracy
English Learner Progress
College Ready Math
DISTRICT PROGRESS REPORT AP/IB TEST TAKING RATE
15%
33%
61%
26%
26%
32%
68%
43%
31%
44%
7.7%0.9%
92%
0.2% 11%95%
0.1%
29%
92%
66%
AP/IB Test Taking Rate is the total number of students taking at least one exam divided by the total number of students enrolled in grades 9-12 the first week of October that school year. This year, we saw a big increase in the number of students taking an exam. The Board of Education committed extra resources to ensure that all students who take an AP/IB class can also take the exam because NUSD pays for the AP/IB test fees. NUSD is also shrinking the gap on the percent of students enrolled in an AP/IB course and the percent taking the exam from a 12% gap in 2016 to a 5% gap in 2017.
21%
115
265
Note: Data on this page does not include results from NUSD independent charter schools.
2015 2016 2017 2015 2016 2017
2015 2016 2017
2015 2016 2017
2015 2016 20172015 2016 2017
2015 2016 20172015 2016 2017
2015 2016 2017
9% 15%
5% 8%16%
22%
42%61%
8%14%
22%
12% 17%31%
10% 15% 23%
0% 0% 1%
1% 1%5%
NA: fewer than 10 students
16%
Increased access to AP/IB courses
Offer AP/IB exams at no cost for our students
Increase information for AP/IB opportunities for students who are not typically enrolled in AP/IB courses
42%
11th Grade Perceptions of Safety & Connectedness
53%
Middle School Dropout Rate
8th Grade Perceptions of Safety & Connectedness
4th Grade Perceptions of Safety & Connectedness
Trend Indicators (arrows and lines designate change over time)No arrow or line means there was no data in the previous year to compare
Improved performance, or meets or exceeds target
Little or no change, or inconsistent
Declining performance
Current Performance Indicators
High performance
Medium performance
Low performance
Not yet able to determine
26%

SOME ACTIONS IN PROGRESS
TARGET
SOME ACTIONS IN PROGRESS
TARGETALL STUDENTS
Asian
African American Hispanic/Latino
White
English Learners
Foster
Low Income
Students with Disabilities
100%
80%
60%
40%
20%
0%
100%
50%
0%
100%
50%
0%
100%
50%
0%
100%
50%
0%
100%
50%
0%
100%
50%
0%
100%
50%
0%
100%
50%
0%
AP/IB PASS RATE ENGAGEMENT - ACCESS AND READINESS
Students at NHS, DHS, IHS, LGA studetns in 1617 who took at AP or IB class (includes IB SL and HL) with an S1 or S2 grade
Divided by students in grades 9-12 at those schools enrolled at CBEDS
ENGAGEMENT ACCESS AND READINESS
● Graduation Rate (p.6)
● High School Dropout Rate (p.7)
● Middle School Dropout Rate (p.8)
● Chronic Absenteeism (p.9)
● Suspension Rate (p.10)
● Expulsion Rate (p.11)
● Student Perceptions of Safety and
Connectedness - Grade 4 (p.12)
● Student Perceptions of Safety and
Connectedness - Grade 8 (p.13)
● Student Perceptions of Safety and
Connectedness - Grade 11 (p.14)
● College Readiness English Language Arts (p.15)
● College Readiness Math (p.16)
● CAASPP Achievement English Language Arts (p.17)
● CAASPP Achievement Math (p.18)
● CAASPP Improvement English Language Arts (p.19)
● CAASPP Improvement Math (p.20)
● 11th Grade A-G (p.21)
● California State Seal of Biliteracy (p.22)
● ACT Participation (p.23)
● A-G Completion (p.24)
● AP/IB Course Enrollment (p.25)
● AP/IB Test Taking Rate (p.26)
● AP/IB Pass Rate (p.27)
● English Learner Progress (p.28)
● English Learner Redesignation Rate (p.29)
The District Progress Report communicates what matters most for our system-wide performance and improvement. Each year we will measure our performance and progress on important indicators of student engagement, and college/career access and readiness. The metrics below are aligned to our Vision, Core Beliefs, and Goals as well as California performance targets. On the following pages, each metric is defined and data is presented showing the current performance, progress over three years (when available), and results for some of our important student groups.
427
40%
Increased access to AP/IB courses
Offering AP/IB exams at no cost for our students
Increased co-curricular programs, such as study sessions and practice tests to prepare students
AP/IB Pass Rate is the total number of students who pass an AP or IB exam divided by the total number of test takers. NUSD measures the student pass rate, rather than the test pass rate, because our intention is to give as many students as possible the opportunity to take an advanced course and pass a college level exam. In the 2017 school year, we expanded access to AP classes and testing in large numbers. It is normal when expanding access to see a slight drop in the overall pass rate. At both Leroy Greene Academy and Natomas High School, test taking as well as pass rates increased in 2017. The total number of English Learners passing an AP/IB exam has grown each of the past three years, but the number of test takers more than tripled in 2017, leading to a drop from 60% to 24%.
2015 2016 2017 2015 2016 2017
2015 2016 2017
2015 2016 2017
2015 2016 20172015 2016 2017
2015 2016 20172015 2016 2017
2015 2016 2017
Note: Data on this page does not include results from NUSD independent charter schools.
9%23% 19%
24%39%
31%32% 39% 33%
24%35%
50%60%
35%40% 39%
26% 36%
33%
24%
NA: fewer than 10 students
NA: fewer than 10 students
32%

SOME ACTIONS IN PROGRESS
TARGETALL STUDENTS
Asian
African American Hispanic/Latino
White
English Learners
Foster
Low Income
Students with Disabilities
100%
80%
60%
40%
20%
0%
100%
50%
0%
100%
50%
0%
100%
50%
0%
100%
50%
0%
100%
50%
0%
100%
50%
0%
100%
50%
0%
100%
50%
0%
ABOUT THE DISTRICT PROGRESS REPORT ENGLISH LEARNER PROGRESS
The District Progress Report is a snapshot of our efforts to prepare all of our students to graduate as college and career ready, productive, responsible, and engaged global citizens. It keeps us focused on supporting all our students with attention on specific groups of students, and it provides consistency and reassurance that these priorities will be monitored and our progress will be shared regularly.
The District Progress Report is a tool for measuring our progress aligned to our Theory of Action for Student Success, a Board adopted policy that states:
This report is a tool for parents, teachers, students, and community members to monitor our performance and our progress. Continuous Improvement does not mean that scores will improve every year. There may be little growth some years, significant improvement other years, and some years there may be declines in our performance. Successful school districts, just like successful companies, may have years without growth, or even declines. Like other successful organizations, we can learn from mistakes, celebrate successes, and make continuous improvement over time.
With that in mind, the metrics on the following pages provide both a snapshot of current data, as well as progress over time. Each metric has an identified target and some of the actions that are currently in progress to support students in that area of work.
The Board of Trustees believes that “progress over time” is more essential than a snapshot in time of student achievement results. The Board of Trustees will monitor student and staff progress over time following the Cycle of Continuous Learning and Improvement (CCLI) for these Theory of Action elements to make policy and budgeting decisions to ensure that student success remains the primary focus of the Natomas Unified staff.
283
70%
Designated English Language Development
WIN time for elementary students
EL training for teachers and Specially Designed Academic Instruction in English (SDAIE) training for MS and HS teachers
Site support data analysis
Parent University
District English Language Advisory Committee (DELAC) workshops
English Learner Progress is the total number of English Learners who improve one level or more on the Annual State test for English Learners or remain at one of the top two levels divided by the total number of English Learners who took the annual state test for English Learners. The State of California is changing annual tests from the CELDT to the ELPAC. NUSD will make this shift with our metrics in 2018 and 2019. The California State Dashboard reports EL Progress as a combination of test progress and redesignation rate, but NUSD reports these metrics separately.
Note: Data on this page does not include results from NUSD independent charter schools.
2015 2016 20172015 2016 2017
2015 2016 2017
2015 2016 2017
2015 2016 20172015 2016 2017
2015 2016 20172015 2016 2017
2015 2016 2017
67% 65%
27%
64% 71%
70% 68% 71%
66% 63% 64%
63%81% 71%
67% 63% 64%
33%38%
52%
67% 65% 66%
NA: fewer than 10 students
66%

All NUSD students
graduate as college
and career ready,
productive,
responsible, and
engaged global
citizens
VISION
SOME ACTIONS IN PROGRESS
TARGETALL STUDENTS
Asian
African American Hispanic/Latino
White
English Learners
Foster
Low Income
Students with Disabilities
100%
80%
60%
40%
20%
0%
100%
50%
0%
100%
50%
0%
100%
50%
0%
100%
50%
0%
100%
50%
0%
100%
50%
0%
100%
50%
0%
100%
50%
0%
English Learner Redesignation Rate is the total number of English Learner (EL) Students who were redesignated between the last two annual census dates (first week of October) divided by the total number of English Learners at the first of those two census dates. Know that after a student is redesignated, we continue to monitor their progress for four additional years, and provide support as needed. Some of the metrics in this report show lower performance for EL Students in part because once a student demonstrates higher academic performance they may also redesignate to Fluent English Proficient. Note that there are very few African American EL Students, fewer than 20 of the 2,000 EL students, therefore redesignation rates for that group can change dramatically from year to year.
Natomas Unified School District Successes
Building on a commitment to excellence and achievement, the District Progress Report measures our progress over time to achieve our district vision and goals. Over the past five years, some of our successes include:
● Increased enrollment to 15,000students
● Increased graduation rates andlowered dropout rates
● Became a Sacramento Countyleader in the percentage ofgraduates meeting requirements toenroll in the University of Californiaor California State Universitysystems
● Became the first school districtcountywide to offer an InternationalBaccalaureate continuum fromTransitional Kindergarten through12th grade
● Expanded Career TechnicalEducation opportunities, includingCulinary Arts, Auto Technology,Broadcast Media, and EmergencyMedical Technician
● Expanded access to Gifted andTalented Education (GATE)
● Won national recognition by theCollege Board for AdvancedPlacement (AP) course access andsuccess
● Launched the academicallyrigorous AP Capstone Diplomaprogram at Natomas High School
● Received statewide recognition by theCalifornia Department of Education forexemplary practices at multiple schools
● Implemented a California Early CollegeAcademy, which allows high schoolstudents to earn college credits atAmerican River College while attendinghigh school
● Won voter passage of Measure J, a $129million school bond directed to fundcampus construction, renovation,security and other projects
● Opened the B. Teri Burns Health Clinicat Natomas High School to providebasic care, vaccinations, flu shots, andinformational workshops
● Launched an elementary school sportsprogram to promote studentengagement, school spirit, health andwellness
● Launched a free, on-campus ACTcollege admissions test program for alleleventh graders, with over 90%participation
● Received statewide awards for bestpractices in Constituent and CustomerServices and K-12 Continuum ofSocial-Emotional Support for students'behavioral and mental health needs
15%or higher
Designated English Language Development
WIN time for elementary students
EL training for teachers and Specially Designed Academic Instruction in English (SDAIE) training for MS and HS teachers
Site support data analysis
Parent University
District English Language Advisory Committee (DELAC) workshops
Note: These graphs do not include Natomas Charter School students. The redesignation rates displayed above are reported from the year the student was redesignated. This is different than the State of California, which reports the rate during the following year.
2015 2016 2017 2015 2016 2017
2015 2016 2017
2015 2016 2017
2015 2016 20172015 2016 2017
2015 2016 20172015 2016 2017
2015 2016 2017
16%5% 6%
24% 15%29%
13% 9%25%
21% 12%17% 10%18%
18% 12%
18%
5% 4% 6%
NA: fewer than 10 students
18% 12% 21%
NUSD has the highest A-G rate in SacramentoCounty, and the highestA-G rate for Asian,African American, Hispanic/Latino, White,English Learners, andlow income students.
21%
ENGLISH LEARNER REDESIGNATION RATE DISTRICT SUCCESSES - THE PAST FIVE YEARS229

Message from the Superintendent
This is Natomas Unified’s first District Progress Report. This progress report puts the various state and local measures of student success in one place, continuing our theme of transparency. In these pages, we show where we are succeeding, where we are making progress, and where we need to improve. This data is reviewed in principal meetings, staff meetings, and within the Boardroom. In this booklet, it is available for all to see. These aren’t final “grades;” these are works in progress. It’s a progress report like we had when we were in school. We will celebrate the good news and take actions to address the areas of need. I take great pride in our efforts. We have a great staff, strong Board leadership, and a wonderful community. We also have more work to do and the sense of urgency to prepare all of our students to graduate as college and career ready, productive, responsible, and engaged global citizens. Moving forward, we have efforts in place to engage our community in which other metrics for success can be included in our elementary schools. Right now, our progress report is secondary school “heavy.” Please take the time to look through this and talk to your school principals about your school and what this means for your student and community.
- Chris Evans, Superintendent
Message from the Board President
Every family in Natomas Unified has a stake in this District Progress Report because it provides valuable insight into our district’s performance and student learning. Data is tracked annually over three years, making it easier to spot trends. This report also reflects our commitment to keep you informed of progress toward meeting community priorities listed in “The Next 5” strategic plan. We look forward to continuing our work with you to ensure that all students graduate from high school prepared for a bright future in college and/or a career. We’re honored to serve you and pleased to provide this report.
- Lisa Kaplan, NUSD Board President
BOARD OF TRUSTEES
Lisa KaplanPresident
Dr. Susan HerediaVice President
Micah GrantClerk
B. Teri BurnsMember
Scott DosickMember
SUPERINTENDENTChris Evans
OTHER INFORMATION301
● Throughout this report, on each of the metrics, some of the actions that are underway in NUSD to supportour students, staff, and school are listed. For an explanation of how we’re addressing metrics in red, and toview some other actions in place, visit our NUSD LCAP at: www.natomasunified.org/lcfflcap
● Current status indicators and colors for high, medium, and low performance were selected based on: 1)comparisons to State and other local districts, 2) using research in K-12 education, and/or 3) comparisons toprevious performance in Natomas Unified School District.
● Unless otherwise noted on the bottom of individual pages, the data on those pages include results from allNUSD schools, including independent charter schools.
● Data in this report are drawn from the most up-to-date resources available in NUSD at the time of printing.The data in this report do not necessarily match data on the California School Dashboard or CaliforniaDepartment of Education website because in some cases, those websites present data that are one or twoyears old, and may include charter school results.
● Data are presented for the four largest student groups in NUSD: African American, Asian, Hispanic, & White.
● Some data charts may not add up to 100% because American Indian/Alaska Native, Native Hawaiian orOther Pacific Islander, Students with Two or More Races, and Students without a reported Race are includedin the overall data but do not have individual graphs.
● Visit our website to learn more about NUSD & the District Progress Report: www.natomasunified.org/dpr

DISTRICT PROGRESS REPORTFALL 2017
Staying focu
sed on
What is most
important
This year, our district launched an ambitious effort with our community to identify what is working, what is not, and where we need to go for the NEXT 5 years in Natomas Unified School District. There have been a lot of successes in NUSD, but there is still work to do. Today, we are proud to share our first District Progress Report which is like a checkup to see how we are doing along the way to achieve our district goals through 28 strategic directions.
This District Progress Report is a snapshot of our daily work as we prepare all of our students to graduate as college and career ready, productive, responsible, and engaged global citizens. It keeps us focused on supporting all of our students with particular attention on our English Learners, students of poverty, students of color, and foster students. It also provides consistency and reassurance that we will monitor our strategic directions, and share our progress twice a year.
www.natomasunified.org/dpr