district strategic improvement plan - · pdf filedistrict strategic improvement plan ......
TRANSCRIPT

GREENWICH PUBLIC SCHOOLS
DISTRICT STRATEGIC IMPROVEMENT PLAN
2012 - 2013 School Year

Greenwich Public Schools District Strategic Action Plan
In the fall of 2011, educators at both the District and school levels conducted an analysis of standardized test scores from 2007 to 2011. Six issues emerged that account for most of the difference in performance between Greenwich and comparable Connecticut districts:
1. Low student achievement in reading and mathematics at the end of the primary grades.
2. The recent two year decline in writing scores as measured by the Connecticut Mastery Test in grades three through eight.
3. Continued low performance of students in science as measured by the Connecticut Mastery Test in grades five and eight and the Connecticut Academic Performance Test in grade ten.
4. Gaps in achievement among student subgroups; most notably the gap in achievement between students who qualify for free or reduced price lunch and their peers who do not qualify.
5. The growth in mathematics and reading achievement of Greenwich students lags comparable districts from grade five to grade six.
6. The performance of students who are new to the District as defined by students enrolled in the Greenwich Public Schools for less than three years.
After careful consideration of these issues, in June of 2012, the Board of Education adopted three goals that will drive district improvement planning through the 2014-2015 school year:
READING: The percentage of Grade 3 students at Goal/Mastery in CMT Reading will be 83% by 2015.
MATH: The percentage of 8th grade students successfully passing Algebra I will be 75% by 2015 to be measured by standardized test and GPS district math test.
WRITING: The percentage of Grade 8 students at Goal/Mastery in CMT Writing will be 87% by 2015.
The following diagnostic memoranda detail why each of these goals are important, identify the root causes of underperformance and outline strategies designed to improve student achievement. The second year of the resulting District Strategic Action Plan (DSIP) will be funded by the 2013-2014 budget. Improvement plans in each school are aligned with the DSIP and support the achievement of the Board of Education goals.
Page 2

Greenwich Public SchoolsStrategic Planning CyclePolicy E - 010
AugustProgress Report from the
previous school year on the student achievement results from the District
Monitoring System (dashboard format).
FebruaryConsidering Diagnostic
Memorandum, BOE adds, deletes or maintain goals for following school year and adjusts strategic
directions. New goals written in
SMART format.
AprilDistrict Data Team
updates action plans for continuing goals and
develops action plans for new goals for the
following school year.
JuneBOE reviews student
achievement measures. District Monitoring System revised as
necessary (implemented following school year).
OctoberDistrict Data Team reports to BOE on
adjustments to the District Action Plan for the current
school year based on results from previous
school year.
JanuaryDistrict Data Team
prepares a diagnostic memorandum for BOE updating progress on
existing goals and discussing causes and
solutions for potential goals.
ProgramMonitoring Reports
Provide detailed student achievement data disaggregated by school, grade and subgroup.
Highlight issues impacting achievement.
Suggest new student achievement measures.
Mission articulates the purpose of the Greenwich Public Schools
Core Values and Beliefs comprise the ethical framework that guides all our decisions.
Strategic Directions specify long term trends that will shape strategic planning over the next five to ten years.
The Vision of the Graduate broadly describes the outcomes we seek for students.
District Monitoring System specifies measures for the student outcomes described in the Vision of the Graduate.
Data Teams align improvement goals and action plan from the district to the school to the classroom.
Page 3

Instructional Data Team
(grade)
Elementary School
Data Teams
Instructional Data Team
(grade)
Instructional Data Team
(grade)
Instructional Data Team
(grade)
Instructional Data Team
(grade)
Instructional Data Team
(grade)
Instructional Data Team
(grade)
Middle School
Data Teams
Instructional Data Team
(team)
Instructional Data Team
(team)
Instructional Data Team
(team)
Instructional Data Team
(team)
Instructional Data Team
(team)
Instructional Data Team (subject)
High School Data Team
Instructional Data Team (subject)
Instructional Data Team (subject)
Instructional Data Team (subject)
Instructional Data Team (subject)
Instructional Data Team (subject)
Program Data Teams
(District)
Instructional Data Team
(ES)
Instructional Data Team
(MS)
Instructional Data Team
(HS)
District Monitoring System
Board of Education Goals
K-12 District Data Team
District Improvement Plan
Greenwich Public SchoolsData Team Structure
Student achievement measures aligned from district to schools to classrooms.
School Data Teams and Instructional Data Teams must account for Board of Education goals.
IDT (course)
IDT (course)
IDT (course)
IDT (course)
Page 4
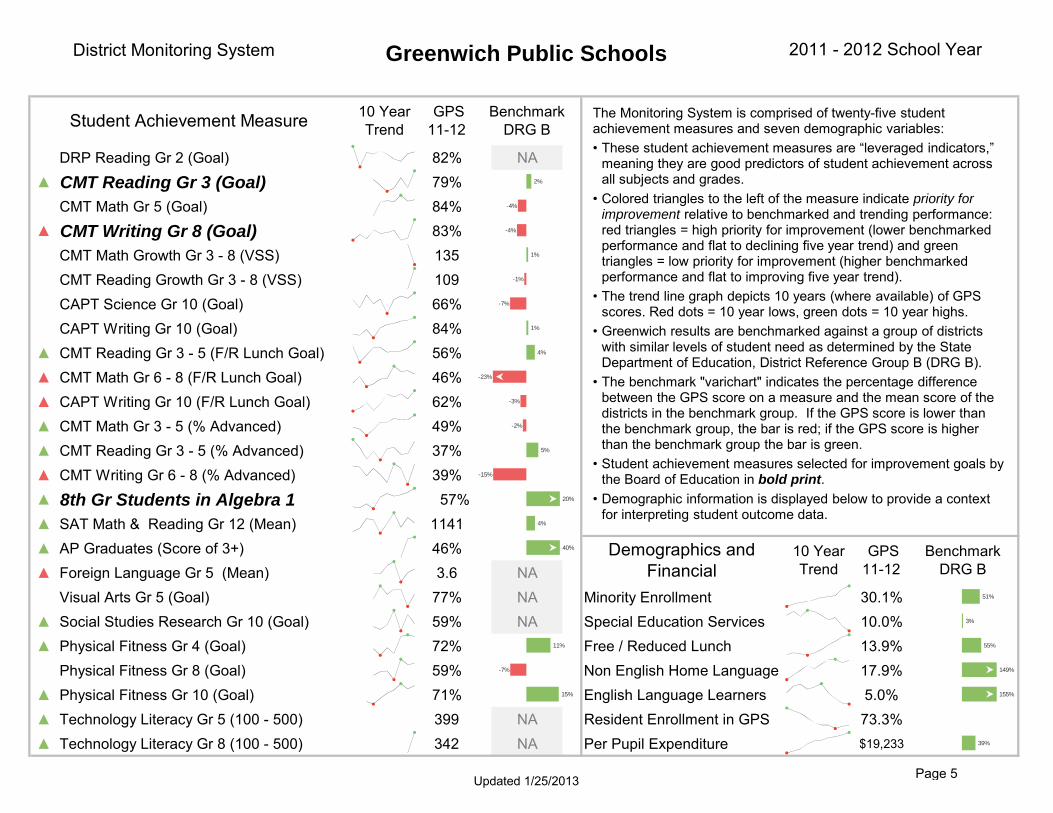
District Monitoring System Greenwich Public Schools 2011 - 2012 School Year
▲ DRP Reading Gr 2 (Goal) 82% NA▲ CMT Reading Gr 3 (Goal) 79%▲ CMT Math Gr 5 (Goal) 84%▲ CMT Writing Gr 8 (Goal) 83%▲ CMT Math Growth Gr 3 - 8 (VSS) 135▲ CMT Reading Growth Gr 3 - 8 (VSS) 109▲ CAPT Science Gr 10 (Goal) 66%▲ CAPT Writing Gr 10 (Goal) 84%▲ CMT Reading Gr 3 - 5 (F/R Lunch Goal) 56%▲ CMT Math Gr 6 - 8 (F/R Lunch Goal) 46%▲ CAPT Writing Gr 10 (F/R Lunch Goal) 62%▲ CMT Math Gr 3 - 5 (% Advanced) 49%▲ CMT Reading Gr 3 - 5 (% Advanced) 37%▲ CMT Writing Gr 6 - 8 (% Advanced) 39%▲ 8th Gr Students in Algebra 1 57%▲ SAT Math & Reading Gr 12 (Mean) 1141▲ AP Graduates (Score of 3+) 46%▲ Foreign Language Gr 5 (Mean) 3.6 NA▲ Visual Arts Gr 5 (Goal) 77% NA Minority Enrollment 30.1%▲ Social Studies Research Gr 10 (Goal) 59% NA Special Education Services 10.0%▲ Physical Fitness Gr 4 (Goal) 72% Free / Reduced Lunch 13.9%▲ Physical Fitness Gr 8 (Goal) 59% Non English Home Language 17.9%▲ Physical Fitness Gr 10 (Goal) 71% English Language Learners 5.0%▲ Technology Literacy Gr 5 (100 - 500) 399 NA Resident Enrollment in GPS 73.3%▲ Technology Literacy Gr 8 (100 - 500) 342 NA Per Pupil Expenditure $19,233
GPS 11-12Student Achievement Measure 10 Year
Trend
Demographics and Financial
10 Year Trend
Benchmark DRG B
GPS 11-12
Benchmark DRG B
The Monitoring System is comprised of twenty-five student achievement measures and seven demographic variables:• These student achievement measures are “leveraged indicators,”
meaning they are good predictors of student achievement across all subjects and grades.
• Colored triangles to the left of the measure indicate priority for improvement relative to benchmarked and trending performance: red triangles = high priority for improvement (lower benchmarked performance and flat to declining five year trend) and green triangles = low priority for improvement (higher benchmarked performance and flat to improving five year trend).
• The trend line graph depicts 10 years (where available) of GPS scores. Red dots = 10 year lows, green dots = 10 year highs.
• Greenwich results are benchmarked against a group of districts with similar levels of student need as determined by the State Department of Education, District Reference Group B (DRG B).
• The benchmark "varichart" indicates the percentage difference between the GPS score on a measure and the mean score of the districts in the benchmark group. If the GPS score is lower than the benchmark group, the bar is red; if the GPS score is higher than the benchmark group the bar is green.
• Student achievement measures selected for improvement goals by the Board of Education in bold print.
• Demographic information is displayed below to provide a context for interpreting student outcome data.
39%
11%
155%
51%
-3%
2%
-7%
-2%
-4%
149%
40%
1%
15%
4%
-15%
-1%
-23%
-4%
55%
20%
-7%
4%
1%
3%
5%
Updated 1/25/2013 Page 5

Diagnostic Memorandum
Writing
Goal: The percentage of Grade 8 students at Goal/Mastery in CMT Writing will be 87% by 2015.
Problem:
The Common Core standards place emphasis on writing across the academic disciplines.
Writing skills, particularly non-fiction writing, are critical to success in high school and college (Reeves 2000, Schmoker 2006).
For the five years through 2011, the trend in the percentage of Greenwich eighth graders achieving at goal or higher in CMT writing has been essentially flat and lags comparable districts:
Update Based on 2012 Results
The percentage of students in grade eight scoring at goal or above in writing increased from 78.4% in 2011 to 82.6% in 2012 as compared to 86.3% in the DRG B districts and 94.0% in the DRG A districts.
0%
10%
20%
30%
40%
50%
60%
70%
80%
90%
100%
2007 2008 2009 2010 2011
Greenwich Public SchoolsCMT Writing at Goal
Grades 8 2007 - 2011All Students
GreenwichDRG ADRG B
Page 6

Diagnostic Memorandum
Writing
Causes Solutions Strategies*
Cause #1:
Sufficient instructional time is
not allocated for students to
write for information and
argument in content area
lessons.
Data:
Data from administrator
formal and informal
observations indicate
insufficient writing taking
place in content area
instruction. (Additional data to support this cause
will be collected as part of the Writing
Action Plan.)
What: Develop an integrated writing curriculum (informational, argumentative) in English/Language Arts (ELA), Science, Social Studies, Media consistent with Common Core expectations Who: Program Coordinators for ELA, Science, Social Studies Media/Technology; Middle School Principals How implemented: Curriculum mapping process Result Measure: The amount of time students are engaged in writing for information and argument during content areas lessons will increase by 10% each year when compared to baseline data collected in the fall of 2013.
1. Collect baseline data on the amount of time allocated for students to write for information and argument in content area lessons. (Fall 2012)
2. Conduct a gap analysis in LA, Science, Social Studies and Media/Tech. to identify skills and genre deficiencies utilizing the curriculum-mapping system. (Fall 2012)
3. Create a vertically articulated writing skill/genre map for Science, Social Studies, and Media consistent with Common Core State Standards (Spring 2013)
4. Utilize the map to guide writing instruction in Science and Social Studies (2013-15)
Page 7

Diagnostic Memorandum
Writing
Causes Solutions Strategies*
Cause #2:
Teachers are not utilizing the
GPS Research and Writing
Process to an optimum level in
content area classes.
Data:
8th
Grade 21st Century Skills
Assessment Data: The results
from the pre to post assessment
for 11-12 showed little to no
growth on the Research and
Informational Fluency and
Critical Thinking/Problem
Solving and Decision-Making
strands. See Attached
Grade 8 Science CMT Data:
Although results increased in
11-12, scores in Strand 5 have
remained consistently flat.
Strand 5 is where students are
required to develop
investigable questions, design
investigations, present and
analyze data, and
communicate in writing about
their results.
See Attached (Additional data to support this cause
will be collected as part of the Writing
Action Plan.)
What: Improve/Enhance capacity of Science, Social Studies and Media/Technology teachers to teach writing in their content area consistent with Common Core expectations. Who: Program Coordinators for ELA, Science, Social Studies, Media; Middle School Principals, Teachers How implemented: Professional learning Result Measure: The percentage of content area teachers who are meeting the GPS Performance Standards for Writing Instruction (Research and Writing Process) will be 85% (2014) and 95% (2015).
1. Collect baseline data on the level of utilization of the GPS Research and Writing Process.(Fall 2012)
2. Provide professional learning to teachers focused on the qualities of argumentative and informational writing.(2012-2013)
3. Provide professional learning for teachers on the design and use of core writing rubrics for focused and corrective feedback with additional criteria that is discipline-specific for students in all content-areas. (2013-2014)
4. Provide professional learning on the writing process. (Summer 2013)
Page 8

Diagnostic Memorandum
Writing
Causes Solutions Strategies*
Cause #3:
Writing tasks across grade
levels and content areas are
not appropriately rigorous**.
Data:
ELA Common Core Standards
(http://www.corestandards.org/
the-standards/english-
language-arts-standards) and
Appendix C
(http://www.corestandards.or
g/assets/Appendix_C.pdf);
8th
Grade 21st Century Skills
Assessment Data: See Cause
#2 Data above.
Grade 8 Science CMT Data:
See Cause #2 Data above.
(Additional data to support this cause
will be collected as part of the Writing
Action Plan.) **Rigorous writing tasks are defined as those which require students to engage in reflective thought, analysis, problem-solving, evaluation or creativity to demonstrate thorough mastery and to develop cognitive skills.
What: Increase the student cognitive demand of writing tasks including research and information fluency within Social Studies and Science consistent with Common Core/SBAC performance task expectations. Who: Program Coordinators for ELA, Science, Social Studies, Media; Middle School Principals How implemented: Professional learning, identification/purchase of resources, exemplar tasks Result Measure: The distribution of writing tasks in which students are engaged will between balanced across Webb’s Depths
of Knowledge levels as follows:
2013-14 at 50% levels 2/3 and 50% levels 3/4
2014-15 at 40% levels 2/3 and 60% levels 3/4
1. Collect baseline data on the level of rigor in writing tasks in content areas. (Fall 2012)
2. Identify and collect/purchase available performance tasks exemplars and related resources. (2012-2014)
3. Provide professional learning for teachers and administrators on instructional frameworks to enhance “rigor” within classroom tasks (e.g. Revised Bloom’s Taxonomy, Webb’s Depths of Knowledge-DOK) (2012-2014).
4. Integrate effective and research-based digital tools and resources to support rigorous writing tasks and student engagement. (2012-2013)
5. Increase collaboration time between media specialists and content-area teachers in order to integrate research and informational fluency skills. (2012-2015)
*Each strategy has a detailed action plan that includes specific timelines; costs; person(s) responsible.
Page 9

Greenwich Public Schools, BOE Grade Eight Writing Goal Action Plan 2012-13
Goal: The percentage of Grade 8 students at Goal/Mastery in CMT Writing will be 87% by 2015.
Cause #1: Sufficient instructional time is not allocated for students to write for information and argument in content area lessons. Solution #1: Develop an integrated writing curriculum (informational, argumentative) in Language Arts, Science, Social Studies, and Media/Technology to align with Common Core State Standards.
Result Measure #1: The amount of time students are engaged in writing for information and argument during content areas lessons will increase by 10% each year when compared to baseline data collected in the fall of 2012.
Strategies Timeline Fiscal Impact and Funding Source Person(s) Responsible
Progress Monitoring 2012-13 2013-14 2014-15
1. Collect baseline data on the amount of time allocated for students to write for information and argument in content areas lesson.
All Middle School administrators will conduct 20 minute observations of social studies and science classrooms to collect baseline data on the amount of time students are engaged in writing for information and argument.
Fall 2012 NA /A NA NA Middle School (MS) Principals; English/Language Arts (ELA) Program Coordinator
Observation Data
Middle School Principals will aggregate the data by grade level and content area; review the data with the SDT; and report that data to the CIPL office.
Fall 2012 NA NA NA MS Principals; CIPL; ELA Program Coordinator; School Data Teams (SDT) at 3 Middle Schools
Baseline Data; SDT Minutes
Page 10

Cause #1: Sufficient instructional time is not allocated for students to write for information and argument in content area lessons. Solution #1: Develop an integrated writing curriculum (informational, argumentative) in Language Arts, Science, Social Studies, and Media/Technology to align with Common Core State Standards.
Result Measure #1: The amount of time students are engaged in writing for information and argument during content areas lessons will increase by 10% each year when compared to baseline data collected in the fall of 2012.
Strategies Timeline Fiscal Impact and Funding Source Person(s) Responsible
Progress Monitoring 2012-13 2013-14 2014-15
2. Conduct a gap analysis in ELA, Science, Social Studies and Media/Tech. to identify skills and genre deficiencies utilizing the curriculum-mapping system.
Coordinators will work with existing content-area maps/ pacing guides to conduct a gap analysis of current writing skills.
Fall 2012 NA NA NA Asst. Super. CIPL; Program Coordinators for ELA, Science (Sci), Social Studies (SS), Media/ Tech; MS Principals
Completion of Gap Analysis Document
Coordinators will review “gap analysis” document with teachers/departments at November/ December department meeting.
October 17,
2012 NA NA NA CIPL, Program
Coordinators for ELA, Sci, SS, Media/ Tech; MS Principals
Meeting Minutes
3. Create a vertically aligned writing skill/genre map for the content-areas of Science, Social Studies and Media/Tech. to align with Common Core State Standards.
Based on gap analysis document and CCSS, Coordinators will generate a cross-content area map of all writing skills to be integrated into existing units of study.
Spring 2013 NA NA NA CIPL, Program Coordinators for ELA, Sci, SS, Media/ Tech; MS Principals
Cross content-area scope/sequence (map) of writing skills
4. Utilize the “map” to guide writing instruction in Science and Social Studies.
Identify/purchase available resources to support writing instruction within existing units of study.
Spring 2013-2015
$10,000 310
TBD TBD CIPL, Program Coordinators for ELA, Sci, SS, Media/ Tech; MS
Materials Inventory and Distribution List; Purchase Orders
Page 11

Cause #1: Sufficient instructional time is not allocated for students to write for information and argument in content area lessons. Solution #1: Develop an integrated writing curriculum (informational, argumentative) in Language Arts, Science, Social Studies, and Media/Technology to align with Common Core State Standards.
Result Measure #1: The amount of time students are engaged in writing for information and argument during content areas lessons will increase by 10% each year when compared to baseline data collected in the fall of 2012.
Strategies Timeline Fiscal Impact and Funding Source Person(s) Responsible
Progress Monitoring 2012-13 2013-14 2014-15
Principals
Teachers will integrate writing skills into existing units of study, across all content-areas.
Ongoing
NA NA
NA CIPL, Program Coordinators for ELA, Sci, SS, Media/ Tech; MS Principals
Content-area Curriculum Maps/ Units of Study
Grade-level, vertical Instructional Data Teams (IDT) will discuss, identify and implement strategies for integrating writing into lessons. Minutes will be reviewed by SDT.
Ongoing NA NA NA Grade-level IDT Teams, Middle School SDT teams
Vertical IDT Minutes SDT Minutes
Cause #2: Teachers are not utilizing the GPS Research and Writing Process to an optimum level in content area classes. Solution #2: Improve and enhance the capacity of Science, Social Studies and Media/Technology teachers to teach writing in their content-areas consistent with Common Core expectations.
Result Measure #2: The percentage of content area teachers who are meeting the GPS Performance Standards for Writing Instruction (Research and Writing Process) will be 85% (2014) and 95% (2015).
Strategies Timeline Fiscal Impact and Funding Source Person(s) Responsible
Progress Monitoring
2012-13 2013-14 2014-15
1.Collect baseline data on the level of utilization of the GPS Research and Writing Process.
All Middle school administrators will conduct 20-minute observations of social studies and science instruction to collect baseline data on the
Fall 2012 NA NA NA MS Principals; ELA Program Coordinator
Observation Data
Page 12
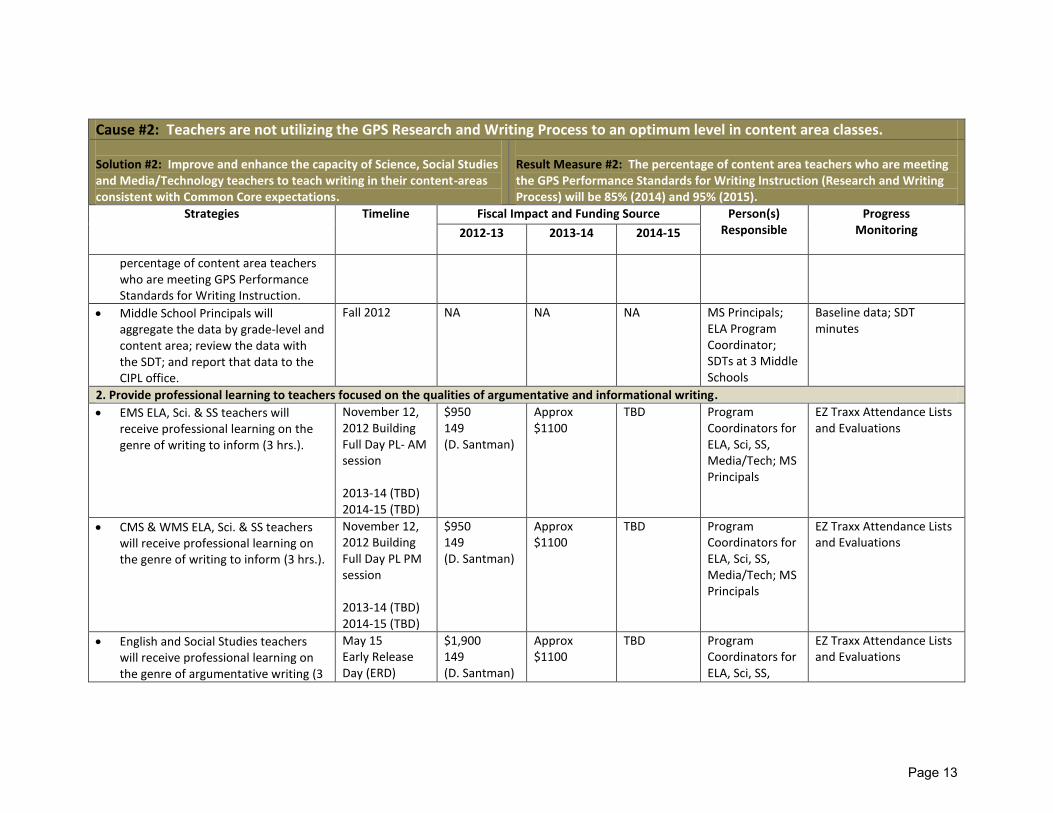
Cause #2: Teachers are not utilizing the GPS Research and Writing Process to an optimum level in content area classes. Solution #2: Improve and enhance the capacity of Science, Social Studies and Media/Technology teachers to teach writing in their content-areas consistent with Common Core expectations.
Result Measure #2: The percentage of content area teachers who are meeting the GPS Performance Standards for Writing Instruction (Research and Writing Process) will be 85% (2014) and 95% (2015).
Strategies Timeline Fiscal Impact and Funding Source Person(s) Responsible
Progress Monitoring
2012-13 2013-14 2014-15
percentage of content area teachers who are meeting GPS Performance Standards for Writing Instruction.
Middle School Principals will aggregate the data by grade-level and content area; review the data with the SDT; and report that data to the CIPL office.
Fall 2012 NA NA NA MS Principals; ELA Program Coordinator; SDTs at 3 Middle Schools
Baseline data; SDT minutes
2. Provide professional learning to teachers focused on the qualities of argumentative and informational writing.
EMS ELA, Sci. & SS teachers will receive professional learning on the genre of writing to inform (3 hrs.).
November 12, 2012 Building Full Day PL- AM session 2013-14 (TBD) 2014-15 (TBD)
$950 149 (D. Santman)
Approx $1100
TBD
Program Coordinators for ELA, Sci, SS, Media/Tech; MS Principals
EZ Traxx Attendance Lists and Evaluations
CMS & WMS ELA, Sci. & SS teachers will receive professional learning on the genre of writing to inform (3 hrs.).
November 12, 2012 Building Full Day PL PM session 2013-14 (TBD) 2014-15 (TBD)
$950 149 (D. Santman)
Approx $1100
TBD
Program Coordinators for ELA, Sci, SS, Media/Tech; MS Principals
EZ Traxx Attendance Lists and Evaluations
English and Social Studies teachers will receive professional learning on the genre of argumentative writing (3
May 15 Early Release Day (ERD)
$1,900 149 (D. Santman)
Approx $1100
TBD
Program Coordinators for ELA, Sci, SS,
EZ Traxx Attendance Lists and Evaluations
Page 13

Cause #2: Teachers are not utilizing the GPS Research and Writing Process to an optimum level in content area classes. Solution #2: Improve and enhance the capacity of Science, Social Studies and Media/Technology teachers to teach writing in their content-areas consistent with Common Core expectations.
Result Measure #2: The percentage of content area teachers who are meeting the GPS Performance Standards for Writing Instruction (Research and Writing Process) will be 85% (2014) and 95% (2015).
Strategies Timeline Fiscal Impact and Funding Source Person(s) Responsible
Progress Monitoring
2012-13 2013-14 2014-15
hrs.). Media/Tech; MS Principals
3. Provide professional learning for teachers on the design and use of core writing rubrics for focused and corrective feedback with additional criteria that is discipline-specific for students in all content-areas.
A small team of administrators and teachers will collect a variety of model rubrics designed to assess non-fiction (informational and argumentative) writing. Documents will be revised to address GPS content-area expectations.
Spring 2013
NA NA NA CIPL, MS Principals, ELA, Sci, SS & Media/Tech Coordinators
GPS Non-fiction writing rubrics
Common non-fiction writing rubrics will be utilized to assess student writing and to provide feedback to students in all content-areas.
2013-14 NA NA NA CIPL, MS Principals
4. Provide professional learning on the writing process.
4-day Writing Institute for English Teachers
Summer 2013 NA -$7,600 149 -TBD G&D ($220*4= $880*30; $26,400)
NA Program Coordinators for LA, Sci, SS, Media/ Tech; MS Principals
EZ Traxx Attendance Lists and Evaluations
3-day Content-Area Writing Institute (Sci, SS, Media/Tech. teachers)
Summer 2013 NA -$5,700 149 -G&D
TBD CIPL, MS Principals, ELA, Sci, SS &
EZ Traxx Attendance Lists and Evaluations
Page 14

Cause #2: Teachers are not utilizing the GPS Research and Writing Process to an optimum level in content area classes. Solution #2: Improve and enhance the capacity of Science, Social Studies and Media/Technology teachers to teach writing in their content-areas consistent with Common Core expectations.
Result Measure #2: The percentage of content area teachers who are meeting the GPS Performance Standards for Writing Instruction (Research and Writing Process) will be 85% (2014) and 95% (2015).
Strategies Timeline Fiscal Impact and Funding Source Person(s) Responsible
Progress Monitoring
2012-13 2013-14 2014-15
($220*3= $660 * 45=$39,600)
Media/Tech Coordinators
Cause #3: Writing tasks across grade levels and content areas are not appropriately rigorous. Solution #3: Increase the cognitive demand of student writing tasks, including research and information fluency, within Science and Social Studies to align with Common Core/SBAC performance task expectations.
Result Measure #3: The distribution of writing tasks in which students are engaged will be balanced across Webb’s Depths of Knowledge levels as follows: 2013-14 at 50% levels 1/2 and 50% levels 3/4 2014-15 at 40% levels 1/2 and 60% levels 3/4
Strategies Timeline Fiscal Impact and Funding Source Person(s) Responsible
Progress Monitoring 2012-13 2013-14 2014-15
1. Collect baseline data on the level of rigor in writing tasks in content areas.
All Middle school administrators will conduct 20-minute observations of social studies and science instruction to collect baseline data on the level of rigor in writing tasks in the content areas.
Fall 2012 NA NA NA MS Principals; ELA Program Coordinator
Observation Data
Middle School Principals will aggregate the data by grade level and content area; review the data with the SDT; and report data to the ELA
Fall 2012 NA NA NA MS Principals; ELA Principals; SDTs at 3 Middle Schools
Baseline Data; SDT Minutes
Page 15

Cause #3: Writing tasks across grade levels and content areas are not appropriately rigorous. Solution #3: Increase the cognitive demand of student writing tasks, including research and information fluency, within Science and Social Studies to align with Common Core/SBAC performance task expectations.
Result Measure #3: The distribution of writing tasks in which students are engaged will be balanced across Webb’s Depths of Knowledge levels as follows: 2013-14 at 50% levels 1/2 and 50% levels 3/4 2014-15 at 40% levels 1/2 and 60% levels 3/4
Strategies Timeline Fiscal Impact and Funding Source Person(s) Responsible
Progress Monitoring 2012-13 2013-14 2014-15
Program Coordinator.
2. Identify and collect/purchase available performance tasks exemplars and related resources.
Identify and gather available Performance Task exemplars and resources (e.g. websites, published materials).
Fall 2012 NA NA NA Program Coordinators for ELA, Sci, SS, and Media/Technology; MS Principals
Materials Inventory and Distribution List
English teachers will receive professional learning on Performance Task exemplars and resources (morning: 3 hrs.).
November 6, 2012
NA NA NA Program Coordinators for ELA, Sci, SS, and Media/Technology; MS Principals
EZ Traxx Attendance Lists and Evaluations
Science and Social Studies teachers will receive professional learning on Performance Task exemplars and resources (3 hrs.).
January 30, 2013 Early Release Day
NA NA NA Program Coordinators for ELA, Sci, SS, and Media/Technology; MS Principals
EZ Traxx Attendance Lists and Evaluations
All MS teachers will work in vertical and horizontal teams to identify, administer and double score 1 Performance Task exemplar.
Spring, 2013; Grade-level, content-area team meetings
NA NA TBD MS Principals, CIPL, ELA, Sci, SS & Media/Tech Coordinators
Aggregate scores will be reviewed by SDT to determine next steps
Purchase & administer CCSS/SBAC Interim Performance Tasks and Formative Tools in grades 3-11
2013-14 NA CSDE will release CCSS/SBAC
Recurring Cost determined
Special Projects Manager & CIPL
Purchase Orders; CCSS/SBAC Interim Performance Task and
Page 16

Cause #3: Writing tasks across grade levels and content areas are not appropriately rigorous. Solution #3: Increase the cognitive demand of student writing tasks, including research and information fluency, within Science and Social Studies to align with Common Core/SBAC performance task expectations.
Result Measure #3: The distribution of writing tasks in which students are engaged will be balanced across Webb’s Depths of Knowledge levels as follows: 2013-14 at 50% levels 1/2 and 50% levels 3/4 2014-15 at 40% levels 1/2 and 60% levels 3/4
Strategies Timeline Fiscal Impact and Funding Source Person(s) Responsible
Progress Monitoring 2012-13 2013-14 2014-15
Performance Tasks and Formative Tools at a per pupil cost sometime in 2013-14
on a per pupil basis
Formative Tools results data
3. Provide professional learning for teachers and administrators on instructional frameworks to enhance “rigor” within classroom tasks (e.g. Revised Bloom’s Taxonomy, Webb’s Depths of Knowledge-DOK).
Provide professional learning for all district administrators on instructional frameworks designed to increase “rigor”.
2012 Aug. Leadership Institute 2012-14 Leadership Council Mtgs 2012-13 Administrator PLA
NA NA NA
TBD TBD CIPL, Principals, Program Coordinators for Math, ELA, Media/Tech and Deputy Superintendent
EZ Traxx Attendance Lists and Evaluations
Provide professional learning for ELA, Science and Social Studies teachers on instructional frameworks designed to increase “rigor”.
2012-14 Faculty Meetings
NA TBD TBD MS Principals EZ Traxx Attendance Lists and Evaluations
Page 17

Cause #3: Writing tasks across grade levels and content areas are not appropriately rigorous. Solution #3: Increase the cognitive demand of student writing tasks, including research and information fluency, within Science and Social Studies to align with Common Core/SBAC performance task expectations.
Result Measure #3: The distribution of writing tasks in which students are engaged will be balanced across Webb’s Depths of Knowledge levels as follows: 2013-14 at 50% levels 1/2 and 50% levels 3/4 2014-15 at 40% levels 1/2 and 60% levels 3/4
Strategies Timeline Fiscal Impact and Funding Source Person(s) Responsible
Progress Monitoring 2012-13 2013-14 2014-15
4. Integrate effective and research-based digital tools and resources to support rigorous writing tasks and student engagement.
Science and social studies teachers will receive 3-hours of professional learning on the Discovery Learning tool.
Science and social studies teachers will receive 3-hours of professional learning on digital tools to support the information/research process.
November 6, 2012 (morning/ afternoon)
NA NA NA Program Coordinators for ELA, Sci, SS, and Media/Technology; MS Principals
EZ Traxx Attendance Lists and Evaluations
ELA teachers will receive 3-hours of professional learning on digital tools to support the information/research process.
November 6 or 12, 2012 (TBD)
NA TBD TBD ELA & Media/Tech. Coordinators
EZ Traxx Attendance Lists and Evaluations
Science and Social Studies teachers will receive professional learning on Tech. Integration Tools to improve the quality of writing instruction (3 hrs.).
April 10, 2013
NA
TBD TBD CIPL; ELA, Sci, SS, Media/ Tech. Coordinators
EZ Traxx Attendance Lists and Evaluations
5. Increase collaboration time between media specialists and content-area teachers in order to integrate research and informational fluency skills.
The district will increase the amount of collaboration time that media staff can work in classrooms to integrate technology into lessons in science and social studies classrooms.
2012-15 NA TBD Staffing Per Tech Plan $600 (131)
TBD Staffing Per Tech Plan $600 (131)
Media/Tech. Coordinator and MS Principals
Integration Specialist Evaluation Monthly Library Media Center Report
Page 18

Diagnostic Memorandum Reading
Goal: The percentage of Grade 3 students at Goal/Mastery in CMT Reading will be 83% by
2015. (Adopted by BOE, June 2012)
Problem:
The centerpiece of the Common Core standards is reading in the primary grades. Students “learn to read so they can read to learn.” The Smarter Balanced Assessment Consortium test to be administered in the spring of 2015 will place strong emphasis on critical reading skills.
Literacy skills are established during the primary grades and become the foundation for continuing success in school (National Reading Panel 2000).
For the five years through 2011, the trend in the percentage of Greenwich third graders achieving at goal or higher in CMT reading has been flat and lagged comparable districts in 2011:
(Continued on next page)
0%
10%
20%
30%
40%
50%
60%
70%
80%
90%
100%
2007 2008 2009 2010 2011
Greenwich Public SchoolsCMT Reading at Goal
Grades 3 2008 - 2012All Students
GreenwichDRG ADRG B
Page 19

Diagnostic Memorandum Reading
Problem (cont):
However, growth in achievement of Greenwich students from third grade to eighth grade is equal to growth in the highest performing districts:
In order to close the gap between Greenwich students and students in similar districts, it is necessary to raise achievement levels by the end of third grade by focusing on reading instruction in the primary grades (K – 3) and sustain that improvement in achievement through eighth grade.
Update Based on 2012 Results
The percentage of third grade students scoring at goal or above in reading increased from 72.0% in 2011 to 78.8% in 2012 as compared to 77.2% in the DRG B districts and 84.1% in the DRG A districts.
455
566
451
562
448
429
538
447
556
400
420
440
460
480
500
520
540
560
580
600
Gr 3 2007 Gr 4 2008 Gr 5 2009 Gr 6 2010 Gr 7 2011 Gr 8 2012
CMT ReadingVertical Scale Score Growth
Gr 3 2007 to Gr 8 2012
DRG ASW CONNDRG BStateGreenwich
Page 20

Diagnostic Memorandum Reading
Causes Solutions Strategies* Cause #1: Data teams need more support on how to effectively utilize data to differentiate/ focus instruction (whole group, small group, interventions).
Data: Analysis and evaluation team from the analysis of student intervention plans (available in RtI Studio) Formal and informal administrator observations Common Core Foundational Skills Expectations (http://www.corestandards.org/the‐standards/english‐language‐arts‐standards/reading‐foundational‐skills/introduction/)
What: Educate and support teachers (Instructional Data Teams) in the effective use and monitoring of data to differentiate/focus instruction for students. Who: Program Coordinators for LA, Media/Technology, ELL, Special Ed; Elementary Principals, Literacy Specialists/Coaches, District Coaches and Teachers How Implemented: Professional learning and TEPL Evaluation System Result Measurement: In the spring of 2013, 80% of Greenwich Public School Elementary Instructional Data Teams (IDT) will meet Standard expectations on the Documenting Student Achievement Issue portion of GPS’ IDT Rubric (2014= 85%; 2015= 95%).
1. Provide professional learning to enhance assessment practices (administration, analysis and interpretation of multiple data sources; school-based, 2012-14)
2. Provide targeted professional learning on the use of running records to adjust instruction for students (2012-14).
3. Instructional Data Teams will collaborate to plan small group instruction and the development of intervention plans for students utilizing multiple sources of data (school-based, 2012-14).
4. Require teachers to identify the area of reading concern(s) in RtI Studio (comprehension, accuracy, fluency) based on the Fountas and Pinnell Benchmark Assessment (winter 2012-13).
5. Explore, identify and implement additional technology tools to collect and analyze student data.
Page 21

Diagnostic Memorandum Reading
Causes Solutions Strategies* Cause #2: Small group instruction is not consistent across the district (as determined by GPS Comprehensive Literacy Performance Standards). Data: Formal and Informal Administrator Observations, Comprehensive Literacy Benchmark Assessment Data, Spring 2012 Grade-level
F&P Benchmark data indicate:
-13% of our kindergarten students (97) do not meet the district’s benchmark target
-28% of our first grade students do not meet the district’s benchmark target
-30% of our second grade students do not meet the district’s benchmark target
-29% of our third grade students do not meet the district’s benchmark target
-33% of our fourth grade students do not meet the district’s benchmark target
-43% of our fifth grade students do not meet the district’s benchmark targets
GPS Implementation Performance Targets for Small Group Instruction- See Attached
What: Improve/enhance capacity of K-3 teachers to deliver small group instruction with fidelity. Who: Program Coordinators for LA, Media/Technology, ELL, Special Ed; Elementary Principals, Literacy Specialists/Coaches, District Coaches and Teachers How Implemented: Professional learning and focused instruction Result Measure: The percentage of K-3 teachers who meet the GPS Performance Standards for Small Group Instruction will be 80% by 2013, 90% by 2014 and 95% by 2015.
1. Provide professional learning on implementing Small Group Instruction with fidelity (guided reading and strategy groups, 2012-13).
2. Literacy Coaches will provide professional learning via in-class coaching to teachers who require support (2012-13).
3. Students will receive targeted small group instruction (2012-15).
4. Integrate technology and appropriate tools in small group instruction and learning centers (including digital and technology tools) (2012-14).
Page 22

Diagnostic Memorandum Reading
Cause #3: Current GPS Word Study program (Hampton Brown) may not consistently support students’ development of an automatic use of phonics, spelling and word recognition skills, by the end of Grade 2. Data: Comprehensive Literacy Benchmark Data- See Above (Cause #2) and Attached Analysis of GPS Kindergarten Task Data – See Attached Kindergarten: By the end of Kindergarten, 100% of students have mastered “beginning and “ending” sounds; By February of Kindergarten, 95% of students can identify lowercase letters; 97% can identify uppercase letters; By the end of Kindergarten, 100% of students can identify ending sounds
Grade One: Results for students meeting “goal” on the grade one Nonsense Word Assessment will increase yearly by 2 percentage points (2012 baseline= 82%, 2013= 84%, 2014= 86%; 2015= 88%); Results for students meeting goal on the grade one Fluency Assessment will increase yearly by 5 percentage points (2012 baseline= 62%, 2013= 68%, 2014= 73%, 2015= 78%). Grade Two: Results for students meeting goal on the grade two Nonsense Word Assessment will increase yearly by 5 percentage points (2012 baseline= 67%, 2013= 72%, 2014= 77%, 2015= 82%). Results for students meeting goal on the grade two Fluency Assessment will increase yearly by 5 percentage points (2012 baseline= 56%, 2013= 61%, 2014= 66%, 2015= 71%).
Common Core Foundational Skills Expectations (http://www.corestandards.org/the‐standards/english‐language‐arts‐standards/reading‐foundational‐skills/introduction/)
What: Review Greenwich Public Schools’ word study program to determine effectiveness. Do students read fluently by the end of second grade so the focus shifts from “learning to read” to “reading to learn”? Who: Program Coordinators for LA, Media/Technology, ELL, Special Ed; Elementary Principals, Literacy Specialists/Coaches, District Coaches and Teachers How implemented: Review of GPS core K-2 Word Study program and early reading intervention programs Result Measure: Program recommendations will be made based on: 1. Results identified in the
Program Review for alignment between our current word study program (Hampton Brown) and the Common Core State Standards.
2. An analysis of pre-post test Fluency and Nonsense Word Assessment data to compare growth between a sample of Words Their Way pilot and non-pilot classrooms.
1. Review and calibrate existing phonics, spelling and word recognition student assessment data; create/collect additional pre/post assessments if needed (2012-13).
2. Review Hampton Brown curriculum for alignment and to increase rigor (winter 2012-13).
3. Continue to provide Academy of Orton-Gillingham training to cohorts of teachers and specialists (2012-15).
4. Continue to pilot/purchase Words Their Way word study materials and research/monitor the impact on student learning (2012-13).
5. Research feasibility of reinstituting a Reading Recovery program in Greenwich through the I3-Scaling Up Federal grant (Summer 2012); train and/or hire Reading Recovery specialists based on available funds.
6. Schools will provide structures for consistent Instructional Data Teams (with literacy specialist support) to analyze phonics, spelling and word recognition student assessment data (2012-13).
7. Integrate technology and appropriate tools in phonics, spelling and word recognition instruction (2012-14).
Page 23

Diagnostic Memorandum Reading
Causes Solutions Strategies* Cause #4: Current preschool and Kindergarten curricula may not consistently prepare Kindergarten students to know enough letter names and sounds by the end of October to access phonics skills. Benchmark targets for letter name and sounds assessments may not be rigorous enough. Data: GPS Comprehensive Literacy Benchmark Data-See Above (Cause #2) and Attached Analysis and evaluation team from the analysis of student intervention plans (available in RtI Studio) Common Core Foundational Skills Expectations (http://www.corestandards.org/the‐standards/english‐language‐arts‐standards/reading‐foundational‐skills/introduction/)
What: Screen Kindergarten students before October 1st to differentiate instruction or to provide interventions for students whom require additional instruction. Additionally, revised benchmark targets will support more rigorous instruction for all learners. Who: Program Coordinators for LA, Media/Technology, ELL, Special Ed; Elementary Principals, Literacy Specialists/Coaches, District Coaches and Teachers How implemented: Review current assessment data, provide professional learning and research additional early intervention programs Results Measure: October 1st Letter Name and Beginning Sound Assessment baseline data will be collected and entered into RtI Studio by October 15, 2012; growth targets will be set. Students are not consistently meeting district benchmark targets, after differentiated instruction, will be placed on intervention plans accordingly (see RtI Studio).
1. Review and revise the benchmark targets for letter name and sound assessments (Fall 2012).
2. Every child is administered the letter name and sound assessment before October 1st and the data is entered into RtI Studio (fall 2012).
3. Review Hampton Brown Kindergarten curriculum for alignment and to increase rigor (winter, 2012-13).
4. Designate consistent Instructional Data Team meetings (with literacy specialist support) to collaboratively analyze Letter Name and Sound Assessment data (school-based, 2012-13).
5. Continue to provide Academy of Orton-Gillingham training to cohorts of teachers and specialists (2012-15).
6. Pilot Words their Way in particular Kindergarten and grade 3 sections; collect spring 2013 developmental spelling data.
7. Integrate technology and appropriate tools in letter name and sound instruction (2012-14).
8. Provide professional learning for Kindergarten teachers in the area of Emergent Reading (E. Sulzby)
Page 24

Diagnostic Memorandum Reading
Causes Solutions Strategies* Cause #5: Some pre-school students may not receive sufficient instructional support that is aligned to academic standards within Connecticut’s Pre-school Frameworks. Data: Comprehensive Literacy Benchmark Data; Kindergarten Tasks and Fountas & Pinnell Benchmark Assessments- See Above (Causes #2 and #3) and Attached CT PreK Standards to CCSS http://www.sde.ct.gov/sde/lib/sde/pdf/ccss/prek_ela_crosswalk.pdf
What: Strengthen the partnership between local pre-schools and the Greenwich Public Schools to support implementation of Connecticut Pre-School Frameworks. Who: Director of Pupil Personnel Services, Program Coordinators for Pre-School, Rdg/LA, Media/Technology, ELL, Director of Special Education, Special Ed; Elementary Principals, Literacy Specialists/Coaches, District Coaches and Teachers. How implemented: Coordinate and align preschool and Kindergarten expectations, provide professional learning. Results Measure: Student performance on October GPS Kindergarten Screening Assessments/Tasks (Baseline to be collected: 10/2012).
1. Conduct a mini-research study to determine potential risk factors for pre-school age learners that may contribute to poor performance on the 3rd grade CMT4 (Basic and Below Basic Achievement Levels).
2. Continue and expand the collaborative relationship between public and private preschools (curriculum resources, professional development, 2013-15).
3. Determine if we need additional early literacy assessments (fall 2012).
4. Create a GPS Summer “Transition Program” for students identified early with potential support needs or who have no pre-school experience.
*Each strategy has a detailed action plan that includes specific timelines; costs; person(s) responsible.
Page 25

Greenwich Public Schools, BOE Grade Three Reading Goal Action Plan 2012‐13
Goal: The percentage of Grade 3 students at Goal/Mastery in CMT Reading will be 83% by 2015.
Cause #1: Data teams need more support on how to effectively utilize data to differentiate/ focus instruction (whole group, small group, interventions).
Solution #1: Educate and support teachers (Instructional Data Teams) in the effective use and monitoring of data to differentiate/ focus instruction for students.
Result Measure: In the spring of 2013, 80% of Greenwich Public School Elementary Instructional Data Teams (IDT) will meet Standard expectations on the Documenting the Student Achievement Issue portion of GPS’ IDT Rubric (2014= 85%; 2015= 95%).
Strategies Timeline Fiscal Impact and Funding Source Person(s) Responsible
Progress‐Monitoring
2012‐13 2013‐14 2014‐15 Provide professional learning to enhance assessment practices (administration, analysis and interpretation of multiple data sources; school‐based)
Elementary School Data Teams (SDTs) will collect baseline data to measure implementation of Standards identified on the Documenting the Student Achievement Issue portion of GPS’ Instructional Data Team Rubric. Aggregated data will be shared with the Greenwich District Data Team (GDDT).
fall 2012 NA NA NA SDTs, GDDT Team SDT Data Collection Sheet for the Documenting the Student Achievement Issue portion of GPS’ IDT Rubric
Professional learning on the analysis of multiple data sources
fall 2012‐13 Leadership Mtgs./
NA NA NA District trained “Data‐Wise” group, Sped/RtI Coaches,
EZ Traxx Attendance List and Evaluations
Page 26

to focus instruction will be provided for administrators.
Monday Principal Meeting (date TBD)
Special Projects Manager, CIPL, Deputy Supt., ELA & Math Coordinators
Professional learning will be provided for teachers to support the analysis of multiple data sources to focus instruction and the data team process.
2012‐13 Faculty/ School Improvement Plan meetings
$2,000 149‐ 1 day (Haskins/ Literacy How)
$4,000149‐ 2 days
TBD Elementary Principals, ELA Coordinator, RTI/Sped Coaches, Literacy Department
EZ Traxx Attendance List and Evaluations
Provide targeted professional learning on the use of running records to adjust instruction for students.
Professional learning to support administration and analysis of running records and Fountas & Pinnell Benchmark Assessment System (F&P) will be provided for all teachers (basic training was provided in 2010‐11 to all K‐5 teachers).
2012‐13 PL full & ½ days (reference 2012‐13 ELA PL Calendar for specifics)
$4,500149 5*$900 (½ day rate)
$8,000149 Approx.
TBD ELA Coordinator, CIPL, Elementary Principals, classroom teachers
EZ Traxx Attendance List and Evaluations
Elementary Instructional Data Teams (IDTs) will double‐score a sample of F&P assessments to calibrate expectations.
winter 2013, 2014
$3,300Sub Line 3 days ($100)*11
$2,200Sub Line 2days ($100)*11
TBD Elementary Principals, Teachers, Literacy Department, IDTs
Results from the sample will have 90% Inter‐rater reliability
Instructional Data Teams (IDTs) will collaborate to plan small group instruction and the development of intervention plans for students utilizing multiple sources of data (school‐based).
IDTs will focus their work on the collaborative analysis of data to inform instruction and develop intervention plans (as needed).
2012‐15
NA NA NA Elementary
Principals, IDTs Artifacts: small group planning sheets and meeting agendas
Page 27

Professional learning will be provided to support the Instructional Data Team process
2012‐14 $15,000149 M. Wasta 10 days * $1,500 (3 schools/day)
$15,000149 M. Wasta 10 days * $1,500 (3 schools/day)
TBD CIPL, Elementary Principals, IDTs
EZ Traxx Attendance List and Evaluation
Require teachers to identify the area of reading concern(s) in RtI Studio (comprehension, accuracy, fluency) based on the Fountas and Pinnell Benchmark Assessment (F&P).
During the RtI Studio “data entry” process, teachers will identify the area of reading (comprehension, accuracy, fluency) that prohibited the student from attainment of the benchmark target.
winter 2012 NA NA NA Director of Technology, ELA Coordinator, Special Project Manager, classroom teachers
Data is entered into RtI Studio
Explore, identify and implement additional technology tools to collect and analyze student data.
The district will continue to explore alternate technologies and methods for collecting and analyzing student data (e.g. iPad, apps, Google Forms, Clickers, Socrative, online benchmark assessments).
2012‐15 NA Per Tech Plan (devices/ laptops, apps, subscription to online assessments)
Per Tech Plan (devices/ laptops, apps, subscription to online assessments)
Dir. of Technology, Coordinator Media /Technology, Special Project Manager
Technology Action Plan‐ e.g. platforms for data collection and/or progress monitoring
Page 28

Cause #2: Small group instruction is not consistent across the district (as determined by GPS Comprehensive Literacy Performance Standards).
Solution #2: Improve/enhance capacity of K‐3 teachers to deliver small group instruction with fidelity.
Result Measure: The percentage of K‐3 teachers who meet the Greenwich Public School Performance Standards for Small Group Instruction will be 80% by 2013, 90% by 2014 and 95% by 2015.
Strategies Timeline Fiscal Impact and Funding Source Person(s) Responsible
Progress Monitoring 2012‐13 2013‐14 2014‐15
Provide professional learning on implementing Small Group Instruction with fidelity (guided reading and strategy groups).
Professional learning to support small group instruction‐ guided reading & strategy groups (comprehension & fluency/accuracy)‐ will be provided for K‐2 teachers.
2012‐13 PL full & ½ days (reference 2012‐13 ELA PL Calendar for specifics)
$1,800 (full day) 2 full‐days; 5 ½ days
$1,900 (full day) 2 full‐days; 5 ½ days
TBD ELA Coordinator, CIPL, Elementary Principals
EZ Traxx Attendance List and Evaluations
Literacy Coaches will provide professional learning via in‐class coaching to teachers who require support.
Coaches will conduct coaching cycles to support Greenwich Public School Performance Standards for Small Group Instruction
2012‐2013 NA NA NA ELA Coordinator and Literacy Coaches
Pre‐post Google Form Coaching Cycle Inventories based on the “Indicators for Success” documents
The CIPL Assistant Superintendent, the Math and the ELA Coordinator will provide support for coaches to implement coaching cycles focused on the transfer of performance standards for small
fall/winter 2012‐13
NA NA NA ELA and Math Coordinator
Agendas/minutes from alternate Friday coaching meetings
Page 29

Cause #2: Small group instruction is not consistent across the district (as determined by GPS Comprehensive Literacy Performance Standards).
Solution #2: Improve/enhance capacity of K‐3 teachers to deliver small group instruction with fidelity.
Result Measure: The percentage of K‐3 teachers who meet the Greenwich Public School Performance Standards for Small Group Instruction will be 80% by 2013, 90% by 2014 and 95% by 2015.
Strategies Timeline Fiscal Impact and Funding Source Person(s) Responsible
Progress Monitoring 2012‐13 2013‐14 2014‐15
group instruction (guided reading & strategy groups).
Students will receive targeted small group instruction.
Administrators will utilize GPS Performance Standard for Small Group Instruction to support implementation of guided reading and strategy groups.
2012‐13 NA NA NA Elementary Principals, classroom teachers
CIPL and Learning Walks, informal and formal observational feedback
Teachers will analyze student work, benchmark assessments and conferring notes to plan and implement small group instruction for all learners.
2012‐15 NA NA NA Elementary Principals
Small group planning sheets, conferring systems and IDT meeting agendas
Integrate technology and appropriate tools in small group instruction and learning centers (including digital and technology tools).
Media/Technology Coordinator will work with literacy specialists and coaches to identify and purchase appropriate applications and/or tools to support literacy instruction and learning centers.
2013‐15 $1,200 – for pilot only
$ Per Technology Plan – 5 devices/ laptops per classroom & supporting apps
$ Per Technology Plan – 5 devices/ laptops per classroom & supporting apps
Media/Technology and ELA Coordinator
List of GPS approved media/technology digital tools, resources and apps.
Page 30

Cause #2: Small group instruction is not consistent across the district (as determined by GPS Comprehensive Literacy Performance Standards).
Solution #2: Improve/enhance capacity of K‐3 teachers to deliver small group instruction with fidelity.
Result Measure: The percentage of K‐3 teachers who meet the Greenwich Public School Performance Standards for Small Group Instruction will be 80% by 2013, 90% by 2014 and 95% by 2015.
Strategies Timeline Fiscal Impact and Funding Source Person(s) Responsible
Progress Monitoring 2012‐13 2013‐14 2014‐15
Research and purchased proven intervention‐based technology tools to provide immediate feedback (accelerated learning programs).
2012‐14 Pilot 3 Classrooms @ NL: $6,000 ($25 apps./ student); $7,500 (15 devices)
Digital Learning Centers in K‐2 per Tech Plan (Devices = $34, 000/ lease and $25/device for apps
Digital Learning Centers in K‐2 per Tech Plan ($34, 000/ lease and $50/device for apps
CIPL, Media/Technology and ELA Coordinators
List of GPS approved media/technology digital tools, resources and apps.
Page 31

Cause #3: The current GPS Word Study program (Hampton Brown) may not consistently support students’ development of an automatic use of phonics, spelling and word recognition skills, by the end of Grade 2. Solution #3: Review Greenwich Public Schools’ word study program to determine effectiveness. Do students read fluently by the end of second grade so that the focus shifts from “learning to read” to “reading to learn”?
Result Measure: Program recommendations will be made based on: 1. Results identified in the Program Review for alignment between our current
word study program (Hampton Brown) and the Common Core State Standards.
2. An analysis of pre‐post test Fluency and Nonsense Word Assessment data to compare growth between a sample of Words Their Way pilot and non‐pilot classrooms.
Strategies Timeline Fiscal Impact and Funding Source Person(s) Responsible
Progress‐monitor 2012‐13 2013‐14 2014‐15
Review and calibrate existing phonics, spelling and word recognition student assessment data; create/collect additional pre/post assessments if needed.
The literacy department will review the full scope of literacy assessments to determine if appropriate data is currently being collected to monitor student learning process in the areas of phonics, spelling and word recognition skills.
fall‐ October 2012 (department meeting)
NA NA NA ELA Coordinator
Post‐review conclusions on the status of GPS word study assessments (strengths/ gaps)
Based on the conclusions from the review, the literacy department may identify/ purchase additional assessment resources as needed.
winter/spring 2012
TBD TBD TBD ELA Coordinator
Resources identified address the gaps identified in the conclusions of the Review.
The literacy department and district leadership will review available assessment data to determine the effectiveness of the Hampton Brown
winter 2012
‐Collect Developmental
NA NA NA ELA Coordinator
Results from the data review
Page 32

Cause #3: The current GPS Word Study program (Hampton Brown) may not consistently support students’ development of an automatic use of phonics, spelling and word recognition skills, by the end of Grade 2. Solution #3: Review Greenwich Public Schools’ word study program to determine effectiveness. Do students read fluently by the end of second grade so that the focus shifts from “learning to read” to “reading to learn”?
Result Measure: Program recommendations will be made based on: 1. Results identified in the Program Review for alignment between our current
word study program (Hampton Brown) and the Common Core State Standards.
2. An analysis of pre‐post test Fluency and Nonsense Word Assessment data to compare growth between a sample of Words Their Way pilot and non‐pilot classrooms.
Strategies Timeline Fiscal Impact and Funding Source Person(s) Responsible
Progress‐monitor 2012‐13 2013‐14 2014‐15
portion of GPS’ word study program; additional assessments may be collected as needed
Spelling Assessment data in RtI Studio (spring 2013) ‐Sight Word Assessments (TBD)
Review Hampton Brown curriculum for alignment to Common Core State Standards and to increase rigor.
A small committee will be formed to conduct a mini‐review of the Hampton Brown curriculum materials to determine alignment to new CCSS expectations.
fall/winter 2012 NA NA NA ELA Coordinator
Formed committee and meeting minutes
Continue to provide Academy of Orton‐Gillingham training to cohorts of teachers and specialists.
The district will train a 3rd cohort of teachers in the Orton‐Gillingham methodology
(Classroom Teacher: Gr. 1‐2).
2012‐15 $7,500Subs (25 staff) 3 days
TBD TBD ELA & Sped Coordinator
Roster of GPS’ Academy of Orton‐Gillingham – Cohort #3
Page 33

Cause #3: The current GPS Word Study program (Hampton Brown) may not consistently support students’ development of an automatic use of phonics, spelling and word recognition skills, by the end of Grade 2. Solution #3: Review Greenwich Public Schools’ word study program to determine effectiveness. Do students read fluently by the end of second grade so that the focus shifts from “learning to read” to “reading to learn”?
Result Measure: Program recommendations will be made based on: 1. Results identified in the Program Review for alignment between our current
word study program (Hampton Brown) and the Common Core State Standards.
2. An analysis of pre‐post test Fluency and Nonsense Word Assessment data to compare growth between a sample of Words Their Way pilot and non‐pilot classrooms.
Strategies Timeline Fiscal Impact and Funding Source Person(s) Responsible
Progress‐monitor 2012‐13 2013‐14 2014‐15
$5,000Materials
Continue to pilot/purchase Words Their Way word study materials and research/monitor the impact on student learning.
The district will expand pilot implementation of Words Their Way and continue professional learning to support this research‐ based instruction.
2012‐15 $12,000 ‐310 $3,600 ‐149
TBD‐ based on conclusions: $12,000
TBD ELA Coordinator
Pilot Implementation Documents (by school/by classroom) Developmental Stage Assessment (2014)
Research feasibility of reinstituting a Reading Recovery program in Greenwich through the I3 –Scaling Up Federal Grant (Summer 2012); train and/or hire reading recovery specialists based on available funds.
Contact Mary Anne Doyle at UConn’s NEAG School to determine 3‐year costs for re‐instating a Reading Recovery program in Greenwich Public Schools through the i3‐Scaling Up Grant.
fall NA NA NA ELA Coordinator
Artifacts: research and communication with UConn‐ Mary Anne Doyle
Based on availability of the i3‐Scaling Up Grant and supplemental district funds, we will begin training staff.
spring/ summer 2013
Year 1: $19,500
Year 2: $4,500 approx.
TBD ELA Coordinator
EZTraxx
Page 34

Cause #3: The current GPS Word Study program (Hampton Brown) may not consistently support students’ development of an automatic use of phonics, spelling and word recognition skills, by the end of Grade 2. Solution #3: Review Greenwich Public Schools’ word study program to determine effectiveness. Do students read fluently by the end of second grade so that the focus shifts from “learning to read” to “reading to learn”?
Result Measure: Program recommendations will be made based on: 1. Results identified in the Program Review for alignment between our current
word study program (Hampton Brown) and the Common Core State Standards.
2. An analysis of pre‐post test Fluency and Nonsense Word Assessment data to compare growth between a sample of Words Their Way pilot and non‐pilot classrooms.
Strategies Timeline Fiscal Impact and Funding Source Person(s) Responsible
Progress‐monitor 2012‐13 2013‐14 2014‐15
approx. $6,500/ teacher *3
$1,500/ teacher*3
Schools will provide structures for consistent Instructional Data Team (IDT) meetings (with literacy specialist support) to analyze phonics, spelling and word recognition student assessment data.
Literacy specialists will meet with IDT teams to analyze multiple data sources (phonics, spelling and word recognition) to inform instruction.
2012‐15 NA NA NA Elementary Principals
IDT Minutes
Integrate technology and appropriate tools in phonics, spelling and word recognition instruction.
Identified classrooms will begin to integrate literacy centers utilizing a range of technology tools and applications to support phonics, spelling and word recognition instruction.
2012‐15 Pilot 3 Classrooms @ NL: $6,000 ($25 apps./ student); $7,500 (15 devices)
Same as above – per Tech Plan – 5 devices/ laptops per classroom & supporting apps
Same as above – per Tech Plan – 5 devices/ laptops per classroom & supporting apps
ELA and Media/ Technology Coordinators
List of approved apps and hardware
Page 35
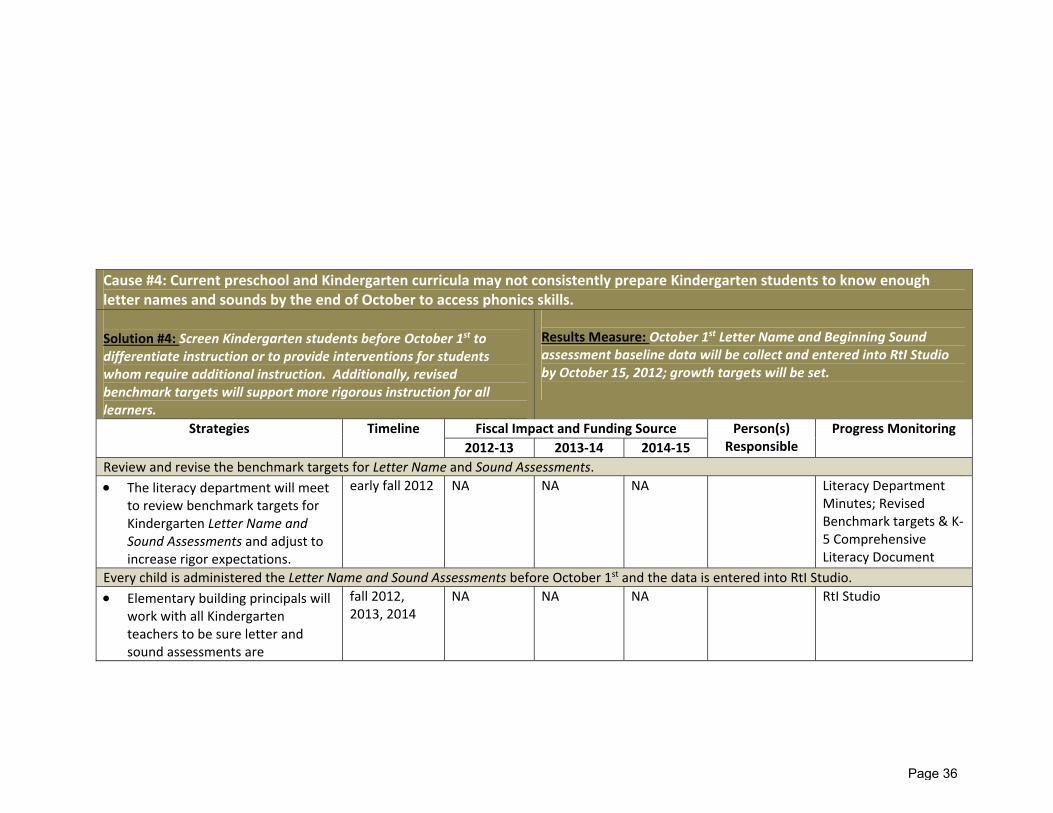
Cause #4: Current preschool and Kindergarten curricula may not consistently prepare Kindergarten students to know enough letter names and sounds by the end of October to access phonics skills. Solution #4: Screen Kindergarten students before October 1st to differentiate instruction or to provide interventions for students whom require additional instruction. Additionally, revised benchmark targets will support more rigorous instruction for all learners.
Results Measure: October 1st Letter Name and Beginning Sound assessment baseline data will be collect and entered into RtI Studio by October 15, 2012; growth targets will be set.
Strategies Timeline Fiscal Impact and Funding Source Person(s) Responsible
Progress Monitoring2012‐13 2013‐14 2014‐15
Review and revise the benchmark targets for Letter Name and Sound Assessments. The literacy department will meet
to review benchmark targets for Kindergarten Letter Name and Sound Assessments and adjust to increase rigor expectations.
early fall 2012 NA NA NA Literacy Department Minutes; Revised Benchmark targets & K‐5 Comprehensive Literacy Document
Every child is administered the Letter Name and Sound Assessments before October 1st and the data is entered into RtI Studio. Elementary building principals will
work with all Kindergarten teachers to be sure letter and sound assessments are
fall 2012, 2013, 2014
NA NA NA RtI Studio
Page 36

Cause #4: Current preschool and Kindergarten curricula may not consistently prepare Kindergarten students to know enough letter names and sounds by the end of October to access phonics skills. Solution #4: Screen Kindergarten students before October 1st to differentiate instruction or to provide interventions for students whom require additional instruction. Additionally, revised benchmark targets will support more rigorous instruction for all learners.
Results Measure: October 1st Letter Name and Beginning Sound assessment baseline data will be collect and entered into RtI Studio by October 15, 2012; growth targets will be set.
Strategies Timeline Fiscal Impact and Funding Source Person(s) Responsible
Progress Monitoring2012‐13 2013‐14 2014‐15
administered to all students by October 1st.
Review Hampton Brown Kindergarten curriculum for alignment and to increase rigor.
A small committee will be formed to review Hampton Brown Kindergarten program materials to determine alignment to new Common Core State Standard expectations.
fall 2012 NA NA NA Committee Meetings Agendas
Designate Instructional Data Team meetings (with literacy specialist support) to collaboratively analyze Letter Name and Sound Assessment data (school‐based)
Kindergarten Instructional Data Teams (IDTs) will collaborate with literacy specialists to analyze Kindergarten screening data to determine focus for instruction/ intervention.
Fall 2012, 2013, 2014
NA NA NA IDT Minutes
Continue to provide Academy of Orton‐Gillingham training to cohorts of teachers and specialists.
The district will train a 3rd cohort of teachers in the Orton‐
2012‐15 $7,500 Subs. (25 staff) $5,000
$7,500 Subs. (25 staff) $5,000
TBD ELA & Sped Coordinator
EZ Traxx Attendance List and Evaluations
Page 37

Cause #4: Current preschool and Kindergarten curricula may not consistently prepare Kindergarten students to know enough letter names and sounds by the end of October to access phonics skills. Solution #4: Screen Kindergarten students before October 1st to differentiate instruction or to provide interventions for students whom require additional instruction. Additionally, revised benchmark targets will support more rigorous instruction for all learners.
Results Measure: October 1st Letter Name and Beginning Sound assessment baseline data will be collect and entered into RtI Studio by October 15, 2012; growth targets will be set.
Strategies Timeline Fiscal Impact and Funding Source Person(s) Responsible
Progress Monitoring2012‐13 2013‐14 2014‐15
Gillingham methodology (Classroom Teacher: Gr. 1‐2).
310 310
Pilot Words their Way in particular Kindergarten and grade 3 sections; collect spring 2013 developmental spelling data.
Pilot classrooms will continue to implement Words Their Way
2012‐13 $18,000310
$15,000310 (approx)
TBD ELA Coordinator
Developmental Spelling Assessment Data
Integrate technology and appropriate tools in letter name and sound instruction.
Identified classrooms will begin to integrate literacy centers utilizing a range of technology tools and applications to support letter name and sound instruction.
2012‐15 NA Same as above – per Tech Plan – 5 devices/ laptops per classroom & supporting apps
Same as above – per Tech Plan – 5 devices/ laptops per classroom & supporting apps
Media/ Technology and ELA Coordinators
List of digital resources and tools
Provide professional learning for Kindergarten teachers in the area of Emergent Reading (E. Sulzby).
Kindergarten teachers will have the opportunity to participate in a 3‐hour workshop on Emergent Reading.
Fall (10/24/12) & Spring (5/15/13)
$1,800149 2 ½ days $900*2
TBD NA ELA Coordinator
EZ Traxx Attendance List and Evaluations
Page 38

Cause #5: Some pre‐school students may not receive sufficient instructional support that is aligned to academic standards within Connecticut’s Performance Assessment Framework. Solution #5: Strengthen the partnership between local preschools and the Greenwich Public Schools to support implementation of Connecticut’s Pre‐School Frameworks.
Results Measure: Student performance on October GPS Kindergarten Screening Assessments/Tasks (Baseline data to be collected: 10/2012)
Strategies Timeline Fiscal Impact and Funding Source Person(s) Responsible
Progress Monitoring2012‐13 2013‐14 2014‐15
Conduct a mini‐research study to determine potential risk factors for pre‐school age learners that may contribute to poor performance on the 3rd grade CMT4 (Basic and Below Basic Achievement Levels).
District administrators will conduct a post‐hoc, mini‐research study to analyze the 2012 CMT4 data (Below Basic and Basic Achievement levels) to determine potential risk factors (e.g. no pre‐K experience, free/reduced lunch, ELL) for students who attended pre‐school in 2007‐2008.
fall 2012 NA NA NA Special Project Manager, Director of Pupil Services, ELA Coordinator
Conclusions of mini‐research study (identified risk factors)
Continue and expand the collaborative relationship between public and private preschools (via curriculum sharing & professional development).
District administrators will work with local pre‐school Directors to provide professional learning to a group of “teacher leaders” to Turn Key to additional staff members (e.g. Literacy How, emergent reading, oral language).
spring 2013 $3,600149
$3,600149
NA PreK Coordinator, ELA Coordinator
EZ Traxx Attendance List and Evaluations
Determine if we need additional early literacy assessments
The ELA department will review early literacy assessments to determine if additional assessments are required to monitor student progress.
winter 2012 NA NA NA ELA Coordinator Additional assessments as needed
Page 39

Cause #5: Some pre‐school students may not receive sufficient instructional support that is aligned to academic standards within Connecticut’s Performance Assessment Framework. Solution #5: Strengthen the partnership between local preschools and the Greenwich Public Schools to support implementation of Connecticut’s Pre‐School Frameworks.
Results Measure: Student performance on October GPS Kindergarten Screening Assessments/Tasks (Baseline data to be collected: 10/2012)
Strategies Timeline Fiscal Impact and Funding Source Person(s) Responsible
Progress Monitoring2012‐13 2013‐14 2014‐15
Create a Greenwich Public School Summer “Kindergarten Transition Program” for students identified early with potential support needs or for students with no pre‐school experience.
Conduct a mini‐screening on pre‐school students to identify a pool of students for which we can provide additional summer support prior to their Kindergarten year.
spring 2013 NA $7,000(2 days *$100*35 K sections)
NA Summer School Coordinator, Deputy Supt., Elementary Principals
List of students who would benefit from early support.
Offer a Kindergarten Transition Program for students with no pre‐school experience or for students whose mini‐screening results indicate a need for early support.
summer 2013
NA $12,000 ‐2 teachers $15,000 ‐6 para‐professionals
TBD GPS Summer School enrollment
Page 40

Diagnostic Memorandum
Math
1 11/2/12 bmb
Goal:
The percentage of 8th grade students successfully passing Algebra I will be 75% by 2015 to
be measured by standardized test and GPS district math test (BOE adopted June 2012).
Problem:
• The Common Core mathematics standards build upon fundamentals acquired in the elementary
grades to focus on geometry, algebra, probability and statistics in middle school. The high school
standards require students to apply mathematical ways of thinking to real-world issues and
challenges and emphasize the use of mathematical modeling.
• Successful completion of Algebra I by the end of eighth grade is a prerequisite for accessing
the advanced mathematics program at Greenwich High School.
• The percentage of Greenwich students enrolled in Algebra I or Geometry at the beginning of
eighth grade is higher than the DRG B average and lower than the DRG A average:
0
10
20
30
40
50
60
70
80
90
100
2006-2007 2007-2008 2008-2009 2009-2010 2010-2011
Greenwich Public Schools% Students Enrolled in Algebra I or Higher by October 1st
Grades 8 2007 - 2011
Greenwich
DRG A
DRG B
Problem (con’t):
Page 41

Diagnostic Memorandum
Math
11/2/12 bmb
Problem (con’t):
• In 2010-2011, only two of the twenty-seven districts in DRG A and DRG B exceeded 75% of students enrolled in Algebra I or Geometry at the beginning of eighth grade - Westport at 81.0% and Granby at 83.8%. Two other districts, Easton and Farmington, exceeded 70%.
• Scoring at the advanced level on the fifth grade mathematics CMT has been strongly correlated with successful completion of Algebra I by the end of eighth grade. In 2012, 55% of fifth graders scored at the advanced level on CMT mathematics. 56% of the students entering sixth grade in 2012-2013 are placed in a course sequence that would lead to the successful completion of Algebra I. This is the cohort of students who will be eighth graders in 2015.
40%44%
49%55% 53% 52% 53%
48% 49%53%
57%
0%
10%
20%
30%
40%
50%
60%
70%
80%
90%
100%
2009 2010 2011 2012 2013 2014 2015
Greenwich Public SchoolsStudents Scoring at Advanced on CMT Math vs
Completing Algebra I by 8th Grade
Scoring at Advanced (Gr 5) Completing Algebra 1 (Gr 8)
Board Goal75% by 2015
Challenges:
1. Current status of the 2014-2015 8th Grade cohort (current 6th grade).
Current enrollment in 6th Grade Math at all levels is 651 students. Current enrollment in courses that would lead to successful completion of Algebra I (or higher) by the end of 8th grade (Math 6A or Pre-Algebra) is 361 students (55%). In Math 6, there are currently 36 students (5%) that met the district’s CMT scaled score criteria (290+) for placement into 6A. These students likely did not meet the other criteria (teacher recommendation based on class performance, 70% or higher on district placement exam). Overall, the current percentage of students who would be eligible to complete Algebra I (or higher) by the end of 8th grade is 60% at most. This percentage varies greatly from school to school (EMS – 72%, CMS – 53%, WMS – 38%). – (see attached)
Page 42

Diagnostic Memorandum
Math
11/2/12 bmb
Challenges (con’t):
2. Current status of students enrolled in Algebra I in 8th grade compared to DRG A and DRG B districts.
As part of the ED165 data filed with the state of Connecticut, districts self-report the number of 8th grade students enrolled in Algebra I or Geometry by October 1st. In 2010-2011, Greenwich had 52.5% of 8th graders enrolled in one of these two courses compared to the DRG A average of 58.4% and the DRG B average of 47%. When compared to other area districts, Greenwich outperformed New Canaan (50.2%), Fairfield (44.9%), and West Hartford (51.1%) and was close to the average of Ridgefield (55.6%) and Wilton (53.8%).
3. The number of students who successfully complete advanced mathematics at the high school level has increased more than five-fold since 1999 without the requirement of Algebra I at 8th Grade.
In looking at data from 1999 to the present, the number of students successfully completing advanced mathematics courses at Greenwich High School has increased from 120 in 1999 to 801 in 2012. This has been achieved without requiring Algebra I as a “gateway” at the 8th grade level. – (see attached)
4. Research has shown that Algebra I at 8th grade is not an appropriate placement for large numbers of students.
A number of studies have been done regarding the placement of students in Algebra I at the 8th grade level. One study has shown that students inappropriately placed in Algebra I not only struggle, but also bring down the level of rigor for the students who are appropriately placed in the class. (Robelen, 2012). A large study conducted by the Brown Center on Education Policy at the Brookings Institution in 2008 concluded that students at both ends of the spectrum are adversely affected by “misplaced” students (p. 13; Loveless, 2008). Another study has shown that moderately math-proficient students placed in Algebra I in 8th grade performed significantly worse on end-of-year state math tests, and lower-performing students placed in Algebra I were significantly less likely to take more advanced math courses later on (Sparks, 2012).
Page 43

Diagnostic Memorandum
Math
11/2/12 bmb
Challenges (con’t):
5. Operationalizing this Stretch Goal will have to be managed carefully with students, staff and parents.
The pursuit of this stretch goal requires careful communications and clear expectations. Many students are ready for Algebra in 8th grade; we already know that 57% of 8th graders in 2011-2012 have successfully completed the course before entering high school. However, many students will not be academically prepared or developmentally ready for Algebra in middle school, particularly in the next few years. It will take a few years to implement a revised curriculum that will prepare more students to take Algebra in middle school, beginning in the elementary school years. Also, 8th grade Algebra will not be the best path for some students. A student’s placement in 8th grade Algebra will be carefully considered, and will be based on the individual student’s readiness. We do not want to place a student in a course for which they are not academically or developmentally ready to succeed, as this can have negative effects on both student performance and attitudes toward learning mathematics (LeGeros, 2012).
Causes Solutions Strategies* Cause #1: Students affected by this goal have already been placed in 6th grade math using district criteria (CMT scores, placement exam scores, class performance). Data: 6th Grade Course Placement: Current placement is approximately 53% in this cohort.
What: Develop and implement a plan for supplemental instruction to prepare selected students currently placed in Math 6 to move to Pre-Algebra in 7th grade. Who: Program Coordinators for Math and Media/Tech, MS Math Learning Facilitators, Instructional Coach, Middle School Principals How Implemented: Curriculum analysis, Supplemental instruction Results Measure: The number of students enrolled in Pre-Algebra in 7th grade will increase from 53% in 2012-2013 to 59% in 2013-2014.
1. Conduct gap analysis between curriculum in Math 6 and Math 6A (2012-2013)
2. Identify students targeted for supplemental instruction (2012-2013)
3. Identify supplemental materials (possibly online) to support instruction (2012-2013)
4. Provide instructional coaching to support teachers in differentiated math instruction (2012-2015)
5. Offer Summer Bridge to Pre-Algebra course to targeted students not attaining Pre-Algebra placement by the end of the school year (Summer 2013)
Page 44

Diagnostic Memorandum
Math
11/2/12 bmb
Causes Solutions Strategies* Cause #2: Current K-8 math curriculum/ program materials do not contain the amount of rigorous problem solving necessary to promote the algebraic thinking skills required to be successful in Algebra I at 8th grade. Data: Common Core State Standards for Mathematics (http://www. Corestandards.org/ assets/CCSSI_Math %20Standards.pdf)
What: Provide a rigorous mathematics curriculum with materials to support and promote problem solving and algebraic thinking skills Who: Program Coordinators for Math and Media/Tech, Instructional Coaches, Middle School Math Learning Facilitators, K-12 Vertical Math Team, Curriculum Study Committee How Implemented: Curriculum review, Identification/purchase of resources; Professional learning Results Measure: The number of students performing at the Advanced level on the CMT/SBAC at Grade 5 will increase from 53% in 2011-2012 to 65% in 2014-2015.
1. Conduct a full review of the GPS math curriculum and related materials (2012-2013)
2. Implement aligned curriculum with supporting materials (2013-2014)
3. Provide professional learning for teachers surrounding CCSS (Standards for Mathematical Practice), rigorous instruction (Performance Tasks, Math Workshop, Accountable Talk) (2012-2013)
4. Provide professional learning for teachers in new program materials (2013-2014)
Causes Solutions Strategies* Cause #3: Administrators, teachers and students have not had sufficient experience with the types of cognitively demanding tasks that are expected to be used in the Common Core/SBAC assessments.
What: Increase the cognitive demand of student mathematical performance tasks to align with Common Core/SBAC performance task expectations, and provide professional learning for administrators and teachers to support student learning. Who: Program Coordinators for Math and Media/Tech, Instructional Coaches, Middle School Math Learning Facilitators, K-12 Vertical Math Team, Curriculum Study Committee
1. Collect baseline data on the level of rigor in mathematical tasks (Fall 2012)
2. Identify and collect available Performance Task exemplars and resources (e.g. websites, published materials). (2012-2014)
3. Provide professional learning for all district administrators and teachers on frameworks to increase instructional rigor (2012-2014)
Page 45

Diagnostic Memorandum
Math
11/2/12 bmb
Data: Common Core State Standards for Mathematics (http://www. Corestandards.org/ assets/CCSSI_Math %20Standards.pdf) (Additional data to support this cause will be collected as part of the Math Action Plan)
How Implemented: Identification/purchase of exemplars/resources; Professional learning
4. Integrate effective and research-based digital tools and resources to support rigorous mathematical tasks and student engagement (2013-2015)
*Each strategy has a detailed action plan that includes specific timelines, costs, person(s) responsible.
Page 46

Greenwich Public Schools Grade Eight Math Goal Action Plan 2012-‐13
11/7/12 bmb
Goal: The percentage of 8th grade students successfully passing Algebra I will be 75% by 2015 to be measured by standardized test and GPS district math test. Cause #1: Students in the cohort affected by this goal have already been placed in 6th grade math using district placement criteria (CMT Scores, Placement Exam, Class Performance). The current placement numbers have approximately 53% of students on the pathway to Algebra I or higher by 8th grade. Solution #1: Develop and implement a plan for supplemental instruction to prepare selected students currently placed in Math 6 to move to Pre-‐Algebra in 7th Grade.
Result Measure #1: The number of students eligible to enter Pre-‐Algebra in 7th grade will increase from 53% in 2012-‐2013 to 59% in 2013-‐2014.
Strategies Timeline Fiscal Impact and Funding Source Person(s) Responsible
Progress Monitoring 2012-‐13 2013-‐14 2014-‐15
1. Conduct gap analysis between curriculum in Math 6 and Math 6A. • Coordinator will work with Middle
School Math Learning Facilitators and 6th grade teachers to determine prerequisite skills necessary for Pre-‐Algebra that are not taught in Math 6.
September 19, 2012 (Early Release)
NA NA NA Assistant Supt for Curriculum, Instruction and Professional Learning (CIPL); Program Coordinator for Math
• Meeting minutes • Gap Analysis
Document
• Coordinator will review “gap analysis” document with 6th Grade Math teachers at department meetings in October.
October 17, 2012
NA NA NA CIPL; Program Coordinator for Math
• Meeting Minutes
2. Identify students targeted for supplemental instruction. • Based on district criteria for 6th grade
math placement, Coordinator will identify students who were close to the CMT and placement exam cutoffs to potentially receive targeted supplemental instruction in skills identified in gap analysis.
September 2012
NA NA NA CIPL; Program Coordinator for Math
• List of Students with CMT Scores and Placement Exam Scores
Page 47

Greenwich Public Schools Grade Eight Math Goal Action Plan 2012-‐13
11/7/12 bmb
• Coordinator will consult with 6th grade math teachers to review list of students (generated above) at the end of the first academic quarter (marking period) to determine if student class work and grades supports candidacy for supplemental instruction.
Fall 2012 NA NA NA Program Coordinator for Math; 6th Grade Math Teachers
• Revised list of students targeted to receive supplemental instruction.
3. Identify supplemental materials to support instruction. • Identify/purchase available resources
(possibly online) to support math instruction in skills identified in gap analysis.
Fall 2012 $10,000 310, 307
TBD TBD CIPL; Program Coordinators for Math, Media/ Tech
• Materials Inventory • Purchase Orders • Distribution List
4. Provide instructional coaching support to teachers in differentiated Math instruction. • Secondary instructional coach will
provide support to 6th grade math teachers in differentiation as part of regularly scheduled coaching cycles.
2012-‐2013
NA TBD
TBD CIPL; Program Coordinator for Math; Secondary Instructional Coach
• Coaching cycle schedule
• Coaching action plan
• Hire an instructional coach to provide support to middle school math teachers in differentiation and rigorous instruction
2013-‐2014 2014-‐2015
NA TBD Recurring Cost
CIPL; Program Coordinator for Math
• Administrator observations
• Coaching cycle schedule;
• Coaching action plan • Coaching survey • Coaching evaluation
plan (based on TEPL) 5. Offer Summer Bridge to Pre-‐Algebra Course to Selected Students who do not attain placement in Pre-‐Algebra for Grade 7. • Provide tuition free attendance at the
Summer Bridge to Pre-‐Algebra course for students in the selected group who do not attain placement in Pre-‐Algebra by the end of the school year.
Summer 2013 NA $12,000 (one teacher)
TBD CIPL; Program Coordinator for Math; Summer School Coordinator
• Bridge to Pre-‐Algebra Exam Scores,
• % of students Placed in Grade 7 Pre-‐Algebra
Page 48

Greenwich Public Schools Grade Eight Math Goal Action Plan 2012-‐13
11/7/12 bmb
Cause #2: Current elementary math curriculum/ program materials do not contain the amount of rigorous problem solving and performance tasks necessary to promote the algebraic thinking skills required to be successful in Algebra I at 8th grade. Solution #2: Provide a rigorous K-‐8 mathematics curriculum with materials to support and promote problem solving and algebraic thinking skills.
Result Measure #2: The number of students performing at the Advanced level on the CMT/SBAC at Grade 5 will increase from 55% in 2011-‐2012 to 60% in 2014-‐2015.
Strategies Timeline Fiscal Impact and Funding Source Person(s) Responsible
Progress Monitoring 2012-‐13 2013-‐14 2014-‐15
1. Conduct a full review of the GPS Math curriculum and related materials. • Conduct an alignment study of
current K-‐5 Everyday Math materials with CCSS (content and practice standards) and produce a unit-‐by-‐unit implementation guide for teachers.
Summer 2012
$9,240 139
NA NA CIPL; Program Coordinator for Math
• Completed alignment/ implementation guides
• Provide professional learning for teachers surrounding CCSS (Standards for Mathematical Practice), rigorous instruction (Performance Tasks, Math Workshop, Accountable Talk)
November 6, 2012 (MS) and November 12, 2012 (ES) Full Day PL; Early Release Days (10/24/12, 1/30/13, 4/10/13, 5/15/13)
NA NA NA CIPL; Program Coordinator for Math; District Elementary Math Coaches; Middle School Math Learning Facilitators
• EZ-‐Traxx Attendance List
• EZ-‐Traxx Evaluation
• Establish a Vertical Math Team and meet bi-‐monthly to problem solve around district math issues including CCSS alignment, grade-‐to-‐grade articulation, etc.
2012-‐2015 NA NA NA Program Coordinator for Math; HS Math Program Administrator
• Meeting minutes • District Math Wiki
• Establish a Curriculum Study Committee to provide input for the curriculum review.
2012-‐2013 NA NA NA CIPL; Program Coordinator for Math
• Curriculum Review charge
• Meeting minutes
Page 49
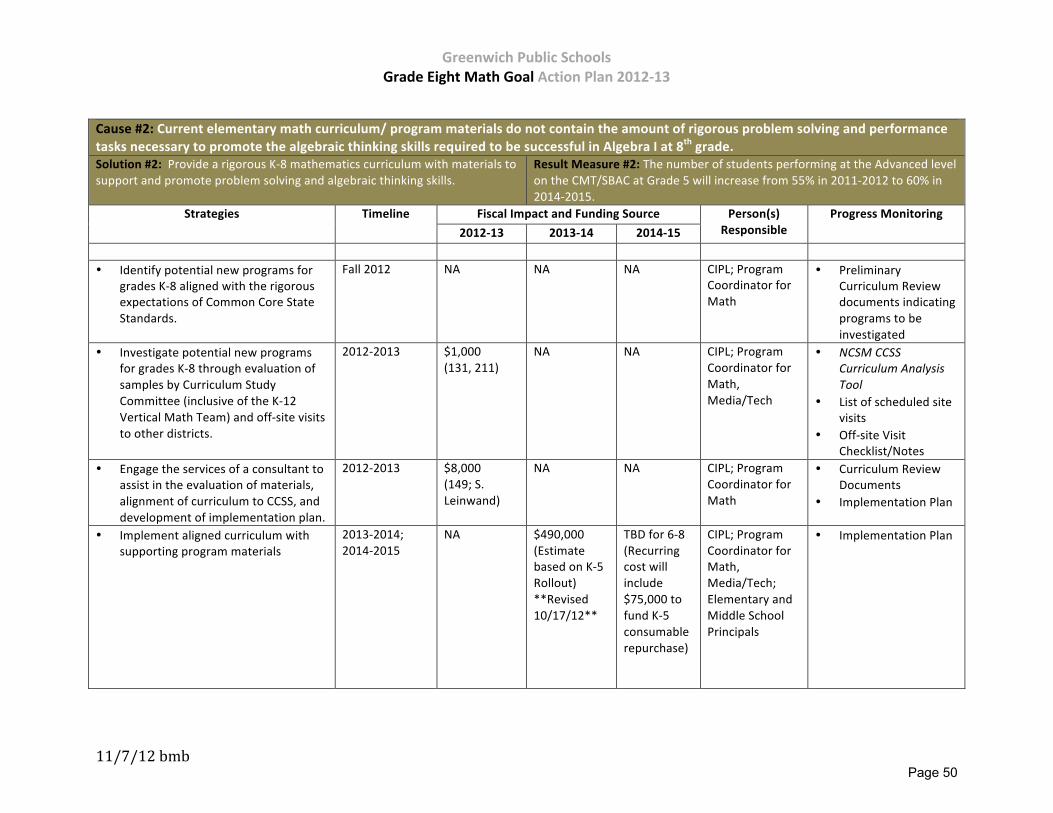
Greenwich Public Schools Grade Eight Math Goal Action Plan 2012-‐13
11/7/12 bmb
Cause #2: Current elementary math curriculum/ program materials do not contain the amount of rigorous problem solving and performance tasks necessary to promote the algebraic thinking skills required to be successful in Algebra I at 8th grade. Solution #2: Provide a rigorous K-‐8 mathematics curriculum with materials to support and promote problem solving and algebraic thinking skills.
Result Measure #2: The number of students performing at the Advanced level on the CMT/SBAC at Grade 5 will increase from 55% in 2011-‐2012 to 60% in 2014-‐2015.
Strategies Timeline Fiscal Impact and Funding Source Person(s) Responsible
Progress Monitoring 2012-‐13 2013-‐14 2014-‐15
• Identify potential new programs for
grades K-‐8 aligned with the rigorous expectations of Common Core State Standards.
Fall 2012 NA
NA NA CIPL; Program Coordinator for Math
• Preliminary Curriculum Review documents indicating programs to be investigated
• Investigate potential new programs for grades K-‐8 through evaluation of samples by Curriculum Study Committee (inclusive of the K-‐12 Vertical Math Team) and off-‐site visits to other districts.
2012-‐2013 $1,000 (131, 211)
NA NA CIPL; Program Coordinator for Math, Media/Tech
• NCSM CCSS Curriculum Analysis Tool
• List of scheduled site visits
• Off-‐site Visit Checklist/Notes
• Engage the services of a consultant to assist in the evaluation of materials, alignment of curriculum to CCSS, and development of implementation plan.
2012-‐2013 $8,000 (149; S. Leinwand)
NA NA CIPL; Program Coordinator for Math
• Curriculum Review Documents
• Implementation Plan
• Implement aligned curriculum with supporting program materials
2013-‐2014; 2014-‐2015
NA $490,000 (Estimate based on K-‐5 Rollout) **Revised 10/17/12**
TBD for 6-‐8 (Recurring cost will include $75,000 to fund K-‐5 consumable repurchase)
CIPL; Program Coordinator for Math, Media/Tech; Elementary and Middle School Principals
• Implementation Plan
Page 50

Greenwich Public Schools Grade Eight Math Goal Action Plan 2012-‐13
11/7/12 bmb
Cause #2: Current elementary math curriculum/ program materials do not contain the amount of rigorous problem solving and performance tasks necessary to promote the algebraic thinking skills required to be successful in Algebra I at 8th grade. Solution #2: Provide a rigorous K-‐8 mathematics curriculum with materials to support and promote problem solving and algebraic thinking skills.
Result Measure #2: The number of students performing at the Advanced level on the CMT/SBAC at Grade 5 will increase from 55% in 2011-‐2012 to 60% in 2014-‐2015.
Strategies Timeline Fiscal Impact and Funding Source Person(s) Responsible
Progress Monitoring 2012-‐13 2013-‐14 2014-‐15
• Provide professional learning for teachers and administrators surrounding new program materials and implementation plan
2013-‐2014; 2014-‐2015
NA $125,000 (Approx. Cost for PD and G&D)
$125,000 (Approx. Cost for PD and G&D)
CIPL; Program Coordinator for Math
• EZ-‐Traxx Attendance List
• EZ-‐Traxx Evaluation
Cause #3: Administrators, teachers, and students have not had sufficient experience with the types of cognitively demanding tasks that are expected to be used in the Common Core/SBAC assessments. Solution #3: Increase the cognitive demand of student mathematical performance tasks to align with Common Core/SBAC performance task expectations, and provide professional learning for administrators and teachers to support student learning.
Result Measure #3: The distribution of mathematical tasks in which students are engaged will be balanced across Webb’s Depth of Knowledge levels (correlated to the SEC Cognitive Demand in Mathematics) as follows: 2013-‐14 at 50% levels 2/3 and 50% levels 3/4 2014-‐15 at 40% levels 2/3 and 60% levels 3/4
Strategies Timeline Fiscal Impact and Funding Source Person(s) Responsible
Progress Monitoring 2012-‐13 2013-‐14 2014-‐15
1. Collect baseline data on the level of rigor in mathematical tasks. • All Elementary and Middle School
administrators will conduct 10 minute observations of math instruction to collect baseline data on the level of rigor in mathematical tasks
Fall 2012 NA NA NA Program Coordinator for Math; MS Principals; ES Principals
• Observation Data
• Elementary and Middle School Principals will aggregate the data by grade level; review the data with the SDT; and report data to the Math Program Coordinator.
Fall 2012
NA NA NA Program Coordinator for Math; MS Principals
• Baseline Data • SDT Minutes
Page 51
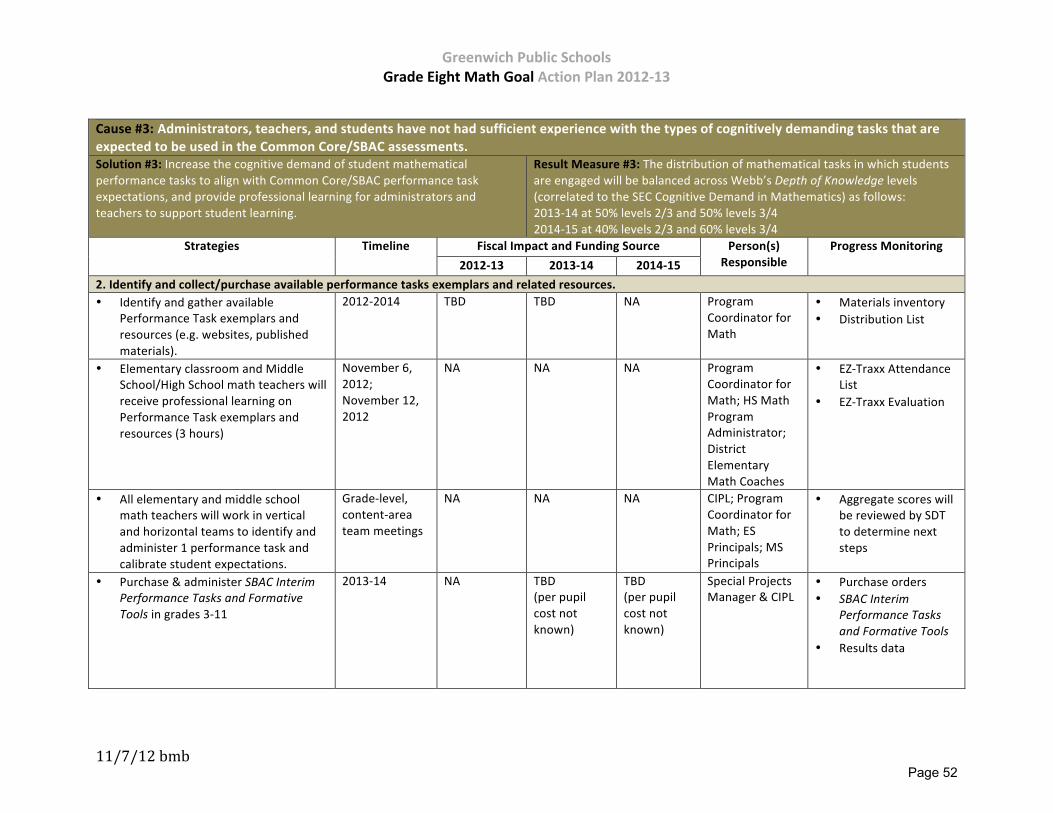
Greenwich Public Schools Grade Eight Math Goal Action Plan 2012-‐13
11/7/12 bmb
Cause #3: Administrators, teachers, and students have not had sufficient experience with the types of cognitively demanding tasks that are expected to be used in the Common Core/SBAC assessments. Solution #3: Increase the cognitive demand of student mathematical performance tasks to align with Common Core/SBAC performance task expectations, and provide professional learning for administrators and teachers to support student learning.
Result Measure #3: The distribution of mathematical tasks in which students are engaged will be balanced across Webb’s Depth of Knowledge levels (correlated to the SEC Cognitive Demand in Mathematics) as follows: 2013-‐14 at 50% levels 2/3 and 50% levels 3/4 2014-‐15 at 40% levels 2/3 and 60% levels 3/4
Strategies Timeline Fiscal Impact and Funding Source Person(s) Responsible
Progress Monitoring 2012-‐13 2013-‐14 2014-‐15
2. Identify and collect/purchase available performance tasks exemplars and related resources. • Identify and gather available
Performance Task exemplars and resources (e.g. websites, published materials).
2012-‐2014 TBD TBD NA Program Coordinator for Math
• Materials inventory • Distribution List
• Elementary classroom and Middle School/High School math teachers will receive professional learning on Performance Task exemplars and resources (3 hours)
November 6, 2012; November 12, 2012
NA NA NA Program Coordinator for Math; HS Math Program Administrator; District Elementary Math Coaches
• EZ-‐Traxx Attendance List
• EZ-‐Traxx Evaluation
• All elementary and middle school math teachers will work in vertical and horizontal teams to identify and administer 1 performance task and calibrate student expectations.
Grade-‐level, content-‐area team meetings
NA NA NA CIPL; Program Coordinator for Math; ES Principals; MS Principals
• Aggregate scores will be reviewed by SDT to determine next steps
• Purchase & administer SBAC Interim Performance Tasks and Formative Tools in grades 3-‐11
2013-‐14 NA TBD (per pupil cost not known)
TBD (per pupil cost not known)
Special Projects Manager & CIPL
• Purchase orders • SBAC Interim
Performance Tasks and Formative Tools
• Results data
Page 52

Greenwich Public Schools Grade Eight Math Goal Action Plan 2012-‐13
11/7/12 bmb
Cause #3: Administrators, teachers, and students have not had sufficient experience with the types of cognitively demanding tasks that are expected to be used in the Common Core/SBAC assessments. Solution #3: Increase the cognitive demand of student mathematical performance tasks to align with Common Core/SBAC performance task expectations, and provide professional learning for administrators and teachers to support student learning.
Result Measure #3: The distribution of mathematical tasks in which students are engaged will be balanced across Webb’s Depth of Knowledge levels (correlated to the SEC Cognitive Demand in Mathematics) as follows: 2013-‐14 at 50% levels 2/3 and 50% levels 3/4 2014-‐15 at 40% levels 2/3 and 60% levels 3/4
Strategies Timeline Fiscal Impact and Funding Source Person(s) Responsible
Progress Monitoring 2012-‐13 2013-‐14 2014-‐15
3. Provide professional learning for teachers and administrators on instructional frameworks to enhance “rigor” within classroom tasks (SEC Cognitive Demand Categories for Mathematics, Revised Bloom’s Taxonomy, Webb’s Depths of Knowledge). • Provide professional learning for all
district administrators on frameworks to increase instructional “rigor.”
2012 Aug. Leadership Institute 2012-‐14 Leadership Council Mtgs.
NA NA
TBD
NA
CIPL; Program Coordinators for Math, ELA, Media/Tech; Principals; Deputy Superintendent
• EZ-‐Traxx Attendance List
• EZ-‐Traxx Evaluation
• Provide professional learning for all teachers on frameworks to increase instructional “rigor.”
2012-‐14 Faculty Meetings
NA TBD TBD CIPL; Program Coordinators for Math, ELA, Media/Tech; Principals
• EZ-‐Traxx Attendance List
• EZ-‐Traxx Evaluation
4. Integrate effective and research-‐based digital tools and resources to support rigorous mathematical tasks and student engagement. • Elementary classroom and middle
school Math teachers will receive professional learning on Tech Integration Tools to increase math achievement (3 hrs.).
Early Release (1/30/13); Additional dates TBD
NA TBD TBD Program Coordinators for Math and Media/Tech
• EZ-‐Traxx Attendance List
• EZ-‐Traxx Evaluation
Page 53