districtofmission received - mission, british columbia · ntpltd r ntnd thn a rv f rrnt n ndtn n th...
TRANSCRIPT

District of Mission
Received
August 16, 2010

FORWARD
The following represents Phase One of the study commissioned by Ground Control on behalf of the District of Mission (DM) to provide a reviewof the current and anticipated state of the housing market in Mission and the Fraser Valley Regional District (FVRD) as it relates to the proposedrezoning and development of the Mission Waterfront Lands, and recommendations for the residential components of the planned community.In this first phase of the study, quantitative and qualitative data on those projects currently marketing along with new developments beingcontemplated are contained within. A review of current economic conditions in the District of Mission along with an analysis of the Demographicand Psychographic make ‐ up of Mission residents is also included. This analysis is intended for use by Urban Analytics Inc. (UAI) and GroundControl in evaluating the potential development forms of residential product on the Waterfront Lands – to be provided in Phase Two of thestudy.
All information and detail within is compiled through public sources and through developers and property owners or their representatives. Everyreasonable effort has been taken to compile accurate and reliable information, and the data contained herein is deemed to be that. Noresponsibility is assumed for inaccuracies of information provided by Developers, their agents or other reporting parties.
2District of Mission – Housing Market Status Urban Analytics Inc.

Methodology – Demographic Estimates and Projections
The analysis and recommendations contained herein are based on demographic estimates and projections provided by Tetrad. Tetrad usesEnvironics Analytics as its supplier of census data and demographic profiling.
Environics Analytics describes their methodology for development for demographic profiling as follows:
Demographic Estimates and Projections (DEP) includes current ‐year demographic estimates and projections for three, five and ten years into thefuture covering over 350 key variables for 54,626 census dissemination areas and for six ‐ digit postal codes (FSALDUs). It also provides historicalestimates from five years ago based on the same methodologies to ensure accurate trend analysis. DEP is created using innovative methods thatcombine econometric, demographic and geographic models and employs a variety of data inputs including the latest census, current economicindicators, post censual estimates from federal and provincial governments, immigration statistics and economic data like building permits. DEPfeatures variables on population, family structure, household size and type, diversity, labour force participation and income—including bothaverages and distributions.
Statistics Canada conducts a comprehensive national census every five years to provide an in ‐depth portrait of Canada. But for many marketers,some of the census demographic and economic data are too dated to be useful when they are released. In addition, census data has a knownundercount. DEP addresses these gaps by providing demographic data for the current year and authoritative projections for a decade into thefuture—a 10 ‐year timeline that permits in ‐depth trend analysis of consumers and markets. The models, developed and tested over many years,also correct for the undercount at the demographic area level based on the known error levels for larger geographic areas that Statistics Canadareleases after the census. DEP’s demographic information helps make informed decisions when evaluating catchment or trade areas, selectingsites, targeting new markets and analyzing population trends. DEP is up ‐to‐date and provides estimates and projections of variables not includedin the census, including household income distributions in $10,000 increments, reported in constant and inflation ‐adjusted dollars, for alldissemination areas. Such detailed data have proven valuable to banks, utilities and retailers, which depend on the latest demographic analysisto better serve their dynamic customer base. With DEP, you gain access to the most current demographic trends to monitor changes in marketshare, migration and income—neighbourhood by neighbourhood.
Census Data – Historical population and demographic analysis contained in the report is based on 2006 Census data by Statistics Canada. Anyreference made to Census refers to the latest available Census data unless otherwise stated.
3District of Mission – Housing Market Status Urban Analytics Inc.

Table of Contents
PART ONE – Economic Indicators, Fundamentals / Development StrategiesA. Provincial Overview 11B. Mission / Fraser Valley Regional District Economic Fundamentals / Indicators 18
i. Migration 18ii. Employment 19iii. Labour Force and Occupation 20iv. Benchmark Housing Prices 22v. Housing Starts 23vi. Building Permits 25
C. Mission Economic Development Strategy 28D. Major Projects Inventory 29
vii. Major Projects – Mission 30viii. Major Projects – Fraser Valley Regional District & Maple Ridge 34
PART TWO - Demographic / Psychographic AnalysesA. Population Growth Trend 40B. Population Projections 41C. Age Characteristics 43D. Ethnicity 45E. Household Size 46F. Home Ownership 48G. Incomes 49H. Education/Occupation 50I. Mobility 51
4District of Mission – Housing Market Status Urban Analytics Inc.

PART THREE - Community StructureA. Primary Employers/Industries 52B. Employee Mobility 54C. Current Housing Stock 55D. Community Amenities 57
PART FOUR - The Residential Housing MarketA. Fraser Valley 60B. Mission 62
i. Single Family Detached 65ii. Multi ‐ Family Development 67iii. Active New Residential Development Summary 68
C. Abbotsford 71i. Active New Residential Developments Summary Tables 73
D. Maple Ridge 75i. Active New Residential Development Summary Tables 76
PART FIVE - MLS Resale Market AnalysisA. Total Absorption in the Comparable Region 79B. Absorptions by Product Type 81C. Single Family Detached Summary 83D. Townhome Summary 87E. Apartment Summary 90F. Price Points by Bedroom Type 93
5District of Mission – Housing Market Status Urban Analytics Inc.

PART SIX - Contemplated Residential Development Review - MissionA. District of Mission ‐ OCP Review 94B. Future Development Strategies 96C. Contemplated Residential Development in Mission 97D. Contemplated Multi ‐ Family Residential Summary Tables in Mission 98E. Project Specific Proposed Development Review in Mission 99
i. Community of Cedar Valley 99ii. Community of Silverdale 101iii. Parr Avenue Development 104
F. Contemplated Development Review – Neighbouring Markets 105
PART SEVEN – ConclusionsA. Demand Forces 115B. Housing Projections for Mission 116C. Summation 117
6District of Mission – Housing Market Status Urban Analytics Inc.

EXECUTIVE SUMMARY
Economic Indicators, Fundamentals and Development Strategies• In 2010, consumer confidence in British Columbia sits at 92.8%, eight points above Canada’s national average of 84.8%;• In 2007 & 2008 Fraser Valley Regional District (FVRD) had the highest level of intra ‐ provincial migration with 1,566 new residents while the
Greater Vancouver Regional District (GVRD) lost 5,948 residents to intra ‐ provincial migration;• Net migration to Mission & Abbotsford CMA projected to increase in 2010 & 2011 by 1.7%;• Implementation of HST in July 2010 will inevitably have some negative impact on the new housing market;• The FVRD has performed well within the province during this time of recovery;• The District of Mission (DM) has been one of the fastest growing communities in BC but the vast majority of this growth has been
concentrated in residential development with little industrial, commercial or government/institutional growth, unlike Mission’s FVRDcounterparts;
• New construction in the Fraser Valley Region has improved considerably in the first quarter of 2010. Housing starts were up 128 per centover the same period last year;
• The DM has averaged 190 housing starts annually since 1982 which represents a small portion of new housing starts in the FVRD;• The highest volume of new home starts in Mission took place from 1989 to 1993 (Expo effect) when over 300 homes were started each year;• Single ‐family starts have represented 100% of all housing starts in 2010 – single family dominance;• The benchmark price for a detached single family home in Mission peaked at $385,872 in 2008 – a 127% increase from 1999;• In Mission it has since dropped 21% to $350,074 as of June 2010;• The spread in benchmark price between Abbotsford and Mission since 2007 was 14.3%, currently there is a 21.5% differential;• The development of the local tourism industry will require a significant investment to ensure the proper development of a strategy that will
allow Mission to derive the full benefit of future potential tourism growth.
Demographic/Psychographic Analysis• The population of DM was 34,505 as of 2006 Census – 13.4% of FVRD’s population;• The population is projected to grow to 38,420 by 2011, 42,187 by 2015 and 47,051 by 2020;• Based on the most recent census data, Mission’s population is young with approximately 60% of the population under the age of 45 and the
demographic make ‐ up over the next 10 years is not projected to shift significantly;• The majority of the DM is non ‐ immigrant Caucasian, comprising 82.8% of the population as of the 2006 Census. The population of
immigrants in Mission is significantly lower than the rest of the Province; 14.7% versus 27.2% respectively;
7District of Mission – Housing Market Status Urban Analytics Inc.

• The average household size of 2.83 is forecast to drop to 2.56 by 2020 due to a young population;• Median household income of $65,923 expected to rise 18% by end of 2010 to $77,691;• 65% of Mission residents who have a usual place of work commute outside the District daily.
Community Structure• There are a total of 12,185 occupied dwellings in Mission;• 76.4% of the 12,185 dwellings in the DM are owned versus rented. This is 8% higher than BC’s average;• Nearly 27% of the existing housing stock in the District of Mission was constructed between 1971 and 1980;• Detached homes make up 69.9% of the housing stock – townhomes and apartments account for only 13.8%.
The Residential Housing Market – The Now• The Fraser Valley new home market has largely recovered from the economic downturn of 2008 however it has seen a downward
adjustment in pricing;• The Mission market area did not experience any of the investor speculation for new homes that other Metro Vancouver and Fraser Valley
communities did;• Single family home construction continues to dominate the residential development landscape in Mission;• There were 126 new single family detached homes introduced to Mission in 2009 and to date in 2010;• It is hard to gauge the current inventory of single family detached homes in Mission, but UAI estimates there is anywhere from 55 to 75
unsold new homes under construction or recently completed;• Considering the somewhat limited amount of multi ‐family development in Mission, this segment of the marketplace can be best described
as under –developed; most product favours local residents;• Much of the limited low ‐ rise and townhome projects are overpriced relative to single family developments;• Over the last decade Mission has introduced less than 550 units of new multi ‐family residential product. No new significant multi ‐family
product has been introduced in Mission since 2007;• What is important to note is that out of the 550 units built, 322 were non ‐ market housing used for Congregate Care or for BC Housing. In
other words, market housing was limited to 218 units of which 55 units are still in inventory, which equates to an average absorption of 16units per year over the last decade.
• At this time there are only three active multi ‐family projects selling in Mission consisting of 51 townhomes and 70 low ‐ rise woodframeapartments;
8District of Mission – Housing Market Status Urban Analytics Inc.

• Current available inventory for new multi ‐family product in Mission include 11 townhomes and 44 apartments as of June 2010.
The Residential Housing Market – On MLS• Mission accounts for approximately 14% of all sales recorded on MLS in the Comparable Region (Region) since 2000. 8,823 homes were sold
in Mission through the MLS out of a total of 63,109 homes sold in the Region over the last decade;• The average absorption in Mission over the last decade was about 882 homes per year;• Sales of single family detached homes in Mission accounts for 16% of the Region’s sales with 6,395 homes; an average of 54 sales per month;• Single family detached homes in Mission make up over 87% of sales on MLS over the last decade which is greater than any other markets in
the region;• The distribution of multi ‐family product sold in the Region is consistent in each market except for Mission where multi ‐family product only
accounts for only 13% of the product sold. In comparison 36% to 39% of the product sold in the rest of the Region is multi ‐family residential;• Mission has only sold 489 townhomes over the last decade, averaging only 4 units per month;• Apartments in Mission represent only 4.5% of the total apartment sales for the Region or less than 4 units per month. This totals only 434
apartments sold on MLS in the last decade, averaging 43 units per year;• The majority of single family detached homes sold in Mission over the last four years have been priced from $300,000 to $450,000;• Based on current listings in Mission there is approximately 8 months’ supply of single family detached homes in Mission;• The average price for a townhome in Mission over the last decade climbed by 131% to $249,262;• Over the last four years 66% of the townhomes sold in Mission have been priced $200,000 to $300,000 and the most expensive townhome
sold to date in Mission was $369,000;• The average price of an apartments in Mission grew at an annual rate of 6.4% and the average price climbed by 114% to $185,490;• The greatest price increase for apartments in Mission occurred from 2005 to 2007 when the average price of apartments climbed 87% on
MLS. During this period the average price increased from $112,174 in 2005 to $214,327 in 2007;• Over the last decade not only the average price but the average price per square foot for apartments sold on MLS was higher in Mission than
in Abbotsford (except for 2005). The average price for apartments in Mission peaked in 2007 at $214,327 or $206 price per square foot.
The Residential Housing Market – The Future• A key objective is to develop and implement a Downtown Neighbourhood Plan to increase both the population and vibrancy of Downtown
Mission;• Over 17,000 new residential units are currently being contemplated for the District of Mission. This includes Cedar Valley (approx. 2,400),
Silverdale (approx. 11,000) and the current proposed Mission Lands (approx. 3,000).
9District of Mission – Housing Market Status Urban Analytics Inc.

• Current development applications represent approximately 1,170 units for all product types with 521 units slated for multi ‐familydevelopment;
• Mission has never experienced the absorption of the amount of multi ‐family product currently being contemplated in the District;• Current significant communities in the development application process being considered and that are of relevance to the Mission Lands
include:• Parr Avenue (Pattison): Approx. 333 Units Status: 3 rd Reading – 297 townhomes and 36 apartments• Maple St & 1 st Ave (Perspective): Approx. 154 Units Status: Development Application Submitted in 2008
• Abbotsford currently has 39 projects in planning with approximately 6,643 units being proposed;• Maple Ridge currently has 49 projects in planning with approximately 3,000 units being proposed.
Conclusions• The District of Mission needs to attract new, job producing industries to the community if Mission is to attract more residents who will live
and work in Mission;• Significant changes are required to housing prices and the economic and physical make ‐ up of Mission to sufficiently increase demand to
absorb the proposed new home supply;• Based on current population projections and household size, over 450 housing units would be required annually to meet the demand from
the over 780 anticipated annual new residents over the next 10 years;• The Silverdale community is not expected to have a significant impact to housing supply in Mission over the next 10 years;• For significant absorption of multi ‐family product to achieve success in Mission, price points need to be adjusted lower relative to single
detached home product in Mission and comparable multi ‐family product in neighbouring communities;• As it stands today, prices for new multi ‐family product approaches and in some cases exceeds prices of single family detached homes;• The District of Mission has a unique opportunity with the Waterfront Lands in that it can take a much longer term view of its OCP zoning;• Land surrounding the waterfront area is highly fragmented with numerous owners. New zoning should be approved in an orderly & timely
manner;• Only an appropriate and effectively executed mix of uses on the Waterfront lands will provide the opportunity to create a sustainable
neighbourhood on the property, and initiate the much ‐ needed revitalization of Downtown Mission & its waterfront.
10District of Mission – Housing Market Status Urban Analytics Inc.
PART ONE – Economic Indicators, Fundamentals and Development Strategies
A. Provincial Overview
The following provides a brief summary of current economic conditions in British Columbia.
Provincial GovernanceWhile British Columbia’s economy has traditionally been dominated by natural resource based industries in recent decades the province hasdiversified significantly and industrial and service based industries form a more prominent role in British Columbia’s economy. Thisdiversification has led to BC becoming one of the top performing economies in Canada, second to Alberta in most categories of growth formost of the past decade. Despite the global economic recession, the province is projected to lead Canada and continue to experience robustand resilient growth on the road to economic recovery. The BC Liberals re ‐election in 2009 will allow the government to see through theimplementation of several policy decisions related to significant infrastructure spending in the coming years. The strong economicfundamentals that existed prior to the recent recessionary issues taking hold, combined with the implementation of these and other policyinitiatives will position the province for a softer landing and presumably a quicker recovery from the prevailing global economic challenges.The biggest challenge British Columbia will face in the coming months is external global economic factors that will dampen the recovery.
Fiscal Responsibilities• Standard & Poor’s has affirmed the Province of British Columbia’s credit rating at AAA, the highest possible, noting the Province’s strong fiscal
management is keeping BC on track to balance its budget by 2014.• The significant debt reduction efforts of the past few years have put British Columbia in a stronger position to face recently recorded and
anticipated deficits and increases in debt burden.• Among Canada’s senior governments, only BC, Alberta and the Government of Canada currently hold AAA ratings.• S&P’s report notes, “The province's debt reduction in recent years gave it an increased capacity to respond to the global recession, in our
opinion. From fiscals 2004‐2007, BC used some of its strong operating and after ‐capital surpluses to reduce its direct and tax ‐supported debtmaterially.”
• Dominion Bond Rating Services stated; “... the Province’s fiscal recovery plan is relatively unchanged from last year, supported by prudentspending discipline, and expectations for continued economic recovery ... DBRS expects British Columbia to be one of the first provinces toreturn to balance, thanks to its strong fiscal resolve.”
11District of Mission – Housing Market Status Urban Analytics Inc.

• Olympic Game and Tourism• Tourism is on the rise, thanks in part to the incredible success of the 2010 Winter Games. Statistics Canada reports over 268,000 international
visitors entered BC in February 2010, an increase of 30 per cent from the previous February.• The 2010 Olympic and Paralympic Winter Games generated over $4 billion in economic activity. If you include the potential of the convention
centre expansion, the resulting economic activity climbs to $10.7 billion.• The Games and the resulting economic activity created an estimated 244,000 jobs. Independent economists agree that the 2010 Winter
Games couldn’t have been better timed as an effective stimulus for BC’s economy.• Although many nay ‐Sayers argue that the Olympic legacy will ultimately become a burden to taxpayers, there is an intangible long ‐term effect
that cannot necessarily be measured (monetarily) in the short ‐term.• In December 2009, China granted Canada approved destination status, allowing tour operators and travel agents in China to advertise and
organize tours in Canada and British Columbia. Approved destination status could increase Chinese tourism to BC by 25% annually over thenext few years and have a positive impact on the Lower Mainland housing market.
Resource and Exports on the Rise• With the establishment of major international lumber supply agreements, the British Columbia forestry industry continues to experience
stable growth in 2010.• BC’s mining industry is vibrant. Two major metal mines – Copper Mountain outside Princeton and New Afton near Kamloops – are under
construction. Together, they are expected to employ 750 workers during construction and another 500 when the mines are fully operational.A third mine at Mount Milligan northwest of Prince George is set to begin construction this year.
• With the New West Trade Partnership BC is currently establishing stronger economic ties with China and Japan while marketing the region’ssubstantial natural resources such as gold, copper, potash, wood, natural gas and metallurgical coal as well as Western Canada’s geographicaladvantage as North America’s Pacific Gateway with direct access by rail, air and highway to major North American markets.
Consumer and Business Confidence Highest in BC• Consumer confidence in British Columbia in 2010 sits at 92.8%, eight points above Canada’s national average of 84.8%.• The Canadian Federation of Independent Business reports the confidence rating of BC’s small and medium sized businesses rose in April
2010, is above the Canadian average, and is 23 points higher than it was a year ago.
12District of Mission – Housing Market Status Urban Analytics Inc.

Economic Growth Forecasts• Currently, major economic indicators such as housing starts, retail sales, employment, manufacturing shipments, exports and non ‐ residential
building permits have begun to exhibit strong growth compared to late 2008 and early 2009.• The Conference Board of Canada forecasts that British Columbia will be one of the provincial leaders in economic growth at 3.8% in 2010.• Canada Housing and Mortgage Corporation forecasts BC will lead the country in the growth of housing starts, which are expected to increase
by 37% in 2010.• The British Columbia Real Estate Association reports almost 6,000 homes were sold in BC in February 2010 – an increase of more than 60%
compared with February 2009. Overall, more than 85,000 homes changed hands in British Columbia during 2009, a 23% increase over 2008sales figures. The Association predicts sales will continue to increase in 2010, topping 90,000 homes, up from an annualized rate of 50,000units during the first quarter of 2009.
• BC’s total value of building permits has increased 47.5% over last year – from $597.2 million in March 2009 to $881.1 million in March 2010.• The number of urban housing starts in BC during the first quarter of 2010 was more than double that of the same time last year. More than
5,300 units were started between January and March 2010, compared with 2,500 in 2009.• A total of 882 major construction projects, worth an estimated $187 billion, were planned or underway in the fourth quarter of 2009. Since
2001, the volume of major projects has nearly tripled, and their corresponding value has more than quadrupled.• According to Statistics Canada, BC created 49,300 jobs between April 2009 and April 2010 representing 22% of the jobs created in Canada
during those 12 months. The BC unemployment rate fell to 7.3% in April 2010, the third lowest in Canada.• BC has experienced many economic swings and restructuring over the past few decades and has always come out stronger in the end.
Budget Highlights• British Columbia’s Budget 2010 maintains the government’s priority of protecting core services in health and education and commits that
every dollar raised through the Harmonized Sales Tax (HST) and four other revenue streams be used for health services funding.• With Budget 2010, the BC government continues to invest in job ‐creating construction projects such as highways, schools, bridges, hospitals
and other needed infrastructure throughout the province.• Under the current 2010 budget, $5.3 billion has been committed to over 850 accelerated capital projects across British Columbia, an increase
of $1.9 billion since the September 2009 Budget Update.• Budget 2010 provides a property tax deferral program for homeowners with children under the age of 18.• Over the next three years, capital spending on schools, hospitals, roads, hydro ‐electric projects and other infrastructure in BC is expected to
total $20.7 billion (this assumes federal contributions of $1.5 billion).
13District of Mission – Housing Market Status Urban Analytics Inc.

• The desired result of this capital investment is for continued employment and economic growth during this period of economic recovery.
Economic Development Highlights• From an economic development perspective, a variety of programs and initiatives were announced to stimulate economic growth and
mitigate adverse conditions in the economy, some of which will have a direct impact on Mission and the Fraser Valley Region.
a. Forestry • BC Stats reports that lumber production in the province increased by nearly a quarter since May 2009. In March 2010, sawmills turned
out 33.3% more lumber than in March 2009.• Expanding lumber exports to China is one of government’s key actions to attract investment and improve the competitiveness of the
British Columbia forestry sector.• Due to strong lumber prices, effective June 1, 2010 BC’s softwood lumber producers will no longer pay tax on shipments to the U.S.
The export tax has dropped from 15% to zero because of higher lumber prices.
b. Infrastructure and Capital Improvement• $5.3 billion has been committed to over 850 accelerated capital projects across British Columbia, an increase of $1.9 billion since the
September Update 2009.• Over the next three years, capital spending on schools, hospitals, roads, hydro ‐electric projects and other infrastructure in BC is
expected to total $20.7 billion. This assumes federal contributions of $1.5 billion.• $2.8 billion upcoming in transportation improvements over a three ‐year period, including rapid bus projects along the No. 1, 7 and 99
highways in Metro Vancouver and $302 million for the Evergreen rapid transit line into Coquitlam.
c. Mining, Oil & Gas and Energy • The May 2010 natural gas and petroleum sale resulted in over $76 million in bonus bids, announced Energy, Mines and Petroleum
Resources Minister Blair Lekstrom. This brings the calendar‐year‐to‐date total to $204.9 million. This is very positive news and showsthat British Columbia is leading the economic recovery in Canada. Investor confidence and a thriving natural gas and petroleumindustry will ensure we continue to create jobs and stimulate economic opportunities especially in northeast BC
d. Education and Labour Market Development • $302 million has been set aside for school replacement.
14District of Mission – Housing Market Status Urban Analytics Inc.

e. Film• According to the BC Film Commission, spending on television and film production in British Columbia topped $1.3 billion during 2009,
up by more than $100 million over 2008. With 2009’s increase, British Columbia remains firmly established as North America’s thirdlargest television and film production centre.
• A new tax credit has also been introduced for digital media and enhancements to provincial film ‐tax credits have been made to reflectthe convergence of these sectors and their importance to the BC economy.
f. Sustainability and Climate Action • To maintain British Columbia’s commitment to addressing climate change, Budget 2010 commits $100 million to climate action and
clean ‐energy development, initiatives that will support new jobs and investments in BC communities, while lowering greenhouse gasemissions. An additional $35 million will be invested in the successful LiveSmart BC program for household ‐energy audits and energy ‐efficiency retrofits.
g. Asia ‐ Pacific • The current provincial government is investing in strengthening the Asia ‐ Pacific connections because as Canada’s Pacific Gateway.• The Asia Pacific initiative has the potential to drive BC’s economy with $5 billion in increased investment, $76 billion in additional
annual trade and 255,000 new jobs by 2020.• $30 million is being invested towards the $170‐ million Phase 1 expansion and containerization of the Port of Prince Rupert to increase
trade with Asia and Phase II, a further $650 ‐ million expansion of the Prince Rupert port is underway.• The government implemented a new Asia Pacific Division focused on increasing trade and investment.• A new Twinning Tool Kit to support local governments in building ‘sister city’ relationships with Asian countries.
15District of Mission – Housing Market Status Urban Analytics Inc.

BC’s Population and Interprovincial Migration Continues to Rise• BC’s population grew at a rate of 1.6 percent between the third quarter of 2008 and 2009, placing it, along with Saskatchewan (+1.6%), third
among provinces and territories behind Alberta (+2.3%) and Nunavut (+1.8%). The average growth across Canada was 1.2%.• For the second consecutive quarter, British Columbia was Canada’s leader in proportional population growth. From October to December
2009, B.C’s population grew by nearly 14,300 persons, including more than 9,200 immigrants and now totals 4,494,232• From March 2001 to December 2009, close to 10,000 skilled and business immigrants were attracted to British Columbia through the BC
Provincial Nominee Program. In the last fiscal year alone, BC attracted 2,658 skilled workers and entrepreneurs – more than 6,200 newimmigrants including family members.
• Examining current population estimates provides insight into some aspects of the province's growth. Given BC's very low fertility rate (a totalfertility rate of 1.4) and increasingly older population, about three quarters of the population growth between 2001 and 2006 was due tomigration, with natural increase (births minus deaths) accounting for the remainder. This migration growth was primarily due to migrationfrom international sources (71%), with only about 5% due to net interprovincial migration. In the previous 1996 ‐2001 period, BC's populationgrowth was due to net international migration and natural increase, as there was a net outflow to other provinces.
• Approximately three quarters (76%) of the immigrants to BC over the 2001 ‐2006 periods were from Asian countries, followed by Europeansources (11%) and North America (5.2%). Mainland China accounted for 28% and India for 13% of immigrants to BC
• Net migration into the Mission/Abbotsford CMA is projected to increase this year and next. Over the next two years, the population in theFraser Valley is projected to grow by about 1.7%. Net migration, which totalled approximately 3,500 in 2009, resulted in population growthof nearly 2% in the Fraser Valley. With more people moving into the area, demand for housing in the Fraser Valley will rise.
16District of Mission – Housing Market Status Urban Analytics Inc.

Harmonized Sales Tax (HST)• As of July 1, 2010 the British Columbia provincial sales tax will be harmonized with the federal Goods and Services Tax.• As proposed, the HST will have a direct or indirect increase to the cost of buying or selling all types of property.• The threshold of $525,000 for new housing rebate will ensure that purchasers of homes up to $525,000 will pay no more tax on their
homes than under the previous GST System. A maximum rebate ($26,250) will apply to new homes priced above this level.• For home buyers purchasing resale product the increased costs will appear in the form of higher taxes on the services required to
complete these transactions (i.e.: appraisals, realtor commissions, home inspections).• In the case of home renovations, the tax will also increase from 5% to 12%.• Generally speaking the HST will increase the cost of buying and selling property, both new and resale, but it will have a much greater
impact on purchasers of newly constructed homes.• In the case of owner built housing the value of the rebate available will be dependent on whether HST is paid on the land purchase.• In the case of single family home construction after July 1, 2010 (by a builder for example), residing in the home as a principle residence
for one year prior to selling will require disclosure to Canada Revenue Agency as to the buyer’s relation to the builder (no opportunity toescape the HST).
• Generally speaking the transition to the HST application will have a noted impact over the short term because of the marked differencebetween buying and selling from June 30, 2010 to July 1, 2010. Over time these costs will become part of doing business and thoughthey may become a significant factor of the cooling of the real estate market in the short term (i.e. 1 year) the longer term impact will bean adjustment by all in the real estate market to the HST applications.
17District of Mission – Housing Market Status Urban Analytics Inc.

B. District of Mission & Fraser Valley Regional District Economic Fundamentals/Indicators
This section of the report provides a summary of relevant data and analysis related to the prevailing economic conditions in the Fraser ValleyRegional District (FVRD) and The District of Mission (DM).
I. Migration
The majority of immigrants choosing to land in BC settle in the province’s larger centres in the Lower Mainland. These larger centres providemore employment opportunities for individuals of varying skill levels and language abilities and offer a variety of support systems and servicesaimed at speeding up the adjustment and transition process. For those of ethnic or cultural minorities, established cultural communities inthese larger centres assist immigrants with their transition.
In 2007, Abbotsford recorded a 56.6% employment rate among immigrants. This is higher than the provincial level of 55.6% but lower thanVancouver at 57.8%. Among immigrants coming to BC, about 91% settle in the Metro Vancouver. In 2007, while BC accepted 16.5% of allimmigrants to Canada, Vancouver alone accounted for 14.5% of the national total.
Between 2007 and 2008 the Fraser Valley Regional District (FVRD) had the highest level of intra ‐provincial migration with 1,566 new residents tothe area. As a comparison Greater Vancouver lost 5,948 residents to other parts of the province.
A total of 92,802 British Columbians relocated to a different regional district in 2007 and 2008. Of British Columbia’s Regional Districts, elevenwere net sources of intra ‐ provincial migrants, and 17 were net destinations. The top net gainer of intra ‐ provincial migrants was the Fraser ValleyRegional District, which includes the municipalities of Abbotsford, Mission, Chilliwack, Hope etc. The highest net gain of individuals over the ageof 65 was in the FVRD, where inflows of 947 persons resulted in a net increase of 285 persons in this age group.
18District of Mission – Housing Market Status Urban Analytics Inc.
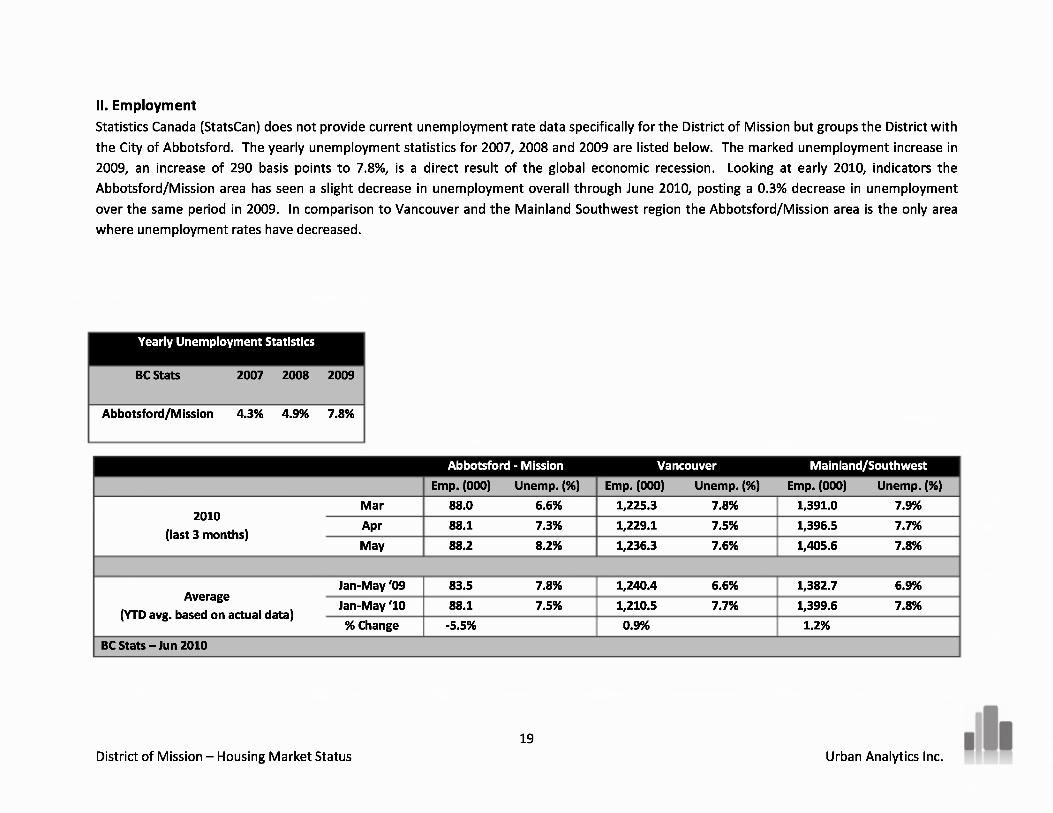
II. EmploymentStatistics Canada (StatsCan) does not provide current unemployment rate data specifically for the District of Mission but groups the District withthe City of Abbotsford. The yearly unemployment statistics for 2007, 2008 and 2009 are listed below. The marked unemployment increase in2009, an increase of 290 basis points to 7.8%, is a direct result of the global economic recession. Looking at early 2010, indicators theAbbotsford/Mission area has seen a slight decrease in unemployment overall through June 2010, posting a 0.3% decrease in unemploymentover the same period in 2009. In comparison to Vancouver and the Mainland Southwest region the Abbotsford/Mission area is the only areawhere unemployment rates have decreased.
Yearly Unemployment Statistics
BC Stats 2007 2008 2009
Abbotsford/Mission 4.3% 4.9% 7.8%
Abbotsford - Mission Vancouver Mainland/SouthwestEmp. (000) Unemp. (%) Emp. (000) Unemp. (%) Emp. (000) Unemp. (%)
2010(last 3 months)
Mar 88.0 6.6% 1,225.3 7.8% 1,391.0 7.9%Apr 88.1 7.3% 1,229.1 7.5% 1,396.5 7.7%May 88.2 8.2% 1,236.3 7.6% 1,405.6 7.8%
Average(YTD avg. based on actual data)
Jan-May‘09 83.5 7.8% 1,240.4 6.6% 1,382.7 6.9%Jan-May‘10 88.1 7.5% 1,210.5 7.7% 1,399.6 7.8%
% Change -5.5% 0.9% 1.2%BC Stats – Jun 2010
19District of Mission – Housing Market Status Urban Analytics Inc.
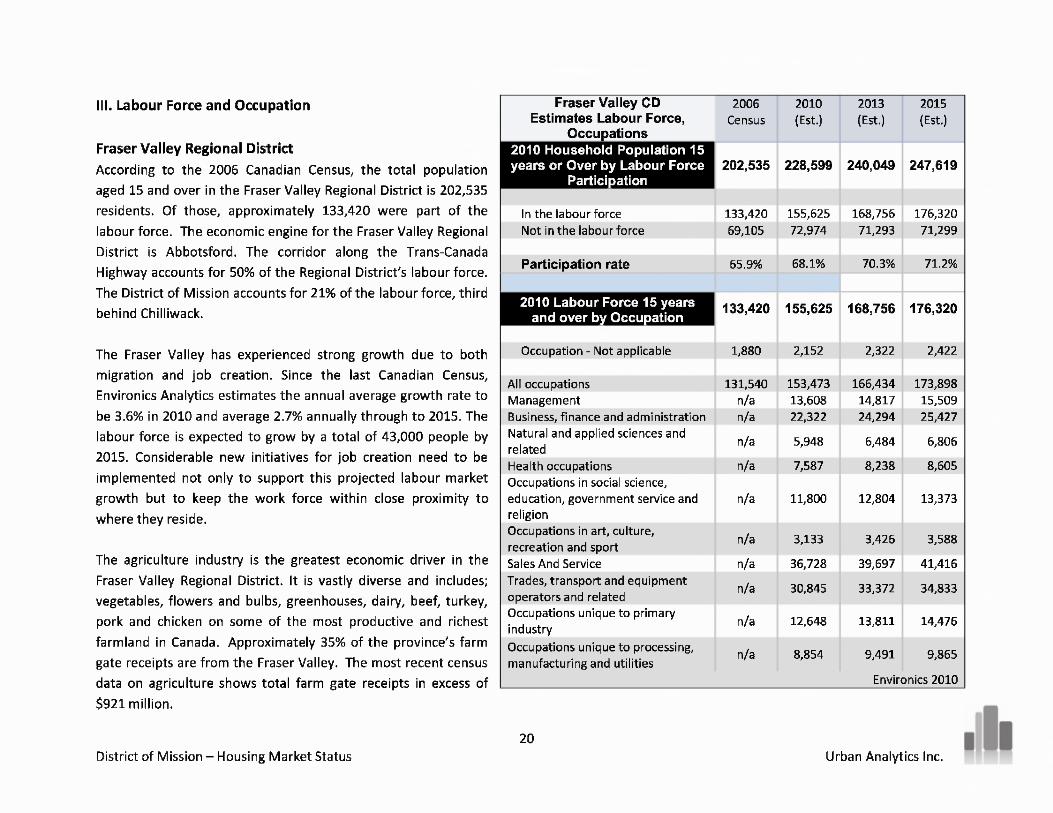
2010(Est.)
228,599
2013(Est.)
240,049
2015(Est.)
247,619
2006Census
202,535
Fraser Valley CDEstimates Labour Force,
Occupations2010 Household Population 15years or Over by Labour Force
Participation
In the labour force 133,420 155,625 168,756 176,32069,105 72,974 71,293 71,299Not in the labour force
65.9% 68.1% 70.3% 71.2%Participation rate
155,625 168,756 176,320133,4202010 Labour Force 15 yearsand over by Occupation
1,880 2,152 2,322 2,422Occupation ‐ Not applicable
131,540 153,473 166,434 173,898All occupationsManagement n/a 13,608 14,817 15,509
n/a 22,322 24,294 25,427Business, finance and administration
n/a 7,587 8,238 8,605Health occupationsOccupations in social science,education, government service andreligion
n/a 11,800 12,804 13,373
n/a 3,133 3,426 3,588Occupations in art, culture,recreation and sportSales And Service n/a 36,728 39,697 41,416
n/a 30,845 33,372 34,833Trades, transport and equipmentoperators and related
n/a 13,811 14,47612,648Occupations unique to primaryindustry
Natural and applied sciences andrelated
Occupations unique to processing,manufacturing and utilities
Environics 2010
n/a 5,948 6,8066,484
n/a 9,4918,854 9,865
20District of Mission – Housing Market Status Urban Analytics Inc.
III. Labour Force and Occupation
Fraser Valley Regional DistrictAccording to the 2006 Canadian Census, the total populationaged 15 and over in the Fraser Valley Regional District is 202,535residents. Of those, approximately 133,420 were part of thelabour force. The economic engine for the Fraser Valley RegionalDistrict is Abbotsford. The corridor along the Trans ‐ CanadaHighway accounts for 50% of the Regional District’s labour force.The District of Mission accounts for 21% of the labour force, thirdbehind Chilliwack.
The Fraser Valley has experienced strong growth due to bothmigration and job creation. Since the last Canadian Census,Environics Analytics estimates the annual average growth rate tobe 3.6% in 2010 and average 2.7% annually through to 2015. Thelabour force is expected to grow by a total of 43,000 people by2015. Considerable new initiatives for job creation need to beimplemented not only to support this projected labour marketgrowth but to keep the work force within close proximity towhere they reside.
The agriculture industry is the greatest economic driver in theFraser Valley Regional District. It is vastly diverse and includes;vegetables, flowers and bulbs, greenhouses, dairy, beef, turkey,pork and chicken on some of the most productive and richestfarmland in Canada. Approximately 35% of the province’s farmgate receipts are from the Fraser Valley. The most recent censusdata on agriculture shows total farm gate receipts in excess of$921 million.

District of MissionAccording to the 2006 Canadian Census, the total populationaged 15 and over in Mission was 27,530 residents. Of those,approximately 18,345 were part of the labour force. Mission’sunemployment rate has been traditionally higher than that ofMetro Vancouver. In 2006, this spread was wider than inprevious census years (5.6% vs. 4.4% ‐ Vancouver, and 4.8% ‐ BC)due to the cyclical nature of forestry and agriculture.
Mission has been one of the fastest growing communities inBritish Columbia, however, with this growth, Mission has notachieved a balance between residential andindustrial/commercial growth. In fact, more than 65% ofMission’s local labour force commutes outside the communityfor employment and with little growth in employment relatedindustries this type of activity is projected to continue for theforeseeable future. Moving forward it is unrealistic based on theurban sprawl of the GVRD that residents are expected to workwithin their community.
A brighter outlook for employment opportunities combined withcontinued population growth will support housing demand in theFraser Valley Region in the future. According to EnvironicsAnalytics, Mission’s labour force in 2010 grew at an annual rateof 3.8% since the 2006 Canadian Census and is estimated to beover 21,500 residents. By 2015 the labour force is expected togrow by over 6,700 residents (since the 2006 Canadian Census)to a labour force of over 24,500 strong.
EstimatesLabour Force, Occupations
2006Census
2010(Est.)
2013(Est.)
2015(Est.)
2010 Household Population 15years or Over by Labour Force
Participation27,530 30,973 33,081 34,465
In the labour force 18,345 21,694 23,839 25,114Not in the labour force 8,545 9,279 9,242 9,351
Participation rate 68.2% 70.0% 72.1% 72.9%
2010 Labour Force 15 years andover by Occupation 18,345 21,694 23,839 25,114
Occupation ‐ Not applicable 265 304 332 350
All occupations 18,085 21,390 23,507 24,764Management na 1,785 1,955 2,056Business, finance and administration na 2,938 3,250 3,432Natural and applied sciences and related na 957 1,062 1,130Health occupations na 1,183 1,292 1,352Occupations in social science, education,government service and religion
na 1,648 1,791 1,870
Occupations in art, culture, recreationand sport
na 554 618 656
Sales And Service na 5,119 5,608 5,901Trades, transport and equipmentoperators and related
na 4,830 5,293 5,571
Occupations unique to primary industry na 889 994 1,057Occupations unique to processing,manufacturing and utilities
na 1,487 1,644 1,739
Environics 2010
21District of Mission – Housing Market Status Urban Analytics Inc.

IV. Benchmark Housing PriceThe benchmark housing price for Mission is available only for single family detached homes due to the historically limited supply of various otherproduct types in the area. The benchmark price for single family detached homes in Mission increased from $169,930 in Dec 1999 to $385,872 atthe recent market peak in April 2008; an approximate 127% increase. However, since the April 2008 market peak, the benchmark price for June2010 has decreased 21% to $350,074.
In contrast, the average benchmark price in Abbotsford peaked in June of this year at $446,410. Overall, the benchmark price in Abbotsfordincreased by 135% versus 106% in Mission. Since 2007 the spread in benchmark price between Abbotsford and Mission was 14.3% thoughcurrently there is a 21.5% differential in the benchmark price for detached homes between the two markets.
Note: Benchmark Price is the estimated sale price of benchmark property. Benchmarks represent a typical property within each market. Typical homes are defined by theaverage home features sold in each of the FVRD communities. These feature together become the benchmark house in a given area.
22District of Mission – Housing Market Status Urban Analytics Inc.

V. Housing Starts
In the following two sections of the study, a Comparable Region (Region) was used to benchmark the District of Mission to its neighbouringcommunities. Unless stated otherwise the Region includes: Mission(DM), Abbotsford, Chilliwack, and Maple Ridge. Any referencemade to Fraser Valley Regional District (FVRD) includes all areas ofthe FVRD but excludes Maple Ridge, which is part of the GVRD.
How Does Mission Compare?The Region has averaged over 2,300 housing starts per year since1982. Peak activity in the Region occurred after Expo 86 when realestate in the lower mainland gained an enormous boost frominfrastructure spending, international exposure and propertydevelopment. Tourism increased as Vancouver became aninternational city and thus began the upward spiral of propertyprices and sales in the Vancouver and Lower Mainland real estatemarkets. According to a February 11, 2009 article in The Globe andMail, “prices of land around the initial Sky Train stations rose 628%in the decade that followed Expo 86.” In the seven years followingExpo 86’ the Region averaged over 3,400 housing starts per year ‐this has yet to be duplicated again in this Comparable Region.
2000 2001 2Mission
AbbotsfordChilliwack
Maple Ridge 357 444 6
District of Mission – Housing Market Status
Mission accounts for a small portion of new housing starts in theRegion. Since 1982, 5,500 homes, predominantly singleFamily, were built. This equatesto an average of about 190homes per year since 1982.In comparison Abbotsford hasaveraged over 945 starts peryear, while Maple Ridge
309181
86298264
112
482

averaged over 600 starts per year during the same period. The highest volume of new home starts in Mission took place from 1989 to 1993(Expo effect) when over 300 homes were started each year. In total over 1,800 new homes were built in Mission during this five year period,peaking in 1991 with 398 starts. The only other year where over 300 housing starts were recorded was in 2004 (361 starts).
While most comparable communities experienced a boom in construction activity in the last decade, Mission’s housing starts were relatively flatin comparison. During the past decade, a significant portion of new housing starts in comparable communities occurred in the multi ‐familysector while in Mission single family homes continue to dominate the new residential construction landscape.
Mission have a much lower proportion of non ‐Caucasians (discussed later in the study) compared to its comparable neighbours and as suchmany of these new immigrants established themselves in communities where there was an immediate familiarity (culturally) with the localresidents. The exception is Maple Ridge where the majority of its boom was in anticipation of the Golden Ears Bridge to allow commuters easieraccess to the Fraser Valley.
Where are we today?• The lack of housing starts in 2009 is a reflection of the drastic reduction in demand for new housing, due primarily to the global
economic crisis. Outlying areas were most affected and are traditionally the last to recover.• The volume of new construction in the FVRD has increased considerably in the first quarter of 2010. Housing starts were up 128% over
the same period last year.• British Columbia housing starts statistics show drastic strengthening of the new housing market in 2010. New home construction in BC
picked up during the first quarter as builders responded to increased homeownership demand. Foundations were poured for 5,337 newhomes during the first quarter of 2010, compared to 2,522 housing starts in the first quarter of 2009. (Source: CMHC)
• Single detached construction continued to be favoured in the region with 100% of the housing starts in Mission in 2010 concentratedsolely on this type of housing.
• CMHC predicts housing starts in the Abbotsford/Mission CMA will increase in 2010 and 2011, but remain below the ten year averagelevel. Improving sales of new homes have helped to reduce the stock of completed and unabsorbed new housing, prompting developersto start building again.
• There is optimism in the market as new housing starts are anticipated to increase 37% from 2009 in the Mission/Abbotsford CMA andrise a further 10% in 2011. Again, these figures are more heavily weighted to Abbotsford.
24District of Mission – Housing Market Status Urban Analytics Inc.

VI. Building PermitsBuilding Permits are an indicator of future activity while Housing Starts reflect what activity actually took place. In the District of Mission,Housing Starts closely reflect Building Permits due to the nature of the type of product built in the community. District of Mission Planningrepresentatives indicate that roughly 95% of building permits issued for single family construction is started within 30 days, and 99% of thesehomes are completed within a year of permit issuance. This is higher than other municipalities in the FVRD and GVRD. In Mission, the totalnumber of residential building permits issued peaked in 1991 with 402 permits and equalled in 2004 with 400 starts.
Since 1986 the FVRD averaged just over 2,000 starts per year, while Mission has averaged about 225 per year. Similar to housing starts, buildingpermit activity was significant from 1989 to 1994 averaging over 360 per year in Mission. This is congruent with the FVRD where the regionaveraged over 3,200 starts per year during the same time period. To compare this to the peak of the recent housing boom (in 2007), buildingpermits in the FVRD were 2,589 or 20% less than the early nineties.

As real estate has increased in value over theyears building permit revenues have alsoincreased. The value of building permits inthe FVRD peaked in 2007 at $373 million. In2009 building permit values totalled $167million, a 55% decrease from the peak of themarket. As of the end of April 2010 therewere 553 building permits issuedrepresenting $86 million in revenue. InMission, building permit values also peakedin 2007 at $69 million and then dropped to$21.5 million in 2009 – a 69% reduction fromtwo years prior. As of April 2010 buildingpermit revenues in Mission sit at $8.6 million
(45 issued), an increase of 244% over the same period last year.
Residential building permits in Mission have comprised the vast majority of all permits issued in recent years. As mentioned above, residentialbuilding permits peaked in 2007, at close to $69 million. The following are values of the other major types of building permits issued at theirrespective peaks:
• Industrial peaked in 2008 at $8.5m (12.3% of peak residential vs. 15% in the FVRD)• Commercial peaked in 2005 at $10.9m (15.8% of peak residential vs. 44% in the FVRD)
• Institutional and Gov’t peaked in 2006 at $1.1m (1.5% of peak residential vs. 34% in the FVRD)
The statistics above clearly illustrate that Mission has attracted little new commercial or government/institutional development to itscommunity. Though new industrial development has closely followed the trend in the FVRD, both commercial and government/institutional haslagged behind significantly in comparison. This statistic is alarming because for long ‐term economic sustainability, the District needs to attractand encourage all types of new investment in order to diversify its future tax base. Relying so heavily on residential development will createmore vulnerability to the housing market volatility in future years.
26District of Mission – Housing Market Status Urban Analytics Inc.

Residential Building Permits by TypeMission has maintained its relative share of new single family development in the FVRD with single family building permits historicallyrepresenting from 15% to 20% of the total building permits issued in the FVRD. On the other hand townhomes and apartments have laggedconsiderably. The table below shows Mission’s building permit by type compared to the FVRD over the past decade.
Residential Building Permits by Type and as Percentage of AvgTotal Permits Issued in Fraser Valley RD Totals
2000 2001 2002 2003 2004 2005 2006 2007 2008 2009Mission, DM 88 105 133 258 350 161 142 210 116 95 1,658
Single Family Homes% of FVRD 15.0% 16.1% 12.2% 22.1% 27.4% 14.3% 13.1% 19.9% 17.3% 16.7% 17.9%
Mission, DM 0 0 0 0 0 0 0 51 0 0 51Townhomes
% of FVRD 0.00% 0.00% 0.00% 0.00% 0.00% 0.00% 0.00% 9.59% 0.00% 0.00% 1.88%Mission, DM 3 12 96 0 50 183 30 113 3 0 490
Apartments% of FVRD 8.3% 8.2% 23.4% 0.0% 10.6% 28.5% 2.9% 12.0% 0.3% 0.0% 10%
Mission, DM $12M $17M $26M $37M $63M $50M $30M $69M $28M $22M 353,512Total Value
% of FVRD 13.0% 16.8% 13.7% 19.5% 24.4% 17.4% 14.2% 18.5% 9.4% 13.2% 15.5%
Building Permits Benchmarked to the Comparable RegionMission represents about one third of the volume when compared to each of its neighbours over the last decade. Based on population growthover the last decade this is not surprising or out of proportion relative to its position in the Region.
Total Residential Building Permits as a Percentage to2000 2001 2002 2003 2004 2005 2006 2007 2008 2009
AvgComparable Municipalities Totals
Mission, DM Total # of Units 91 117 229 258 400 344 172 374 119 95 2,199
# of Units 319 307 832 662 602 767 1,037 731 1,073 340 6,670Abbotsford% of Abbotsford 29% 38% 28% 39% 66% 45% 17% 51% 11% 28% 33%
# of Units 186 337 437 600 962 1,028 1,290 1,336 649 429 7,254Chilliwack% of Chilliwack 49% 35% 52% 43% 42% 33% 13% 28% 18% 22% 30%
# of Units 332 334 763 509 510 484 1,234 691 427 310 5,594Maple Ridge% of Maple Ridge 27% 35% 30% 51% 78% 71% 14% 54% 28% 31% 39%
27District of Mission – Housing Market Status Urban Analytics Inc.

C. Mission Economic Development StrategyIn 2002, the District of Mission Economic Development Committee (EDC) engaged Lions Gate Consulting Inc. to assess the current economicenvironment and to recommend a strategic plan to identify strategies for encouraging and enhancing community economic development anddiversification. The report was to be used by the Economic Development Office to implement a strategy for balanced growth in the community.Five key strategic issues were identified from the findings and UAI provides a commentary to each of these strategic issues:
1. Building Capacity and Collective Action – Adequate funding needs to be available to ensure that strategic initiatives are executed in atimely manner. The strategic plan has to keep pace with rapidly growing neighbouring communities.
2. Expanding Tax Base – Evident from trends in current and historical building permits issues in the DM. The tax base has heavily shiftedto residential property class and this trend continues today, albeit there are signs that it is just starting to shift.
3. Location – Geographic location is isolated off the beaten track compared to Abbotsford, Chilliwack. Also Mission will need to clearlydefine the downtown core.
4. Commercial Market – New commercial, retail and industrial uses are being pushed outside the downtown core further diminishingthe heart of the community.
5. Diversify Local Employment – While creating jobs within the community is critical yet the DM should embrace a commuting labourforce and focus its efforts in sustainable amenities and services to enhance the residential lifestyle in Mission.
More detailed information can be found on the District of Mission website (http://www.mission.ca/wp ‐content/uploads/economic ‐development ‐strategy.pdf). Having to adjust to the socio ‐ economic impact of the resource based industries of recent years, the DM has realizedit needs to redirect its energies to its core competencies and offerings. One such competency is its potential as a tourist destination.
Tourism Expansion Strategy
The District of Mission has a significant local tourism industry because of its strategic location bordering its municipal forest. The municipalforest is an excellent recreation resource used for hiking, camping, mountain biking, and horseback riding. Mission is also a popular day tripdestination for boating and racetrack recreation enthusiasts based in the Greater Vancouver Area.
The District of Mission would ultimately like to become more of a tourism based destination in and of itself; going beyond its role as a servicecentre and day trip destination. To enhance the strength of and grow this sector will require significant investment in new attractions,infrastructure and facilities (particularly roofed accommodations) in order to attract and cater to overnight destination visitors and themoderate/recreational outdoor enthusiast. The District of Mission will need to commit to a significant increase in tourism funding from itscurrent level of approximately $20,000 for 2010 if it hopes to realize its goals for higher tourism revenues.
28District of Mission – Housing Market Status Urban Analytics Inc.

D. Major Projects Inventory
Major Projects – British Columbia
In the first quarter of 2010, BC Major Projects Inventory lists 54new proposed projects over $15 million, with available capital costestimates totalling about $3.3 billion in potential new capitalinvestment, if all projects proceed. The capital cost of all majorprojects currently under construction in BC is estimated at $61.2billion, up from $60.7 billion reported in the fourth quarter of2009.
Major Projects – Fraser Valley
Outside of major residential projects in the Fraser Valley region,various transportation/roadway improvements, commercialdevelopments as well as a few major infrastructure projects arehighlighted in the following section. For the purpose of this report,this section includes only major infrastructure projects in thedevelopment (planned and on ‐ hold) or the construction phase. Thecapital cost estimates totalling about $1.3 billion in potential newcapital investment, if all projects proceed in the Fraser Valley andMaple Ridge.
Any major residential projects are discussed in the residentialsection of the report.
29District of Mission – Housing Market Status Urban Analytics Inc.

I. Major Projects – Mission
Silver Creek Industrial Park
Solterra Development Corp. is a Delta, BC based firm that has started construction for a 39.8 acre industrial site. The property is locatedadjacent to the Fraser River, to the west of downtown Mission. The Silver Creek Industrial Business Park, with frontage to both the LougheedHighway and CP Rail, provides for 20 individual parcels ranging in area size from .76 acres to 4 acres plus. The Industrial Business Park Zone thatis applicable to the site allows for a wide range of business uses including manufacturing, assembling, service, marine and some forms of retail.From a municipal perspective, the Solterra lands represent a significant opportunity to expand the number of local employment opportunities,and to act as a catalyst for further business park development on adjacent area properties.
Solterra advertises that the Silver Creek Industrial Park, located on theLougheed Highway is less than 10 minutes from the Golden Ears Bridge. Thesite is approximately an hour’s travel time from downtown Vancouver, but isonly ten to fifteen minutes from the US Border and the expandingAbbotsford Airport. In addition, the West Coast Express Commuter RailStation is only minutes away. The Lougheed Highway and the Trans ‐ CanadaHighway via the Abbotsford ‐Mission Highway provide primary arterial routesto other lower mainland communities as well as distribution points west andeast.
The overall site has Lougheed Hwy and CP Rail frontage of approximately 1,300 feet and Fraser River frontage ofapproximately 1,400 feet (with foreshore rights). The water frontage contains depths of 27 feet with bargecapability. The sites are flat and have been partially sand ‐filled.
30District of Mission – Housing Market Status Urban Analytics Inc.

Northwest Stave River Hydroelectric ProjectCloudworks Energy is proposing 18 MW run ‐of‐ river hydroelectric projects located 45 km northwest of Mission. The project by CloudworksEnergy (Vancouver) has been approved for a BC Hydro energy purchase agreement.
Website: http://www.cloudworksenergy.com/project.php?p=2Status: ProposedFinish: UnknownEstimated Cost ($ million): $40mLast Update: Mar 2010
Alouette Generating Station RedevelopmentThe 9 MW Alouette Generating Station has been in operation since 1928. Due to its age, condition of the facility, including the fact that it doesnot meet current seismic standards, BC Hydro is contemplating rehabilitating or replacing both the powerhouse and the generating equipment.The project is in the Identification and Definition Phases and no target date or estimated cost has been established. As the estimated cost will begreater than $50 million, BC Hydro is required to go through the British Columbia Utilities Commission process.
Website: www.bchydro.com/annual report 2009/appendices/information on capital projects.html
Status: ProposedFinish: UnknownEst. Cost ($ million): over $50mLast Update: Dec 2009
31District of Mission – Housing Market Status Urban Analytics Inc.

Stave Falls Spillway Gate Upgrades
BC Hydro is proposing an upgrade of the spillway gates (controlling water released from the reservoir) of the Stave Falls dam to meet currentflood discharge reliability requirements reducing operational risks associated with the spillway gates. No additional spill capacity is being addedto the Stave Falls facility. The project is in the Identification and Definition Phases. As the estimated cost is greater than $50 million, BC Hydro isrequired to go through the British Columbia Utilities Commission process.
Website: http://www.bchydro.com/planning regulatory/projects/spillway gate reliability program.html www.bcuc.com/Documents/Proceedings/2010/DOC 25095 B ‐5 BCHydro IR 2 ‐to‐ BCUC ‐ and ‐ IR 1 ‐to‐ INTV.pd
Status: ProposedStart: 2011Finish: 2013Estimated Cost ($ million): $70mLast Update: May 2010
Ruskin Dam Seismic Improvement Project and Powerhouse Rehabilitation ProjectBC Hydro is proposing to perform seismic upgrades to Ruskin Dam, which was constructed in 1930. Currently, the dam does not meet seismicstandards and the rehabilitation will be to ensure and protect public safety in the event of an earthquake. BC Hydro’s electricity demandcontinues to grow; forecasts estimate this load to grow by approximately 25 to 40 per cent over the next 20 years and an upgraded Ruskinfacility will help ensure British Columbia is able to meet this increasing demand. As the estimated cost is greater than $50 million, BC Hydro isrequired to go through the British Columbia Utilities Commission process.
Website : http://www.bchydro.com/planning regulatory/projects/ruskin dam powerhouse upgrade.html
Status : ProposedEstimated Costs : $112m for Seismic and $175m for PowerhouseStart : 2012Finish : 2017Last Update: May 2010
32District of Mission – Housing Market Status Urban Analytics Inc.

Tim Horton’s Children’s Foundation CampThe proposed development of the Tim Horton Children’s Foundation Camp (THCF) is currently in the approvals process. It is anticipated that thedevelopment of the camp will take 3 years to complete. Upgrades to the Florence Lake Forest Service Road and bridge are required and areslated for completion in 2011. The capital improvements identified in this area are in the range of $31 million to be spent over a 10 yeartimeframe with the majority of the investment occurring in the first 3 years.
Website : http://www.timhortons.com/ca/en/difference/childrens about.html
Status : ProposedEstimated Costs : $31mStart : 2011Finish : 2045Last Update: May 2010
33District of Mission – Housing Market Status Urban Analytics Inc.

II. Major Projects – Fraser Valley Region & Maple Ridge
Abbotsford Airport Expansion ProjectInitiated and executed primarily by the City of Abbotsford, the expanded Abbotsford airportinclude a 14,000 sq ft passenger terminal, significant runway upgrades, expansion for cargo and freservices as well as helicopter repair services. A hotel feasibility process has been completed andmaster planning process is currently underway. Thirty million dollars in infrastructure funding wilprovided from the federal, provincial and municipal governments
Website: http://www.abbotsfordairport.ca/Page825.aspxStatus: ProposedStart: Spring 2011Finish: 2020Estimated Cost: $100 millionLast Update: June 2009
High Street Shopping Centre ProjectThis $200 million, 670,000 square feet commercial centre within the Mt. Lehman Interchange Arewill be one of the largest commercial and retail bases in the Lower Mainland. The High Street projehas been designed to be pedestrian friendly; transit oriented and will include 100 “park and ridspaces for patrons and employees. The new 20 ‐ acre outdoor mall portion will be called Abby Lanand will be built over two years by Shape Properties. This will be the largest mall in the Fraser Valleregion, attracting large retailers and given its location access will be convenient for LangleChilliwack and Mission residents.
Website: http://www.shapeproperties.com/project abby.htmlStatus: Construction to beginFinish: Fall 2012Estimated Cost ($ million): $200mLast Update: March 2010
34District of Mission – Housing Market Status Urban Analytics Inc.

Abbotsford Collegiate (Abbotsford Senior Secondary)Abbotsford Collegiate (2329 Crescent Way) is planning a $45 million upgrade to the existing secondary school and a 3 storey addition connectedto the existing building. Central to the project will be the new Neighbourhood Learning Centre. The rebuild is part of the province’s vision(www. neigh bourhoodlearningcentres.gov.bc.ca ,) to evolve schools into community hubs to combine education (day) and community services(night). The new Neighbourhood Learning Centre proposed uses include common space for community agencies, Fraser Health offices, computerlab, counselling and senior’s services, day care, kitchen and other office space. Therewill be a public consultation to determine the final centre uses.
Building design is by Craven Houston Powers Architects (Chilliwack)www.chparchitects.com, the designer who completed Abbotsford Middle School withextensive use of natural light and organic materials including wood and polishedconcrete. The building is aiming to be one of the first schools in BC to achieve LEEDGold standards. Design plans may include geothermal heating and capture of waterand rainfall for diversion to the school’s playing fields.
Website: http://abbotsfordcollegiate.ca/index.php?option=com content&task=view&id=126&Itemid=80Status: ProposedFinish: Aug 2012Estimated Cost ($ million): $45mLast Update: March 2010
Clearbrook Interchange ReconstructionA new overpass and interchange is being constructed over Hwy 1 at Clearbrook Road. Focus CMS was awarded the construction contract. Thetender for the final contract for the bridge over the Clearbrook Interchange closed in June 2010.
Status: ConstructionFinish: Q4 2010Estimated Cost ($ million): $25mLast Update: March 2010
35District of Mission – Housing Market Status Urban Analytics Inc.

Hemlock Valley Mountain Ski Resort Expansion (Agassiz)Berezan Management Ltd (Langley) is proposing an expansion to the Hemlock ValleyMountain Ski Resort to include additional lifts and ski runs as well as a new villagecentre, several 35 to 65 room hotels and up to 5,000 housing units. Berezan purchasedthe resort from the BC government in 2006 for $3 million. In addition, plans are todouble the 3 lift, 34 ski run facilities. The Project is still in the early planning stages andis currently under review by Fraser Valley Regional District, BC government andChehalis First Nation.
Website: http://www.berezan.ca , http://www.hemlockvalleyresort.com Status: ProposedEstimated Cost ($ million): $45mLast Update: March 2009
Chilliwack Senior Secondary Replacement
Chilliwack Senior Secondary is proposing replacement of the secondary school on the existing site. The project will expand the current 900student capacity to 1,200 student capacity. Like Abbotsford Collegiate the building is aiming to be one of the first schools in BC to achieve LEEDGold standards. The project is currently in the design stage.
Status: ProposedStart: Oct 2010Finish: Aug 2012Estimated Cost ($ million): $58 milLast Update: Mar 2010
36District of Mission – Housing Market Status Urban Analytics Inc.

Rosedale Elementary and Middle School ReplacementPlans are to replace and consolidate Rosedale Elementary and Rosedale Middle Schools into a single school with capacity for 510 students. Thisbuilding, like the other schools is designed to achieve LEED Gold standards. The consolidated Rosedale Elementary/Middle School will become aNeighbourhood Learning Centre, part of the province’s vision to evolve schools into community hubs to combine education (day) andcommunity services (night). The school will include space for full day Kindergarten. Plans include 810 square metres for day care, youth andAboriginal services and 100 square metres for community multi ‐ purpose use.
Status: ApprovedStart: Fall 2010Finish: Aug 2011Last update: June 2010
Maselpanik Creek Hydro Project
Enmax Systaris Bid Corporation is proposing a 13 MW hydroelectric project with annual energy of 60 GWh on Maselpanik Creek, south of theWahleach generating station near Chilliwack. A new transmission line will be constructed from the project powerhouse to a tie ‐ in at an existingBCTC transmission line west of Hope. The project is in the design stage.
Website: http://syntarispower.com/projects/chipmunk ‐ and ‐ maselpanik ‐ creeks Status: ProposedEstimated Cost ($ million): $35mLast Update: Dec 2009
37District of Mission – Housing Market Status Urban Analytics Inc.

Tamihi Creek Hydro ProjectKMC Power is proposing a 9.9 MW hydroelectric run ‐of‐ river project located on the Tamihi Creek tributary of Chilliwack River. This project hasbeen selected in the BC Hydro 2006 call for power with expected commissioning in September 2010. The project is registered under the federalecoENERGY for Renewable Power program.
Status: ProposedEstimated Cost ($ million): $20mLast Update: Mar 2010
Fraser Valley East ReinforcementsBC Transmission Corp is proposing construction of facilities necessary to reinforce the transmission system in the Fraser Valley East Area.Currently the project is submitted for approval with the BC Utilities Commission.
Website: http://www.bctc.com Status: ProposedStart: Fall 2011Finish: 2013Estimated Cost ($ million): $20mLast Update: Mar 2010
Maple Ridge Community Gaming Centre
The Great Canadian Gaming Corporation is proposing to build a 30,000 sq ft casino,designed to obtain LEED certification, at Lougheed Highway and 227 th Street. It iscurrently ‘on hold’ due to unfavourable market conditions. The project obtained thirdreading in July 2008.
Website : http://www.greatcanadiancasinos.com/Start : 2013Finish: 12 ‐ 18 months to completeEstimated Costs : $24mLast Updated : May 18, 2010
38District of Mission – Housing Market Status Urban Analytics Inc.

Heavy Vehicle Maintenance and Transportation Training CentreThe British Columbia Institute of Technology (BCIT) Heavy Equipment program and CMBC Fleet Overhaul have proposed a Heavy VehicleMaintenance and Transportation training Centre in Maple Ridge. The campus will become the region's centre for training and skills developmentin heavy vehicle maintenance. Due to the increasing number of vacancies for commercial transport and heavy duty mechanics in the trucking,public transit and construction sectors, this project is considered to be very important to ensure long term viability of the commercialtransportation industry. The merging of BCIT's Heavy Equipment programs and CMBC's Fleet Overhaul facility will see BC become more "self ‐sufficient" in the development of skilled trades people. A 230,000 square feet facility at 11520 ‐ 203 Street for the Coast Mountain Bus Company’soverhaul facility (relocated from Burnaby) and an adjoining 100,000 square feet training centre for BCIT students are in the design phase. Theproject will receive $50 million in provincial funding.
Website: http://www.bcit.ca/news/releases/newsrelease061306462.shtmlStart : 2010Finish: 2013Estimated Costs : $165mLast Updated : Dec 2009
39District of Mission – Housing Market Status Urban Analytics Inc.

PART TWO – Demographic/Psychographic Analyses
This section of the report summarizes the most recent demographic and psychographic information available for the population of Fraser ValleyRegional District and District of Mission. The majority of the data in this section was derived and compiled from the 2006 Canadian Census andpopulation projections from Environics Analytics. The analysis of this data is meant to provide a deeper understanding of how the population ofthe District of Mission and the surrounding region has grown, evolved and changed over the past several years, project how it will continue toevolve in future years.
Initially, UAI examined growth rates projected by British Columbia’s P.E.O.P.L.E. stats and found that the expected growth was too aggressivebased on historical trends. As a result UAI relied on projected growth rates supplied by Environics Analytics, which more closely correlatesprojections to historical population trends by Canadian Census data.
A. Population Growth TrendTogether with Abbotsford, Chilliwack, Harrison Hot Springs, Hope and several other areas, the DM is located in the Fraser Valley RegionalDistrict. As of the 2006 Census, the population of Mission was 34,505, which represents 13.4% of the FVRD total population, and is third behindAbbotsford and Chilliwack.
Canadian Census Year
Population
1986 1991 1996 2001 2006 % of Region Population DensityPerson per Sq. Km.
Population of Mission, DM 21,985 26,202 30,519 31,272 34,505 13.4% 152.8
Population of Abbotsford 65,945 86,928 105,403 115,463 123,864 48.2% 344.7
Population of Chilliwack 41,337 49,531 60,186 62,927 69,217 26.9% 266.0
Total of Fraser Valley, RD 149,744 186,163 222,397 237,550 257,031 100% 19.2
Total British Columbia 3,003,621 3,373,787 3,874,317 4,076,264 4,113,487 4.4
40District of Mission – Housing Market Status Urban Analytics Inc.

Mission’s population growth rate is expected to be higher in the comingyears due to local economic development, job creation and migration.In 2010, the population of Mission is estimated to be 38,420 it isestimated that there are 284,724 people in the FVRD. This represents anapproximate annualized growth rate of 2.8% in both regions since the last Census.
Following the last Census, Environics Analytics projects that by the year 2020, Mission’s population will be over 47,000 while in the FVRD therewill be over 336,000 residents.
Since 1991 to the last Census, Mission’s population has grown by 24% or1.6% on an annualized rate. Comparatively the FVRD grew by 21.5% or1.4% annually.
B. Population Projections
Some of the challenge with predicting future growth in Mission is theuncertainty of how rapidly new product will be introduced in theSilverdale community by GENSTAR. The introduction of this communitycould change the projections however the community is not expectedto house any significant residents for at least five to seven years.
Population Projections for Mission & FVRD
Year Mission % Change from Previous FVRD % Change from Previous
2010 38,42011.3%
( since 2006 Census)284,724 10.8%
2013 40,596 5.7% 297,554 4.5%
2015 42,187 3.9% 306,992 3.2%
2020 47,051 11.5% 336,626 9.7%
Projections by Environics Analytics
41District of Mission – Housing Market Status Urban Analytics Inc.

On a percentage basis the DM is expected to exceed the average growth of the FVRD. Mission’s population is expected to grow by 36.4% orannualized average growth rate of 2.6%. The FVRD is expected to grow by 31% or 2.1% annually. This is not surprising because over the lastdecade the majority in the growth in the valley was focused in Abbotsford and Chilliwack. Mission is just starting to realize some of the spin ‐offexperienced by its neighbours.
42District of Mission – Housing Market Status Urban Analytics Inc.

30.00%
25.00%
20.00%
15.00%
10.00%
5.00%
0.00%
28.1%
11.8%
23.0%
26.3%
10.7%
5.0%
C. Age CharacteristicsThe District of Mission has a younger average population than that of BC and the FVRD. According to the 2001 Census, 66% of Mission’spopulation is under the age of 45 compared to a provincial average of 57%. In the 2006 Census, this percentage decreased slightly to 63% whileBritish Columbia remained at 57%.
Distribution by Age - 2006 Census
0 to 19 years 20 to 29 years 30 to 44 years 45 to 64 years 65 to 74 years 75 years andover
Mission Fraser Valley British Columbia
Total Population by Age (2006 Census)
Mission Fraser Valley British Columbia
0 to 19 years 28.10% 27.20% 23.20%
20 to 29 years 11.80% 12.20% 12.40%
30 to 44 years 23.00% 20.80% 21.40%
45 to 64 years 26.30% 25.20% 28.40%
65 to 74 years 10.70% 14.60% 14.60%
75 years and over 5.00% 7.10% 7.00%
Source: BC Stats
2006Census
Median Age Median Agefor Males for Females
Mission 36.6 38.3FVRD 37.2 39.2
BC 40.0 41.5Source: BC Stats
43District of Mission – Housing Market Status Urban Analytics Inc.

In the 2006 Census, the highest percentage age bracket inMission was 19 years and younger but Environics Analyticsestimates this to shift in the coming years. Over the nextcouple of years as the traditional younger population ofMission gradually move into the workforce, EnvironicsAnalytics estimates the population percentile of person’s19 years and under will drop from 27.2% in 2006 to anestimated 25.9% in 2010. This shift is projected tocontinue until 2020 when the number of Mission residents19 years and under will sit around 22% of the totalpopulation. On the other hand, the population percentagefor all age groups 45 and older is projected to steadilyincrease throughout the next 10 years. As these two agegroups become more prominent it will increase thedemand for multi ‐family dwellings in Mission.
Similar to the District of Mission, the FVRD’s agedistribution is expected to go through some redistributionphases as indicated below by BC Stats:
Fraser Valley British ColumbiaPopulationEstimate
2009 2019(% Distribution)
2009(% Distribution)
2019(% Distribution)
0-17 years 63,676 21.8% 19.1% 17.8%18-24 years 28,210 8.0% 9.7% 7.7%25-64 years 148,089 53.8% 56.4% 55.9%
65+ year 40,235 16.4% 14.7% 18.6%Total 280,210 100% 100% 100%
Source: BC Stats
44District of Mission – Housing Market Status Urban Analytics Inc.

Immigrants in Mission by Place of Birth – 2006 Census
RecentImmigrants(2001-2006)
United States 9.0%
Eastern Asia 16.5%Southeast 9.8%
Western 11.8%Europe All Europe
Immigrants Southeast
Southern 28.6%Asia
Central 7.5%America
Eastern 9.0% United States 8.6%Europe
Southern Asia 24.1%
Eastern Asia 4.5%
Northern 24.5%Europe
Asia 10.8
Immigrants by Birth Place - 2006 CensusEasternEurope
11%
CentralAmerica
9% Southern Asia36%
U.S.A.11%
SoutheastEurope
12%
Eastern Asia21%
D. EthnicityThe majority of the population in the District of Mission is non ‐ immigrant Caucasian, comprising 82.8% of the population as indicated in the 2006Census. The population of immigrants in Mission is significantly lower than the rest of the province; 14.7% versus 27.2%. Residents withaboriginal background account for just 4.8% of the Mission population.
Total Populationby Immigrants Status
Mission Fraser Valley British Columbia
2001 2006%
Change 2001 2006%
Change2001 2006
%Change
Non-immigrant 25,875 28,595 10.5% 188,880 201,390 6.6% 2,821,870 2,904,240 2.9%
Immigrant 4,580 5,065 10.6% 43,945 50,640 15.2% 1,009,820 1,119,215 10.8%Percentage of Immigrant inTotal Population 14.7% 14.7% 14.5% 19.7% 25.8% 27.2%
Source: BC Stats
Even though Mission has a relatively lower percentage of new immigrants compared to the rest of the province, Mission’s ethnic makeup is stillvery complex. There are residents of German and Dutch descent, as well as Finns, Norwegians, Italians, Hungarians, Poles, anglicised French ‐Canadians, among others, who make up a fairly diverse ethnic population. The largest visible minority group in Mission are South Asians,primarily Indo ‐Canadians comprising 6.6% of Mission’s population. Trends indicate that ethnic diversity will continue to grow and remain asignificant characteristic of the community.
45District of Mission – Housing Market Status Urban Analytics Inc.

% Change in Household Size - 2001 to 2006
0 10 20 30 40
British Columbia
Fraser Valley,RD
Mission, DM
non ‐familyhousehold change %
multi ‐familyhousehold change %
1 ‐family householdchange %
8.3%
18.4%
6.1%
14.5%
38.7%
7.1%
21.8%
22.5%
10.9%
E. Household Size
The total number of private households in the DM is 12,185. One family households accountfor 69% of the occupied dwellings with an average size of 2.8 residents per household. This ishigher than BC’s average at 2.5 residents per household and the FVRD average of 2.7 residentsper household.
Household Characteristics – 2006 CensusMission FVRD
Total number ofprivate households 12,185 94,630
Avg. # of Person inhouseholds 2.8 2.7
One familyhouseholds 8,705 65,450
Multiple-familyhouseholds 435 3,390
Non-familyhouseholds 3,050 25,785
Source: BC Stats
46District of Mission – Housing Market Status Urban Analytics Inc.

In 2010, Environics Analytics estimates that there are 13,864 occupied private households in the DM. This is an increase of 13.8% since the 2006Canadian Census. It also estimates that the average household size has decreased from 2.83 to 2.74.
Based on population projections and age characteristics, the number of occupied households is expected to increase over the next decade toover 18,000 ‐ a 49% increase from the 2006 Census. In 2020, it estimated the average household size will decrease to 2.56 persons per occupiedprivate household.
UAI also expects the average household size to decrease over the next ten years as the community structure shifts toward more multi ‐familydwellings as the younger population ages and intra ‐ provincial migration attracts those looking for more affordable housing options.
Trend:Households and Dwellings
District of Mission
2010Estimate
% 2013Projection
% 2015Projection
% 2020
Projection %
Households 13,864 14,972 15,794 18,148Growth 8.0% 5.5% 14.9%
Households by Size of Household 13,900 15,000 15,800 Over 18,000
1 person 2,937 21.2% 3,146 21.0% 3,306 20.9% 3,751 20.7%2 persons 4,355 31.4% 4,708 31.4% 4,973 31.5% 5,745 31.7%3 persons 2,318 16.7% 2,491 16.6% 2,625 16.6% 2,987 16.5%4 - 5 persons 3,567 25.7% 3,877 25.9% 4,099 26.0% 4,749 26.2%6 or more persons 687 5.0% 750 5.0% 791 5.0% 916 5.0%
Persons in Households 37,928 40,065 41,633 46,419Persons per household 2.74 2.68 2.64 2.56
Projections from Environics Analytics
47District of Mission – Housing Market Status Urban Analytics Inc.

F. Home OwnershipBased on the 2006 Census, 76.4% of the 12,185 dwellings in TheDistrict of Mission are owner occupied versus rented. This is 8%higher than BC’s average, and 2% higher than the average in theFraser Valley Regional District. Based on Environics Analyticsprojections, home ownership rates in Mission are anticipated toremain steady with only a slight increase by the end of the decade to78.4% in 2020.
This can undoubtedly be attributed to the increased unaffordabilityfor many families in the GVRD, pushing families to look further eastfor more affordable housing options. Also, Mission allows families toown a generously sized single family detached home for less thanwhat a two bedroom condominium would cost to own in Burnaby orRichmond.
Estimated Home Ownership in Mission
2010Estimate
2015Estimate
2020Estimate
%
Dwellings byTenure 13,900 15,800 Est. 18,500
Owned 10,700 77.1% 12,300 77.7% Est. 14,000 78.5%Rented 3,160 22.9% 3,500 22.3% Est. 4,000 21.6%
Source: Environics Analytics
48District of Mission – Housing Market Status Urban Analytics Inc.
.

22.2%
2.3%
4.6%
8.5% 9.1%
Family Income Distribution (%)2006 Census
10.1% 9.5% 9.5% 10.1%
7.8%6.3%
2006 Census Mission,DM
Fraser Valley, RD British Columbia
Median total Income $24,679 $23,363 $24,867
After-tax totalIncome $22,799 $21,660 $22,785
Average Family totalincome
$65,923 $61,934 $65,787
G. IncomesAccording to the 2006 Census, the median total income in 2005 forthe District of Mission was $24,679 which was higher than the mediantotal income in the Fraser Valley ($23,363) and only $188 less thanBC’s median total income of $24,879.
Over 22% of households in the District of Mission have a householdincome greater than $100,000. This is lower than Metro Vancouver at25%, but higher than the Fraser Valley Regional District’s average of20.0%.
Since the 2006 Census the average household income in the DM is projected to rise to $77,691 in 2010 and $99,929 by 2015. In 2010 it isestimated that close to 24% of households earn greater than $100,000. This can be attributed to the continued shift in the demographic andpsychographic make ‐ up of the DM; more residents and households comprised of professionals choosing to live in the area and commute to jobsoutside the DM. The shift in the local economy towards higher ‐ paying, knowledge ‐ based industries will also contribute to the higher householdincomes.
2010 Estimates and ProjectionsIncome Trends
Average Household Income Mission %Change
2010 estimated $77,691 17.9%(from 2006)
2013 projected $90,647 16.7%2015 projected $99,929 12.4%2020 projected $120,772 20.9%
Source: Environics Analytics
49District of Mission – Housing Market Status Urban Analytics Inc.

Fraser Valley
Mission
Bachelor's degree
University certificate, diploma or degree
Cellege, CEGEP or other cert. or diploma
8.1%7.5%
18.8%15.8%
18.9%19.4%
14.6%Apprnticeshiop/trades certificate or deploma
High school certificate of equvalent
16.8%
17.3%No certificate, diploma or degree
17.1%
30.4%
30.9%
H. Education/OccupationMission has historically been a resource based community for most of its existence. The area has attracted labourers to work in farming,forestry, logging, pulp and fishing industries and as a result, the proportion of residents between the ages of 25 and 64 with a Universitydiploma/degree has traditionally been low relative to those residents with only a high school diploma or no diploma at all. The recent shift to amore knowledge ‐ based economy has resulted in a greater proportion of residents having a University or College education.
Based on 2006 Census Data Mission Fraser Valley
2001 2006 % Change 2001 2006 % Change
Total Population of 25 to 64 years 16,195 18,460 15.1% 118,555 131,715 11.10%
No certificate, diploma or degree 4,570 3,180 ‐30.0% 33,895 22,825 ‐32.70%
High school certificate of equivalent 3,774 5,760 52.6% 27,495 40,035 45.60%Apprenticeship/trades certificate or diploma 2,760 3,130 13.4% 17,855 19,190 7.50%
College, CEGEP or other cert. or diploma 3,140 3,620 15.3% 21,570 24,905 15.50%University certificate, diploma or degree 1,970 2,940 49.2% 17,740 24,760 39.60%
Bachelor's degree 890 1,395 56.7% 8,490 10,720 26.30%
Highest Level of Education - 2006 CensusThe 2006 Census data illustrates thatMission is similar to FVRD and BC wherethere was about a 30% decrease in thosewith the ‘no certificate’, diploma from2001 to 2006.
50District of Mission – Housing Market Status Urban Analytics Inc.

G. Mobility
Of the nearly the 46% of Mission residents who moved from their primary home in the five years leading up to 2006, about 79% moved fromanother BC community. The table below also illustrates the growing prominence of immigrants since 2001. As the local economy continues itsshift to more locally based tourism and knowledge ‐oriented industries, and as accessibility between Mission and Metro Vancouver improves,thereby attracting more residents to the community, Mission can anticipate more positive migration to the area.
Mobility Status Over 5 Year Period2006 % 2001 %
Total 33,460 100.0% 30,290 100.0%Non-Moves 28,050 83.8% 25,985 85.6%Moves 5,415 16.2% 4,305 14.2%
Non-Migrants 2,930 8.8% 2,165 7.1%Migrants 2,485 7.4% 2,140 6.8%
Internal Migrants 2,255 6.7% 1,935 6.3%Intra-Provincial Migrants 1,965 5.9% 1,725 5.7%Inter-Provincial Migrants 290 0.9% 215 0.7%
External Migrants 230 0.7% 200 0.7%Source: BC Stats – 2006 Census
51District of Mission – Housing Market Status Urban Analytics Inc.

-2.8% -2.5%-2.5%
25%21.9%
18.2%19.1%
12.7%
8.1%
20%
15%
10%
5%
0%
-5%
14.6%
9.2%9.8%
7.4%
Mission % change Fraser Valley %change BC %change
PART THREE – Community Structure
A. Primary Employers / IndustriesAs the third largest District in the region, Mission has generally adjusted well to the economic changes in the Fraser Valley Regional District.Mission’s traditional forestry, hydroelectricity and agriculture sectors have provided a sound foundation for varied related retail and serviceactivities.
Mission FVRD BC2001 2006 % change 2001 2006 %change 2001 2006 %change
Labour force (15+ yr.) 15,520 18,350 18.2% 118,350 133,420 12.7% 2,059,950 2,226,380 8.1%Employees 13,225 15,755 19.1% 98,590 112,970 14.6% 1,715,600 1,873,050 9.2%Self-employed 1,870 2,280 21.9% 16,460 18,076 9.8% 291,455 313,000 7.4%Unemployment rate 8.1% 5.6% -2.5% 8.6% 5.8% ‐ 2.8% 8.50% 6.0% ‐ 2.5%
Source: BC Stats – 2006 Census
Over the past few years, transportation improvementshave enabled the manufacturing sector to expand beyondsawing and food processing to sales and services; trade;transport and equipment; business, finance andadministrations. These industries offer a wide variety ofopportunities for residents with many high paying jobs.Of the total workforce population of 18,435 (15+ yr.),17,315 are employed (94.4%); 1,035 are unemployed(5.6%) compared to BC’s unemployment rate of 6.0% ofthat time.
Labour force (15+ yr) employees self-employed unemployment rate
52District of Mission – Housing Market Status Urban Analytics Inc.

The major employers for the District of Mission are various manufacturing firms (as listed in the following table); large retail stores (CanadianTire, London Drugs, Fraser Valley Building Supplies, Real Canadian Superstore, Shoppers Drug Mart, Save on Foods and Sears Canada etc.);accommodation & food service (ABC Restaurant, Boston Pizza, McDonalds, Mission Springs Brew Pub, Spurs, Subway, White Spot etc.);education (School District 75, University of the Fraser Valley, Mission Community Skills Centre etc.); tourism (Bellevue Hotel & Lounge, BestWestern Mission City Lodge, Mission Raceway Park, Power House at Stave Falls etc.); government & public administrations (CFDC North Fraser,Corrections Canada, District of Mission, Mission Memorial Hospital).
Manufacturing plays an important role in Mission. There are more than 60 manufacturing companies in Mission employing over 4,000 people.The following is a list of major manufacturing players in the District of Mission.
Major Employers
Company Name
in Manufacturing Industry
Main Products or ServiceInterwrap Industry packing materials
Rayburn Yachts YachtsAcri ‐Tec Acrylic bath & kitchen fixtures
BC Frozen Foods Frozen fruits and VegetablesAnglo American Cedar Cedar shakes and shingles
Archgard Gas, wood and pellet stovesSteelhead Marine Yacht cranes
VIP Soap Biodegradable soaps & detergentsFive Star Packaging Corrugated boxesThe Clarke Group Cedar shakes and shinglesCimtex Industries Precision machined components
RW Cabinets CabinetsVerbeek Pallet Wood Pallets and Skids
Source: District of Mission
Number of Firms by Employment Size Range for Abbotsford /Mission CMA
1 to 19 20 to 49 50 to 199 200 Plus
2008 5,239 437 206 27
2009 5,391 414 211 26
Source: BC Stats
BC Stats indicates the majority of employers in the Mission /Abbotsford CMA area have fewer than 19 employees.
53District of Mission – Housing Market Status Urban Analytics Inc.

B. Employee Mobility
As of the 2006 Census, Mission has a total labour force of 12,855 who have a usual place to work. 65% of this labour force commutes outside ofthe community for employment.
Employee Mobility from 2006 Census
Total employer labour force 15 and over 17,310
Mission
100%
BC
100%
Have usual place of work 12,855 74.1% 77.2%
In census subdivision of residents 4,600 26.6% 37.6%
In different census subdivision 8,240 47.6% 39.6%
In same census division 3,195 18.5% 35.7%
At home 1,250 7.2% 9.0%
Outside Canada 50 0.3% 0.7%
No fixed workplace address 3,180 18.4% 13.1%
City Distance TimeAbbotsford 10 km 11 min
Maple Ridge 28 km 28 min
Pitt Meadows 37 km 34 min
Port Coquitlam 40 km 36 min
Langley 33 km 37 min
Chilliwack 44 km 37 min
Port Moody 47 km 42 min
Surrey 63 km 49 min
Coquitlam 52 km 50 min
Harrison Hot Springs 55 km 51 min
New Westminster 68 km 54 min
White Rock 54 km 56 min
Burnaby 75 km 1 hr.
Hope 93 km 1 hr. 3 min
Vancouver 69 km 1 hr. 5 min
North Vancouver 70 km 1 hr. 6 min
Delta 66 km 1 hr. 8 min
West Vancouver 77 km 1 hr. 10 min
54District of Mission – Housing Market Status Urban Analytics Inc.

The following table is the Environics Analytics forecast of Mission’s employee mobility for the coming years. It is clear that no significant shifts inmobility are anticipated and vehicle transport will continue to be the primary mode of transportation for most Mission residents between thehome and workplace.
Mode of Transportationto Work 2010 2013 2015
18,792 %base 20,579 %base 21,639 %baseCar as driver 16,127 85.8% 17,681 85.9% 18,600 86.0%Car as passenger 1,400 7.4% 1,530 7.4% 1,608 7.4%Public transit 586 3.1% 625 3.0% 648 3.0%Walked 407 2.2% 451 2.2% 479 2.2%
Source: Environics Analytics
C. Current Housing Stock
There are a total of 12,185 dwellings in Mission compared to 94,625 in the Fraser Valley Regional District. The current housing stock in FraserValley and the Mission area is largely reflective of the various building peaks that have occurred over the years. Until newer development beganto occur earlier this decade, the community was predominantly composed of dwellings that were constructed between 1971 and 1980. Beloware some of the key characteristics of the current housing stock:
• Nearly 27% of the existing housing stock in the DM was constructed between 1971 and 1980;• It is evident that the Mission area contained a higher proportion of dwellings constructed during 1971 ‐ 1980 period than the rest of
the Fraser Valley and the province;• The next significant period of housing construction occurred as a result of the Expo effect from 1991 to 1995, where 13.1% of
housing stock was constructed;• Mission and the FVRD have a notably higher proportion of homes (built after 1980s) than the provincial average;• With the combined potential developable land in Cedar Valley and Silverdale Residential Area, nearly 170,000 square feet of land
supply is expected to be approved for additional residential development. The relative percentage of newly constructed homeswill continue to make up larger proportions of the existing housing stock.
55District of Mission – Housing Market Status Urban Analytics Inc.

70%
60%
50%
40%
30%
20%
10%
0%
57%
Housing Stock by Type
MissionFraser ValleyBritish Columbia
18%13%
11% 9%8%2%
1%2%3% 4%
0% 0% 1% 3%
70%
Mission, FVRD, and BC - Age of Dwelling Structure
13.1%
Britishi Columbia
Fraser Valley
Mission
2006 Census
26.9%
2001 to 2006
1996 to 2000
1991 to 1995
1986 to 1990
1981 to 1985
1971 to 1980
1961 to 1970
1946 to 1960
Pre 1946
0% 5% 10% 15% 20% 25% 30%
Examining the housing stock by structural type the following basicfundamentals were identified;
• The distribution of housing in the FVRD by structural typeis dominated by single ‐detached homes, which account for56.5% of all private dwellings in the area and which ismarkedly higher relative to the provincial average at 49%;
• The second largest portion of structure type within theFraser Valley region is apartment buildings under fivestoreys (17.9%).
• The District of Mission has a significantly higher percentageof single detached homes at 69.6% of all private dwellingsin the area;
56District of Mission – Housing Market Status Urban Analytics Inc.

• The second largest structure type in Mission is Apartment ‐Duplexes which accounts for 13.4% of all private dwellings. Themajority of this product comprises a single detached homewith a primary residence and an attached secondary suite witha separate private entrance.
• There has been a slow move towards providing a range ofhousing choices that includes multi ‐family residential units inthe Mission area. During the early to mid ‐ 1980s, less than 100multi ‐family residential dwellings were built in Mission. By2006, the housing stock contained 1,200 apartments,representing 9.8% of the total housing stock.
• There are only 480 townhomes in Mission which representsonly 3.9% of the total housing stock.
Dwelling Structure Mission Fraser ValleySingle-detached house 8,480 53,460
semi-detached house 290 2,785
Row house 480 7,345
Apartment, duplex 1,635 10,230
Apt. with 5 or more storeys 70 1,375
Apt. under 5 storeys 1,130 16,950
Other single-attached house 30 140
Movable dwelling 65 2,345
Source: BC Stats
D. Community Amenities – Entertainment, Lifestyle, Amenities and Climate
Mission has approximately 1,700 hectares of municipal and non ‐ municipal parkland including neighbourhood, community and sport parks, aswell as recreational greenway, and ecological greenbelts. Throughout the municipal forest region there are many opportunities for outdoorrecreation enthusiasts with activities including hiking, mountain biking, horseback riding, boating, fishing, snowmobiling and swimming. With anabundant supply and ease of accessibility to recreational areas, open spaces, lakes, rivers, streams, rivers and trails The DM provides a widearray of opportunities for both active and passive recreational pursuits.
Arts and Culture Mission is becoming increasingly involved with the facilitation and delivery of arts and cultural services. Certain communities own and operatecultural facilities, including museums, archives, art galleries, instructional spaces, and theatres. The DM also provides arts and cultural centers tosupport various festivals and cultural activities.
57District of Mission – Housing Market Status Urban Analytics Inc.

One of the main art & culture centers in Mission is the 702 seat Clarke Theatre. Opened in 1996, the Clarke Theatre it is now owned andoperated by School District 75 as a result of local fundraising efforts.
Health Care Services: The major health care facility in Mission is the Mission Memorial Hospital, serving people in the Mission and Abbotsford area. The Fraser HealthAuthority has completed a state ‐of‐the ‐art 300 ‐ bed replacement for the former MSA acute care hospital in Abbotsford. The new hospitalprovides enhanced and specialized health services to more than 150,000 people in the area, and up to 330,000 in the Fraser Valley region. Thefacility is three times the size of the former MSA hospital, measuring approximately 60,000 square meters .
Education ‐ Schools: Public education for the residents of Mission is provided by School District 75. The School District operates 21 schools; 16 Elementary, 4Secondary, and 1 Alternative Secondary School providing education for children from grades 1 through 12. Mission operates a regional campusfor the post ‐secondary education at the University of the Fraser Valley (UCFV). The other campuses are located in Abbotsford, Chilliwack, Hopeand Agassiz. Located at Heritage Park Centre, the Mission Campus is a partnership between the District of Mission, School District 75 and theUniversity College of the Fraser Valley.
Local Recreation Facilities: The District of Mission has numerous indoor and outdoor activities that the citizens of Mission enjoy. The Mission Leisure Centre is one of themain community centers for indoor recreation. The facility includes an ice arena, curling sheets, squash courts, a fitness centre, and a swimmingpool. The Leisure Centre has undergone a major expansion with the addition of a second NHL sized ice arena, a new aquatic pool, and significantinterior renovations. The Mission Sports Park is another major municipal centre for outdoorrecreational activity, with baseball, slow pitch, softball, and soccer being the main activities. Itprovides 4 baseball diamonds; 4 soccer fields; and 2 all ‐weather soccer fields.
Library & Museum Mission is part of the Fraser Valley Regional Library system, North America’s first regional librarysystem. It currently serves more than 600,000 people, through 23 regional libraries. The Missionmuseum’s permanent displays trace the history of Mission from the first people who lived in thearea, through the arrival of Father Fouquet and his establishment of St. Mary's Mission, to thearrival of the railways and recent developments. Also featured are special displays of kitchen,
58District of Mission – Housing Market Status Urban Analytics Inc.

logging and farming artefacts from early settlers, as well as the famous Western Canada Soap Box Derby. The Museum offers a wide variety oftours targeted specifically for children, as well as material for adults.
Climate Mission is situated in the central Fraser Valley and enjoys one of Canada’s mildest climates, characterized by its warm summers, mild wintersand long frost–free growing season.
Month Jan Feb Mar Apr May Jun Jul Aug Sep Oct Nov Dec Year15.6 20.6 22.5 28 36.5 36 37.8 36.5 36 27 18.9 17.5 37.5Record high °C (°F)
(60.1) (69.1) (72.5) (82) (97.7) (97) (100) (97.7) (97) (81) (66) (63.5) (99.5)
5.1 8 10.9 14.6 17.4 19.9 23.5 23.4 20.9 14.9 8.9 6 14.5Average high °C (°F)(41.2) (46) (51.6) (58.3) (63.3) (67.8) (74.3) (74.1) (69.6) (58.8) (48) (43) (58.1)
‐0.2 1.3 2.7 4.8 7.7 10.3 12.3 12.5 10.4 6.7 3.2 0.9 6.1Average low °C (°F)(31.6) (34.3) (36.9) (40.6) (45.9) (50.5) (54.1) (54.5) (50.7) (44.1) (37.8) (33.6) (43)
‐ 14.4 ‐ 15.5 ‐ 12.2 ‐2.8 ‐2.2 2.2 4.4 5 0.6 ‐3.5 ‐ 13.3 ‐ 19.4 ‐ 19.4Record low °C (°F)(6.1) (4.1) (10) (27) (28) (36) (39.9) (41) (33.1) (25.7) (8.1) ( ‐2.9) ( ‐2.9)
217 190.7 154.6 129.7 102.5 100.6 63.6 74 77.9 141.2 252.7 260.1 1,764.5Precipitation mm (inches)(8.54) (7.508) (6.087) (5.106) (4.035) (3.961) (2.504) (2.91) (3.067) (5.559) (9.949) (10.24) (69.469)
59District of Mission – Housing Market Status Urban Analytics Inc.

PART FOUR – The Residential Housing Market
A. Fraser Valley Regional District
Like their counterparts in the more urban market areas of Metro Vancouver, housing industry stakeholders in the Fraser Valley reverted to fullsurvival mode in late 2008 and early 2009 as the global economic downturn began to take full effect and resulted in virtual paralysis of theresidential real estate market. Fortunately, very few Fraser Valley market areas had any significant amount unsold inventory of either multi orsingle family residential product. There was little concern of a significant over ‐supply of product resulting from over‐ building by developers.
The primary concern for industry stakeholders as market conditions turned for the worse during the second half of 2008 was the potential forspeculative investors who pre ‐ bought product in the frenzied lead ‐ up to the market peak to not complete their purchase. This would have beenthe only way inventories would have increased significantly during this period. Even then, the impact would have been felt in very few isolatedFraser Valley market areas such as South Surrey, the Whalley neighbourhood of Surrey, and Clayton in Cloverdale where speculators wereespecially active in the low and high ‐ rise condominium sectors. While some speculative purchasing occurred in other market areas, it was on amuch smaller scale and would have a nominal impact on overall market conditions had more than a few speculators not completed the purchaseof their investment units. In the end, the combination of the threat of legal action to force performance of the contract to purchase, andimproved market conditions in 2009 that allowed market prices to increase limited the number of speculators who did not complete theirpurchases.
The other new home market stakeholders who felt some concern over the market downturn were developers and builders who had purchasedbuilding lots or development property during the lead ‐ up to the market peak, only to see the value of those properties drop substantially in amatter of two or three months. Land speculators who had assembled potential development properties in the hopes of flipping it to a developerfor a tidy profit experienced some nervous periods as most in the development community essentially ceased the purchase of any newproperties. Those that did continue to purchase were seeking a substantial price reduction from landowners to reflect the change in marketconditions.
As it turned out, the market downturn did not last long as the combination of historic low interest rates and lower home prices attracted buyersback into the marketplace. Most of the buyers who returned to the market first were those who had been priced out of it during the lead ‐ up to
60District of Mission – Housing Market Status Urban Analytics Inc.

peak pricing and were now able to afford the home they wanted in the neighbourhood they desired. The increased demand drove resale pricingback to peak levels – in some cases surpassing those levels.
While the new home market also experienced substantially increased sales activity in the second half of 2009, values have not yet returned topre‐ peak levels. Most of the buyers who returned to the market in 2009 were end ‐ users who were seeking product they could move into in theshorter term. As such, unless a new detached or multi ‐family home was completed or nearing completion, these buyers were more likely toconsider resale product they could move into sooner.
It should also be noted that the detached home market recovered much more quickly in most Fraser Valley market areas than multi ‐familyproduct. Again, this had more to do with buyers returning to the market and taking advantage of the lower interest rates and affordable housingprices to maximize the value they were able to obtain with their purchase.
In general the residential real estate market in the Fraser Valley is as close to balanced as it has been in many years. The frantic sales pace of late2009 and early 2010 has allowed much of the pent ‐ up demand built up during the lead ‐ up to the market peak to be expended. With fewerbuyers and increased listings, the Fraser Valley market is approaching a normalized state where buyers can take some time to make a rationalbuying decision. All indicators point to the Fraser Valley residential real estate market maintaining the status quo through the end of the year.
61District of Mission – Housing Market Status Urban Analytics Inc.

B. The District of Mission
While Mission offers its residents many benefits that come with living in an urban setting – such as access to an abundance of retail and serviceamenities – in many ways, it has maintained a rural feel due to its somewhat hilly terrain that renders large areas of the communityundevelopable. The rural nature of the community is also derived from the geographical location of the community, somewhat physicallyisolated from other Fraser Valley and Metro Vancouver communities. It is at least a 20 minute drive east of Maple Ridge, and approximately thesame amount of time to access Highway #1 from the north end of the Mission ‐Abbotsford Bridge. This perceived isolation has resulted inMission developing a bit of a stigma among residents of other Fraser Valley and Metro Vancouver communities that it is a located a bit ‘outthere’ – that it’s not really part of the Fraser Valley. The physical separation by water from both Abbotsford and Maple Ridge makes Mission itsown unique community and helps it retain its small town charm as well as its perceived negative small ‐town traits.
The reality is that Mission not only offers its residents many of the sameamenities and services as most other communities in the region, just on asmaller scale, it also features easy access to most other parts of the FraserValley and Metro Vancouver. The Westcoast Express provides easy access toand from Downtown Vancouver and points in between on a daily basis. TheLougheed Highway and Highway 11 offer reasonably easy access to theRidge ‐ Meadows (Pitt Meadows and Maple Ridge) and Abbotsford areasrespectively.
Mission has suffered many of the same challenges as other resource‐ basedcommunities in BC; the closure of a number of these industries eliminatedmany of the higher paying jobs in the community, and in turn slowedMission’s growth rate dramatically. The annual average growth rate between1996 and 2001 slowed to less than half a percent. This low growth rate,combined with the fact Mission has historically found it challenging to attractnew residents from outside the community, has resulted in limited demandfor new home product in the area.
62Urban Analytics Inc.

One of the negative results of Mission being so reliant on resource sectors overthe years is that much of this industry occurred along the community’swaterfront. This industry was – and still is to some degree – very apparent toanyone driving through town. From an aesthetic perspective, the gateways toMission leave much to be desired due to the visual impact of the industrial usesthat still exist around Downtown Mission. Further, as was the case in False Creekin Vancouver up until the mid ‐ 1970’s and with other communities like Squamishwhere most of the waterfront was used by industry and blocked public access,most visitors passing through Mission have difficulty visualizing how much moreappealing Mission could be if the uses along the shores of the Fraser River weresomething other than sawmills and a race track. The current aesthetic challengesof areas bordering Downtown Mission often keep these visitors and prospectivenew residents from exploring Mission a little further and discovering theabundance of natural beauty and access to outdoor recreation opportunitiesthat would rival any other BC community.
Not surprising given the nature of the community and the fact housing here is generallymore affordable than neighbouring communities to the south and west, detached homesare the dominant housing form in Mission. People who move to Mission do so in search ofmore value for the home ‐ buying dollar. This means they are typically searching fordetached homes. Most of the demand for multi ‐family home product is generated amonglocal residents who are looking to downsize. Even with this local demand, new multi ‐family product typically takes considerably longer to sell than detached product.
Rising prices in the neighbouring Abbotsford and Ridge ‐ Meadows markets during the lead ‐up to the market peak in 2007/’08 likely resulted in increased demand for housing inMission as home ‐ buyers priced out of these neighbouring areas sought more home valuein Mission. However, it’s important to note this increased demand was driven exclusively
by end users. The Mission market area did not experience any of the investor speculation for new homes that other Metro Vancouver and FraserValley communities did.
63District of Mission – Housing Market Status Urban Analytics Inc.

Thus, while home values in Mission varied at approximately the same rate as other neighbouring communities during the region’s real estateboom and subsequent downturn, the volume of product built and sold in Mission during this period was far lower than in these other marketareas. As has occurred in these other communities, the Mission housing market has returned to being relatively balanced with most of thedemand for new and resale homes coming from existing residents.
Until Mission can either do a more effective job of selling its many physical attributes or make a concerted effort to create/attract new job ‐creating investment in the community that would in turn attract new residents to the area, the housing market will continue to be drivenprimarily by existing residents.
In spite of the market challenges recently experienced, the Mission housing market is much better positioned to meet whatever demands lieahead than it has been in the past. The District’s planning department is more demanding of the type of product it is allowing to be developedand is effectively spearheading efforts to create a plan for a much ‐ needed downtown revitalization, as well as centralizing the community byrenewing the waterfront neighbourhood. The result is an evolution of a much more sophisticated residential real estate market that will providethe community with a far more diverse housing stock in the years to come.
64District of Mission – Housing Market Status Urban Analytics Inc.

i. New Single Family Detached
Single family home construction continues to dominate the residential landscape in Mission. As the lower mainland became increasinglyunaffordable, opportunities in Mission were created – particularly for those seeking land and more affordable housing options. New singlefamily home developments marketed in Mission over the past several years have benefited from the strong market conditions. Over the lastdecade more than 1,800 new single family homes were introduced to Mission.
There were 126 new homes introduced to Mission in 2009 and to date in 2010. Prices for these homes ranged on average from $400,000 to$500,000. From the current listings of these newer homes for sale, the average asking price is $461,000 with an average size of 2,591 squarefeet. In speaking to realtors in the community they indicated many of the new prospective migrants to the region are attracted to the “mortgagehelper” option. Much of the allure of living in Mission is having the ability to own a single family home on a large lot with a “private rental suite”in the basement to assist with the mortgage.
UAI analysis of housing completions indicated that there was a gap between thenumbers of new households relative to housing completions between Census years.And this gap widened as the years have progressed. We believe some of this isattributed to many basement rental units built over the last decade not being capturedin the Districts building permit statistics. In the Housing Stock section of the report westated there were more than 1,650 Apartment Duplex dwellings which are one of twodwellings, located one above the other. If we conservatively took 50% of single familystarts over the last decade, it is estimated that there could be over 700 units notaccounted for by the District.
The two significant neighbourhoods in Mission that experienced growth over the lastdecade were Cedar Valley and the Stave Lake Road Corridor. Both brought differenttypes of buyers to their respective areas. Of the areas, Cedar Valley is more central andgenerally has smaller lots, while the Stave Lake area, specifically College Heights and Cherry Ridge provide larger lots in a more establishedcommunity.
The Cedar Valley area has a higher concentration of South Asian residents, specifically Indo ‐Canadian immigrants, while the Stave Lake Roadcorridor attracts local buyers – most of whom have lived in the community for quite some time.
65District of Mission – Housing Market Status Urban Analytics Inc.

Compact single family lots, first introduced in the Cedar Valley area, areslowly gaining acceptance with new home builders and the District tryingto attract a wider array of buyers to satisfy demand and increase densitywithout the need to introduce multi ‐family developments in suburbanareas. Builders constructing these 4,500 to 5,000 square feet lots arebuilding homes that were once found on 6,000+ square foot lots atsimilar price points.
Smaller homes in the Cedar Valley area range in size between 2,200 to3,000 square feet and range in price from $420,000 to $450,000. Largerground level basement entry homes range in size from 2,500 to 3,500square feet and are priced from $450,000 to $525,000. In comparison abasic older single family home in Mission today sells for anywhere from$330,000 to $360,000.
The Stave Lake Road corridor can be divided into two areas – CollegeHeights (Stave Lake Road to Forbes) and Cherry Ridge (Best Avenue toBlueberry Avenue). Both of these area have the strongest resalemarket in the community due to quality of life – living in an establishedcommunity; beautiful parks – close to Heritage Park overlooking thevalley; and good schools. Homes in these neighbourhoods are largerand sell for an average of $420,000 to $475,000.
UAI estimates there are between 55 to 75 new homes underconstruction or recently completed in current inventory.
66District of Mission – Housing Market Status Urban Analytics Inc.

ii. Multi-Family Development Activity
Considering the somewhat limited history of multi ‐family development in Mission, this segment of the marketplace can be best described asunder‐developed with demand driven primarily by local residents. Much of the limited new apartment and townhome projects constructedrecently have been priced too high relative to single family homes in the area to generate any significant amount of demand. As a result theprice per square foot and in some cases the average price of this new multi ‐family product exceeds those of its nearest neighbouring community‐ Abbotsford.
Over the last decade Mission has introduced fewer than 550 units of new multi ‐family residential product and no new significant multi ‐familyproduct has been introduced in Mission since 2007. What is important to note is that out of the 550 units built, 322 were non ‐ market housingused for Congregate Care or for BC Housing. In other words, market housing was limited to 218 units of which 55 are still in inventory. Thisequates to an average absorption of 16 units per year over the last decade.
At this time there are only three active multi ‐family projects selling in Mission – a three storey woodframe apartment and two townhomeprojects. All three projects, which comprise 51 townhomes and 70 apartments, are completed with remaining inventory selling through localrealtors. There are currently 11 townhomes and 44 apartments still available for sale. The townhomes are priced from $249,000 to $330,000.The apartments range in price from $279,000 to $349,000. As there is very little competition for this type of product in the District, the averageprice is high relative to older single family homes in the area.
One of the factors that would assist in increasing absorptions is ensuring that multi ‐family product designed for the proposed developmentsmeets the needs and demands of buyers looking to live in Mission. Much of the current new multi ‐family inventory in Mission remains unsoldlargely as the result of inadequate planning and design – particularly with respect to unit mix and size. The condominium product at The Mewsare challenged because the unit size and finishing specifications result in price points the market has deemed to be too high.
To summarize, historical sales rates indicate there is little, if any evidence of sufficient demand to absorb the amount of multi ‐family productcurrently proposed and contemplated in the future for Mission. However, the more of this product that is effectively designed and positioned totarget a specific and well ‐defined target market; and assuming it is appropriately priced relative to market conditions at the time of marketing,sufficient demand should be created such that absorption rates in this sector of the market will experience a substantial increase and much ofthis product will begin to attract outside residents seeking a quieter pace and more value for their home ‐ buying dollar.
67District of Mission – Housing Market Status Urban Analytics Inc.

iii. Active New Residential Development Summary
This section of the study will highlight some of the more significant residential developments recently marketed in the Mission area. Currentlyonly three new residential projects are actively selling in Mission.
Horizons at Lightbody CourtWebsite: www.mindymacpherson.com Location: Cedar Valley – 32792 Lightbody CourtDescription: Three storey, three bedroom townhomes and duplexes with
attached garages, both tandem and double available.A1: 1,527 sf $339,000 ‐ $349,000B1: 1,589 sf $290,000 ‐ $310,000B2: 1,589 sf $290,000 – $310,000C1/C2: 1,477 sf $329,000 – $339,000
Constr. Status: Complete (January 2008)No. of Units: 25No. Sold: 20 (at Jun 1, 2010)Current Inventory: 5 units from $314,500 ‐ $319,500Buyer Profile: Product target local end ‐ user who are working couples
and single restarts or empty‐ nesters.
Comments: Horizons started selling in November of 2007 and to datehas achieved an average of $214 price per square foot.Over 40% of the sales occurred in 2008 achieving $223price per square foot. These townhomes are finished withmore luxurious touches and include granite counter,hardwood floors and fireplaces. It is a gated communityat the end of a cul ‐ de‐sac with a private amenity center ina stand ‐alone building. Currently five units remain with anask price averaging $203 price per square foot.
68District of Mission – Housing Market Status Urban Analytics Inc.

Fraser Landing (Mount Baker Enterprises)
Website: www.fraserlanding.com Location: 32501 Fraser CrescentDescription: Two and three bedroom townhomes
2 Bed: 900 – 1231 sf $169,000 ‐ $279,9003 Bed: 1206 ‐ 1592 sf $220,000 ‐ $260,000
Constr. Status: Complete (May 2009)No. of Units: 26No. Sold: 20Current Inventory: 6 units from $249,900 ‐ $279,500Buyer Profile: Product targets local end ‐ users
Comments: Fraser Landing began selling in November 2008.The project started marketing during the recessionand sales in 2009 achieved $173 price per squarefoot. In 2010, sales improved with units achieving $194 price per square foot. To date the project has sold 20 units withprices averaging $182 price per square foot. Currently 6 units remain with an average ask price of $193 price per square
foot. The project is nestled on a sunny south facing slope and isjust minutes from Mission’s waterfront district. The standardfeatures include stainless appliances, laminate counters andfloors, and nine foot ceilings on the main living area. There areeight available floorplans in two and three bedroomconfiguration with a flex room on the main level which can beused as a media room, storage room or den.
69District of Mission – Housing Market Status Urban Analytics Inc.

The Mews (Derma Estates)
Website: www.themews.com Location: 33,755 7 th Avenue in MissionDescription: One and two bedroom apartments
1 Bed: 880 – 975 sf $217,000 ‐ $239,0002 Bed: 1109 ‐ 1244 sf $259,000 ‐ $405,000
Construction Status: CompleteMarketing Start: February 2007No. of Units: 70No. Sold: 26Current Inventory: 44
Buyer Profile: Primary buyers have beenlocal empty nesters whowill “lock up and go” andare looking to downsizeand be maintenance freeas they travel or spendextended periods of timeaway from the area.
Comments:Price points for this project started high and havenot been adjusted downward. Currently prices are starting at $289,000 and range up to $339,000. The developer on this project is Calgary ‐based and does not intend to adjust prices to increase sales. Amenities available include card and pool tables in an amenity lounge area andthough no fitness areas set up there is an area in the building where this can be accommodated. Unfortunately, the larger size of these unitsrequired a higher price point than most buyers were willing to pay. As a result, only 2 of 8 larger units in the building have sold. To date thebuilding has averaged $268 price per square foot with an average price point of $310,000. The remaining units are asking $267 price per squarefoot with an average price of $310,000.
70District of Mission – Housing Market Status Urban Analytics Inc.

C. Abbotsford
Abbotsford has a much more mature, diverse and active economy than the District of Mission. The area has experienced strong employmentgrowth as a result of a wide variety of employment ‐producing industries that have been located there. The growth of the Abbotsford Airport hasgenerated substantial spin ‐off investment in the community, which has created more jobs, thereby attracting new residents to the area.
Unlike other parts of the Fraser Valley and Metro Vancouver, the Abbotsford market relied primarily on the end user buyer segment to drivedemand for new housing in the area. This is not to say that investors – speculative and otherwise – were not active in the marketplace duringthe recent region ‐wide housing market boom, they just weren’t nearly as significant a factor in the Abbotsford market as they were in certainparts of Surrey, South Surrey and even Chilliwack.
As with Mission, detached homes are the dominant housing form in Abbotsford. However, there is more demand for both low ‐ rise apartmentsand townhomes than in Mission. This is largely a function of Abbotsford having a much larger population base, and as such, a greater number ofbuyers who are specifically seeking multi ‐family product.
While some high rise condominium product has been successfully developed and marketed in Abbotsford in the past, there does not seem to bean abundance of demand for it. This didn’t change during the recent housing boom as is evidenced by the failure of a couple of proposed newhigh ‐ rise developments being cancelled before construction commenced.
It is difficult to determine why greater demand for high ‐ rise condominium product hasn’t materialized over the years. One of the most likelyreasons is affordability. Most buyers of condominium product in Abbotsford are empty nesters downsizing from a larger home and entry levelbuyers purchasing their first home. Both of these buyer groups tend to be quite price ‐sensitive. As such, there is little reason for them toconsider more expensive concrete condominium product when there is such a vast selection of more affordable wood frame product.
While the amount of new home development activity in Abbotsford was generally less than many other Fraser Valley and Metro Vancouvercommunities, the area was not able to fully escape the impact of the recent market downturn. The impact was largely felt in the low ‐ risecondominium sector of the market where some developers, caught with unsold inventory when the downturn occurred were forced toimplement substantial price reductions to liquidate the product. For example, condominium product that was originally priced at over $360 persquare foot was reduced to approximately $250 per square foot in the late spring of 2009.
71District of Mission – Housing Market Status Urban Analytics Inc.

Some price adjustments of standing inventory were required in the townhome and detached home sectors of the market as well, though theywere not as significant or dramatic as in the low ‐ rise condominium sector. This was largely due to developers of this product being more able tocontrol construction progress to match market conditions.
In addition to generating significant demand for new housing from existing residents, the economic growth in the area has also helped the areaattract new residents from other parts of the Fraser Valley and Metro Vancouver. Some of the region’s larger developers have taken note of thisand have purchased large development parcels in the community, which they plan to begin construction on in the next 12 to 18 months. Themove into the community by developers such as Polygon and Onni indicates the growth in the community is expected to continue.
In spite of this new development interest from outside the area, Abbotsford is expected to remain a predominantly ground ‐oriented residentialmarket. It should be noted that much of the new residential development is occurring urban neighbourhoods, or neighbourhoods that will bedeveloped into largely urban neighbourhoods.
72District of Mission – Housing Market Status Urban Analytics Inc.

i. Abbotsford - Active New Residential Developments Summary Tables
The following tables represent active new product being marketed in Abbotsford. Currently there are 21 active projects being marketed inAbbotsford with 541 units in inventory. New apartment product in Abbotsford is averaging from $240 to $320 per square foot while townhomesrange from $160 to $240 per square foot. The majority of the product was sold at the peak of the recent market cycle in 2007 – 2008.
Apartments
New Condominium Projects - AbbotsfordProject / Address Total
UnitsTotalSold
TotalUnsold
Total Rlsd Unit Size Range(sf)
$ PSF Min Price Max Price
Abacus 90 0 90 90 454 ‐ 1,077 $290 $139,900 $289,900Brooklyn 87 0 87 87 663 ‐ 1,146 $270 $174,900 $309,900Edgebrook 73 71 2 73 635 ‐ 1,200 $248 $155,900 $284,900Gallantree 56 15 41 56 732 ‐ 985 $238 $159,900 $259,900Latitude 142 67 75 142 589 ‐ 1,021 $290 $159,900 $321,900Tamarind 188 154 34 188 456 ‐ 1,026 $298 $120,875 $286,470The Crossing 187 145 42 187 510 ‐ 1,112 $320 $133,238 $359,900Yale Crossing 56 20 36 56 735 ‐ 1,124 $290 $199,999 $354,999Totals & Averages: 879 472 407 879 $281 $155,577 $308,484
Source: Urban Analytics Inc.
Townhomes
New Townhome Projects - AbbotsfordProject / Address Total Total Total Total Rlsd Unit Size Range $ PSF Min Price Max Price
Units Sold Unsold (sf)
Argyle 95 46 17 63 1,207 ‐ 1,662 $240 $262,793 $383,435Harmony 11 8 3 11 1,210 ‐ 1,346 $179 $216,901 $250,901Ledgeview Villas 44 36 8 44 2,014 ‐ 2,364 $175 $345,000 $429,900Luna Townhomes 51 0 15 15 1,347 ‐ 3,593 $160 $299,900 $409,900Totals & Averages: 201 90 43 133 $189 $281,149 $368,534
Source: Urban Analytics Inc.
73District of Mission – Housing Market Status Urban Analytics Inc.

Single Family Detached
New Single Family Home Projects - AbbotsfordProject / Address Total
HomesTotalSold
TotalUnsold
TotalRlsd
Unit SizeRange (sf)
$ PSF Min Price Max Price
Auguston Homes ‐ Blauson Homes 12 10 2 12 1,653 ‐ 2,518 $222 $399,900 $559,048Emerald Meadows 37 0 37 37 2,100 ‐ 4,400 $161 $389,900 $1,070,551Junction Creek 50 49 1 50 1,714 ‐ 2,314 $189 $339,050 $410,000Mountain Falls 31 21 6 27 1,543 ‐ 3,925 $256 $465,000 $666,571Parkview Ridge 50 9 14 23 1,943 ‐ 4,497 $200 $499,900 $685,000Pepin Brook ‐ Azura 75 24 8 32 2,579 ‐ 4,620 $235 $605,700 $779,000Pepin Brook ‐ Morningstar Homes 150 28 14 42 2,160 ‐ 2,400 $245 $499,900 $576,900The Pines 19 9 5 14 1,914 ‐ 3,885 $206 $471,428 $689,900The Quarry 79 23 4 27 1,601 ‐ 4,031 $206 $476,190 $582,190Totals & Averages: 503 173 91 264 $213 $460,774 $668,796
Source: Urban Analytics Inc.
74District of Mission – Housing Market Status Urban Analytics Inc.

D. Maple Ridge
Maple Ridge is an interesting market in that while it is technically part of the Real Estate Board of Greater Vancouver (REBGV), it is alsoassociated with the Fraser Valley – specifically the Mission and Abbotsford areas of the Valley. Traditionally a single family market, multi ‐familyprojects have formed a greater proportion of the market as demand for multi ‐family housing has increased. Reaction to and success of theseprojects has been mixed.
The high demand for detached home product is driven by buyers from the Tri ‐Cities and other Metro Vancouver markets seeking more value fortheir home ‐ buying dollar. As a result, Maple Ridge has developed into a ‘bedroom community’ with a significant proportion of residentscommuting to work outside the community.
During the most recent market boom a greater amount of low rise condominium product was developed and this market, which was absorbedby both investors and end ‐ user buyers. Following the downturn, the activity of these two buyer groups virtually ceased, resulting in an increaseof standing inventory these new projects were completed. A traditionally conservative, end user market, Maple Ridge was slower to react to thechanging market conditions following the downturn. Once price corrections were applied, market activity picked up in 2009 as developersresponded to the new realities. The gap between MLS listings and resale statistics is narrowing as vendors slowly adjust to a changing market.
Maple Ridge suffers from some of the same stigma associated with Mission. Specifically, it is perceived by many as being somewhat isolated anddifficult to access for commuters. The completion of the Golden Ears Bridge was expected to change this perception as it would allow for mucheasier access to and from the area for commuters. However, the completion of the bridge has not yet led to the expected population andhousing demand increase.
Maple Ridge and Mission, with their similar geographical position north of the Fraser and connectivity to Highway #1 accessed only via arterialroutes are both bedroom communities to the surrounding municipalities. These similarities dictate that Mission pricing for comparable productshould also be measured against Maple Ridge product.
75District of Mission – Housing Market Status Urban Analytics Inc.

i. Maple Ridge - Active New Residential Developments Summary Tables
The following tables represent active new product being marketed in Maple Ridge. Currently there are 21 active projects being marketed inMaple Ridge with 247 units in unsold inventory. New apartment product in Maple Ridge averaged from $259 to $302 per square foot whiletownhomes are seeking an average of $190 to $245 per square foot. The majority of the product was sold at the peak of the market in 2007 –2008.
Apartments
New Condominium Projects - Maple RidgeProject / Address Total
UnitsTotalSold
TotalUnsold
Total Rlsd Unit Size Range(sf)
$ PSF Min Price Max Price
Haney's Landing 100 72 12 84 682 ‐ 1,367 $302 $189,900 $399,900Rio 106 94 7 101 682 ‐ 1,485 $272 $179,166 $359,900Solo 37 36 1 37 504 ‐ 1,031 $290 $159,900 $289,900Stonegate 108 84 24 108 1,106 ‐ 1,357 $259 $242,761 $405,900Totals & Averages: 351 286 44 330 $281 $192,932 $363,900
Source: Urban Analytics Inc.
Townhomes
New Townhome Projects - Maple RidgeProject / Address Total
UnitsTotalSold
TotalUnsold
TotalRlsd
Unit Size Range(sf)
$ PSF Min Price Max Price
Brighton 145 10 33 43 1,179 ‐ 1,610 $235 $275,900 $334,900Copperstone Ridge 29 25 4 29 1,394 ‐ 1,909 $245 $307,655 $459,900Duet 44 5 39 44 1,423 ‐ 2,385 $200 $339,050 $394,137Silver Heights Estates 31 9 7 16 1,524 ‐ 2,195 $191 $333,655 $379,900Windsong 78 63 15 78 1,528 ‐ 2,397 $210 $296,400 $569,900Trails Edge 104 78 10 88 1,619 ‐ 2,481 $243 $400,000 $519,900Totals & Averages: 431 190 108 298 $221 $325,443 $443,106
Source: Urban Analytics Inc.
76District of Mission – Housing Market Status Urban Analytics Inc.

Single Family Detached
New Single Family Home Projects - Maple RidgeProject / Address Total
HomesTotalSold
TotalUnsold
TotalRlsd
Unit Size Range (sf) $ PSF Min Price Max Price
Anderson Creek Estates 38 32 6 38 2,246 ‐ 4,265 $240 $519,000 $770,000Baker Ridge 22 11 6 17 2,274 ‐ 4,576 $206 $533,333 $799,700Blaney Heights 15 1 1 2 2,696 ‐ 3,539 $207 $623,500 $639,900Cherry Hills 34 32 2 34 1,536 ‐ 2,114 $255 $409,900 $493,194Falcon Bluff 26 19 0 19 2,527 ‐ 5,349 $220 $600,000 $898,971Falcon Hill 35 28 7 35 1,868 ‐ 2,510 $230 $436,190 $617,000Highland Vistas (Ph. 2) 45 7 8 15 2,111 ‐ 2,196 $232 $469,980 $544,980Mainstone Creek 56 23 20 43 1,640 ‐ 2,550 $242 $434,900 $539,900Silver Views 22 7 8 15 2,314 ‐ 4,302 $228 $499,523 $753,800Stoneleigh at Silver Ridge 115 34 22 56 1,809 ‐ 2,305 $266 $389,900 $659,495The Pointe 29 7 15 22 1,939 ‐ 2,448 $225 $459,282 $561,875Totals & Averages: 437 201 95 296 $232 $488,683 $661,710
Source: Urban Analytics Inc.
77District of Mission – Housing Market Status Urban Analytics Inc.

PART FIVE – Comprehensive Review of MLS Data
A comprehensive review of MLS data is an important tool in tracking historical activity in the Mission real estate market – particularly given therelative size of the community relative to other municipalities in the Lower Mainland. It is also effective in identifying any trends in themarketplace as they relate to pricing, neighbourhood appeal, product preferences and consumer confidence.
For the purposes of this study our analysis includes current active listings as of June 1, 2010 and historical sales from June 1 st, 2000 to June 1 st ,2010. Over 67,000 MLS records were used in the analysis of the Comparable Region (Region). The Region, in addition to Mission, includesAbbotsford, Chilliwack, and Maple Ridge. These communities are the most direct comparable for values and absorptions for the differentproduct types.
As noted earlier in this report, single family detached homes form the largest proportion of residential product in Mission. It is no surprise thenthat demand for this product type exceeds that of all other product types. While detached home prices in Mission have traditionally been moreaffordable relative to Abbotsford and Maple Ridge, pricing of this product in Mission has yet to increase demand for multi ‐family orientedproduct. This section of the report provides a comprehensive comparable review of MLS activity of detached single family homes, townhomes,and apartments.
78District of Mission – Housing Market Status Urban Analytics Inc.

A. Absorption – All Product Types in the Comparable Region
Since June 1, 2000 Mission has accounted for approximately 14% of all sales recorded on MLS in the region. There were 8,823 homes soldthrough the MLS compared with a total of 63,109 homes sold in the Region. On an annualized basis, Mission absorbed 882 homes per year overthe last decade. Abbotsford accounted for the greater number of sales recorded with annualized absorption of 2,685 homes per year or 43% oftotal sales.
Annual Absorption of All Product Type Sold on MLSYear Mission Abbotsford Chilliwack Maple Ridge Comparable Region
From June 1, 2000 292 764 293 583 1,9322001 632 3,306 686 1,590 6,2142002 862 2,509 789 2,005 6,1652003 1,032 2,914 998 2,153 7,0972004 1,078 2,862 1,021 1,818 6,7792005 1,152 3,138 1,122 2,206 7,6182006 1,032 3,013 1,154 2,121 7,3202007 966 3,095 1,206 2,073 7,3402008 676 2,059 658 1,310 4,7032009 784 2,335 774 1,843 5,736
YTD 2010 317 890 294 704 2,205Total 8,823 26,885 8,995 18,406 63,109
A combination of a healthy economy and the anticipation of the 2010 Winter Olympic Games drove housing prices higher across the LowerMainland. Prices began to climb a year prior to the announcement in 2003 speculative investors began placing their bets on the local market.Many buyers looking for affordable single family detached homes were forced to consider the outlying communities where prices had notclimbed as quickly as in the core markets. Mission and the Fraser Valley had the opportunity to leverage on the market boom since the majorityof its product comprised single family detached homes. In 2002, the average price of a single family detached home in Mission was $184,200which was much lower than in the suburban communities of Burnaby, Port Moody, Coquitlam and even Langley.
In the wake of the Games announcement, average monthly absorptions in the Region increased by 27% to 588 units per month. Sales from 2002through to the end of 2007 (a 6 year period) totalled 42,319 homes for an average of 7,053 homes per year. Much of this growth can also beattributed to increased consumer confidence resulting from a change in provincial governments in 2001. This stimulated business investmentand growth for both service based industries and manufacturing in the Fraser Valley. In Mission, sales over the same period increased by a
79District of Mission – Housing Market Status Urban Analytics Inc.

significant 43% to over 85 units per month. In the same six year period Mission sold over 6,122 units on MLS. Among the local sub ‐ markets,Cedar Valley experienced the highest number of absorptions from 2002 through to the end of 2007.
Since 2007 monthly absorptions in all areas of the Region have fallen with sales decreasing by 35% to 436 units per month. Even with the recentrecovery the market experienced through the second half of 2009 and into the spring of 2010, the Region did not see the same type of activity.Although the volume of sales was greater in 2009 than in 2008, the sales in 2009 were lower than any of the six years from 2002 to 2007 (withthe exception of Maple Ridge in 2004). In Mission sales were down 39% to 61 units per month since the beginning of 2008. This equates toapproximately 735 homes per year on MLS.
The real estate market in the Fraser Valley and Mission has cooled in 2010 relative to 2009. Since the beginning of the year Mission has averaged63 units per month or a total of 317 sales – primarily in the detached home sector. The number of sales experienced to date in 2010 in Missionrepresents 14% of the approximate 2,200 units sold in the Comparable Region, which is comparable to the proportionate historical average overthe last decade.
80District of Mission – Housing Market Status Urban Analytics Inc.

B. Monthly Absorption by Product Type
The average monthly absorption for detached homes, townhomes, and apartments over the last decade was 503 units per month in the Region.It is worth noting that the distribution by product type sold in the in the Region has been consistent over the last decade. Detached homes arethe predominant product sold comprising over two‐thirds of the total sales. On a municipal basis, Abbotsford leads in all categories for theComparable Region, accounting for 43% of the total monthly absorption over the last decade.
There were 38,381 sales of detached homes in the Comparable Region over the last decade – an average of over 3,800 homes per year.Detached homes dominate by a wide margin with 67% of sales averaging 332 units per month. Mission accounts for 16% of the Region with6,395 detached home sales, which translates to an average of 54 sales per month. Detached homes in Mission make up over 87% of sales onMLS over the last decade, which is greater than any other region. By comparison, detached home sales in Abbotsford account for 61% of totalsales. In Mission, sales of detached homes peaked from 2002 to 2007 when an average of 737 homes was sold annually for a total of 4,424during the six year period. This translates to an average of 61 homes per month, a 14% increase over the decade monthly average. While salesactivity increased in the Lower Mainland in 2009, just 579 detached homes were sold in Mission, which is still below the yearly average of the639 homes sold over the past decade.
ApartmentsMonthly Absorptions by Product Type on MLS
Townhomes Single Family
Year Mission Abbotsford Chilliwack MapleRidge Mission Abbotsford Chilliwack Maple
Ridge Mission Abbotsford Chilliwack Maple Ridge
Adjusted2000 3 41 12 12 5 36 9 29 53 207 50 95
2001 2 28 8 11 2 32 6 25 38 200 40 882002 2 31 9 15 3 41 8 39 53 126 46 1022003 5 43 11 18 5 42 14 40 60 146 54 1082004 4 53 13 15 4 40 17 35 66 135 51 902005 5 59 15 18 7 45 17 39 70 145 57 1152006 4 63 18 22 5 43 23 38 62 136 51 1042007 6 69 23 22 4 46 20 39 58 135 55 1022008 3 48 13 18 3 29 10 23 42 89 30 612009 2 45 14 17 5 38 12 34 48 105 35 922010 4 44 11 22 6 30 10 28 45 95 35 81
Ten Year 3.7 47.6 13.3 17.1 4.1 38.5 13.2 33.5 54.1 138.1 45.7 94.1Average
81District of Mission – Housing Market Status Urban Analytics Inc.

Multi ‐family home sales in Mission account for just 13% of all residential products sold on MLS in Mission. By comparison multi ‐family productrepresents 36 ‐ 39% of all residential product sold on MLS in the other Fraser Valley communities.
Over the last decade townhome sales in the Region have averaged 1,067 units per year compared to only 489 unit sales in Mission during thesame period – an average of only 4 units per month. Townhome sales peaked in Mission in 2005 with 82 units sold (7 units per month).Townhomes in the Region account for 17% of the volume over the last decade averaging 90 unit per month. Mission only contributes for 4.8% ofthe region’s total townhome sales.
Apartments in the Comparable Region account for 16% of the total housing stock sold on MLS. This equates to an annual average of 967apartments per year, or 20 unit sales per month over the last decade. Mission represents only 4.5% of the total apartment sales for theComparable Region or less than 4 units per month. This totals only 434 apartments sold on MLS in the last decade, averaging 43 units per year.
In Mission the greatest number of apartment sales recorded on MLS for a given year was in 2007 when 72 units were sold. Even when themarket recovered in other areas of the Lower Mainland in 2009, Mission only recorded 26 apartment sales on MLS, which is half the yearlyaverage over the past decade.
82District of Mission – Housing Market Status Urban Analytics Inc.

C. Single Family Detached Homes
As has been noted, detached home product has been the primary housing type in Comparable Region, and particularly in Mission by a largemargin. It is the easiest market to compare on an ‘apples to apples’ basis due to the similarity in the product type. Over the last decade the priceof detached homes in the Region grew at an annualized rate of 7.9%. With the strong economy and real estate market from 2002 to 2007, theprice of a single family home in the Region grew by 11.5% per annum. This equated to the average price of a single family home in theComparable Region growing by 132% to $434,538 over the last decade.
83District of Mission – Housing Market Status Urban Analytics Inc.

The price of a single family detached home in Mission grew at the same pace with an annual increase of 7.8% per annum. During the 6 years ofpeak activity, Mission’s single family home prices increased at a faster rate compared to the Comparable Region – 12.7% annually. The averageprice of a single family detached home in Mission today is $389,000 or 130% higher than June 2000. The average price today is close to the peakprice of 2008 when the average price of a detached home in Mission was $390,294. The average price of a home in Mission sells at a 10%discount relative to the average of the Comparable Region.
In comparison, detached home prices in Abbottsford grew at an annualized rate of 7.8% ‐ or 128% over the last decade.
The average price of a detached home in Maple Ridge grew by 131% while Chilliwack experienced the largest growth with 143% during the sameperiod.
Values in the detached home market in the Comparable Region fared well reasonably well during the recent market downturn. Prices dropped4.9% between 2008 and 2009, but have increased 5% from 2009 to YTD 2010. In Mission, the average price dropped by 4.7% from the peak buthas recovered most of that loss with the average price having increased by 4.1% year to date.
84District of Mission – Housing Market Status Urban Analytics Inc.

What is interesting to note is that on a price per square foot basis Mission, Abbotsford and Chilliwack mirrored each other and all peaked atabout $190 price per square foot. Only Maple Ridge had a 20% premium on a price per square foot basis. While the price per square foot wascomparable for three of the market areas in the Comparable Region, the average price was different. At the peak of the market in 2008 theaverage price of a detached home in Mission was 13% lower than in Abbotsford, while the average price in Chilliwack was 15.5% lower than inMission. This was largely a result of the average size of homes in each market area. In Abbotsford a detached home is typically 16% larger than inMission, the same type of home in Chilliwack it is 11.2% smaller than in Mission. The average size of a detached home in Mission in 2000 was1,879 square feet. The average size has since increased by 26% to 2,397 square feet.
85District of Mission – Housing Market Status Urban Analytics Inc.

Distribution of Single Detached Sold in Comparable RegionPrice Range 2007 2008 2009 2010 Total
0.0% Distribution of Single Detached Sold in Mission<$100K 0.0% 0.1% 0.1% 0.0%$100-$149K 0.0% 0.2% 0.0% 0.1% 0.1% Price Range 2007 2008 2009 2010 Total
<$100K 0.1% 0.4% 0.3% 0.0%$150-$199K 0.4% 0.2% 0.9% 0.7% 0.6% 0.2%
$200-$249K 2.9% 2.3% 3.9% 2.2% 2.9% $100-$149K 0.0% 1.2% 0.0% 0.3% 0.4%
$250-$299K 9.3% 6.7% 9.5% 7.2% 8.5% $150-$199K 0.7% 0.8% 1.2% 0.6% 0.8%
$300-$349K 16.1% $200-$249K 3.1% 3.2% 4.9% 0.6% 3.4%17.2% 15.0% 16.5% 13.3%13.8% 16.0% 12.3%$350-$399K 21.4% 20.6% 20.3% 17.4% 20.4% $250-$299K 9.2% 13.0%
21.7%$400-$449K 16.0% 17.0% 16.4% 20.2% 16.8% $300-$349K 22.6% 21.0% 22.6% 21.9%
$450-$499K 13.3% 12.6% 12.0% 12.9% 12.7% $350-$399K 23.5% 23.8% 22.1% 20.6% 22.9%
$500-$549K 8.2% $400-$449K 17.3% 17.8% 18.7% 24.2% 18.6%7.7% 9.3% 7.6% 9.3%8.1%$550-$599K 5.1% 6.5% 5.1% 5.9% 5.5% $450-$499K 10.0% 12.1% 11.6% 10.2%
2.8% 3.9% 4.9%$600-$649K 2.8% 3.9% 3.2% 5.6% 3.5% $500-$549K 2.4% 3.2%
$650-$699K 1.7% 2.1% 1.9% 1.7% 1.9% $550-$599K 3.0% 2.6% 1.4% 1.1% 2.3%
$700-$749K 0.8% 1.2% 0.9% 1.7% 1.0% $600-$649K 0.9% 1.1% 0.8% 0.4% 0.9%
$750-$799K 0.4% 0.4% 0.4% 0.6% 0.4% $650-$699K 0.2% 1.3% 0.9% 0.9% 0.8%
$800-$849K 0.2% 0.4% 0.1% 0.3% 0.3% $700-$749K 1.1% 0.4% 1.3% 0.0% 0.9%
$850-$899K 0.2% 0.3% 0.2% 0.4% 0.2% $750-$799K 0.3% 0.0% 0.0% 0.0% 0.1%
$900-$949K 0.1% 0.1% 0.1% 0.3% 0.1% $850-$899K 0.0% 0.4% 0.7% 0.0% 0.3%
$950-$999K 0.1% 0.4% 0.1% 0.0% 0.2% $900-$949K 0.2% 0.0% 0.0% 0.0% 0.1%
>$1M 0.3% 0.6% 0.6% 0.2% 0.4% >$1M 0.4% 0.0% 0.0% 0.0% 0.1%
Total 4,193 2,660 3,363 1,276 11,492 Total 696 499 579 226 2,000
In speaking to realtors and in reviewing the MLS sales data, a significant portion of the new homes built and sold over the last decade haveoptional basement apartment suites. This is one of the main reasons the average home size has increased so significantly. The average housesize in Abbotsford has been consistent throughout the years.
In analyzing where the majority of the product has been selling in Mission over the last four years, most single detached homes in Mission arepriced from $300,000 to $450,000. Approximately 64% of the homes sold in Mission are in this price range compared to 53% in the ComparableRegion. The percentage of product sold drops significantly after $500,000 except for Maple Ridge where the threshold is about $100K greater at$600,000.
As of June 2010, there were over 1,900 homes listed for sale in the Comparable Region – 386 homes in Mission, which comprises 20% of theavailable detached home listings. The average list price of homes in the Comparable Region is $211 per square foot, with an average askingprice of $490,318. This is a 13% premium over what has been achieved year to date. In Mission, the average list price of detached home is 12%higher. This indicates demand for this product type is still strong in the Comparable Region and that prices are trending higher. Based on currentlistings and monthly absorptions since January 2007, there is an approximate 8 month supply of detached homes in Mission.
86District of Mission – Housing Market Status Urban Analytics Inc.

D. Townhomes
Relative to detached homes in the Comparable Region and in Mission, the volume of townhome sales on MLS are limited ‐ primarily due to thelimited amount of product introduced to the local market over the past few years. As noted earlier, Mission accounts for just 4.5% of the totaltownhome sales in the Comparable Region over the last decade.
The annual growth rate of townhome prices in the Comparable Region was 7.2% during the six years from 2002 to 2007 the annual growth rateincreased to 11.3%. The growth of townhome prices in the Mission area was similar at 7.3% ‐ a growth rate of 12.2% during the same six yearperiod. The average price of a townhome in the Comparable Region rose by 115% to $280,499. The average townhome price in Mission climbedby 131% to $249,262 during the same period. The townhome market peaked in Mission in 2008 when the average price of a townhome reached$292,303. Average townhome prices fell significantly in 2009 with the downturn of the market. From 2008 to 2009 the average price of atownhome in Mission dropped by 23% to $237,784. Since the townhome sector of the residential market in Mission is so limited, any new
87District of Mission – Housing Market Status Urban Analytics Inc.

townhome product will have a significant impact on overall average pricing. This is evidenced by the launch of Mission Landing in 2007, whichresulted in a significant increase in average townhome pricing in the area. A more accurate measure of the impact the recession had ontownhomes is to consider the overall Comparable Region, where average MLS townhome values dropped by 6.4% from the peak of the market.
As a benchmark to Mission, townhome values in Abbotsford experienced annualized growth of 6.8% over the last decade for a total increase of109% to an average of $279,634 in 2010.
The average size of a townhome sold in Mission over the last decade is approximately 1,540 square feet – larger than the average townhomesize in Maple Ridge and Chilliwack, but smaller than Abbotsford.
88District of Mission – Housing Market Status Urban Analytics Inc.

0.6%
4.8%
8.3%
28.0%
39.9%
15.5%
3.0%
50.0%
26.5%
8.8%
0.0%
6.9%
10.3%
0.0%
1.6%
9.5%
9.5%
36.5%
31.7%
7.9%
3.2%
<$100K
$100 ‐$149K
$150 ‐$199K
$200 ‐$249K
$250 ‐$299K
$300 ‐$349K
$350 ‐$399K
0.0%
0.0%
5.9%
8.8% 31.0%
34.5%
17.2%
0.0%
0.0%
0.0%
7.1%
28.6%
47.6%
16.7%
Distribution of Townhomes Sold in Mission
Price Range 2007 2008 2009 2010 Total
Total 42 34 63 29 168
Distribution of Townhomes Sold in Comparable Region
Price Range 2007 2008 2009 2010 Total
<$100K 0.1% 0.0% 0.4% 1.0% 0.2%
$100-$149K 1.1% 1.7% 2.8% 1.7% 1.8%
$150-$199K 13.2% 10.9% 12.7% 10.3% 12.2%
$200-$249K 19.5% 13.0% 21.4% 19.2% 18.5%
$250-$299K 32.6% 32.1% 31.9% 29.9% 32.0%
$300-$349K 18.8% 25.8% 12.9% 17.6% 18.6%
$350-$399K 9.5% 8.8% 13.1% 10.0% 10.4%
$400-$449K 4.4% 5.6% 3.6% 8.1% 4.8%
$450-$499K 0.5% 1.8% 1.0% 1.5% 1.1%
$500-$549K 0.4% 0.4% 0.1% 0.3% 0.3%
$550-$599K 0.0% 0.0% 0.0% 0.5% 0.1%
Total 1,310 781 1,063 373 3,527
Approximately 68% of the townhomes sold in Mission are priced from $200,000 to $300,000 compared to only 51% in the rest of theComparable Region. 84% of homes sold in Mission are priced between $200,000 and $350,000 compared to 69% in the Comparable Region. InMission, no townhome product has sold above $369,000.
Currently there are 28 townhomes listed for sale on MLS with prices ranging from $128,000 to $325,000 for an average price of $264,000 or$179 per square foot. This represents approximately seven months of supply of this product type. To date in 2010 the average sale price of atownhome in Mission is $249,000,which is about 6% lower than theaverage list price.
Historically, the average sale priceof a townhome is higher inAbbotsford than Mission.However, at the recent peak of themarket the average of townhomessold on MLS in Mission exceededthat of Abbotsford. On a price persquare foot basis, townhomes inMission compared closely withAbbotsford. As with averageprices, Mission townhomesachieved a premium –approximately $10 per squarefoot – at the recent peak of themarket. Even today the averageprice per square foot sale price oftownhomes sold on MLS inMission exceeds that ofAbbotsford. This can be attributedto limited supply of townhomes inMission relative to Abbotsford,and due to the difference in theaverage size of product soldbetween the two markets.Townhomes in Abbotsford are 20% larger than those sold in Mission in 2010.
89District of Mission – Housing Market Status Urban Analytics Inc.

E. Apartments
Apartments represent the smallest segment of product type in the Comparable Region and are the least developed product type in Mission. Inthe Comparable Region, sale values of apartments sold through MLS grew at annual rate of 8.2%, while the average price over the last decadeclimbed 145% to $186,893. In Mission, apartment sale prices grew at an annual rate of 6.4% ‐ or a total of 114% to $185,490 over the past 10years. The greatest price increase for apartments in Mission occurred in 2006 and 2007 when the average price of apartments climbed 87%.During this period the average price increased from $112,174 to $214,327. A new condominium project introduced to the market in 2006significantly affected the average price of apartments in Mission. The Mews listed their units on MLS in 2006 selling 17 units at an average priceof $318,230.
90District of Mission – Housing Market Status Urban Analytics Inc.

With the exception of 2005, both the average price and the average price per square foot of apartments sold on MLS were higher in Missionthan in Abbotsford in each year of the past decade. The average price for apartments in Mission peaked in 2007 at $214,327 or $206 per squarefoot. While other product types have recovered to near ‐ peak levels, the average prices of apartments in both Mission and Abbotsford havecontinued to decrease. The average MLS sale price of an apartment in Mission is now $185,491 or $173 per square foot, compared to $177,136or $182 per square foot in Abbotsford.
Typically, the average size of an apartment in Mission is larger compared to other areas in the Comparable Region. Over the last decade theaverage size of apartments sold was 1,013 square feet. In 2010, the average size of sold apartment units is 1,077 sf. This square footage closelycompares to Abbotsford, but is larger than apartment product sold in Maple Ridge and Chilliwack. Over the last four years 65% of apartment
91District of Mission – Housing Market Status Urban Analytics Inc.

product sold on MLS in Mission was priced from $150,000 to $250,000. This is much higher than the Comparable Region average where 34% ofthe apartments sold in this price range. Over 40% of the product sold in Mission was from $150,000 to $200,000 whereas in the ComparableRegion it represented only 7.6% of sales.
There is currently a limited amount of apartment product actively listed for sale on MLS in Mission. There are a total of 38 active listings seekingan average of $199,839. Based on historical absorption data this represents 10 months of supply. The most expensive apartment currently listedfor sale is $340,000.
Distribution of Apartment Sold in Mission Distribution of Apartments Sold in Comparable RegionPrice Range 2007 2008 2009 2010 Total Price Range 2007 2008 2009 2010 Total
<$100K 1% 0% 2% 3% 1% <$100K 0.0% 0.0% 0.7% 0.0% 0.3%
$100-$149K 10% 14% 15% 9% 11%$100-$149K 0.0% 0.0% 7.4% 5.3% 3.5%
$150-$199K 34% 38% 45% 60% 40%$150-$199K 6.9% 4.8% 9.2% 8.9% 7.6%
$200-$249K 25% 38% 17% 14% 25%$200-$249K 27.2% 6.5% 36.0% 31.9% 26.6%
7% 6% 5% 7%$250-$299K 6%$250-$299K 46.4% 46.3% 31.8% 33.5% 39.0%
$300-$349K 13% 4% 17% 8% 11%
$300-$349K 19.5% 30.7% 9.9% 20.4% 18.8%$350-$399K 8% 0% 0% 0% 4%
$350-$399K 0.0% 11.6% 4.8% 0.0% 4.2%$400-$449K 2% 0% 0% 0% 1%
156 Total 1,436 979 950 406 3,771Total 72 36 26 22
92District of Mission – Housing Market Status Urban Analytics Inc.

F. Price Points by Bedroom Type
The following tables represent the average price in Mission and the Comparable Region since 2007 by product and bedroom types:
# of BedroomsApartment1 Bedroom2 Bedroom
Average Price by Bedroom in Mission2007 2008
$158,614 $174,560
$232,171 $203,843
2009
$148,100$195,966
2010
$105,950$197,869
Townhome2 Bedroom $213,114 $265,800 $200,522 $211,6503 Bedroom $274,071 $297,982 $263,643 $275,812
Duplex3 Bedroom $257,100 $279,143 $231,000 $280,500
Single Detached3 Bedroom $373,342 $369,132 $338,788 $337,6994 Bedroom $386,681 $401,387 $385,321 $397,2095 Bedroom $403,850 $427,611 $396,970 $407,581
Single Detached on Acreage3 Bedroom $606,658 $655,411 $531,234 $595,2944 Bedroom $669,526 $683,114 $564,690 $678,0715 Bedroom $647,495 $691,800 $596,593 $595,000
# of BedroomsApartment1 Bedroom2 Bedroom
Average Price by Bedroom in Comparable Region2007 2008
$151,458 $170,539
$196,112 $203,463
2009
$145,699$187,481
2010
$154,584$194,921
Townhome2 Bedroom $243,144 $256,308 $227,434 $242,5663 Bedroom $284,080 $300,175 $284,974 $289,722
Duplex3 Bedroom $283,995 $323,839 $371,564 $413,650
Single Detached3 Bedroom $398,428 $405,494 $379,955 $406,0234 Bedroom $425,211 $437,890 $422,579 $441,6905 Bedroom $437,625 $470,002 $447,147 $461,084
Single Detached on Acreage3 Bedroom $719,376 $726,991 $612,978 $665,5064 Bedroom $786,719 $796,720 $707,140 $729,5415 Bedroom $864,652 $879,429 $736,622 $710,700
93District of Mission – Housing Market Status Urban Analytics Inc.

PART SIX – Contemplated Residential Development Review
This section of the study provides a summary of all new developments with a significant residential component being contemplated in MissionThe compilation of data and analysis is meant to provide some context as to the amount and type of product that could compete with residentialproduct with the Mission Waterfront Lands, and assist in the determination of the optimum product mix and release of the various producttypes contemplated for the site.
Context Review
Prior to a review of the amount and type of product being contemplated, a brief discussion in regards to some influential municipal initiatives isworthwhile.
A. District of Mission – OCP Review
Looking ahead to the future, the vision for the District of Mission as indicated in its most recent OCP is as follows:
Mission is a healthy community that has a balance of residential, commercial, and industrial land uses, amongst an abundance of parkland andnatural open space. It is known as a community ‐oriented, affordable, and safe community. Mission has a mix of housing types, offering choicesto people of all incomes, lifestyles, and age groups. Community neighbourhoods reflect principles of sustainable development. The downtown isa vibrant place with a distinct identity that attracts residents and visitors in search of unique shopping and living experiences. The number oflocal industries and jobs has increased over the years to allow more residents to live and work in Mission. Natural and cultural resources providerecreation and tourism opportunities that have contributed to the attractive quality of life and the strong local economy.
The overall purpose of the updated OCP is to provide a policy framework that contributes to the sustainable growth and development ofMission, while strengthening individual and collective well ‐ being through balanced and integrated actions that are mindful of social, cultural,economic, and environmental attributes of the community.
94District of Mission – Housing Market Status Urban Analytics Inc.

District of Mission Official Community Plan – Adopted July 28, 2008The goals of the OCP are designed to reflect the diverse attributes of the community, keeping in mind the principles of sustainability. The OCP’sgoals are summarized as follows:
,/ To achieve sustainable growth; balancing economic, environmental and social principles;,/ To increase the number of local employment and shopping opportunities through commercial and industrial development;,/ To manage the natural environment ;,/ To develop housing alternatives which reflect the diverse needs of the community’s current and future residents;,/ To ensure that development provides public spaces, open spaces, and parkland that contribute to the value of the public realm;,/ To enhance transportation choice through the development and enhancement of an integrated, multi ‐ modal transportation system;,/ To enhance the community’s character and economic well ‐ being through waterfront development and downtown revitalization and
sustainable development;,/ To maintain and enhance the quality of life that will continue to encourage people to live, work, and visit Mission;,/ To involve the public in all stages of the development and implementation of the OCP.
95District of Mission – Housing Market Status Urban Analytics Inc.

B. Future Developments Strategies
Downtown Initiatives and StrategiesThe District of Mission is currently promoting the redevelopment of mixed commercial and residential land usages, both in existing structuresand new construction within the Downtown area. The objective is to ensure that there is an attractive and seamless link between the existingdowntown area and service of commercial area.
✓ Encourage and support the upgrading of buildings and constructions of new building within the Downtown Business improvement area,using the District of Mission’s Revitalization Tax Exemption Bylaw as a key mechanism.
✓ Encourage the upgrading of storefronts✓ Develop an updated Downtown streetscape improvement plan to guide high quality streetscape improvements in the downtown core.✓ Focus on pedestrian development
Areas adjacent to Downtown :
✓ Encourage the residential and commercial transition areas immediatelyadjacent to Downtown Mission to develop as diverse, high qualityresidential, commercial and mixed ‐ use neighbourhoods with strongphysical, social and cultural links to Downtown Mission.
✓ Encourage the Downtown East Expansion Area to develop as a primarilycommercial area while providing commercial/residential development.
Waterfront and Commuter Rail Area :Based on the municipal development plan, one of the largest opportunities forMission is the re ‐development of the waterfront. Mission is one of the onlylocations left in the Lower Mainland that has substantial developable waterfrontland appropriate for residential uses. The location would be ideal for a mix ofuses including hotel and residential, along with professional office space and aretail mix.
✓ Encourage the development of the Commuter Rail Area as a transit oriented urban residential neighbourhood that is connected withDowntown Mission as well as Waterfront areas.
✓ Encourage the development of the waterfront Area as an exceptional, high quality waterfront residential neighbourhood that isconnected with the Commuter Rail, Downtown, as well as the overall central urban area of Mission.
96District of Mission – Housing Market Status Urban Analytics Inc.
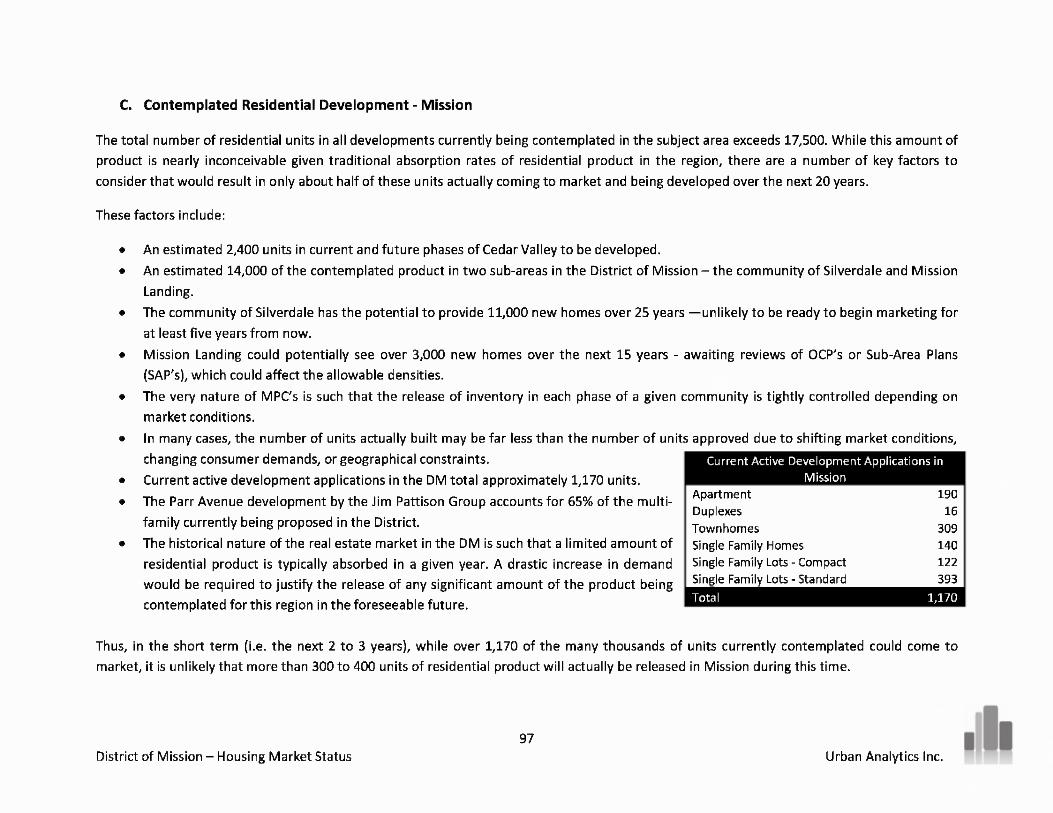
Current Active Development Applications inMission
Apartment 190Duplexes 16Townhomes 309Single Family Homes 140Single Family Lots ‐ Compact 122Single Family Lots ‐ Standard 393Total 1,170
C. Contemplated Residential Development - Mission
The total number of residential units in all developments currently being contemplated in the subject area exceeds 17,500. While this amount ofproduct is nearly inconceivable given traditional absorption rates of residential product in the region, there are a number of key factors toconsider that would result in only about half of these units actually coming to market and being developed over the next 20 years.
These factors include:
• An estimated 2,400 units in current and future phases of Cedar Valley to be developed.• An estimated 14,000 of the contemplated product in two sub ‐ areas in the District of Mission – the community of Silverdale and Mission
Landing.• The community of Silverdale has the potential to provide 11,000 new homes over 25 years —unlikely to be ready to begin marketing for
at least five years from now.• Mission Landing could potentially see over 3,000 new homes over the next 15 years ‐ awaiting reviews of OCP’s or Sub ‐Area Plans
(SAP’s), which could affect the allowable densities.• The very nature of MPC’s is such that the release of inventory in each phase of a given community is tightly controlled depending on
market conditions.• In many cases, the number of units actually built may be far less than the number of units approved due to shifting market conditions,
changing consumer demands, or geographical constraints.• Current active development applications in the DM total approximately 1,170 units.• The Parr Avenue development by the Jim Pattison Group accounts for 65% of the multi ‐
family currently being proposed in the District.• The historical nature of the real estate market in the DM is such that a limited amount of
residential product is typically absorbed in a given year. A drastic increase in demandwould be required to justify the release of any significant amount of the product beingcontemplated for this region in the foreseeable future.
Thus, in the short term (i.e. the next 2 to 3 years), while over 1,170 of the many thousands of units currently contemplated could come tomarket, it is unlikely that more than 300 to 400 units of residential product will actually be released in Mission during this time.
97District of Mission – Housing Market Status Urban Analytics Inc.

D. Contemplated Multi-Family Residential Summary in Mission
Development applications represent approximately 1,170 units for all product types with 521 units slated for multi ‐family development in theDM. Mission has never experienced the absorption of the amount of multi ‐family product currently being contemplated for the area.
Significant communities in the development application process being considered and that are of relevance to the Mission Lands include:• Parr Avenue (Pattison): Approx. 333 Units Status: 3 rd Reading – 297 townhomes and 36 apartments• Maple St & 1 st Ave (Perspective): Approx. 154 Units Status: Development Application Submitted in 2008
Active Development Applications for Multi ‐ Family Product in Mission
FILE # SUBMITTED XREF APPLICANT CIVIC STREET STATUS# of
Proposed Details
LandUse
Location(Mission Central and
Fraser Area, CedarValley, Rural (Hatzic,
etc.)
R07 ‐021 DTR, Stave Lake94 units (free ‐hold and strata)
DP09-004 2009/12/11S07 ‐019
Regnier, PaulStreet, York Avenue
ACTIVE 26 68 S.F. lots, 14 duplex units, 12townhouse units
M.F. Rural
R09 ‐014 Lot 1: duplexMission Central and
DP09-002 2009/11/04 S08 ‐003 Ellison, T 7273 Hurd Street ACTIVE 3 Lot 2: S.F. with suite M.F.Fraser AreaDV10 ‐003 Lot 3: duplex
R08 ‐010 7260/7290 Maple Street 10,950 square feet commercialPerspective Investments M.F. Mission Central andDP08-006 2008/04/03 DV08 ‐009
Ltd.32848/32852 1st Avenue ACTIVE 154 space on ground floor,
Commercial Fraser AreaS08 ‐020 32851/32853/32859 View Avenue apartment units above
Robert Ciccozzi 34048 3 rd ReadingDP06-014 2006/10/11 R06 ‐035 Architecture 34054 Parr Avenue ACTIVE 333 297 Townhomes M.F.
Mission Central andFraser Area
(Jim Pattison Group) 34142 36 Apartments
DP06-006 2006/04/04 ‐ Chadwick, J 7057 Mershon Street ON HOLD 5Commercial ‐ 3 units Commercial Mission Central andM.F. above ‐ 5 units M.F. Fraser Area
Total 521
Source: District of Mission Planning Department
98District of Mission – Housing Market Status Urban Analytics Inc.

E. Project Specific Proposed Development Review in Mission
The following pages provide a brief description of the most significant new residential communities currently being contemplated for DM.
i. Community of Cedar Valley
Cedar Valley is one of the key areas in Mission that has experienced significant growth over the last decade. This approximate 1,000 acre area,located to the immediate north of the existing urban area, has recently been serviced with sanitary sewers and has the potential toaccommodate an estimated 10,000 new residents over the next 20 plus years. There is also designation for about 100,000 square feet ofneighbourhood for commercial and business ventures.
This comprehensive development plan includes:✓ Various densities of Single Family Dwellings – 428
acres (53% of plan area);✓ Townhome dwellings – 100 acres (11% of plan
area);✓ Garden apartment dwellings – 5 acres (0.6% of plan
area);✓ Institutional/residential use – 8 acres (1% plan
area);✓ Commercial uses – 12.5 acres (1.4% of plan area);✓ CD Zone for employment uses – 27.5 acres (3% of
plan area);✓ Schools – 36.1 acres (4% of plan area);✓ Neighbourhood parks – 90 acres (10% of plan area);✓ Institutional uses – 13 acres (1% of plan area);✓ Natural open space – 181 acres (20% plan area).
99District of Mission – Housing Market Status Urban Analytics Inc.

Future Phases of Cedar ValleyCedar Valley when completely built ‐out is estimated to have 3,300 market housing units in four phases. Currently Phase 1 is being developedand to date 854 single family detached homes and 50 townhomes have been constructed in the community. There are another 62 units in theactive development application process for Phase 1.
The table below outlines current and future phases, and estimated product mix for the community:
Product Type
Phase 1(Current)
Phase 2 Phase 3 Phase 4 Total
Single Family Detached 1,068 240 503 260 2,071Townhomes 374 339 49 282 1,185Condominiums 141 110 ‐ ‐ 110Institutional (Non ‐ Market) 254 ‐ ‐ ‐ 254Total Estimated 1,834 689 551 542 3,616
Constructed to DateSingle Family Detached 854 ‐ ‐ ‐ 854Townhomes 50 ‐ ‐ ‐ 50
Active Applications 62 62
Total EstimatedMarket HousingContemplated
614 689 551 542 2,396
Source: District of Mission Planning Department
100District of Mission – Housing Market Status Urban Analytics Inc.

ii. Community of Silverdale
The Silverdale Urban area represents a 1,435 acre portion of a larger, approximately 3,400 acre previously designated as the Urban Reserve areaof DM. The subject hillside area is located north of the Lougheed Highway, and to the west of the existing urban core. To move forward withpotential urban development within the Silverdale Urban Residential area, Neighbourhood plans must be prepared and approved by the DMCouncil.
Once the west side of Mission has developed there will be an addition of an estimated 30,000 new residents. Development of this area wouldpotentially double Mission's population within the next 40 years. The neighbourhood one area includes plans for new residential, commercial,and school zones. It calls for roadway expansions, plus municipal water and sewage hook ‐ ups. Silverdale neighbourhood one area has beenapproved as the site of an intense residential development by Genstar.
Some residents of the area expressed concerns about the impact of intensive residential development on the area’s aquifers as most residentscurrently rely on shallow wells.
Developer: Genstar and Madison
Location: SW Mission, Lougheed Highway to the south, Silverdale community to the West, Mission Urban Area to the East separated bySilverdale Creek
Size (Acres): Silverdale Urban Area: 3,400 acres
Urban Residential Area: 1,435 acres
Commercial: Minimum of 312,000 square feet
Description: Silverdale is projected to take 40 years to build out with an estimated 11,000 homes and 30,000 residents. The mixed ‐ use masterplanned community would be the largest of its kind in Western Canada, doubling the size of Mission when complete. Genstar the lead developerdoes not plan to build itself, but would select builders to follow a master plan with Genstar and Madison supplying the infrastructure (roadways,ground services, high tech connections).
101District of Mission – Housing Market Status Urban Analytics Inc.

Total Build Out:
40 years: Estimated 11,000 units and 30,000 residents
20 years: Estimated 6,424 units and 17,503 residents
Proposed Silverdale Neighbourhood One Area
In August 2007 a Neighbourhood Planning Advisory Committee and consulting team began the planning process. The environmental base mapwas completed with over 8 years of study. Neighbourhood one is the first phase of development of 442 acres with a Village Centre and 1,435units of residential proposed. The proposed plan includes two village centres, single family detached homes (77%), townhomes (10%) andapartments (13%).
102District of Mission – Housing Market Status Urban Analytics Inc.

Silverdale – Neighbourhood One
Description: The first phase of Silverdale development includes a commercial/mixed useVillage Centre and 1,435 units of residential single family and multi ‐family homes
Size: 442 acres
Stage: Neighbourhood One plan approval by District of Mission and amended to OCP
Zoning: Zoned from rural to “Silverdale Neighbourhood 1A Zone” March 2009
Site Features: Hillside with gentle slope allowing views for most of the development
Units: 1,435 units (3,893 people or 8.81 units per acre)
Precincts:
Unit Counts by Precinct: See table to the right
Village Centre: The Village Centre is envisioned to include a groceryanchor, commercial, professional services (doctor, dentist, andpostal outlet), neighbourhood pub, small scale office, school andcommunity facilities and possible boutique hotel
Housing Types: Apartments (20 ‐50 units per acre), Ground OrientedResidential – Single detached (secondary suites allowed), small lot,duplexes, stacked duplexes, townhomes, clustered townhomes,country residential (1/0.88 acre)
Neighbourhood Design: Whistler style design with rock, timber andnatural elements
Parks/Green Space: Wildlife Reserve, green space, community park,neighbourhood park, trail network
103District of Mission – Housing Market Status Urban Analytics Inc.

iii. Parr Avenue Development (The Pattison Group)
Property Size: 34 acresNo. of Units Proposed: 333Proposed Product Mix: 297 townhomes
36 condominiums in 3 level wood framebuilding
Proposed Public Amenities: NoneComments:The proposed seven ‐ phase development on Parr Avenue by The PattisonGroup is the most advanced of any of the significant new homecommunities currently proposed for Mission. Third Reading for the projectwas received in early 2009. However, due to deteriorating marketconditions, the developer decided to put the project on hold indefinitelyuntil market conditions are more conducive. The developer indicatesachievable price per square foot for the townhome product in today’smarket would likely range from $200 to $210 per square foot. Marketconditions will continue to be evaluated to determine whether to proceed with marketing of the initial phase.
The table below shows a breakdown of the unit mixes by phase:
PhaseSite Area 13’ Wide TH’s 16’ Wide TH’s 20’ Wide TH’s 26’ Wide TH’s 31’ Wide
(sf) 1,111 – 1,180 sf 1,341 – 1,383 sf 1,478 – 1,517 sf 1,650 – 1,800 sf 1,435 – 1,582 sfApts Total #
of Units1 82,287 2 42 0 7 7 0 582 86,487 2 54 0 6 1 0 633 83,510 0 49 0 0 11 0 604 91,107 2 41 0 19 1 0 635 58,835 2 12 27 0 0 0 416 39,129 0 0 0 0 0 36 367 17,736 0 0 12 0 0 0 12
Total 459,087 8 198 39 32 20 36 333
104District of Mission – Housing Market Status Urban Analytics Inc.

F. Contemplated Development Review – Neighbouring Market Areas
The following pages provide a quantitative summary of the amount of current new residential development proposed for the neighbouringmarket areas of Abbotsford and Maple Ridge. Detailed information on the description and status of each of these proposed developments is notconsidered relevant to this study, rather it is the amount of proposed residential product that is important to note given that prospective buyersof new home product in Mission are also likely to consider product in these market areas. Therefore, it is important to consider the total amountof product being contemplated in these areas in relation to the historical and estimated future absorption levels to determine how many of theproposed units could realistically be released and absorbed within a reasonable period of time.
Abbotsford – Projects in Planning
Product Type # of Projects in # of Proposed Units
PlanningHigh ‐ Rise 5
1,154Mid ‐ Rise 1
83Low ‐ Rise 17
2,062Single Family 8
1,750Town Home 8
689Total 39 6,643
Maple Ridge – Projects in Planning
Product Type # of Projects in
# of Proposed UnitsPlanning
Low Rise 13
744Single Family 22
1,218Town Home 14
1,037Total 49 2,999
105District of Mission – Housing Market Status Urban Analytics Inc.

Comments / Description
Proposed 25 storey concrete residential building. The application wassubmitted by the architects. There is no additional information availableat this time.Proposed 20 storey high ‐ rise building with commercial use on theground floor. The application was submitted by Kasian Architects.Proposed 25 storey high ‐ rise with 6 storey commercial building. Thedevelopment is being put forward by Matsqui Development Co. Ltd.There is much uncertainty whether this project will move forward in thenear future.Proposed four tower developments with a maximum of 24 storeys byEmco Investment Ltd. No timeframe was provided on when thedevelopment will move forward.Re ‐zoning to allow a 6 storey development put forward by FocusArchitecture. .Quantum Properties is moving forward with a 26 storey high rise towerand a four story woodframe apartment building. It is expected thatmarketing for the development will begin sometime in 2011.
Proposed High Rise Product in Abbotsford
New Concrete Condominium Projects In Planning - Abbotsford
Project / Address TotalUnits Planning Status
2795 Gladwin Rd 126 Development Application
32346 ‐ 32366 South Fraser Way 120 Development Application
33006 ‐ 33020 Marshall Rd 165 Development Application
33011 South Fraser Way 476 Development Application
2405 ‐ 2427 Crescent Way 83 Development Application
Mahogany 272 Development Application
Totals 1,242
106District of Mission – Housing Market Status Urban Analytics Inc.

Proposed Woodframe Product in Abbotsford
New Wood Frame Condominium Projects In Planning - Abbotsford
Project / Address TotalUnits Planning Status Comments / Description
2150 Whatcom Rd 156 DevelopmentApplication
2174 ‐ 2184 Ware St 100 DevelopmentApplication
2800 Allwood St 463 DevelopmentApplication
2880 McCallum Rd 60 DevelopmentApplication
32074‐ 32094 Hillcrest Ave 42 DevelopmentApplication
32132 George Ferguson Way 71 DevelopmentApplication
32176 Hillcrest Ave 30 DevelopmentApplication
32345 Dahlstrom Ave 42 DevelopmentApplication
32888 Maclure Rd 69 DevelopmentApplication
33033 ‐ 33075 Marshall Rd 94 DevelopmentApplication
Focus Architecture applied for rezoning for two apartmentbuildings. No additional information available.
Focus Architecture applied for rezoning for a four storeywoodframe apartment in 2008. No additional informationavailable at this time.Onni applied for a rezoning for a mixed ‐ used residentialdevelopment. It is estimated that there will be 463 woodframeapartments. The application was submitted in 2007.Clayburn Court Ltd. is proposing a woodframe apartment. The sitewas recently listed for sale and no additional information isavailable at this time.Application for a mixed used woodframe development.
Rezoning application submitted with the intent to sell theproperty after rezoning.
Site is cleared and the property was re ‐zoned for four storeywoodframe apartment. The site is now listed for sale with the newrezoning.No additional information is available at this time on the property.
Rezoning application submitted for a four storey woodframeapartment in 2007 by Len Loewen.
Proposed rezoning submitted by Point West Architects for a fourstorey woodframe apartment.
33237 Robertson Ave 72 Development Rezoning was approved for 72 woodframe apartments. The site
107District of Mission – Housing Market Status Urban Analytics Inc.

Application has been cleared but no additional information is available.
33762 ‐ 33800 McDougall Ave 64 DevelopmentApplication
33868 Pine St 34 DevelopmentApplication
34565 Delair Rd, 34538 ‐ 34582 Marshall Rd 52 DevelopmentApplication
35202 McKee Rd 1400 DevelopmentApplication
Rezoning was approved for a four storey woodframe apartment.The site was listed for sale and no additional information isavailable.
Proposed rezoning for a small woodframe apartment. Theapplication was submitted by Focus Architecture in 2008.
Proposed approval for a 52 unit woodframe apartment by ToolTime Investments Ltd.
Proposed master planned community to include up to 1,400 unitsin various dwelling types.
3600 Block Townline Rd 129 Coming Soon Polygon has applied for a comprehensive rezoning for a masterplan community for over 560 homes. The rezoning proposes 431townhomes, 129 apartments in two building. This project isexpected to start marketing in 2011.
Parallel Marketplace 84 Development
As part of the development of the shopping mall, ShapeApplication
Properties is proposing a three storey residential above retail. Themall is currently in construction.
Totals 2,962
108District of Mission – Housing Market Status Urban Analytics Inc.

Proposed Townhome Product in Abbotsford
New Townhome Projects In Planning - Abbotsford
Project / Address TotalUnits Planning Status Comments / Description
2263 ‐ 2273 McKenzie Rd 48 Development Application Amacon has filed for a development permit for a 48 unit townhomedevelopment. It was originally to begin marketing in 2008 but due to marketcondition the project was delayed. There is no additional information whenthe project will be launched. .
2946 ‐ 2964 Lefeuvre Rd 40 Development Application No additional information available at this time. The original application wassubmitted in late 2007.
33848 ‐ 33870 Marshall Rd 20 Development Application Proposed rezoning for 20 unit townhome development. The application wassubmitted by Focus Architecture in 2010.
35298 Old Yale Rd 48 Development Application Noort Homes has applied for a rezoning from a RR ‐4 to RM ‐30
35846 McKee Rd 32 Development Application Rezoning submitted by Focus Architecture in 2009 for 31 townhomes and 1single family home.
3600 Block Townline Rd 431 Development Application Polygon has applied for a comprehensive rezoning for a master plancommunity for over 560 homes. The rezoning proposes 431 townhomes, 129apartments in two building. This project is expected to start marketing in2011.
Sunspring Estates 59 Coming Soon Solterra Development will be launching 29 duplexes and 30 single familyhomes.
Arbour Ridge 11 Coming Soon Kingscraft Construction will begin marketing shortly a small 11 unittownhome development. Keller Williams will be doing the marketing andsales.
Totals 689
109District of Mission – Housing Market Status Urban Analytics Inc.

Proposed Single Family Communities in Abbotsford
New Single Family Home Projects In Planning - Abbotsford
Project / Address Total Homes Planning Status Comments / Description
27848 Maclure Rd 35 DevelopmentApplication
HJ Properties is proposing a residential subdivision and initial servicingefforts are now underway.
2094 Horn St 17 DevelopmentApplication
Forewest Construction is proposing serviced lots. The application iscurrently in the rezoning process.
3363 Horn St 40 DevelopmentApplication
Noftie Land Development Strategies is proposing a single familydevelopment. The application was submitted in 2008.
34242 Maclure Rd 28 Development Proposed rezoning from RR3 to RS5 to permit servicing of 28 lots.Application
35202 McKee Rd 1,400 DevelopmentApplication
Proposed master planned community to include up to 1,400 units invarious dwelling types.
35235 Straiton Rd 50 Development Rezoning to a bare land strata subdivision.Application
Auguston Parkway South 115 DevelopmentApplication
Beauworld Development Corp has applied for rezoning for 115 singlefamily lots in the community of Auguston.
Dawson Rd & Sumas Mountain Rd 65 Development Application filed by Focus Architecture to permit serviced lots.Application
Totals 1,750
110District of Mission – Housing Market Status Urban Analytics Inc.

Proposed Low Rise Woodframe Product in Maple Ridge
New Wood Frame Condominium Projects In Planning - Maple Ridge
Project / Address Total Units Planning Status Comments / Description
11566 224 St 35 Development Application Application was submitted in 2010 to allow for a four storey woodframeapartments with estimated unit sizes between 680 to 1,050 sf.
11580 223 St 51 Development Application Vetta Enterprises and Axia Management have submitted an application forapproval of a four storey apartment with two levels of underground parking.
11865 ‐ 11873 Burnett St 39 Development Application Rezoning to permit a 30 unit 4 storey woodframe apartments.
12028 ‐ 12048 222nd St 45 Development Application No information is available.
12060 ‐ 12082 227 St 81 Development Application Currently in the rezoning process from RS1 to RM2 for 81 unit woodframeapartments.
12256 222nd St 109 Development Application Site was acquired by Plasma Development and they are proposing twoapartment buildings.
12367 224 St 33 Development Application No current information is available at this time.
22327 River Rd 29 Development Application No current information is available. In the rezoning process the site was listedfor sale.
22491 ‐ 22525 Brown Ave 77 Development Application MacLean Homes applied for rezoning for 4 lots for 77 unit woodframeapartments.
22611 Selkirk Ave 96 Development Application Westpoint architecture applied to the city for the development for a fourstorey woodframe apartment building.
22810 113 Ave 69 Development Application Application was submitted in 2008 for 65 unit four storey apartment complex.
22858 Lougheed Hwy 15 Coming Soon Construction is underway for a four storey woodframe apartments. Marketingis expected to start in the fall of 2010.
Chelsea Park 65 Coming Soon Quadra homes are building a four storey woodframe apartment. Constructionis well underway and it is expected to begin marketing in Sept 2010.
Totals 744
111District of Mission – Housing Market Status Urban Analytics Inc.
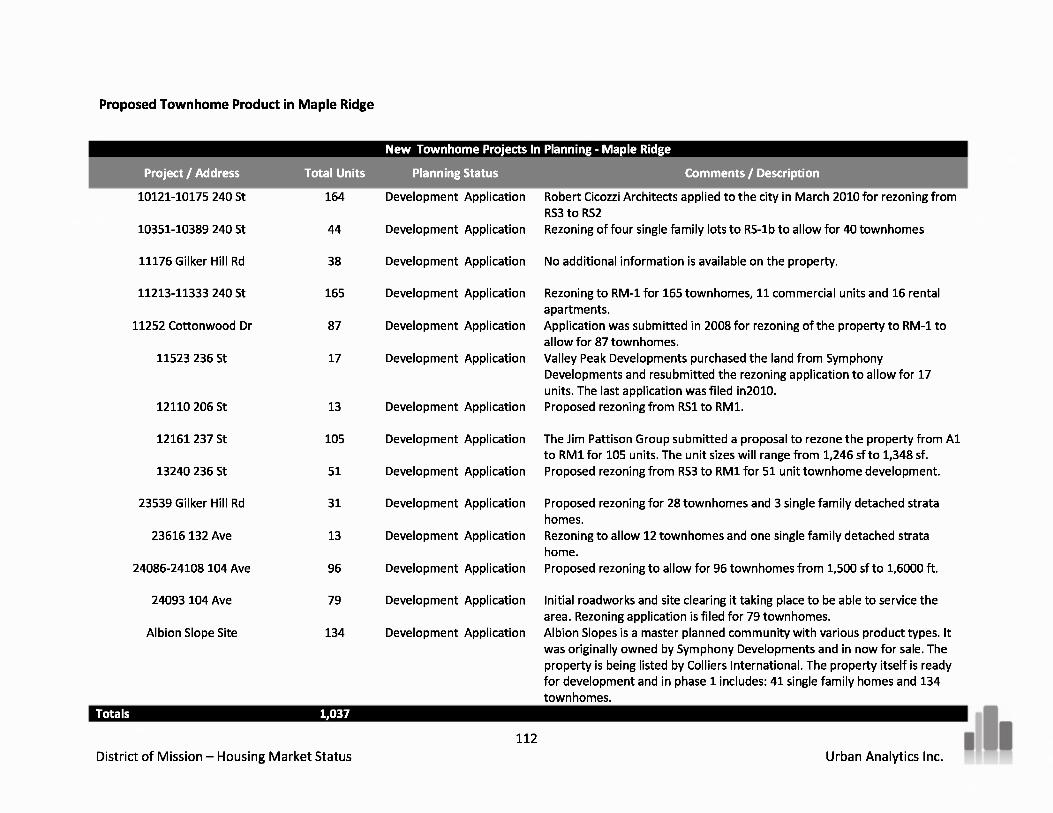
Proposed Townhome Product in Maple Ridge
New Townhome Projects In Planning - Maple Ridge
Project / Address Total Units Planning Status Comments / Description
10121 ‐ 10175 240 St 164 Development Application Robert Cicozzi Architects applied to the city in March 2010 for rezoning fromRS3 to RS2
10351 ‐ 10389 240 St 44 Development Application Rezoning of four single family lots to RS ‐ 1b to allow for 40 townhomes
11176 Gilker Hill Rd 38 Development Application No additional information is available on the property.
11213 ‐ 11333 240 St 165 Development Application Rezoning to RM ‐ 1 for 165 townhomes, 11 commercial units and 16 rentalapartments.
11252 Cottonwood Dr 87 Development Application Application was submitted in 2008 for rezoning of the property to RM ‐ 1 toallow for 87 townhomes.
11523 236 St 17 Development Application Valley Peak Developments purchased the land from SymphonyDevelopments and resubmitted the rezoning application to allow for 17units. The last application was filed in2010.
12110 206 St 13 Development Application Proposed rezoning from RS1 to RM1.
12161 237 St 105 Development Application The Jim Pattison Group submitted a proposal to rezone the property from A1to RM1 for 105 units. The unit sizes will range from 1,246 sf to 1,348 sf.
13240 236 St 51 Development Application Proposed rezoning from RS3 to RM1 for 51 unit townhome development.
23539 Gilker Hill Rd 31 Development Application Proposed rezoning for 28 townhomes and 3 single family detached stratahomes.
23616 132 Ave 13 Development Application Rezoning to allow 12 townhomes and one single family detached stratahome.
24086 ‐ 24108 104 Ave 96 Development Application Proposed rezoning to allow for 96 townhomes from 1,500 sf to 1,6000 ft.
24093 104 Ave 79 Development Application Initial roadworks and site clearing it taking place to be able to service thearea. Rezoning application is filed for 79 townhomes.
Albion Slope Site 134 Development Application Albion Slopes is a master planned community with various product types. Itwas originally owned by Symphony Developments and in now for sale. Theproperty is being listed by Colliers International. The property itself is readyfor development and in phase 1 includes: 41 single family homes and 134townhomes.
Totals 1,037
112District of Mission – Housing Market Status Urban Analytics Inc.

Proposed Single Family Communities in Maple Ridge
New Single Family Home Projects In Planning - Maple Ridge
Project / Address TotalHomes Planning Status Comments / Description
10578 245B St 22 Development Application Proposed rezoning for medium density single family residential.Application was filed in late 2009.
11237 236 St 14 Development Application Proposed rezoning for 14 single family homes.
12140 ‐ 12170 203 St 22 Development Application Rezoning to create 22 serviced single family lots.
12639 ‐ 12759 232 St 43 Development Application No information was available for the property.
13396 233 St 49 Development Application Proposed rezoning for a 49 lot subdivision.
13910 232 St 33 Development Application Rezoning from RS3 to RS1 to allow 19 RS1 lots and 14 compactRS1 lots.
14155 Marc Rd 89 Development Application Rezoning application for an 89 lots subdivision.
22650 136 Ave (Silver Ridge ) 105 Development Application Proposed rezoning for a future phases of the Silver Ridge masterplanned community.
22875 132 Ave 70 Development Application Rezoning to allow 50 single family lots in a new subdivision.
22947 132 Ave 67 Development Application No detailed information available for the property.
23103 136 Ave 40 Development Application Proposed rezoning for 40 single family lot subdivisions.
23553 Larch Ave 30 Development Application Proposed rezoning to include 30 serviced lots and additionaltownhomes.
23929 ‐ 23943 130th Ave 12 Development Application No additional information is available on the property.
23942 ‐ 23948 Dewdney Trunk Rd 16 Development Application Proposed rezoning to allow for 16 single family lots.
23944 104 Ave 49 Development Application Proposed rezoning to allow for 49 single family lots in a newsubdivision.
24221 ‐ 24361 104 Ave 45 Development Application Proposed rezoning to allow for serviced lots in a new subdivision.
113District of Mission – Housing Market Status Urban Analytics Inc.

24552 102 Ave 112 Development Application
25130 ‐ 25176 112 Ave 30 Development Application
25274 Bosonworth Ave 106 Development Application
26527 Dewdney Trunk Rd 26 Development Application
Albion Slopes Site 78 Development Application
269 St 160 Development Application
Totals 1,218
Rezoning to allow 112 serviced lots and park dedication.
Proposed future subdivision for stratified single family homes.
Proposed rezoning for a new subdivision in ALR land near aforest reserve.Proposed rezoning for suburban residential lots. The site is listedfor sale.Albion Slopes is a master planned community with variousproduct types. It was originally owned by SymphonyDevelopments and in now for sale. The property is being listedby Colliers International. The property itself is ready fordevelopment and in phase 1 includes: 41 single family homesand 134 townhomes.New proposed master planned community in a new subdivisionon the North end of 269 street.
114District of Mission – Housing Market Status Urban Analytics Inc.

PART SEVEN - Conclusions of Market Housing Status
A. Demand Forces
While the historical make ‐ up and community structure provides a good reference point to understand the various relationships in thecommunity, it does not help predict future change or growth. Projected demand is not based solely on what has happened or what futuredevelopment is being contemplated, but also on what is required to satisfy future projected growth as a result of net migration and changingdemographic characteristics of the community.
Our projected demand for future housing in Mission was based on the following assumptions:
i. Population projections by Environics Analytics are realistic and achievable;ii. Increased investment in job creation and tourism to create greater diversity for its tax base and increase the appeal of the
community for potential new residents;iii. Household size expected to change based on the demands of a maturing population in the community;iv. Future land servicing costs will increase the development and construction costs of the historical traditional predominant housing
form in Mission – detached homes;v. Demand for multi ‐family will increase in the DM as it has in most other GVRD and FVRD municipalities in response to the erosion of
detached home affordability in the area;vi. Future growth and supply of new product in Mission will more closely match historical patterns of dwelling unit types in the FVRD;vii. Land supply that is appropriate for multi ‐family residential is made available through changes in the Official Community Plan;viii. Land supply made available for multi ‐family residential that is in close proximity to shopping, community amenities and services;
ix. Market prices of new product will be more competitive to neighbouring markets with increased supply.
115District of Mission – Housing Market Status Urban Analytics Inc.

B. Housing Projections for Mission
Population projections are estimates and therefore difficult to base accurate housing demand forecasts further than 10 years in the future –particularly due to the numerous economic and provincial, regional and municipal policy ‐oriented variables that can impact it over time. Asnoted, the estimates for the demand for various dwelling type are based on distribution of housing forms in neighbouring communities in theComparable Region. It is expected as the population of Mission evolves in the coming years; the demand for various housing types will moreclosely follow historical structure distribution of the Comparable Region.
Based on the preceding analyses, there is an estimated demand for 4,515 new homes in Mission between 2011 and 2020 to accommodate thefuture expected growth of the community’s population and change in household characteristics. This assumes that there is demand for morethan 450 new dwellings units annually over the next decade. UAI recognizes this is more than double the 190 starts average annual starts thathave occurred in Mission during the past 10 years and that Mission has yet to experience this type of demand. However, the projectionconsiders the introduction of a comprehensive new residential community offering a mix of appropriate unit types, targeting a range of buyerprofiles and located in an appealing and convenient location that would significantly increase demand for this housing form in the community –something that has never been offered in Mission.
While detached homes will continue to garner the majority of buyer demand, resulting in the requirement of an estimated 2,500 new homesover the next 10 years, demand for multi ‐family product will experience a proportional increase that would result in the need for an estimated1,200 new apartments and townhomes over the same period.
116District of Mission – Housing Market Status Urban Analytics Inc.

Projected Housing Demand for The District of Mission (2011 - 2020)
PopulationAnnualized % Growth
HouseholdsAvg Household Size
Private Dwellings by CensusEstimated # Occupied Dwellings Required
Housing Type Required Based onFVRD Census Distribution
Actual
26,202 30,520 31,272 34,505N/A 2.83% 2.46% 10.34%
8,563 10,045 10,705 12,1853.06 3.04 2.92 2.83
1,482 660 1,480
Actual1991 1996 2001 2006
11.35% 1.85% 1.82% 1.79% 1.92% 1.89% 2.25% 2.20% 2.16% 2.11% 2.07%38,420 39,145 39,871 40,596 41,392 42,187 43,160 44,133 45,105 46,078 47,051
13,864 14,339 14,658 14,972 15,473 15,794 16,448 16,922 17,402 17,888 18,379
1679* 475 319 314 501 321 654 474 480 486 492 4,515
2010 2011 2012 2013 2014 2015 2016 2017 2018 2019 2020
2.74 2.73 2.72 2.71 2.68 2.64 2.62 2.61 2.59 2.58 2.56
Total
Single Family (57%)Semi-Detached - Apartment, Duplex (14%)Townhomes (8%)Apartment -Low Rise & High Rise (20%)Other (1%)
2,574271 182 179 286 183 373 270 273 277 28066 45 44 70 45 92 66 67 68 6938 26 25 40 26 52 38 38 39 3995 64 63 100 64 131 95 96 97 985 3 3 5 3 7 5 5 5 5
63236190345
8,4801,925
1,200480
95
The following table provides details of expected growth and demand by dwelling type:
Source: Stats Canada, Environics Analytics, Urban Analytics 2010* Total # of occupied dwellings estimated based on population growth since last Census data.
C. Summation
Mission has historically been known for offering more affordable home values relative to other parts of Metro Vancouver. As prices peaked inVancouver and its surrounding suburbs in 2007 and 2008, home buyers were forced to sacrifice on space to remain closer to the urban cores ormake a lifestyle choice to move further out of the core in order to attain more living space for their home ‐ buying dollar. Mission benefited fromthis trend by attracting families seeking relatively affordable detached homes. These buyers found they were able to purchase a detached homein Mission for what they would pay for a two bedroom apartment in Burnaby and Richmond.
Municipal demands – including those of the DM – that developers bear the majority, if not all, the cost of servicing new development propertieswill result in much higher costs to develop and construct detached homes. This added cost must be passed on to the end consumer since bearing
117District of Mission – Housing Market Status Urban Analytics Inc.

the costs completely will make the viability of detached home developments impossible for developers and contractors. This will result in theerosion in the affordability of this housing form and increase demand for more affordable housing options – even in more rural communities likeMission. The resulting increased cost of traditional detached housing forms will result in greater demand for more affordable options such astownhomes and condominiums.
Although the proposed development of the Silverdale community and the Mission Waterfront Lands would significantly alter the physical make ‐up and character of Mission, the appeal of Mission as a residential destination for prospective homebuyers from outside the community stillneeds to be considered. While it is clear that each of these communities on their own would double the number of units built in Mission, it is stillquestionable whether there is sufficient demand to absorb the contemplated supply based on future growth projections, particularly over thenext ten years. That being said, there remains uncertainty over when Silverdale might begin introducing new home product in the foreseeablefuture. Thus, it is unlikely that Silverdale will contribute any significant amount of new supply to this market over next five to seven years.
The same can be said about the Waterfront Lands given the various factors that need to be aligned to realize any actual development progresson the lands. In addition to the lands requiring an amendment to the OCP in order to be rezoned – a process that is likely to take considerabletime due to the public consultation that would be required, the several various landowners in the area also need to be brought on board withthe District’s vision. In addition, substantial site servicing would be required prior to the completion of any new residential or commercialproperties. Thus, any addition to the current housing stock from the Mission Waterfront Lands is estimated to be at least five years away.
To conclude, detached homes will continue to be the dominant housing form in Mission for the foreseeable future. Further, much of thedemand for this detached home product will continue to be generated among existing residents in the community. An appealing comprehensiveand appropriately designed and located new higher density community will be required to attract new residents from outside the DM insufficient numbers to make development of this type financially viable in this community. The Mission Waterfront Lands have the potential tobe that community.
118District of Mission – Housing Market Status Urban Analytics Inc.