diuin pape eie - iza institute of labor economicsftp.iza.org/dp12432.pdf · diuin pape eie iza dp...
TRANSCRIPT

DISCUSSION PAPER SERIES
IZA DP No. 12432
Gloria MoroniCheti NicolettiEmma Tominey
Child Socio-Emotional Skills: The Role of Parental Inputs
JUNE 2019

Any opinions expressed in this paper are those of the author(s) and not those of IZA. Research published in this series may include views on policy, but IZA takes no institutional policy positions. The IZA research network is committed to the IZA Guiding Principles of Research Integrity.The IZA Institute of Labor Economics is an independent economic research institute that conducts research in labor economics and offers evidence-based policy advice on labor market issues. Supported by the Deutsche Post Foundation, IZA runs the world’s largest network of economists, whose research aims to provide answers to the global labor market challenges of our time. Our key objective is to build bridges between academic research, policymakers and society.IZA Discussion Papers often represent preliminary work and are circulated to encourage discussion. Citation of such a paper should account for its provisional character. A revised version may be available directly from the author.
Schaumburg-Lippe-Straße 5–953113 Bonn, Germany
Phone: +49-228-3894-0Email: [email protected] www.iza.org
IZA – Institute of Labor Economics
DISCUSSION PAPER SERIES
ISSN: 2365-9793
IZA DP No. 12432
Child Socio-Emotional Skills: The Role of Parental Inputs
JUNE 2019
Gloria MoroniUniversity of York
Cheti NicolettiUniversity of York, University of Essex, CHILD Collegio Carlo Alberto and IZA
Emma TomineyUniversity of York, HCEO and IZA

ABSTRACT
IZA DP No. 12432 JUNE 2019
Child Socio-Emotional Skills: The Role of Parental Inputs
Informed by the psychological literature and our empirical evidence we provide new
insights into the technology of socio-emotional skill formation in middle childhood. In line
with economic evidence, increasing parental inputs that enrich the child home environment
and reduce stress has larger returns for children with higher socio-emotional skills in early
childhood (complementarity), but only for levels of inputs that are high. For low levels of
inputs, i.e. levels implying a stressful home environment, an increase has a higher return for
children with lower socio-emotional skills in early childhood (substitutability). Consequently,
well targeted policies can reduce middle childhood socio-emotional gaps.
JEL Classification: J13, D10, I10, I31
Keywords: socio-emotional skills, complementarities, substitutabilities, parenting styles, mother’s mental health, time investment, child behavioural disorders, diathesis-stress hypothesis
Corresponding author:Gloria MoroniUniversity of YorkHeslingtonYork YO10 5DDUnited Kingdom
E-mail: [email protected]
1 Introduction
Evidence suggests that gaps in child socio-emotional skills emerge at very young ages, persist
across the lifetime and are predictive of adult skills including labour market, health and crime
outcomes.1,2 In this paper we assess whether it is possible to reduce the gap in socio-emotional
skills in middle childhood by targeting interventions at specific parental inputs. We focus
on the development from age 6 to 11 - a sensitive period, when socio-emotional skills are
especially reactive to environmental stimuli (see Cunha and Heckman 2008), as well as a
developmental switch point, when environmental inputs combine with child’s predisposition
to determine personality and physical attributes (see Del Giudice 2018).
The main body of the literature on the production of child cognitive skills has found
empirical evidence for complementarity (a higher productivity of an input for children with
high early cognitive skills) for almost all inputs.3 In the presence of a similar complementarity
for the production of child socio-emotional skills in middle childhood, we would expect a
higher return to parental inputs in middle childhood for children with higher socio-emotional
skills in early childhood. Such complementarity is exemplified in Figure 1 by the solid
regression lines for socio-emotional skills on parental inputs with a flatter slope for children
with low (Panel A) rather than high (Panel B) socio-emotional skills in early childhood.
However, the development of child socio-emotional skills is expected to show substitutabil-
ity - a higher productivity of an input for children with low early socio-emotional skills - if the
child is exposed to a stressful home environment. This is because child socio-emotional and
behavioural disorders are triggered by the interaction of a stressful environment and a predis-
position to the disorder, as described by the diathesis-stress hypothesis in the psychological
literature (see Monroe and Simons 1991; Belsky and Pluess 2009). Therefore, we expect
children with low socio-emotional skills in early childhood, which can be an indicator for a
predisposition to behavioural disorders, to be more vulnerable to a stressful home environ-
ment in middle childhood; and children with high socio-emotional skills in early childhood
to be more resilient to these stressful experiences. Because low levels of parental inputs,
such as sensitive parenting and time investments, are likely to cause a stressful home en-
vironment, while high levels are associated with an enriched home environment, we expect
1What we call socio-emotional skills have been referred to as non-cognitive or soft skills (or abilities).2See Heckman and Rubinstein (2001); Carneiro and Heckman (2003); Heckman et al. (2006); Kautz et al.
(2014).3Empirical evidence on the degree of complementarity between investments and cognitive skills in the
production of future cognitive skills can be found in Cunha et al. (2010), Nicoletti and Rabe (2014), Attanasioet al. (2015, 2017), Garcıa and Gallegos (2017).
2

an increase in parental inputs when low, to have higher productivity for children with low
socio-emotional skills. This pattern is described by the dotted lines in Figure 1. For low
levels of parental inputs - or a stressful home environment - an improvement in the home
environment has a greater effect for children with low rather than high socio-emotional skills
in early childhood (compare Panels A and B). This is consistent with some degree of sub-
stitutability between low levels of parental inputs and early child socio-emotional skills and
it implies that interventions in middle childhood to increase these inputs - i.e. to improve a
stressful home environment - would be effective and optimally timed to facilitate the catch
up of socio-emotional skills.
To check empirically whether there is evidence of substitutability rather than complemen-
tarity for low levels of parental inputs, we estimate a production model of socio-emotional
skills at age 11 (middle childhood) that allows the productivity of a set of parental inputs to
vary both across the distribution of child’s socio-emotional skills at age 6 (early childhood)
and across the input distribution. The only other papers which have allowed the productiv-
ity of inputs to vary across level of earlier socio-emotional skills are Cunha et al. (2010) and
Attanasio et al. (2015). They find evidence for complementarity but under the assumption
that the level of complementarity/substitutability does not change across different inputs
and across different levels of the inputs.
The parental inputs measured between age 6 and 11 include (1) sensitive parenting,
(2) routines in parenting, (3) parental time investment; (4) family income, (5) mother socio-
emotional skills, (6) mother cognitive skills. We allow for self-productivity of socio-emotional
skills and cross-productivity between the child cognitive and socio-emotional skills. Factor
analysis is used to construct two measures - or traits - of socio-emotional skills, of internalising
and externalising behaviours and we assume that both measures follow the same production
model. Typical examples of internalising behaviours are being withdrawn, anxious, depressed
and having somatic symptoms. Externalising behaviours occur when children direct their
negative feelings and problems outward by adopting disruptive, hyperactive and aggressive
behaviours.4 Children with high levels of either internalising or externalising problems, i.e.
in the first quartile of the distribution, are 7 times more likely to develop Attention Deficit
Hyperactivity Disorder (ADHD) and 20 times more likely to be diagnosed with Autism
Spectrum Disorder (ASD).
4The concepts of internalising and externalising behaviours were introduced in the psychological literatureby Achenbach (1966), who used factor analysis to show that these two socio-emotional traits are the twomain latent factors underlying a large set of psychological disorders. Since then, the concepts of internalisingand externalising behaviours have been used in more than 75,000 articles in psychology (see Achenbach et al.2016).
3
Our first contribution is to adopt a flexible production model of socio-emotional skills
which relaxes the assumption of an equal degree of complementarity/substitutability across
inputs and across levels of inputs, therefore allowing to test whether the previous evidence
of complementarity between early socio-emotional skills and parental inputs in middle child-
hood is rejected for some of the parental inputs. In particular, we test whether the comple-
mentarity assumption is rejected because children with low (high) levels of socio-emotional
skills in early childhood are more vulnerable (resilient) to a stressful environment, i.e. are
more vulnerable (resilient) to low levels of parental inputs that are stress relievers. Looking
at Figure 1 Panels A and B, the complementarity hypothesis is represented by the solid lines,
whereas the alternative hypothesis is represented by the dotted lines.
Our second contribution is to estimate the production of socio-emotional skills separately
by gender, therefore providing new insights on gender differences in skills development during
middle childhood.5 This contribution is especially important because middle childhood is
characterised by the awakening of the adrenal glands which leads the brain to develop along
different pathways for boys and girls (Del Giudice, 2018).
Our final contribution is to control for unobserved heterogeneity by adopting child fixed
effect estimation which exploits the availability of two traits of socio-emotional skills for
each child - internalising and externalising behaviours.6 Our identification strategy relies
on variation in the deviation of a trait-specific socio-emotional skill from the mean across
the two traits, i.e. the mean across externalising and internalising behaviours. Whilst
variation in the general level of socio-emotional skills across individuals at age 6 is likely to
be endogenous, variation in the deviation of a trait-specific skill from the mean is mainly
driven by a predisposition to either internalising or externalising problems. The consistency
of this child fixed effect estimation relies neither on the assumption that unobserved inputs
be independent of observed inputs nor on the assumption that they be invariant across
life stages, age or siblings; which are the most common assumptions imposed by previous
papers on child development. We discuss below the three identification assumptions of our
estimation method.
First, we assume that the latent externalising and internalising traits follow the same
dynamic production model. Section 6 provides references to empirical papers with results
supporting the assumption that the effect of parental inputs are similar for externalising
and internalising behaviours. Furthermore, we show that our main results are robust to
5For previous evidence on gender difference, see Bertrand and Pan (2013); Baker and Milligan (2016).6A similar approach is adopted by Dee 2007; Clotfelter et al. 2010; Bandiera et al. 2010; Lavy et al. 2012
using within-student between-subject estimation.
4

relaxing the assumption of invariance of the self-productivity coefficient across the two traits.
Second, we assume that the variation picked up by the deviation of a trait-specific socio-
emotional skill from the mean across the two traits is explained by random variation in
the child predisposition to either internalising or externalising problems. Section 6 rules
out alternative sources of variation between internalising and externalising which could be
endogenous. Third, we assume there are no omitted inputs whose productivity varies across
the distribution of early socio-emotional skills. Even if our estimation model controls for
all unobserved inputs that are invariant across socio-emotional traits, we could still have a
potential endogeneity of parental inputs if the productivity of these omitted inputs varies
across different levels of socio-emotional skills in early childhood and are correlated with our
parental inputs. For this reason, in all of our analysis we control for a large set of further
characteristics which can proxy for unobserved inputs, including controls for mother’s labour
supply, child care arrangements, fertility decisions, neighbourhood capital, social capital and
health capital. Finally, we are also able to show that our results are unchanged even when
controlling for past parental inputs.
Using the UK Millennium Cohort Study, we find that levels of sensitive parenting,
parental time investments and maternal mental health below (above) the median constitute
examples of a stressful (enriched) home environment. Children with low socio-emotional
skills in early childhood are more vulnerable to a stressful home environment in middle
childhood - defined as levels of these inputs below the median - whilst high skilled children
in early childhood show resilience. Our empirical evidence supports the type of relationship
between socio-emotional skills and parental inputs in middle childhood depicted in Figure
1 Panels (A) and (B) by the dotted lines for low levels of inputs and by the solid lines for
high level of inputs. Therefore, our evidence suggests that there is complementarity between
parental inputs and early socio-emotional skills, but only for high starting values of parental
inputs, i.e. corresponding to an enriched environment. We instead find substitutability for
low levels of parental inputs that constitute examples of a stressful environment. Across
gender, boys with low (high) socio-emotional skills seem more vulnerable (resilient) to low
levels of sensitive parenting; whereas girls seem to be vulnerable (resilient) also to low levels
of parental time investments and maternal mental health. On the other hand we find no
variation in the productivity across level of early socio-emotional skills in family income,
routines parenting style, mother’s cognitive skills and child’s cognitive skills.
Taken all together, these findings suggest that there are some parental inputs which
may help children to catch up their socio-emotional skills, and these seem to be the inputs
that reduce child stress. A back of the envelope calculation shows that if interventions to
5
raise parent inputs were targeted correctly at households with low initial levels of the inputs
displaying substitutability, then the gap between children at the bottom - and the top of
socio-emotional skills distribution at age 11 could be reduced by up to 34% for boys and
52% for girls by increasing the input by one standard deviation.
The remainder of this paper is organized as follows. We introduce the production model
and the estimation strategy in Sections 2 and ?? respectively. We then move to describe the
data and variables in Section 4 and to present our main empirical results in Section 5. In
Section 6 we test the validity of our model assumptions and in Section 7 present robustness
checks to show that there is no bias caused by measurement error, model specification or the
specific metric of socio-emotional skills. Finally, Section 8 concludes.
2 The production model of socio-emotional skills
In this section we lay out our production model that describes the process of development of
children’s socio-emotional skills between age 6 and 11. We allow children’s socio-emotional
skills at age 11 to depend on their past socio-emotional and cognitive skills and on their
family inputs, as described by the following equation:
θNi,s,2 = f2(θNi,s,1, θCi,1, Ii,2,θP,i,2, µNi,2) (1)
where the subscripts 1 and 2 denote the development stages from 0 to 6 and from 6 to
11; s takes value 1 for internalising and 2 for externalising behaviour; θNi,s,1 and θNi,s,2 are
the unobserved latent trait-specific socio-emotional (non-cognitive) skills of the child i for
the trait s at the end of stage 1 and 2, i.e. at age 6 and 11; θCi,1 is the child’s unobserved
latent cognitive skill at the end of stage 1, i.e. at age 6. Ii,2 and θP,i,2 represent two vectors
of parental inputs, which are parental investments and skills during stage 2, i.e. between
age 6 and 11.7 Ii,2 = [ISensitivei,2 , IRoutinesi,2 , IT imei,2 , IIncomei,2 ] is a row vector of four parental
investments which are measures of sensitive parenting style, daily routine parenting style,
parental time investment and family income; while θP,i,2 = [θCognitiveP,i,2 , θSocio−emotionalP,i,2 ] is a row
vector of parental skills, where mother’s cognitive skills are proxied by mother’s education and
mother’s socio-emotional skills are proxied by mother’s mental health. µNi,2 denotes potential
omitted inputs that might affect the socio-emotional development of the child during stage
7We cannot observe these parental inputs for the full period from 6 and 11 and we assume that measuresobserved when the child is 7 are a good proxy for the parental inputs during stage 2.
6
2. We do not restrict the unobserved component µNi,2 and the production function f2 to be
time invariant across different child’s life stages, as done in some of previous papers; but we
assume invariance of f2 and µNi,2 between the two trait-specific socio-emotional skills.8
While the end of stage 1 is set at age 6, the start does not need to be at age 0 and we
could divide the development stage from 0 to 6 in different shorter stages, e.g. from 0 to 1,
1 to 2, 2 to 4 and 4 to 6, without any loss of generality for our production model. For all
these earlier development stages, we assume that child socio-emotional skills evolve following
a stage-specific dynamic production function, say θNi,s,t = ft() for each stage t < 2, and that
all these production functions are twice continuously differentiable in their inputs.
Our aim is to assess whether there are interaction effects between each of the parental
inputs in [Ii,2,θP,i,2] and the socio-emotional skill θNi,s,1, i.e. to test whether the productivity
of each of the seven parental inputs varies across levels of the socio-emotional skill at age
6. As highlighted above, there is almost no empirical evidence on the presence of such
interactions in the production of socio-emotional skills. The presence of complementarity
(a positive interaction effect) between a parental input in stage 2 and the socio-emotional
skill at the end of stage 1 would imply the presence of dynamic complementarity between
the parental inputs in stage 2 and inputs in earlier stages (see Heckman and Mosso 2014).9
On the contrary, the presence of substitutability (a negative interaction effect) between a
parental input in stage 2 and the socio-emotional skill at the end of stage 1 would imply
dynamic substitutability between such input in stage 2 and earlier stages’ inputs. Knowing
whether there exists substitutability or complementarity is therefore relevant to understand
which inputs in stage 2 are most effective to reduce potential gaps in socio-emotional skills.
We allow the production function (1) to be flexible enough to accommodate for the
8We provide empirical evidence to support the model invariance across traits in the empirical section.9We can show this by measuring the degree of dynamic complementarity between ITimei,t and ITimei,t−δ for
the production of socio-emotional skills at the end of stage t, θNi,s,t, in the following way,
d2ft()
dITimei,t dITimei,t−δ=
∂2ft()
∂ITimei,t ∂θNi,s,t−1(
δ
∏
j=1
∂ft−δ+j()∂θNi,s,t−δ+j−1
)
∂ft−δ()∂ITimei,t−δ
. (2)
Because∂ft−δ+j()
∂θNi,s,t−δ+j−1
and ∂ft−δ()∂ITimei,t−δ
are generally higher than zero, a strong static complementarity between
ITimei,t and θN1,s,i,t−1, i.e. a large value for ∂2ft()∂ITimei,t ∂θNi,s,t−1
, will lead to a strong dynamic complementarity
between ITimei,t and ITimei,t−δ . Following a similar reasoning we can show also that any early input in t − δ iscompliment with a later input in t as long as there is complementarity between this later input in t and thesocio-emotional skill in (t − 1).
7

presence of interactions between each pair of inputs in the following way:
θNi,s,2 =m2,N(θNi,s,1) +K
∑k=1
m2,N,k(θNi,s,1, Zk,i,2) +K
∑k=1
m2,k(Zk,i,2) +K
∑k=1
K
∑j=2j>k
m2,k,j(Zk,i,2, Zj,i,2)
+m2,µ(µNi,2) +m2,N,µ(θNi,s,1, µNi,2) +K
∑k=1
m2,k,µ(Zk,i,2, µNi,2),
(3)
where k = 1, ...,K, Zk,it denotes the k-th input in the following vector of dimension K × 1
and that we express in deviation from its sample mean,
Zk,i,2 = (θCi,2, Ii,2,θP,i,2).
The term m2,N(θNi,s,1) characterizes the effect of the lagged latent socio-emotional skill when
all other inputs are at the mean, i.e. when Zk,i,2 = 0 for each k; and m2,k(Zk,i,2) denotes
the effect of the input Zk,i,2 when θNi,s,1 is at the baseline value10 and all other variables
are at the mean. m2,N,k(θN1,i,s,1, Zk,i,2) captures the differential productivity of each input
Zk,i,2 across levels of the lagged latent socio-emotional skill; m2,k,j(Zk,i,2, Zj,i,2) measures
the differential productivity of Zk,i,2 at different values of the j-th input Zj,it; and finally
m2,µ(µNi,2), m2,N,µ(θNi,s,1, µNi,2) and m2,k,µ(Zk,i,2, µNi,2) are the effects of unobserved inputs and
of their interactions with lagged socio-emotional skills and inputs.
Similar types of child development production functions with interactions between pairs
of inputs have been considered by Liu et al. (2010), Mueller (2013) and Nicoletti and Rabe
(2017) and are more general than the constant elasticity of substitution (CES) and Cobb-
Douglas functions (see e.g. Cunha et al. 2010; Del Boca et al. 2013). The advantage of
adopting such general production function is that we can allow for self-productivity of socio-
emotional skills, for cross-productivity between cognitive and socio-emotional skills and for
complementarity/substitutability between each pair of inputs and between each of the inputs
Zk,i,2 and the socio-emotional skill θNi,s,1 without imposing the elasticity of substitution to be
the same for all pairs of inputs as imposed by CES models.
10In our empirical application we consider dummies for the different quartiles of the lagged socio-emotionalskill, θNi,s,1, where the baseline category is the first quartile.
8

3 Estimation of the production model
To estimate consistently the production model we need to take account of potential endo-
geneity caused by the omission of variables and of measurement error issues. The rest of this
section is organized as follow. Section 3.1 introduces our estimation procedure of the pro-
duction model and explains how we deal with endogeneity issues under the assumption of no
measurement errors. In Section 3.2 we describe the measurement model of socio-emotional
skills and parental inputs, which we use to derive the latent factors that are theoretically
unaffected by measurement errors.
3.1 Estimation
Thanks to the assumption of invariance of the production model (3) across the two trait-
specific socio-emotional skills, internalising and externalising behaviours, we can exploit the
availability of the two trait-specific socio-emotional skills for each child to apply a child
fixed-effect estimation.11 We do this by rewriting the equation (3) in deviations from the
mean across traits,
θNi,s,2 = m2,N(θNi,s,1) +K
∑k=1
m2,N,k(θNi,s,1, Zk,i,2) + m2,Nµ(θNi,s,1, µNi,2) + ui,s,2, (4)
where the double dot denotes the deviation from the mean across the two different traits,
internalising and externalising. This transformation of θNi,s,2 cancels out any potential mea-
surement error in the socio-emotional skills which is shared across traits and likewise any
shared error in the lagged socio-emotional skills θNi,s,1.12 This deviation transformation elimi-
nates all the terms in the right hand side of the production model (3) that do not vary across
the two trait-specific socio-emotional skills. Notice that the last two terms in equation 3 de-
pends on the unobservable component µNi,2 and eliminating them solves, at least in part, the
endogeneity caused by unobservables.
Computing the deviations from the mean across traits does not solve completely the
endogeneity issue caused by unobservables µNi,2 because it does not eliminate the interac-
tions between the child socio-emotional skills at age 6 and the unobservable parental inputs:
11Notice that this child fixed effect allows to take into account of potential cross-productivity betweeninternalising and externalising traits at each stage.
12If the production model is not linear in θNi,s,1, then considering a Taylor approximation of order one of
the non-linear function of θNi,s,1 around the average of θNi,s,1 across traits would still cancel out the sharedmeasurement error through the deviation from the mean transformation.
9
m2,S,µ(θNi,s,1, µNi,2). These unobserved inputs bias our estimation of the productivity of ob-
served parental inputs, [Ii,2,θP,i,2], only if both of the following conditions hold: (i) the
productivity of the omitted inputs varies across the distribution of socio-emotional skills at
age 6; (ii) there is correlation between the observed parental inputs and the omitted inputs.
Previous papers on socio-emotional development have not considered the possibility of such
bias. On the contrary, we control for this potential bias by including the interactions between
θNi,s,1 and a rich set of additional observed inputs, which can proxy for the unobserved inputs.
In particular, we consider measured of neighbourhood capital, social capital, health capital,
mother’s labour supply, child care arrangements and fertility decisions. We denote each of
these additional inputs with Wg,i,2, where g = 1, ...G denotes each of the G inputs, and we
assume that the interaction term between the lagged socio-emotional skills and the unobserv-
able component µNi,2, m2,S,µ(θNi,s,1, µNi,2), can be replaced by a set of interactions between the
lagged socio-emotional skills and each of the additional variables Wg,i,2, m2,N,g(θNi,s,1,Wg,i,2),so that our production model expressed in deviations from the mean across traits becomes
θNi,s,2 = m2,N(θNi,s,1) +K
∑k=1
m2,N,k(θNi,s,1, Zk,i,2) +G
∑g=1
m2,N,g(θNi,s,1,Wg,i,2) + ui,s,2. (5)
In the following we impose some parametric assumptions on model (5), but we keep
the specification flexible enough to allow for a differential productivity of the inputs across
different levels of θNi,s,1. Specifically, we model socio-emotional skills in stage 2 as a linear
function of socio-emotional skills in stage 1 and of all possible pairwise interactions between
each of the inputs and quartiles of socio-emotional skills in stage 1 - with each of these
interactions allowed to change for levels of parental inputs above and below the median.
The model specification that we adopt is the following:
θNi,s,2 = α + θNi,s,1ρ +K
∑k=1
4
∑q=2
1
∑p=0
[Di,s,qDi,k,pZk,i,2βk,q,p] +G
∑g=1
4
∑q=2
[Di,s,qWg,i,2γg,q] + ui,s,2, (6)
where the double dot still denotes the deviation from the mean across the two different
socio-emotional traits; Di,s,q is a dummy taking value 1 if the observed θNi,s,1 lies between the
(q-1)-th and q-th quartile and 0 otherwise, and Di,s,q is its deviation form the mean across
traits; Di,k,0 is a dummy variable taking value 1 for values of Zk,i,2 below its median, while
Di,k,1 = 1 −Di,k,0 is a dummy variable taking value 1 for values of Zk,i,2 above its median;
Zk,i,2 and Wg,i,2 are measured in deviations from their sample mean; α is the intercept; ρ
is a scalar parameter measuring the self-productivity (persistence) of socio-emotional skills,
i.e. the effect of an increase in θNi,s,1 while all other inputs are held at their mean; βk,q,p is a
10
scalar parameter measuring the differential productivity of input Zk,i,2 when children have
lagged socio-emotional skills in the q-th quarter rather than in the first (baseline) quarter of
the distribution and have values of Zk,i,2 below its median if p = 0 and above it if p = 1, while
all other inputs are held constant at their mean; finally γg,q is a scalar parameter measuring
the differential productivity of Wg,i,2 for children in the q-th quarter of the distribution of
θNi,s,1 with respect to the bottom quarter, while all other inputs are held at their mean. In
Section 6 and 7 we allow for even more flexible specifications of the production model and
provide empirical evidence that the parametric assumptions imposed in equation (6) are not
too restrictive.
Estimating equation (6), which is expressed in deviations from the mean across traits,
is equivalent to adopting a child fixed effect estimation. Similar types of child fixed ef-
fect estimations have been used in several previous papers, e.g. to estimate the effect of
lagged cognitive abilities or school class characteristics and school peers on cognitive abili-
ties or educational achievements.13 The main difference is that whilst we exploit variation
within child across socio-emotional traits to estimate a production model for socio-emotional
skills, previous papers exploit variation within child across cognitive skills such as subject-
specific test scores. Furthermore, we allow for complementarities between inputs and lagged
socio-emotional skills, similarly to Nicoletti and Rabe (2014) who consider complementar-
ities between school investments and cognitive ability at the end of primary school in the
production of cognitive abilities in secondary school.
Differently from previous papers that have used dynamic factor models to estimate the
production function of cognitive and socio-emotional skills (e.g. Cunha et al. 2010; Attanasio
et al. 2015; Agostinelli and Wiswall 2016),14 we identify the effect of lagged socio-emotional
skills in the production model by using exclusively variation coming from the differences
between trait-specific latent socio-emotional skills, i.e. differences between θNi,s,1 and θNi,s′,1for s ≠ s′, rather than variation coming from the general latent socio-emotional skill. This
matters because, while variation in the general level of socio-emotional skills across individ-
uals at age 6 is likely to be endogenous, variation in θNi,s,1 across traits is mainly explained
by variation in an innate predisposition to specific socio-emotional issues.15
Part of the variation in θNi,s,1 across traits could be related to trait-specific unobserved
13E.g. Dee 2007; Clotfelter et al. 2010; Bandiera et al. 2010; Lavy et al. 2012; Del Boca et al. 2017;Nicoletti and Rabe 2017
14Note that the number of measures required to estimate equation (6) in dynamic factor models wouldincrease exponentially for each interaction included, making it nearly impossible to estimate.
15We explore this assumption further in Section 6.
11
inputs and therefore potentially endogenous. In particular, children may learn or imitate
internalising and externalising socio-emotional behaviours from parents based on their trait-
specific socio-emotional skills. To check if such an endogeneity issue could be a concern
in our estimation, we run some robustness checks by including as further inputs measures
of trait-specific socio-emotional skills for the parents, with results that confirm our main
conclusions.
3.2 Measurement models of socio-emotional skills and parental
inputs
We have multiple measures for each of the two socio-emotional traits - internalising and
externalising behaviours. We allow each of the observed measures of socio-emotional skills
to be affected by two types of measurement error, a measurement error which is shared across
the two traits and across all measures, and a measurement error which is instead trait- and
measure- specific.
Because the observed traits of internalising and externalising behaviours are derived from
the Strength and Difficulty Questionnaire which is administered to mothers, we could have
a systematic error shared across all observed socio-emotional traits if mothers systemati-
cally under-report or over-report behavioural issues of their child. To allow for such shared
measurement error across different observed traits of socio-emotional skills, we allow the
observed trait-specific socio-emotional skill θNi,s,t to depend on a shared measurement error
in the following way:
θNi,s,t = ϑNi,s,t + vi,t, (7)
where ϑNi,s,t is the true trait-specific latent skill and vi,t is the measurement error which is
common across socio-emotional traits in stage t (t = 1,2). Note that while the variation in
θNi,s,t is in part spurious and caused by the measurement error vi,t; the variation of ϑNi,s,t within
child and across the two traits does not depend on vi,t. In our estimation model we correct
for the shared error vi,t by considering the deviations of θNi,s,t from its mean across traits.
A second type of measurement error is within traits and across measures. We can deal
with this because for each trait (internalising and externalising behaviour) we can observe
multiple measures at the end of stage t, i.e. at age 6 for t = 1 and at age 11 for t = 2.
Following previous papers on the technology of skill formation (see Cunha et al. 2010 and
Agostinelli and Wiswall 2016), we assume the following relationship between each of the
observed measures of a trait-specific socio-emotional skills and the unobserved latent trait-
12
specific socio-emotional skill θNi,s,t:
Y N,mi,s,t = λms,t + αms,tθNi,s,t + emi,s,t, (8)
where Y N,mi,s,t is the m-th observed measure of the s trait-specific socio-emotional skill at the
end of stage t (at 6 or at 11), m = 1, ...,Ms,t, s = 1 for internalising and 2 for externalising, λms,t
and αms,t are the intercepts and factor loadings specific for the measure m. emi,s,t is the measure-
specific measurement error which has mean zero and is assumed to be uncorrelated with θNi,s,tand independently distributed across children and measures. The latent trait-specific socio-
emotional skill θNi,s,t can be identified only up to scale and location parameters. By setting
the mean of θNi,s,t to 0 and α1s,t = 1, we fix the location and scale so that we can identify the
parameters in λms,t and αms,t for any trait s and t and we can extract the latent factor. We
use measures of peer problems and emotional symptoms for internalising behaviours, and
measures of hyperactivity and conduct problems for externalising behaviours. We use these
measures observed at 5 and 7 as proxies for measures at 6; whereas we use only measures
observed at age 11 as proxies for internalising and externalising at 11.16
We consider measurement models similar to (8) for the following parental inputs: sensi-
tive parenting style, routine parenting style, parental time investment and mother’s mental
health.17 For each of these parental inputs which we denote with the subscript h, we consider
the measurement model
Imi,h,2 = λI,mh,2 + αI,mh,2 Ii,h,2 + e
I,mi,h,2, (9)
where Imi,h,2 is the m-th observed measure of the h parental input at end of stage 2; m =1, ...,Mh,2; h = 1 for sensitive parenting style, 2 for routine parenting style, 3 for parental
time investment and 4 for mother’s mental health; λI,mh,2 and αI,mh,2 are the intercepts and factor
loadings specific for the measure m; eI,mi,h,2 is the measure-specific measurement error which
has mean zero and is assumed to be uncorrelated with Ii,h,2 and independently distributed
across children, measures and inputs.18 We identify and extract each of the latent factor
Ii,h,2 by setting the factor mean to 0 and αI,1h,2 to 1.
We estimate the production model by using directly the factors θNi,s,1, θNi,s,2 and Ii,h,2 for
h = 1, ...,4 , which are theoretically free of measurement error when expressed as deviations
from the mean across traits.
16See Section 4 for more details.17Notice that we adopt the same measurement model for child cognitive skills.18Two parental inputs, family income and mothers’ education, are directly used in our estimation without
considering any factor model.
13

4 Description of data
We use the UK Millennium Cohort Study (MCS), a cohort member longitudinal survey
covering a sample of about 19000 children born in the UK between September 2000 and
January 2002. Interviews on the children and the family members are collected when the
children are aged 9 months, 3, 5, 7, 11 and 14 years old.19 The MCS includes a wealth of
information about the child, his/her household members and the home environment.
The sample consists of singleton children whose parents are married or cohabiting with
analysis restricted to children for whom we observe socio-emotional skills reported by the
mother, cognitive skills, parental inputs and parental skills. Our final sample consists of
6452 children. Table A.1 shows the demographic characteristics of the sample of children at
age 7. The average age of the child in the sample is 86.6 months, with an average number of
siblings of 1.5 and the mother being 37 years old. 93% of children are white; 36% of children
have mothers in a managerial or professional occupation, 29% in an intermediate occupation
and 32% in a routine or manual occupation.
4.1 Child’s skills
4.1.1 Socio-emotional skills
We use the Strengths and Difficulties Questionnaire (SDQ) to construct our measures of
socio-emotional skills. The SDQ is an international standardised test measuring children’s
behaviours and emotions in several contexts (Goodman, 1997). It is largely used in psychol-
ogy as well as in the human capital literature within economics,20 and it shows correlations
with Diagnosis of Autism Spectrum Disorder (ASD) and Attention Deficit Hyperactivity Dis-
order (ADHD). The questionnaire, administered to parents since age 3 of the child, consists
of 25 items on child psychological attributes measuring five scales for (i) Emotional Prob-
lems, (ii) Conduct Problems, (iii) Hyperactivity, (iv) Peer Relationship Problems and (v)
Pro-social Behaviour are created. The scales can be either used separately to inform about
specific behavioural problems or combined to create two different traits of socio-emotional
skills such as internalising and externalising behaviour.
The internalising trait combines emotional symptoms and peer problems and the exter-
19More information on survey design, recruitment process and fieldwork can be found in Dex and Joshi(2005).
20See for examples in the UK setting Del Bono et al. (2016); Moroni (2018).
14

nalising trait combines conduct problems and hyperactivity problems. Table 1 details the
items included in each of the traits used in our analysis.21 The top panel of Table 2 reports
the descriptive statistics of the four scales of socio-emotional skills of the child at age 5, 7
and 11 respectively for boys and girls. With the exception of emotional symptoms measured
at age 5 and 7, girls have statistically significantly higher socio-emotional skills and are less
likely to have emotional, peer, conduct or hyperactivity problems. This gender gap is more
pronounced for externalising behaviour and especially for hyperactivity problems.
As explained in Section 3.2, we use factor models to derive the two specific traits of
internalising and externalising behaviour. The correspondent factor loadings of the latent
factors, i.e. internalising and externalising traits, can be found in Tables A.2 and A.3 in the
Appendix, respectively for boys and girls.
4.1.2 Cognitive skills
Cognitive abilities are mainly derived from the British Ability Scales (BAS), which tests
child skills differently depending on the age of the child (Elliott et al., 1997; Hansen et al.,
2012) and captures child abilities including problem solving, expressive verbal ability and
reading and spatial awareness.22
The bottom panel of Table 2 reports the descriptive statistics of the different measures of
child’s cognitive skills at age 5 and 7 respectively for boys and girls. Girls have statistically
significantly higher cognitive skills than boys for all the measures, with the exception of
reading abilities measured at age 5 where there is no statistically significant gender difference
and maths at age 7 where boys outperform girls. Similarly to socio-emotional skills and as
explained in Section 3.2, we use factor models to derive the latent cognitive skills of children.
The correspondent factor loadings of the latent factors, can be found in Tables A.4 and A.5
in the Appendix for boys and girls respectively.
4.2 Main Inputs
The importance of considering a multiplicity of parental inputs when estimating the sub-
stitutability and/or complementarity between the inputs and the skills has been recently
recognized by Garcıa and Gallegos (2017). We consider six main parental inputs grouped
21Pro-social behaviour is excluded from our analysis as it represents a different dimension of socio-emotional skills which cannot be combined with internalising or externalising behaviour.
22More details on the tests administered to the child can be found in Hansen et al. (2012).
15

in two categories: parental investments and parental skills. We capture parental invest-
ments using measures of sensitive parenting style, routines parenting style, time investments
and family income. We capture parental skills using measures of mothers’ cognitive and
socio-emotional skills.
4.2.1 Parental Investments
The different types of parental investment included in our analysis capture various facets of
parent-child interactions. Parenting style has recently been recognised as a distinct parental
input from the usual material and time investments (Cobb-Clark et al., 2016). Mainly in the
psychology literature, but recently also in economics (Doepke and Zilibotti, 2017; Fiorini and
Keane, 2014; Cobb-Clark et al., 2016), different categories of parenting style have been used
to measure how warm/communicative and how strict/controlling a parent is. We construct
two domains of parenting styles capturing respectively the degree of sensitive parenting style
and routines in parenting style.
The degree of sensitive parenting style is measured using the Straus’ Conflict Tactics
Scale included in the MCS (Straus and Hamby, 1997). The mother reports on a 5 point
scale ranging from ‘never’ to ‘daily’ how frequently she takes a set of specific actions with
her child which are described in Table A.6.
We use latent factor models as explained in Section 3.2 to estimate the latent factor
measuring sensitive parenting style which captures how harsh-sensitive a parent is when the
child misbehaves. The latent variable for sensitive parenting style is reverse coded such
that it can be interpreted as a positive input going from harsh to sensitive parenting, with
higher values associated with more sensitive parenting. Table A.6 shows the factor loadings
(Column 1) and the signal, i.e. percentage of the variance explained by the latent factor
(Column 2). There is considerable variation in the amount of information captured by each
measure of the same factor ranging from 11% to 50%.
The second domain of parenting style, i.e. routines in parenting style, accounts for the
parental rules based on daily routines. The survey includes four questions on daily routines
set by the parent on bedtime and watching TV, detailed in Table A.6.23 The factor loadings
in Table A.6 for the four measures (Column 1) and the signal (Column 2) are reported for
the latent factor of routine parenting. We interpret this factor such that, the higher the
value the stricter the daily routines.
23Similar measures of parental rules have been used by Del Bono et al. (2016); Fiorini and Keane (2014).
16
The third type of parental investment considered in our analysis aims at capturing the
parental time investment by using 6 questions regarding how often the mother spends time
in formative activities with the child, again detailed in Table A.6. For all the statements
the mother reports how frequently she plays these activities with the child in a scale ranging
from ‘Every day or almost every day’ to ‘Not at all’.24 The estimated factor loadings and
signal are reported in Table A.6. The interpretation of the factor is such that the higher the
value, the higher the time investment. For all factors in Table A.6, no measure has a signal
close to 100% emphasizing the importance of accounting for measurement error through the
latent factor model.
Finally, as largely established in the economic literature, income matters for the devel-
opment of child human capital (see e.g Dahl and Lochner 2012; Carneiro et al. 2015). We
therefore include a fourth type of parental input to capture the material investment, mea-
sured with the household weekly income equivalised using the OECD scale25 reported in the
MCS.
4.2.2 Parental Skills
The second group of parental inputs consists of parental skills. We include mother cogni-
tive skills, proxied by mother’s education (the age mothers left school) and mother’s socio-
emotional skills captured by mother’s mental health. Specifically, mother’s mental health is
assessed with the Mental Health – Kessler (K6) Scale (Kessler et al., 2002) a questionnaire
intended to collect information on mothers’ psychological distress. The mother indicates how
frequently she experiences feelings such as being depressed and hopeless for example, in the
last 30 days ranging from ‘All of the time’ and ‘None of the time’. Similarly to the procedure
followed for the other parental investments, we use latent factor model as described in Sec-
tion 3.2 to estimate the latent factor measuring mother’s mental health. Table A.7 reports
the factor loadings for the full set of measures (Column 1) and the signal, i.e. percentage of
the variance explained by the latent factor (Column 2).
As additional measures of parental skills we include trait specific parents’ socio-emotional
skills, of both mothers’ and fathers’. These measures will be used in our sensitivity analysis
to show that the intergenerational transmission of trait-specific socio-emotional skills does
24Similar measures of parental time investment have been used by Del Bono et al. (2016).25The OECD equivalised income is defined as the household income divided by the OECD equivalent
scale, which counts the first adult as 1, each additional adult as 0.5 and each child (aged under 15) as 0.3equivalent adults.
17
not represent a threat for our identification strategy. They are derived using the questions
on parental neuroticism and extroversion available in the MCS and used to construct mea-
sures which proxy for parental internalising and externalising traits. Table A.8 reports the
corresponding factor loadings (Column 1) and the signal (Column 2) for both the mother
and the father.
4.3 Other inputs
Our production model of socio-emotional skills accounts for the fact that the child is exposed
to other inputs, coming not only from the family environment but also from the external
environment. We include in our production model of socio-emotional skills, a number of
additional inputs such as health capital (including mother’s general health, reported by the
mother as excellent, good, fair or poor, and indicators of child and father’s long-standing
illness), neighbourhood capital (proxied by the local income decile) and social capital (mea-
sured as the presence of family and/or friends nearby). Finally, we include as additional
controls other family decisions that might have be taken jointly with the parental invest-
ment decisions. These include (i) mother’s labour supply, measured as the number of hours
worked; (ii) child care, measured by the number of daily hours the child is looked after not
by parents (e.g. nursery, child minder, nanny, grandparents) and the number of daily hours
the child spent in breakfast or afternoon club, (iii) mother’s fertility, i.e. whether the mother
has given birth between age 5 and 7 of the cohort child.
4.4 Descriptive statistics of the inputs
Table 3 details the mean and standard deviation by gender of the inputs described above,
all measured when the child is 7 years old. All the latent inputs that have been estimated
with factor models - sensitive parenting style, routines in parenting style, time investment,
mothers’ mental health and parents’ socio-emotional skills - have been standardized to have
mean 0 and standard deviation of 1. The descriptive statistics show that there exist a
statistically significant difference between boys and girls in the parental inputs that they
receive. Parents adopt a harsher (less sensitive) parenting style with boys than with girls
and invest more time in girls than in boys. On the contrary, there is no statistical gender
difference in parental daily routines, mother’s mental health and parental socio-emotional
skills. On average family OECD equivalised income is £497 and mothers are on average 18
years old when they leave education, with no differences between boys and girls.
18

Looking at the descriptives of the other inputs, 90% of the mothers report to have either
excellent or good health, whilst 20%, 15% and 23-24% of boys, girls and fathers report
a long-standing illness respectively. The areas where children live are on average ranked
between the fifth and the sixth income decile (neighbourhood capital) and 69% of children
live near family and friends (social capital). Finally, on average boys and girls spend 4.6
and 4.8 hours per day looked after by someone that is not the parent and they spend half
an hour per day in either breakfast or afternoon club. The average number of hours worked
by the mother is 17.4 per week and 13% or 14% of mothers has had another child when the
cohort child was between 5 and 7 years old.
5 Estimation Results
We estimate the production model for socio-emotional skills at age 11 as described in equa-
tion (6) using child fixed effect estimation. The dependent variable θNi,s,2 is the trait-specific
socio-emotional skill of the child at 11, in middle childhood (stage 2), which is a measure
of internalising behaviour for s = 1 and of externalising behaviour for s = 2.26 The right
hand side variables are the trait-specific socio-emotional skills of the child at age 6, in early
childhood (stage 1), θNi,s,1; the child cognitive skills in early childhood (age 6); the main
parental inputs of interest during middle childhood, between age 6 and 11, which are sen-
sitive parenting style, routines in parenting style, time investment, family income, mother’s
education and mothers’ mental health, and a set of other controls which we use as proxies for
potential omitted inputs to control for potential endogeneity. These extra control variables
are mother working hours per week, hours spent by the child in non-parental care and in
school clubs, fertility (the birth of another sibling), and three measures of neighbourhood,
social and health capital (see Section 4.3 for more details).
Before presenting our results, we remind the reader of the aim of our paper. We are
interested to assess whether there is complementarity or substitutability between parental
inputs in middle childhood and child socio-emotional skills in early childhood (at age 6) in
producing socio-emotional skills in middle childhood (at age 11). To test for this, we allow
the productivity of each parental input to change across quartiles of socio-emotional skills
in early childhood.27 In addition and as an extension to previous economic papers on child
skill formation, we also allow the productivity of each parental input to vary between high
26To be more precise, θNi,1,2 and θNi,2,2 are factors derived from the measurement models described inSection 3.2.
27We chose quartiles because finer partitions of the distribution would lead to imprecise estimates.
19

and low levels of the parental input as defined by levels above and below the median.28
This high level of flexibility of our model is motivated by the psychological literature. Low
levels of parental inputs can cause a stressful home environment that, when interacted with
a child predisposition to psychological problems, can lead to the development of behavioural
disorders as predicted by the psychological hypothesis diathesis-stress.29 We therefore expect
a child with low socio-emotional skills in early childhood, which can be an indicator of a
predisposition to psychological problems, to be more vulnerable to a change in a parental
input when this input is low and causing a more stressful home environment. Conversely,
we expect a child with high socio-emotional skills in early childhood to be more resilient to
a change in a parental input which is low. This would imply substitutability rather than
complementarity for low levels of a parental input, as exemplified in Figure 1 by the steeper
slope of the dotted line in Panel A with respect to the dotted line in Panel B for levels of
inputs that are low.
Why might we expect complementarity for high levels of the inputs? Firstly, complemen-
tarity would be consistent with the early years of childhood being sensitive or critical periods
for socio-emotional skill development, for high level of inputs (Cunha and Heckman 2008).30
Secondly, high levels of parental inputs characterise an enriched home environment that,
according to the psychological hypothesis vantage sensitivity, can represent an environment
more beneficial for children with high rather than low level of skills in early childhood (see
Pluess 2015). Consequently, a child with high socio-emotional skills in early childhood, which
can be an indicator of vantage sensitivity, may be more sensitive to an increase in a parental
input when this input is already high and enriched. This would imply complementarity for
high level of parental inputs, as exemplified in Figure 1 by the flatter slope of the solid line
in Panel A with respect to the solid line in Panel B for high level of inputs.
Table 4 reports our benchmark results separately for boys and girls in Panel A and B
respectively. Because we use child fixed effect estimation we identify and report only the
differential rather than the absolute productivity of each of the parental inputs for children
at the second (column 1), third (column 2) and fourth (column 3) quartiles relative to the
28When allowing the productivity of each parental input to vary across more fine partition of the dis-tribution (e.g. deciles), we get estimates that, although imprecise, suggest that changes in the comple-mentarity/substitutability pattern of parental inputs occurs only when moving from below to above themedian.
29This hypothesis is also known as disadvantage sensitivity because it implies a vulnerability to a negativehome environment (see for a definition of such sensitivity hypothesis Monroe and Simons 1991; Belsky andPluess 2009).
30During sensitive periods parental investments into child development have relatively high returns andthe critical periods of investments are the vital period during childhood for investments to occur.
20

first quartile of the socio-emotional skills in early childhood31 and separately for levels of the
parental input below and above the median, which are reported in the first and second row
of each sub-panel respectively. The socio-emotional skills at 6 and 11 and all parental inputs
are standardized to have mean zero and variance one.32 A negative (positive) differential
productivity at higher quartiles with respect to the first quartile indicates the presence of
substitutability (complementarity). At the bottom of each of the two panels we report the
self-productivity or persistence parameter for socio-emotional skills; this is computed keeping
all other inputs at the mean and it represents the effect of one standard deviation increase
of socio-emotional skills at 6 on socio-emotional skills at 11, also expressed in standard
deviations.
Looking at boys and focusing on sensitive parenting style (see Table 4, Panel A, first
sub-panel), we find substitutability for levels of the sensitive parenting style below the me-
dian and complementarity for levels above the median; these results are consistent with the
implications of the diathesis-stress and vantage sensitivity hypotheses represented in Figure
1 by the dotted lines below the median and solid lines above the median.
In the first row of Panel A of Table 4, we find that an increase in sensitive parenting by
one standard deviation for harsh parents (parents with a sensitive parenting style below the
median) raises skills at age 11 by 30.0% and 27.5% of a standard deviation less for children
in the third and fourth quartile of socio-emotional skills at age 6 compared to those in the
first quartile. This implies that boys with low socio-emotional skills at age 6 (in the bottom
two quartiles) are more vulnerable to a decrease in sensitive parenting compared to higher
skilled children (in the third or fourth quartile) who are relatively resilient. These results
are consistent with the diathesis-stress hypothesis, as low levels of sensitive parenting, i.e.
harsh parental discipline such as smacking or shouting at the child, can increases the child’s
stress and especially affect children who have low socio-emotional skills.
On the other hand, an increase in parenting style for parents initially adopting a more
sensitive style of parenting (sensitive parenting style above the median) would not indicate a
movement away from a stressful environment but rather an even more enriched environment.
The vantage sensitivity hypothesis would then suggest that children with relatively high
socio-emotional skills at age 6 are more sensitive to such improvements in sensitive parenting.
This is confirmed by our results which indicate that an improvement in sensitive parenting
statistically significantly increases socio-emotional skills at age 11 by around 50.4% and 45.9%
31The quartiles are defined separately for boys and girls.32The only exceptions are dummy variable inputs which are not standardized and family income and
mother’s education which are demeaned.
21
of a standard deviation more for boys in the third and fourth quartile of the distribution at
age 6 compared to those in the first quartile (see the second row of Panel A in Table 4).
For boys, we find evidence for neither complementarity nor substitutability in any other
of the inputs, which imply that those inputs do not have a heterogeneous effect by socio-
emotional skills. For brevity, Table 4 reports the coefficients only on inputs for which we
found either substitutability or complementarity, for boys and/or for girls. Results for the
remaining main inputs are reported in Appendix Table A.9, whereas results for the re-
maining control variables are reported in Appendix Table A.10.33 Finally, looking at the
self-productivity parameter (see the fourth sub-panel of Panel A in Table 4), we find that a
standard deviation increase in socio-emotional skills at age 6 raises socio-emotional skills at
age 11 by 47.0% of a standard deviation.
The pattern in the productivity of sensitive parenting style for girls is similar to the one
observed for boys (see first sub-panel of Panel B in Table 4). We find substitutability between
sensitive parenting style and early socio-emotional skills for levels of the parental input
below the median and complementarity for levels of the input above the median, confirming
again the implications of the psychological hypotheses represented in Figure 1 by the dotted
lines below the median and solid line above the median. Notice that the productivity of
sensitive parenting style at the first quartile is not statistically significantly different from
the productivity at the second and third quartiles; but it is statistically significantly different
than the productivity at the top quartile for both low and high levels of sensitive parenting.
For girls, we also find a pattern in the productivity of time investment which is very similar
to the one observed for sensitive parenting (see third sub-panel of Panel B in Table 4). This
seems to suggest that levels of parental time investments below the median may cause a
more stressful home environment for girls. Moreover, this result is also consistent with the
evidence provided in Baker and Milligan (2016) finding that parents tend to invest more
time in girls compared to boys.
Finally, for girls, we find even stronger evidence of substitutability between maternal
mental health and early socio-emotional skills for levels of the maternal mental health below
the median (see second sub-panel of Panel B in Table 4), again supporting the diathesis-
stress hypothesis. Girls with early socio-emotional skills in the bottom quartile are more
vulnerable to a decrease in mothers’ mental health, as their socio-emotional skills at age 11
33In a robustness check, available upon request to the authors, we also include school inputs measuredby years of experience of the school teachers, which is a variable available only for a smaller sub-sample.The results show that this school input does not have a statistically significant differential effect across thesocio-emotional skills at age 6.
22

decrease by 18.3-20.9% of a standard deviation more compared to girls with early skills in
the top three quartiles. On the contrary, if maternal mental health is above the median, an
increase of the maternal input is more beneficial for girls in the second or third quartile of
the socio-emotional skills distribution at 6, compared to those in the bottom quartile who
are relatively resistant to this improvement. That the differential effect of mothers’ mental
health at the bottom quartile of the child socio-emotional skills is statistically significant
only for girls and not for boys is consistent with previous empirical studies which have found
the intergenerational transmission of mental health to be stronger from mothers to girls than
from mothers to boys. E.g., Powdthavee and Vignoles (2008) find a statistically insignificant
effect of maternal negative emotional stress on boys, but a strong effect on girls, when the
children are in adolescence.34
Ultimately, our findings suggest that policy can help children who are lagging behind in
terms of socio-emotional skills with interventions in middle childhood aiming at improving
specific parental inputs but only if these interventions are targeted to parents with low
levels of these inputs. To provide some information on the size of the potential effect of
these interventions, we adopt a “back on the envelope” computation. This makes use of
our estimated coefficients in Table 4 to predict the reduction in the socio-emotional skills
gap at 11 caused by an increase in each of the inputs. The predicted reduction is computed
comparing the predicted gap in socio-emotional skills at 11 with and without assuming an
increase in a specific parental input. In Table 5 we show the predicted reduction in the gap
in socio-emotional skills at 11 caused by an increase of 1 standard deviation in the parental
input (reported at the start of the row), for parents with a level of the input below the
median and holding all other inputs are at their mean. The gaps are the differences in socio-
emotional skills at 11 between a child who was at the second (column 2), third (column 3)
and fourth quartile (column 4) of the socio-emotional skills at 6 with respect to a child at
the bottom quartile.35
Looking at results for boys in Table 5, we find large reductions in the gaps when consid-
ering an increase in sensitive parenting which range between 21% and 34%, but much more
modest reductions when considering equivalent increases in the mother’s mental health or
in the parental time. Results for girls suggest that an increase by one standard deviation
in sensitive parenting style, mother’s mental health and parental time investments leads to
substantial reductions in the gaps in socio-emotional skills at 11 for girls. This is especially
34Results for the remaining main inputs are reported in Appendix Table A.9, whereas results for theremaining control variables are reported in Appendix Table A.10.
35When considering a child in the q-th quartile of the socio-emotional skills at 6, we assume that his/herlevel of socio-emotional skills is equal to the average level observed for children in the q-th quartile.
23

true when increasing the mother’s mental health which could close up to 52% of the gap.
In conclusion, results of this “back on the envelope” computation provides further evidence
that interventions aiming at increasing certain parental inputs, when they are low, could be
cost-effective to help children to catch-up their socio-emotional skills.
6 Validity of Model Assumptions
In this section we provide supportive evidence for the three main identification assumptions
of our model: (i) invariance of the production model across the two trait-specific socio-
emotional skills; (ii) random variation in the child predisposition to either internalising or
externalising problems in early life; (iii) absence of omitted inputs which are correlated with
the included inputs and whose productivity varies across the distribution of early socio-
emotional skills.
First, the latent traits for externalising and internalising are assumed to follow the same
dynamic production model. In practice this means assuming invariance of the effect of inputs,
shocks and early childhood skills across externalising and internalising traits.
The assumption that the effect of inputs and shocks is the same for externalising as in-
ternalising traits may be violated if for example, the response to a particular shock leads to
children internalising over externalising, or vice versa. However, there is evidence from the
economics and psychology literatures of a similar reaction of externalising and internalising
traits in response to shocks to income (Akee et al., 2018), divorce (Lansford et al., 2006)
and parent maltreatment (Anthonysamy and Zimmer-Gembeck, 2007; Maschi et al., 2008).
To give some more detail, Akee et al. (2018) analyse the effect of an unconditional cash
transfer to participants of the Great Smoky Mountains study. The authors find very simi-
lar effects between emotional and behavioural problems, corresponding to our measures of
internalising and externalising behaviour. Similarly Lansford et al. (2006) find very similar
patterns when examining how parental divorce affects the average development trajectory of
externalising compared to internalising traits. Finally, Anthonysamy and Zimmer-Gembeck
(2007) has documented that externalising and internalising problems develop in a similar
manner following episodes of child abuse.
The assumption of invariance of the persistence is not confirmed by previous empirical
studies, which find that externalising behaviours tend to decrease across child age, whereas
the internalising behaviours tend to increase (see e.g. Bornstein et al. 2010; Gilliom and
24
Shaw 2004). For this reason, we also consider the estimation of a model that allows the
self-productivity coefficient to change between internalising and externalising, with results
reported in Appendix Table A.11. We do not reject the assumption of invariance of the
persistence between the two trait-specific socio-emotional skills at 5% level, neither for boys
nor for girls. In addition, the differential productivity coefficients of parental inputs remain
similar and our conclusions relating to the interactions between inputs and lagged socio-
emotional skills remain the same.
Secondly, we assume that the variation in the deviation of a trait-specific socio-emotional
skill from the mean across the two traits, which we use when we consider the child fixed effect
estimation, picks up a random predisposition to externalising or internalising behaviours. To
understand if this is the case, we consider all potential sources of variation in the differences
between externalising and internalising behaviours at age 6. These differences may be due
to an innate random predisposition, as we assume, or to three other potential sources which
we now discuss in turn.
It could be that the within child deviation in lagged externalising and internalising traits
comes from differences in trait-specific inputs. The only trait-specific inputs that could
explain the trait-specific socio-emotional skills at age 6 and 11 are the trait-specific socio-
emotional skills of the parents, which can be transmitted to children. In a sensitivity analysis
we estimate our model including both mothers’ and fathers’ trait-specific socio-emotional
skills to control for such intergenerational transmission (see Panel A and B in Table A.12 for
boys and girls respectively).36 The conclusions from our benchmark results are unchanged
once we control for parent trait-specific socio-emotional skills. It is not expected that other
individuals who interact with the child, for example teachers, would make trait-specific in-
vestments in children. We conclude that the variation in child’s trait-specific socio-emotional
skills are not caused by other trait specific investments.
Next, the differences between the measures of internalising and externalising behaviours
can be caused by measurement errors in the mother reports of child socio-emotional skills.
However, in our main specification we control for this by estimating a latent factor, and
furthermore Section 7 below shows that our results are robust to measures of child behaviour
using teachers reports.
Moreover, there may be differences in the effects of past investments and inputs between
externalising and internalising behaviours. Nevertheless, as discussed above, this is incon-
36The subsample with details on both father and mother trait-specific skills is smaller. Table A.13 showsdescriptive statistics for such subsample.
25

sistent with the evidence which shows that events including family income shocks (Akee
et al., 2018), divorce (Lansford et al., 2006) and parent maltreatment (Anthonysamy and
Zimmer-Gembeck, 2007; Maschi et al., 2008) induce a similar reaction in externalising and
internalising behaviours. Furthermore, even in presence of past investments and inputs with
effects that vary between externalising and internalising behaviours at age 6, their omission
would not cause any endogeneity bias for the estimation of the production model at age 11 as
long as they do not have a direct effect on socio-emotional skills at 11 which varies between
the two traits.
Therefore, given that we can rule out all other potential sources of endogenous variation
in the differences between externalising and internalising behaviours at age 6, we conclude
that the source comes primarily from a random innate predisposition to internalising and
externalising behaviours.
Finally, our third identification assumption is that are no omitted inputs in our model
whose returns change across levels of the socio-emotional skills at 6. This assumption is
needed to guarantee the exogeneity of the parental inputs in our estimation model. Because
we adopt a child fixed effect estimation, we are able to control for any omitted input which
is invariant across the two trait-specific socio-emotional skills. Nevertheless, omitted inputs
whose effects differ across the distribution of early socio-emotional skills can still bias our
estimation if they are correlated with our parental inputs of interest. As explained in Section
3.1, our model includes a much larger set of inputs than just the parental inputs of interests.
Our results in Appendix Table A.10 show there is no evidence of differential returns to these
inputs across early socio-emotional skills even when considering events which could cause a
shock in the child’s life and therefore some behavioural reactions, such as the birth of another
child (fertility), having a mother with poor health or a father with longstanding illness. In
addition, it may be that parental inputs measured before the child was aged 6 can cause
an omitted variable bias. Therefore in Tables A.14 and A.15 we control additionally for
the three main inputs of sensitive parenting, time investments and mothers’ mental health,
measured when the child was aged 3. Our results are robust to this addition, indicating
there are no concerns about the endogeneity of the parental inputs.
7 Sensitivity Analysis
To ensure that there are no other endogeneity issues threatening our identification strategy,
we run several robustness checks where we (i) use mother and teacher reports to correct
26
for measurement error; (ii) test for differences in self-productivity across quartiles of socio-
emotional skills at age 6; (iii) anchor socio-emotional skills to a real-life measure.
A first sensitivity analysis controls for the measurement error in the child socio-emotional
skills reported by the mother. The mother reports could be systematically biased and cor-
related with mothers mental health as found by Del Bono et al. (2017). Controlling for the
measurement error in the child socio-emotional skills, by using both mother’s and teacher’s
reports to derive the latent factors for internalising and externalising behaviours, does not
seem cause any large change in the estimated coefficients (see Table A.16).37 However, the
estimates are not identical and are less precisely estimated, most likely due to the smaller
sample size. We conclude that there is no systematic empirical bias for our benchmark re-
sults. The lack of measurement error bias in our estimates is probably explained by the
fact that we use latent factors for the two socio-emotional skills and that the child fixed
effect estimation exploits variation in socio-emotional skills within child and across traits
and therefore corrects for any potential measurement error which is shared across different
measures of socio-emotional skills reported by the mother.
Our second sensitivity analysis relaxes the assumption of linearity in the socio-emotional
skills at 6 imposed by our benchmark model (6) by allowing the self-productivity coefficient ρ
to vary across different quartiles of the socio-emotional skills at 6. Results of this specification
are shown Table A.17 in the Appendix for boys and girls, in Panel A and B respectively. We
do not reject the hypothesis of equality of the self-productivity coefficient across quartile at
5% level of significance, therefore the linearity assumption in our benchmark model is not
rejected.
Finally, the lack of a natural metric of our socio-emotional skills implies that our results
might be sensitive to arbitrary scaling of socio-emotional skills. This is especially an issue
when regressing an arbitrarily scaled outcomes on arbitrarily scaled lagged outcomes (see
Cunha and Heckman 2008; Cunha et al. 2010; Bond and Lang 2013).38 We follow Cunha
et al. (2010) and re-scale socio-emotional skills by anchoring them to a measure with a well
defined scale, which in our case is smoking behaviour at age 14. Using the latest wave
of the MCS, we construct an indicator of whether the child has ever smoked at age 14,
taking value 0 if the child has smoked and 1 if the child has never smoked. We regress the
37We use a latent factor model to combine measures of socio-emotional skills using the repeated measuresreported by the mother at age 5 and 7 and the measures reported by the teacher at age 7.
38Notice that arbitrary rescaling is less of an issue when considering the different quartiles of the socio-emotional skills at age 6 given that any monotonic transformation of the socio-emotional skills would yieldthe same values for each of these quartiles.
27
smoking dummy separately on internalising and externalising behaviour at ages 6 and 11
using linear spline regression. Then we import the estimated coefficients into our estimation
sample and perform our analysis on socio-emotional skills transformed into the probability
of non-smoking.
Table A.18 in the Appendix displays the results for boys and girls, in Panel A and B
respectively. Looking at the degree of self-productivity, we find an increase in socio-emotional
skills at age 6 that corresponds to 1 percent increase in the probability of non-smoking
raises the socio-emotional skills at age 11 of an amount that corresponds to an increase in
the probability of non-smoking of 0.44 percentage points for boys and of 0.30 percentage
points for girls. These results confirm that the higher self-productivity observed among
boys compared to girls in our benchmark results is not affected by the scale of the observed
measures. The anchoring exercise confirms all our benchmark results including the evidence
on substitutability and complementarity between the parental inputs and socio-emotional
skills at age 6 in producing socio-emotional skills at age 11.
8 Conclusions
Existing empirical evidence suggest that inequalities in socio-emotional and cognitive skills
are present before children start schooling and persist across their childhood. However, socio-
emotional skills tend to be malleable much further into childhood than cognitive skills; this
suggests that these early life differences can be attenuated through interventions in middle
childhood, e.g. introducing public policies that support parents to improve their parenting
behaviour.
To assess the potential usefulness of such interventions in middle childhood and to identify
which types of parental inputs should be targeted, we evaluate the degree of complemen-
tarity and/or substitutability between different types of parental inputs and socio-emotional
skills at age 6 in producing socio-emotional skills at age 11. In particular, we test whether
there is heterogeneity across quartile of socio-emotional skills at age 6 in the productivity
of the following six parental inputs: sensitive parenting style, routines parenting style, time
investment, family income, mother’s cognitive skills and mother’s mental health.
We find evidence of substitutability between socio-emotional skills at 6 and parental
inputs that help reducing child’s stress, for both boys and girls. Children with low socio-
emotional skills early in life are more vulnerable to a stressful home environment, such as
28
harsh parenting, poor mothers’ mental health and low parental time investment. An im-
provement of these inputs when the initial values these parental inputs is below the median
is more beneficial for children with low rather than high socio-emotional skills in early child-
hood. In line with existing evidence in the child development literature our findings suggest
that the early years are crucial for the development of socio-emotional skills, as children
with low skills at age 6 are set on a different trajectory of skill development up to age 11
compared to those with high early skills.
Coming back to our initial question of whether interventions in middle childhood can be
effective to narrow the gaps in socio-emotional skills, the short answer is yes. Nevertheless,
to be cost-effective such interventions should be aimed at raising parental inputs that reduce
stressful environment experiences for the child and should be targeted exclusively to par-
ents with low level of such parental inputs. Specifically, a policy aiming at reducing harsh
(increasing sensitive) parenting, improving mother’s mental health and increasing parental
time investment targeted to parents whose level of these inputs is below the median and
therefore indicative of a stressful home environment, would be effective in shrinking gaps in
socio-emotional skills of children in middle childhood.
References
Achenbach, T. M. (1966). The classification of children’s psychiatric symptoms: a factor-
analytic study. Psychological Monographs: general and applied, 80(7):1.
Achenbach, T. M., Ivanova, M. Y., Rescorla, L. A., Turner, L. V., and Althoff, R. R. (2016).
Internalizing/externalizing problems: Review and recommendations for clinical and re-
search applications. Journal of the American Academy of Child & Adolescent Psychiatry,
55(8):647–656.
Agostinelli, F. and Wiswall, M. (2016). Estimating the technology of children’s skill forma-
tion. National Bureau of Economic Research, (NBER) Working Paper No. 22442.
Akee, R., Copeland, W., Costello, E. J., and Simeonova, E. (2018). How does house-
hold income affect child personality traits and behaviors? American Economic Review,
108(3):775–827.
Anthonysamy, A. and Zimmer-Gembeck, M. J. (2007). Peer status and behaviors of mal-
treated children and their classmates in the early years of school. Child Abuse & Neglect,
31(9):971–991.
29

Attanasio, O., Cattan, S., Fitzsimons, E., Meghir, C., and Rubio-Codina, M. (2015). Es-
timating the production function for human capital: Results from a randomized control
trial in Colombia. National Bureau of Economic Research, (NBER) Working Paper No.
20965.
Attanasio, O., Meghir, C., Nix, E., and Salvati, F. (2017). Human capital growth and
poverty: Evidence from Ethiopia and Peru. Review of Economic Dynamics, 25:234–259.
Baker, M. and Milligan, K. (2016). Boy-girl differences in parental time investments: Evi-
dence from three countries. Journal of Human Capital, 10(4):399–441.
Bandiera, O., Larcinese, V., and Rasul, I. (2010). Heterogeneous class size effects: New
evidence from a panel of university students. The Economic Journal, 120(549):1365–1398.
Belsky, J. and Pluess, M. (2009). Beyond diathesis stress: Differential susceptibility to
environmental influences. Psychological bulletin, 135(6):885.
Bertrand, M. and Pan, J. (2013). The trouble with boys: Social influences and the gender
gap in disruptive behavior. American Economic Journal: Applied Economics, 5(1):32–64.
Bond, T. N. and Lang, K. (2013). The evolution of the black-white test score gap in grades
k–3: The fragility of results. Review of Economics and Statistics, 95(5):1468–1479.
Bornstein, M. H., Hahn, C.-S., and Haynes, O. M. (2010). Social competence, externalizing,
and internalizing behavioral adjustment from early childhood through early adolescence:
Developmental cascades. Development and psychopathology, 22(4):717–735.
Carneiro, P. and Heckman, J. (2003). Human capital policy. National Bureau of Economic
Research, (NBER) Working Paper No. 9495.
Carneiro, P. M., Garcia, I. L., Salvanes, K. G., and Tominey, E. (2015). Intergenerational
mobility and the timing of parental income. CEMMAP working paper CWP66/15.
Clotfelter, C. T., Ladd, H. F., and Vigdor, J. L. (2010). Teacher credentials and student
achievement in high school a cross-subject analysis with student fixed effects. Journal of
Human Resources, 45(3):655–681.
Cobb-Clark, D. A., Salamanca, N., and Zhu, A. (2016). Parenting style as an investment in
human development. Discussion paper series, IZA DP No. 9686.
Cunha, F. and Heckman, J. J. (2008). Formulating, identifying and estimating the technology
of cognitive and noncognitive skill formation. Journal of Human Resources, 43(4):738–782.
30
Cunha, F., Heckman, J. J., and Schennach, S. M. (2010). Estimating the technology of
cognitive and noncognitive skill formation. Econometrica, 78(3):883–931.
Dahl, G. B. and Lochner, L. (2012). The impact of family income on child achievement:
Evidence from the earned income tax credit. American Economic Review, 102(5):1927–56.
Dee, T. S. (2007). Teachers and the gender gaps in student achievement. Journal of Human
Resources, 42(3):528–554.
Del Boca, D., Flinn, C., and Wiswall, M. (2013). Household choices and child development.
Review of Economic Studies, 81(1):137–185.
Del Boca, D., Monfardini, C., and Nicoletti, C. (2017). Parental and child time investments
and the cognitive development of adolescents. Journal of Labor Economics, 35(2):565–608.
Del Bono, E., Francesconi, M., Kelly, Y., and Sacker, A. (2016). Early maternal time
investment and early child outcomes. The Economic Journal, 126(596).
Del Bono, E., Kinsler, J., and Pavan, R. (2017). Estimating the technology of skill formation
and maternal well-being. mimeo.
Del Giudice, M. (2018). Middle childhood: An evolutionary-developmental synthesis. In
Handbook of life course health development, pages 95–107. Springer, Cham.
Dex, S. and Joshi, H. (2005). Children of the 21st century: from birth to nine months. Policy
Press.
Doepke, M. and Zilibotti, F. (2017). Parenting with style: Altruism and paternalism in
intergenerational preference transmission. Econometrica, 85(5):1331–1371.
Elliott, C. D., Smith, P., and McCulloch, K. (1997). British ability scale, second edition.
administration and scoring manual. Technical report, London:NFER-Nelson.
Fiorini, M. and Keane, M. P. (2014). How the allocation of children’s time affects cognitive
and noncognitive development. Journal of Labor Economics, 32(4):787–836.
Garcıa, J. L. and Gallegos, S. (2017). Dynamic complementarity or substitutability? parental
investment and childcare in the production of early human capital. Available at SSRN:
https://ssrn.com/abstract=2910167 or http://dx.doi.org/10.2139/ssrn.2910167.
Gilliom, M. and Shaw, D. S. (2004). Codevelopment of externalizing and internalizing prob-
lems in early childhood. Development and psychopathology, 16(2):313–333.
31

Goodman, R. (1997). The strengths and difficulties questionnaire: a research note. Journal
of Child Psychology and Psychiatry, 38(5):581–586.
Hansen, K., Johnson, J., Joshi, H., et al. (2012). Millennium Cohort Study, first, second,
third and fourth surveys: a guide to the datasets. London: Centre for Longitudinal Studies,
Institute of Education.
Heckman, J. J. and Mosso, S. (2014). The economics of human development and social
mobility. Annual Review of Economics, 6(1):689–733.
Heckman, J. J. and Rubinstein, Y. (2001). The importance of noncognitive skills: Lessons
from the ged testing program. The American Economic Review, 91(2):145–149.
Heckman, J. J., Stixrud, J., and Urzua, S. (2006). The effects of cognitive and noncognitive
abilities on labor market outcomes and social behavior. Journal of Labor Economics,
24(3):411–482.
Kautz, T., Heckman, J. J., Diris, R., Ter Weel, B., and Borghans, L. (2014). Fostering and
measuring skills: Improving cognitive and non-cognitive skills to promote lifetime success.
National Bureau of Economic Research, (NBER) Working Paper No. 20749.
Kessler, R. C., Andrews, G., Colpe, L. J., Hiripi, E., Mroczek, D. K., Normand, S.-L.,
Walters, E. E., and Zaslavsky, A. M. (2002). Short screening scales to monitor popula-
tion prevalences and trends in non-specific psychological distress. Psychological medicine,
32(6):959–976.
Lansford, J. E., Malone, P. S., Castellino, D. R., Dodge, K. A., Pettit, G. S., and Bates, J. E.
(2006). Trajectories of internalizing, externalizing, and grades for children who have and
have not experienced their parents’ divorce or separation. Journal of family Psychology,
20(2):292.
Lavy, V., Silva, O., and Weinhardt, F. (2012). The good, the bad, and the average: Evidence
on ability peer effects in schools. Journal of Labor Economics, 30(2):367–414.
Liu, H., Mroz, T. A., and Van der Klaauw, W. (2010). Maternal employment, migration,
and child development. Journal of Econometrics, 156(1):212–228.
Maschi, T., Morgen, K., Bradley, C., and Hatcher, S. S. (2008). Exploring gender differences
on internalizing and externalizing behavior among maltreated youth: Implications for
social work action. Child and Adolescent Social Work Journal, 25(6):531–547.
32

Monroe, S. M. and Simons, A. D. (1991). Diathesis-stress theories in the context of life stress
research: implications for the depressive disorders. Psychological Bulletin, 110(3):406.
Moroni, G. (2018). Explaining divorce gap in cognitive and non-cognitive skills of children.
University of York, Discussion Papers in Economics, No 18/16.
Mueller, S. (2013). Teacher experience and the class size effect—experimental evidence.
Journal of Public Economics, 98:44–52.
Nicoletti, C. and Rabe, B. (2014). School inputs and skills: Complementarity and self-
productivity. IZA Discussion Paper No. 8693.
Nicoletti, C. and Rabe, B. (2017). The effect of school spending on student achievement:
addressing biases in value-added models. Journal of the Royal Statistical Society: Series
A (Statistics in Society), 181(2):487–515.
Pluess, M. (2015). Individual differences in environmental sensitivity. Child Development
Perspectives, 9(3):138–143.
Powdthavee, N. and Vignoles, A. (2008). Mental health of parents and life satisfaction of
children: A within-family analysis of intergenerational transmission of well-being. Social
Indicators Research, 88(3):397–422.
Straus, M. A. and Hamby, S. L. (1997). Measuring physical & psychological maltreatment
of children with the conflict tactics scales. In G. K. Kantor & J.L.Jasinski (Eds.) Out of
the darkness: Contemporary research perspectives on family violence.
33
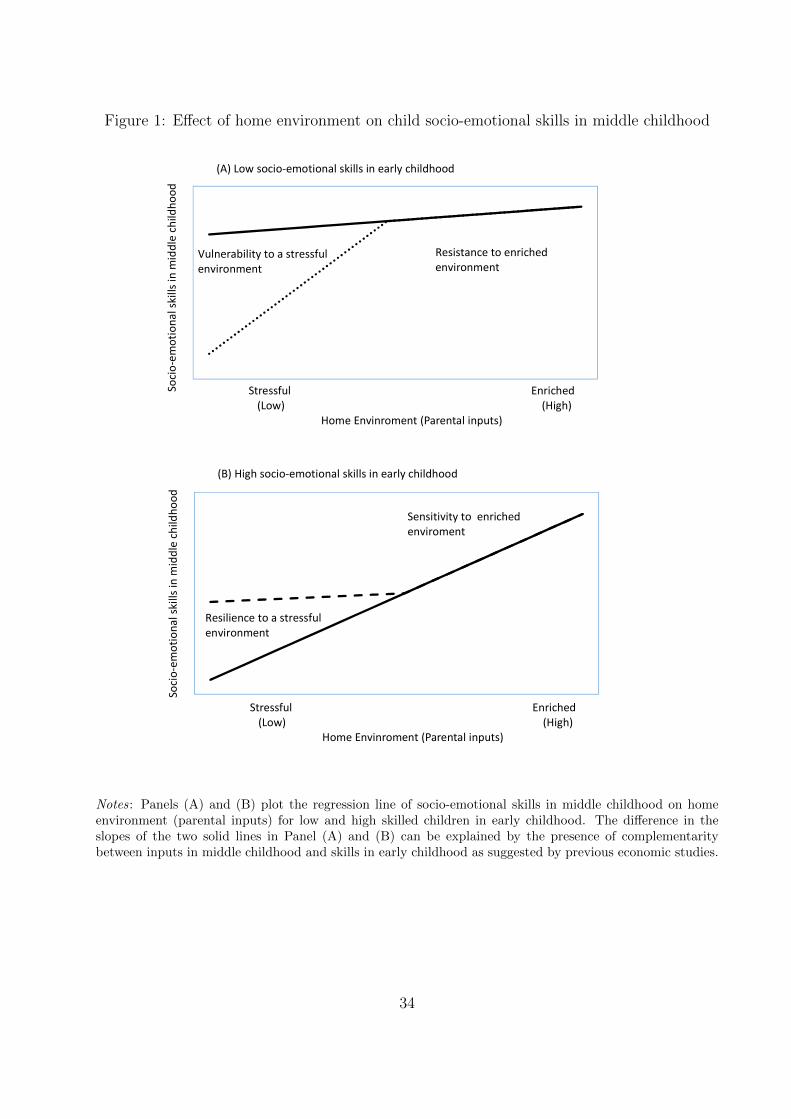
Figure 1: Effect of home environment on child socio-emotional skills in middle childhood
Socio
-em
otio
nal s
kills
in m
iddl
e ch
ildho
od
Stressful Enriched(Low) (High)
Home Envinroment (Parental inputs)
(A) Low socio-emotional skills in early childhood
Vulnerability to a stressfulenvironment
Resistance to enriched environment
Socio
-em
otio
nal s
kills
in m
iddl
e ch
ildho
od
Stressful Enriched(Low) (High)
Home Envinroment (Parental inputs)
(B) High socio-emotional skills in early childhood
Resilience to a stressful environment
Sensitivity to enriched enviroment
Notes: Panels (A) and (B) plot the regression line of socio-emotional skills in middle childhood on homeenvironment (parental inputs) for low and high skilled children in early childhood. The difference in theslopes of the two solid lines in Panel (A) and (B) can be explained by the presence of complementaritybetween inputs in middle childhood and skills in early childhood as suggested by previous economic studies.
34

Table 1: SDQ Questionnaire. Details on items for each scale.
Scale Items within scale
1) Emotional symptoms
a. Complaints of headaches/stomach aches/sickness
b. Often seems worried
c. Often unhappy
d. Nervous or clingy in new situations
e. Many fears, easily scared.
2) Peer Problems
a. Tends to play alone
b. Has at least one good friend*
c. Generally liked by other children*
d. Picked on or bullied by other children
e. Gets on better with adults.
3) Conduct problems
a. Often has temper tantrums
b. Generally obedient*
c. Fights with or bullies other children
d. Can be spiteful to others
e. Often argumentative with adults.
4) Hyperactivity
a. Restless, overactive, cannot stay still for long
b. Constantly fidgeting
c. Easily distracted
d. Can stop and think before acting*
e. Sees tasks through to the end*.
Notes: For ease of interpretation each scale is reverse coded, with higher values associated with
higher levels of socio-emotional skills (or lower levels of socio-emotional problems). * denotes items
that are reversed when computing the total score for each type of behavioural problem (scale). All
of the 25 items are related with a statement on the child and the parent has to indicate whether the
statement is ‘true’, ‘somewhat true’ or ‘not true’. Each of the 4 scales can be used alone or together
to create: (i) total difficulties score when 1-4 are taken together ; (ii) an internalising behavioural
score combining 1 and 2 ; (iii) an externalising behavioural score combining 3 and 4.
35

Table 2: Descriptive statistics of child’s skills, Raw Measures
Boys Girls Test diff
mean sd mean sd p-value
Socio-emotional skills age 5
Internalising behaviour
Emotional Symptoms 8.813 1.474 8.765 1.434 0.181
Peer Problems 8.976 1.369 9.128 1.226 0.000
Externalising behaviour
Conduct Problems 8.605 1.401 8.827 1.295 0.000
Hyperactivity Problems 6.718 2.297 7.406 2.098 0.000
Socio-emotional skills age 7
Internalising behaviour
Emotional Symptoms 8.699 1.621 8.631 1.575 0.090
Peer Problems 8.973 1.444 9.100 1.288 0.000
Externalising behaviour
Conduct Problems 8.704 1.440 8.983 1.286 0.000
Hyperactivity Problems 6.539 2.437 7.445 2.243 0.000
Socio-emotional skills age 11
Internalising behaviour
Emotional Symptoms 8.424 1.857 8.234 1.910 0.000
Peer Problems 8.810 1.604 8.938 1.508 0.001
Externalising behaviour
Conduct Problems 8.693 1.514 8.937 1.349 0.000
Hyperactivity Problems 6.759 2.457 7.698 2.134 0.000
Cognitive skills age 5
BAS:Picture similarities 82.669 10.995 83.906 10.886 0.000
BAS:Reading abilities 111.198 14.769 111.750 13.986 0.123
BAS:Pattern construction 89.204 18.492 91.604 16.848 0.000
Cognitive skills age 7
NFER: Maths test 10.119 2.706 9.977 2.511 0.029
BAS:Reading abilities 108.986 30.615 112.721 26.530 0.000
BAS:Pattern construction 118.040 16.432 119.474 15.167 0.000
Observations 3217 3235 6452
Notes: Last column reports the p-value of the test for the equality of means between boys and girls. Data:
UK Millennium Cohort Study, Main Sample.
36
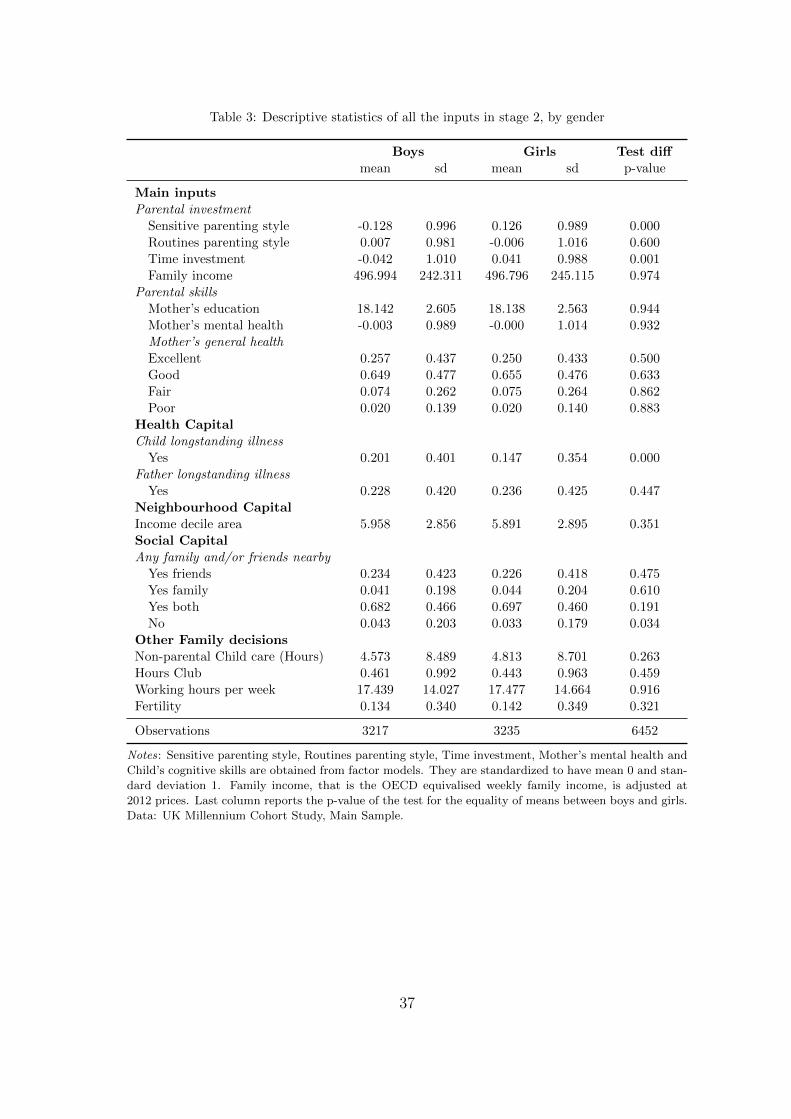
Table 3: Descriptive statistics of all the inputs in stage 2, by gender
Boys Girls Test diff
mean sd mean sd p-value
Main inputs
Parental investment
Sensitive parenting style -0.128 0.996 0.126 0.989 0.000
Routines parenting style 0.007 0.981 -0.006 1.016 0.600
Time investment -0.042 1.010 0.041 0.988 0.001
Family income 496.994 242.311 496.796 245.115 0.974
Parental skills
Mother’s education 18.142 2.605 18.138 2.563 0.944
Mother’s mental health -0.003 0.989 -0.000 1.014 0.932
Mother’s general health
Excellent 0.257 0.437 0.250 0.433 0.500
Good 0.649 0.477 0.655 0.476 0.633
Fair 0.074 0.262 0.075 0.264 0.862
Poor 0.020 0.139 0.020 0.140 0.883
Health Capital
Child longstanding illness
Yes 0.201 0.401 0.147 0.354 0.000
Father longstanding illness
Yes 0.228 0.420 0.236 0.425 0.447
Neighbourhood Capital
Income decile area 5.958 2.856 5.891 2.895 0.351
Social Capital
Any family and/or friends nearby
Yes friends 0.234 0.423 0.226 0.418 0.475
Yes family 0.041 0.198 0.044 0.204 0.610
Yes both 0.682 0.466 0.697 0.460 0.191
No 0.043 0.203 0.033 0.179 0.034
Other Family decisions
Non-parental Child care (Hours) 4.573 8.489 4.813 8.701 0.263
Hours Club 0.461 0.992 0.443 0.963 0.459
Working hours per week 17.439 14.027 17.477 14.664 0.916
Fertility 0.134 0.340 0.142 0.349 0.321
Observations 3217 3235 6452
Notes: Sensitive parenting style, Routines parenting style, Time investment, Mother’s mental health and
Child’s cognitive skills are obtained from factor models. They are standardized to have mean 0 and stan-
dard deviation 1. Family income, that is the OECD equivalised weekly family income, is adjusted at
2012 prices. Last column reports the p-value of the test for the equality of means between boys and girls.
Data: UK Millennium Cohort Study, Main Sample.
37
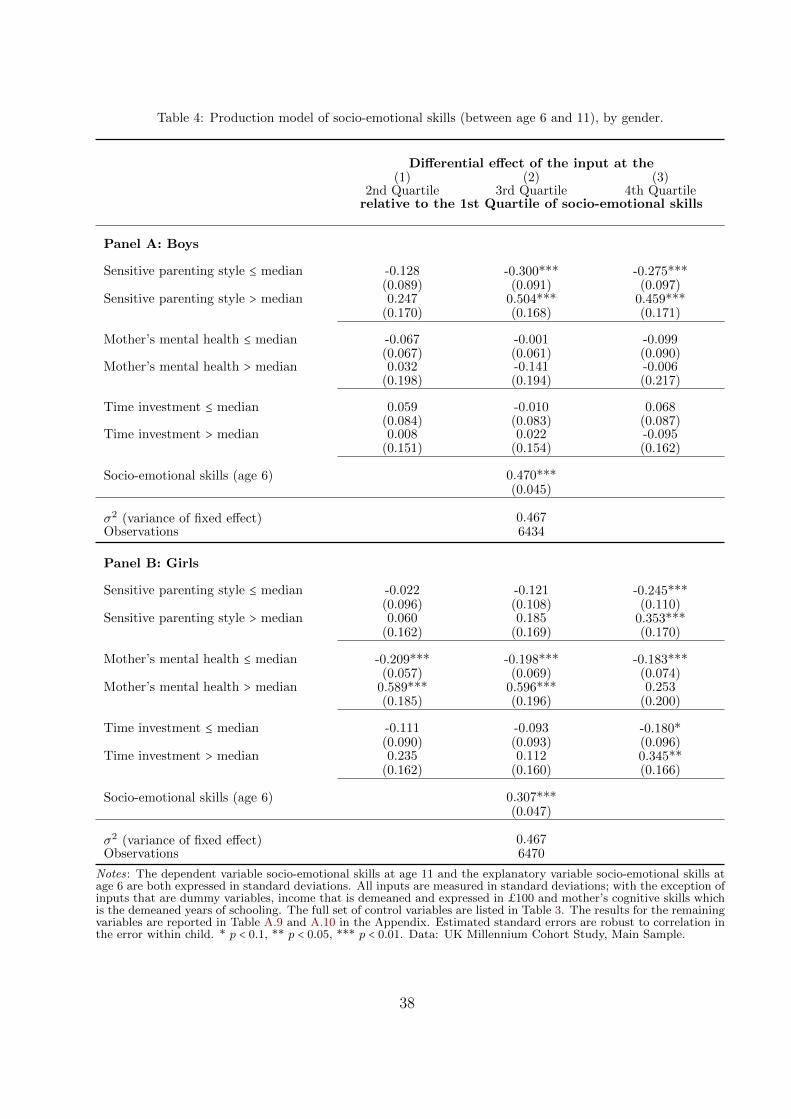
Table 4: Production model of socio-emotional skills (between age 6 and 11), by gender.
Differential effect of the input at the(1) (2) (3)
2nd Quartile 3rd Quartile 4th Quartilerelative to the 1st Quartile of socio-emotional skills
Panel A: Boys
Sensitive parenting style ≤ median -0.128 -0.300*** -0.275***(0.089) (0.091) (0.097)
Sensitive parenting style > median 0.247 0.504*** 0.459***(0.170) (0.168) (0.171)
Mother’s mental health ≤ median -0.067 -0.001 -0.099(0.067) (0.061) (0.090)
Mother’s mental health > median 0.032 -0.141 -0.006(0.198) (0.194) (0.217)
Time investment ≤ median 0.059 -0.010 0.068(0.084) (0.083) (0.087)
Time investment > median 0.008 0.022 -0.095(0.151) (0.154) (0.162)
Socio-emotional skills (age 6) 0.470***(0.045)
σ2 (variance of fixed effect) 0.467Observations 6434
Panel B: Girls
Sensitive parenting style ≤ median -0.022 -0.121 -0.245***(0.096) (0.108) (0.110)
Sensitive parenting style > median 0.060 0.185 0.353***(0.162) (0.169) (0.170)
Mother’s mental health ≤ median -0.209*** -0.198*** -0.183***(0.057) (0.069) (0.074)
Mother’s mental health > median 0.589*** 0.596*** 0.253(0.185) (0.196) (0.200)
Time investment ≤ median -0.111 -0.093 -0.180*(0.090) (0.093) (0.096)
Time investment > median 0.235 0.112 0.345**(0.162) (0.160) (0.166)
Socio-emotional skills (age 6) 0.307***(0.047)
σ2 (variance of fixed effect) 0.467Observations 6470
Notes: The dependent variable socio-emotional skills at age 11 and the explanatory variable socio-emotional skills atage 6 are both expressed in standard deviations. All inputs are measured in standard deviations; with the exception ofinputs that are dummy variables, income that is demeaned and expressed in £100 and mother’s cognitive skills whichis the demeaned years of schooling. The full set of control variables are listed in Table 3. The results for the remainingvariables are reported in Table A.9 and A.10 in the Appendix. Estimated standard errors are robust to correlation inthe error within child. * p < 0.1, ** p < 0.05, *** p < 0.01. Data: UK Millennium Cohort Study, Main Sample.
38

Table 5: Predicted reduction in the gap in socio-emotional skills at 11 for an increase in inputs below themedian of 1 standard deviation.
Percentage reduction in the gap between children at the(1) (2) (3)
2nd Quartile 3rd Quartile 4th Quartileand the 1st Quartile of socio-emotional skills at age 6
Panel A:BoysSensitive parenting style 20.898 33.737 24.245
(14.914) (11.049) (9.020)Mother’s mental health 10.953 0.093 8.736
(10.960) (6.813) (7.994)Time investment -9.669 1.154 -5.968
(13.733) (9.342) (7.718)
Panel B:GirlsSensitive parenting style 5.493 20.668 33.224
(24.073) (19.016) (16.155)Mother’s mental health 52.279 33.783 24.814
(17.023) (13.171) (10.900)Time investment 27.842 15.939 24.337
(23.086) (15.994) (13.414)
Notes: Percentage reductions in gaps are computed as the difference between the predicted gap with and without anincrease of one standard deviation in the input. The predictions are computed using our benchmark model estimatedcoefficients and keeping all other inputs at the mean. Standard errors in parenthesis.
39
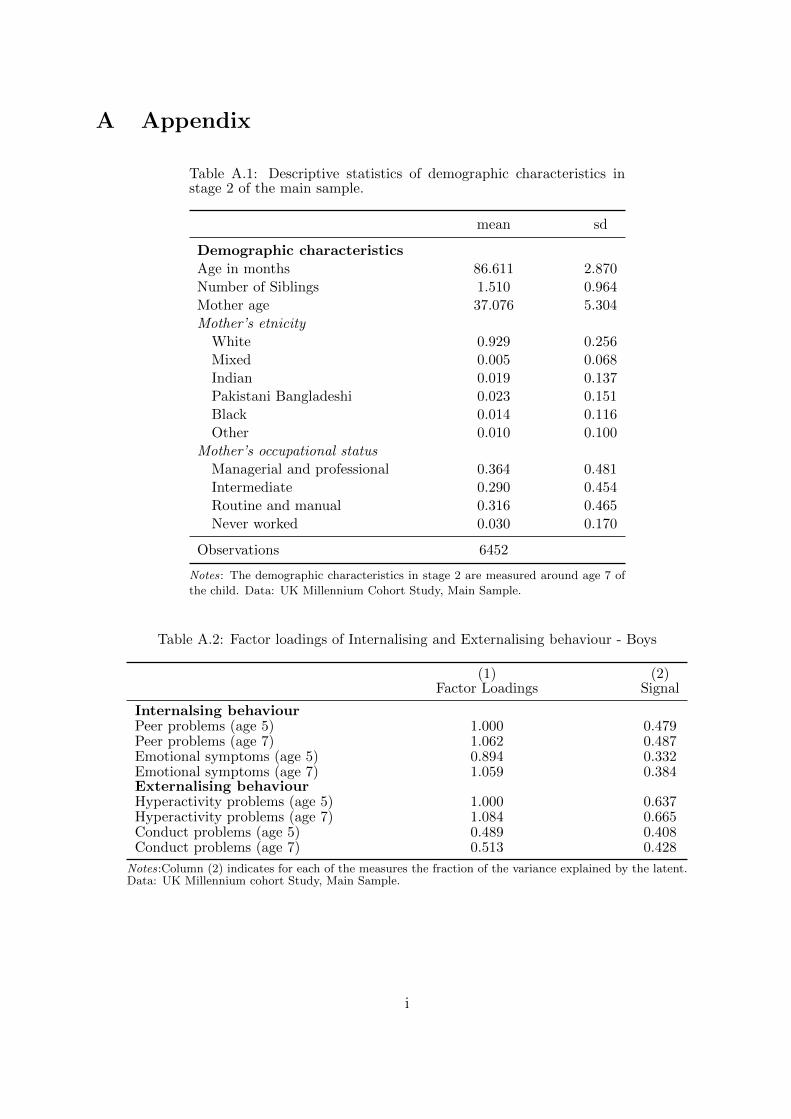
A Appendix
Table A.1: Descriptive statistics of demographic characteristics instage 2 of the main sample.
mean sd
Demographic characteristics
Age in months 86.611 2.870
Number of Siblings 1.510 0.964
Mother age 37.076 5.304
Mother’s etnicity
White 0.929 0.256
Mixed 0.005 0.068
Indian 0.019 0.137
Pakistani Bangladeshi 0.023 0.151
Black 0.014 0.116
Other 0.010 0.100
Mother’s occupational status
Managerial and professional 0.364 0.481
Intermediate 0.290 0.454
Routine and manual 0.316 0.465
Never worked 0.030 0.170
Observations 6452
Notes: The demographic characteristics in stage 2 are measured around age 7 of
the child. Data: UK Millennium Cohort Study, Main Sample.
Table A.2: Factor loadings of Internalising and Externalising behaviour - Boys
(1) (2)Factor Loadings Signal
Internalsing behaviourPeer problems (age 5) 1.000 0.479Peer problems (age 7) 1.062 0.487Emotional symptoms (age 5) 0.894 0.332Emotional symptoms (age 7) 1.059 0.384Externalising behaviourHyperactivity problems (age 5) 1.000 0.637Hyperactivity problems (age 7) 1.084 0.665Conduct problems (age 5) 0.489 0.408Conduct problems (age 7) 0.513 0.428
Notes:Column (2) indicates for each of the measures the fraction of the variance explained by the latent.Data: UK Millennium cohort Study, Main Sample.
i

Table A.3: Factor loadings of Internalising and Externalising behaviour - Girls
(1) (2)Factor Loadings Signal
Internalsing behaviourPeer problems (age 5) 1.000 0.393Peer problems (age 7) 1.024 0.374Emotional symptoms (age 5) 1.144 0.376Emotional symptoms (age 7) 1.304 0.405Externalising behaviourHyperactivity problems (age 5) 1.000 0.607Hyperactivity problems (age 7) 1.103 0.641Conduct problems (age 5) 0.492 0.386Conduct problems (age 7) 0.497 0.400
Notes: Column (2) indicates for each of the measures the fraction of the variance explained by the latent.Data: UK Millennium cohort Study, Main Sample.
Table A.4: Factor loadings of child’s cognitive skills - Boys
(1) (2)
Factor Loadings Signal
BAS:Picture similarities (age 5) 1.000 0.220
BAS:Reading abilities (age 5) 1.420 0.245
BAS:Pattern construction (age 5) 2.396 0.445
NFER: Maths test (age 7) 0.360 0.470
BAS:Reading abilities (age 7) 3.398 0.327
BAS:Pattern construction (age 7) 2.099 0.433
Notes: Column (2) indicates for each of the measures the fraction of the variance explained by the latent.
Data: UK Millennium cohort Study, Main Sample.
Table A.5: Factor loadings of child’s cognitive skills - Girls
(1) (2)
Factor Loadings Signal
BAS:Picture similarities 1.000 0.210
BAS:Reading abilities 1.444 0.265
BAS:Pattern construction 2.124 0.395
NFER: Maths test 0.354 0.494
BAS:Reading abilities 2.929 0.302
BAS:Pattern construction 2.088 0.471
Notes: Column (2) indicates for each of the measures the fraction of the variance explained by the latent.
Data: UK Millennium cohort Study, Main Sample.
ii
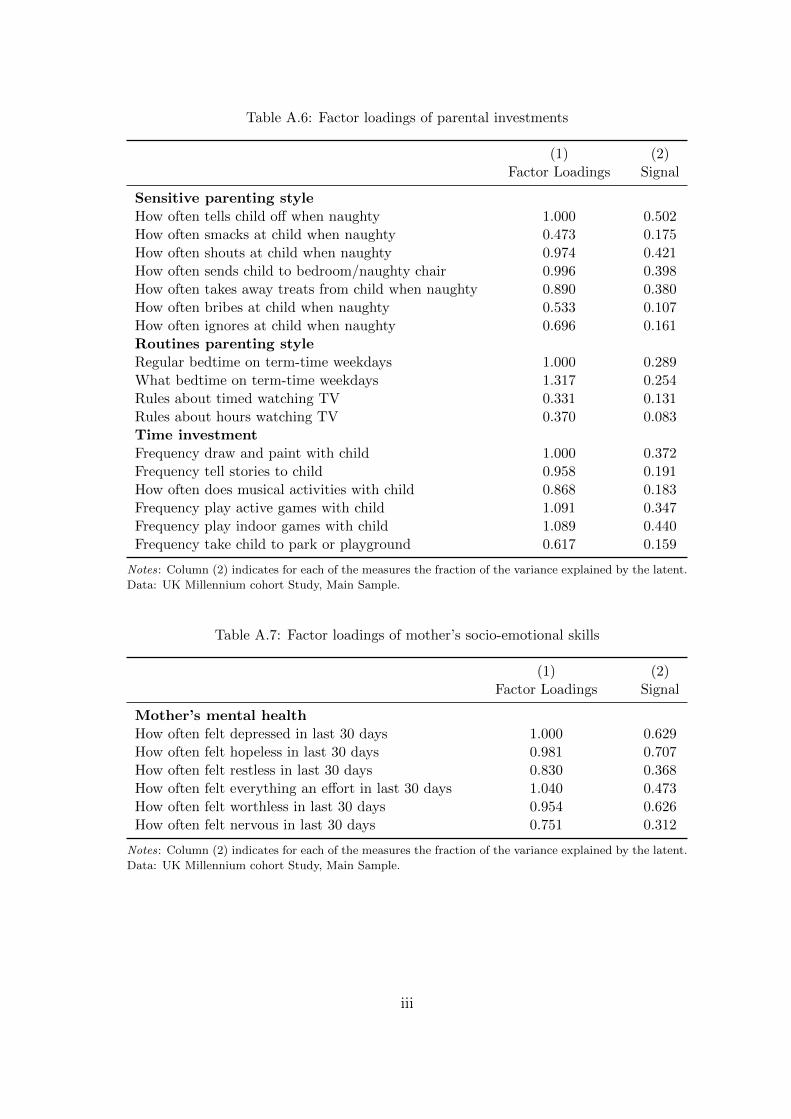
Table A.6: Factor loadings of parental investments
(1) (2)
Factor Loadings Signal
Sensitive parenting style
How often tells child off when naughty 1.000 0.502
How often smacks at child when naughty 0.473 0.175
How often shouts at child when naughty 0.974 0.421
How often sends child to bedroom/naughty chair 0.996 0.398
How often takes away treats from child when naughty 0.890 0.380
How often bribes at child when naughty 0.533 0.107
How often ignores at child when naughty 0.696 0.161
Routines parenting style
Regular bedtime on term-time weekdays 1.000 0.289
What bedtime on term-time weekdays 1.317 0.254
Rules about timed watching TV 0.331 0.131
Rules about hours watching TV 0.370 0.083
Time investment
Frequency draw and paint with child 1.000 0.372
Frequency tell stories to child 0.958 0.191
How often does musical activities with child 0.868 0.183
Frequency play active games with child 1.091 0.347
Frequency play indoor games with child 1.089 0.440
Frequency take child to park or playground 0.617 0.159
Notes: Column (2) indicates for each of the measures the fraction of the variance explained by the latent.
Data: UK Millennium cohort Study, Main Sample.
Table A.7: Factor loadings of mother’s socio-emotional skills
(1) (2)
Factor Loadings Signal
Mother’s mental health
How often felt depressed in last 30 days 1.000 0.629
How often felt hopeless in last 30 days 0.981 0.707
How often felt restless in last 30 days 0.830 0.368
How often felt everything an effort in last 30 days 1.040 0.473
How often felt worthless in last 30 days 0.954 0.626
How often felt nervous in last 30 days 0.751 0.312
Notes: Column (2) indicates for each of the measures the fraction of the variance explained by the latent.
Data: UK Millennium cohort Study, Main Sample.
iii

Table A.8: Factor loadings of parents’ trait specific socio-emotional skills
(1) (2)Factor Loadings Signal
Mother’s internalisingI get overwhelmed by emotions 1.000 0.444I get caught up in my problems 0.962 0.478I bottle up my feelings -0.844 0.285I am a very private person -0.510 0.119Mother’s externalisingI grumble about things 1.000 0.330I get angry easily 1.109 0.420I take offence easily 0.868 0.253Father’s internalisingI get overwhelmed by emotions 1.000 0.254I get caught up in my problems 1.360 0.456I bottle up my feelings -1.283 0.317I am a very private person -0.809 0.144Father’s externalisingI grumble about things 1.000 0.293I get angry easily 1.149 0.443I take offence easily 0.833 0.250
Notes: Column (2) indicates for each of the measures the fraction ofthe variance explained by the latent. Data: UK Millennium CohortStudy, subsample with details on mother’s and father’s trait specific socio-emotional skills.
iv

Table A.9: Production model of socio-emotional skills (between age 6 and 11), by gender. Remaininginputs effects.
Differential effect of the input at the(1) (2) (3)
2nd Quartile 3rd Quartile 4th Quartilerelative to the 1st Quartile of socio-emotional skills
Panel A: BoysRoutines parenting style ≤ median -0.081 -0.054 -0.097
(0.074) (0.075) (0.075)Routines parenting style > median 0.014 0.014 0.152
(0.162) (0.166) (0.164)Family income ≤ median 0.001 0.065 0.098*
(0.047) (0.049) (0.052)Family income > median 0.013 -0.054 -0.099
(0.069) (0.070) (0.073)Cognitive skills (age 6) ≤ median 0.027 0.064 -0.023
(0.081) (0.088) (0.098)Cognitive skills (age 6) > median 0.071 -0.100 0.141
(0.162) (0.161) (0.165)Mother’s education ≤ median 0.018 0.021 0.007
(0.050) (0.050) (0.051)Mother’s education > median 0.003 -0.028 -0.019
(0.068) (0.066) (0.068)
Observations 6434
Panel B:GirlsRoutines parenting style ≤ median 0.113 0.000 0.028
(0.072) (0.071) (0.080)Routines parenting style > median -0.310** 0.049 -0.124
(0.156) (0.157) (0.163)Family income ≤ median 0.064 -0.037 -0.029
(0.049) (0.050) (0.051)Family income > median -0.067 -0.007 0.005
(0.072) (0.070) (0.071)Cognitive skills (age 6) ≤ median 0.065 -0.042 -0.012
(0.100) (0.097) (0.101)Cognitive skills (age 6) > median -0.083 0.089 0.083
(0.186) (0.182) (0.195)Mother’s education ≤ median -0.060 -0.009 0.029
(0.053) (0.054) (0.054)Mother’s education > median 0.057 0.040 -0.018
(0.074) (0.074) (0.073)
Observations 6470
Notes: The table shows the full set of interactions of the benchmarck model shown in Table 4. Data: UK MillenniumCohort Study, Main Sample.
v

Table A.10: Production model of socio-emotional skills (between age 6 and 11), by gender. Remaining controls.
Differential effect of the input at the(1) (2) (3)
2nd Quartile 3rd Quartile 4th Quartilerelative to the 1st Quartile of socio-emotional skills
Panel A: BoysMother General Health - Excellent -0.363 0.251 -0.214
(0.355) (0.350) (0.341)Mother General Health - Good -0.298 0.280 -0.097
(0.346) (0.341) (0.336)Mother General Health - Fair -0.348 0.254 -0.334
(0.393) (0.391) (0.377)Mother General Health - Poor -0.155 0.356 -0.247
(0.533) (0.537) (0.518)Child longstanding illness -0.070 -0.072 -0.190
(0.134) (0.129) (0.125)Father longstanding illness -0.058 -0.152 0.113
(0.125) (0.122) (0.120)Income decile area -0.005 -0.030 -0.020
(0.019) (0.019) (0.019)Family and/or friends nearby - Yes friends -0.000 -0.153 -0.137
(0.278) (0.264) (0.244)Family and/or friends nearby - Yes family 0.193 -0.118 0.046
(0.328) (0.338) (0.302)Family and/or friends nearby - Yes both 0.044 -0.284 -0.081
(0.266) (0.251) (0.230)Non-parental child care 0.002 0.006 0.006
(0.006) (0.006) (0.006)Hours club -0.055 -0.011 -0.006
(0.047) (0.061) (0.056)Working hours per week 0.005 0.002 0.003
(0.004) (0.004) (0.004)Fertility 0.040 -0.074 -0.073
(0.146) (0.153) (0.159)
Observations 6434
Panel B: GirlsMother General Health - Excellent -0.350 -0.434 -0.447
(0.331) (0.344) (0.333)Mother General Health - Good -0.301 -0.492 -0.357
(0.315) (0.325) (0.315)Mother General Health - Fair -0.380 -0.299 -0.083
(0.368) (0.392) (0.383)Mother General Health - Poor -0.100 -0.028 -0.181
(0.462) (0.507) (0.674)Child longstanding illness -0.045 0.223* 0.089
(0.135) (0.134) (0.140)Father longstanding illness -0.001 -0.040 0.019
(0.120) (0.119) (0.130)Income decile area -0.019 -0.005 -0.011
(0.018) (0.019) (0.019)Family and/or friends nearby - Yes friends 0.093 0.092 0.187
(0.241) (0.250) (0.245)Family and/or friends nearby - Yes family 0.283 0.614 0.166
(0.309) (0.309) (0.326)Family and/or friends nearby - Yes both 0.259 0.116 0.242
(0.229) (0.237) (0.232)Non-parental child care -0.004 -0.004 -0.005
(0.005) (0.006) (0.006)Hours club -0.023 0.003 -0.014
(0.042) (0.050) (0.056)Working hours per week -0.005 -0.002 -0.001
(0.004) (0.004) (0.004)Fertility 0.090 0.020 -0.102
(0.136) (0.137) (0.143)
Observations 6470
Notes: The table shows the full set of interactions of the benchmark model shown in Table 4. Data: UK Millennium CohortStudy, Main Sample.
vi

Table A.11: Production model of socio-emotional skills (between age 6 and 11). Equivalence ofself-productivity across socio-emotional traits.
Differential effect of the input at the(1) (2) (3)
2nd Quartile 3rd Quartile 4th Quartilerelative to the 1st Quartile of socio-emotional skills
Panel A:BoysSensitive parenting style ≤ median -0.140 -0.311*** -0.282***
(0.091) (0.093) (0.098)Sensitive parenting style > median 0.253 0.508*** 0.464***
(0.170) (0.168) (0.171)Mother’s mental health ≤ median -0.064 0.003 -0.098
(0.068) (0.062) (0.092)Mother’s mental health > median 0.026 -0.145 -0.012
(0.197) (0.193) (0.217)Time investment ≤ median 0.054 -0.014 0.067
(0.085) (0.084) (0.088)Time investment > median 0.019 0.028 -0.090
(0.153) (0.155) (0.163)
Socio-emotional skills (age 6) 0.484***(Internalising) (0.048)Socio-emotional skills (age 6) 0.447***(Externalising) (0.045)
σ2 (variance of fixed effect) 0.468Observations 6434
Panel B: GirlsSensitive parenting style ≤ median -0.013 -0.114 -0.240**
(0.096) (0.108) (0.111)Sensitive parenting style > median 0.058 0.186 0.351**
(0.162) (0.169) (0.170)Mother’s mental health ≤ median -0.214*** -0.202*** -0.189**
(0.058) (0.070) (0.075)Mother’s mental health > median 0.588*** 0.594*** 0.254
(0.184) (0.196) (0.199)Time investment ≤ median -0.112 -0.092 -0.184*
(0.091) (0.094) (0.097)Time investment > median 0.233 0.109 0.348**
(0.163) (0.161) (0.167)
Socio-emotional skills (age 6) 0.293***(Internalising) (0.050)Socio-emotional skills (age 6) 0.324***(Externalising) (0.048)
σ2 (variance of fixed effect) 0.466Observations 6470
Notes: The dependent variable socio-emotional skills at age 11 and the explanatory variable socio-emotional skills atage 6 are both expressed in standard deviations. All inputs are measured in standard deviations; with the exception ofinputs that are dummy variables, income that is demeaned and expressed in £100 and mother’s cognitive skills whichis the demeaned years of schooling. The full set of control variables are listed in Table 3. Estimated standard errorsare robust to correlation in the error within child. * p < 0.1, ** p < 0.05, *** p < 0.01. Data: UK Millennium CohortStudy.
vii

Table A.12: Production model of socio-emotional skills (between age 6 and 11). Controlling additionally formother’s and father’s trait-specific socio-emotional skills
Differential effect of the input at the(1) (2) (3)
2nd Quartile 3rd Quartile 4th Quartilerelative to the 1st Quartile of socio-emotional skills
Panel A:BoysSensitive parenting style ≤ median -0.162 -0.273** -0.290***
(0.100) (0.101) (0.107)Sensitive parenting style > median 0.254 0.493** 0.480**
(0.191) (0.188) (0.192)Mother’s mental health ≤ median -0.056 -0.019 -0.105
(0.075) (0.067) (0.091)Mother’s mental health > median -0.005 -0.141 -0.022
(0.216) (0.210) (0.234)Time investment ≤ median 0.042 -0.016 0.061
(0.094) (0.092) (0.097)Time investment > median 0.013 0.014 -0.074
(0.171) (0.172) (0.180)
Socio-emotional skills (age 6) 0.470***(0.049)
Mother’s Socio-emotional skills 0.057**(0.024)
Father’s Socio-emotional skills 0.024(0.022)
σ2 (variance of fixed effect) 0.458Observations 5430
Panel B:GirlsSensitive parenting style ≤ median 0.015 -0.174 -0.244**
(0.111) (0.121) (0.119)Sensitive parenting style > median 0.038 0.234 0.335*
(0.187) (0.192) (0.189)Mother’s mental health ≤ median -0.225*** -0.199** -0.245**
(0.075) (0.083) (0.095)Mother’s mental health > median 0.598*** 0.591*** 0.398**
(0.212) (0.219) (0.228)Time investment ≤ median -0.118 -0.066 -0.123
(0.105) (0.103) (0.108)Time investment > median 0.333* 0.125 0.348*
(0.188) (0.180) (0.188)
Socio-emotional skills (age 6) 0.323***(0.052)
Mother’s Socio-emotional skills 0.013(0.024)
Father’s Socio-emotional skills 0.025(0.022)
σ2 (variance of fixed effect) 0.471Observations 5318
Notes: The dependent variable socio-emotional skills at age 11 and the explanatory variable socio-emotional skills atage 6 are both expressed in standard deviations. All inputs are measured in standard deviations; with the exception ofinputs that are dummy variables, income that is demeaned and expressed in £100 and mother’s cognitive skills whichis the demeaned years of schooling. The full set of control variables are listed in Table 3. Estimated standard errorsare robust to correlation in the error within child. * p < 0.1, ** p < 0.05, *** p < 0.01. Data: UK Millennium CohortStudy, subsample with details on mother’s and father’s trait specific socio-emotional skills.
viii

Table A.13: Descriptive statistics of the father’s subsample, by gender
Boys Girls Test diffmean sd mean sd p-value
Mother’s internalising 0.003 1.010 -0.006 0.991 0.697Mother’s externalising -0.013 1.018 0.011 0.983 0.316Father’s internalising -0.013 0.993 0.015 1.008 0.305Father’s externalising -0.038 0.994 0.037 1.006 0.005
Observations 2715 2659 5314
Notes: Last column indicates the p-value mean test of the difference in each variables between boys andgirls. Data: UK Millennium Cohort Study, Father Sample.
Table A.14: Production model of socioemotional skills (between age 6 and 11). Including past inputs - Boys
Differential effect of the input at the(1) (2) (3)
2nd Quartile 3rd Quartile 4th Quartilerelative to the 1st Quartile of socio-emotional skills
BoysSensitive parenting style ≤ median -0.116 -0.293*** -0.303***
(0.096) (0.097) (0.105)Sensitive parenting style > median 0.224 0.462** 0.473**
(0.183) (0.182) (0.186)Sensitive parenting style (age 3) ≤ median -0.006 -0.073 -0.007
(0.099) (0.098) (0.102)Sensitive parenting style (age 3) > median -0.011 0.151 0.045
(0.167) (0.170) (0.173)Mother’s mental health ≤ median -0.053 0.022 -0.071
(0.073) (0.067) (0.099)Mother’s mental health > median 0.112 -0.081 0.051
(0.212) (0.213) (0.241)Mother’s mental health (age 3) ≤ median 0.007 0.005 -0.093
(0.076) (0.087) (0.101)Mother’s mental health (age 3) > median -0.294 -0.331 -0.141
(0.190) (0.205) (0.232)Time investment ≤ median 0.050 -0.030 0.072
(0.089) (0.087) (0.092)Time investment > median 0.013 0.026 -0.114
(0.160) (0.163) (0.172)Time investment (age 3) ≤ median -0.203 -0.246* -0.256*
(0.136) (0.136) (0.136)Time investment (age 3) > median 0.382* 0.338* 0.436**
(0.206) (0.202) (0.206)
Socio-emotional skills (age 6) 0.479***(0.046)
σ2 (variance of fixed effect) 0.475Observations 6148
Notes: The dependent variable socio-emotional skills at age 11 and the explanatory variable socio-emotional skills at age6 are both expressed in standard deviations. All inputs are measured in standard deviations; with the exception of inputsthat are dummy variables, income that is demeaned and expressed in £100 and mother’s cognitive skills which is the de-meaned years of schooling. The full set of control variables are listed in Table 3 . Standard errors are clustered at childlevel. * p < 0.1, ** p < 0.05, *** p < 0.01. Data: UK Millennium Cohort Study, School Sample.
ix

Table A.15: Production model of socioemotional skills (between age 6 and 11). Including past inputs - Girls
Differential effect of the input at the(1) (2) (3)
2nd Quartile 3rd Quartile 4th Quartilerelative to the 1st Quartile of socio-emotional skills
GirlsSensitive parenting style ≤ median -0.011 -0.084 -0.241*
(0.104) (0.116) (0.120)Sensitive parenting style > median 0.046 0.247 0.378*
(0.171) (0.178) (0.182)Sensitive parenting style (age 3) ≤ median 0.011 -0.044 0.000
(0.095) (0.097) (0.000)Sensitive parenting style (age 3) > median 0.020 -0.154 -0.064
(0.157) (0.165) (0.166)Mother’s mental health ≤ median -0.178*** -0.204*** -0.167**
(0.068) (0.076) (0.083)Mother’s mental health > median 0.570*** 0.548*** 0.263
(0.200) (0.210) (0.217)Mother’s mental health (age 3) ≤ median -0.070 -0.073 -0.075
(0.082) (0.080) (0.097)Mother’s mental health (age 3) > median -0.118 0.127 -0.127
(0.207) (0.209) (0.220)Time investment ≤ median -0.113 -0.080 -0.167*
(0.094) (0.097) (0.100)Time investment > median 0.247 0.132 0.338**
(0.168) (0.164) (0.172)Time investment (age 3) ≤ median -0.185 -0.155 -0.207
(0.126) (0.126) (0.126)Time investment (age 3) > median 0.013 -0.066 0.000
(0.178) (0.153) (0.000)
Socio-emotional skills (age 6) 0.298***(0.048)
σ2 (variance of fixed effect) 0.487Observations 6190
Notes: The dependent variable socio-emotional skills at age 11 and the explanatory variable socio-emotional skills at age6 are both expressed in standard deviations. All inputs are measured in standard deviations; with the exception of inputsthat are dummy variables, income that is demeaned and expressed in £100 and mother’s cognitive skills which is the de-meaned years of schooling. The full set of control variables are listed in Table 3. Standard errors are clustered at childlevel. * p < 0.1, ** p < 0.05, *** p < 0.01. Data: UK Millennium Cohort Study, School Sample.
x
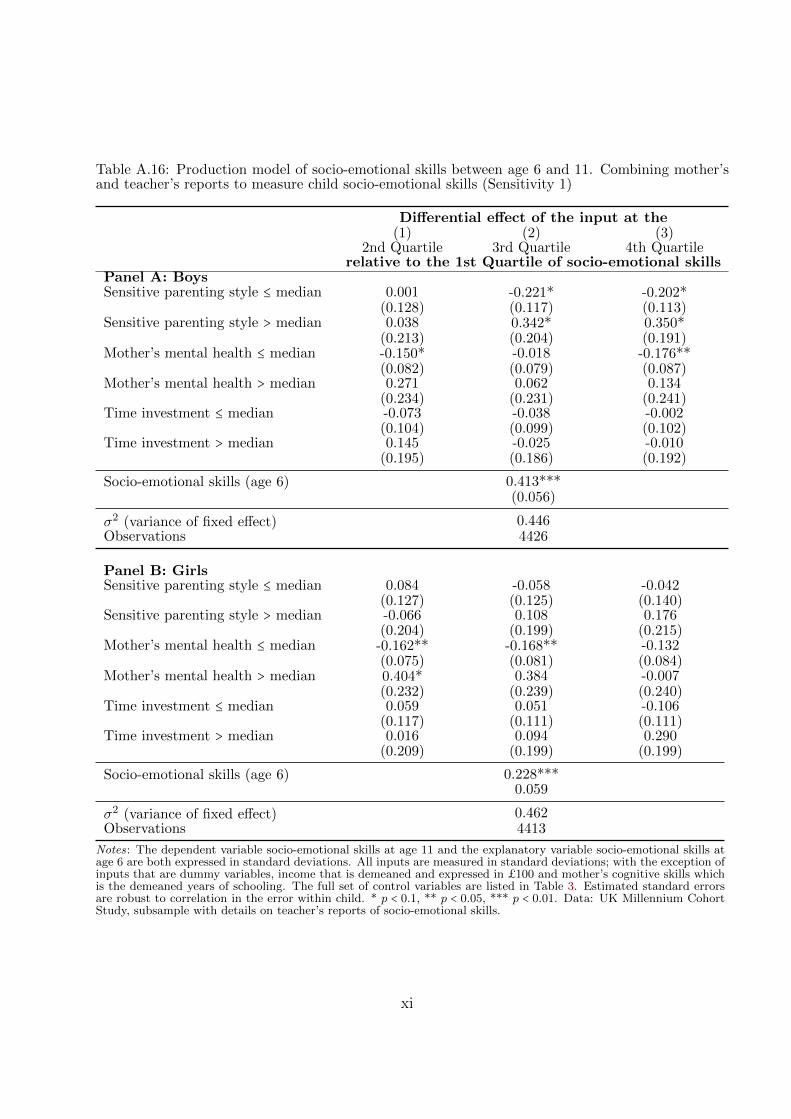
Table A.16: Production model of socio-emotional skills between age 6 and 11. Combining mother’sand teacher’s reports to measure child socio-emotional skills (Sensitivity 1)
Differential effect of the input at the(1) (2) (3)
2nd Quartile 3rd Quartile 4th Quartilerelative to the 1st Quartile of socio-emotional skills
Panel A: BoysSensitive parenting style ≤ median 0.001 -0.221* -0.202*
(0.128) (0.117) (0.113)Sensitive parenting style > median 0.038 0.342* 0.350*
(0.213) (0.204) (0.191)Mother’s mental health ≤ median -0.150* -0.018 -0.176**
(0.082) (0.079) (0.087)Mother’s mental health > median 0.271 0.062 0.134
(0.234) (0.231) (0.241)Time investment ≤ median -0.073 -0.038 -0.002
(0.104) (0.099) (0.102)Time investment > median 0.145 -0.025 -0.010
(0.195) (0.186) (0.192)
Socio-emotional skills (age 6) 0.413***(0.056)
σ2 (variance of fixed effect) 0.446Observations 4426
Panel B: GirlsSensitive parenting style ≤ median 0.084 -0.058 -0.042
(0.127) (0.125) (0.140)Sensitive parenting style > median -0.066 0.108 0.176
(0.204) (0.199) (0.215)Mother’s mental health ≤ median -0.162** -0.168** -0.132
(0.075) (0.081) (0.084)Mother’s mental health > median 0.404* 0.384 -0.007
(0.232) (0.239) (0.240)Time investment ≤ median 0.059 0.051 -0.106
(0.117) (0.111) (0.111)Time investment > median 0.016 0.094 0.290
(0.209) (0.199) (0.199)
Socio-emotional skills (age 6) 0.228***0.059
σ2 (variance of fixed effect) 0.462Observations 4413
Notes: The dependent variable socio-emotional skills at age 11 and the explanatory variable socio-emotional skills atage 6 are both expressed in standard deviations. All inputs are measured in standard deviations; with the exception ofinputs that are dummy variables, income that is demeaned and expressed in £100 and mother’s cognitive skills whichis the demeaned years of schooling. The full set of control variables are listed in Table 3. Estimated standard errorsare robust to correlation in the error within child. * p < 0.1, ** p < 0.05, *** p < 0.01. Data: UK Millennium CohortStudy, subsample with details on teacher’s reports of socio-emotional skills.
xi

Table A.17: Production model of socio-emotional skills (between age 6 and 11), by gender. Allowingfor differential self-productivity of socio-emotional skills across quartiles (Sensitivity 2).
Differential effect of the input at the(1) (2) (3)
2nd Quartile 3rd Quartile 4th Quartilerelative to the 1st Quartile of socio-emotional skills
Panel A: BoysSensitive parenting style ≤ median -0.128 -0.299*** -0.272***
(0.089) (0.091) (0.097)Sensitive parenting style > median 0.245 0.504*** 0.466***
(0.170) (0.168) (0.171)Mother’s mental health ≤ median -0.068 -0.001 -0.100
(0.067) (0.061) (0.090)Mother’s mental health > median 0.031 -0.142 -0.006
(0.198) (0.194) (0.217)Time investment ≤ median 0.060 -0.011 0.068
(0.084) (0.083) (0.087)Time investment > median 0.008 0.023 -0.093
(0.151) (0.155) (0.162)
Socio-emotional skills 0.473***(age 6 - first quartile) (0.053)
0.052 -0.043 -0.105(0.124) (0.170) (0.100)
σ2 (variance of fixed effect) 0.466Observations 6434
Panel B: GirlsSensitive parenting style ≤ median -0.023 -0.121 -0.248**
(0.096) (0.108) (0.110)Sensitive parenting style > median 0.065 0.184 0.354**
(0.162) (0.169) (0.170)Mother’s mental health ≤ median -0.209*** -0.199*** -0.183**
(0.057) (0.069) (0.074)Mother’s mental health > median 0.595*** 0.600*** 0.256
(0.185) (0.197) (0.200)Time investment ≤ median -0.110 -0.092 -0.179*
(0.091) (0.093) (0.096)Time investment > median 0.236 0.110 0.344**
(0.162) (0.160) (0.166)
Socio-emotional skills (age 6) 0.315***(age 6 - first quartile) (0.053)
-0.144 0.029 0.005(0.155) (0.167) (0.140)
σ2 (variance of fixed effect) 0.466Observations 6470
Notes: The dependent variable socio-emotional skills at age 11 and the explanatory variable socio-emotional skills atage 6 are both expressed in standard deviations. All inputs are measured in standard deviations; with the exception ofinputs that are dummy variables, income that is demeaned and expressed in £100 and mother’s cognitive skills whichis the demeaned years of schooling. The full set of control variables are listed in Table 3. Estimated standard errorsare robust to correlation in the error within child. * p < 0.1, ** p < 0.05, *** p < 0.01. Data: UK Millennium CohortStudy, Main Sample.
xii

Table A.18: Production model of socio-emotional skills between age 6 and 11 by gender. Anchoringsocio-emotional skills to ‘non-smoking’ at age 14 (Sensitivity 3).
Differential effect of the input at the(1) (2) (3)
2nd Quartile 3rd Quartile 4th Quartilerelative to the 1st Quartile of socio-emotional skills
Panel A: BoysSensitive parenting style ≤ median -0.104 -0.284*** -0.207**
(0.080) (0.081) (0.088)Sensitive parenting style > median 0.147 0.401** 0.310*
(0.159) (0.158) (0.165)Mother’s mental health ≤ median -0.059 0.075 -0.090
(0.056) (0.050) (0.075)Mother’s mental health > median -0.075 -0.427* -0.095
(0.175) (0.164) (0.187)Time investment ≤ median 0.053 -0.038 0.038
(0.071) (0.073) (0.075)Time investment > median -0.024 0.069 -0.049
(0.139) (0.140) (0.145)
Socio-emotional skills (age 6) 0.438***(0.048)
σ2 (variance of fixed effect) 0.470Observations 5658
Panel B: GirlsSensitive parenting style ≤ median 0.012 -0.141 -0.183*
(0.087) (0.097) (0.101)Sensitive parenting style > median 0.066 0.250 0.320**
(0.144) (0.155) (0.157)Mother’s mental health ≤ median -0.176*** -0.131** -0.146**
(0.052) (0.064) (0.066)Mother’s mental health > median 0.508*** 0.509*** 0.189
(0.167) (0.177) (0.180)Time investment ≤ median -0.053 -0.093 -0.135
(0.083) (0.086) (0.087)Time investment > median 0.139 0.107 0.261*
(0.146) (0.145) (0.151)
Socio-emotional skills (age 6) 0.299***(0.051)
σ2 (variance of fixed effect) 0.462Observations 5742
Notes: The dependent variable socio-emotional skills at age 11 and the explanatory variable socio-emotional skills atage 6 are both expressed in standard deviations. All inputs are measured in standard deviations; with the exception ofinputs that are dummy variables, income that is demeaned and expressed in £100 and mother’s cognitive skills whichis the demeaned years of schooling. The full set of control variables are listed in Table 3. Estimated standard errorsare robust to correlation in the error within child. * p < 0.1, ** p < 0.05, *** p < 0.01. Data: UK Millennium CohortStudy, subsample with details on child’s socio-emotional skills at age 14.
xiii