diverse ways of knowing for water quality conservation in
TRANSCRIPT

i
v
Diverse Ways of Knowing for Water Quality Conservation in North Carolina
by
Amy Freitag
Marine Science and Conservation
Duke University
Date: __________
Approved:
___________________________
Lisa Campbell, Supervisor
___________________________
Daniel Rittschof
___________________________
Xavier Basurto
___________________________
Barbara Garrity-Blake
___________________________
David Hinton
Dissertation submitted in partial fulfillment of
the requirements for the degree of Doctor
of Philosophy in
Marine Science and Conservation in the Graduate School
of Duke University
2013

i
v
ABSTRACT
Diverse Ways of Knowing for Water Quality Conservation in North Carolina
by
Amy Freitag
Marine Science and Conservation
Duke University
Date: __________
Approved:
___________________________
Lisa Campbell, Supervisor
___________________________
Daniel Rittschof
___________________________
Xavier Basurto
___________________________
Barbara Garrity-Blake
___________________________
David Hinton
An abstract of a dissertation submitted in partial
fulfillment of the requirements for the degree
of Doctor of Philosophy in
Marine Science and Conservation in the Graduate School of
Duke University
2013

Copyright by
Amy Freitag
2013

iv
Abstract
Diverse ways of knowing have been recognized by scholars in many disciplines
to contribute creative perspectives and novel problem-solving approaches to better
understand and address a variety of issues. In the environmental sciences, those
dependent on natural resources and working daily with those resources are in one of the
best positions to observe and learn from subtle changes in the environment. In the
coastal marine and estuarine environment, some of these experiential knowledge
holders are the fishers and their families. In this dissertation, I use ethnographic
methods to investigate different ways of knowing (specifically, experiential, academic,
and political) as well as collaborative science at multiple scales through facilitating a
participatory water quality project and investigating a state-led program supporting
collaborative science. Each chapter offers detailed perspectives on a specific piece of the
collaborative research process (foundations, methods, and institutionalization,
respectively), yet there are lessons learned across the board. For instance, best efforts at
quality participation may be thwarted by participant desires and other contextual
circumstances. Additionally, the strong need for interactional expertise to cross
boundaries within the social network of a project emerged as a strong determinant of
satisfaction with collaborative research and perceived success. Like interactional
expertise, the role of technology should be specifically cultivated to meet the needs of

v
the project. In addition, a shared epistemology among participants is important for
managing existing power dynamics; this may be created as part of the collaborative
research methodology. Finally, collaborative research takes on many forms and
functions and each may be successful in the eyes of participants depending on their
motivations for participating; diversity in opportunities and adequate voice in deciding
what role to take on in research is an important part of the research process.

vi
Dedication
To the love of my life, Andrew Thaler, with whom I travel life’s crooked road.

vii
Contents
Abstract ......................................................................................................................................... iv
List of Tables ................................................................................................................................ xii
List of Figures ............................................................................................................................ xiii
Acknowledgements .................................................................................................................... xv
1. Introduction ............................................................................................................................... 1
1.1 Why Water Quality? ........................................................................................................ 2
1.2 Wicked Problems .............................................................................................................. 7
1.3 Crossing the nature/culture divide by moving from hydrological to hydrosocial . 9
1.4 Multiple ways of knowing and the co-production of knowledge ........................... 14
1.5 From co-production to co-management ...................................................................... 20
1.6 The Case and Parallel Systems ..................................................................................... 22
1.6.1 Examples of comprehensively managed watersheds .......................................... 23
1.7 Project Objectives ............................................................................................................ 25
1.8 Dissertation Road Map .................................................................................................. 26
1.9 Philosophical and Methodological Approach ............................................................ 29
2. Naming, framing, and blaming: Exploring ways of knowing in the deceptively simple
question “what is water quality?” ............................................................................................ 34
2.1 Introduction ..................................................................................................................... 34
2.1.1 Starting with the Basics: Ways of Knowing Environmental Problems .............. 37
2.1.2 Assisting policymaking: Helping by incorporating diverse ways of knowing 38

viii
2.1.3 Easier said than done: What is needed to officially recognize different ways of
knowing ............................................................................................................................... 40
2.1.4 The case of Albemarle-Pamlico Water Quality: From federal legislation to local
eyes ....................................................................................................................................... 42
2.2 Methods ........................................................................................................................... 47
2.3 Results .............................................................................................................................. 51
2.3.1 Life through the eyes of others – experiencing water quality in three ways .... 51
2.3.2 Perceptions of water quality: Interview data ........................................................ 55
2.3.2.1 Naming: Definition of water quality ............................................................... 55
2.3.2.2 Framing: Water quality status .......................................................................... 59
2.3.2.3 Blaming: Assigning responsibility ................................................................... 62
2.3.2.4 Regulating ........................................................................................................... 66
2.3.2.5 Recognition of diverse ways of knowing ....................................................... 68
2.4 Discussion ........................................................................................................................ 71
2.4.1 Comparing water quality definitions and perceptions ........................................ 71
2.4.2 Implications for management of different ways of knowing .............................. 75
2.5 Conclusions ..................................................................................................................... 79
3. Collaboratively Studying Contaminants ............................................................................. 81
3.1 The Geography of Mercury and PCBs in North Carolina’s Local Seafood ............ 81
3.1.1 Introduction .................................................................................................................. 81
3.1.1.1 Seafood Safety Recommendations ................................................................... 81
3.1.1.2 Why Mercury and PCBs? .................................................................................. 83
3.1.1.3 Hypothesis .......................................................................................................... 85

ix
3.1.2 Methods ...................................................................................................................... 85
3.1.2.1 Sampling and Tissue Preparation .................................................................... 85
3.1.2.2 Mercury ............................................................................................................... 87
3.1.2.3 PCBs ..................................................................................................................... 88
3.1.2.4 Lipid Determination .......................................................................................... 88
3.1.2.5 Estimates of Mercury and PCB Recovery ....................................................... 89
3.1.2.6 Statistics ............................................................................................................... 89
3.1.3 Results ......................................................................................................................... 89
3.1.4 Discussion ................................................................................................................... 98
3.1.4.1 Spatial Scale Considerations ............................................................................. 98
3.1.4.2 NC Seafood Is Safe to Eat ................................................................................ 100
3.1.5 Conclusions .............................................................................................................. 103
3.2 Collaboratively defining water quality within the hydrosocial cycle of North
Carolina ................................................................................................................................ 104
3.2.1 Introduction.............................................................................................................. 104
3.2.2 Methods .................................................................................................................... 112
3.3.3 Results ....................................................................................................................... 116
3.3.4 Discussion and Conclusions .................................................................................. 128
3.3 An Ethnographic Look at Co-producing Knowledge about Water Quality ........ 133
3.3.1 The Project ................................................................................................................ 134
3.3.1.1 Situating myself ................................................................................................ 139
3.3.2 Possible Avenues of Participation ......................................................................... 140

x
3.3.3 The North Carolina Coast ...................................................................................... 144
3.3.4 Pre-project: Gaining Rapport as a Facilitator through Basketball Alliances and
Oyster Eating..................................................................................................................... 146
3.3.5 Searching for Mercury: Collecting Samples State-wide ..................................... 150
3.3.6 Exploding Coils and Other Technological Hiccups: Lab Analysis .................. 152
3.3.7 Chasing Interpretations .......................................................................................... 156
3.3.8 The End Game: Vanishing Outreach Finances and a Distant Horizon for
Continuity .......................................................................................................................... 164
3.3.9 Reflections on the Scientific Process ..................................................................... 166
3.3.9.1 Forks in the Research Road: Critical Decisions ............................................ 166
3.3.9.2 Breathing Life into Data: What Happened to the Results? ........................ 168
3.3.9.3 Where Do I Fit In? The Role of the Facilitator .............................................. 170
3.3.9.4 Conclusions Lessons for the Road ................................................................. 172
4. Seed Grants for Stakeholder Engagement fostering Empathy and Respect: Reflecting
on North Carolina’s Fisheries Resource Grants .................................................................... 174
4.1 Introduction ................................................................................................................... 174
4.1.1 Integration: How to recognize the multiplicity of legitimate knowledges ..... 175
4.1.2 Innovation: benefits of knowledge co-production for complex problems ...... 180
4.2 The Fisheries Resource Grant Program ..................................................................... 184
4.3 Methods ......................................................................................................................... 187
4.4. Results ........................................................................................................................... 189
4.4.1 Characterizing collaboration.................................................................................. 190
4.4.2 Learning from each other ....................................................................................... 195

xi
4.4.3 Products of grant: science, outreach, policy ........................................................ 198
4.4.4 Role of FRG administration ................................................................................... 200
4.4.5 Purpose of FRG ........................................................................................................ 202
4.4.6 Creating boundary spanners and broader scientific thinkers ........................... 203
4.5 Discussion ...................................................................................................................... 205
4.5.1 Ways of knowing and co-production of knowledge .......................................... 205
4.5.2 Meeting the promise of co-production? ............................................................... 209
4.6 Conclusions ................................................................................................................... 211
5. Conclusions ............................................................................................................................ 214
5.1 Contributions to Theory .............................................................................................. 216
5.2 Recurring Themes......................................................................................................... 220
5.3 Reflections on Interdisciplinarity ............................................................................... 224
5.4 Applications for the Future ......................................................................................... 226
Appendix A: Interview Guides for Chapter 2 ...................................................................... 229
Appendix B: Institutions Represented in Chapter 2 ............................................................ 233
Appendix C: FRG Proposal from Chapter 3.3 ...................................................................... 235
Appendix D: Example Handout used in Chapter 3.3 .......................................................... 240
References .................................................................................................................................. 244
Biography ................................................................................................................................... 266

xii
List of Tables
Table 1: Numbers of respondents from each knowledge group, for a total of 82. The
“knowledge type” column categorizes respondents according to their current roles, and
include boundary spanners, i.e. individuals who serve career or advisory roles in more
than one category. “Primary knowledge” shows how people self-identified their
primary knowledge base. No one fell in all three categories. ............................................... 49
Table 2: Different perspectives on water quality by primary way of knowing. Totals do
not add the up to the total n=82 or the same for each question because people chose not
to answer some questions. Halves are created by people stating two answers. ................ 57
Table 3: Boundary-spanner answers to ‘what is water quality’? ......................................... 57
Table 4: The perceived most important current issues in water quality management.
Only the topics with more than 5 people mentioning them are listed. All 82 respondents
answered this question with between one and three issues. ................................................ 62
Table 5: Frequently suggested priorities for water quality management. Only those with
more than one person supporting the action are listed. All 82 participants answered this
question, either directly or indirectly. Because there are so few people for each
suggestion, they are not separated by knowledge group. .................................................... 68
Table 6: Primary water quality concerns as identified in the rounds of the collaborative
conceptual modeling. ............................................................................................................... 118
Table 7: List of projects and who generated the idea. In the fourth project (starred), each
collaborator said the other came up with the idea. .............................................................. 191
Table 8: Types of result products separated by type of authorship................................... 195
Table 9: Topics participants learned from each other. Those marked with an asterisk (*)
indicate topics that appear on each list, therefore representing blended knowledge.
Numbers in the right column indicate number of participants that mentioned that topic;
totals add up to more people than respondents because some people mentioned more
than one thing. ........................................................................................................................... 196

xiii
List of Figures
Figure 1: The 17 River Basin Plans of North Carolina. This is how the state currently
conceptualizes each hydrosocial system. Produced by the Wildlife Resources Commission,
http://216.27.39.101/Plan/NC_River_Basins_Map.htm ................................................................ 14
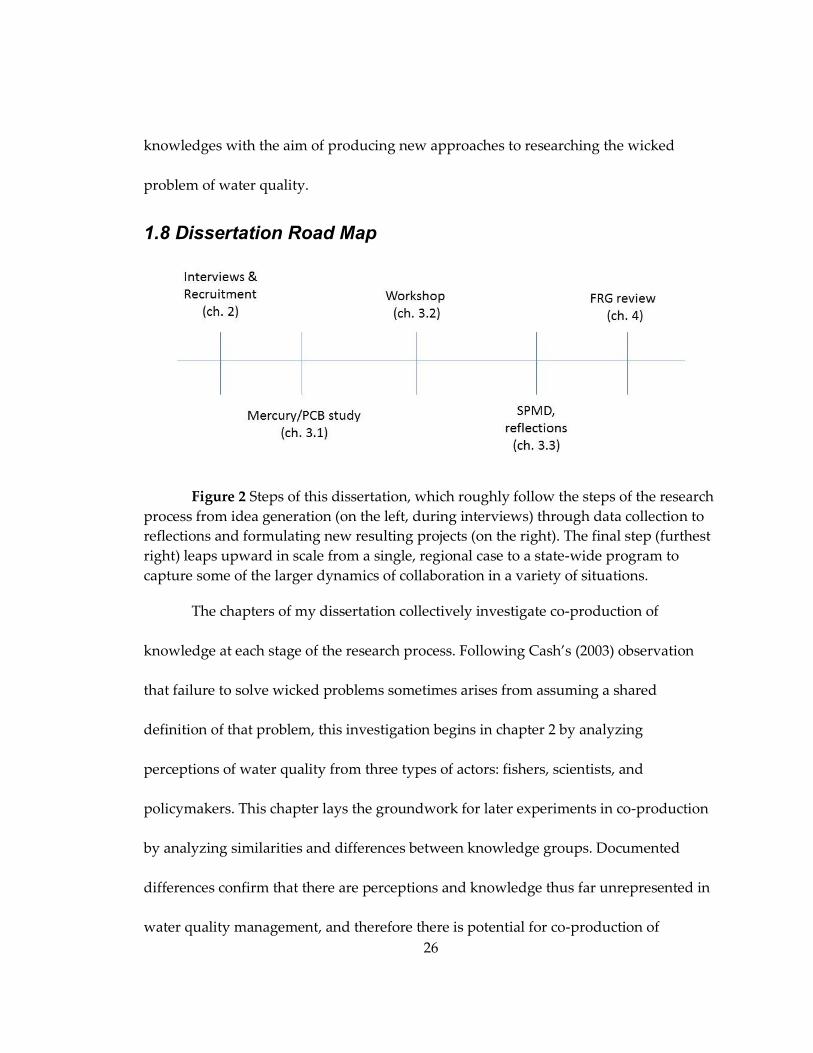
Figure 2 Steps of this dissertation, which roughly follow the steps of the research process
from idea generation (on the left, during interviews) through data collection to
reflections and formulating new resulting projects (on the right). The final step (furthest
right) leaps upward in scale from a single, regional case to a state-wide program to
capture some of the larger dynamics of collaboration in a variety of situations. .............. 26
Figure 3: Sketch of agencies involved in water quality management. Arrows indicate
authority; rules are made at the higher level and implemented by the agency at the end
of the arrow. Each box is an independent set of agencies at either the federal, state, or
local level. NCDENR is depicted above its various divisions and commissions as an
organizational (not rulemaking) authority.............................................................................. 47
Figure 4: Heuristic of the ways in which way of knowing changes perspective on water
quality. Only factors in which knowledge groups differed are included. .......................... 73
Figure 5: Mercury contamination by water body for each tissue type. Graphs are ordered
by increasing mercury content and bars in each graph from North to South. Bars
represent standard error and letters above the bars indicate statistical significance. Bars
with shared letters are not significantly different from one another. .................................. 91
Figure 6: PCB levels by water body for each tissue type. Graphs are ordered by
increasing mercury content and bars within each graph from North to South. The
asterisk indicates that the bar for clams in Masonboro Inlet extends to 84 µg/kg but was
truncated to have consistent axes. Bars represent standard error and letters above the
bars represent statistical significance; graphs without letters above the bars were not
statistically significant for the water body scale. .................................................................... 92
Figure 7: State fisheries regions. Bars represent standard error. Letters above the bars
represent statistical significance; bars sharing a letter are not significantly different from
one another. ................................................................................................................................. 93
Figure 8: Geographic variation in mercury content in estuarine commercial fisheries.
Darker points indicate more mercury (black over the EPA limit of 0.3 mg/kg), lighter
less. ................................................................................................................................................ 94

xiv
Figure 9: Geographic variation in PCB content in estuarine commercial fisheries. Darker
points indicate more PCBs (black above the EPA limit of 50 µg/kg), lighter less. ............ 95
Figure 10: State averages for mercury. Bars represent standard error and letters above
the bars indicate statistical significance; bars sharing a letter are not significantly
different. Recommendations are not within the scale of this cart: 0.3 mg/kg for EPA and
EDF, 1 mg/kg for FDA. ............................................................................................................... 96
Figure 11: State averages for PCBs, ordered by increasing mercury concentration for
comparison. Bars represent standard error and letters above the bars indicate statistical
significance; bars sharing a letter are not significantly different. Recommendations are
not within the scale of this chart: 12 µg/kg for EDF, 50 µg/kg for EPA, 2000 µg/kg for
FDA. .............................................................................................................................................. 97
Figure 12: Lipid content in the tissue types, shown in the order of increasing mercury
content. Bars indicate standard error and letters above the bars indicate statistical
significance. Bars sharing a letter are not significantly different from one another. ......... 98
Figure 13: Example diagram from participant who included as much of the hydrosocial
as he could. ................................................................................................................................. 119
Figure 14: Groups 1’s blended diagram (the 4-person group). Note the tree-like structure
delineating the problem of declining water quality into the two categories of
development and agriculture. ................................................................................................. 121
Figure 15: Group 2’s blended diagram (the 7-person group). The capitalized emphases
and hanging dash are from the original. Note the circular structure and combination of
factors in the centre, declared the foremost problems for water quality. ......................... 122
Figure 16: Sampling locations for the mercury and PCB study. Stars designate the
original 4 fisher/fish house collaborators in the city of Wilmington and towns of
Columbia, Smyrna, and Swanquarter. ................................................................................... 139
Figure 17: The most common query of the map layer exercise – how mercury levels in
the sediments compared with those measured in fish tissue during the project. The
overall consensus is that the relationship is tenuous at best. ............................................. 163
Figure 18: Results in the hands of participants who run a community supported fishery,
under the link “Is NC Seafood safe to eat?” I’m listed as the primary contact for
consumer questions. ................................................................................................................. 169

xv
Acknowledgements
This dissertation would not have been possible without the love and support
from many people. Much like raising a child, it truly takes a village to create a scholar.
First and foremost, I’d like to thank my participants for their time and patience in
introducing me to the world of coastal North Carolina. I’d like to think this research is a
testament to your love of the region, strong sense of culture, and strong connections to
the natural resources that support society. This testament was shared through lessons in
Down East brogue, tutorials in crab picking, shared delicious oyster roasts, and
otherwise taking time to teach the student what she really needed to know.
I’d also like to acknowledge my funding sources for thinking my research ideas
were worth supporting: North Carolina Sea Grant, Ramus Fund for Albemarle-Pamlico
Sound, Sigma-Xi Grants-In-Aid-of-Research, Kenan Institute for Ethics, Duke
University, and Duke University Marine Lab.
I also owe a lifetime of gratitude to my friends and family. To the CABLAB that
has been my home for the last 5 years, at times called the Beaufort School of Political
Ecology, thanks for the support and time spent bouncing ideas around: Myriah
Cornwell, Josh Stoll, Nick Mallos, Cristina Villaneuva, Noelle Boucquey, Rebecca Gruby,
Luke Fairbanks, Leslie Acton, Morgan Gopnik, Abigail Bennett, Courtney Pickett, and

xvi
Mateja Nenadovic, with Xavier Basurto and my ever-trusting and encouraging advisor
Lisa Campbell at the helm. Thanks to my wonderful officemate, Kristina Cammen, who
has forever inspired me to keep a drawer of chocolate in my office. Thanks to Uncle
Chris, who initiated me into the world of water quality – may we someday impress
upon the world how important and fragile our water supply is. The utmost of thanks
goes to my parents, who have supported me over many years of messy science
experiments including a microwave on fire and frogs on the dining room table. Finally,
to my love, Andrew Thaler, who patiently listens to my ideas and supported me
through the trials and tribulations of graduate school.

1
1. Introduction
Complex and diffuse socio-ecological issues such as water quality, climate
change, and biodiversity conservation make apparent how much information must still
be learned about the nature of a problem before solutions can begin to emerge. This
information needs to address both the issue’s details (e.g. mechanisms of decline) and
the relationship between humans and nature. My dissertation examines water quality in
coastal North Carolina as a case study of such a complex, persistent problem, and
explores: 1) diverse ways of knowing as a potential source of information that can lead
to a better understanding of water quality and 2) co-production of knowledge, through
collaboration among scientists and experiential knowledge holders, as a means of
productively channeling that diversity into research practices. Specifically, I am
concerned with three fundamental questions related to knowledge production:
1. What are the ways of knowing water quality, and do different understandings of
water quality emerge from different ways of knowing?
2. How do ways of knowing interact in a collaborative research setting?
3. What sorts of institutional mechanisms are needed to support collaborative
research?
This introduction serves to set the broader theoretical stage and describe my
motivations for research design.
First, I’ll describe why water quality makes a good example case for
researching complex socio-ecological issues, then describe the state of current research
and management. Then, 4 key concepts inform research design and analysis throughout

2
this dissertation: wicked problems, hydrosocial systems, ways of knowing with co-
production of knowledge, and links between knowledge and co-management. These
concepts inform each chapter to a varying degree, but together they draw together
political ecology’s focus on power (e.g. McCarthy 2002) with science and technology
studies’ philosophies of knowledge production (e.g. Raffles 2002). Elements of both
literatures are present in each of the key concepts. Finally, I provide a road map of the
dissertation followed by an overview of my research philosophy and methods.
1.1 Why Water Quality?
Water quality is a hallmark of the US environmental movement, anchored by the
flaming Cuyahoga River and drastic ecological effects described in Rachel Carson’s
Silent Spring (Kline 2011). Implementation of the Clean Water Act (CWA, 1973) resulted
in drastic improvements nationwide, but water quality remains a challenge, especially in
large watersheds such as the Mississippi River basin and the Chesapeake Bay. Poor
water quality is largely treated as an environmental issue in need of technical solutions
(e.g. pollutant trapping and remediation technologies) with scientists both framing and
attempting to solve the problem through political arrangements that authorize scientists
as problem-solvers because of their technical expertise (prevention and enforcement are
therefore only a small piece of the overall solution) (Jasanoff 2004). For example, this
technocratic framing is reflected in the legal frameworks for water quality monitoring.
The CWA identifies acceptable levels of 150 chemicals of concern determined by the “no

3
observable effects level”, or the concentration of a chemical below which no adverse
effects are observed in a test organism (usually mice, African clawed frogs, or zebrafish).
The no observable effects level is measured through standard toxicological assays,
primarily the dose-response curve, which documents effects over a range of doses of a
given chemical in a single species. Thus, through CWA definitions, scientists are
established as the authorities on the status of the nation’s water bodies, and the technical
expertise required to conduct the standard analyses means there is little room for other
forms of knowledge (and knowledge holders) to contribute.
Many scientists outside the EPA have noted the inadequacies of the dose-
response approach, suggesting that effects should instead be modeled by effects on
organisms in the environment (Rittschof & McClellan-Green 2005) or by model systems
that can measure multiple exposures (Petty et al. 2000) or loss of ecosystem services. In
addition, there may be indirect effects of contaminants working through ecological
processes that should be addressed by ecosystem-level indicators (Hinton 1998). Despite
efforts like these of individual scientists to broaden the approach to water quality, the
scientific community still lacks methods to complete a “community dose-response
curve” that estimates levels of concern based on a wide variety of potential impacts, for
example fishery status for both biological and economic viability. The emphasis of
economic and social issues as indicators of water quality plays a key role in the
differences between knowledge groups in chapter 2. In other words, although the

4
ultimate goal of the CWA is to promote healthy human communities and their use
values, the CWA has no direct indicators to measure success on this front. This research
begins to tread the complex path towards the goal of a broader approach to water
quality by exploring an expanded framework for knowledge that might be used to
address water quality management.
Both natural and social forces affect water quality. In a given body of water
within the study region of this dissertation, forces of both past and present affect water
quality. For example, take mercury contamination in Core Sound, just one sliver of the
overall profile of water quality (Bales et al. 2003), but one that captures the imagination
of residents. The peat soils underlying the terrestrial landscape naturally leach mercury
during hurricane disturbance and natural wildfires (Benoit et al. 1998). However, much
of the historic contamination is from pesticide residues when mercury was the main
active ingredient in pesticides; use of these pesticides was encouraged by the US Farm
Bill, which pushed for higher yields through chemical intervention (McClellan-Green,
pers. comm). Recent decisions to develop marginal lands for amenity migration and peat
mining increase the mercury leaching (Henry, National Fish and Wildlife Service, pers.
comm). Most modern sources of mercury are tied to coal-fired power production, with
atmospheric deposition of delivering mercury from as far as China (Evans 1986). Levels
resulting from coal combustion are determined both by the purity of the coal and the
scrubbing technology available for power plants. Overall levels of mercury in the

5
estuary are then controlled by water flow through the estuary, which is manipulated by
the Army Corps of Engineers, which dredges navigation channels and thus resuspends
mercury in the water column, making it bioavailable for fish and other aquatic
organisms (Kim et al. 2006). Thus, past and present political decisions, economic trends,
and the natural chemistry of the area blend to form the mercury profile, which then
interacts with other metrics of water quality in an overall assessment of quality.
Water quality is impacted by combined natural and social forces, making water
quality useful as a hybrid object in the study of marine and aquatic systems. Hybrid
objects provide “a mode of worldly inhabitation that precedes the urge to separate the
social from the natural rather than a gesture towards their reconciliation” (Whatmore
2002). In other words, they are objects that exemplify the need to cross the nature/culture
binary and provide opportunity to reconceptualize human relationships with nature.
Though hybrid objects provide opportunities to investigate the relationship between
humans and nature, they also appear simple at first glance. Forsyth (2003) further
specifies hybrid objects as “commonplace objects or ‘things’ that appear to be unitary,
real, and uncontroversial, but in practice reflect a variety of historical framings and
experiences specific to certain actors or societies in the past” (87). For example, historic
framings of water as a commodified resource for human consumption de-valued and
underprovided the ecosystem services provided by clean water outside of water markets
while recent movements to include the environment as a stakeholder have begun to

6
correct these trends (Bakker 2005). Hybrids are used as tangible concepts to study the
interaction of natural and social forces acting on a single phenomenon. Water quality
also fits Forsyth’s definition, as it is something perceived by the public as
uncontroversially measured by technology, when in reality the framing of water quality
is a politically negotiated process where different types of stakeholders have widely
varying access and influence (Keller & Cavallaro 2008).
Water quality’s hybrid properties were reflected during a controversy over
coastal development that brought community members in Down East, Carteret County,
North Carolina (an area contained within the study site) to the County Commissioners.
During debates over future development in the area, water quality emerged as a focal
issue for both discussion and action, while other community concerns (public access to
water, affordable housing, cultural heritage, aesthetics) were sidelined (Campbell &
Meletis 2011). At first glance, the focus on water quality improvement seemed to
showcase collaboration and shared interests, but a more detailed look reveals that water
quality proved governable in part because it was perceived to be amenable to
measurement and to technical solutions, like building regulations and industrial filter
technologies. By ignoring the complex hybridity of water quality (e.g. the way water
quality is linked to changing economies and cultures on the coast), the technical ‘fix’ that
emerged failed to address concerns at the heart of the conflict.

7
1.2 Wicked Problems
A wicked problem is defined as “a complex issue that defies complete definition,
for which there can be no final solution, since any resolution generates further issues,
and … diabolical in that they resist all the usual attempts to resolve them” (Brown et al.
2010, p.3). They are unstructured, spread over multiple overlapping subsets of problems
and policy domains, and relentless (Weber & Khademian 2008). Water quality meets
these criteria, as each aspect of water quality has complex causes, interacts with other
aspects, and is governed by multiple federal, state, and local agencies. Even with
improvements over time, new water quality concerns emerge and original concerns
continue to need attention for prevention and remediation.
The term ‘wicked problem’ was first coined in 1973 by Rittel and Webber, with
later scholars adding the need for creative research and management approaches as a
means of generating possible solutions. Since the term was first coined, the definition
has shifted slightly from characterizing problems as completely intractable and
unsolvable to including the possibility of amelioration (but recall the possibility that
solving one aspect of the problem may exacerbate other aspects (Brown et al. 2010)). The
optimistic title of Brown et al’s (2010) book Tackling Wicked Problems suggests that,
although wicked problems may not necessarily be solved, the situation can be improved
and managed like a chronic disease, using long-term monitoring and treatments.
Wicked describes well the persistent and complex challenge of protecting and

8
remediating water quality, and therefore provides a helpful conceptual structure for
approaching potential water quality solutions. Now and throughout the dissertation,
‘solutions’ refers to this type of incremental improvement – not providing access to clean
water for everyone, all the time – but improving water quality conditions step-by-step to
meet the needs of the community, as defined by the community.
There are several approaches to managing wicked problems and in this
dissertation I am interested in those that consider the question of knowledge because
water quality is a realm that could benefit from additional knowledge (described in
more detail later). A collection of wicked problem cases by Brown et al (2010) highlights
the potential of transdisciplinary imaginations in approaching wicked problems,
requiring problem solvers “to be open to different ways of thinking, to use imagination
to the full and to be receptive to new ideas and new directions that match the times” (5).
Another approach by Weber & Khademian (2008) suggests building social networks for
the “transfer, receipt, and integration of knowledge”, as networks match the diffuse and
complex characteristics of wicked problems. Of critical importance for these networks is
the role of collaborative capacity builders (and the subset of boundary spanners) to aid
in creation of new knowledge rather than merely mixing existing knowledge
contributions. In a third approach, work in environmental health promotes a systems
thinking approach, leaning on community health efforts as a means of incorporating
varied worldviews in which the wicked problem is embedded (Kreuter et al. 2004). In

9
this approach, specifically for water management, Lach et al. (2005) describe an
awakening among managers shifting from failing technology-based approaches to
“social interaction-intense strategies” that recognize the problem’s emergence from
society. These approaches aim for solutions through community stewardship for
problem prevention rather than using technology to clean up existing contaminants.
These three approaches share characteristics and my dissertation pulls lessons
from each of them, but relies mainly on the open transdisciplinary inquiry suggested by
the first. The role of diverse knowledges features in each approach, but transdisciplinary
inquiry pays explicit attention to fully incorporating different worldviews at all stages of
research with the aim of fostering creative problem-solving. Thus, my dissertation
begins in chapter 2 by structuring inquiry using contributions of knowledge and
perspective from stakeholders, as this achieves a wide-angle view needed for “tackling
wicked problems”. The questions of co-production highlighted in chapters 3 and 4
employ one possible means of fostering open transdisciplinary inquiry in a structured
way to ensure full inclusion of contributing ways of knowing water quality.
1.3 Crossing the nature/culture divide by moving from hydrological to hydrosocial
Recent discoveries such as the Great Pacific Garbage Patch, the importance of
prescribed fire to forest ecology, and effects of climate change felt in remote villages
support the argument that there is no longer (if indeed there ever was) a ‘nature’ that
has not been affected by human activity. Furthermore, some environmental historians

10
and others suggest that western philosophical traditions supporting a nature/culture
separation have contributed to environmental degradation and resulted in unjust
practices against local peoples directly dependent on nature for livelihood (Cronon
1996). For example, in one well known example, Fairhead and Leach (1996) refute long-
standing beliefs about the nature of the forest/savannah transition in West Africa, where
conservationists believed human population growth and settlement ‘degraded’
naturally forested landscapes and hastened a transition to savannah. Based on their
ethnographic work and analysis of aerial photographs with remote sensing data, they
show that instead, human practices increase forest cover. As a result of their faulty
assumptions, government and foreign aid agencies adopted flawed management
programs that penalized local people for practices that historically contributed to forest
growth. Similar to the savannahs, the complexity of aquatic ecosystems that contributes
to its wickedness is rooted in the combination of natural and social forces that produce
water quality, as discussed in the previous section. Although there is a shared need for
theoretical connections between nature and society, there are several approaches that
each offer different benefits and drawbacks, described briefly below.
Prominent bridging concepts include the socioecological system, “the integrated
concept of humans in nature” (Berkes, Colding et al. 2003) and ‘social-ecological
systems’, acknowledging equal contributions from social and the natural processes in
creating observed nature. These concepts focus on the emergent properties of resilience,

11
adaptability, and transformability (Hanna, Folke et al. 1996). Ostrom (2009) integrated
social-ecological thinking into her institutional analysis and design framework in order
to theorize sustainability through deconstruction to contributing factors. Socioecological
systems best address the outcome of the interactions between humans and nature, rather
than the processes constructing the system.
Crutzen (2002) goes a step farther, proposing that in order to better understand
the new global ecosystem, we need to think in terms of a new geologic era of the
‘anthropocene’. This model suggests that humans have irreversibly altered the geologic
processes that form an ecosystem, not just temporarily interacted with them. Ellis and
Ramankutty (2008) use anthropocene theory to create a typology of “anthromes”, or
anthropogenic biomes, that conceptualize landscape-scale ecosystem functions as the
product of both social and natural processes. The anthropocene concept also focuses
more on the observable ecosystem rather than formative factors, but also offers a more
global approach, including marine and aquatic systems, in order to create useful
ecosystem models including humans, past and present. Both of these models emerged
from natural science traditions and have a tendency to include humans as forces of
negative impact rather than a truly inseparable nature/culture.
My dissertation employs the concept of socionature, which “embodies both
material processes and the proliferating discursive and symbolic representations of
nature” and “implies constructing multiple narratives that relate material,

12
representational, and symbolic practices” (Swyngedouw 1999). Swyngedouw (2004)
argues that socionature is continually reproduced and that research should focus on
how such reproduction takes place, especially when interested in shifting the
reproduction to meet conservation goals. Socionature therefore provides a helpful
theoretical framework to examine the problem identification and framing that occur
within ecosystem conservation efforts because of its attention to multiple narratives – or
how different types of knowledges combine to conceptualize the system. In addition,
Swyngedouw specifically applies the socionature concept to aquatic systems, albeit in
urban settings, through the concept of the hydrosocial cycle.
The ‘hydrosocial cycle’ is defined as the encounter of the hydrological cycle with
patterns of water production and use (Giglioli & Swyngedouw 2008). Swyngedouw
(2004) highlights urban water as an example of mismanagement that arises from
ignoring the social side of the hydrosocial cycle, resulting in unequal distribution,
contamination, and debates over nature’s rights to water. For example, he describes how
capturing water for urban use also monetized water as a commodity and strengthened
existing power and class relations structured by money, a process not recognized if
water is considered a natural public good. Water is impossible to manage as a single,
sellable resource as many cities have tried because of the interconnectedness of physical
and social properties of water (Bakker 2005). For example, Bakker (2005) illustrates how
ideologically driven changes in urban water management in England fell short due to

13
physical properties of water and demands for water use that fell outside privatized
market capabilities. As Ostrom (2005) proposes, political, community and biophysical
properties of a resource are equally important to recognize and integrate for successful
management.
Referring to his hydrosocial cycle concept, Swyngedouw (2009) states “such a
perspective opens all manner of new and key research issues and urges considering
transformation in the way in which water policies are thought about, formulated, and
implemented”. Furthermore, he argues that the new perspective will produce a different
geographic imaginary which in turn will lead to novel, more democratic and equitable
forms of hydrosocial organization. He suggests describing “the architecture” of a hybrid
object as an analytical tool for this transformative process, focusing on the knowledge
and practice of production of that hybrid (Swyngedouw 2004). For example, the
following map shows how North Carolina currently bounds its hydrosocial systems – by
‘basin plan’, roughly following river basins. Maps like these depict current architecture
(largely hydrological) as used in political decisions, but need many improvements to
meet Swyngedouw’s ideal to transform it to a hydrosocial (discussed in further detail in
chapter 2).

14
Figure 1: The 17 River Basin Plans of North Carolina. This is how the state
currently conceptualizes each hydrosocial system. Produced by the Wildlife Resources
Commission, http://216.27.39.101/Plan/NC_River_Basins_Map.htm
1.4 Multiple ways of knowing and the co-production of knowledge
The complexity of both wicked problems and hydrosocial systems creates a need
for more information from a diversity of perspectives in order to fully understand the
system (Fortmann & Ballard 2009). To achieve this understanding, Robbins (2003)
suggests society move beyond the positivist model of science to recognize the linkages
between knowledge and power. Positivist science as described by Compte in the mid-
1800’s solidified into modern scientific method (Popper 1959), relying on the assumption
that all information is objectively measureable and verifiable. Currently, positivist
inquiry is perceived by managers and the general public as objective fact produced
using the scientific method and by experts. Scholars of science studies suggest that
instead, all knowledge is constructed through social processes through which neutrality
is far from guaranteed (Irwin 1995). Postpositivist inquiry recognizes that “knowledge is

15
inherently multiple, with multiple claims to representing reality and multiple ways of
knowing” and requires multiple approaches to reveal the “truth” (Rydin 2007).
At a more basic level, “the reality of complex socio-ecological systems may not
allow such unambiguous conclusions” that result from a positivistic approach (Pahl-
Wostl 2006). Especially for aquatic systems, positivist tendency towards reductionism
(Christie 2011) actively undermines the broad-scale understanding needed for problem
solving that includes multiple components and how those components fit together
(Pahl-Wostl 2006). In Van Sittert’s (2005) marine example, “the current crisis in the
world’s oceans has unfolded at a massively accelerated rate in the twentieth century
during the disciplinary lifetime of modern marine science and actively facilitated by its
abstracted notions of nature as a model”. He suggests other scientific traditions are
needed to both understand the marine crisis and help stem the decline, in particular
historical ecology, to address the cultural assumptions inherent in current marine
science. In this case and others, positivist science is good at describing aspects of a
problem but often not the complete picture or opportunities for solutions. Positivist
belief that scientific data can speak for themselves in decision-making is recognized in
many of the social sciences to be inadequate in motivating change (Ward 2007).
Alternative ways of knowing may provide links “across the knowledge-action divide”
(Robinson & Wallington 2012a).

16
Alternative ways of knowing often offer a different view of how the world is put
together. For instance, in her study of the Gimi people of Papua New Guinea, West
describes how forest animals are not seen as a piece of nature to protect but a
reincarnation of the souls of ancestors. Conservation and religion are therefore
inextricably intertwined, a concept that does not translate well to conservation biologists
and has created rifts between local citizens and transnational conservation organizations
(West 2005). Another example arises out of Ingram & Lejano's (2010) investigation of
water management in the American West, where engineering, followed by biology and
medicine, drive management but local understandings of water as a human right
demands other types of information for management such as perceptions of a
rural/urban power divide in how water is allocated. This is not to say divisions between
knowledge holders are inevitable, only that they must be attended to carefully. In
response to critiques like those by Ingram and Lejano, more recent water management
in California uses perspectives of diverse stakeholder groups as a means to create a
more comprehensive and well-accepted management plan (Hanak et al. 2011).
One of the most common ways of including alternative ways of knowing and
their associated worldviews is in making science participatory, particularly through the
subset of participation co-producing knowledge (Fischer 2002). Moving beyond the
positivist-created expertise involves more than just bringing different knowledge
holders together, but has knowledges engage with one another (Rydin 2007). Co-

17
production of knowledge contains two facets of engagement: one setting a fair process
for holding knowledge to cultural standards of reliability, within the worldviews of
stakeholders, (a la Jasanoff) and one creating a qualitatively better collection of socially
robust knowledge (a la Nowotny) (Rydin 2007). Jasanoff’s (2004) theoretical focus is on
the process of knowledge production, where ‘co-production’ is shorthand for the fact
that the way we know and represent the world are inseparable from the ways we choose
to live in it. Nowotny’s (2003) theoretical focus is on the information that results from
knowledge production, where ‘co-production’ represents a diversity of contributions to
knowledge that match the complexity of the issue and diversity of the intended
audiences for such knowledge. This dissertation will focus largely on Nowotny’s facet of
co-production, but the two are inextricably linked.
Concerns about ways of knowing are not restricted to science studies scholars
and critics of traditional resource management. For example, educational scholars
discuss multiple intelligences in relation to the diverse ways that people learn. Although
these scholars largely describe science as embodied in logical-mathematical intelligence,
there are seven other types of intelligence: linguistic, musical, spatial, bodily-kinesthetic,
interpersonal, and intrapersonal (Gardner & Hatch 1989). Each discipline thinking about
multiple ways of knowing creates a term for the non-scientific knowledges, and the
number of terms grows with the concept’s popularity. In the environmental sciences, a
number of terms co-exist. Berkes defines traditional ecological knowledge as “a cumulative

18
body of knowledge, practice, and belief, evolving by adaptive processes and handed
down through generations by cultural transmission, about the relationship of living
beings with one another and with their environment” (Berkes, 2008: 7). The term refers
both to the way of knowing and the resulting body of knowledge. However, many
people assign a static time component to the term traditional, implying that the
knowledge is one to be collected from community elders and relies on understandings
of the world before the emergence of modern society, a world seen as static through
generations (Antweiler 1998). Local knowledge emerged as an alternative, as Ruddle
suggests, “because it is the least problematical” (Ruddle 1994). Ruddle (2000) describes
common traits of local knowledge that are evidenced worldwide: based on observation,
practical and behavior-oriented, structured but inductive, dynamic and capable of
learning. Ordinary knowledge also pertains to local context but adds a normative
prescription to embed future learning in that context (Fischer 2002). The term ordinary is
scarcely used outside of the participatory research community, where it refers to
knowledge created through a participatory process, and recognizes the inability to
extract knowledge from the knowledge creators’ worldview. The much more general
alternative knowledge encompasses all possible terms, referring to types of knowledge
outside the socially dominant, usually Western science. The term specifically references
the power differential often present between alternative knowledge systems and the
dominant knowledge, calling attention to the fact that knowledge outside science is

19
often denigrated by managers and the public as backward and unsophisticated (Gratani
et al. 2011).
In recognizing the value and necessity of multiple ways of knowing, scholars
such as Agrawal (1995) note that conceptually dividing knowledge groups can create
additional false dichotomies that threaten the validity of co-production efforts. These
dichotomies fail to attend to the active and dynamic flow of information, especially new
information, between knowledge groups that may tie groups closer together than at first
glance. Yanow (2009) also notes that there is a significant difference between different
ways of knowing and different types of information. Therefore, multiple ways of
knowing must represent different underlying social and learning architecture, not just
different aspects of the same (usually scientific) approach. However, recognizing the
danger of dichotomies, there is value in separating groups to ensure representation and
attend to the real differences between their perspectives and practice (Robbins 2006).
In the case of coastal North Carolinian water quality, it is helpful to delineate
three groups of knowledge holders. Scientists have scientific knowledge, sourced from
experiments undertaken largely in the western positivist tradition, meant to generalize
and ultimately uncover ‘truths’ or laws of nature. Fishers have local or experiential
knowledge sourced from everyday lived experience and cultural received wisdom, and
of practical use in their fishing activities (Berkes 2008). Policymakers have political
knowledge that combines aspects of both scientific and local knowledge sourced from

20
scientific and community informants (Weeks 1995). This dissertation makes use of these
three categories, separated by the intent of knowledge creation, recognizing the body of
literature problematizing categorization overall (Dove 2000) and the use of certain
terminology, such as local (Raffles 2002).
1.5 From co-production to co-management
In the region of coastal North Carolina where my research took place, a
complicated fabric of social relations exists between different groups of knowledge
holders that exhibit the need for knowledge management. An international history of
taking advantage of fisher knowledge to then regulate fisheries creates a large trust gap
between fishers and managers (Maurstad 2002). The resulting perception is that fishers
and scientists fail to agree on knowledge content, but in fact, the political history
obscures possible knowledge complementarities outside of fish stock data, as
demonstrated in interviews about a variety of fisheries-related topics (Wilson 2003). In
his study of fishery management knowledge in the Northeastern US, one of the topics
Wilson (2003) identified water quality as an area of complementarity because fishers and
scientists used their respective knowledges to arrive at similar conclusions regarding
research and management needs. In North Carolina specifically, despite their wealth of
experiential knowledge over the length of long careers, fishers are consistently left out of
discussions where that knowledge would be insightful (such as land use planning and
other water quality-related policies), their knowledge labeled as irrelevant (Griffith

21
1999). Despite their disenfranchisement in North Carolina, other fisheries successfully
leverage fisher knowledge for co-management, fundamentally changing the relationship
between knowledge and power (Jentoft 2000).
In his review of co-management, Berkes (2009) found that successful co-
management (defined as “the sharing of power and responsibility between the
government and local resource users”) does not always go far enough in
changing the relationship between knowledge and power. Co-management
inherently engages with different ways of knowing, where scientists and
managers bring big-picture knowledge while citizens provide specific details and
local context. However, co-management that does not intentionally attend to
how those knowledges are combined or integrated may fail, especially because
compartmentalization of knowledge “has profound effects on how people can
think about knowledge and the ways in which it can be used’ (Nadasdy 1999).
Beginning the process with co-production of knowledge sets the stage for shared,
negotiated, and trusted information rather than simply ensuring representation
of multiple knowledges that maintain existing problematic power relations
(Berkes 2009). Cooperative research in the Northeast increased acceptance of
management efforts by fishers and decreased the trust divide between fishers
and policymakers by using an expanded definition of scientific expertise in
management dependent on the ‘best available science’, invoking co-produced

22
research results on squid fishery dynamics as the base on which management
decisions should be founded (Johnson 2010). Optimistic cases like Johnson’s
work in Northeastern fisheries adhere to Nadasdy’s call for care in knowledge
integration and successfully manage diverse ways of knowing, that enable the
connection of resultant knowledge to policy. That’s why I’ve chosen a similar
line of inquiry for water quality in North Carolina, as an issue in need of new
approaches and perspectives.
1.6 The Case and Parallel Systems
This study investigates the potential contribution of collaborative research to
water quality in coastal North Carolina, particularly in Carteret County. Coastal waters
are largely brackish, increasing in salinity from headwaters to the open ocean. As a
result, water quality refers not to drinking water standards, but to ability to provide
ecosystem services and support a healthy estuary. Examples of ecosystem services
dependent upon clean estuarine water and resulting healthy estuaries include
commercial and recreational fishing, swimming, aquaculture, storm buffer protection,
nursery grounds for fisheries and protected species, natural water filtration, providing
for cultural heritage activities, and tourism (Street et al. 2005)
Water quality in the area has improved over time – starting with the days of
rivers running different colors depending on the dye of the day at the textile mills before
the Clean Water Act – in response to increased knowledge about water quality and

23
resulting legislation. Most recently, the USGS prioritized sediment contamination as the
most pressing need for improving water quality (Bales et al. 2003). A more thorough
description of water quality North Carolina’s estuaries is included in chapter 2, but more
importantly, throughout this dissertation I intentionally let the term be defined (in many
cases, literally) by the research participants, who used their perceptions and
observations to comment on water quality research and management and move forward
to design new research questions on the subject.
1.6.1 Examples of comprehensively managed watersheds
Given theories integrating nature and culture, often in the form of the
hydrosocial system, a number of regions of integrated watershed management have
emerged. These regional management efforts are borne of specific needs of that
watershed and therefore define their strengths and weaknesses with reference to these
needs. These examples vary in scale from municipal land and water use plans to
expansive regional efforts. Here, I will focus on two coastal examples with estuaries at
their downstream end that make an easy analog to the sound system of North Carolina –
the San Joaquin valley of California and the Chesapeake Bay.
The San Joaquin valley suffers from both strong agricultural pressures on water
quality as well as climatic and population pressures on water quantity. As a result of the
“smeltdown” of water and habitat management, the state of California created CALFED,
a comprehensive institutional arrangement meant to instill adaptive management and

24
participation by all stakeholders in both research and management (Hinton 1998). The
plan, intended to be implemented by the California Bay-Delta Agency as a boundary-
spanning organization, mandated a social-ecological understanding of water and formal
roles of participation for all stakeholders (Lejano & Ingram 2009). Later analysis of
CALFED implementation stated success in innovations in collaboration and conflict
resolution, but deficits in mandated environmental justice outcomes because of tensions
between market domination, state legitimation, and procedural justice (Shilling et al.
2009). However, the San Joaquin valley has since become a testing ground for
participatory methods in how to construct justice and adequate participation, thus
improving CALFED over time and setting an example for other regions facing similar
management struggles (Cvetkovich & Earle 1994; Shilling et al. 2009).
The Chesapeake Bay faces similar pressures on water quality, with higher
pressure from urbanization and the added challenge of needed inter-state cooperation.
Management through policy occurs primarily through the tri-state Chesapeake Bay
Commission, which implements bay-wide management through border-crossing
legislation such as total maximum daily load (Commission 2011). The Commission also
credits improvements in Bay water quality to the use of “sound science”, promoted
especially by the Chesapeake Bay Program, which helps coordinate needed applied
research. However, the Chesapeake leads the nation by example not in management or
research, but in education and involvement of watershed residents from an early age.

25
School programs spearheaded by the Chesapeake Bay Foundation increase
environmentally-friendly behaviors of both students and teachers, innovating practices
now copied broadly such as stamping stormwater drains “Drains to Chesapeake” (Zint
et al. 2002). Citizen science programs in the watershed also define stakeholder roles in
what has been termed “large-scale collaborative resource management”, aiding the
creation and maintenance of an adaptive management system for citizens of the entire
watershed (Heikkila & Gerlak 2005).
While these are brief summaries of expansive watershed programs that
constantly adapt to new needs and stresses, both provide insight into how
reconceptualization of water as hydrosocial and development of public participation in
science may provide foundations for more sustainable outcomes for both environmental
needs and human uses.
1.7 Project Objectives
This research reconceptualizes the estuarine water system not simply as a
‘natural’ phenomenon, but as a complex hydrosocial ystem, where the way in which we
use, manage, and organize water systems are co-determined with social processes
(Norgaard 1994). This conceptualization will make more explicit the contributing types
of knowledge and related interactions that produce and define the system. The research
goes beyond documentation of differing perspectives to consciously combine those
26
knowledges with the aim of producing new approaches to researching the wicked
problem of water quality.
1.8 Dissertation Road Map
Figure 2 Steps of this dissertation, which roughly follow the steps of the research
process from idea generation (on the left, during interviews) through data collection to
reflections and formulating new resulting projects (on the right). The final step (furthest
right) leaps upward in scale from a single, regional case to a state-wide program to
capture some of the larger dynamics of collaboration in a variety of situations.
The chapters of my dissertation collectively investigate co-production of
knowledge at each stage of the research process. Following Cash’s (2003) observation
that failure to solve wicked problems sometimes arises from assuming a shared
definition of that problem, this investigation begins in chapter 2 by analyzing
perceptions of water quality from three types of actors: fishers, scientists, and
policymakers. This chapter lays the groundwork for later experiments in co-production
by analyzing similarities and differences between knowledge groups. Documented
differences confirm that there are perceptions and knowledge thus far unrepresented in
water quality management, and therefore there is potential for co-production of

27
knowledge to contribute to that management. These differences also justify delineating
these knowledge groups for analysis (in light of Agrawal’s critique of dividing
knowledge groups), especially when paired with a section on how each group learns
included in chapter 2. Chapter 2 also contains an in-depth description of the case of
North Carolina coastal water quality with the status of social, chemical, and biological
indicators.
Chapter 3 continues the ethnographic approach to evaluate co-production of
knowledge through the lens of a collaborative research project as it unfolds. The project
was designed to observe firsthand the negotiation of the roles different ways of knowing
play during applied collaborative research. As the researcher/facilitator for the project, I
directly confronted the role of expertise and related power structures in collaborative
research, paying particular attention to the role of interactional expertise (or the
knowledge and authority needed to facilitate combining different types of knowledge).
The first paper documents the knowledge we collectively created, then evaluated
through the standard peer-review process of academic journals. Without successful
creation of new knowledge such as this, motivation for knowledge co-production effort
is greatly, but not entirely diminished. This is because the motivation is rooted in both
the knowledge product (Cash et al. 2003) and in shifting the social processes of science to
become more just (Jasanoff 2004), as discussed in the review of co-production literature.
The second paper focuses on process, and details my method of facilitation meant to

28
ensure that all participants were able to voice their perspectives comfortably and that
knowledge was not merely mixed but integrated. This occurred primarily during a mid-
process workshop that pulled from systems dynamics techniques by using collaborative
conceptual modeling (Newell & Proust 2009). Taking a larger-scale picture of the
collaborative research effort as a whole, the chapter concludes with a third paper that
offers an ethnographic account of the entire process, told from my perspective as the
only participant present at all stages of knowledge production and negotiation. The fact
that I was the only one in this situation is a testament itself to the difficulty in facilitating
true co-production.
Taking Robbins’ (2002) advice for political ecologists to look up in addition to
looking near, chapter 4 looks at co-production of knowledge as institutionalized through
the North Carolina Sea Grant Fisheries Resource Grant (FRG) program. The FRG
program promotes co-produced knowledge in an effort to produce timely applied
knowledge to help science, fisheries, and management. The program has changed over
time (described in more detail in the chapter) and is guided through legislation
reviewed annually by the state’s General Assembly. One of the topics of interest, most
often funded through the “environmental pilot category”, is water quality. Sea Grant’s
support in this area provides the opportunity to investigate whether and how over a
decade of co-produced research on water quality has changed the knowledge and social
landscape of the wicked of water quality. Because the FRG program is orchestrated by

29
state institutions, it provides a case study of what co-production of knowledge at a
larger scale has to offer and the pitfalls organizers of such programs should be wary of.
1.9 Philosophical and Methodological Approach
Following a trend within political ecology (Wainwright 2005), my
philosophical approach to research falls within critical realism, where multiple
perspectives are needed to gain a better understanding of the whole. Unlike forms of
constructivism that deny the existence of reality beyond what society recognizes, critical
realism acknowledges that there is a physical reality that exists independent of society.
However, our ability to know this reality is mediated by social processes. In this light,
multiple ways of knowing, borne of multiple social processes, can help us get nearer to
understanding ‘reality.’ Fisher (2002) states the philosophical shift must necessarily
accompany efforts to democratize science, along with a shift in methodologies towards
participatory inquiry. George and Bennett (2005) also promote critical realism as a
means of determining (and rearranging) complex causality through conceptual validity
using data triangulation, supporting derivation of new hypotheses, and directly
exploring causal mechanisms. They warn against a narrow field of vision and potential
case selection bias associated with the in-depth case studies required for these methods.
My approach in chapter 4 is meant to somewhat address these concerns, but these
concerns can only completely be put to rest through future case studies in other places
or for other wicked problems.

30
Water quality, like many wicked problems, is “in reality a constellation of linked
problems embedded in the fabric of the communities in which [it] occurs” (Kreuter et al.
2004) and therefore the broader context should be considered. I chose to investigate the
question of water quality in the small downstream communities of coastal North
Carolina. Linked problems for this case revolve largely around fisheries management
and rural livelihoods. During the course of the work presented here, many
developments related to coastal resources and their use also proceeded in the larger
constellation of linked problems, including the aforementioned debates about changing
land use as well as a legal debate over the use of gillnets because of their incidental
capture of sea turtles, the ongoing struggle between allocations for recreational and
commercial fishing, continued efforts to support mariculture and aquaculture, and the
formation of two community-supported fisheries. At the very minimum, these events
affected participation in the studies embodied in my dissertation, both taking attention
away from water quality and drawing attention to the potential for help in these
developments from the research community. For example, mariculturists in particular
were more likely to show continued commitment to the collaborative research efforts of
this dissertation than other fishers because they market their development as improving
water quality. Long term, only time will tell how impacts from collaborative water
quality research may ripple through the environmental and social indicators in related
arenas.

31
Because of the need for in-depth description and a focus on process, I chose
ethnographic methods for my dissertation, including interviews, participant
observation, and document review. Each chapter includes a more specific account of the
methods employed for that particular part of the dissertation, so herein I restrict
attention to how I operationalized my philosophy of critical realism into a defined set of
methods. Tied to my choice of ethnographic methods was reliance on qualitative data
(with some quantitative in chapter 2). Among benefits of being able to record
complexity, qualitative approaches can also lesson power differentials between
researcher and participants (Karnieli-Miller et al. 2009), an outcome that is particular
desirable when both knowledge and power are of research interest (Watts 1993).
Fundamentally, though, qualitative data collection allows the adaptive hypothesis
analysis that is a hallmark of critical realist inquiry (George & Bennett 2005).
My analysis of this qualitative, ethnographic data utilized grounded theory,
where conclusions and underlying theory emerge from the data free of pre-determined
hypotheses (Charmaz et al. 2000). Grounded theory is particularly useful in exploratory
research where research questions emerge from the exploration (Gallardo & Stein 2007),
as is particularly the case with participatory research. It is also commonly used in social
studies of science. For example, in her reflections of boundary object studies, Star (2010)
promotes grounded theory as the best way to analyze the complex and multifaceted
nature of boundary objects. She especially relies upon grounded theory to ensure that

32
categories imposed upon the analysis (in the case of my research, fisher, scientist, and
policymaker) are in fact real boundaries. The utility of these boundaries are further
explored in chapter 2. During the course of my dissertation, all data (interview
transcripts, documents, journals) and in-the-field reflections on emerging themes were
archived in NVIVO (Doncaster, Victoria, Australia) and the results sections of each
chapter reflect the themes emerging from this database of qualitative data.
This research received exemption from the Duke University Institutional Review
Board, as the research participants were all over 18, no identifiable information was
recorded permanently (each participant is identified by career only in the results and
analysis), and participation was entirely voluntary, yielding minimum risk or benefit.
The IRB exemption thus provided minimal ethics oversight for ethnographic human
subjects research. Given that IRBs were formed in response to egregious abuses of
participants in medical research, this review was understandably minimal. However,
my personal code of research ethics extends far beyond the requirements of IRB. The
topic of research ethics within participatory research is under development currently (as
discussed at the Public Participation in Scientific Research conference in 2012), and
therefore I expect reflections such as this one will be helpful to future research
endeavors. Understanding that participants donated not only their time but their
intellect, I was and am committed to providing proper credit for that contribution. For
example, the results of chapter 3 were published co-authored with the fisher who

33
generated the idea for the project, a practice that chapter 4 reveals is far from standard
practice.
Though I give other participants acknowledgements in every presentation of this
data, they deserve further credit for their intellectual contributions and I am currently
seeking a meaningful way of providing that credit. I also gave each participant my
personal cell phone number not only for questions about the research, but to create an
ethic of constant communication that is atypical of research. I also made sure that I met
each participant to discuss results in a setting most comfortable to them, be that on a
boat, in their house, or at the local coffee shop. Others have noted this type of
communication is the difficultly in participatory research for a dissertation (Fortmann,
pers comm.), but this is necessary to ensure that participant voices are adequately
recorded. Both the constant communication and the maintenance of this respect raise
questions for what will happen with this work in the future. Waning levels of
participation and a sluggish job market both point towards ending this vein of research,
but what are the ethical requirements of finalizing a project with social ties throughout
the community? Only time will tell. I consider many of the participants my friends and
will let that relationship guide future efforts as the topography of our social web
continues to change.

34
2. Naming, framing, and blaming: Exploring ways of knowing in the deceptively simple question “what is water quality?”
2.1 Introduction
Concern for water quality is a hallmark of the US environmental movement,
capturing the minds of the public through the flaming Cuyahoga River in 1952 and
Silent Spring in 1962, and maintains attention due to the importance of clean water for
personal health and livelihood (Kline 2011). Despite initial improvements to water
quality realized through the creation of the Environmental Protection Agency (1970) and
passage of the Clean Water Act (1972), water quality problems continue to negatively
impact human health and livelihoods. Natural resource problems such as water quality
are long-term and complex, with multiple contributing causes of decline, jurisdictional
overlap and gaps, and debate over benchmarks and indicators of quality (Kreuter et al.
2004). Conflict between user groups over water quality can serve as a metric of
management failure, something prevalent in water management (Schumann 2011).
Failure to provide ecosystem services is another metric, used most recently to declare
Chesapeake Bay water quality management a failure (Berkes 2009). Water quality is a
persistent environmental problem in need of creative solutions (Brown et al. 2010), and
remains a priority for research and management.
There are multitudes of reasons natural resource management efforts might fail
to meet their objectives, and in this paper, I explore two of these related to ways of

35
knowing: a) assumptions about the nature of the problem and, b) implications that
diverse ways of knowing have for evaluating and implementing management. For the
first of these, regarding the nature of the problem, Adams et al. (2003) argue that in
resource management conflicts, there is a tendency to assume a shared definition of the
problem, and to move immediately to analyzing policy failures in terms of institutions,
costs versus benefits, regulatory capture, etc. However, assuming a shared problem
definition may lead to failed efforts to find solutions because stakeholders tailor their
solutions to what they perceive to be the problem (Adams et al. 2003). As a result,
Adams et al promote beginning the policymaking process with clarifying the nature of
the problem and the extent to which actors share an understanding of it. The same might
be suggested for research processes.
The second reason, implications of diverse ways of knowing, is in response to the
fact that for complex environmental problems, traditional positivist science has proven
insufficient to both define problems and design solutions (Pahl-Wostl 2006). For
example, in water management, dealing with climatic uncertainty and cultural values
ascribed to water in Europe necessitated new scientific approaches, allowing people
who learn in different ways to participate in research and management (Pahl-Wostl
2006). Like in the European water case, calls to recognize other forms of knowing (under
a variety of labels, including local, traditional, indigenous, and alternative) accompany
critiques of the role of traditional science in policymaking. Especially for complex

36
systems, engaging non-scientific knowledge holders is seen as a way to increase overall
understanding of the problem and potential solutions (Fortmann & Ballard 2009). In
spite of resource management failures and how science is sometimes implicated, science
is still most often elevated as the legitimate lens with which to view both the problem
and solutions (Hilgartner 2002). These two problems combine to form an assumed
shared, scientific definition of the problem.
In this paper, I explore how actors who ‘know’ water in different ways (fishers,
scientists, and policymakers), understand water quality problems and solutions,
particularly how these understandings do or do not overlap. Using a case study of the
Albemarle-Pamlico estuary system in North Carolina, I specifically consider how actors
define water quality generally, their assessment of local water quality status and trends,
who they think is primarily responsible for management, and what they think should be
done to address the problems they identify. This research lays the groundwork for a
larger project exploring the possibilities for collaborative research and management. As
instructed by Adams et al, any potential research collaboration or management
decisions will need to be informed by an understanding of the extent to which different
actors share an understanding of water quality problems and associated solutions (see
also Nadasdy 1999). Before turning to the details of the current study, I briefly review
the literature related to ways of knowing the environment, why incorporating ways of

37
knowing may assist with policymaking, and what is needed to recognize perspectives
from different ways of knowing in research and management.
2.1.1 Starting with the Basics: Ways of Knowing Environmental Problems
Though there are many ways to delineate different ways of knowing and people
may possess more than one, nonscientific knowledge bases that contribute to
environmental management include local, traditional, or ordinary – knowledge based in
local context and learned through experience (Fischer 2002). Educational scholars define
8 types of intelligence that describe how people learn best, where people integrate a mix
of strategies but generally have one or two strengths: logical-mathematical, linguistic,
musical, spatial, bodily-kinesthetic, interpersonal, and intrapersonal (Gardner & Hatch
1989). The experiential knowledge that contributes to environmental management fits
within spatial and bodily-kinesthetic categories, as it ascribes to place-based, hands-on
learning. The fishers in North Carolina possess this type of knowledge, learned through
apprenticeships, generally along patrilineal lines. Western science fits largely within the
logical-mathematical category, as it is driven by hypothesis testing and the quest for
generalizable truths. The scientists in this study possess this type of knowledge. Finally,
policymakers possess interpersonal intelligence, as they manage many avenues of
information flow from constituents, lobbyists, agency staff, and other policymakers.

38
Investigation of initial problem framings and the associated worldviews of
stakeholders with diverse ways of knowing is an essential first piece of finding a
solution to environmental problems (Nadasdy 1999). In his study of artic traditional
ecological knowledge, Nadasdy found “new integrated knowledge will allow
improvements in existing processes of environmental impact assessment and resource
management” but that this integration could not adequately take place until accounting
for the underlying worldviews that describe problems in a different, more qualitative
and complex form. In addition, scholars of science and technology studies have argued
that multiple perspectives from diverse ways of knowing are needed to fully understand
a given problem, pushing the process of science to a new, more inclusive model (H. M.
Collins & R. Evans 2002).
2.1.2 Assisting policymaking: Helping by incorporating diverse ways of knowing
Not all knowledge production, or even all science, translates into political power;
only knowledge producers with more connections to the decision-makers (Weiss et al.
2012). The first step in improving democratic management is to democratize science and
ensure that knowledge and views of each group are heard (S. McCormick 2007).
Previously unheard voices often have useful insights that contribute to improving
management. For example, in their comparison of forestry in Trinidad and Guinea,
Fairhead and Leach (2003) found that local ways of knowing played a large role in
management success, even when priorities originated from global sources. In these

39
forests, local knowledge filled the gap between the relatively new non-equilibrium
ecological understanding and policy changes needed to incorporate this new
understanding. In a marine context, Gerhardinger et al. (2009) found local knowledge
helpful for informing marine protected areas management across a range of institutional
structures. The local knowledge created a broader and more diverse knowledge base in
order to make management decisions, either through informing local institutions,
stakeholder participation, or official Western science assessments.
How different forms of knowledge are presented for management makes a
difference in the success in assisting policymaking. Huntington (2000) emphasizes the
need to move away from a tendency to describe local knowledge in Western scientific
terms. He suggests moving towards more participatory methods derived from the social
sciences, including interviews, workshops, and collaborative research. This echoes other
analyses calling for participation as a means of shifting the dominant mode of
knowledge creation, from stakeholder roles to ‘stakesharers’ actively involved in
creation of the nature they would like to see (Torkar & McGregor 2012). In water
management, responsibility by a network of people has proven most successful through
relying on bridging organizations to make connections across scales and stakeholder
groups (Rathwell & Peterson 2012). These networks accommodate active participation
by people with a variety of perspectives by ensuring information flows throughout the
network.

40
2.1.3 Easier said than done: What is needed to officially recognize different ways of knowing
The process of inclusion will likely take some readjustment of the standing
balance of power that favors scientific expertise to ensure that historically unrepresented
voices like those of local knowledge are heard (Fortmann & Ballard 2009). Integration of
local and scientific knowledge is a notoriously difficult task because knowledges are
structured in different forms and there is often distrust of motives behind using the
knowledge (Nadasdy 1999). In addition, integration techniques need to be systemic,
reflexive, and cyclic to ensure that multiple perspectives maintain their voice (Raymond
et al. 2010). Overcoming these difficulties requires that participants recognize different
ways of knowing both within themselves and within the problem-solving community
for a given issue. One strategy suggested by the literature for aiding integration is to
support boundary spanners and boundary organizations (Johnson 2011; Forsyth 2003).
Boundary work translates across knowledge types and “across the knowledge-
action divide”; it does not need consensus but instead finds avenues of complementarity
(Robinson & Wallington 2012). Boundary organizations establish frequent
communication between knowledge groups as a norm, helping to maintain respect and
trust (Kearney et al. 2007). This was documented during collaborative research
characterizing the Texas oyster fishery, where scientists and fishers borrowed language
from one another, in essence creating their own boundary organization. This trust
between parties lent legitimacy to both types of knowledge and was successfully used to

41
lobby for a new type of stock assessment, even against one of the scientist’s former
students (Weeks 1995). Boundary spanners are critical in integrating contributed
expertise and connecting information to potential solutions; they have interactional
expertise displayed through knowledge management and facilitation (Johnson 2011). As
part of the investigation of different ways of knowing water quality, this study will
document the perspectives of and linkages formed by boundary spanners.
Boundary spanners can also initiate and facilitate cooperation between
knowledge groups that have a history of conflict. This has proven particularly important
in fisheries management, where two information-rich groups (scientists and fishers)
often need boundary spanners to bridge conflict rooted in a history of distrust (Johnson
2010). Though fisheries conflicts are complex, the distrust in some cases stems from the
one-way flow of information from fishers to scientists, information that is then used to
shut down fisheries, for example when the information reveals a struggling stock
(Johnson 2010). A pattern of similar management decisions in some places has
established a culture of secrecy between fishers and scientists to stop the flow of
information since it has often proven detrimental to fishery access (Neis et al. 1999). The
history of conflict between fishers and the scientific community means that fishers may
not have their perspective represented well in management, sometimes as a result of
their own decision to ‘opt-out’ of management processes (May 2012). Although this
research is not specifically about fisheries, relations among fishers, scientists, and

42
policymakers remain important because many fishers perceive declining water quality
as a major factor in fisheries decline and resent a lack of attention to water quality by
fisheries scientists and managers. Thus fishers may distrust water quality scientists and
policymakers via their association to professions and institutions they distrust.
However, as in the Texas oyster case, scientist and fisher knowledge of the ecosystem is
complementary and alliances can form over trusted information (Weeks 1995) and
Johnson (2010) found water quality was one area where fishers and scientists could
collaborate. Therefore, in this case, boundary spanners are expected to play an especially
important role in showing and utilizing that complementarity.
2.1.4 The case of Albemarle-Pamlico Water Quality: From federal legislation to local eyes
The Clean Water Act of 1972 (CWA) serves as the national legislation guiding
water quality management, delegated to multi-scalar implementation by the
Environmental Protection Agency, state agencies, and municipal governments. The
CWA provides two definitions of water quality. The first focuses on use values: “the
State must take into consideration the use and value of water for public water supplies,
protection and propagation of fish, shellfish and wildlife, recreation in and on the water,
agricultural, industrial, and other purposes including navigation” (131.10), commonly
referred to as the ‘fishable, swimmable clause’. A contrasting definition is found in the
first sentence of the CWA: “the objective of this Act is to restore and maintain the
chemical, physical, and biological integrity of the Nation’s waters”.

43
Thought the Clean Water Act contains two definitions of water quality, it is
implemented by the use of “best available science” and enforced by “best available
control technology” that adheres to the chemical parameter definition. The general
guidance Act is translated into criteria pollutants with thresholds tied to legal and
financial penalties. Among other criticisms, scientists critique this list of criteria
pollutants as far from comprehensive and highlight that chemical interactions are not
incorporated (Hinton 1998). A politically negotiated process, often involving
Congressional hearings, decides not only which chemicals are listed but what quantity is
cause for action. Toxicological dose-response studies and other biomedical research are
knowledge types required for the negotiation resulting in criteria listing, even if other
knowledge documents impacts not apparent in these tests (Hotchkiss et al. 2008).
Therefore the CWA as currently implemented restricts research attention and restoration
action to a certain set of indicators defined by those who have won the political tug-of-
war to determine criteria pollutants (Ringquist 1995; Keller & Cavallaro 2008). This
situation provides a good opening to investigate how other perspectives might offer a
more complete understanding of the problem and additional options to address it.
The coastal plain of North Carolina serves as a national example and regulatory
experiment region beginning with textile and agricultural chemical industries
throughout the watershed (West 1992) and continuing with nonpoint source pollution
and Pfisteria in the Neuse River (Burkholder et al. 1992). The US Geological Survey

44
coordinates most water quality information gathering through cooperative
arrangements with state scientific agencies; they prioritize sedimentation, nutrient
runoff, nuisance algae and hypoxia, and fecal coliform bacteria based on impaired uses
(Bales et al. 2003). Recent emerging water quality concerns such as pharmaceuticals,
mercury from atmospheric deposition, and carbon dioxide-linked acidification appeared
on NC’s Environmental Management Commission’s water quality committee agenda,
but decisions on what to do about such concerns have been deferred until more
information can be presented.
Water quality priorities in North Carolina are summed up in the Department of
Water Quality motto “we all live downstream”. The natural resources and ecosystem
services provided by estuaries serve as the canary in the coal mine for water issues
throughout the state, as estuarine indicators integrate the whole watershed (West &
Garrity-Blake 2003). In 1987, the administrator of EPA deemed the Albemarle-Pamlico
estuary system of national significance in recognition of its importance ecologically,
culturally, and economically; this declaration creates a multidisciplinary dimension to
these indicators. The estuarine focus also prioritizes coastal resident concerns in state
water management decisions. This study follows the state’s lead, focusing on how
downstream users experience water quality.
Clean Water Act enforcement is largely delegated to the state’s Department of
Environmental and Natural Resources, which embodies several agencies and their

45
rulemaking commissions tasked with different aspects of clean water: Environmental
Management Commission, Division of Marine Fisheries and the Marine Fisheries
Commission, Division of Water Quality, Division of Air Quality, Clean Water
Management Trust Fund, the Ecosystem Enhancement Program, the Division of
Pollution Prevention and Environmental Assistance, the Wildlife Resources Commission
, the Division of Water Resources, the Division of Coastal Management and the Coastal
Resource Commission. These interact with other related state health agencies (the
Department of Health and Human Services) as well as federal and local agencies (see
Fig. 2). Clean water on the coast is mostly enforced through two guiding pieces of
legislation: coastal storm water regulations and the Coastal Habitat Protection Plan. The
process for creating both required public comment on proposed rules and both were
controversial when they were first proposed (Deaton, CHPP Steering Committee, pers.
comm).
Previously confusing and sometimes contradictory storm water rules were
recently combined into the Universal Storm Water Program (USWP) for coastal counties
(http://portal.ncdenr.org/web/wq/ws/su/usmp). The USWP consists of design standards
for both coastal and inland counties paired with setback requirements providing natural
buffers along coastal waterways. These rules are meant to be incorporated into required
municipal plans and maintain chemical standards for existing state designated

46
Outstanding Resource Waters and High Quality Waters as well as Clean Water Act
requirements.
The Coastal Habitat Protection Plan (CHPP) sets forth a detailed plan for coastal
area management, including its fourth goal to “enhance and protect water quality”. The
CHPP executive summary states “the greatest single threat to North Carolina’s coastal
fish habitats is probably storm water runoff”, which incorporates the priority areas of
development, large-scale agriculture, and wastewater treatment (Michael W Street et al.
2005). In the public comment period, citizens overwhelmingly thought the most
important step forward overall is to enforce existing rules protecting water quality and
habitat (Miller 2005). In action 1.2, the CHPP calls for coordinated and enhanced
monitoring statewide. Currently, monitoring efforts are grant-funded and run by
universities (with the exception of fecal coliform monitoring by Shellfish Sanitation, part
of the Division of Marine Fisheries), so coverage is patchy and inconsistent over time,
creating information gaps. Lack of information is a potential problem emerging from the
disconnection between users and management institutions (Anderies et al. 2004) and
continues through positive feedback to inhibit further management initiatives.
Incorporating user knowledge may provide the needed information for management to
move forward. Fishers are one user group who are regularly on the water, have
experiential knowledge of water quality issues, and who would benefit from more

47
effective water quality management; therefore, fishers potentially can help fill in those
information gaps – a fact that provides much of the motivation for this study overall.
Figure 3: Sketch of agencies involved in water quality management. Arrows
indicate authority; rules are made at the higher level and implemented by the agency
at the end of the arrow. Each box is an independent set of agencies at either the
federal, state, or local level. NCDENR is depicted above its various divisions and
commissions as an organizational (not rulemaking) authority.
2.2 Methods
This study focuses on three major coastal stakeholder groups with different
knowledge types related to the estuarine water system: fishers, scientists, and

48
policymakers. Fishers represent experiential knowledge gained through long careers.
Scientists represent academic knowledge, gained through formal science education in
university (often not in North Carolina), and applied now in water quality research
programs in North Carolina’s estuaries according to formal ecological theories.
Policymakers represent a blended way of knowing created through their role as
knowledge aggregators (Robbins 2006); they aggregate scientific information, public
opinion, and whatever else is presented to them.
While individuals may cross boundaries between knowledge groups, past
studies show this same delineation useful for investigating knowledge in marine
systems (Weeks 1995). I categorized people crossing groups as boundary spanners but
asked them to categorize themselves by how they normally think about the system (e.g.
a scientist raised in a fishing family still considers himself primarily a fishing-knowledge
holder). I documented the concept of water quality as perceived and constructed by
these stakeholders through an ethnographic approach consisting primarily of semi-
structured interviews paired with participant observation and photography; these were
analyzed using grounded theory (Charmaz et al. 2000).
Semi-structured interviews directed people to discuss two broad themes: how
they ‘know’ water quality generally, and local specifics covering both science and policy
(see Appendix A for interview guides). Informants were selected from existing contacts
with fishers, scientists and policymakers followed by snowball sampling until saturation

49
was reached. Saturation is defined as the point at which no further new information and
insights emerge from interviews (M. Q. Patton 2002), for this research, after a total of 82
knowledge holders were interviewed (see Table 1). While seeking saturation, I ensured
that within each group, interviewees represented the diverse institutions involved in
water quality research and policymaking, with at least one informant from each (see
Appendix B). Scientists and policymakers were included in the sample population if
they had water quality in their lab or agency mission statement. For fishers, diversity
was represented through different gear types (e.g. shrimp drawler, crab potter, gillnets,
etc.) and home port. Interviews were recorded and transcribed for analysis.
Table 1: Numbers of respondents from each knowledge group, for a total of 82.
The “knowledge type” column categorizes respondents according to their current
roles, and include boundary spanners, i.e. individuals who serve career or advisory
roles in more than one category. “Primary knowledge” shows how people self-
identified their primary knowledge base. No one fell in all three categories.
Knowledge
type
categorization
by author,
according to
current roles
Primary
knowledge
identification
by
respondent
Fisher 28 40
Scientist 15 19
Policymaker 7 23
Fisher-scientist 7 N/A
Scientist-Policymaker 19 N/A
Fisher-Policymaker 6 N/A

50
Participant observation aided in characterizing personal constructions of water
quality by providing the opportunity to observe how the informants experience the
estuarine system, i.e. to see the context in which the knowledge is embedded. I spent at
least 6 days in each learning environment: working in water quality research labs, going
on commercial fishing trips, and attending open legislative forums1. During this time, I
documented my observations and a description of context in a research journal and
notes were later paired with interview data for analysis where applicable. Some
interviewees provided photographs of good or bad water quality and specific cases
mentioned in the interview. These photographs visually documented discussed
concepts, providing internal validation of data provided through spoken narrative. I
coded both participant observation notes and photographs with the matching interviews
as a case in NVIVO 10 for analysis.
All interviews, documents, photographs, and journal entries from participant
observation were coded in NVIVO based on grounded theory, or allowing themes to
emerge from the data without a priori structure (Charmaz et al. 2000). Code trees that
1 I worked in the following water quality lab contexts: disaster response after a fly ash spill, determining
biological indicators for stream health, performing histology on test fish dosed with environmentally
relevant estrogen levels, collecting fecal coliform bacteria samples after a rainstorm, making exposure maps
for proposed industrial development, and collecting plankton samples through an environmental gradient. I
went on the following types of commercial fishing trips: blue crab potting, shrimp trawling, clamming,
oyster tonging, gillnetting, and pole-catching tuna. I attended public policy meetings for the following:
Environmental Management Commission Water Quality Committee, Carteret Crossroads annual meeting,
Division of Marine Fisheries public comment period for proposed rules (Beaufort), Marine Fisheries
Commission Water Quality Committee, General Assembly Hearing on proposed industrial development,
and General Assembly hearing on reclassifying stream uses.

51
emerged were (in alphabetical order) bettering regulations, changes over time, current
water quality problems, future research questions, good or bad water quality,
knowledge types, local food, opinion on regulations, process, responsibility, scale,
specific definition, and water quality indicator. These themes were compared by
knowledge type to explore differences by groups.
Results from the analysis of interviews are sometimes presented by summary
table to show the extent to which particular groups identified particular answers (e.g.
see Fig. 3). This is a qualitative study that uses non-random sampling thus quantified
responses should not be read as an effort to definitively characterize particular points of
view. Instead, the quantification illustrates some of the differences and similarities
observed in this study and explanatory and representative quotes for each of these
topics is highlighted in the results to explore what these difference and similarities
might mean. Results from participant observation are presented first to describe the
context in which knowledge of water quality is embedded (as a composite of my various
experiences), followed by interview results that explore this knowledge in detail.
2.3 Results
2.3.1 Life through the eyes of others – experiencing water quality in three ways
Fishers in North Carolina live in the coastal plain, where it is difficult to tell
where the land ends and water begins. The boats are small 21-42 foot skiffs with draft

52
shallow enough to travel through the estuaries in search of the daily catch. Most of the
boats, docks, fish houses, and homes have passed through generations to the current
fisher (Garrity-Blake & Nash 2007). These fishers are almost a slice of history, having
learned their craft from their father or grandfather and many practicing their trade for
the last 40 or 50 years (Mirabilio 2005). I meet three of them on the dock just before
dawn, a father, son, and apprentice getting ready for a day’s work, with the son and
apprentice loading bait fish, gear, and snacks. The team evaluates the color of the sky,
the strength of the wind, and the color of the water, making predictions for the day’s
catch. Based on what’s in season and information gleaned from the constant phone calls
from neighboring fishers, the team decides what to go after and where to go. As we
head out to the fishing grounds of the day, the father points out what changes in the
landscape have happened over his career and which fishing grounds used to be fruitful
but no longer are. They tell stories of air force practice bombings, failed oyster plantings,
successful seagrass restoration, the influx of people “from off” building houses on the
waterfront, and other local changes. Once the fishing begins, they evaluate the catch pot
by pot or net by net in quantity and quality, logging each location and notes in a well-
loved notebook. The fishers tell me the best species to look at to determine water quality
is the blue crab, Callinectus sapidus, which accumulates hitchhiking barnacles in poor
water quality and turns color based on the chemistry of the water. In particularly stark

53
cases of hypoxia2 or “bad water” the fishers pull up pot after pot of deceased crabs. After
a few curses, the fishers pull the pots up to move to shallower areas of the estuary free
from the depth-hugging hypoxic zone.
Scientists’ knowledge is less place-based and experiential than that of the fishers.
They are largely trained outside of North Carolina and many work in labs away from
the coast, overseeing experiments in labs and making occasional forays to the field.
Many report they would like to “be in the field” more often, but in reality, students and
technicians do much of the labs’ fieldwork. Understanding of water quality is a team
approach, viewed through the lens of the lab’s methodologies and technical specialties
for particular species or pollutants. Though most scientists recognize the complexity of
ecological systems, they tend to (and have been trained to through graduate education)
specialize. In this case, specialties are sometimes influenced by what scientists see as the
most important or as lacking attention. A few scientists mentioned they work in North
Carolina because it is a national example of water quality research and policy, especially
with a history of very public issues like Pfisteria and hog lagoons, and therefore easily
resonate with a national agenda. These scientists experience water quality, in the end, in
lab experiments focused on the mechanism of one or two indicators such as mercury,
salinity, or hypoxia. Common species in toxicology experiments such as medaka
2 Hypoxia describes areas of low oxygen, caused by excess nutrient pollution. The low oxygen levels cause
mortality in fishery species not mobile enough to escape these areas (Eby & L. B. Crowder 2002).

54
(Orzyias), frogs (Xenopus), or mummichug (Fundulus), are grown in experimental
conditions, subjected to chemical exposure, and then dissected and chemically analyzed
to fully understand how particular pollutants might manifest in changes in the
ecosystem.
Policymakers are hardly ever in the field unless investigating a particularly high-
profile issue. They rely on their science staff and advisors to digest information.
Regardless of which of the many agencies is making a decision (see Fig.1), their public
meetings usually begin with a presentation by an invited scientist to present decision-
relevant information. Packets of published information and summaries of public
comments are also available for decision-makers. Most issues receive an hour or two of
attention but for issues with more than 10 public comments, decisions automatically
elevate to the General Assembly, which must hear the issue again and make a decision.
Decision-makers rely at least in part upon these packets and testimony to make
decisions, which are often dominated by stakeholders with direct interests in the
outcome such as industry or non-governmental organizations. During daily work,
decision-makers learn both about the general principles that apply to water quality in
estuarine systems and the specifics about the locality, including the relevant
stakeholders, but all filtered through the eyes of agency staff. Controversial issues that
move to the General Assembly floor vary widely in scale, from reclassifying a creek as a
supply for drinking water to integrating watershed and airshed management in order to

55
implement a total maximum daily load for mercury. These cases received up to 2 days of
deliberation with testimony from relevant agency staff, local scientific experts, and
citizen leaders before the Assembly members voted.
2.3.2 Perceptions of water quality: Interview data
Data presented here contributes to answering the goals of the study: to compare
stakeholder definitions of water quality and implications of diverse ways of knowing in
research and management. Themes, as denoted by subheading, emerged from interview
data during analysis using grounded theory.
2.3.2.1 Naming: Definition of water quality
When asked how they define water quality, two types of definitions quickly
emerged: one focused on use values associated with coastal water and one focusing on
chemical measurements of contaminants. As described previously, both these
definitions are embedded in the Clean Water Act, and respondents recognized this. Use
values were summarized by one of the fishers, with water quality defined as “healthy
water conducive for natural life and living, [for] healthy living creatures”. Chemical
indicators were summarized in the words of one policymaker, “we’re interested in
knowing about what’s the physical, chemical, biological condition of the water because
they have to meet certain conditions”.

56
Of the 56 people that gave a definition, 45% responded with the use value
definition and 41% took the chemical measurement approach. The remaining 14% of
people used a less common definition or didn’t directly answer (Table 2). The divide did
not fall clearly across the different knowledge holder groups – although more fishers
utilized the use value definition, and more policymakers the chemical, all groups
recognize both definitions and scientists essentially split between the two. Six
individuals used both definitions and 5 of these were boundary spanners (Table 3).
Boundary spanners recognized that there are different versions in existence, but did not
stray from their primary group’s tendencies. One scientist-policymaker who self-
identified as a science knowledge holder stated “if you say water quality, it’s quite often
referred to as ‘is it drinkable and swimmable?’ And for most people that’s the bottom
line – if it’s drinkable and swimmable, they feel it’s pretty good. And so as a scientist, I
go a lot deeper in terms of does it meet standards, does it meet the criteria set by EPA
and the state for individual ions and pollutants and so forth”.

57
Table 2: Different perspectives on water quality by primary way of knowing.
Totals do not add the up to the total n=82 or the same for each question because
people chose not to answer some questions. Halves are created by people stating two
answers.
Fisher Scientist Policymaker Total
Definition
(naming)
Use values 9.5 8 7.5 25
Chemical
indicator
2.5 6 14.5 23
Other/deflected 5 3 0 8
Water
quality
condition
(framing)
Good 15 5 8 28
Bad 8 5 6 19
Increasing 5 9 11 25
Decreasing 10 9 5 24
Who is
responsible?
(blaming)
Government
responsible
5 6 10 21
Individuals
responsible
6 6 6.5 18.5
Scientists
responsible
1 1 0.5 2.5
How do you
feel about
regulations?
Adequate 4 7 15 26
Not adequate 12 7 3 22
Table 3: Boundary-spanner answers to ‘what is water quality’?
Use value Chemical
indicator
Both
Boundary-spanner 8 12 5
Not boundary-
spanner
17 11 1
The boundary spanner quote recognizes that depending on the definition of
water quality, different indicators are used for evaluation. While this is not necessarily

58
negative, these indicators may lead to different conclusions. Those using the use-value
definition of water quality look for ecosystem service indicators like “we’ve got plenty
of grass and everything, plenty of fish” (fisher). One policymaker critical of current
indicators advocated for “[ecological] performance-based” permits instead of patchy
chemistry-based regulations that overlook non-organic compounds. Others described
how the state closes shellfish beds based on fecal coliform bacteria counts, but other
potential pollutants such as mercury aren’t measured under state management. These
regulations are based on the policymaker understanding of water quality as a suite of
chemical parameters that can be measured and classified using certain indicators. As
long as those indicators are met, in this case by low organics and bacteria counts, the
water is classified as clean even if not performing to the desired standards of other
definitions. For example, shellfish in waters designated “outstanding resource waters”
by the state may be inedible because of high mercury or arsenic. One policymaker
suggested using community sustainability or economic indicators, stating a case of
“those old communities couldn’t survive anymore, the catches were going down so
far… the majority of [the cause] was water quality impacts and loss of some important
habitats, the seagrass”; he maintained the decline of fisheries should have indicated the
need for remediation while chemical indicators did not.
59
2.3.2.2 Framing: Water quality status
Respondents were divided on whether the water quality was good (60%) or bad
(40%), independent of their knowledge group, though almost twice as many fishers
described it as ‘good’ versus ‘bad’ (Fig. 3). Some respondents made their assessments
while acknowledging the absence of current water quality criteria data for the estuaries.
One policymaker stated “I have to put a caveat on that; I really don’t know because as I
mentioned there isn’t monitoring for the sounds in particular; that the ability to make a
real good statement about that, to say water quality is such, then the information’s not
there”. Despite the lack of data, people answered from personal experiences or relative
to other places in the country, especially the ecologically similar Chesapeake Bay. In one
fisher’s eyes, North Carolina is “largely undeveloped relative to the Chesapeake Bay and
that is wonderful. Not to say we don’t have water quality problems, but we can see the
direct difference in terms of the lack of people and water quality”.
Rating water quality is also influenced by a perceived nature/culture divide. The
photos that people provided “of good or bad water quality” included many more
examples of bad water quality or water quality practices than good. For example, photos
highlighted armored shorelines, sewage effluents, and “closed shellfish bed” signs.
These photographic examples of bad water quality were always linked to anthropogenic
activities. However, respondents revealed during interviews that hurricanes also caused
water quality impacts but were not considered ‘bad’ water quality because they are

60
controlled “by Mother Nature”. According to one fisher, water quality is “wonderful
except for the hurricanes. When the hurricanes come through, all the shit upstate comes
down to us”. His quote is representative of the contradiction in conceptually dividing
nature and culture – the impacts from hurricanes on water quality are primarily from
associated storm water runoff, which respondents identified as one of the main water
quality concerns in the state.
All knowledge groups were divided on whether water quality is improving
(51%) or declining (49%) (Table 2). Many people focused their answer on particular
chemicals or time periods. For example, older respondents focused on the drastic shift in
water quality observed after legislation like the Clean Water Act emerged from the
environmental movement in the 1970’s. As one policymaker remembered “the Chowan
River in the ‘70’s and ‘80’s was green with algae and it’s not anymore. It’s a beautiful
river. The phosphate ban was put in place in the state has helped water quality
tremendously”. Other rivers are storied to have run red, green, or blue depending on
what color the textile mills were using that day. The presence of laws and enforcement
supported optimism about water quality remediation – even within the agencies
responsible: “[in] this job, we’re looking for the unpolluted water[s] and trying to protect
them. So I think because of that, I kind of come down a little bit more on the optimistic
side”. However, the optimism only referred to whether water quality was improving –

61
people did not necessarily match their attitude on trajectory with a particular water
quality rating.
When asked to name top water quality issues, respondents listed a wide array of
concerns (mostly unrelated to knowledge group), which partially reflects the openness
of the concept of water quality (Table 4). Many people asked for spatial or temporal
clarification before they answered, i.e. they wanted to discuss particular problems at
particular times and places. Regardless, storm water was the most often mentioned issue
(by 38% of respondents), and also frequently named as “the top” or “the one” issue.
Storm water runoff, however, can encompass the next bundle of problems – agricultural
runoff (32%) and runoff from development (27%), sediment and turbidity (18%), and
bacterial contamination (17%). In the coastal plain, storm water is the primary vehicle
that moves chemicals, contaminants, sediment, and bacteria associated with land based
activities into coastal water, so they are all part of the same problem. Most people
provided a rationale for identifying particular issues. For example, one policymaker
prioritizing emerging contaminants said “most of the work in this state has gone toward
sediment control. Sediments are the number one pollutant, but what about all that other
stuff?” He then listed less understood pollutants as his top priorities. A few people
interpreted “issues” more broadly – including the economics and politics of regulation
and enforcement. This broader interpretation came mostly from the policymakers who
tended to emphasize regulatory feasibility when explaining their ranking of concerns.

62
As one policymaker said, “so I would say that one [nutrient pollution] would be the
number one because we can control the others, we can’t control that one”.
Table 4: The perceived most important current issues in water quality
management. Only the topics with more than 5 people mentioning them are listed.
All 82 respondents answered this question with between one and three issues.
Issue Total
Respondents
Fisher Scientist Policymaker
Stormwater incl.
hurricanes
31 11 9 11
Agricultural runoff 26 10 9 7
Runoff from development 22 14 3 5
Sediment/turbidity 15 5 3 7
Bacteria 14 4 5 5
Industry/mercury 12 2 8 2
Hypoxia or ‘dead water’ 8 4 2 2
Salinity changes 7 5 2 1
Politics 7 1 5 1
Boat maintenance 7 2 4 1
Septic systems and sewage 7 4 2 1
2.3.2.3 Blaming: Assigning responsibility
Three main groups were identified as holding responsibility for ensuring or
restoring water quality: individuals (50%), government (44%), and to a lesser degree,
scientists (6%) (Table 2). Many respondents viewed these groups as interlinked through
the hierarchy of political representation and information sharing, but pinned ultimate
responsibility on one particular group. Some people explicitly recognized feasibility of
management when deciding who was responsible for protecting or restoring water
quality. One policymaker recognized the “state of NC has policies that were established

63
by the General Assembly and one of the policies is to maintain, protect, enhance water
quality across the state” but placed blame for failure to do so with “everybody. We live
here, we use it, we have a responsibility for it. Do we all do what we’re supposed to do?
No. A lot of us don’t know what to do, but we’re all responsible”. A fisher expanded
that to include inland residents: “everyone should be responsible for protecting it…
whether they live off the water or not, it’s important to everyone”. A policymaker
explained the logistics of this sentiment: “It’s the public and everybody because while
you got an agency or two that are charged with protecting this stuff, if the public
support for that protection doesn’t exist, you’re not going to be able to do your job,
you’re going to get your regulations blown out of the water, so if the public in general
isn’t willing…”. In reverse, government was seen as playing a critical coordinating role:
“because water quality is not one major polluter, it’s coming from thousands of sources
mainly through runoff, which is the bulk of the problem… it falls back on innovative
management to try to address it” (policymaker). In the words of another policymaker,
“the buck stops with government”. Very few interviewees identified scientists as
responsible, but those who did saw a role as information brokers, with scientists
responsible for “making sure [managers] have the best available science and also
understanding how best to communicate their needs and the resources’ needs to the
general public” (scientist).

64
One fisher recognized how the multifaceted nature of water management makes
placing responsibility difficult: “everybody that uses it – you can’t point to any agency
or anybody who’s responsible [overall]”. How people defined water quality affected
with whom they placed blame and responsibility. Those who defined water quality by
use values – the “fishable, swimmable, drinkable” – were more likely to place ultimate
responsibility with government as “stewards of the public trust” (fisher). All but 2 of the
fishers and scientists who defined water quality by chemical indicators placed blame
with individuals in the watershed and all but 4 of the fishers and scientists who defined
water quality by use values placed blame with government. However, the policymakers
who largely defined water quality by chemical indicators, were split between
individuals and government. The latter of these implicated themselves and their agency
for holding the responsibility and many were able to quote specific laws authorizing
their responsibility such as the Clean Water Act or NC’s Coastal Area Management Act,
which are locally recognized as lightly enforced.
Part of defining responsibility for water quality lies in delineating possible
responsible actors in the system. In the case of estuaries, upstream externalities redefine
who is capable of protecting water quality, introducing non-local actors: “if there’s any
water quality problems – you ever heard the old saying shit rolls down the hill?... When
they flush in Raleigh a damn turd beats us down here… you want those water quality
problems, go and talk to people up there” (fisher). The upstream/downstream

65
relationship is an example of how the question of which actors are included is
fundamentally about spatial scale and delineation of system boundaries. The spatial
scales at which research and observations take place vary from molecular to system-
wide (i.e. the Albemarle-Pamlico Estuary system) but informed mostly state-level policy
– “they implement at the state level because they have to” (policymaker). The state of
North Carolina implements water quality planning through “basinwide plans”, which
are perceived as successful. People credit them for increasing water quality: “One thing
that has helped is just the basin-wide planning type of methodology they use with
regards to going in the approach towards water quality. It makes a whole lot of sense
and I think finally, people are getting it” (policymaker). However, there is potential for
scalar mismatch between knowledge and action because of static policy scales at the
state level.
None of the scales discussed are static, however, and people expressed interest
and need to shift scales for a different view of the same problem or investigate cross-
scale linkages. In the words of one scientist, “you can’t just look at all the chemical
reactions and get all the reaction rates at a reasonable time-frame… I think we need
more faculty working at the watershed scale, both on the natural and the social sciences
and the combined water resource systems”. But scaling up creates logistical problems –
“the problem the state has and they’ll freely admit it is that they don’t have time to look
at the data” (scientist). The current scale delineations by the state - basins, roughly based

66
on watershed hydrology – is also complicated by the specifics of each case, a point most
often mentioned by policymakers charged with implementing plans at the basin scale.
One policymaker questioned “when the streams – they flow to the ocean, they don’t
flow to a river – which basin do you want to put it in?” Coastal hydrology is tidally
dependent, in constant flux, and often unclear. Different agencies also have jurisdiction
over freshwater and saltwater – often leaving the brackish estuaries without leadership.
New technologies also question existing boundaries. For example, remote sensing makes
large-scale management easier and new forms of monitoring have identified
atmospheric deposition as a potentially major player in water quality. Neither science
nor policy has established means of incorporating these new types of information.
2.3.2.4 Regulating
Respondents varied in whether they thought current regulations adequately
protect water quality (Table 2). Opinions of the regulations were separate from
judgment of water quality – people did not necessarily think regulations were adequate
if water quality was good and vice versa. Policymakers mostly thought the regulations
were adequate, though many of them had directly participated in their creation. One
policymaker said “probably a lot of people who are opposed to regulation don’t stop to
think that every time they raise a glass of water to their lips, they’re protected by
regulations… they don’t consider that there are all these regulations and there’s a whole
government structure that enforces them, makes that possible”. Using this approach, the

67
mere presence of institutional structure protecting water quality makes North Carolina’s
regulations laudable compared to other places or times. In contrast, fishers thought the
regulations were far from adequate to protect their livelihoods, which they saw as
mandated by the Clean Water Act’s ‘fishable, swimmable clause’. Scientists either
agreed with this sentiment or thought the regulations were adequately written but not
enforced. Scientists and policymakers both frequently mentioned lack of funding for
enforcement and research as well as lack of political will for environmental protection as
the reason existing regulations are not manifesting in cleaner water. Fishers leaned
toward explanations of scale conflict, strong natural ecological cycles, no political input
from the public. All three groups referred to complexity as a challenge.
When asked what change in water quality management would improve water
quality, 23 possibilities emerged, many of them creative (e.g. growing ‘smart jobs’,
changing the Administrative Procedures Act, and using trespass laws to implicate
polluters). The things that received repeated attention were logistical, immediate needs:
increased buffer zones, change leaders/managers, increased monitoring, increased
funding, improved communication, improved education, depoliticized decision-making,
implemented land-use planning, loosened regulations, and decreased storm water
runoff (Table 5). Another common set of suggestion reflected the recent change (2010) of
majority in the General Assembly from coastal Democrats to urban Republicans – many
participants thought a shift back would aid enforcement of regulations, stem agency job

68
loss, and return funding for the environmental agenda. While people generally had a
difficult time quickly choosing a single change, there was a sense that low-hanging fruit
had not yet been taken. For example, increased buffer zones “would also protect them
from sea level rise and reduce a lot of expense for having to plan and disaster response”
(policymaker) while “buffers [have] to be the cheapest and easiest way to do anything
about [water quality]” (fisher).
Table 5: Frequently suggested priorities for water quality management. Only
those with more than one person supporting the action are listed. All 82 participants
answered this question, either directly or indirectly. Because there are so few people
for each suggestion, they are not separated by knowledge group.
Solution Total
number
Increase Buffer zones 6
Change leaders/managers 6
Increase monitoring 5
Increase funding 5
Improve communication 4
Improve education 4
Depoliticize decision-
making
3
Implement land-use
planning
2
Loosen regulations 2
Decrease storm water
runoff
2
2.3.2.5 Recognition of diverse ways of knowing
Most respondents commented directly on the theme of this research – different
ways of knowing – without prompting. They recognized different types of knowledges

69
relevant for water quality research and management, pointing to both benefits and
challenges this diversity presents. One fisher considers it his responsibility to share his
knowledge with the other prevalent knowledge communities; he believes part of getting
a commercial fishing permit entails the responsibility to participate in management and
biological studies in order for “fishermen to take control of their destiny” and “keep
people connected to their food source”. Yet, the blending of knowledges does not always
come easily. One fisher thought “I don’t know how much more information we need
right now”, continuing that it’s a matter of how that information is put together for
interpretation. This can lead to well-documented distrust, in this case between the
fishers and the science/government: “in a weird way science is aligned with the
government…they’re an instrument to a certain extent” (fisher).
Many comments about ways of knowing were optimistic and emphasized the
important role of boundary spanners and boundary spanning events. Boundary
spanners answered some questions twice from their different perspectives (eg “as a
scientist…”). Many looked toward their past experiences in a different knowledge
context as critical to current career success. For example, a fisher looked towards his
engineering training as a lifelong skill in information finding, no matter what type of
information he now needed. Another fisher was quick to point out “if you didn’t know
it or not we’ve got a lot of commercial fishermen that are left [who] have college
degrees”, crediting his education with his success. For water policy, “it’s very helpful to

70
understand the implementation of things when you’re moving into policy development
because you know you can develop all the policies in the world but if you don’t
understand implementation, your policies may not be implementable and you may not
be able to accomplish the goals of what you’re trying to achieve” (engineer turned
policymaker).
Despite the recognized benefits of boundary spanning, one scientist “lament[ed]
the fact that people who have the broader perspective, who get their training in one area
and are conversant in the other area are just in shorter and shorter supply”. He later
blamed these deepening disciplinary divisions for the distrust between groups. One
policymaker who facilitates boundary spanning explained
“water quality conservation takes so many different things from the law
to the science to being politically savvy to technical issues and people
tend to have their strengths and weaknesses and when you have a group
together you find that different people have different ways to
contribute… and just the creativity that it brings to the issues. Get people
to think with different perspectives in a whole different way – thinking
about things could maybe help what you’re doing register in a way you
never really thought about it”.
Another scientist explained his motivation for investing effort in creating moments of
information sharing:
“It was really an enjoyable experience to be out on the boat with those
guys, sharing information, posing questions, trying to answer them, and
so whatever we can do to put ourselves as scientists in a situation where
we’re sort of informally exchanging information like that is really

71
important….That’s sort of the essence of population ecology so it’s
interesting to get perspective from a fisherman who’s out on the water all
the time and then a fisheries manager who’s also out on the water quite a
bit, a fisheries biologist, on answers to those questions. And sometimes
they come up with things that I’ve never thought of and that’s the thing
that I enjoyed personally as a scientist is when the unexpected pops up.”
One agency scientist appreciated his opportunity to witness the different knowledges in
his new role as boundary spanner between science and policy: “sometimes it’s amazing
how just black and white words different people can read them and read different, very
different things in it and until I started this job it was just like a word is a word, has a
meaning, you look it up in the dictionary and that’s not true.” Boundary spanners and
events facilitated for knowledge blending (e.g. some agency careers or stakeholder
workshops) are perceived as having the best potential to reach the “truth”, recognizing
that each group can only see a piece of the whole. One scientist who participated in one
of these events recounted his epiphany: “the questions that seemed to me to have
answers, correct answers, came up with incredibly different sets of answers that really
did for the most part partition out by people’s perspective and experience. So yeah, I
mean the ‘truth’, that’s what that is.”
2.4 Discussion
2.4.1 Comparing water quality definitions and perceptions
Many topics that emerged from the interviews generally described people’s
perceptions and definitions of water quality. Knowledge groups shared more of these

72
topics than not: water quality status, if it was improving or decreasing, many of the top
issues, responsibility for ensuring or restoring water quality, possibilities for regulatory
improvement, and recognition of the benefits of different ways of knowing. It is worth
noting that within each of these categories, respondents were not unified in their
answers, just not easily categorized by knowledge group. Some differences did appear
between knowledge groups, especially with decisions relating to policymaking:
definition of water quality, some of the top issues, whether existing rules were adequate,
and problems with existing rules (see Fig. 3). Even with these differences, groups tended
to answer one way or the other but most answers exist within each group. First, I will
discuss aspects that relate to a shared or complementary definition before moving into a
discussion of what different ways of knowing may mean for policymaking.

73
Fisher Scientist Policy
Definition “fishable,
swimmable”
chemical, biological
properties
Biggest issues
(all)
Sewage Sediment
Hypoxia
Salinity
Stormwater
Development
Ag. runoff
Bacteria
Industry
Politics
Rules
adequate?
No Yes
Problems with
existing rules
Scale
conflict
Strong
cycles
No input
Complexity
Funding
Political
will
Education
Variances
Figure 4: Heuristic of the ways in which way of knowing changes perspective
on water quality. Only factors in which knowledge groups differed are included.
Both definitions of water quality used, “swimmable, fishable, drinkable” or by
“chemical, biological, and physical parameters”, are correct by the Clean Water Act.
While fishers tend to use the former and policymakers the latter, both definitions exist in
both groups and scientists equally use both; therefore the conceptual divide between
groups may not be as stark as commonly believed (Wilson 2003). However, use of
different definitions may arise from the need for practical implementation and
enforcement in policymaking. Because more complex models of water quality are harder
to enforce and pursue in court than checking a set of chemical indicators, policymakers
continue to use the chemical definition of water quality and potentially cause
miscommunications with other scientists (Borowski & Hare 2006) and stakeholders

74
expecting ‘good’ water quality to deliver use values. This divide, not in definition, but in
implementation through indicators, is what likely contributes to the documented divide
between science and policy (W. V Reid 2004; Roux et al. 2006) and fishers and
policymakers (May 2012).
Evaluating water quality by any metric is a difficult task, especially as in this
case, where there is no general agreement of whether water quality is good or bad,
improving or declining. People who prefaced their answers with a comparison, either to
other nearby estuaries or to past times, hinted that evaluating water quality is a task in
relativity. People define good or bad by what they have personally experienced,
recognizing that evaluating water quality depends on personal benchmarks. In addition,
whether the water quality was good or bad was independently evaluated from whether
it was increasing or decreasing, introducing another angle from which water quality
problems may be defined differently – but along lines of age more than knowledge
groups.
People who said the water quality was good tended to be older, remembering
the water before implementation of the Clean Water Act. The quality of the water “back
in the day” was almost universally agreed upon as bad, as the conditions are local
legend. Compared to these very visible and memorable water quality impacts of rivers
flowing many colors and the bright blooms of eutrophication due to overabundant
phosphorus, modern concerns seem less immediate. This could be considered a case of

75
shifting baselines, as the younger generation does not remember these historic
conditions (Ainsworth et al. 2008) and suggest ways of knowing may vary by more than
how one experiences water but also when they experience it.
Respondents had the easiest time framing water quality through tangible issues.
Not surprisingly, most people focused on the most politically and physically visible
issue of storm water. Shortly before these interviews took place (in 2011), North Carolina
put in place a contentious set of new storm water rules and storm water was also a
contentious issue locally (Campbell & Meletis 2011), so respondents may still have had
their public comments on the tip of their tongues. Other common water quality issues
mentioned also emerged during public comments for the state’s Coastal Habitat
Protection Plan, adopted in 2004 and amended in 2010 – enforcement of existing rules.
Given that people were directed to name their top three water quality concerns, these
recent public processes may have influenced their responses. However, once these top
concerns are identified, responses diversify and many reflect personal interests and
activities. This may explain why some of the top issues identified were common to all
three knowledge groups while others specific to just one.
2.4.2 Implications for management of different ways of knowing
Depending on how a problem is framed, responsibility for preventing or fixing it
can be constructed differently (Forsyth 2003). While interviewees reacted to the question
differently – some had a clear and definite answer while others had to think about it –

76
nearly everyone did place blame with a particular type of actor. Though some
respondents recognized responsibility differs depending on the spatial extent of the
problem, they did not necessarily place the responsibility with someone able to reach the
appropriate spatial scale. In this system, as noted in one of the quotes, scale is not easily
definable or drawn on the map. Ultimately, actors with knowledge are responsible for
coordinating water quality protection through a network by defining the system
boundaries. Though networks may be needed for multi-level action, bridging
organizations are necessary to facilitate information exchange (Rathwell & Peterson
2012). This responsibility is so crucial that ultimately responsibility may fall with the
information brokers. In the case of coastal North Carolina, this is ultimately the state
through its various agencies. They are responsible for incorporating information from
scientists and coordinating that information into digestible packets for smaller-scale
programs or even individuals to then act on.
Most of the interviewees who recognized both definitions of water quality and
consequent complexity in regulation were boundary spanners. These boundary
spanners are potentially important in preventing the miscommunications caused by
different stakeholders attempting to manage explicitly using different definitions of the
problem (Borowski & Hare 2006). By recognizing the different definitions of water
quality, boundary spanners can recognize the need for more than one type of indicator
to satisfy all stakeholders. As in the shellfish sanitation example and the policymaker’s

77
plea for ‘performance-based’ standards, biological or social indicators are needed in
addition to the chemical limits specified in amendments to the Clean Water Act
(Courtemanch et al. 1989). These broader perspectives on water quality could more
easily identify regulatory gaps such as the need for more diverse indicators.
Though respondents, especially policymakers and scientists, seemed satisfied
with the state’s efforts as both information broker and water quality regulator, they
thought of many of these regulations as de jure only. In this view, regulatory gaps are
secondary to enforcing existing, if inadequate, regulations. Enforcement at the state level
is understandably difficult and many have argued for the devolution of enforcement to
the regional or local levels (Osterblom et al. 2010). The data presented here echoes
results from the state’s own analysis of public comments during formulation of the
Coastal Habitat Protection Plan, which lays out guidelines for water quality as part of
habitat protection; public comments indicated no changes in regulations are needed but
enforcement should be a major priority for the future (Miller 2005).
Many of the other suggestions for better regulation perceived as easy or
“common sense” steps toward cleaner water may be logistically challenging. The most
common suggestion, increasing buffer strips, was also perceived as a simple solution
because it takes advantage of already existing legal and economic infrastructure.
Though the perception is that not all the easy measures of protecting water quality have
been taken, even these “common sense” ideas may be difficult to implement. In the case

78
of buffer strips, local environmental conditions such as topography, species
composition, and type of runoff affect the efficacy and best design of the strips (Osborne
& Kovacic 1993) and resistance by landowners to unmowed buffers prevents adoption.
These complexities are reflected in the longer, more wide-ranging list of suggested
regulatory changes involving economic and social approaches, like increased education
and implementing land-use planning.
Respondents provided thoughtful comments on both the diverse ways of
knowing on the topic of water quality as well as the implications for utilizing particular
understandings. The active boundary-spanning exhibited by some respondents was
surprising considering societal trends towards specialization especially within academia
(M. H. Graham & Dayton 2002). Uncertainty of the future of fisheries partly explains
some of the crossovers, as younger fishermen seek other types of knowledge for a
fallback career. Boundary spanning therefore offers personal benefits and incentives but
a few people directly recognized the benefit to the system as a whole – breaking through
traditionally distrustful relationships between fishers and scientists/government
employees and seeing the whole “truth” of the system.
Societal trends towards specialization limit the focus of a problem to
contemporary conditions and obscure connections to the broader ecosystem (M. H.
Graham & Dayton 2002). The increased jargon associated with specialization decreases
the ability to easily communicate across boundaries (Borowski & Hare 2006) and

79
requires larger investments in becoming a boundary spanner. The respondents who
made these investments recognized the need for bridging knowledge types in order to
see this bigger picture. Their reflections directly point to the need for multiple
perspectives to see the whole “truth” – the state of the ecosystem (Fischer 2002) - and
successfully manage that truth (Clement 2009).
2.5 Conclusions
While there were differences between knowledge groups, age groups, and along
personal interests in how water quality is defined and conceptualized, there were also
many areas of overlap and complementarity, following findings by Wilson (2003).
Perhaps the most important difference was caused by feasibility in water quality
management. Since the definition of water quality influences which indicators are used
to evaluate water quality, operationalizing a single perspective may leave loopholes in
water quality criteria. If a water body meets the criteria for a particular suite of
indicators (Borowski & Hare 2006) or in a particular place (Ruhl et al. 2010), it may be
declared high quality but still ignores negative ecological impacts. These impacts arise
from scalar effects (Buizer et al. 2011) and complex interactions between criteria
indicators (Bunch et al. 2011), but are often missed when a comprehensive view is not
utilized.
The application of these findings is overcoming the disconnect between policy
implementation (not necessarily the policymakers or the policies themselves) and on-

80
the-ground knowledge. For example, finding a way to recognize and remediate impacts
in aquatic areas that are identified as clean while not providing needed ecosystem
services. This study and others (Johnson 2010) suggest that one way to help may be
through boundary spanners, which fundamentally improve communication between
stakeholder groups and increase trust critical for moving forward with management.
Indicators need to address the perspectives of all stakeholders in the system and
boundary spanners need to be supported both financially and culturally to advocate for
these diverse indicators (e.g. seagrass abundance and fishery stock). This conclusion
contradicts the tendency for water quality to be relegated to engineers and chemists as a
problem to be fixed by technocratic means (Swyngedouw 2004). Instead, such a
multifaceted problem needs multifaceted solutions.

81
3. Collaboratively Studying Contaminants
3.1 The Geography of Mercury and PCBs in North Carolina’s Local Seafood
This paper is published in Marine Pollution Bulletin, May 2012 with co-authors Nari Sohn,
Mark Hooper, and Daniel Rittschof
3.1.1 Introduction
3.1.1.1 Seafood Safety Recommendations
Seafood safety recommendations by both the federal government and non-
governmental organizations (NGOs) for commercial fisheries occur at a national scale.
EPA and FDA recommendations are based on data sets collected from monitoring
programs all around the country; the recommendation whether or not to eat seafood is
based on a national average for contaminants (EPA 2009). Currently EPA
recommendations instruct pregnant women to avoid tilefish, shark, king mackerel, and
swordfish (http://www.epa.gov/mercury/advisories.htm), and any other seafood that
crosses the threshold of concern of 0.3 mg/kg of mercury or 50 µg/kg of PCBs. Though
based on the same data set, EPA and FDA recommendations often do not match because
of different thresholds of concern.
Information on the toxicity of seafood is also communicated by seafood pocket
guides issued by NGOs including the Monterey Bay Aquarium and Food and Water
Watch. Aiming to protect consumer health through education, these guides flag seafood

82
types with high levels of mercury and PCBs as health concerns regardless of their stock
status or fishing methods. At the start of this research (summer 2009), these cards listed
two of North Carolina’s largest commercial fisheries - blue crabs and oysters - as having
unsafe levels of both mercury and PCBs (above 0.3 mg/kg mercury or 12 µg/kg PCBs for
Food and Water Watch). These cards were based upon data from EPA and individual
research reports gathered by Environmental Defense that had few sampling sites within
North Carolina estuaries (Fitzgerald, pers. comm).
NGO pocket guides have been criticized for lack of attention to “traceability”
back to the origin of the seafood (Jacquet & Pauly 2007). In addition, the guides
emphasize single-species traits while wider ecosystem concerns are not addressed
(Jacquet & Pauly 2007). Environmental toxins are indicated on the cards but are not
factored into overall ranking. The cards reflect little on the ecosystems and communities
providing the seafood. However, these guides affect consumer purchasing patterns,
causing decreased demand for foods deemed unsustainable (Roheim 2009).
Consumer awareness of seafood toxins is less clear and there is confusion by
consumers in how to respond to mercury and other contaminant data (Hicks et al. 2008).
Two-thirds of women of childbearing age were found to be unaware of local mercury
advisories (Knobeloch et al. 2005), but pregnant women have decreased their
consumption of all fish, not just those in the EPA advisory (Oken et al. 2003). Some of

83
this confusion may come from the fact that the science is relatively new, conflicting, and
recommendations may differ by region.
Boundaries of both federal and NGO recommendations are based on political
jurisdictions rather than environmental variability at the watershed, water body, or
stream scale. North Carolina watersheds, such as the Albemarle-Pamlico, each contain a
large portion of the coast and are composed of smaller water bodies (sounds or river
deltas) that are each fed by multiple tributaries. Recent marketing efforts from fishermen
in conjunction with the growing local food movement also function at these smaller
scales. Fresh seafood is often marketed by county. Fishers participating in these
programs were concerned that the national recommendations may not apply to their
catch (Mosher, NCSG, pers. comm).
3.1.1.2 Why Mercury and PCBs?
Mercury and PCB levels represent a direct link between source and exposure that
simplifies risk assessment for consumption recommendations. Mercury and PCBs often
co-occur (Pál Weihe et al. 1996), compounding toxicity and complicating measures of
human health effects. (Grandjean et al. 2001). In Faroe Islanders, daily average mercury
consumption by mothers of 36 µg and PCB consumption of 200 µg led to neurological
defects in children, mediated primarily by a PCB-induced decline in dopamine levels
(Pál Weihe et al. 1996). Mercury impairs neurological development and causes impaired
vision, muscle impairment and lack of coordination, and ‘pins and needles’ feeling in

84
hands, feet, and mouth (EPA 2010a). PCBs are primarily carcinogens and environmental
steroids that cause immune system suppression, decreased fertility, reduced birth
weight, learning deficits, and decreased thyroid function (EPA 2010b).
Seafood safety recommendations, especially seafood cards produced by
nongovernmental organizations, focus on mercury and PCB content in edible tissue as
an indicator of overall contamination (Lazorchak et al. 2003). Mercury and PCBs are
especially important because seafood represents the sole path of exposure for most
consumers (Grandjean et al. 1995). Studies of mercury and PCBs in seafood from specific
locations focus on recreational catches, though the majority of seafood eaten comes from
commercial fisheries (Burger et al. 2005).
Though less studied, effects on wildlife or ecology may be equally or more
profound than human health impacts. Wall et al (2001) found decreased seagrass
biomass, fungal biomass, and grass shrimp fecundity in a site contaminated with
mercury and PCBs. When combined with documented shifts in trophic structure, these
ecosystem changes facilitate trophic transfer of contaminants into fishery species (Wall
et al. 2001). Sediments contaminated with a mix of toxins including PCBs decrease
macrobenthic diversity and shift trophic structure, decreasing overall productivity (S. S.
Brown et al. 2000). PCBs also cause acute damage to fauna, such as atrophied digestive
epithelium and degenerated connective tissue in oysters (Lowe et al. 1972). Mercury
causes acute mortality in wetland organisms, and residue-effect relationships are good

85
indicators of ecological damage (Zillioux et al. 1993). Mercury, PCBs, and DDT are the
most common contaminants, explaining most of the observed toxicity in the nation’s
estuaries (Kamman et al. 2005). Therefore, levels of these chemicals in small mid-trophic
level fish serve as a good indication of overall contaminant effects (Lazorchak et al.
2003).
3.1.1.3 Hypothesis
We use mercury and PCBs to inform the spatial scales of seafood consumption
advisories in NC. Given coastal North Carolina’s few point sources and primarily rural
population, contaminant levels are expected to be low compared with other inshore
fisheries. We chose softshell and hardshell crab, pink shrimp, white shrimp, clams,
oysters, mullet, and spot as study tissue types because they are relatively sedentary and
their toxin loads should reflect levels in a given location. We hypothesize that national
predictions are not reliable predictors of contaminant level in localized fisheries. Since
both mercury and PCB levels vary by water body due primarily to water chemistry and
upstream inputs (Kamman et al. 2005; Hillery et al. 1997), we expect that there will be
spatial differences between water bodies within the state.
3.1.2 Methods
3.1.2.1 Sampling and Tissue Preparation
Sampling occurred within the commercial fishing season for each species from
July 2010 – June 2011. 5 individuals of each of 8 types of edible seafood tissue were

86
collected at 5 locations in each of the 3 fishing regions of North Carolina (North, Central,
and South) for a total of 600. Edible tissue refers to meat taken from the seafood as if
prepared for cooking – fillets for the finfish, whole but shelled bodies for the bivalves
and shrimp, whole cleaned bodies for softshell crabs, and picked backfin and leg meat
for hardshell crabs. Seafood was donated or purchased from retailers who could identify
the fishing location and were therefore within the range of market sizes for each species.
Individual sampling locations identified in figure 3 represent a fisher’s trawl,
trap line, or collection site where the samples were collected as marked by GPS or
marked by hand on a printed map. Fishers were instructed to provide samples from
their usual fishing locations where they consistently have good fishing conditions. Some
fishers provided multiple species for study from the same location, depending on gear
types available. For example, shrimpers often caught blue crabs and spot in their nets
simultaneously; these were all recorded as one sampling location when the net was
pulled up. In order to test differences between larger-scale variables, other location
information was recorded. Port town, where fishers dock at the end of the day to sell or
transport their product, is an approximation of the socioeconomic community associated
with each sample location. Water body is recorded as an approximation of the
biogeographic community, referring to the larger sound or river delta from which the
sample was sourced. Both of these metrics served to investigate an intermediate scale
between individual sampling location and the state’s three designated fishery regions.
87
Samples were immediately frozen at -20⁰C. Frozen samples were later thawed
and shelled or filleted to separate the edible parts. Tissue from spot, mullet, blue crabs,
and softshell crabs were homogenized in a small electric chopper (Black & Decker
#HC306). Shrimp, clam, and oyster tissues were too small to be homogenized in the
electric chopper, so were minced with an acid-washed scalpel and homogenized by
hand. About 10 grams of each homogenized tissue was placed in a glass vial
(Fisherbrand # 03-339-26G), frozen at -80⁰C for at least an hour, and lyophilized for 48
hours. Wet:dry ratios were determined by weighing 5 – 10 of these samples of each type
of tissue before and after drying. Freeze-dried samples were ground to a fine powder
with an acid-washed 3mm diameter glass stir-rod prior to determination of mercury and
PCB levels.
3.1.2.2 Mercury
Mercury content was determined by thermal decomposition, amalgamation, and
atomic absorption spectroscopy on a Milestone DMA-80 analyzer according to EPA
method 7473 (USEPA 1998) using 0.04-0.12 g of freeze-dried and powdered sample. A
standards curve was created by adding 0, 25, 50, 100, 150, 200, and 400 ng of mercury in
the form of HgNO3 to approximately 0.1g soy flour. Certified reference standards TORT-
2 (National Research Council – Canada), DOLT-3 (National Research Council – Canada),
and soy flour with 200 ng mercury as HgNO3 were used to confirm standards curve.
Duplicate samples varied by an average of 5%.

88
3.1.2.3 PCBs
PCBs were extracted from 0.09-.12 g of freeze-dried seafood tissue by column
extraction (Lasrado et al. 2003). Columns were made from Pasteur pipets plugged with
glass wool and then layered with 0.4 mL of 60/40 silica gel/sulfuric acid followed by 0.1
mL of 70/30 silica gel/sulfuric acid, each dried overnight at 180°C. Tissue was then
placed in the column and extracted with 2 mL hexane. Eluent was then evaporated with
nitrogen gas until dry and frozen at -20⁰C until Enzyme-Linked Immunosorbent Assay
(ELISA) could be performed.
Total PCB content was determined by ELISA using kits obtained from Sdix
(Newark, DE). 100 µL of methanol and 100 µL of diluent from the kit were used to dilute
the extracts before analysis. A standard curve was created for analysis using .25ppm,
1ppm, and 5ppm standard solutions of PCBs dissolved in methanol. Samples with
concentrations exceeding the range of the standard curve were re-run using 0.3 to 0.5 g
of dry tissue. Duplicate samples varied by an average of 21%.
3.1.2.4 Lipid Determination
Lipid concentration was determined gravimetrically for a subset of the tissue
samples. 0.2 mL, or 10% by volume, of the eluent was taken before evaporation by
nitrogen and weighed on a tared aluminum weighing boat. Following a 30 minute
evaporation period, dried lipid was reweighed to calculate lipid content.

89
3.1.2.5 Estimates of Mercury and PCB Recovery
Spike-recoveries for PCBs were performed on 45 paired tissue samples, 5 to 6
samples per tissue type. 1 ng of PCBs dissolved in 200 µL methanol was added to freeze-
dried seafood tissue prior to extraction alongside paired non-spiked samples. Spike
recoveries for mercury were performed on 40 paired tissue samples, 5 per tissue type.
200 ng of mercury in the form of HgNO3 was added to freeze-dried tissue prior to
analysis. Duplicate samples for both the mercury and PCB analysis were run with each
batch of samples analyzed. Spike-recovery averaged 95% for mercury and 120% for
PCBs.
3.1.2.6 Statistics
Mercury and PCB data were normally distributed and tests of significance were
determined by one-way ANOVA followed by Tukey’s multiple comparisons test using
the R statistics package (R Foundation for Statistical Computing, Vienna, Austria 2001).
Differences were considered significant at the P=0.05 level.
3.1.3 Results
Since the motivation for this study focused on the geography at which seafood
safety recommendations can be made, we tested the significance of various spatial
scales. Individual fishing routes or shellfish locations were significantly different from
one another (p<<0.001 for both mercury and PCBs). Port town, where the fishers docked
to sell their catch at the end of each day, was also significantly different from one

90
another for mercury (p<<0.001) but not for PCBs (p=.2116). Water body, which references
the various Sounds that punctuate the North Carolina coast and a few river deltas, was
the most significantly different (p<<0.001 for mercury and p=.0055 for PCBs, see levels by
water body for each species in figures 4 and 5). Notably, the state’s three designated
fishing regions (north, central, and south) were also different from one another for
mercury (p<<0.001) but not for PCBs (p=.1909) (see fig 6). Overall the only spatial scale
that elucidated the variation in a statistically significant way for both contaminants was
water body. In addition, as shown in figure 7 and 8, mercury had higher spatial
variation overall. All but 14 samples were below the EPA recommendations for both
mercury and PCB content.

91
Figure 5: Mercury contamination by water body for each tissue type. Graphs
are ordered by increasing mercury content and bars in each graph from North to
South. Bars represent standard error and letters above the bars indicate statistical
significance. Bars with shared letters are not significantly different from one another.

92
Figure 6: PCB levels by water body for each tissue type. Graphs are ordered by
increasing mercury content and bars within each graph from North to South. The
asterisk indicates that the bar for clams in Masonboro Inlet extends to 84 µg/kg but
was truncated to have consistent axes. Bars represent standard error and letters above
the bars represent statistical significance; graphs without letters above the bars were
not statistically significant for the water body scale.

93
Figure 7: State fisheries regions. Bars represent standard error. Letters above
the bars represent statistical significance; bars sharing a letter are not significantly
different from one another.

94
Figure 8: Geographic variation in mercury content in estuarine commercial
fisheries. Darker points indicate more mercury (black over the EPA limit of 0.3
mg/kg), lighter less.

95
Figure 9: Geographic variation in PCB content in estuarine commercial
fisheries. Darker points indicate more PCBs (black above the EPA limit of 50 µg/kg),
lighter less.

96
The state averages for mercury in all tissue types ranged from 0.016 mg/kg in
pink shrimp to 0.056 mg/kg in spot, placing them far below the state and national
thresholds of concern at 0.3 mg/kg (EPA), 0.4 mg/kg (NC DHHS), or 1 mg/kg (FDA). The
tissue types were significantly different from one another (p<<0.001) (see Fig. 9).
Figure 10: State averages for mercury. Bars represent standard error and letters
above the bars indicate statistical significance; bars sharing a letter are not
significantly different. Recommendations are not within the scale of this cart: 0.3
mg/kg for EPA and EDF, 1 mg/kg for FDA.
State averages for PCBs ranged from 1.45 µg/kg in pink shrimp to 10.55 µg/kg in
spot, far below state and federal thresholds of health concerns at 50 µg/kg (EPA,
NCDHHS) or 2000 µg/kg (FDA). Like mercury, the tissue types differed significantly

97
from one another (p=.008), with wider variation both within species and within
individual sample locations (see Fig. 10). Mercury and PCB concentrations also covaried
(p=.0062), indicating that locations that are high in mercury tend to be high in PCBs and
vice versa. Mercury and PCBs also did not correlate with lipid content (see fig. 11).
Figure 11: State averages for PCBs, ordered by increasing mercury
concentration for comparison. Bars represent standard error and letters above the bars
indicate statistical significance; bars sharing a letter are not significantly different.
Recommendations are not within the scale of this chart: 12 µg/kg for EDF, 50 µg/kg
for EPA, 2000 µg/kg for FDA.

98
Figure 12: Lipid content in the tissue types, shown in the order of increasing
mercury content. Bars indicate standard error and letters above the bars indicate
statistical significance. Bars sharing a letter are not significantly different from one
another.
3.1.4 Discussion
3.1.4.1 Spatial Scale Considerations
The spatial dynamics of mercury and PCBs are different. At all spatial scales,
mercury levels differed, suggesting extremely localized movement and methylation of
mercury that could be differentiated in individual fishing locations. Levels of PCBs were
more uniform across the entire state, but still differed by water body, likely due to
upstream contributions. The differences in dynamics between mercury and PCBs

99
suggest there are many processes at work determining contaminant levels that may not
yet be fully described but that water body is the best spatial scale to identify differences.
Although mercury and PCB levels co-occur, there were sites that had high
mercury and low PCBs and vice versa. Such cases can be explained from known local
pollution events, such as the Hewlett’s Creek sewage spill. Since sewage treatment
effluent is known to be a significant source of PCBs but not mercury (Samara et al. 2006),
elevated levels of PCBs but not mercury are expected. Similarly, areas with high
mercury and low PCBs are near areas of disturbed peat land or chloralkali production,
both of which are expected to increase mercury in the surrounding environment.
Because the association of the two chemicals is uncoupled by localized sources, use of
additional indicators for seafood safety would improve assessment of overall
contamination.
Previous studies of the spatial heterogeneity of mercury contamination between
Newfoundland and New York revealed that mercury varied by water body, dependent
on water body acidity and watershed size (Kamman et al. 2005). Similar studies of lakes
in Wisconsin show that water chemistry in lakes was a stronger determinant of mercury
concentration in perch than many other commonly used variables such as trophic
position and latitude (K Greenfield et al. 2011). PCBs also tend to accumulate at higher
latitudes due to global atmospheric dynamics, but are primarily related to distance to
original source (Meijer et al. 2003) and areas of high atmospheric deposition (Dierking et

100
al. 2009). Patchy PCB distribution depends on proximity to urban development and
meteorological conditions (Hillery et al. 1997).
The developed Southern region of the state (around the city of Wilmington) had
the highest levels of both mercury and PCBs, though all regions were on average below
federal health concern thresholds. Other individually elevated samples were proximate
to historic pollution events or industrial sites upstream. Pollution collects in
downstream water bodies, settling in sediments and bioaccumulating in biota.
Therefore, our North Carolina data add to a growing body of evidence that water body
should be the spatial scale of concern due to chemical variables.
3.1.4.2 NC Seafood Is Safe to Eat
Despite low trophic-level, small body size, and relatively short life cycles (all of
which are associated with low toxin levels), blue crabs and oysters were flagged for high
toxin levels on national and regional seafood pocket guides. In North Carolina, however,
average mercury and PCB levels for these and other commercially important species
were ten times lower than the federal and state thresholds of concern. This means that at
least for oysters and blue crabs, the North Carolina catch is cleaner than the national
average. All species in the study were, on average, 10 times below the EPA thresholds
of concern and therefore represent safe food choices. The pattern of contamination
found in this study (figure 4) is likely most related to trophic position, as levels of
mercury and PCBs did not correlate to differences in lifespan or lipid content (figure 5)

101
Eastern North Carolina is largely a sparsely populated, rural area, so lower
contaminant loads than the national average are not surprising (Street et al. 2005).
Impacts from development and industry are not contributing to contaminant load as
much as in other regions of the country supplying the same seafood, though urban
development (e.g. chloralkali plants discharging mercury) in the Southern region of the
state explains higher average levels of contaminants in that region. The presence of low-
level mercury and PCB contamination is likely from diluted upstream contributions and
aerial deposition from distant sources such as coal-fired power plants; this represents no
health concern to humans in the seafood types tested but is a vector for bioaccumulation
in higher trophic level fish dependent on these estuaries for prey. Spot and mullet also
migrate offshore, serving as a trophic base and another vector for bioaccumulation.
In North Carolina, natural sources contribute to mercury load. The peat bogs that
dominate the landscape sequester mercury then release it during disturbance such as
fire or land clearing for agriculture; leaching rate is correlated to riverine dissolved
organic carbon (Zillioux et al. 1993). However, two-thirds of the ambient bioavailable
mercury is emitted from worldwide coal-fired power production, most notably in China,
which is atmospherically upwind of the United States (Lindberg et al. 2007). Global and
natural sources of mercury make contamination levels in a particular location difficult to
predict (Lindberg et al. 2007), though ultimate sources are certainly from pollution

102
elsewhere (R. D. Evans 1986). Control of mercury pollution therefore depends on
controlling distant anthropogenic sources.
Similar challenges arise when investigating PCB levels. Before the 1979 ban on
PCB production, PCBs were ubiquitous, found in almost all electronics and
transformers. Modern sources stem largely from former productions sites, disposal sites,
waste incineration (Murphy et al. 1985), and wastewater treatment plants (Samara et al.
2006). For North Carolina, a controversial landfill placed in upstream Warren County
leaches PCBs over time (Bullard 1992) into the northern region, the wastewater
treatment plant in Morehead City contributes to downstream PCB contamination, and a
spill in Hewlett’s Creek (southernmost red point, fig. 3) in the Southern region continues
to deliver PCBs into the nearby Masonboro Sound (Alphin, UNCW, pers. comm); these
cases explain the 8 of the 14 instances exceeding EPA level of concern. The other 4
exceed mercury standards, 3 of which were sourced from a peatland drainage
documented to leach mercury; there are no documented local pollution sources for the
final 3 samples exceeding EPA standards.
Human presence plays a large role in mercury and PCB contamination in
seafood even with confounding factors such as global transport and natural release.
North Carolina thus far has committed to protecting the natural shoreline through the
Coastal Habitat Protection Plan and commercial fisheries play a prominent role in state
policy, led by powerful coastal representatives in the state’s general assembly. Their

103
work likely also contributes to the lower contaminant levels found in North Carolina
than other neighboring states by favoring more environmentally-friendly development
and industrial regulation.
3.1.5 Conclusions
The low levels of mercury and PCBs in oysters and blue crabs from North
Carolina indicate that the current system of national or regional seafood
recommendations is not fine-scale enough to capture the spatial dynamics of pollution.
The seafood we tested (all short-lived, low-trophic level), with the exception of 14
samples of the total 600, is safe to eat according to both federal and non-governmental
organization recommendations. These findings parallel similar work in offshore species
in North Carolina (Petre et al. 2012) showing the state may be a more accurate level of
analysis than the region or nation. Markets, especially those specializing in local
seafood, source their seafood from a finer spatial scale and therefore advisories need to
be focused at a sub-state scale as “data that show discrepancies between local data and
the FDA data (i.e. fresh tuna) suggests that site-specific data may be required before
consumption information or advisories are prepared” (Burger et al. 2005). In this case,
national recommendations falsely identified two of North Carolina’s biggest fisheries as
contaminated and likely had a negative impact economically since consumers have been
shown to alter their purchasing based on these recommendations (Roheim 2009).

104
Seafood recommendations averaging data on the national scale (the current standard)
fail to pick up local dynamics and accurately predict the health of a given seafood.
Analysis of differences at a variety of spatial scales in this study and others
(Hillery et al. 1997; Kamman et al. 2005) indicate that water body is the appropriate scale
at which to make seafood safety recommendations. A spatially-explicit approach should
be replicated in other locations to determine if this is a national or global trend. The
physics of the water bodies in North Carolina mean that each has a different set of
riverine and terrestrial inputs and flushing rates (related to the number of inlets),
suggesting ecological rather than political boundaries should be used to create seafood
safety guides. Recommendations by water body would also make these differences more
explicit and connect consumers to the ecology of their food. For North Carolina, this is
possible through tailoring recommendations to local food marketing efforts (such as
Outer Banks Catch, Carteret Catch, and Brunswick Catch that focus on particular
counties, roughly encapsulating each water body) or to state fishery management plans
that already address each water body individually.
3.2 Collaboratively defining water quality within the hydrosocial cycle of North Carolina
3.2.1 Introduction
Water quality is a persistent problem resistant to existing modes of inquiry and
decision-making - a wicked problem (Brown et al. 2010). Such wicked problems have
105
characteristics that make them resistant to solution through top-down government
control: they are unstructured, spread over multiple overlapping subsets of problems
and policy domains, and are relentless (Weber & Khademian 2008). Water quality
problems span ecosystems, from mountains to sea and from surface water to
groundwater; they exist in a complex network of physical and social forces known as the
hydrosocial cycle (Swyngedouw 2009). These characteristics of water quality make the
issue interdisciplinary and interjurisdictional, requiring coordination and cooperation
beyond the capabilities of institutions charged with responsibility for water quality
protection and remediation.
In North Carolina, over 13 state, federal, and local agencies claim some
jurisdiction over water quality. Solutions to water quality problems thus far are partial
and incremental, requiring constant monitoring and evaluation (Street et al. 2005). The
topic of water quality recently became a political scapegoat for the effects of increased
development during negotiations over new stormwater runoff rules. Rather than
creating the watershed-scale, complex approach needed, the stormwater rules
committee bowed under political pressure to instead focus on traditional technology-
based rules aimed at improving standard indicators of water quality (Campbell &
Meletis 2011). In contrast, North Carolina simultaneously maintains structure and
funding for a broader, ecosystem-based approach through its Coastal Habitat and
Protection Plan (CHPP), that enrols most of the state’s residents in a watershed-based

106
approach to water quality research and conservation. Despite championing by state
political actors, the plan has thus far achieved only partial successes in response to
particular, measurable goals prioritized in other legislation (Deaton, CHPP Steering
Committee, pers comm).
The judicial world has established definitions of acceptable water quality, setting
political benchmarks for success. The Clean Water Act of 1973 defines clean water as
“drinkable, fishable, swimmable”. Managers and legislators then negotiate specific
quantitative targets for individual chemicals that affect desired water use. North
Carolina further classifies bodies of water for use, including high-standard “High
Quality Waters” and “Outstanding Resource Waters” based on biological, chemical, and
physical characteristics (NCDENR 2012). These definitions rely upon both use
capabilities and quantitative chemistry to evaluate water quality and frame any existing
problems.
By recognizing some human values, the judicial and legislative definitions move
away from the hydrologic cycle model of water, which was constructed devoid of
human entanglement (Linton 2008). They instead situate water in the hydrosocial cycle,
a concept that bridges the false divide between nature and society (Latour 2005) to
recognize the complex social and ecological context in which water is embedded
(Swyngedouw 2004). A healthy hydrosocial system includes additional measures of
cultural preservation, access, ecosystems services, and justice across the watershed

107
(Swyngedouw 2009). The hydrosocial cycle concept also better captures recent scientific
advances in ecology such as recognition of the Anthropocene (Crutzen 2002) and
nonequilibrium dynamics (Gunderson & Holling 2002). In order to reorganize the
hydrosocial into a more desirable form, management must imagine a more democratic
form of social organization and reconstruct the hydrosocial production (Swyngedouw
2009). These goals require tools outside of those typically used in water management,
ones that link knowledge and management democratically (Swyngedouw 2004).
Such a broader approach is beneficial to management (Page & Bakker 2005) but
requires a parallel broader approach to researching and framing associated water
quality problems. Water quality priorities historically focused on point source toxins,
forming the basis of the early environmental movement – most notably, flammable
materials in the Cuyahoga River and DDT creating silent springs (Kline 2011). Recent
water quality priorities instead focus on particular watersheds with concerns specific to
activities in that watershed. The Chesapeake Bay program, for instance, recently
declared urban runoff their greatest concern (Horton 2008; Commission 2011), while the
Mississippi basin remains focused on agricultural runoff. However, rules addressing the
original point sources remain in place, to be enforced again when needed.
In North Carolina, the CHPP outlines watershed management priorities, many of
which focus on water quality. One of the four overall goals of the CHPP is to “enhance
and protect water quality” (Street et al. 2005 p.13). This is most often implemented

108
through individual “basinwide plans” for each of the state’s river basins. State
environmental legislative priorities are also reflected in the new stormwater regulations,
which emerged initially as the first step toward meeting the CHPP water quality goal.
The CHPP highlights the need for new water quality approaches, stating “there is a need
to coordinate and enhance water quality, physical habitat, and fisheries resources
monitoring efforts”. In essence, the CHPP makes clear the need for a hydrosocial cycle
approach, moving beyond the standard chemical indicators.
Attempts at more coordinated and comprehensive water management point to
the potential of co-management, or “the sharing of power and responsibility between
the government and local resource users” (Berkes 2009). Co-management would also
begin to address Swyngedouw’s call for social reorganization. Co-management of water
resources to include the complex values and meanings attached to water is successfully
employed in a number of urban and arid regions by combining community efforts with
larger-scale planning efforts (Bakker 2008; Goodman 2000). Co-management of fisheries
has also proven successful in wide range of cases (Pomeroy 1996; Castilla & Defeo 2001;
Jentoft et al. 1998) and is credited with creating the foundations for successful watershed
co-management (Berkes 2009). Facilitators of these cases credit the legitimacy gained
through participation with why co-management is successful, though caution that it is
not a panacea for gaining legitimacy (Jentoft 2000) and warn against romanticizing
community (Bakker 2008). However, it does appear that perceived procedural justice -

109
recognition and fairness of the process - can increase community buy-in, feedback, and
therefore adaptive capacity (Cash 2006).
Despite co-management applications, water quality protection and remediation
remains a wicked problem. Co-management therefore does not go far enough in
Swyngedouw’s goals of social reorganization and reconstructing hydrosocial
production, calling attention to the need for a more direct attention to shifting power
dynamics as part of a co-production/co-management effort. As a result, learning
management strategies are increasingly incorporated into co-management schemes for
wicked problems, as “successful co-management is a knowledge partnership” (Berkes
2009). The co-production of knowledge – defined as “the collaborative process of
bringing a plurality of knowledge sources and types together to address a defined
problem and build an integrated or systems-oriented understanding of the problem” -
and participatory framing of research questions is a complementary process that enables
successful problem-solving and adaptive management (Armitage et al. 2011). For
example, in adapting to changing climate in the Canadian Arctic, the possibilities
created through including diverse ways of knowing in climate change research
triggered mechanisms of adaptation in the face of uncertainty (Armitage et al. 2011).
Creating new knowledge through facilitated social learning enhances cross-scale
linkages and can help to avoid the negative power dynamics involved in simply
blending existing knowledge during co-management forums ( Berkes 2009). Specifically,

110
co-production offers early capacity-building for all participants to create an ethic of
effective dialogue for negotiating knowledge rather than allowing the more powerful
participants to promote their knowledge above others (Berkes 2009). This research aims
to investigate the social reorganization potential of learning management through
facilitating knowledge production and synthesis in a participatory workshop setting.
Co-production of knowledge can happen between any combination of
stakeholders who learn differently (Yanow 2009), but this case looks specifically at
scientists and fishers in Carteret County, North Carolina. Scientists have scientific
knowledge, sourced from experiments largely in the western positivist tradition, meant
to generalize and ultimately uncover ‘truths’ or laws of nature (Popper 1959). Fishers
have place-based experiential knowledge sourced from everyday lived experience and
cultural received wisdom, meant to provide practical information (Berkes 2008). While
these knowledges can be complementary, especially for common interests such as good
water quality, they are often held as “two cultures” at odds (Wilson 2003).
Internationally, distrust between fishers and scientists is rooted in use of fisher
knowledge that resulted in regulatory loss of fishery access and extension of conclusions
beyond the local context in which the knowledge is rooted (Maurstad 2002).
Additionally in North Carolina, “the detailed, rooted nature of environmental
knowledge of fishers allows fishery biologists and economists in the state to discount

111
that knowledge, in whole or in part, as not based on the tried-and-true methods of
science” (Griffith 1999), therefore we need methods to overcome this dismissal.
Shifting epistemic authority through participation can manifest in alternative
governance and environmental outcomes (S. McCormick 2007). However, giving power
to the unheard voices is only part of the goal; finding scientists willing to work in
partnerships that may undermine their own expertise may be the more difficult part.
The quality of participation determines what potential benefits may arise out of
engaging in such a process. This study will examine the dynamics of a workshop
facilitated to incorporate fisher and scientific knowledge of the hydrosocial system of
coastal North Carolina. This paper focuses on three main dynamics: a) how knowledge
held by fishers and water quality scientists is integrated, b) if any innovation occurs
through a facilitated process, and c) if the workshop offers a measure of procedural
justice or the potential to shift underlying power dynamics, as needed for co-
management.
Results focus on themes as they emerged from the process, informed by many
hypotheses from the literature on other workshop cases. For example, depending on
how the process is structured, participation may merely integrate different types of
information in a common forum or, alternatively, extend to innovation through social
learning based on contributed information (Von Korff et al. 2012). In a small community
where knowledge holders regularly interact, innovation may be fostered utilizing the

112
familiarity of existing social networks (Imperial & Hennessey 1996). Finally, early
engagement by unusual combinations of stakeholders is expected to establish a common
language and trusted base of information to move forward in future endeavours
(Gopnik et al. 2012).
3.2.2 Methods
The method tested here is a two-hour facilitated workshop, created as a node of
interaction in a web of already existing relationships. Participants invited to the
workshop had all previously participated in a project investigating mercury and PCBs in
local seafood (Freitag et al. 2012). A month in advance, invitees received a postcard
invitation in the mail advertising “Thanks for helping me! There’s more…” on the front
and “We need your ideas! You are invited to a workshop to discuss water quality in the
sounds and plan research to help better protect water quality in the future. You will be
compensated $50 for your time” on the back. I followed the mail invitations with a
reminder phone call a week before the workshop.
Out of a total of 30 invitees, 11 attended the workshop – 7 fishers and 4 scientists.
Those in attendance were the most local of invitees, with no one commuting more than
20 minutes. Fishers had a lower rate of attendance (25% of those invited as opposed to
66% of invited scientists), attributed by those present to unseasonably warm weather
that night, which allowed unseasonable fishing opportunities. The ratio of fishers to

113
scientists, however, meant that small groups used in the workshop each contain a
diversity of experiences and careers.
Following the lead of other researcher/facilitators (St. Martin 2006; Fikret Berkes
2009) I used my role as researcher to facilitate the workshop using collaborative
conceptual modelling (CCM) (Newell & Proust 2009), which has been used in a variety
of systems dynamics analyses to elicit different knowledges in a common diagrammatic
language. Newell and Proust (2008) successfully used this methodology to
operationalize a critical realist3 approach to estuarine management – they found that the
diagramming process allows people with expertise in different parts of the system to
each contribute to a whole-system description and move forward with novel
management approaches based on this description. The motivation for using the CCM
method in this study is similar – to identify future research priorities for particular
components of the hydrosocial system while recognizing system dynamics as a whole.
The method asks participants to first map complexity before distilling important system
behaviour and policy levers.
The first stage of CCM is diagramming, which lasted the first hour of the
workshop. Diagramming began with each participant individually drawing a flow chart
3 Critical realist philosophy moves beyond positivist science and commonly underpins the work of
knowledge scholars. Critical realism recognizes while that there may be an observable truth of a system,
each individual sees just a portion of that truth filtered through their culture and experiences.

114
of water quality beginning with the primary causative issue in a circle in the middle of
the paper. From that circle, participants added proximately connected issues using
arrows facing either towards or away from the primary issue denoting cause or effect,
respectively. Participants were encouraged to diagram the most important factors in the
system, as a complete description is impossible (following the critical realist
perspective). Participants then blended their diagrams by finding a partner with a
different perspective – directed in this case to find someone with a different career.
These blended diagrams were then blended again in pairs of pairs. Participants created
one final blending, this time in two groups, each sharing their final creation on the
whiteboard in the room that served as a reference during discussion.
The second stage of the CCM process is priority-building (B. Newell & Proust
2009). Participants moved seamlessly into this stage, viewing it as a logical next step.
Discussion moved to the whole group, gathered in a semi-circle around the diagrams on
the board. First I asked them to identify surprises from their own diagrams and
challenges faced while blending the contributing diagrams. Discussion then moved to
the differences between the two groups. After covering these basics, participants pointed
out particular contributions that should be highlighted in the diagram(s) and serve as
the focus of future research and policy.
The final stage of this workshop differed from Newell et al (2009) in that it
focused on future research questions and implications for expanding knowledge about

115
water quality rather than direct management implications. Given knowledge co-
production’s potential role in connecting to co-management, this shift in focus allowed
further investigation as to whether co-production was occurring and if so, in what ways.
A brainstorming list on the whiteboard aided this discussion, which began as broad and
eventually highlighted particular research questions through assessed in therms of
feasibility and potential for application to policy. I offered some basic water quality
monitoring tools in order to test some of these questions, as a further purpose of the
workshop was to initiate a shared research project among fishers and scientists, through
which I could further study processes of co-production. This discussion ended with
tangible planning of a small water quality research project utilizing the offered semi-
permeable membrane devices (SPMD’s) to study pesticide contamination4.
All participants filled out an anonymous evaluation form at the end of the
workshop that asked basic evaluative questions and inquired about their learning
during the workshop process. The evaluation also provided space for additional
4 6 participants (4 fishers and 2 scientists) volunteered to implement the SPMD research to investigate
pesticide contamination leaching off a large nearby farm. Fieldwork took place 6 months after the workshop
(July/August) during a time when the farm’s operator reported regular spraying typically occurs. The
scientists informed deployment and extraction of the SPMDs, but field work including determination of
locations, occurred in pairs of me and one fisher, each of whom chose a cluster of 3 locations. A total of 30
SPMDs were deployed at 10 locations for 28 days according to manufacturer instructions. Fall storms and
one hurricane washed away 18 SPMDs; the remainder were mailed back to the manufacturer for extraction.
Chemical analysis of extracts took place at the Duke University mass spectrometry facility according to their
protocols after sample clean-up through solid phase extraction. All samples were below the detection limit
for glyphosate and lamda-cyhalothrin, the two pesticides used on the farm. These results were returned to
participants for further discussion.

116
comments, details, and examples for their answers to the questions. All participants
filled these spaces with comments. Participants also filled out basic tax forms to receive
their $50 compensation and they had the opportunity to sign up for implementing the
planned water quality project (to occur the months following the workshop). Dinner
was also provided for the workshop, as it occurred over the typical dinner time (6-8pm).
I also spoke with some of the participants after the workshop as we were cleaning up
regarding their overall impressions of the evening and some additional local water
quality details that did not make it to the full group conversation.
The results presented here focus largely on the CCM process as a means to
structure participation. These results are illustrated using comments from participants
during the workshop and supplemented by the final evaluation. Themes discussed in
the results emerged from the workshop, later fieldwork, and evaluations using
grounded theory (Charmaz et al. 2000); the meeting’s transcript, field notes, and
evaluations were coded in NVIVO for analysis.
3.3.3 Results
The individually-made diagrams drawn in round one of the collaborative
conceptual modelling revealed what participants placed at the center of their water
quality concerns for the region (the coastal Carteret County, NC). These prioritizations
revealed the variety of factors affecting coastal water quality but also showed a
prevalence of concern for storm water runoff and coastal development, which are linked

117
concepts (see table 6). These concerns were shared equally by fisher and scientist
participants, while other indicators of water quality differed between the groups:
scientists tended to include chemical indicators (nitrogen, dissolved oxygen) while
fishers included biological (algae, fish stock). The contributing factors to these priority
concerns were, for the most part, one causal link away from the main concern, e.g.
pollution was identified as a central concern caused directly by storm water runoff. Two
participants, one fisher and one scientist, focused on one issue and depicted several
steps in the causal chain, e.g. industrial forestry practices causing the need for mosquito
ditches, which exacerbates storm water runoff (the central concern). Although
participants were instructed to limit their diagrams to a handful of causal factors, most
participants exceeded this instruction. The people capable of writing quickly managed
to diagram their perception of the entire system’s water quality problems as it affected
them in daily life (Fig. 12).

118
Table 6: Primary water quality concerns as identified in the rounds of the
collaborative conceptual modeling.
Round 1 (11 diagrams by
11 individuals)
Round 2 (5 diagrams by 4
pairs and 1 group of 3)
Round 3 (2 diagrams by 2
groups of 4 and 7)
Nuisance algae Pollution/fecal coliform Development, agriculture
Population growth Nuisance algae/pollution
Algae, dissolved oxygen,
clarity
Coastal development
Stormwater runoff Sedimentation, pollution
Stormwater runoff Algae, dissolved oxygen,
clarity
Pollution, nuisance algae,
pathogens, dissolved
oxygen, turbidity, heavy
metals
Pollution
Water runoff
Waste water
Coastal development
Development
Wetland Loss

119
Figure 13: Example diagram from participant who included as much of the
hydrosocial as he could.
Moving from round 1 to round 2, the foci of the conceptual maps changed
slightly. The more general term “pollution” became more prevalent, but was always
used in combination with other factors. Participants often blended their diagrams by
incorporating all parts of the contributing diagrams rather than eliminating and

120
streamlining for the second diagram. One pair of participants used the round one
diagram from one person and added concepts from the other diagram to form their
blended diagram. The word pollution is general enough to enable such easy blending,
especially when in combination with other priorities. In addition, coastal development
and stormwater runoff, identified frequently as the primary water quality concerns in
round 1, moved to the contributing factors part of the diagram in round 2 diagrams, for
all but one group.
The final round of blending, round 3, created a group of 7 and maintained a
group of 4. Without the need to blend further diagrams, the group of 4 spent their time
revising the diagram to a more hierarchical structure, much like a decision tree or
genetic phylogeny (see figure 13). Their reasoning was “we tried to organize it” as a
means of “getting to the details of pollution”. A member of the other group commented
after presentations that “it looks like a molecular person – there are two of them. That’s
how they got those trees”. In response, the two fishers in the group responded “yeah, I
guess we’ve been impacted [by the molecular scientists]”. This vignette gives insight
into the structure of the group conversation, suggesting power dynamics or
persuasiveness favouring the scientists.
The group of 7 maintained the wheel-and-spoke structure of the previous two
rounds, listing pollution, eutrophication, pathogens, decreased dissolved oxygen,
increased turbidity, nuisance algae, and heavy metals in the middle as primary concerns

121
(see figure 14). When presenting, the group stated that “when you get to the specific of
water quality, we came up with pollution as the main thing and under pollution we
have all of these things when we drew together all these people”. These “things” were
primarily from the centre of the contributing diagrams, but there were a few added
concepts that emerged from the group’s discussion during blending (i.e. heavy metals
and pathogens). The categorization of agriculture and development as the main
contributing problems represents their re-terming of storm water runoff and became
commonly used terms in the ensuing discussion.
Figure 14: Groups 1’s blended diagram (the 4-person group). Note the tree-like
structure delineating the problem of declining water quality into the two categories of
development and agriculture.

122
Figure 15: Group 2’s blended diagram (the 7-person group). The capitalized
emphases and hanging dash are from the original. Note the circular structure and
combination of factors in the centre, declared the foremost problems for water
quality.
According to one scientist in his workshop evaluation, the workshop allowed
“sharing ideas with many friends whom I don’t see often enough”, referring to both the
other scientists and fishers in the room. The sentiment echoes the beginning of the
workshop, where participants caught up with each other as they arrived rather than
requiring a round of introductions. The participants have a history of working together,
either from collaborative fisheries research (through the NC Sea Grant Fisheries
Resource Grant program) or from serving on the state government’s advisory councils;
these relationships are in addition to the varying degrees of collaboration that occurred

123
in the mercury and PCB project that they collaborated on with me. Since water quality is
a politically active issue in the state, this meant that the discussion about water quality
captured in the workshop was not the beginning of the conversation, but a structured
middle or constructed “node” in the existing network of relationships related to the local
environment (Fikret Berkes 2009).
Presenters acknowledged different terms for the same concept, as demonstrated
in the following exchange between four participants, discussing ecosystem services:
Fisher: “liveability”
Scientist: “That used to be quality of life when I was a kid, but I’m
thinking ecosystem services in the ecology sense.”
Scientist: “That’s the decline in populations.”
Fisher: “Yeah, it’s changes in the ecosystem which is what gives you
your nuisance algae.”
Much of the discussion in the first round of blending diagrams consisted of matching
similar concepts under differing terminology. Farm runoff, for example, could be
considered as part of nonpoint source pollution. In addition to the proliferation of
general terminology, this matching was sometimes reconciled by using the scientific
terminology. In the example above, though the term “liveability” was presented as a
definition of an ecosystem service-like concept, the term ecosystem services persisted in
the larger group discussion. Since many of the fishers were already versed in scientific
language through past collaborations, this compromise may have been one of ease
rather than an indication of negotiated power.

124
Participants treated the final diagrams as a group product, and reflected that
treatment in their choice of plural pronouns such as “we did…” or “we didn’t…”. They
also collectively answered questions about their final diagram, with each group allowing
individual members to speak directly to their expertise. This acknowledgement allowed
participants to accept common knowledge and move seamlessly from individual
diagrams to a shared conception of water quality on which to prioritize research and
management efforts. Participants quickly shifted from prompted discussion of
differences between contributing diagrams and difficulties blending into parts of the
system that needed further attention. Specifically, they quoted no problems blending
diagrams, easily accommodating differences, and wanted to move on. For example,
participants rallied around the role of government in the system, and a discussion of
current management’s definition of water quality and failed attempts to remediate lost
ecosystem services. This discussion wrapped up with the conclusion: “I can answer a
question for them - reorganize state government to manage water so that you can
actually remediate it”.
As with most group dynamics, some people were more outgoing than others. At
one point in the workshop, I explicitly directed these more vociferous people to allow
others raising their hands to speak. Two of the most vociferous were scientists and two
were fishers. Dynamics of the discussion were directed in part by these active
participants, for example, by keeping certain topics active longer than others. For

125
instance, one of these emphatic participants kept mentioning nuisance algae as a recent
water quality issue that deserved attention. Because of his persistence, the topic
remained in the conversation until the very end, when the topic switched to pollution
sources. Though they sometimes dominated the conversation in ways that had to be
checked, these participants were also helpful in directing the discussion toward the
official agenda with statements like “I think this conversation is great but it’s not helping
you get to your focus”.
The discussion following the diagramming activity started with identifying
priority issues for further research and management, emphasizing particular parts of the
diagrams displayed by each group. At first, discussion centred around system-level
questions, such as how to overcome disjointed multi-agency responsibility for water
quality (“Do watershed-level management…and figure out how to do government so it
actually works”) and education for personal practices of citizens in the watershed (“a
societal issue with lack of education for everybody, lack of sharing and inability to talk
to each other”) but were abandoned as intractable or inappropriate. For example,
though education was certainly important, it was also dismissed as not being a research
question.
As discussed earlier, I facilitated the discussion with the intention of identifying
a collaborative project to address one of the priority research questions discussed. The
group, when presented with a few supplies (including semi-permeable membrane

126
devices (SPMDs) capable of measuring desired anthropogenic water contaminants)
moved to discussing particular places where local residents perceive water quality
impacts that could potentially be “measured scientifically”. These places included
drainage from a large conventional farm and sewage drainages from recent housing
developments. The group discussed the potential of a few methods, such as testing
living clams for contaminants or comparing water quality where restoration efforts have
been undertaken with that at non-restored sites, but eventually settled on using the
SPMDs. Participants wanted to investigate specific locations where water quality was
likely compromised. One of the scientists stressed the importance of salinity (which
varies geographically) in determining whether contaminants are bioavailable while
fishers stressed particular sources of contamination and their effluent sites. Since the
SPMDs aid the desired place-based and exploratory approach, they became the chosen
method.5
The final project planned reflects the two biggest water quality factors identified
in the final diagrams – agriculture and development. The group discussion over
priorities honed the emphasis on these two factors as general categories under which
5 During implementation of the SPMD project, participants decided to focus on potential agricultural
contamination because of the dominance of agriculture on the landscape and an abundance of other
indicators of coastal development impacts,. One of the pesticides in question, glyphosate, has both
agricultural and lawn applications, and was perceived by myself and the four fishers to integrate both
agricultural and development impacts. In addition, shellfish die-offs in remote stretches of the region
following spring storms shifted focus to agricultural stormwater runoff as an immediate research priority. In
order to detect the clearest chemical signal, we kayaked or drove shallow-drafted skiffs up tributaries that
drained the farm in question.

127
other concerns fell. One participant used the other group’s collective diagram to support
the conclusion of the importance of both agriculture and development: “Well, look at
your diagram, agriculture and human”.
One participant commented on the final diagrams as follows: “this isn’t rocket
science, my kid could have come up with this; this is common knowledge I mean,
they’ve known this for a long time”. Yet, the evaluations and informal discussions after
the workshop revealed participants were pleased they had participated and had learned
something, though not necessarily facts about water quality. One scientist wrote in his
evaluation that the collaborative conceptual modelling “would be a good way to get at
[the] larger issue” and a fisher wrote he liked “the education hearing from other views
and backgrounds”. Another evaluator professed appreciation for “interactivity between
groups”, reflecting post-workshop comments of surprise that fishers and scientists think
about the same concepts, just with different terminology. The sentiment behind these
kinds of evaluations helped recruit participants for carrying out the SPMD project that
extended to the field. During the SPMD project, I found fisher participants were more
confident in deciding methods than they had been during the initial mercury and PCB
project, and they often referenced decisions made at the workshop and the shared,
‘validated’ knowledge generated there. Increased confidence may also have arisen
through the extended collaboration with me and with each other. This reflects how co-

128
production is concerned not just with knowledge, but the social relations through which
knowledge is produced (Jasanoff 2004).
3.3.4 Discussion and Conclusions
The collaborative conceptual modelling (CCM) activity enabled research
planning based on a shared conception of water quality, created through the CCM
process. In order to describe this shared conception in a common language, participants
situated declining water quality in the full context of the local hydrosocial system before
setting research goals. Though more time would be helpful for the full group to plan a
research project (only 30 minutes of the 2 hour workshop were allotted to planning),
participants laid enough groundwork for a research project to take place in the following
months with myself remaining as facilitator.
There are three general findings of this workshop experiment. First, the
workshop reiterated existing hurdles in co-production of knowledge and adaptive
management related to power dynamics and the need to negotiate new information. In
this case, participants often added their diagrams together rather than negotiating
components; in cases where terminology did not match, participants made it more
general (like “pollution”). Second, the workshop wasn’t critical to producing new
information as reflected in the “my kid could have come up with this” comment.
However, perhaps most importantly, the workshop process strengthened social relations
and potentially procedural justice by placing existing knowledge on a shared space for

129
evaluation and negotiation. Therefore, the workshop succeeded on integration but not
on innovation – however, even partial success is worth pursuing in the future.
The research questions decided upon by participants took on the place-based
nature typical of local or traditional knowledge, targeting explanations of particular
local observations, not necessarily the effects of any one chemical. Yet, this process does
not entirely depart from standard scientific method (Popper 1959), as both begin with
observations; it instead supports repeated findings that all knowledge is local (Haraway
1991). For instance, instead of jumping straight to testing remediation technologies, step
one was declared finding a chemical indicator of water quality impacts from the two
main causes: agriculture and development. This shows complementarity between local
knowledge and scientific process that may be beneficial to structuring collaborative
research efforts.
Consensus between the two groups also eliminated the scepticism described in
other cases between fishers and scientists (Wilson 2003). Participants moved relatively
rapidly through the agenda: diagramming the system, identifying priorities to project
planning, and unifying around highlighted parts of the collectively diagrammed system.
Since consensus was achieved during the beginning of the research process – question
identification – results of the project are expected to be better received (Jasanoff 2004)
and better incorporated into political decision-making as a result. Early consensus also
facilitated social learning by the whole group, shifting the conversation from comparing

130
existing knowledge to co-creating new formulation that fit into both fisher and scientist
schema (Berkes 2009). One workshop with a follow-up project was not enough to
entirely flatten existing power geometries in the community since the dynamics of the
evening were structured around existing relationships, but the structured activities
allowing each person their individual diagram to defend ensured air time in the
discussion. The propensity to keep all details of contributing diagrams in the final
system diagram (making it so general and complex it offered little new information) was
a reflection of mutual respect of each other’s knowledge. This result leads to the
question of whether the twin goals of co-producing new knowledge and forming a more
egalitarian process for integration might sometimes be at odds.
The benefits of collaboration may not be revealed through the diagram blending
alone – as in this case, the final diagram does not look significantly different than the
individual diagrams. The process of blending allowed more factors to be included, but
the basic structure of indicators of decline in the middle surrounded by myriad causes
remains. The prevailing opinion that most factors affect water quality, at least slightly,
helped maintain the ‘kitchen sink’ approach of keeping all suggested variables in the
system. This consistency instead speaks to a different benefit – that of participants
placing themselves in the system, bridging the nature/society divide without explicit
direction to do so. There were many human factors included in the final diagrams,
recognized as both positive and negative forces. In addition, participants referred to

131
“us” as the causal agents. This kind of language use reflects recognition that all people
have a role in the system, not just recent amenity migrants or the industries upriver, two
groups typically blamed for water quality decline. As one participant put it, “we all have
houses”.
The workshop process not only recognized the physical role of both scientists
and fishers in the system, but placed both groups in the system as knowledge holders
with a particular perspective. When the groups asked questions of each other’s
diagrams, the answering group clearly parcelled out pieces of the diagram to group
members with direct experiences in that area. These perspectives point out, through the
displayed diagrams, that expertise resides in many parts of the system and explicitly
points out how those expertises interact. Scientists, for example, regularly measure
nitrogen content, turbidity, dissolved oxygen, and other chemical parameters of water
quality. Fishers observe different water quality indicators like fish stock status, seagrass
levels, and shifting primary producer communities. The workshop process recognized
these different kinds of expertise as legitimate and urged participants to make use of
these complementary perspectives in research design.
During SPMD placement, the project became defined more by ‘science’ as the
number of measured parameters dwindled to pesticides and visual inspection via
photography. Recovering an SPMD after the 28 day deployment, a fisher said “perfect,
that one looks really science-y”. Since the chemical indicators measured below detection

132
limits and the pool of participants already dwindled to 6 people, there is a sense among
the group that the project has reached its end. The notorious ‘negative results’
(Martínez-Abraín 2007) also mean there is little chance to present or publish the results
in the typical venues of academic journals and industry newsletters. The photographic
data alone is not enough to draw any conclusions on the health of the ecosystem without
a point of comparison, such as a time series. This transition parallels those observed in
implementing the Clean Water Act, where feasibility of enforcement and monitoring
limits the use of indicators.
The workshop process allows existing social ties to overcome the traditional
conflict between scientists and fishers and create a productive space for environmental
problem solving. In this case, the topic of water quality served as subject for which both
scientific and experiential knowledge had useful contributions to make, providing a safe
intellectual space for participants to contribute (Whatmore 2002), and reflected in
positive evaluations of the experience. The place-based focus of the discussion created a
tangible, small-scale node to begin co-management with a shared learning exercise,
suggested by Berkes (2009) as necessary for solving wicked problems.
Discussion remained focused on contributing factors to water quality without
reverting to the typical narratives of decline for each group. This suggests that whether
or not the final products of the collaborative conceptual modelling process are novel to
understanding of the system, the highest value is in solidifying existing relationships.

133
The workshop created a strengthened node in the network of people experiencing water
quality in the region, potentially leading to fruitful future collaborations, either directly
as a result of the workshop or as opportunities arise. This was made possible by the
already dense and complex social network of the small town setting; these results are
therefore not generalizable to larger communities. The agricultural and SeaGrant
extension services in each state may offer a future venue for investigating the processes
demonstrated here. They have established collaborative knowledge networks and
funding dedicated to the related mission of outreach and crossing the science/public
divide. Overall, a diversity of knowledges is an asset when addressing wicked problems
through increasing collaborative capacity in the network structured around the system.
3.3 An Ethnographic Look at Co-producing Knowledge about Water Quality
While participation is extensively discussed in both research and management to
achieve aims of social equity (Peluso et al. 1994), knowledge integration (Nadasdy 1999),
and education (Trumbull et al. 2000a), among others, few analyses take a detailed look
within a single project to look at the nuances of collaboration and the situational
circumstances that can affect participation. Yet, it is these inner project details that likely
determine if successful outcomes of collaboration are realized. In addition, knowledge
production for environmental management is as much about social relations and context
as it is about new information, especially when knowledge production is collaborative
(Lauber et al. 2011). Thus, there is value in using the detailed, descriptive methods of

134
ethnography to describe contextualized knowledge production in order to understand
the dynamics of collaborative research efforts. This purpose of this paper is to illustrate
moments during the collaborative research process where the quality of participation is
determined in order to better understand the dynamics of participation through the
course of a single research project.
3.3.1 The Project
In this paper, I take an ethnographic approach to collaborative research in water
quality management by participating in such a project. I provide in-depth description of
the many decisions made during the research process and the opportunities for success,
failure, high-quality participation, and other factors linked to those decisions. The
project started with grant-writing and therefore was structured around the institutional
practices of the granting agency, North Carolina Sea Grant’, and its Fishery Resource
Grant program (FRG). The FRG funds collaborative ideas between fishers and scientists,
and according to the authorizing legislation written by the NC General Assembly,
“every proposal shall include substantial involvement of residents of NC who are
actively involved in a fishing-related industry” and “those with technical or research
backgrounds… work[ing] as partners”. The director of Sea Grant declared the program
successful in his 15-year retrospective (Voiland 2010), calling FRG “a very special and
effective program,” and citing duplication of the program in Virginia and many applied
results as evidence

135
The project started as an idea from a crabber and a few of his friends in reaction
to Food and Water Watch’s listing of blue crabs and oysters on the 2009 “Dirty Dozen”
due to mercury and polychlorinated biphenyl (PCB) contamination. Food and Water
Watch stated that “blue crab should be avoided due to overfishing and mercury and
PCB contamination.” Concerned about his subsistence consumption of blue crab, the
crabber went to a local mercury researcher with questions. The researcher tested hair
from the crabber and his wife, and found the samples showed low levels of mercury.
This led the crabber to believe his largely crab diet was not as ‘dirty’ as Food and Water
Watch suggests.
After an email exchange with the “Dirty Dozen” authors, the crabber became
convinced that “the organization was very aggressive and heavy handed with their
seafood guide.” (email from crabber 10/26/2009) Food and Water Watch relies on data
collated by the Environmental Defense Fund from peer-reviewed studies and EPA
monitoring across the country, but with few locations in North Carolina. An EDF
representative responded to email queries: “While our advice to the general public is
that blue crabs on average have elevated PCB levels, we cannot say that is the case
specifically for NC crabs… based on lack of data” (email from EDF 10/29/2009).
Frustrated with this response, the crabber contacted a student at Duke University
Marine Lab (DUML) who was helping to start a community-supported fishery in the
area. The student brought the issue to a a DUML professor with expertise in water

136
quality and contaminants, and the crabber, student, and professor invited me to work
with them on collaborative research project. The project was designed in direct response
to the Dirty Dozen report, i.e. to look at geographic variation in mercury and
polychlorinated biphenyl (PCB) contamination of commercially important seafood
caught in North Carolina waters. We focused on 8 commercially important products at
harvestable size: softshell crab, hardshell blue crab, pink shrimp, white shrimp, clams,
oysters, mullet, and spot. The goals of the study were twofold: to identify areas in need
of remediation and to enable fishers from clean areas to market their products as
“healthy”. In essence, the tangible product that would emerge from the research was to
be a North Carolina-specific label or card like those produced by Food and Water
Watch. We wrote a proposal to the FRG program (Appendix C) along with three
additional fisher/fish house owner collaborators to ensure spatial coverage of the whole
state (one fisher representative from each of the state’s fishery districts). In addition to
the promised chemical testing and market-related outreach promised in the grant
proposal, I also decided to track the participants a bit more closely, in order to better
understand the social relations and potential negotiations behind a collaborative project
with dual academic and industry goals. This analysis was intended to reflect on goals of
the FRG program of combining different types of expertise to create industry-relevant,
scientifically-sound information. By participating in the project, I was able to observe
interactions between fishers and scientists, and between fishers and seafood safety

137
research protocols. I was also able to discuss with participants how scientific and
industry expertise interacts during the course of the research process and when
disseminating results.
To capture fisher, scientist, and my own experiences in this project, I took
detailed notes on interactions, in-the-moment reflections, and decisions made during the
research process. In addition, I conducted formal follow-up interviews during which I
communicated with all fishers who participated in data collection to discuss results once
the analysis was complete. I also organized a workshop that brought together fisher and
scientists to discuss water quality issues more generally, and to generate ideas for
further collaborative research endeavors.
Participation by fishers varied during different components of the project. After
the project was underway, we realized we needed more mercury and PCB-specific
expertise and enrolled and additional 3 scientists as project consultants, primarily to
teach us methods, help with statistical analysis, and academic publication; this brought
our total academic participants to 6. Fifty fishers, including fisher collaborators on the
ground, participated in the initial fieldwork collecting samples (described in more detail
later). Twenty-one fishers and two scientists participated in one-on-one meetings to
discuss results and their interpretation with me, and 11 participants attended the
workshop (one-on-one meeting participants were invited). Declining participation over
the course of an interest-driven, lengthy project is not surprising (Selman et al. 2010), but

138
will be discussed in more detail later. Note that by “participant”, I am sometimes
lumping family fishing operations, where multiple family members collectively
participated, but are counted as one contributor to the project.
This ethnography draws on time I spent grant writing, organizing project
logistics, collecting fish samples in the field, helping complete the analysis in a lab, and
discussing results with individuals and during the workshop (note the majority of
workshop time was spent discussing new research ideas, and is discussed in detail
elsewhere). Following a brief review of literature on participation, the rest of this paper
chronologically documents the collaborative research process and then ends with some
overall thoughts and conclusions on the process as a whole.

139
Figure 16: Sampling locations for the mercury and PCB study. Stars designate
the original 4 fisher/fish house collaborators in the city of Wilmington and towns of
Columbia, Smyrna, and Swanquarter.
3.3.1.1 Situating myself
My role in this project straddled several types of contribution and developed
over the course of the research. While I eventually came to refer to myself as a facilitator

140
(discussed in detail in concluding thoughts), I initially recruited participants by
identifying myself as a doctoral student at the Duke University Marine Lab interested in
water quality conservation and how people learn new things. While people were happy
to contribute to a student’s project, my position in the local community aligned me with
associated stereotypes of Duke scientists: temporary resident, interested in
environmental preservation over economic development or cultural preservation,
financially well-off, etc. Some of these were true, others not, and I likely never heard all
of the labels associated with my position. Through this recruitment, however, I became
the go-to information source for questions about the project or related issues, so in many
ways the project became “mine”, as I became responsible for ensuring the research
process moved forward, acquiring needed materials, scheduling meetings, fielding
questions, and handling other logistics.
3.3.2 Possible Avenues of Participation
There are many possible forms and related functions of participation, and
therefore no checklist of what to look for in describing a collaborative project or
classifying its ‘success’. Past reviews of collaborative efforts suggest a few themes that
may affect the structure of participation like dissent, negotiation, access, and
technological involvement. I will discuss each of these themes here. While this is not a
comprehensive list of factors that structure participation, they provide examples of the
types of issues that need attention in structuring collaborative projects. Additional

141
literature is embedded in the research description to provide further context when
explaining aspects of this case in particular.
The quality and degree of participation in any scientific venture differs greatly
between projects. Bonney et al (2009) classify three main types of participation:
contributory where participants primarily collect data, collaborative where participants
contribute to methodological design and data interpretation, and co-created where
participants are involved in almost every step of the scientific process from idea
generation to asking new questions that result from data. By this typology, since the idea
for our project originated in the fishing community and results were returned to the
community to generate further ideas for research, our project could already be described
as co-created. However, checking off participation at various stages of the scientific
process is a crude measure of degree of participation and does not address quality.
Critiques of participatory efforts stem from the fact that participatory efforts,
especially within science, are gaining popularity so there is the danger for people to
disingenuously join the participation movement (Cooke & Kothari 2001). Lessons from
participatory watershed management show the less flattering side of citizen
participation, where dissent is rare and thorough, active involvement (as opposed to
mere presence in the room) is difficult to cultivate (Irvin & Stansbury 2004). On this note,
just having fishers participate by donating samples and passively sitting through
interviews about results is not enough. For quality participation, they must truly spend

142
time thinking about the project and the final results must incorporate dissent and
critique. If no dissent is present, Irvin and Stansbury would say the research fell into the
same trap as their unsuccessful participatory watershed management.
Dissent is often accommodated through negotiation of methods and
interpretations. Even when collaborators generally agree, the goal of creating a shared
research result requires negotiation of perspectives formed from people with different
underlying experiences. For example, when farmers and multidisciplinary scientists
form participatory research relationships, each perspective must be investigated through
method development and represented in the final result – this is most likely achieved
through a mixed method approach ensuring active participation from each group,
through garden walkthroughs, agricultural experiments, and joint workshops for data
analysis (Pretty 1995). Only once all perspectives are investigated and represented can
what Pretty calls ‘group formation’ occur – that participants take collective ownership of
the research.
Equal access to avenues of participation also mediates the quality of
participation. While the goal of many participatory science projects is informal science
education (Mueller et al. 2012), this necessary learning that citizens engage in indicates
unequal access. While participants learn to “think scientifically”, following scientific
logic and adopting terminology (Trumbull et al. 2000b), the act of translation from
alternative/local knowledge to scientific promulgates underlying power dynamics that

143
can undermine long-term trust and continued research partnerships (Johnson 2011). This
translation occurred particularly with method development in another fishery-related
participatory research project (squid), where all contributed knowledge was translated
to biological terms to fit the parameters requested by managers; resulting participation
dwindled in fear this information would be used to justify lower fishing quotas (Johnson
2011). The scientific language used in the analysis portion of the research ultimately
closed access to fishers in this management-relevant step of research.
Access is perhaps most challenging when technical expertise is required and is
an expected challenge in the technologically-complicated water quality methodologies.
In some cases, technology such as geospatial technologies, can offer a third language
with which to integrate contributing knowledges. Geospatial software became a
common language to discuss restoration needs in Louisiana estuaries, where physical
scientists and fishers could both translate their knowledge into a tool for learning each
other’s languages (Bethel et al. 2011). Technology that is familiar to one group of
knowledge holders, however, can tip the power balance in favor of that group. This
imbalance can come from differential access to expensive technology or different ability
to invest time to keep up with rapid technological developments (Silvertown 2009).
Therefore, technology can both aid and hinder quality participation depending on the
access and complexity.

144
3.3.3 The North Carolina Coast
The coast of North Carolina boasts a unique ecology where the northern
Labrador current meets the southern Gulf Stream at Cape Hatteras (Bumpus 1954).The
Neuse River forms a dividing line between north and south both biologically and
culturally (Griffith 1999). The landscape is formed from thousands of years eroding the
Appalachian mountains and depositing sediment in a wide, sandy coastal plain forming
a complex network of low-lying peninsulas and estuarine bays. These shallow bays with
their aquatic vegetation serve as important nursery grounds for fishery species
throughout the east coast (Etherington & Eggleston 2000). Locally, these estuaries
support an 82 million dollar commercial fishery including (in order of importance) blue
crab, shrimp, croaker, summer flounder, bluefish as well as oysters, flounder, clams,
spot, and mullet (Mcinerny & Bianchi 2009).
Despite the fact that fishers who are on the water daily are in an excellent
position to monitor long-term ecological changes, “the detailed, rooted nature of the
environmental knowledge of fishers allows fishery biologists and economists in the state
to discount that knowledge, in whole or in part, as not based on the tried-and-true
methods of science: repeated observations, experimentation, controlled settings, and so
forth” (Griffith 1999). However, state management recognizes the potential contribution
of diverse ways of knowing, including fisher knowledge, and thus mandates they be
included through citizen advisory councils and public comment periods. For example, a

145
workshop of fishers and scientists successfully resulted in a blue crab management plan
sensitive to both biological and cultural factors (Mirabilio 2005). Furthermore, NC Sea
Grant’s FRG program that funded this research is explicitly designed to overcome some
of the ‘distance’ between scientists and fishers, by combining the interests, knowledge
and skills in collaborative research projects.
Fishers understand rivers and estuarine waters as public trust (Andreatta &
Parlier 2010) and therefore expect state responsibility for their stewardship as a public
good as well as public availability of ecosystem services. With the state’s Coastal Habitat
Protection Plan (Street et al. 2005), government officials and public commenters agreed
on maintenance of water quality as a priority in management of this public trust
resource. No matter what the causes, the US Geologic Survey recognizes consistent
water quality issues in North Carolina including sedimentation, summer hypoxia and
nuisance algae, excess nutrients, and fecal coliform bacteria (Bales et al. 2003), in
addition to historical legacy contamination from the textile and agricultural chemical
industries (West 1992). Due to financial and time constraints, not all of these issues can
be consistently monitored (only fecal coliform bacteria is repeatedly measured
throughout the state, by the Shellfish Sanitation and Recreational Water Quality
department in the Division of Marine Fisheries), leaving a water chemistry information
vacuum that can be supplemented by fisher knowledge (as is part of the goal of the FRG
program).

146
3.3.4 Pre-project: Gaining Rapport as a Facilitator through Basketball Alliances and Oyster Eating
Previous to the project’s inception, I was already living in the community
(Carteret County, NC), embedded in a social network required for collaborative
research. The academic side was relatively easy. Though there are five marine labs in the
county, scientists go to each other’s seminars and plan social events over an inter-
university email list. The fishing community is not such a unified entity. They divide
along family lines, hometown harbor, gear type, and whether drinking a beer before
noon while fishing is acceptable. While planning recruiting efforts, one investigator
asked for clarification as to who I wanted to work with: “well, there’s the drinkers and
the non-drinkers…” (MH). Connections were largely forged from the 4 initial fisher
collaborators, who reached out to colleagues they thought would be interested.
Given that this mercury and PCB project could theoretically result in the state
taking the fishers’ catch off the market, gaining the trust of fishers played a key role in
the project’s success. Trust is not a bilateral relationship but instead fits into the milieu of
existing relationships and social capital, good and bad (Pretty 2003). Some gestures of
trust were small and subtle, like my acquiring a local phone number. Even in an age of
cell phones where roaming charges are part of the storied past, and most people don’t
pay attention to the numbers they dial, my 252 area code labeled me as someone living
in the region. The most common direct filter fishers applied to me was the question “are
you a state crony?” Though few worded the question quite so colorfully, the intent was

147
clear, and reflects that relationships between fishers and state agents are tenuous at best,
intimately tied to feelings by fishers that of unjust regulations that took advantage of
past cooperation (described in a similar situation by Johnson 2010). Many knew to ask if
my funding came from state sources. These represent the smallest and largest signals of
trust; the three vignettes in box 1 describe some additional details involved in gaining
trust and acceptance into the social milieu.

148
Box 1. Vignettes of Trust
The owner of a fish house called me one Sunday evening to ask if I wanted to go
crabbing with “the college boys” borrowing his boat the next day. “Be here at 4:30 in the
morning”, he said, hanging up the phone. His fish house is a 3-hour drive and I knew of
nowhere I could stay last-minute in the most sparsely populated county in the state. So I
threw my camping gear in the car, drove to the nearest state park and had a few hours
of sleep while the local mosquito population received a late dinner. I woke up before the
local roosters for a great day on the water. The fish house owner thanked me after a full
day of crabbing with GPS-tagged baggies of mullet and phone numbers for the fishers.
True to Southern style, hospitality and a culture of giving is a large part of daily
life. When a team of three crabbers met me at the dock, arms extended with a cup of
steaming coffee and a cheese-filled biscuit from the early-morning diner up the road, I
kindly accepted the breakfast and helped load bait on the boat. After hours of
conversation while fishing covering the local ecology, the fishery, and the love of small-
town eastern North Carolina culture, I knew I needed to get them something in return.
They received an envelope in the mail the next week full of Duke basketball
paraphernalia and we’ve kept in good contact ever since. Making a connection by mail
later was also an effective means of extending the conversation beyond the one day in
the field.
Trust in a fishing community also involves smoothing over a gender divide. “No
one will tell you the truth as a woman”, a gray-haired fisher told me in the early
morning hours, without blinking. While that comment alone required some reflection on
my role as a researcher, it made me realize that the legend of women bringing bad luck
at sea is alive and well. Thinking more logistically, another captain asked “I have a 5-
gallon bucket, is that okay?”. Considering the bucket an improvement for leaning over
the side of the boat to use the bathroom, I said yes. But to him, it was a signal not only
that I would be out of the way, but that I fully understood what a day in life of a small-
scale fisher entailed.
Building rapport and living in the coastal region does not necessarily mean that
fishers and scientists see eye-to-eye to meet common goals – the first step may be just
tolerating one another, then helping each other as part of community culture. One fisher
participating in this project said of scientists “if I thought they were going to do me any
damn good, I’d be down there kissing every one of their asses. But that’s about as god-

149
damn much good as having a pimple on my ass. The only thing you hope for is getting
some grant money out of it” (AS). His quote illustrates how cynicism and lack of trust
could serve as a barrier to access to the participatory research. However, he and his
family were happy to help if it meant someone else in the community was employed by
said grant money. This particular skeptical fisher insisted that I stay for a hearty lunch of
fried oysters in order to meet the other fishers in town.
Despite cynicism towards scientists within the fishing community, collaboration
in the project also offered a chance for fishers to promote their stories and knowledge in
a relatively public forum (outside their usual social network of other fishers), which has
the potential to manifest in management or support for commercial fishing through
offering new perspectives. For instance, I recorded their stories by digital recorder
during follow-up interviews or sampling ride-alongs for use in our final results and
reports to Sea Grant funders, stories that were shared on the condition that I pass them
along to state employees, who might pass them on to state regulators. Cynical fishers
like the man quoted above and those who questioned state cronyism still participated in
the project despite it being supported with state funding, but ensured that their stories
on a number of issues beside the research itself were recorded. The stories were not
restricted to research topics, but told the contextual story of the participants; the
information recorded for the project included far more than mercury and PCB levels but
environmental change over time, family support, economic challenges of the fishery,

150
interactions with endangered species, and other issues only loosely connected to water
quality. This may be the fishers’ way of negotiating the worldview used during research,
ensuring their methods of learning embedded in the larger socio-ecological system were
represented. In Maori communities, collaborative research was found to have a similar
effect on cynical participants, where knowledge creation and knowledge ownership by
participants are respected and embedded in their natural forms of inquiry (Gibbs 2001).
In both cases, the inclusion of contextual stories allowed information sharing in spite of
cynicism (even if it did not assuage any of that cynicism).
3.3.5 Searching for Mercury: Collecting Samples State-wide
The project started with four official fisher collaborators spread across the state.
These four fishers, each of whom were connected to a distribution business (cooperative
or fish house) then recruited other fishers in the area who might be interested in
contaminant levels in their catch. The concept seemed simple enough – go out with each
fisher and GPS tag samples from various positions along their fishing route during the
day. Two problems arose with this model, however – feasibility of having collaborative
research teams on small fishing boats and fishers wanting to test tissue outside the
parameters of the research.
Since the fisheries of North Carolina are small-scale, and use shallow draught
boats, boats are often too small for a ride-along passengers, holding the captain and
perhaps one mate with all the fishing gear. Some fishers thought that an extra person

151
would significantly impede their ability to go about their daily practice, while a few
others followed the old tradition that women on the boat are unlucky. Regardless of
reason, these fishers (33 of the 54) wanted to tag samples on their own and diligently sat
through impromptu training to ensure they’d collect samples correctly, according to the
project’s protocol. They also sat down with me and fully described and mapped their
fishing trip upon return. Those who did agree to take a scientist on board (21 of the 54)
not only collected what was needed for the study but often directed evenly spaced
collection across the environmental gradients throughout the route (adding higher
spatial resolution than originally planned), using the extra person to map the collection
en route.
Sampling involved very little outside a normal fisher’s routine. As we were
trying to model typical consumer experiences, fishers went along their normal routes as
planned according to weather conditions and friends’ recent catch reports. At some
point mid-route, we sequestered some of the catch, noted the location, processed them
as appropriate for the species (i.e. filleted the finfish, iced the clams), and stored them in
a cooler. We also noted the conditions at the time of sampling, such as water color
(indicative of algae blooms), jellyfish abundance, runoff from nearby tributaries, etc.
Many times, we took a photograph of the area to accompany the condition description.
Some fishers wanted to find the most contaminated fish for testing – from
around ports, military bombing ranges, and where they noticed ecological impacts.

152
After much reiteration that the project was supposed to model the average consumer
experience, most people maintained their trajectory but expressed the need for other
areas of testing. One gave me sponge crabs and asked – as a personal favor – if I could
test them because his family considers the sponge a delicacy and he knew eggs
sometimes sequester toxins. In cases like the sponge crab, we used extra laboratory
resources to accommodate the request but did not include them in project analysis.
In each case of in-the-field negotiation, we referred back to the original grant
proposal and the project objectives listed within. Since this protocol was jointly
negotiated between the original four project initiators (the fisher with the original idea
and 3 Duke Marine Lab affiliates), later participants generally accepted it and
understood their personal questions could only be addressed as allowed by additional
resources. As discussed in possible avenues of participation, methodology is often
where translation between knowledge groups limits the quality of participation
(Johnson 2011). In this case, having a document of agreed-upon methods written in
simple language limited the need for spur-of-the-moment translation. In addition, both
knowledge groups had a solid understanding of the technology (geospatial) required
and ecology of the area in order to operationalize objectives written in that document.
3.3.6 Exploding Coils and Other Technological Hiccups: Lab Analysis
Normally, a well-funded participatory science project would send their fish
tissue samples to a contract lab and receive an email several months later with the data

153
from the desired chemical analysis. One national program monitoring mercury, Mussel
Watch, tells participants to mail frozen samples to the NOAA lab orchestrating the
whole program. Results are posted later on a web portal for all participants to see
(http://ccma.nos.noaa.gov/about/coast/nsandt/download.aspx). Our project, however,
was also supposed to support graduate and undergraduate training and was working
on a small budget. So the project was designed around myself and an undergraduate
student running the analysis using the EPA standard protocol for mercury (EPA 2002)
and a commercial kit for PCBs. These protocols could be repeated in the future by
soliciting the help of the same labs or training new people to use the standardized
protocols. This standardization is considered critical to maintain trust in collaboratively
produced data (Mueller et al. 2012) and is therefore non-negotiable.
Samples were stored long-term and prepped for these protocols by freeze-drying
them in a lyophilizer. I then stirred the freeze-dried tissue to mix the sample as best as
possible to ensure we were measuring an average chemical level across the fish, in case
certain fish tissues sequestered more toxins than others (like the clam and oyster livers).
These are amendments to the standard protocols suggested by Lasrado et al. (2003) for
analysis of solid fish tissue, as the EPA protocols are written for liquid samples. Mercury
analysis is run through a machine created to meet the EPA protocols, which essentially
vaporizes the sample using superheated and oxygenated air and measures the elemental
mercury in the air using a chemical trap. PCB analysis, done in this case using a

154
commercially available kit, is performed using an enzyme-linked immunosorbent assays
(ELISA) method in which the PCBs are extracted from the fish tissue, chemically bound
to a color indicator using an active enzyme that specifically binds to PCBs. The color
intensity is then read using a spectrophotometer to quantify the PCB concentration in
the sample (see additional supporting materials for more detailed protocols).
However, questions still arise during these non-negotiable protocols. In our case,
these questions arose mostly around logistical problems that extended the project in
time. Originally scheduled to last 6 months, the project took 12 due to equipment access,
participant travel schedules, fishery access, and other should-have-been expected
events. This longevity forced us to make decisions over whether switching mercury
analyzing machines or buying new PCB kit ingredients would violate the calibration of
the methods established at the beginning of the study. There is also leeway in both the
mercury and PCB procedures both for mistakes and to optimize the procedure for large
number of samples by moving ahead with new samples while some steps are
incubating. Finally, the procedure does not dictate a standard number of replicate
analyses to run to account for procedural variation (likely resulting from these previous
decisions). All of these decisions were handled by the lab director of the mercury and
PCB labs in discussion with the person actually doing the analysis, but not with the full
suite of project participants. For more detail on these occurences, see box 2 and 3 for
mercury and PCB, respectively. It is worth noting, however, that with many

155
collaborative projects, these decisions would have happened in contract labs away from
either the scientist or fisher participants of the study.
Box 2: Mercury Analysis with Different Catalyst Tubes
For those familiar with analytical chemistry, the complex inner workings of the
specialized machines involved are no surprise. Nor is it surprising when that complexity
means that a simple mistake or broken part takes weeks to fix. For me, this lesson started
when the direct mercury analyzer (DMA-80, made by Milestone Inc), nicknamed
“Mercutio” by the host lab, loaded two boats full of sample at the same time. These little
metal boats, about an inch long and made of thin sheets of nickel, load 40 at a time onto
a ring, each filled with a different sample of freeze-dried, ground fish tissue. The ring
rotates after each sample so an automated arm can pick up the next boat and deliver it to
the analytical chamber, where the sample is vaporized with high temperature. The
vapor is carried through a catalyst tube by pure oxygen gas, where interfering chemicals
are captured and mercury sticks to a gold amalgamator. Elemental mercury is again
vaporized, illuminated by a lamp and measured by a spectrophotometer. If two boats
happen to get loaded at the same time, one boat pushes the other into the catalyst tube
where interfering chemicals are sequestered. This technological hiccup meant the
catalyst tube cracked and released an unknown amount of said interfering chemicals
inside the machine. The lab director ordered the new tube from the machine’s company
in Italy, stating they usually have extras lying about for when this happens. She had no
idea what made the machine decide to load two boats or what difference there might be
between catalyst tubes. Meanwhile, I was to help clean the inside of the machine by
loading soy powder (apparently these interfering chemicals stick to the incinerated soy
and are carried out the exhaust of the machine) and pack my samples to go home. A
month later, the machine was fixed and able to analyze the rest of the samples. This is
just one example of why laboratory work takes much longer than the general public
expects.

156
Box 3: PCB Analysis Protocol Optimization
The PCB analysis relied on an undergraduate working on an independent study project.
Between other classes, she had a month of time to focus on the project, which meant that
she spent most of that time in a laboratory building frequently called the “bunker” of the
campus. She had one opportunity to experience fieldwork with one of the crabbers in
town who was having health problems so shortened his days to not stress his body more
than necessary. The expression of my mentee after spending just a few hours in the field
told me she finally understood the project, with the community and fishery context. The
pinkish-white fluffy tissues she had been extracting for weeks finally connected to real
fish, fishermen, and places. Meanswhile, as any toxicologist will tell you, the first time
you try a method is rarely perfect. It’s best to practice on a sample you have an
abundance of or something similar that isn’t needed for the project. This case was no
different – the kit’s instructions still left room for mistakes and we made quite a few of
them. Luckily, we had more than enough extra sample, but we needed to order one
extra kit (at the cost of $1250) to accommodate this learning. Once we had the protocol
figured out and had done several sample runs, we could process 60 in a day, so finishing
the analysis was relatively smooth. All of this method development, however, was done
on the spot by scientists (lab advisors) with little consultation from the fishers.
3.3.7 Chasing Interpretations
The discussions that happened while fishing or chatting on the dock of the fish
house uncovered where the independent personalities of many fishers diverge from
what is needed for cooperation in collaborative research. Out of the many possible
formats through which data could have been returned to them - e.g. symposium, online
forum, focus groups, individual meetings - , all but three of the participants preferred
one-on-one meetings. The remoteness of the towns and working waterfronts where the
participants lived was largely the reason for this preference. The northeastern part of the
NC is one of the most sparsely populated regions in the country (Street et al. 2005).
Meeting me one-on-one and face-to-face also helped fishers digest the information in

157
private, ask questions comfortably, and tie the specifics of their life to the data at large;
fishers felt this could not happen in a group setting and thus justified their choice of
individual meetings.
Despite agreeing to the preferred format of face-to-face meetings, my efforts to
solicit these one-on-one meetings met with one of three responses: avoiding the meeting,
using the meeting as a sounding board on other issues, and using the meeting to
formulate thoughtful responses. For the 31 who avoided the meeting, responses
included not returning phone calls and standing me up for a scheduled meeting. Some
who didn’t want a meeting explained that their role in the project was over (collecting
samples) and wished me the best of luck with the analysis and writing. Others appeared
to want a meeting but couldn’t find a day that they wouldn’t rather be fishing. In any
case, I mailed the results handout and my contact information in case they wanted to
talk over the phone or email. One person called later with thoughts for another possible
project and used the data he received to explain some local observations.
Given that this is the single largest drop in participation in the project, this is a
good place to discuss the larger breakdown in collaboration that occurred during the
project as indicated by drastic loss in participation over the course of the research. First,
participation was mostly interest-driven instead of application-driven, therefore harder
to garner motivation for participation (Selman et al. 2010). Though a few of the initial
investigators viewed the research as a direct response to the Food and Water Watch

158
“Dirty Dozen”, the large majority of participants did not count the cards as their
primary motivation – they were instead driven largely by curiosity. Given curiosity-
driven attention to the project, a drop in participation when competing activities arise is
expected. The laboratory analysis for both mercury and PCBs was finished between six
and twelve months after initial collection trips, a time period long enough for interest
and curiosity to wane (Hoppe 2005). In addition, fisher participants have competing
time interests given participation in and of itself did not directly help their primary
profession (even if the results, in some way and at some time, might). While I was
unable to ask each participant who stopped participating why they did so, some fishers
did report that they wanted to participate but the time demands of fishing, mending
nets, and marketing the catch did not allow continued participation. In addition, not all
participants may have felt they had analysis to contribute. Especially with regard to
health issues, the statistics and data analysis is perceived by society to be the realm of
experts – doctors and toxicologists – formally trained to make health decisions (Karnieli-
Miller et al. 2009); several participants expressed this concern.
The 23 who accepted a meeting either wanted the time to air more general
concerns about water quality and fishery status or wanted to go through the results to
make sure they understood them. In both these cases, I brought the handout (example in
Appendix D), discussed the presented results, and then had them perform a map layer
exercise to put project data in a larger context. Map layers, printed in color on

159
transparencies from the North Carolina geospatial database, included water quality
concerns that were mentioned by participants during sample collection. In addition to
project data, they included ammonia, mercury in sediment, PCB in sediment, dissolved
oxygen, population density, areas with watershed planning efforts, and point sources.
Using both project data and these other indicators, participants were tasked with
deciding at what spatial scale seafood safety recommendations could be made (the
original question of the project).
Looking at the project data, participants had trouble deciding what level
qualified as “high”. Specifically, they had a hard time separating high levels for a species
versus high levels overall. This was supported by the notion that “we’ve got a
department of water quality – we’re one of the highest [rated] bodies of water in North
Carolina… then it’s hard to see how you’d have contaminants” (JSt). State designations
as “outstanding resource water” led some to “consider this area to be, the fish living in it
would be healthy and there shouldn’t be a whole lot of mercury or PCB present or
contaminating anything” (BR). Overall, participants also didn’t differentiate types of
pollution, as “all pollution is bad and it’s all kind of on an equal footing” (DE).
Converting raw data into actionable conclusions requires an understanding of
system complexity and risk assessment probability, an exercise no one involved – not
even consulting scientists – was willing to compute. The answer for each person as to
whether the seafood was safe depended on total consumption – of what species, how

160
often, and whether they fed children. Participants found this calculation, through an
example equation provided by Environmental Defense Fund (webpage no longer
available), troubling, oversimplistic, and full of assumptions (where RfD = reference
dose (0.001 mg/kg-d), BW = body weight (kg), Cm = measured contaminant
concentration (mg/kg), Tap = days in month, MS = meal size, ARL = acceptable risk level
(here, 0.00001), and CSF = cancer slope factor (2 mg/kg-d)-1):
Meals per month for mercury concerns = RfD x BW x 35.2 x Tap
Cm x MS
Meals per month for PCB concerns = Meals/mo = ARL x BW x 35.2 x Tap
CSF x Cm x MS
One participant, when asked about his conclusions from the data, said there’s
“no way I can answer that. I don’t have the knowledge or the education to answer that. I
mean I’m not a doctor, I can’t tell a person what they can eat and what they can’t” (BF).
The question became more complicated in light of the previous conclusion that any
pollution is bad and likely indicates other types of pollution. With regard to overall
safety recommendations, “most of the data is in, is confounded by other potential
contaminants that are there” (DE). Yet, “for the man on the street, water quality is pretty
simple. I can either buy that fish and eat it or I can’t… [but] even when the water’s
polluted for the oysters, you can still go out there and fish because they swim” (JSw). All
of the complexity gets boiled down to the state’s recommendations and may leave out
some types of hazards. One participant concluded “there may be an upper level where

161
you shouldn’t eat it at all, I don’t know if that’s posted or not” (MH). Some thresholds
are posted by EPA, FDA, and NGO groups, but they’re all different for mercury – 0.3
ppm, 1 ppm, and 0.2 ppm respectively (US EPA 2012; FDA 2000; EDF 2011). With the
exception of some known polluted areas, locations averaged less than these
recommended levels. Therefore, when pushed, all came to the conclusion that the data
are “low enough so that I don’t think they present a big risk to people of eating” (DE)
unless they are subsistence fishers (Freitag et al. 2012).
The mapping activity was easier for participants to digest, where contaminant
levels were color coded relative to average for that species and depicted as points on a
regional map (see figure 16). Participants were most concerned about personal samples,
seeking their points with questions like “where is Adam’s Creek?” (BJ). They also
connected more contaminated areas with local human activity, the data confirming what
they had noticed through shifts in the local ecology. Examples include changes after the
Intracoastal Waterway was dug (CP) and how the negative influence of riverine inputs
“definitely shows you that the rivers are your problem” (EF). Some of the “hotspots”
had no explanation in local knowledge, vexation embodied in questions like “so I
wonder what’s going on in the mid part of Albemarle Sound because there’s several
orange/red dots and it seemed like there was something” (CH). But the variation was
expected, as “[participants] would have thought there would have been areas that were
higher and I guess those areas would probably be kind of the industrial areas, kind of

162
Newport River and around here with the port and the history of industry” (CH). The
maps engendered additional questions and critiques of the research. One participant
noted “I don’t know where your sample was going, number one. It looks like you
targeted some high population areas, some high transit water areas and some of the
more possibly pristine areas doesn’t look like that they were sampled” (BJ). But the most
common questions queried the relationship between contaminants in the sediment and
levels in the fishery. Everyone who asked this question used map data to conclude that
the two are unrelated – but then wanted to know what dynamics mediated the
relationship between sediment and fish, as yet an unresolved question in the scientific
literature (Aiken et al. 2011).

163
Figure 17: The most common query of the map layer exercise – how mercury
levels in the sediments compared with those measured in fish tissue during the
project. The overall consensus is that the relationship is tenuous at best.
Participants wanted to know what I was going to do with the completed data set,
the immediate practical application. A few already had their own plan for using the
data, like rebutting “people [that] tell me don’t eat oysters because of the contamination

164
concerns, now I’ve got proof to [eat] my friggin’ oysters” (BJ). This comment reflects the
utility of such data to local marketing efforts. One participant said “I already use the
high water quality standard that we already have in our area as a market tool and NC as
a whole, but having something like this behind you to say tests have been done,
sampling’s been done” is even more helpful (JSt). Our funding source dictated that all
raw data become incorporated into the state biological monitoring database, which is
stored online for public access. One participant dismissed the usefulness of this state
function, “they’re having an issue with it, but not in a point of managing it type” (BF),
reflecting the common sentiment among fishers in the area that an abundance of
available data is not leading to better management.
3.3.8 The End Game: Vanishing Outreach Finances and a Distant Horizon for Continuity
The Fisheries Resource Grant funding is a limited resource (shrinking each year
under General Assembly pressure) meant to fund small, exploratory projects for one
year. Most collaborative or participatory projects are long-term efforts with continued
volunteer recruitment and relationship-building (Newman et al. 2011). Yet, the details of
research funding made longer effort prohibitively difficult. When participants in a
fishing cooperative in central North Carolina expressed interest in purchasing their own
direct mercury analyzer, they discovered the costs would be $30,000 or more, plus likely
large maintenance costs. Milestone, the leading company making these machines, does
not list a standard quote for their machine, so this particular quote is likely below what a

165
university laboratory would pay, but still far above the capabilities of a fishing
cooperative. Given the structure of the funding, I modeled this project with a distinct
end, where participants could take a deep breath and decide if they wanted to continue
thinking about contamination issues during the workshop. The large number of requests
from fisher participants to study individual questions, be that to quantify a repeated
observation or assuage concern over health of their subsistence-dependent families,
suggests that motivation could be maintained for a larger but more diffuse effort.
The other funding challenge relates to the organizational funding required for
organizing large numbers of participants over a geographic area as large as coastal
North Carolina. There was no money for outreach in the original budget to make the
final publication open access or travel for the one-on-one meetings for data
interpretation and analysis, as these needs were expressed by participants once the
research was underway. Like trust, funding and flexibility determine access to and
comfort with collaborative research. The Fishery Resource Grant program requires
outreach and education as a part of the research process, as part of the mandate to make
the research applied (authorizing legislation). Yet, without some additional financial
help, the effort to make the last stages of research fully collaborative happened out of
other personal and research funds.
An optional follow-up workshop was attended by 11 participants, funded using
other resources. During an initial introduction period at the workshop, participants –

166
both scientists and fishers – rekindled long-term relationships and quickly decided that
the one-on-one meetings each had participated in already covered all possible
discussion of mercury and PCBs. We all gave a quick update informally over dinner and
moved on to the second task of the workshop – establishing a new participatory science
endeavor. The results from the second part of the workshop are extensively discussed
elsewhere; I will restrict the rest of this analysis to the mercury and PCB project.
3.3.9 Reflections on the Scientific Process
3.3.9.1 Forks in the Research Road: Critical Decisions
The first decision, and also the first controversy, revolved around the resolution
of spatial data collected with each sample. While ideally, each fish would be GPS tagged
as it was caught, there are biological reasons and social reasons this became infeasible.
First, the finfish in the study, spot and mullet, swim over a range much larger than the
average fishing route, so noting location at the point of netting may not accurately
describe where the fish encountered the chemical contamination. One of the participants
pointed out that a shrimp he tagged once in central NC was later caught in Northern FL.
“His little legs must have been going like this” (KR), he stated as he wagged his fingers
quickly back and forth. The other reason is that some participants were happy to donate
local knowledge and a small part of their catch, but not take me along or learn GPS
technology to mark the locations. Given these reasons, we decided that approximations
using printed local maps would be adequate spatial resolution.

167
Another decision relates to level of participation: determining how hard I tried to
set up follow-up meetings with participants if they did not seem interested. Few people
told me they did not want to meet outright, but many kept postponing meetings or not
returning emails or phone calls. Sometimes this was with good reason; for example, one
fisher evacuated to Louisiana after a large wildfire. Some of the early participants in
fieldwork waited a year before the analysis was performed and meetings took place; I
suspect some of the not-returned phone calls were from lost interest or forgotten
acquaintance. Regardless of potential reason, I tried 3 times for each participant to set up
a meeting through at least 2 different forms of communication (email, phone, mail, or in
person) before mailing the results with my contact information and waiting for the
participant to reach out to me. This was entirely a personal decision and depending on
personality, other facilitators could have put forth very different efforts.
One structural decision elicited the critique from one participant that the spatial
distribution of sampling seemed patchy and favored populated areas (BF). He meant
populated as in small villages, not just cities. Much of the eastern part of the state is
sparsely populated if at all, large tracts of land dedicated to National Wildlife Refuge or
large industrial farms. These areas didn’t get sampled because almost no one fishes
there. His point is well taken, as the National Wildlife Refuges are peat bog, which is a
natural source of mercury leachates (DE) and long-standing farmland was likely dosed
with mercury and lead arsenate pesticides in the early part of the 20th century (PM) so

168
seafood species may be picking up contamination from these areas. However, recruiting
participants for the study involved gaining rapport through the fish house managers
and cooperative organizers. Through recruiting official collaborators in these
community leaders, I could then rely on these collaborators to function as nodes of social
networking as well as providers of places to physically meet. For example, I attended a
meeting of Walking Fish Community Supported Fishery and made a short presentation
to recruit participants, who then recruited their friends. Some “participants” were
actually blended contributions from teams such as husband/wife, father/son/grandson,
or aquaculture lease sharers. Generally, one member of the team interfaced with me for
analysis while the others only helped with fieldwork. These social networks showed
geographically in the data, as did Refuge regions where no one lived or fished, a
methodological fact that solicited dissent from at least one fisher who was not part of
original project design.
3.3.9.2 Breathing Life into Data: What Happened to the Results?
Many participants wondered something like, “so what are you going to do with
all this?” (BJ). I can’t speak for everything that happened to the results because they are
in the hands of the participants, to a certain degree. Some people took ownership,
especially of the data from their fishing route and grounds, and shared the handout I
gave them with business colleagues and family. One participant who also owns a retail
store said “I’m going to post this for customers to see that, so I’m going to actually put it

169
on that window to show [my seafood’s] safe” (OB). The theme of sharing the
information with customers, especially for participants who sold to a relatively educated
clientele, emerged repeatedly despite most people saying they’re rarely directly asked
about contaminants.
Figure 18: Results in the hands of participants who run a community
supported fishery, under the link “Is NC Seafood safe to eat?” I’m listed as the
primary contact for consumer questions.
The Walking Fish Community Supported Fishery posted the resulting journal
article on their website following a link “Is NC Seafood Safe to Eat?” (see Fig 17) with
my contact information for customers with questions. One participant stated “I’m trying
to get a vendor license with Whole Foods Market and I need all the help I can get,”
folding the handout of data into his application packet. The fact that the scientific
publication and my contact information was often promulgated hints at both perceived

170
researcher expertise (Gibbs 2001) and the propensity for multiple kinds of information to
be translated to scientific language, privileging the scientific way of knowing (Johnson
2011) (and in this case, expecting seafood consumers to understand it).
The funding agency staff (NC Sea Grant) spearheaded the most concerted
outreach effort. Some outreach and application is required for funding and in the
original application we proposed to make local or regional seafood recommendation
cards like those that had inspired the study from Food and Water Watch. Though once
the project was over, no one followed up to ensure we followed through on that
particular promise, two separate members of the Sea Grant outreach team contacted me
and several fisher collaborators for a new article in the Sea Grant magazine, CoastWatch,
and a fact sheet in the “BluePrints” series to be posted on the Sea Grant website as a
reference for the North Carolina’s cooperative extension service overall.
3.3.9.3 Where Do I Fit In? The Role of the Facilitator
Collaborative science theoretically removes the role of the expert in scientific
inquiry, where each participant contributes their own expertise and authority is
negotiated (Callon 1995). Distributed information is collected and analyzed by a
collective; all ideas are given thought and time for evaluation. This new mode of science
questions the role of the knowledge producer in a world of no experts. Yet, in many
ways this case was “my” project – not through taking an expert role but through
facilitation. I served as the communication node, collecting questions and information,

171
digesting it, and redistributing the collection as necessary. The skills utilized in this
project were those of facilitation, communication, and project management. In the words
of Collins and Evans (2002), these are the skills of interactional expertise required to
utilize the newly recognized wealth of distributed knowledge. Participatory science,
then, benefits from such a coordinator or facilitator – but funding for such a role is rare
in the standard scientific funding sources. Even with Sea Grant funding dedicated to
participatory science and accompanied by a support staff for outreach, more help in
funding or training for developing interactional expertise would have been helpful.
Continuing to look introspectively, the fact that I was a student changed the
dynamic in the group as a whole. Most of the participants are parents and sympathize
with students spending time researching something that interests them and are willing
to help. They consider the student mind – even if that student has been in the higher
education system for almost a decade – still pliable and open. This probably helped
some participant overcome their cynicism towards scientists and possibly to believe that
their stories would make a difference. For some participants, working on this project
was a chance to mold a future scientist in the way they perceived would be most helpful
to the community (AS). The long careers of most participants made them feel expert in
their own right, sure of their information, so they were willing to help fill the non-
expert, student mind with whatever they could contribute. The quest for interesting
information, free of much institutional or career baggage of professionals, also lends

172
legitimacy and trust to the entire scientific endeavor. As one participant said, “well sure
I trust everything a student does” (JSt).
3.3.9.4 Conclusions Lessons for the Road
Many participatory science endeavors rely largely on volunteer energy to
collect data but vary in involvement during other research stages (Bonney et al. 2009).
The process of sitting down to look introspectively at my personal role in the project
helped develop not only this project but also any future participatory science programs I
may create in the future. The critical decisions made along the way shaped the project
but also showed adaptability in the field, responding to both cultural and biological
demands on the methods. In a way, this increased the quality of participation – the rules
of engagement were guided but not set in stone by the original team designing the
project (which included multiple ways of knowing, unlike many participatory projects),
allowing room for negotiation. Instead, participants were able to not only give
contributory expertise but also interactional expertise, which is the type of expertise that
ended up driving the progress of the project.
Participatory science takes time commitment in developing social relations and
coordinating larger numbers of people, more so than for laboratory science. This
generally results in long-term programs that could run in perpetuity; the best example of
this is the National Weather Service’s rain gauge program that was made official in 1896,
and that relies on volunteers to collect weather data, and more recently, create research

173
questions that can be tested through that data (Doesken & Reges 2010). However, the
short time frame and visible end of this project had added benefits for participants ,
soliciting a certain degree of spontaneous participation for the pure benefit of
knowledge creation or helping a student. The time spent organizing yielded only one
paper, but participants felt free to continue looking at questions of mercury and PCB,
apply for new grants under the Fishery Resource Grant program, or help in the next
endeavor with this group – looking at pesticides in coastal tributaries. Only 6
participants chose to work on the pesticide question, but at least 3 others are applying
for their own grants and at least 10 are participating in other citizen science projects in
the region (oyster restoration, larval monitoring, gamefish stock assessments, and
others). Some of the participants of this project came from those other efforts and are
returning, but in at least one case, this project inspired fresh involvement. Looking at
participatory science as a social phenomenon, there are not isolated projects each
competing for participant attention; instead, there’s a fluid network of participants who
help with or even instigate projects relevant to their interests at the time. In the case of
coastal North Carolina, a network of participants can be maintained with continued and
future support of collaborative research.

174
4. Seed Grants for Stakeholder Engagement fostering Empathy and Respect: Reflecting on North Carolina’s Fisheries Resource Grants
4.1 Introduction
Incorporating different ways of knowing in research and management has the
potential to bring creativity to environmental problem-solving through offering fresh
perspectives. Democratizing knowledge in this way dictates the use of new
methodologies for knowledge creation and integration, leading many researchers to
participatory science (Fischer 2002). Participation can take many forms (Bonney et al.
2009) and has become more complex over time. Miller-Rushing et al. (2012) describe the
development of participation, from the early days of official participatory science where
citizens merely contributed data, to some modern projects where citizens and scientists
blur the lines of formal expertise roles for co-produced knowledge. North Carolina
funds one of these more modern participatory science efforts through its Fisheries
Resource Grant (FRG) program, which was founded in 1994 to encourage co-produced
applied fisheries research. In this paper, I use water quality projects funded via the FRG
program as a case study to 1) explore the nature of collaboration during the process of
co-producing new knowledge, and 2) reflect upon how the nature of collaboration
structures possible benefits for understanding complex problems. The latter goal is why
the study focuses on water quality – the FRG program funds diverse types of research,
but water quality is one of the most complex and persistent issue addressed, while at the

175
same time being one of the least politically contentious. Before continuing with the
specifics of this research, I first review some relevant literature that informs my analysis:
how multiple ways of knowing can each be recognized as legitimate in research and the
benefits of co-producing research for understanding complex problems.
4.1.1 Integration: How to recognize the multiplicity of legitimate knowledges
“The powerless are not considered to be credible knowledge-producers” – (Fortmann and
Ballard 2009)
Society traditionally ascribes scientists with credibility and legitimacy that
privileges their authority in environmental decision-making, but recognizing other
knowledge holders, both within science and within political processes, is necessary to
approach a complete understanding of the ecosystem (Fortmann & Ballard 2009). These
and other benefits of including multiple ways of knowing are discussed extensively
elsewhere (e.g. Berkes 2008), but the question of how best to incorporate non-scientific
knowledges into research endeavors remains. Collins and Evans (2002) suggest that in
order to fully realize the benefits of diversity, knowledges and associated power should
be carefully integrated through a relativist and reconstructive science that allows
prescriptive statements about the role of expertise. As Nadasdy (1999) warns,
integration is difficult because information comes in many forms and knowledge
holders may distrust what their knowledge is used for during integration. Managing
knowledge systems to adjust power geometries may be the only effective way to harness

176
future knowledge for sustainable development (David W Cash et al. 2003). The literature
suggests two ways in which integration may be eased: new institutions specifically
tasked with equitable integration (Nadasdy 1999) and participatory research, in its many
forms (F. Fischer 2002). North Carolina Sea Grant fulfills both these roles.
Formal institutions have a large role to play in information management –
defined as humanly devised constraints that structure political, economic, and social
interaction, or in short, ‘rules of the game’ (North 1990). Moving beyond the
contributory model of learning that only ensures representation of each way of knowing
through specified knowledge collection, institutions can further orchestrate the
interaction of different ways of knowing to find the best fit for policy outcomes (Lejano
& Ingram 2009). These institutions are often boundary organizations that create official
roles for boundary management, formally allocate participant roles, and provide forums
for coproducing knowledge (Cash et al. 2003). They also may be responsible for
navigating the ethics of working with diverse ways of knowing, especially in avoiding
the historic mistake of mining traditional knowledge for insight without compensation.
Ethical prescriptions could include establishing protocols for conducting research and
orchestrating highly participatory or collaborative research (Shackeroff & Campbell
2007). Institutional mechanisms are effective if “they manage the boundaries between
knowledge and action in ways that simultaneously enhance the salience, credibility, and
legitimacy of the information they produce” (Cash et al. 2003).

177
Institutions often choose to facilitate participation in order to combine
knowledges (Fischer 2002). The context for each participatory science endeavor forms
the structure of the program, starting with program goals and purpose. Though these
structures differ, participation offers the opportunity to elevate non-scientific ways of
knowing as legitimate information by offering knowledge holders a place to contribute
in their own voice. A number of typologies of participation attempt to clarify which
structure best aids integration. Shirk et al. (2012) divide programs first by degree of
participation along scales of duration, effort, numbers, and intensity. They then clarify
quality of participation along scales of credibility, trust, fairness, responsiveness, agency,
and due diligence (Shirk et al. 2012). Using these metrics, Shirk et al. divide participatory
science in five models: contractual, contributory, collaborative, co-created, and collegial,
adding contractual and collegial to Bonney’s et al (2009) similar typology. These
divisions follow a similarly documented gradient from projects collecting input with
little quality interaction to the dissolution of expertise barriers allowing free-flowing
information (Coleman & Bernstein 2009). All of these typologies do not create hard
categories but rely on rich description to judge qualitative metrics, a tradition this study
will continue in a similar attempt to judge integration.
There are many signs of quality participation outside typologies, often serving as
indicators of trust and respect for both the participants and the newly created
information (Wynne in Jasanoff 2004). These examples emerge from past qualitative

178
descriptions of collaborative research and represent potential recurring indicators for
this study. For instance, Fortmann and Ballard (2009) highlight that final presentation of
results is generally given by the collaborative member with the right social markers of
‘expert’, while credit should be given in the currency of each other’s careers as a means
of respect (Fortmann 1996). Another indicator arising out of European water
management is “learning to manage by managing to learn”, or institutional support for
social learning that values collaborative work as more than the sum of its parts (Pahl-
Wostl 2006). The list of potential indicators could extend in perpetuity, but each
represents an honest attempt at collaboration as opposed to merely joining the
“participatory turn” (Jasanoff 2003) that led Cooke and Kothari to title their book
“Participation: The new tyranny?” (2001).
In response to growing recognition of benefits from recognizing diverse ways of
knowing as well as the potential for co-production of knowledge as a source of problem
solving, the North Carolina General Assembly created the Fisheries Resource Grant
program (FRG). Here, I use the term co-produced to refer to projects that are
participatory through most steps of the scientific process, from idea generation to
dissemination of results (Bonney et al. 2009); thus co-produced knowledge represents an
intentionally blended knowledge that arises from bringing diverse ways of knowing
together (Cash et al. 2003). The first aim of this study is to use the FRG program to
deconstruct the nature of collaboration associated with producing new blended

179
knowledge. The analysis uses the typology from Shirk et al (2012) based on quantity and
quality of participation adding emergent indicators from the data (like the examples
authorship credit or social learning) to document the amount and types of collaboration
that took place as a metric of integration.
Theory suggests that the FRG program, if it is truly collaborative and co-
produces knowledge, may produce benefits beyond successfully integrated perspectives
through the linkages between knowledge and power (Jasanoff 2004). For example, FRG
may alter power dynamics in the community (Ellis & Waterton 2005) and strengthen
knowledge-to-action links (Berkes 2009). Alternatively, knowledge integration could
obscure diversity within groups and reinforce existing power dynamics (Schumann
2011). In addition, co-produced knowledge is needed to bring creativity to
environmental problem-solving and facilitate outreach efforts (Reid et al. 2011), so these
outcomes are expected to increase as a result of using a collaborative research model.
Institutional oversight also likely plays a large role in orchestrating how different ways
of knowing interact, and in turn, resulting changes in social networks and power
geometries (Cash et al. 2003). To address these possibilities, this project will document
the role of Sea Grant as the managing institution.

180
4.1.2 Innovation: benefits of knowledge co-production for complex problems
While simply legitimizing underrepresented ways of knowing can lead to more
successful outcomes by better incorporating context, “interdependent science done
collaboratively by local people and professional scientists can and has developed better
understandings of conservation and of rural livelihoods” (Fortmann & Ballard 2009).
These better understandings come through three main avenues: more relevant research
design and interpretation (Fortmann & Ballard 2009), better acceptance of the new
knowledge (Reid et al. 2011), and stronger connections to co-management efforts (Berkes
2009). Each of these three avenues will be evaluated during this analysis to determine if
the FRG program meets the promise of co-production for understanding complex
environmental problems.
First, more relevant research design and interpretation of results form a better
understanding of the context surrounding a given research question. Educational theory
challenges the separation of what is learned and how it is learned and used, suggesting
that coproducing knowledge, thus incorporating knowledge context, is the only learning
that occurs (Brown et al. 1989). This situated knowledge is then the only means of
producing a full description of the system. Coproduced knowledge uses multiple
methods to triangulate on practice and interpretation, leading to more thorough and
confident research products (Fortmann & Ballard 2009). For example, Knapp et al (2011)
found that in modeling of arctic rangeland dynamics, scientific and local knowledges

181
complemented each other through contributions at different spatial and temporal scales,
increasing the detail of the system description. Knowledge thoroughness through
diversity is also helpful to participatory water management in Australia and Bulgaria
through presenting new opportunities and creative ideas during knowledge negotiation
(Daniell et al. 2010).
Second, local application of coproduced knowledge allows for assignment of
expertise and acceptance of the new knowledge by both scientific and local knowledge
communities (Reid et al. 2011). Situated learning and attention to context necessitated by
coproduction may facilitate wider acceptance of diverse ways of knowing (Shackeroff &
Campbell 2007). In conservation contexts, many stakeholders “view knowledge as
something that needs to be produced in a collaborative learning process, in which the
meaning of information is negotiated” (Lauber et al. 2011). Studies of fisheries in the
northeast US reveal that coproduced research between fishers and biologists involves a
two-way flow of information that builds capacity for utilizing new, coproduced
information in what is perceived as fair management through communication,
translation, and conflict resolution (Johnson 2010).
Finally, knowledge integration and co-production are necessary prerequisites for
successful co-management initiatives (Nadasdy 1999), where co-management is “the
sharing of power and responsibility between the government and local resource users”
(Fikret Berkes 2009). Co-management efforts question the objectivity of scientific

182
knowledge and make the case for increasing knowledge diversity (Jentoft et al. 1998), so
co-production of knowledge and co-management are, to a certain degree, inextricably
linked. For example, co-production of climate change knowledge in the Canadian Arctic
serves as an institutional mechanism for learning and adaptation through enabling a
friendly environment for diverse modes of communication, deliberation, and social
interaction; this environment practice enables successful adaptive management
(Armitage et al. 2011).
Co-production and co-management arrangements create social networks of
stakeholders capable of linking knowledge to adaptive management (Berkes 2009). In
his review of collaborative conservation projects with action goals, Lauber et al (2011)
found that “successful conservation may require cultivating relationships”;
communication and informal negotiation provided legitimacy to the new information
and arranged logistics for both the science and distribution of information to
appropriate application. These self-reflective social networks proved to be key
predecessors to increasing the overall knowledge base, as “social learning provides the
foundation for technical and conceptual learning”, especially in linking that knowledge
to action (Lauber et al. 2011). This conclusion agrees with Berkes’ (2009) review that
found through opportunities for informal negotiation, these social networks and
continued communication are critical for overcoming the common challenges with
combining ways of knowing: trust, articulation, and underlying worldviews. These

183
networks are therefore necessary to see the benefits of both co-production and co-
management.
Similarly, the benefits of co-produced knowledge depend upon the dynamics
between knowledge and power. Beyond the quality of participation (Shirk et al. 2012),
the format of the knowledge also matters – potential empowerment is diminished if one
form of knowledge must be translated but not others (Raffles 2002). In her study of
collaborative fishery research, Johnson (2010) observed that boundary-spanners aid
communication across groups to ameliorate the power struggles associated with
translation (Johnson 2010). The logistics of determining how to fit knowledge from
different underlying systems together can be a challenge, but fruitful when achieved.
The second aim of this study is to use the Fisheries Resource Grant program to
investigate how the structure of a co-production relationship are related to the main
benefits to understanding of co-production (as discussed above) as it relates to the
persistent environmental problem of water quality. While the majority of Fisheries
Resource Grants are given to fishing gear development efforts, water quality provides a
case to look at the potential for collaborative research to address complex issues.
Through the potential three main benefits of co-production, collaborative research holds
promise to create solutions matching the unstructured and multifaceted nature of
wicked problems – a term that describes complex and persistent problems. In addition,

184
co-produced knowledge tends to be intricately connected with practice, possibly leading
to practical management (Weber & Khademian 2008).
4.2 The Fisheries Resource Grant Program
According to the authorizing legislation, the purpose of the FRG program is “to
work within priorities established by the Grants Committee to protect and enhance the
State’s coastal fishery resources through individual grants”. Priorities are established
every 5 years as part of Sea Grant’s strategic plan, which currently states:
“We need better information about how coastal and ocean ecosystems
function and how human activities affect these habitats and living
resources. We need citizens who understand the complexities of coastal
environments and the interactions between human use and the health of
coastal ecosystems. We need management and decision-making processes
that are based on sound information, involve everyone who benefits from
the beauty and bounty of America’s coastal resources and include
mechanisms to evaluate trade-offs between human and environmental
needs.”
The strategic plan then goes on to champion “strong partnerships with all stakeholders”
as the means to meet these goals, referring to strong participatory programs like FRG.
These strategic plan goals are where FRG derives its participation and outreach
requirements. There are no legal specifications for how success of the program is
measured.
The law authorizing the FRG program states “every proposal shall include
substantial involvement of residents of NC who are actively involved in a fishing related

185
industry. A proposal generated by a person not involved in a fishing related industry
may be eligible for funding only if the proposal includes written endorsements
supporting the project from persons or organizations representing fishing related
industries”. The initial intent of the program was to solicit project ideas grounded in
local knowledge from the fishing community to be explored with the help of scientists.
According to their website (www.ncseagrant.org/home/research/fisher-research),
the FRG program is currently administered through NC Sea Grant and “encourages
cooperative research” between the fishing industry and university researchers. The FRG
focuses on four priority research areas established by the legislature: Fisheries
Equipment and Gear, Environmental Pilot Studies, Aquaculture and Mariculture, and
Seafood Technology. According to the Request for Proposals in 2012, cooperation is
established through a collaborative primary investigator arrangement involving
“substantial involvement of NC fishers” or written endorsements from fisher
supporters. The specifics have varied over the program’s history, but the grants support
a one or two year time-frame with $20,000-$75,000 budgets. In order to meet scientific,
collaboration, and application expectations, Sea Grant staff offer proposal-writing and
final result-writing assistance for both scientists and fishers. As stated in the authorizing
legislation, “The Sea Grant College Program shall encourage preproposal conferences
among persons involved in fishing related industries and those with technical or

186
research backgrounds to work as partners in developing and writing the proposals and
in writing reports of final results”.
Proposals are reviewed by a mixed committee of 11 people: 3 Sea Grant
employees, 2 Division of Marine Fisheries employees, 2 members of the Marine Fisheries
Commission, and 1 member from each of the 4 Regional Advisory Committees. Each
member is appointed by their agency and fishers are eligible to be appointed through
the Marine Fisheries Commission or the Regional Advisory Committees.
The Fisheries Resource Grant program is part of greater North Carolina co-
management efforts that include advisory councils, agency commissions, and other
institutions designating seats at the table to ensure diverse ways of knowing. The
Fisheries Resource Grant projects directly inform the Division of Marine Fisheries
(DMF), where the program was first housed (15A NCAC 03I.0117) and where marine
water quality and habitat issues are regulated. Fishers, scientists, local industry, and “at-
large” members each are designated seats at the Marine Fisheries Commission, which is
granted authority over DMF rulemaking and implementation by the NC General
Assembly (15A NCAC 03). Similar structure is enacted for the Environmental
Management Commission, charged with freshwater quality and habitat protection and
overseeing the Division of Water Quality (DWQ) (15A NCAC 02A.104). Before major
policy changes, DMF and DWQ both host public comment periods, giving citizens each
three minutes of air time and as much written comment as desired (15A NCAC

187
03P.0300). All of these activities interact with federal guidance through the federal
fishery management councils, Atlantic States Marine Fisheries Commission, and the
Environmental Protection Agency, which also maintain avenues for diverse knowledge
contributions.
4.3 Methods
I completed a retrospective review of water quality related Fishery Resource
Grant projects using information from semi-structured interviews and document review
to meet the two aims of the study: characterizing participation and investigating the link
between the structure of participation and potential benefits. A total of 13 projects
relating to water quality and habitat (out of a total of 242 FRG projects) were identified
through a search of Sea Grant’s online archive of “FRG and water quality” followed by a
browsing of listed projects in the ‘environmental pilot’ category. The search was
restricted to projects in the last decade to ensure intact memories and discussion of
projects under the current institutional arrangement. Even with this limit, one of the
scientist primary investigators had passed away since the project was completed, but I
interviewed his scientific partner instead. Two relevant FRG projects were added later
because participants extensively discussed them. I excluded a project in which I
collaborated from the analysis due to conflict of interest. In the end, I analyzed a total of
15 projects.

188
Data were collected via interviews and review of relevant documents. For
interviews, I identified the primary investigators listed in the Sea Grant archives for each
of the projects and added other key researchers and Sea Grant staff based on discussions
with those contacts. Most projects had at least one fisher and one scientist collaborator,
as directed in the call for proposals, but two used elementary school classes as the
stakeholder party instead of a fisher. These school-aged participants were not
interviewed. Three fishers did not return my phone calls, while two others had
participated in multiple projects. The final list of interviews consists of 5 Sea Grant staff
members, 7 fishers, and 19 scientists.
The fisher and scientist primary investigators and Sea Grant staff each
participated in a semi-structured interview covering their experiences with the project,
especially with respect to researcher learning. Each interview lasted around 45 minutes
and most were performed in person, with three phone interviews conducted with those
who had moved away. Questions covered the general history of the project, learning
that took place, outreach and policy connections, and reflections on FRG program goals
and success or failure at a meta-level.
Document review started with the final report required for each project and
snowballed to include other outreach and policy products listed in that report or
identified in related interviews. One project was not yet finished, so had no documents
to review. Others each listed 3 to 11 papers, presentations, reports, testimony, etc. Some

189
of these lacked documents, i.e. they were talks, presentations, or testimony that were
unrecorded. During interviews, participants provided original proposals, powerpoint
slides for presentations, and copies of popular press articles resulting from the research.
Interviews were transcribed, then transcripts and documents were coded in
NVivo 10 (QSR International, Doncaster, Victoria, Australia) using grounded theory
(Charmaz et al. 2000). Code trees that emerged, in alphabetical order, were: connecting
to collaborator, democratizing science, FRG over time, future studies, hypothesis
generation, learning, outreach products, policy links, purpose of FRG, reception of
results, repeat FRGers, research process, scientific products, and seeding younger
participants. Results below present trends in the investigated projects supported by
representative quotes from interviews.
4.4. Results
Results address recurring themes in the data analysis preceded by a
characterization of collaboration, using Shirk et al. (2012) metrics of both quantity and
quality and adding detail as it emerges. Each of the themes represents a topic that
participants thought important to the functioning of the FRG program. Some reflect
direct questions in the discussion guide while others emerged from a variety of thought
processes.

190
4.4.1 Characterizing collaboration
Collaboration quality varies through the different stages of the scientific process,
so first the results will walk through the scientific process giving examples from each
stage. The first step in the research process is idea and hypothesis generation.
According to Sea Grant staff and several of the scientists, hypotheses are often derived
from the large amount of observation time that fishing and other maritime careers (like
ferry driving) offer. Some ideas could not be credited to either the fisher or scientist
participant, as they came from the local base of “common knowledge” (scientist DG). As
one scientific partner noted, “the idea got started in part just the fact that we talked to
fishermen” (MP). This common knowledge, though, was still digested and formed into a
scientific proposal by at least one investigator. Overall, 6 of the 15 projects were
scientist-generated, 5 were fisher-generated, and 3 were jointly generated (see table 7).
Referring to one of these joint ideas, a scientist classified the types of participatory idea
generation: “so while it wasn’t a ‘let’s sit down and brainstorm and come up with
something that we all want to work on’ it was very much a ‘we’re interested in tackling
the water quality side of an issue somehow – how might that fit together?” (scientist
LC). Contrary to trends in the FRG program at large reported by staff (SR) during the
last decade (where scientists have increasingly dominated), water quality-focused
projects have maintained an even divide of fisher and scientist-generated ideas.

191
Table 7: List of projects and who generated the idea. In the fourth project
(starred), each collaborator said the other came up with the idea.
Year Title Idea
generated
by
2010 Linking Variation in Effluent Quality to Hatching Success and
Larval Survival in Blue Crabs
Scientist
2007 An Environmental Pilot Study to Determine Causes of Water
Quality Decline in an Active Shellfish Production Area, Middens
Creek, Carteret County, NC and Development and
Implementation of Strategies to Reverse Water Quality Declines
Fisher
2007 Effects of Different Water Conservation Practices on Effluent
Reduction and Economics of Hybrid Striped Bass Production
Fisher
2007 A Total Quality System (TQS) for Grading, Traceability and
Marketing North Carolina Seafood
Not sure*
2007 Low Impact Development Pilot Study to Reduce Fecal Coliform
into Core Sound
Joint
2006 Effects of Land Use Change on Juvenile Fishes and Brown
Shrimp Abundance in North Carolina's Estuarine Nursery
Habitats
Scientist
2005 Stone Crab Mortality Rates Associated with Claw Harvest at
Varying Water Temperatures
Fisher
2005 Assessment of Blue Crab in the Cape Fear Estuary Joint
2004 The effect of water quality on nocturnal food web in the Cape
Fear River Basin
Scientist
2004 Functional Evaluation of Fish Habitat Quality: Juvenile Southern
Flounder
Scientist
2002 Determining the Role of Dead Water in the Albemarle Sound
Blue Crab Fishery
Fisher
2002 Stakeholders Perceptions of Water Quality: New Approaches to
Assessing and Responding to Public Involvement
Scientist
2001 Hypoxia and Estuarine Nursery Habitat Quality: An
Experimental and Modeling Approach Linking Low Dissolved
Oxygen with Fish Survival and Growth
Scientist
2001 Potential Impacts of Bottom Trawling on Water Column
Productivity and Sediment Transport Processes
Joint
1998 Shrimp and Crab Trawling Impacts on Estuarine Soft-Bottom
Organisms
Fisher

192
Although access to the FRG can be initiated by fishers or scientists, staff
perception is that the program overall has increasingly favored repeat grantees who
know how to write good proposals and who are often academics or from environmental
groups. In the view of one staff member:
“One of the downsides to these things is people figure out how to get the
money and the people who are really good at it tend to do better at
getting it and those tend to not be the people on the water… ideas used to
originate from those watermen and it’s not an idea originating from an
environmental group or from an academic and then saying ‘hey, do you
think this is true, well why don’t you come help me and I’ll give you
some money’”. (MT)
Sea Grant staff also thought the trend was especially true for water quality and habitat
questions (contrary to what the data in table 1 shows), which are not frequently
proposed and less frequently funded as “it’s a little removed and difficult for them to
understand so the proposals coming in, particularly from a stakeholder, that relate to
water quality are not that complicated.” (MV)
Field work is the easiest and therefore most common place to include mutual
participation or collaboration, especially with experiential and local knowledge. All but
one project that relied on historical data involved both a scientist and stakeholder in the
field. Several investigators described field time as the most enjoyable part of the project,
so willingness to participate on both ends was easy to achieve, even if the fisher was the
one directly responsible for completing fieldwork. One scientist “went out in the field

193
with them a couple times to set the temperature loggers to work in the field because I
like going out on the water, mostly” (CT). Fieldwork was also where the collaboration
made the most tangible difference in the research process, with many participants
referencing discussions on the water regarding how to structure the project around field
logistics and maintain useable data for later applications. For one project, the scientist
commented “this has been a very different process; information is coming from all these
different angles and I think most of the time… it’s not really for a lot of applied work
[like that]” (HD).
Data analysis and reporting is where the collaboration most often breaks down
according to types of expertise. Scientists focus on the task of data analysis and drawing
final conclusions based on that analysis, while fishers are tasked with deciding how to
incorporate findings into practice: “she could analyze the outcome of what I did but she
wouldn’t be able to do the fishing part because I’m the fisherman and she’s a biologist or
scientifically educated to be able to drizzle down all the information into a ‘here’s your
answer’… my job is the fieldwork and they do the desk work” (fisher JH). All fishers
wanted to see copies of results, but only two commented on them in a substantial way
before publication. In the eyes of one scientist “we gave him copies of our reports and
things like that because he was interested” (RC) but the fisher felt little ownership in
creating or amending those results.

194
This trend is most apparent in the final reports, where authorship credit to
fishers is not guaranteed. Instead, fishers’ knowledge is sometimes described as a tool to
aid research. For example, one project included the fisher’s involvement in the methods
section: “this project utilized the expertise of a local fisherman who assisted with site
selection…”, parallel to the next sentence “this project utilized a standard 20 foot tri-net”
referencing fishing gear. Of the 9 final reports turned in, 6 gave authorship credit to both
scientists and fishers, 2 did not credit the fisher, and 1 did not credit the scientist (table
8). The remaining 6 final reports were never submitted, largely from the early days of
the program (excluding the most recent, which was late but promised), and from
scientist-only authored proposals (MV). The only research products that consistently
acknowledged fisher participants as authors were industry-sponsored NC Aquaculture
Development Conference presentations, Sea Grant-sponsored FRG Colloquium talks
and Sea Grant published Coastwatch magazine articles.
Measuring along Shirk et al’s (2012) metrics for degree of participation, all
projects included participation in two or more stages of the research process and
collaborators reported frequent meetings with ample opportunity for discussion,
especially during field work. The short duration of these projects also increased intensity
with interviewees reporting frequent phone calls and shared meals to swap ideas. One
scientist effused about the necessity of intensity:

195
“We still talk regularly. Because if you don’t they tend to feel like you
were just using them to get out and get your samples or whatever. They’ll
still stop by here, they’ll come by here ‘what are you doing?’ and then
they spend an hour… and come into the lab and we made sure
everybody’s comfortable enough to come in and just start talking. And
that tends to be, I think, one of the reasons we’ve gotten along so well is
you have to invest that time. Which is the one commodity most of us
don’t have much of” (TA)
The following sections address the more intangible aspects of participation quality.
Table 8: Types of result products separated by type of authorship
Joint authorship Scientist-authored Fisher-authored
Academic journal
articles (theses)
16 (9) 1
Sea Grant reports,
outreach, and talks
9 3 1
Professional talks 3 18
Presentations to
policymakers
5 4 1
Informal education
and interactions
6 7 4
4.4.2 Learning from each other
Learning during the projects was “a valuable two-way street” (scientist JR).
Every respondent could identify what they had learned from their collaborator and vice
versa. Scientists learned 11 topics from fishers while fishers learned 10 topics from
scientists (table 9). Both quantity and variety of learned topics was comparable for each
direction of information flow. The topics extended the scientific to include increased
empathy, adaptability, and recognition that ‘fisher’ and ‘scientist’ are not single entities.

196
Three of the topics were present on both lists: how to best inform policymakers, new
methods to yield a new view of the system, and case-specific information.
Table 9: Topics participants learned from each other. Those marked with an
asterisk (*) indicate topics that appear on each list, therefore representing blended
knowledge. Numbers in the right column indicate number of participants that
mentioned that topic; totals add up to more people than respondents because some
people mentioned more than one thing.
Things Scientists Learned From Fishers Total = 11
About the fishery/full view of the system 4
Feasibility of fieldwork 4
Dealing with citizens 2
Adaptability and diversity of the fishery 2
Empathy 2
How to stand up to public officials * 2
Human behavior and risk aversion 2
New methods for fishing * 1
Case-specific information * 1
‘Fisher’ is not a single entity 1
Why applied research is important 1
Things Fishers Learned From Scientists Total = 10
Case-specific information * 4
Research methods 3
How to stand up to public officials * 3
Scientific philosophy (e.g. can’t prove a hypothesis, just disprove it) 2
Scientific process 2
How to interpret data 1
How to use statistics 1
Details of water quality 1
New methods for fishing * 1
What regulators can do 1

197
These topics identified by both groups as learned during the collaborative
process rather than a direct transfer of information from one person to another represent
‘blended knowledge’. Many interviewees mentioned that they learned how different
types of knowledge fit together, what types of knowledge are needed to see the whole
system, and how diverse experiences lead to creative solutions. One scientist described
how the knowledges fit together: “what we can do is provide that targeted test within
the framework of the broad knowledge” (MP). Participants came to appreciate that
multiple knowledges are necessary for successful problem-solving, especially through
increased creativity in potential solutions:
“it takes so many different things from the law to the science to being
politically savvy to technical issues and people tend to have their
strengths and weaknesses and when you have a group together you find
that different people have different ways to contribute… but it’s just the
creativity that it brings to the issues. Get people to think with different
perspectives in a whole different way – thinking about things could
maybe help what you’re doing register in a way you never really thought
about it” (fisher TM).
Empathy and respect again played a large role in connecting knowledge diversity with
creativity, as “what you acquire is a sensitivity to the fact that it’s a shared resource, it’s
a valuable resource and that when you think of solutions now is that you tend to widen
the options” (scientist TW). In other words, learning from each other was not restricted
to information but included context. This learned is also commonly viewed as critical to

198
project success, with several people stating “I could not have done this project without
them” (scientist CT), referring to their project partner.
4.4.3 Products of grant: science, outreach, policy
Products of the grant were difficult for investigators to remember, especially
those related to older projects. Many of the projects became part of larger research
programs and resulting products combined with those programs. Also, some of the
products people mentioned were not yet completed, but were started and waiting on a
long-term to-do list. One scientist had a stack of hundreds of posters resulting from his
project sitting in his office, with no distinct plans for how to distribute them. Only 5 of
the projects produced the 17 peer-reviewed academic publications (table 2), and though
there may be more forthcoming as a result of graduate student theses, this is far fewer
than would be expected from a scientist-only grant. By far the most common product –
academic, outreach, and policy – were presentations given in places ranging from local
schools to international meetings. According to one scientist, “it was mostly talks…
presented a few sort of public talks and then we certainly gave talks at scientific
conferences, so it was a combination of the two. I’m trying to remember” (LC). Because
people could not give specifics or even quantify the number of talks given, exact impact
is difficult to measure. Each of the 14 finished projects named at least two presentations
as a result of the project. Common forums were combined academic and industry events
like the NC Coastal Resources Commission meetings, NC Marine Fisheries Council

199
meetings, NC Aquaculture Development conference, and the FRG Colloquium, tipping
the balance of products in favor of industry and outreach.
Most investigators (13) believed that results from FRG were well-received, more
so than normal scientific results, especially when presented to varied audiences because
“the fishermen felt like they had a project they could really trust” (scientist MP). Local
trust is an important part of gaining reception as “any time you get somebody who lives
in a watershed and is an integral part of that community, talking to people about what
they might do and about the problems, it’s really the only way to very effectively
communicate because people know who you are and they trust you” (scientist BK).
Respect for collaboratively produced knowledge is increasing as people “are coming
around to the realization that fishermen possess a lot of knowledge” (scientist DG). In
addition, people “tend to receive that more positively because they think [I’ve] had to
listen to somebody else about this” (scientist LC), that the idea had already been vetted.
One person stated that the reception was positive because they “rarely have done a
project without industry participation” (DG). On the other hand, one person was unsure
about reception because they had never received feedback from their presentations. For
another, trust was not extended to a fisher working with “the enemy” (fisher HD), so
reception was no better than had it been entirely scientific. For a third, low fisher
participation led the results to be perceived as purely scientific (JL).

200
4.4.4 Role of FRG administration
The FRG program functions with a large amount of facilitation by Sea Grant
staff. Their most important role is in connecting scientists with fishers who are interested
in the same topics. This happens initially at a required workshop for applicants before
proposals are due. Sea Grant staff facilitate introductions at these meetings and
elsewhere, also linking with broader cooperative extension services offered by their host
university, NC State. According to one scientist, “the folks they have working extension
are top-notch and they’re really in touch with the community, with the fishing
community, they’re in touch with the science community. They’re a really good
facilitator of that relationship” (CT). The staff largely pulls from people they know
through past projects. Other connections occur through the Marine Fisheries
Commission and Fishery Management Plan advisory committees, where a number of
both the scientists and fishers have served. The downside to this networking strategy is
that sometimes the program is perceived as “really hard to get in to, … perhaps not an
open fair playing ground in terms of trying to break in to Sea Grant” (scientist HK)
because reviewers like funding people they know and trust (staff SR).
During the preproposal workshops, proposal review, and project
implementation, Sea Grant staff and the review panel emphasize that the projects are
applied research and therefore outreach and application are required. One scientist who
also served as a reviewer said “the biggest problem I saw with their final reports is that

201
they hadn’t done or hadn’t fully done the outreach component they said they were
going to do and I would almost every time hammer them on that” (JR) by
recommending withholding the final 25% of funding until the outreach was complete.
The review panel also suggests ways of doing extension work by offering their staff to
help make ‘Blueprints’, or fact sheets with project results, and other outreach
publications.
FRG administration has also changed and adapted over time. When the North
Carolina General Assembly first authorized the program, it was for “research really
initiated by the good idea of stakeholders, fishermen, harvesters, and others involved in
the seafood industry whereby they could get some state dollars to explore that idea…
maybe that good idea might pan out” (staff MV). The General Assembly put the
program under the direction of the Division of Marine Fisheries but DMF “made some
mistakes on how they handled the money and whether it was reality or not, it was
perceived that they were using this money simply to do their own work or cover their
own people” (staff MV). As a result, FRG moved under Sea Grant direction where “they
gave it much more rigor to how the program would run” (staff MV).
The Sea Grant staff remained adaptive, making minor but important changes as a
result of their initial experiences. There “was supposed to be regular reporting from the
investigators and maybe I got one or two and then I never got anything else… but there
were no consequences, which is something that [new staff] has worked on improving”

202
(staff BD). They have also responded to perceptions that “those pointy-headed
academicians” (scientist JR) receive more than their fair share of the grants; staff report
choosing proposals from people they know honestly want to collaborate, leading to a
number of repeat grantees.
4.4.5 Purpose of FRG
Two-thirds of interviewees thought their project was successful and each agreed
with their collaborator(s). Most used the criteria of successful outreach and application
or help to state management in order to support their assessment. These are practical
measures of evaluation, as, for example, “they had no choice but to consider it a
success… I’ll put my fish up against anybody’s fish [in the market] and it was this study
that made my fish superior” (fisher TD). A staff member had a financial metric: “it’s
supposed to have a payoff for the state investment. I think the program’s been very
successful, generally speaking” (MV). The small nature and short time frame of the
projects were credited for aiding success, as “FRG basically fits that NC need for [rapid
response], I don’t want to call them putting out fires, but hey there’s an issue coming
up… let’s go ahead and try to get an answer to this [problem]” (scientist TL).
Only one person said specifically that their project was not successful, citing little
fisher involvement and consequently little aid to management. The remaining third of
the investigators could not classify their projects as successful or unsuccessful, citing
three main reasons: the project was too short to evaluate impact, evaluating

203
participation is difficult, and the goals of the program are a moving target. One scientist
responded to the question of success with “I really can’t answer that anymore because I
think the FRG program has changed” (DG). The FRG program has structurally shifted to
foster better collaboration and communication, which made classification of success for
these investigators difficult.
4.4.6 Creating boundary spanners and broader scientific thinkers
The Sea Grant strategic plan states “developing an excellent human resource
base is critical to promoting effective research and outreach. Thus, our research funds
provide training of graduate and professional students in coastal disciplines”. This
carries over to the FRGs, which often supported graduate thesis work. FRG funds
exploratory projects, but “the budget’s way too small for most academic scientists to
take seriously… a lot of the faculty use it as ‘let’s fund this graduate student and this is
their thesis’… it’s a unique funding source” (scientist CT). Often, the graduate students
have other reasons to foster collaborations or make connections to policy, like one
project “had a PhD student who did his dissertation on this and he was doing a lot of
stuff … with keeping up with city and county officials because it was his dissertation”
(scientist JJ). In other words, the student took responsibility for ensuring needed
communication within the project and for outreach occurred.
The funds also tend to support younger fishers, especially with dependent
children possibly entering the fishery: “if [we] don’t have children or something

204
involved … [we] could care less about what [we] do… but at the time that I was doing it
I had an interest in it because it was my livelihood” (fisher HD). The grants provide
capital and support to try relatively high-risk but potentially high-reward ideas. One
aquaculturist (TD) told of his surprise when his collaborator “actually went out and
helped me dismantle a grain bin one day” as part of a story about how FRGs enable
otherwise-unsupported ideas to finally happen. Another fisher (JH) told how the grants
provide an outlet for entrepreneurial ideas in the fishing community, soliciting people to
spend time thinking what would improve the fishery and realizing how important both
research and regulations are to the future of the fishery.
Through FRG support for younger scientists and fishing families with a stake in
the future, for many FRG served as “an introduction that led to something else”
(scientist JM). The students are often the ones who keep the lines of communication
open for further research collaboration, and “students have gone out with them on other
projects, [the fishers] come by and provided comments and ideas as things have come
up” (scientist MP). These young scientists and fishers create a social network where they
“find out that they really aren’t that different people” (scientist TW). According to staff,
“the fishing partners who have been doing this all of their lives have taught scientists a
lot of stuff about practical aspects of doing research and I think that the fishing partners
have done very well with dispelling a lot of myths and folklore” (SR), bringing the
conceptual gap between fishers and scientists closer.

205
4.5 Discussion
There are two topics for discussion based on the goals of the project. First is a
characterization of collaboration and institutionally linking ways of knowing to co-
production of knowledge, following the typology of Shirk et al (2012). Second, I use the
themes emerging from the data about what participants felt important for program
function to evaluate how well FRG meets the promise of co-produced knowledge
described in the literature regarding avenues for better understanding of complex
problems (Fortmann & Ballard 2009; Reid et al. 2011; Berkes 2009).
4.5.1 Ways of knowing and co-production of knowledge
As evidenced in the FRG authorizing legislation, the NC General
Assembly structured the FRG program to facilitate idea solicitation from non-scientific
knowledge holders as a means to generate novel hypotheses and creative solutions to
long-standing fisheries issues. Though the FRG request for proposals and requirements
have shifted over time, many project ideas originate within the fishing community or
emerge through conversations between partners. This hypothesis generation tied to in-
the-field negotiation of methodology demonstrates that multiple perspectives are useful
to complete the research and tie research to action. The significant number of
participants that stated the project could not have happened without significant
contributions from both partners further supports the value of multiple ways of

206
knowing in creating qualitatively different research than would happen outside of a co-
produced knowledge situation.
Pre-existing roles of expertise appear during the data analysis and
reporting stages of the research, where fishers and scientist took clearly defined roles
based on their type of expertise. Since statistics and data interpretation are part of
scientific training, these tasks were delegated to the scientists. Connecting results to
application, outreach, feasible action steps, and other tasks perceived to be within the
realm of experiential expertise were left to the fishers. These roles were initially
established in the early days of FRG, when scientists participated more as consultants to
fishers undertaking a scientific endeavor, but continue in an unofficial capacity to today.
Authorship credit for the final products reflects these roles, as the final report and
academic publications offer authorship primarily to the scientists while public-oriented
products credited both scientists and fishers as well as graduate student assistants. This
may also reflect societal and staff expectations for information from these collaborative
projects to be in the form of a scientific report to qualify as legitimate (Kothari 2002).
Using the axes described by Shirk et al (2012), the FRG projects ranged
from collaborative to co-created, as they all had participation in multiple stages of the
research process. Most notably, information flow, as indicated by things learned,
appears to be a two-way street. The information topics learned also move beyond the
expected basics of scientific method learned by fishers and local specifics learned by

207
scientists (Maurstad 2002) to shared new knowledge amongst the groups. This new
knowledge contributed to simultaneous scientist and fisher learning and is the source of
the creativity in problem-solving mentioned by interviewees – even if that advance is
small, like the a new aquaculture setup. The emergent creativity is mediated by empathy
between the parties, as learning shifts from gaining individual facts to gaining
interactional expertise rooted in figuring out how different knowledges fit together (also
described in Collins & Evans 2002). This interactional expertise is also likely why
interviewees felt the blended knowledge was better received than either’s individual
expertise alone.
The Sea Grant staff served as a boundary organization for research
interactions by carefully orchestrating participation. The staff are often responsible for
introducing collaborators through the official workshops as well as more informal
connections. Staff members now also ensure that investigators complete their outreach
and policy obligations before final funds are disbursed and sponsor venues for
presenting or publishing results. Because many of the investigators are repeat
applicants, the staff performs these duties as part of a larger effort to cultivate a network
of collaborating researchers for contemporary water quality issues. The staff and
legislative leadership also utilizes the capability to change the rules in response to needs
such as budgetary cheating. Though some participants mentioned a frustration at the
lack of stability in program rules, the flexibility of assessing and adapting allows rapid

208
response to identified issues (Dale & Armitage 2011). Analyzing the motives behind
these changes requires investigating the incentives for managing FRG, which are also
changing with the political climate of the General Assembly. In organizational theory,
Sea Grant staff can be viewed as initiating and maintaining collaborative research
endeavors as stage one organizations to maximize the benefits of early collaboration,
including creativity, energy, and a strong role of trust in maintaining the institution
(Jawahar & McLaughlin 2001). The projects best meeting standards set by staff were also
the projects with the best quality participation, recognized by investigators when asked
to self-evaluate their project success.
FRG institutional practices aid maintenance of an FRG social network, first
through introducing investigators and then through encouraging repeat investigators
and consistently funding good collaborators. The social network of collaborative
research relationships also blends somewhat into related co-management networks.
Many of the investigators spent time on advisory councils or state commissions like the
Marine Fisheries Commission. If Sea Grant staff had not introduced collaborators, these
relationships are often where the collaboration started.
The role of Sea Grant as a managing institution is important in ensuring
the benefits of co-production, especially through social network maintenance and
knowledge management for creativity. By focusing on a committed group of younger
investigators, the FRG program creates thinkers with interactional expertise for future

209
endeavors. Almost every project supported training of at least one graduate student,
who is then trained to participate in relatively unusual scientific endeavors (more
applied) and work in collaboration with fishers. Fisher investigators are also given the
chance to try a forward-thinking entrepreneurial idea and supported in voicing their
knowledge. Both parties learn empathy and how to adapt while incorporating different
types of expertise. These new boundary spanners well-versed in the complexity of
expertise and interacting knowledges may then go on and develop boundary work
better connecting information to policy (Hoppe 2005).
4.5.2 Meeting the promise of co-production?
This study looked for three avenues for better understanding through co-
producing knowledge. The first, more relevant research design and a better
understanding of the system materialized, at least in the eyes of the investigators.
Investigators reported learning empathy for the other group of knowledge holders,
which potentially decreases conflict but alternatively may productively channel
disagreements. Collaborative research moves beyond historical differences in ways of
knowing to create an agreed-upon new set of information, not necessarily mediating
past conflict but negotiating areas of shared interest (Robinson & Wallington 2012).
Projects can be considered successful when investigators actively use the knowledge
produced (Raymond et al. 2010). Considering investigators largely decreed their own
projects successful and used the information for policy testimony and industry

210
improvements, the projects can be considered successful at productively channeling
conflict and increasing respect for other knowledges.
Addressing the second indicator of beneficial collaboration, results of
collaborative research have a different reception than either traditional scientific or
industry research. Most of these results were promoted in presentation form, be that at
academic conferences, as political testimony, or as part of public education. Investigators
thought their results were better received because the project was collaborative. There is
credibility in the information being produced and reviewed by people with different
ways of knowing as an early vetting program before the information is used in public
forums. As different ways of knowing became recognized through time and valued for
their contributions, the different types of information became seen as legitimate and
even necessary (L Fortmann & H. Ballard 2009). Given the information is trusted
through the collaborative research process, it legitimizes new sorts of interdependent
expertise in which the investigators invested increased confidence.
Finally, the third indicator of successful collaboration is a strengthened
connection to co-management. This connection manifested in two ways with the FRG
projects: through direct input into the political process and through investigators also
wielding political power through seats on advisory councils. Part of the strategic goal of
Sea Grant is to smoothly incorporate science, citizens, and policy; this is often achieved
through presentation of results to decision-making bodies such as the Division of

211
Marine Fisheries. Whether or not the decision changed as a result of this interaction, at
the very least information was transferred from investigators to decision-makers.
4.6 Conclusions
The FRG program falls somewhere between collaborative and co-
produced research as a whole, with the details of participation left up to the primary
investigators. FRG staff put conscious effort in the way the participation is conducted,
pushing projects in the direction of co-produced. Some efforts are direct, like linking the
project results as a matter of requirement to participatory policy forums throughout
state government. Some efforts may be indirect, like strengthening the legitimacy of the
new hybrid information through creating a social network around the program. Repeat
investigators and facilitated communication between participants in the program
strengthens social ties through trust. This would ordinarily be difficult in a one-year
funding cycle without implicit promise of continued commitment to ongoing efforts.
FRG also serves as an established forum to try new, potentially high-risk
ideas for persistent and wicked problems relating to fisheries in the state, like water
quality. Proposals continue to arise from diverse knowledge groups, creating the
potential for increased creativity and new approaches. Between these factors, the FRG
program fosters creative idea development, excitement, and continued entrepreneurship
in what might otherwise be stale issues (in this case, water quality). The emphasis on
hypothesis generation is laid out in the authorizing legislation for the FRG program, and

212
like many of the other outcomes, is strongly facilitated by a hands-on staff. The staff
responds to issues and adapts from year to year based on solicited feedback and
experiences from that year. Adaptation helps ensures the program cannot be captured
and steered away from the underlying mission of utilizing multiple ways of knowing.
There are also a number of benefits unrecognized in the official FRG
documentation that emerge from investigator interviews. The most prominent of these is
the seed-grant nature of the FRG in that it funds often unacknowledged graduate
students and is also used to leverage larger research programs, often still collaborative.
In the future, staff may want to figure out a way to officially credit these efforts; this
would especially help document returns on state investments. Overall, according to
investigators, the FRG program has met its documented goals and strategies and
fostered some unexpected benefits. This optimistic conclusion comes with a caveat that
this study included only successfully funded projects and self-reported information
from those projects and administrators. In light of comments that the social network
created may be what some call an ‘old boys club’, the program could conceivably create
unjust power geometries in the wider scientific and fishing communities. Yet, this
possibility is balanced by active recruitment and opportunities for entry, through pre-
proposal workshops and review panels judging on the merit of an idea. While these
would form interesting future research questions, this inward-looking case study

213
provides guidance for those considering the design of collaborative or co-produced
research programs.

214
5. Conclusions
Each chapter of this dissertation chronicles a different stage of the research
process, together documenting the different stages at which diverse ways of knowing
may contribute to water quality research and, potentially, management. Together, they
form a case study of the wicked environmental problem of water quality, showcasing
both attributes of what makes the problem wicked and potential steps toward solutions
that may be hiding within unrecognized ways of knowing.
The chapters of my dissertation roughly follow the stages of scientific research.
The fieldwork begins with chapter 2 at the very beginning of the scientific process –
observation and problem definition. Based on in-depth interviews and an ethnographic
approach, chapter 2 explores how scientists, fishers, and policymakers each characterize
water quality in coastal North Carolina. Through interviews, participant observation,
and photography, the chapter also triangulates experiences of water quality. The three
groups indicate water quality differently depending on their experiences, confirming
Adams et al. (2003) suspicion that one cannot assume a shared problem definition, even
for something as seemingly straightforward as water quality. While respondent shared
more views of water quality than not, differences emerged especially during
management implementation. Respondents also reported awareness of the need for
multiple ways of knowing and experience bases in research and management, having
encountered the positive effects of diversity in their careers.

215
Chapter 3 looks at the logistics of integrating different ways of knowing in
research. The chapter is comprised of three parts, each taking a different perspective on
a single research effort: the results of a collaborative project measuring mercury and
PCBs in local seafood, the description of a facilitated workshop undertaken to review
results and to further organize collaborators, and a first-person ethnographic account of
my role and experiences as researcher and facilitator in this collaborative model of
scientific inquiry. These three perspectives comprise the different angles from which
research programs are often evaluated: scientific results, contributions to the field, and
social impact. Chapter 3.1 offers the scientific results produced through the
collaboration, chapter 3.2 the new methods to science studies applied from system
dynamics to combine perspectives from different participants, and chapter 3.3 offers a
detailed description of how the collaboration was structured, addressing the social
relations of learning. The ethnography is especially important as it chronicles both the
successes and the challenges during the entire iterative research process and directly
addresses practical and logistical issues in collaborative research, which is needed
information contributing to future efforts at participatory science efforts at large
(Bonney et al. 2009).
Chapter 4 takes an institutional-scale look at multiple collaborative and
participatory research projects to see what institutional support for efforts like those in
Chapter 3 might look like. Such a scalar step responds to a need identified by Robbins
(2002) for “looking up” in first-world political ecology that is also needed in the related

216
scholarship of science studies. In many ways, efforts at participation and respect for
diverse ways of knowing is more well-developed in developing communities abroad
(e.g. Pretty 1995), since that is where many researchers choose to study. However, in a
country with a strong state, and particularly strong state-supported science, an
institutional perspective is critical to moving forward with any of the lessons learned
from the detailed ethnographic work like that described in chapters 2 and 3. The
Fisheries Resource Grant program, run by North Carolina Sea Grant, offered the perfect
opportunity to retrospectively evaluate collaborative projects with a broader and longer
view of the effects of such projects and social relations involved. Each project funded by
the FRG varied in the structure of collaboration and perceived success, giving insight for
new institutions as well as for improving future collaborative research within the
program (detailed in the chapter).
5.1 Contributions to Theory
This dissertation uses water quality as a case study in the realm of wicked
problems, testing co-production of knowledge as a means for achieving the “new ideas
and new directions” (Brown et al. 2010) needed to move toward solutions. While new
ideas appear to be harder to come by than new directions, co-production does offer the
“social-interaction intense strategies” (Lach et al. 2005) that are needed for future water
management. New ideas for stale problems are understandably hard to come by, a fact
made most apparent in the workshop (chapter 3) when one participant concluded “it’s
not rocket science”. However, satisfaction with the social interaction during this
workshop and expressed by investigators in Fisheries Resource Grant programs (chapter

217
4) show that people find value in collaborative processes even without producing new
information. While some new knowledge did arise through data like the mercury and
PCB maps in Chapter 3, more often the knowledge existed and needed a venue to be
recognized. This is best exemplified in the definitions of water quality – both use values
and chemical indicators are codified in the Clean Water Act, but policymakers rely
heavily on the chemical indicator definition. Ensuring representation of all perspectives
through social interaction strategies holds promise for a more comprehensive, nuanced,
and inclusive, approach to management.
The complexity and hybrid nature of water quality, crossing the nature/culture
binary, makes it a useful object for exploring the architecture of hydrosocial systems.
Swyngedouw (2004) suggests focusing on the knowledge and practice of production of a
hybrid object approximates the process by which the hydrosocial cycle is continually
reproduced and helps identify opportunities for transformative reorganization. Chapter
2 addresses how knowledge about water quality is constructed and experienced by
different types of learners. To a certain degree, this description of knowledges
establishes a foundation of possible contributions to the production of water quality
through documenting stakeholder voices. Chapter 3 and 4 then look at individual and
institutional scale cases of attempting to pull strands of those knowledges together
through co-production. This co-production has the potential to reproduce water quality
or even the entire hydrosocial organization, in a new and more favorable architecture for

218
environmental and social outcomes as the strands are pulled together in different
combinations and structures.
Ways of knowing can be difficult to categorize because knowledge groups blend
and people can belong to more than one (Agrawal 1995), therefore orchestrating
knowledge co-production efforts can be empirically difficult. Yanow (2009) warns that
different types of information should not be confused with different ways of knowing.
This caution is important in the water quality case, where the social part of the
hydrosocial is frequently ignored. It is not enough to simply add social indicators from a
scientific way of knowing; co-production instead demands different forms of knowledge
production. The section of chapter 2 describing how people experience water quality
approximates assurance that the knowledge groups are defined appropriately. The
workshop part of chapter 3 describes a method to aid co-production by pairing people
with different experiences to collectively diagram the hydrosocial cycle. This workshop,
along with the FRG program described in chapter 4 (pairing fisher and scientist
investigators for a particular project), analyze two possible ways of facilitating co-
production of knowledge. There are many other formulations, and some are better than
others in particular situations. The aim of using co-production in this dissertation was to
gain a better understanding of water quality and provide potential new approaches for
steps toward improving water quality. The workshop provided a more complete and
accepted understanding, while the research projects of the FRG program provided new
approaches to research. This suggests that multiple forms of facilitation are likely
needed to manifest the promised benefits of co-production.

219
One of the main reasons to pursue co-production of knowledge is the support it
potentially offers for successful co-management. As Wilson (2003) found in his studies of
northeastern fisheries, fisher and scientist knowledge regarding water quality is
complementary. As determined in the workshop used in this research (chapter 3),
terminology may be different but the words convey different aspects of the same
concept, such as ‘livelihoods’ and ‘quality of life’ meaning ecosystem services. The
workshop also showed that participants can match terminology and move on to a
productive discussion of the concepts together. However, agreed upon information is
not necessarily enough to transfer knowledge to policy action without some degree of
translation, as documented in other cooperative efforts (Johnson 2010). Between the
political need for the “best available science” and a heavy reliance on academic journals
to present data, ultimately the language of power is still scientific. This weak link is best
exemplified in chapter 4, where research results were required to be presented for
application by managers, but the link between transferring that information and actions
taken is still unclear. Scientists and fishers that form long-term working relationships
through FRG may form a language of their own that still does not communicate well
with decision-makers. This is an area for future research.
While I am hesitant to draw lessons learned from FRG (chapter 4) because
I didn’t talk to policymakers or other intended audiences, those who didn’t achieve
grants, or participants in the larger part of the program focused on gear or stock
research, there are a few leads should myself or someone else choose to investigate these
larger questions. Collaboration worked best around potential for shared interests (i.e.

220
water quality) and I suspect that the focus here on water quality yielded more optimistic
perspectives on collaborative research than a similar investigation of the program as a
whole would provide. Even in my own research, a thought experiment exemplifies the
need for shared interest that bolsters trust among participants: what would have
happened to the work in chapter 3 if the fish showed health-concerning levels of
mercury or PCBs? This would have opposed fisher hypotheses that the fish they sell are
clean and healthy and would likely have created conflict in deciding what to do with the
results. While conflict can signal quality collaboration (Irvin & Stansbury 2004), it can
also push participants apart and prevent further meaningful participation (May 2012).
How conflict would have structured later research relationships likely depends on how
strong the existing social network was, including levels of trust between all participants
and myself.
5.2 Recurring Themes
Although each chapter offers detailed perspective on a specific piece of the
collaborative scientific process, there are some lessons to be learned across the board.
First, there is potential in each stage for quality participation, both in terms of
willingness to contribute and necessity to gain a complete understanding of the issue at
hand. However, even best efforts to ensure equitable participation can still not work as
planned. This shows most clearly in chapter 4, when investigators are given a chance to
reflect upon the whole process. Sometimes participants simply do not want to devote
the time necessary to be involved in each stage while other times funding cycles force
shortcuts in order to finish the project on time. In chapter 3, participants also professed

221
preference for one-on-one meetings rather than a whole project group meeting. This is
reflected in other critiques of workshop methodology in which the challenges of large
group dynamics can limit participation (Cooke & Kothari 2001). Rewards and incentives
are particularly important here: usually, scientists gain some professional success from
publishing project data while fishers still maintain a full-time fishing career with the
participation fitting in as more of a hobby. In the projects here, participants who
remained through each step each had a personal business motivations for participating,
from decreasing yield loss in mariculture to developing information for a new
community-supported fishery.
One recurring indicator of success of co-production efforts is the presence and
development of interactional expertise, or “expertise in mediating between the certified
knowledge of science and the uncertified, experience-based knowledge and issue-
meanings held by [fishers], to develop purpose-built knowledge partnerships”
(Robinson & Wallington 2012a). Holders of interactional expertise fostered collegiality
between all involved and noted when translation occurred between knowledge types
that may indicate a transfer of power away from the translated group. They also know
how to navigate around the sensitivities of knowledge groups to ensure that the project
does not fall into historic pitfalls unrelated to the question of water quality. While this
dissertation started by looking at the potential contributions from a diversity of
knowledge holders (experiential, academic, political), future research should also look at
a diversity of expertise types (contributory, interactional).

222
New technologies can increase opportunities for participation in science
(Wiederhold 2011) but also be a barrier to information flow when technical expertise is
required. For water quality, laboratory methods often involve complex chemistry and
specialized, expensive equipment that cannot easily be distributed or used by the public.
As a result, participatory science investigators often turn to contract labs to complete the
methods requiring technical expertise. Because of the large expense associated with
contract labs, I solicited the help of nearby labs by offering my personal labor in return
for lab access. In other cases, there may not be a person involved with the project with
the time or money to donate to the cause. In addition, in both the case of a contract lab or
borrowed equipment, methods are determined by the host lab and negotiations happen
behind closed doors, without full project participant input. In the case of standard
methodologies like those determined by the EPA, this does not detract from
participation in the project because of the large weight given to standardized
methodologies that makes method non-negotiable. For other cases like the relatively
new extraction methods for the semi-permeable membrane devices in chapter 3, the
contract lab employed could not share proprietary methods and made some judgment
calls about which samples could be combined for analysis without consulting any of the
project’s investigators. Both cases present a communication roadblock when trying to be
completely participatory, so the use of technology should be expressly considered
during question formation at the beginning of the investigation.

223
Both the role of interactional expertise and the challenges of technology hint at
the challenge of establishing an epistemology for the project. In many ways, scientific
language is still expected when interacting with contract labs and presenting the final
scientific results. Cash (2003) includes translation with communication and mediation as
one of three necessary functions of knowledge boundary management for sustainability.
Star and Greisemer (1989) suggest two activities are central to this translation role:
standardization of methods and development of boundary objects that “are both
adaptable to different viewpoints and robust enough to maintain identity across them”.
This case had both – chemical methods of measuring water quality were taken as mostly
given through EPA authority and the water itself acted as a boundary object where
participants could inject personal experiences, value, and knowledge without
subsuming other participant perspectives. Johson (2010) warns that translation decreases
the power of the group needing their language translated, so use of boundary objects
where multiple terms continue to be used or new ones negotiated, is critical to the goal
of equal access to participation.
Normative analyses of participation often profess desire for co-production of
knowledge at each step of the scientific process. However, most participatory science
falls in the ‘contributory science’ category where participants contribute knowledge
during the field work stage and little negotiation happens outside the data collection
period of the investigation. There is desire to help science and maybe learn something
new with relatively small commitment. Several fishers in each chapter of my study

224
participated because they do ‘anything to help out a student’. There are also places
where some people felt their expertise a better fit – be that the experiential expertise of
elder fishers documenting changes in water quality over time or the statistical expertise
of scientists in analyzing the health risk of mercury present in fish. This speaks to two
recommendations stemming from my research – one is attention to comfort level in
participating and the need to raise that comfort level for parts of the scientific process
(like analysis) that seem intimidating to non-scientists. The other is the need for
opportunities to partially participate. This case study treated fishing families as
individual participants, creating the added bonus of more people available for meeting
times and validation of their contributions. Both the FRG projects and the projects in
chapter 3 offered chances for people, both scientists and fishers, to opt in and out. This is
also unusual in the efforts of participatory science, where investigations are often long-
term monitoring efforts. Originally designed this way to fit in the confines of finishing a
dissertation, participants suggested they value those options and flexibility so it felt like
a smaller commitment and offered avenues to accommodate life and fishery changes
over time.
5.3 Reflections on Interdisciplinarity
This dissertation also served as an experiment of a different sort – one
testing the possibility of interdisciplinary scholarship at the doctoral level. Functionally,
this means that research is problem-driven and uses multiple methods from different
disciplines to provide depth in understanding of a problem, rather than disciplinary
depth. This arrangement also changes the logistics of a dissertation, from designing a

225
committee to collectively advise and contribute expertise to demanding personal
interactional expertise development required to coordinate an unfamiliar group of
people and set of knowledges.
In practice, however, although my dissertation shows some evidence of
interdisciplinary scholarship, such as classes taken or diversity of disciplines in my
advisory committee, I still had to complete a dissertation that creates new knowledge in
at least one of the contributing fields, even if the novelty was really in the diversity of
approaches brought to the table. My interest in creativity in knowledge production and
background in sociology of science pushed me towards empirical questions structured
around ways of knowing and diverse participation. While currently considered
interdisciplinary, there is a growing group of what I will term ‘knowledge scholars’ who
are looking to characterize, optimize, and democratize science by connecting education
and policymaking through public participation in scientific research. I anticipate that
soon, this group will be its own discipline, as defined by annual conferences and set of
methodological approaches (such as the development of facilitation skills during
training). This begs the question – is my work really interdisciplinary or merely part of
the process of knowledge specialization process that created the disciplines of
biochemistry or other blended fields?
In addition, science studies scholars (a group to which I ascribe) are
required to be familiar with the content and methods of the science that they study.
Specifically, while doing participant observation and other ethnographic techniques, one
is also learning and performing the science itself. For me, this meant learning

226
toxicological techniques to investigate questions of seafood and water contamination.
For scholars before me, this means learning techniques of genetic modification
(Whatmore 2002) or nuclear development (Gusterson in Nader, 1996), oceanography
(Helmreich 2009) or whatever science is the focus of the study. However, this learning is
nested under larger methods in the ethnographic tradition and I still fundamentally
identify as a science studies scholar, not a toxicologist or a blend of the two.
As a result of this disciplinary positioning, I also sat between groups of
fishers and scientists, often taking on the role of boundary spanner. Balancing in the
middle required conscious decisions of how to engage each group and for how long. For
instance, scientists largely communicated by email and agreed to participate in an
interview or attend the workshop after one invitation. Fishers, on the other hand, only
communicated by phone and often did not answer the phone right away or accept the
invitation. As a result, I had to engage more of them and spend time alleviating their
suspicions. In the end, I achieved equal numbers of fisher and scientists participants for
the start of the participatory process, the interviews in chapter 2 but spent much more
time recruiting and managing fishers. While I felt this allocation of my time necessary
for my role as boundary-spanner and facilitator, it is possible that some of the scientists
did not feel they had enough of my attention because their group, on average, was more
communicative.
5.4 Applications for the Future
Recognizing my role as a researcher and the Carteret County community, I am
far from the first person to think about water quality, the complexity of water quality

227
problems, and the need for new approaches to those problems. For describing the social
networks in chapter 3, I like to use the analogy of a spider web: there was an existing
web in place that I jumped into upon starting my research. Existing relationships and
nodes shifted in response to the disturbance of a new person and new relationships were
forged through bringing attention to the node of water quality. Upon finishing,
hopefully this new configuration is strengthened to meet the goals of the community
with regards to improving understanding of local water quality and potential solutions.
By pinching the existing social networks to point toward water quality, hopefully work
will continue with renewed efforts of the people still in the network in their quest for
sustainability.
During the course of this work, I filled the role of facilitator and gained
interactional expertise necessary to become a scholar of knowledge co-production. As a
final act in the effort of collaboration, I plan on distributing the relevant chapters to
participants and interviewees, as was often requested during the course of the research.
Hopefully recommendations within will lead to tangible changes. In particular, public
participation in the state could be strengthened by eliminating the need for translation
and allowing a more diverse epistemology of water management through collaborative
research and knowledge integration techniques such as the collaborative conceptual
modeling in chapter 3. State research funds for collaborative efforts, like those in the
FRG, should also be supported in the future and expanded to incorporate some of the

228
developments highlighted in the dissertation like the need to develop interactional
expertise.
Finally, by approaching water quality as a complex problem, this research has
strengthened links to related issues in the region. The partnerships and relationships
formed and strengthened during this research can potentially be expanded to address
linked issues in tandem. In particular, I would like to continue collaborations with
the community supported fisheries, local mariculture efforts, and their educated
customers to help define the ‘environmentally sustainable fishery’ that members
want to achieve. In future research, I would also like to move up in complexity to
include multiple levels of governance and stakeholders in the upper reaches of the
watershed, who are frequently blamed for poor downstream water quality.
Swyngedouw (2004) suggests that mapping the information flow within the entire
watershed could shed light on existing power relationships and communication gaps,
both of which will structure further efforts at knowledge co-production.

229
Appendix A: Interview Guides for Chapter 2
Fisher Discussion Guide: Definition of Water Quality
PRACTICE
1. What do you value most about your life as a fisher?
2. What are the biggest challenges to an economically viable business?
3. Do you have any spatial strategies to increase yield (like traditional routes,
rotating spots, etc)?
RESOURCES
1. What species do you fish for? What factors do you use in deciding to go after
those species?
2. What resources in the area are you dependent on for a successful fishing season?
3. Have you seen the availability of those resources change over your career/life?
4. How do you feel about water quality in the area?
a. Changes you’ve observed over your career?
b. What specific water quality are you referring to (sources or
chemical names)?
c. What do you think are the top three water quality concerns for the
Sound?
d. Personal impacts faced by water quality (good or bad).
5. Who do you think is responsible for ensuring or restoring water quality
a. Are current regulations working?
b. At what scale do regulations have to be at in order to be effective?
c. Do you ever participate in their creation?
6. Do you have suggestions for better management?

230
OTHER FACTORS: DEMOGRAPHICS AND ALTERNATIVES
1. Basics: age, gender, education
2. Do you have a family history fishing?
3. Do you have a plan to face a low-yield year? What about long-term decline?
Researcher Discussion Guide: Definition of Water Quality
BASICS
1. Basics: age, gender, discipline
2. What is your main research at the moment? Has this changed over your career?
3. Do you work with fishermen or other community members as part of your
research?
PRACTICE
1. How does water quality fit into your research program?
2. In that context, how would you define water quality?
a. What would you say are the top three water quality issues for the Sound?
3. Show map What areas do you work in?
a. What areas do you feel like you can speak to regarding water quality?
WATER QUALITY AND LOCAL RESOURCES
1. How do you feel about water quality in the area?
a. What specific water quality are you referring to (sources or chemical
names)?
b. Are you relying on any particular data to draw these conclusions? If so,
do you mind sharing these data for my map?
c. Changes you’ve observed over your career?
2. How do you think water quality affects NC fisheries?

231
a. What ecological resources are important for healthy fish stocks that are
affected by water quality?
b. Can you point at particular spaces these processes are occurring on the
map?
c. Have you seen the availability of those resources change over your
career/life?
3. Who do you think is responsible for ensuring or restoring water quality?
4. How do you feel about current regulations for water quality?
a. At what scale do regulations have to be at in order to be effective?
b. Do you ever participate in their creation?
c. Do you have suggestions for better management?
Policymaker Discussion Guide: Definition of Water Quality
BASICS
1. Basics: age, gender, education, length of time in position
2. What is your main responsibility for policy at the moment?
3. Do you seek input from fishers, scientists, or other relevant citizens in
policymaking?
PRACTICE
1. How does water quality fit into your job and especially policies you are
responsible for?
2. In that context, how would you define water quality?
a. What would you say are the top three water quality issues for the Sound?
b. At what spatial scale do you think about water quality problems and
solutions? Can you give a few specific examples that you’ve been
working on lately?

232
WATER QUALITY AND LOCAL RESOURCES
3. How do you feel about water quality in Albemarle-Pamlico?
a. What specific water quality are you referring to (sources or chemical
names)?
b. Are you relying on any particular data to draw these conclusions?
i. If so, do you mind sharing these data for my map?
ii. Where do you typically gather your information from?
c. Changes you’ve observed over your career?
4. How do you think water quality affects NC fisheries?
a. Can you point at particular spaces of concern on the map?
b. Is this connection explicitly addressed through NC policies?
5. Who do you think is responsible for ensuring or restoring water quality?
6. How do you feel about current regulations for water quality?
a. At what scale do regulations have to be at in order to be effective?
b. What would an ideal set of regulations for protecting water quality look
like?

233
Appendix B: Institutions Represented in Chapter 2
Scientific
University of North Carolina – Wilmington, Center for Marine Science
University of North Carolina – Wilmington, main campus
University of North Carolina – Chapel Hill, Institute for Marine Science
University of North Carolina – Charlotte
University of North Carolina – Coastal Studies Institute
East Carolina University
North Carolina State University, Center for Marine Science and Technology
North Carolina State University
Duke University Marine Lab
Duke University, main campus
Environmental Defense Fund, Raleigh office
National Oceanographic and Atmospheric Administration, NCCOS Charleston
National Oceanographic and Atmospheric Administration, Beaufort lab
Environmental Protection Agency
North Carolina Division of Water Quality science staff
Political
Environmental Management Commission, water quality committee
Division of Coastal Management
Division of Coastal Management, CAMA permitting
Coastal Resources Commission
Division of Environmental Health
Division of Marine Fisheries
Division of Marine Fisheries, Shellfish Sanitation and Recreational Water Quality
Division of Marine Fisheries, Coastal Habitat and Protection Plan office
Marine Fisheries Commission, water quality and habitat section
Clean Water Management Trust Fund
Division of Water Quality
Division of Water Resources
Division of Water Resources, River Basin Plan committee
Division of Pollution Prevention and Environmental Assistance

234
Department of Health and Human Services, Division of Public Health, Epidemiology
Section

235
Appendix C: FRG Proposal from Chapter 3.3
FISHERY RESOURCE GRANT PROGRAM • • • • • • • • • • • • • • • • • • • • •
APPLICATION 2010 1. Project title : Is North Carolina Seafood Safe: Mercury and Polychlorinated Biphenyl Levels in NC
Seafood
2. Name of applicant(s) Dan Rittschof 3. Company (if applicable) Duke Marine Lab
4. Telephone: 252-504-7634 5. Fax number: 252-504-7634 6. E-mail address: [email protected] 7. Address: 135 Duke Marine Lab Road 8. Fishery district: North, Central, and South 9. Priority (see list): Environmental Pilot Studies and Seafood Technology as follows: - identify criteria to assess compensatory mitigation - assess effects of water quality and habitat alteration on fisheries production - develop value-added products from existing production (potentially, depending on results)
10. DMF License or Permit (# and category) _______ 11. Amount requested $50,640 12. Project dates: Beginning 6/1/2010 Completion 5/31/2011 13. List previous funding, by grant number, of other FRG and Blue Crab projects those completed and
still in progress. NC SEA GRT #03-BIOL-04#5-22351 NCSU SUBAWARD #2002-1581-22 NCSU SUBAWARD#2004-1772-15 NCSU SUBAWARD #2002-1772-16 NC SEA GRT #03-BIOL-05/#5-22352 NC SEA GRT #06-BIOL-04 NC SEA GRT #07-BIOL-03 NC SEA GRT #07-BIOL-06 NC SEA GRT #09-BIOL-03 14. Other participant(s), affiliation & complete addresses (including zip code): Amy Freitag and Josh Stoll Duke University Marine Lab 135 Pivers Island Rd Beaufort, NC 28516 Mark Hooper, Hooper Family Seafood 273 East City Rd Smyrna, NC28579
Dell Newman Newman Seafood 644 Landing Rd Swanquarter, NC 27885

236
Willy Phillips Full Circle Crab Company 1366 Highway 64 East Columbia, NC 27925 Sam Donathan Sea View Crab Company 6458 Carolina Beach Rd Wilmington, NC 28412 15. Brief summary of the situation or problem to be addressed: As concerned citizens become educated about regulatory and environmental and health issues related to the sea food supply they are using economic pressure to prompt action. One tool used by activist organizations is easy-to-use guides that suggest which seafood should be purchased and eaten and which should be avoided. Thus, by selective purchasing, concerned consumers are exerting economic pressure on the seafood industry. Most of guides, such as those produced by the Monterey Bay Aquarium, Blue Ocean Institute, and Food and Water Watch, are tailored to a national audience. These guides deter purchase of seafood important to North Carolina without regionally specific data. For example, Bon Appatite, a restaurant chain with 400 restaurants in 30 states including a franchise at Duke University in Durham NC, used the Monterey bay Aquarium Card to make its purchasing decisions. These cards suggest that eating seafood such as blue crabs is a health concern due to mercury and polychlorinated biphenyls (PCBs). However, the source data from EPA suggesting the seafood is unsafe is from work done in the Chesapeake Bay and in the Gulf of Mexico, with only a few sampling points relevant to local fishing areas in North Carolina, almost all from the Albemarle-Pamlico Sound System (http://www.epa.gov/emap/maia/html/data/estuary/9798/). In addition, the data referenced is now over 10-15 years old and may not represent changes in mercury regulation. In contrast to the highly industrialized and populated (17.5 million people) Chesapeake Bay region or the oil processing areas of the Gulf of Mexico, North Carolina has relatively low levels of industry and much smaller population centers. This study proposes to investigate fishery species in North Carolina for their mercury and PCB contents to create a state wide information base on toxin load in 8 seafood products (as opposed to the 2 offered by EPA, flounder and blue crab). There are two outcomes from this study: 1) we will know which of the 8 products are below recommended toxin loads and can use this as a marketing tool, or 2) we will identify which products contain contaminants and can address these challenges to improve the North Carolina product. We offer, that for the healthy products, this documentation would improve the competitiveness of NC seafood and could even make it marketable at higher prices. We see such documentation as equivalent to or surpassing that for organically grown fruits and vegetables. In contrast to the organic label that certifies the production process, the seafood label would certify the end product on the market. 16. Purposes (objectives) of the project: Determine Levels of mercury in 8 seafood products which grow to harvestable status within the boundaries of north Carolina: 1) softshell crabs; 2) basket blue crabs, 3) pink shrimp; 4) white shrimp; 5) oysters, 6) hard clams; 7) spot and 8) mullet. This work will be done in all three in three NC fisheries districts.
Interpret and provide the information to stakeholders and regulatory agencies. 17. What work do you intend to do, and how do you plan to accomplish it? Eight seafood products will be collected for the study: soft shell crabs, basket blue crabs, white shrimp, pink shrimp, clams, oysters, spot, and mullet. These species were chosen for their limited mobility, enabling linkages to be made directly between geography and contaminant load. We will conduct each chemical test on 600 samples, five tissue samples for each product will be collected from each of five sites in each of the three fisheries regions of North Carolina (northern, central, southern). 1200 additional samples of each type will be stored for verification or potential additional tests. It is cost effective to save these samples because we will have extra material after the preparation steps.

237
Methylmercury is the health concern associated with seafood consumption. However, since greater than 95% of mercury in fish tissue is methylmercury (Bloom 1992), total mercury is an easier and more accurate means to measure mercury exposure through fish. Total mercury will be measured according to EPA protocol #1631, which relies on cold vapor fluorescence spectrometry after complete combustion of the tissue sample. Polychlorinated biphenyls (PCBs) represent a suite of 209 congeners, each with unique health effects in the human body. For a largely exploratory study such as this one, total PCBs are the best measure of overall exposure and can provide insight for more tailored studies in the future. Total PCBs will be measured using an enzyme-linked immunosorbent assay (ELISA) methodology developed by Lasrado (2005). Tissue samples will be handled according to NCDENR’s Standard Operating Procedures for Fish Tissue Analysis so that results can inform fish consumption advisories should contamination levels be of concern. 18. Explain how your results will address the problem and/or enhance fishery resources: Our results will either enhance the fishery resource by providing documentation that the sea food is not contaminated or it will provide data that show pollution should be addressed generally or in specific regions of the state. For example, because blue crab is listed as not safe to eat, showing NC blue crab is safe to eat and adding value to the product. 19. Explain how your results will be shared with the fishing industry and other interested groups: Our results will be presented at both local fisheries meetings and at a national fisheries conference. The information will be shared within academia to promote research on potential remediation techniques, and will be made available to the producers of national seafood guides. Our main outreach efforts will focus at the state level. These data will be presented to North Carolina Sea Grant and to outreach organizations such as the North Carolina Maritime Museum (which hosts a Sustainable Seafood lecture series) and the North Carolina Aquarium and a workshop that focuses on the regional distinctness of North Carolina’s seafood. A concerted effort will also be made to share our findings with local education groups like Carteret Catch and DukeFish, both of whom interact with consumers on a daily basis. Results will be published in academic journals such as Marine Pollution Bulletin and in local news venues such as the Carteret County News-Times. Amy Freitag will present the work at regional and national meetings. Rittschof will volunteer to present the work to the fisheries council and advisory boards. In addition, data will be shared with the state’s fish tissue program, providing more regionally specific information on contamination in coastal water bodies. We will follow their standard operating procedures and continue to discuss results, which will serve as quality assurance/quality control within the fish tissue program and be used as a screening tool for making new fish tissue advisories. All data collected as part of the fish tissue program is publicly available. Expected results of low toxin loads in the fish in several of our understudied field sites, such as Carteret County, will provide extra assurance that these fish are safe to eat. Should we find levels of concern, I have received assurance from DWQ that the state would support further investigation as to sources and initiate remediation. 20. Briefly outline who will be responsible for each aspect of the work plan (attach letters from cooperators outlining their participation): Dan Rittschof will manage the project and devote two months of academic year research time to the project at no cost to Sea Grant.
Amy Freitag, third year Ph.D. student will continue on existing fellowship funding until fall and will participate in the project part time in summer without cost to the project. This project would become part of her dissertation research. She would become an RA in the fall and would be responsible for collecting and processing samples, interfacing with analytical laboratories in Durham, analyzing data and drafting reports under Rittschof's supervision. Josh Stoll, will complete his master's degree May, 2008. He would work part time in the summer assisting Rittschof and Freitag in sample collection and processing for storage. Collaborators Sam Donathan, Willy Phillips, Dell Newman, and Mark Hooper will provide samples for analysis. They will guide sample collection and suggest sites based on traditional fishing routes and

238
intensity to provide the best representation of fish on the market. They will also provide the critical link between the Duke researchers and the market, using the information to help develop the niche market of local seafood. 21. Briefly summarize the qualifications of each participant: Dan Rittschof, Lee Hill Snowdon Distinguished Professor of Ecology and member of the Duke University Integrated Toxicology program has done research on marine organisms including fish, crabs and clams for over 30 years. He has worked in toxicology for about 20 years. Amy Freitag will be a third year PhD student working on water quality issues in North Carolina waterways for her dissertation research. She has training and experience in analytical chemistry through coursework, research, and work experience. Josh Stoll Master’s in Environmental Management at Duke. He is also co-founder of the Community-Supported Fishery Walking Fish that connects Carteret County fishermen with an urban market in Durham. As a result, he is intimately acquainted with the local food market and economic implications of this research. All the fishing industry collaborators are well-respected members of the commercial fishing community in the state. Mark Hooper (central region) is also a member of Carteret Catch and Walking Fish, so linked to the local food movement and well-versed in marketing. The processing houses run by Dell Newman, Willy Phillips, and Sam Donathan also serve as social hubs within their region for people to share information and acquire any needed help in the field. 22. Budget and costs: a. Personnel costs Amy Freitag (9 months) $16,000 Joshua Stoll (2 months) 3,600 Fringe benefits 1,520 b. Travel Field travel 1,200 National Shellfisheries meeting 1,000 c. Supplies Mercury storage vials 1,000 Tissue processing supplies 800 Tissue storage containers 750 PCB Analysis kit (8 @ $1,570/ea) 12,560 Sample preparation chemicals 700 d. Equipment: N/A e. Contractual: N/A f. Other costs (itemize) Mercury analysis (Duke Facility) 6,000 Tuition remission 5,510 g. Total Project Costs $50,640
23. Budget justification and/or explanation: a. Personnel: Dan Rittschof will manage the project and devote two months of academic year research time to the project at no cost to Sea Grant. Amy Freitag, third year Ph.D. student will participate in the project part time in summer without cost to the project. This project will become part of her dissertation research. Funding is requested for her fall and spring support. She will be responsible for collecting and processing samples, interfacing with analytical laboratories in Durham, analyzing data and drafting reports under Rittschof's supervision. Josh Stoll (Master’s of Environmental Science) will work part time in the summer assisting Rittschof and Freitag in sample collection and processing for storage.

239
b. Travel: This work will be conducted at the level of accuracy used by government agencies and will be reported at the National Shell Fisheries or other appropriate National/International meeting. Funding ($1,000) is requested for Ms. Freitag to attend the National Shellfisheries meeting to present our findings from this project. Additional funding ($1,200) is requested for a rental vehicle to travel various field sites to collect samples. c. Supplies: Purchase of the supplies requested would enable us to perform the study as well as store back-up samples for verification of results and additional analysis should it be advisable. As the majority of our effort will be in sample preparation, storing extra samples is cost effective. d. Equipment: N/A e. Contractual: N/A f. Other costs: The tests for analysis of mercury will be conducted on site in Durham at a Duke facility ($6,000). For the 2010 – 2011 academic year, Fall and Spring Semester tuition remission for Ph.D. research assistants is set at $2,755 per semester. These rates are set by the Graduate School and are applied consistently across the University, regardless of funding source. Yes No
Y Did you consult with a Sea Grant or NCDMF staff member regarding this proposal? If yes, their name? _Marc Turano__________________________________
9
/11/09
X

240
Appendix D: Example Handout used in Chapter 3.3
Mercury and PCBs in North Carolina Fish
Your fish: Individual sample
Mercury (mg/kg)
PCBs (µg/kg)
Mullet
0.0049 0.0431
0.0068 0.9758
0.0041 0.5763
0.0050 0.5966
0.0056 0.7552
Averages:
Species Mercury PCBs
Mullet .0053 .5894
According to National Recommendations: EPA FDA NC Department of
Health Environmental
Defense
0.3 mg/kg mercury 50 µg/kg PCBs
1 mg/kg mercury 2000 µg/kg PCBs
0.4 mg/kg mercury 50 µg/kg PCBs
0.269 mg/kg mercury 12 µg/kg PCBs
Your fish samples are 15 times less than the EPA requirements for mercury and 7-270 times for PCBs. The state averages are about 10 times less than the EPA requirements.

241
NC Averages From This Project:

242
Compared to state average

243
Questions? Contact Amy Freitag [email protected] 135 Pivers Island Road Beaufort, NC 28516 (252) 269-4130

244
References
Adams, W.M. et al., 2003. Managing tragedies: understanding conflict over common
pool resources. Science (New York, N.Y.), 302(5652), pp.1915–6. Available at:
http://www.ncbi.nlm.nih.gov/pubmed/14671288 [Accessed July 18, 2012].
Agrawal, A., 1995. Dismantling the divide between indigenous and scientific
knowledge. Development and change, 26(3), pp.413–439.
Aiken, G.R., Hsu-Kim, H. & Ryan, J.N., 2011. Influence of Dissolved Organic Matter on
the Environmental Fate of Metals, Nanoparticles, and Colloids. Environmental
science & technology, 45(8), pp.3196–3201. Available at:
http://cat.inist.fr/?aModele=afficheN&cpsidt=24098941 [Accessed February 5, 2013].
Ainsworth, C.H., Pitcher, T.J. & Rotinsulu, C., 2008. Evidence of fishery depletions and
shifting cognitive baselines in Eastern Indonesia. Biological Conservation, 141(3),
pp.848–859. Available at: http://dx.doi.org/10.1016/j.biocon.2008.01.006 [Accessed
August 4, 2011].
Anderies, J.M., Janssen, M.A. & Ostrom, Elinor, 2004. A Framework to Analyze the
Robustness of Social-ecological Systems from an Institutional Perspective. Ecology
And Society, 9(1).
Andreatta, S. & Parlier, A., 2010. The Political Ecology of Small-Scale Commercial
Fishermen in Carteret County, North Carolina. Human Organization, 69(2), pp.180–
191.
Antweiler, C., 1998. Local Knowledge and Local Knowing: An Anthropological Analysis
of Contested “Cultural Products” in the Context of Development. Anthropos,
93(1998), pp.469–494.
Armitage, D. et al., 2011. Co-management and the co-production of knowledge:
Learning to adapt in Canada’s Arctic. Global Environmental Change, 21(3), pp.995–
1004. Available at: http://linkinghub.elsevier.com/retrieve/pii/S0959378011000665
[Accessed July 6, 2011].
Bakker, K, 2008. The ambiguity of community: Debating alternatives to private-sector
provision of urban water supply. Water Alternatives, 1(2), pp.236–252.

245
Bakker, Karen, 2005. Neoliberalizing Nature? Market Environmentalism in Water
Supply in England and Wales. Annals of the Association of American Geographers,
95(3), pp.542–565. Available at: http://www.tandfonline.com/doi/abs/10.1111/j.1467-
8306.2005.00474.x [Accessed January 23, 2012].
Bales, J.D. et al., 2003. OFR 04-1025: North Carolina District Science Plan, Available at:
http://nc.water.usgs.gov/reports/ofr041025/report.html [Accessed October 8, 2012].
Benoit, J M et al., 1998. Behavior of mercury in the Patuxent River estuary.
Biogeochemistry, 40(2), pp.249–265.
Berkes, F, 2008. Sacred ecology, Psychology Press.
Berkes, Fikret, 2009. Evolution of co-management: role of knowledge generation,
bridging organizations and social learning. Journal of environmental management,
90(5), pp.1692–702. Available at: http://www.ncbi.nlm.nih.gov/pubmed/19110363
[Accessed March 11, 2012].
Bethel, M.B. et al., 2011. Blending Geospatial Technology and Traditional Ecological
Knowledge to Enhance Restoration Decision-Support Processes in Coastal
Louisiana. Journal of Coastal Research, 27, pp.555–571. Available at:
http://www.bioone.org/doi/abs/10.2112/JCOASTRES-D-10-00138.1 [Accessed March
7, 2012].
Bonney, R. et al., 2009. Public Participation in Scientific Research : Defining the Field and
Assessing Its Potential for Informal Science Education, Washington DC.
Borowski, I. & Hare, M., 2006. Exploring the Gap Between Water Managers and
Researchers: Difficulties of Model-Based Tools to Support Practical Water
Management. Water Resources Management, 21(7), pp.1049–1074.
Brown, J.S., Collins, a. & Duguid, P., 1989. Situated Cognition and the Culture of
Learning. Educational Researcher, 18(1), pp.32–42. Available at:
http://edr.sagepub.com/cgi/doi/10.3102/0013189X018001032 [Accessed August 4,
2011].
Brown, S.S. et al., 2000. Effects of Sediment Contaminants and Environmental Gradients
on Macrobenthic Community Trophic Structure in Gulf of Mexico Estuaries.
Estuaries, 23(3), p.411. Available at:
http://www.springerlink.com/content/6422778650280550/ [Accessed September 23,
2011].

246
Brown, V.A., Harris, J.A. & Russell, J.Y., 2010. Tackling wicked problems through the
transdisciplinary imagination, Earthscan. Available at:
http://books.google.com/books?id=Evgk1z2SAeAC&pgis=1 [Accessed March 29,
2012].
Buizer, M., Arts, B. & Kok, K., 2011. Governance , Scale and the Environment : The
Importance of Recognizing Knowledge Claims in Transdisciplinary Arenas. Ecology
And Society.
Bullard, R.D., 1992. Threat of Environmental Racism, The. Natural Resources &
Environment, 7. Available at:
http://heinonline.org/HOL/Page?handle=hein.journals/nre7&id=169&div=&collectio
n=journals [Accessed October 4, 2011].
Bumpus, D.F., 1954. The circulation over the continental shelf south of Cape Hatteras.
Available at:
http://oai.dtic.mil/oai/oai?verb=getRecord&metadataPrefix=html&identifier=AD004
0209 [Accessed October 17, 2012].
Bunch, M.J. et al., 2011. Promoting Health and Well-Being by Managing for Social –
Ecological Resilience : the Potential of Integrating Ecohealth and Water Resources.
Ecology And Society, 16(1).
Burger, J., Stern, A.H. & Gochfeld, M., 2005. Mercury in commercial fish: optimizing
individual choices to reduce risk. Environmental health perspectives, 113(3), pp.266–
71. Available at:
http://www.pubmedcentral.nih.gov/articlerender.fcgi?artid=1253750&tool=pmcentr
ez&rendertype=abstract [Accessed September 15, 2011].
Burkholder, J.M. et al., 1992. New “phantom” dinoflagellate is the causative agent of
major estuarine fish kills. Nature, 358(6385), pp.407–10. Available at:
http://www.nature.com/nature/journal/v358/n6385/pdf/358407a0.pdf [Accessed
July 17, 2012].
Callon, M., 1995. Four models for the dynamics of science. Handbook of science and
technology studies, pp.29–63.
Campbell, L.M. & Meletis, Z.A., 2011. Agreement on water and a watered-down
agreement: The political ecology of contested coastal development in Down East,
North Carolina. Journal of Rural Studies, 27(3), pp.308–321. Available at:
http://dx.doi.org/10.1016/j.jrurstud.2011.06.002 [Accessed March 29, 2012].

247
Cash, D. W., 2006. Countering the Loading-Dock Approach to Linking Science and
Decision Making: Comparative Analysis of El Nino/Southern Oscillation (ENSO)
Forecasting Systems. Science, Technology & Human Values, 31(4), pp.465–494.
Available at: http://sth.sagepub.com/cgi/doi/10.1177/0162243906287547 [Accessed
July 30, 2012].
Cash, David W et al., 2003. Knowledge systems for sustainable development. Proceedings
of the National Academy of Sciences, 100(14), pp.8086–91. Available at:
http://www.ncbi.nlm.nih.gov/pubmed/19892739.
Castilla, J.C. & Defeo, O., 2001. Latin American benthic shellfisheries : emphasis on co-
management and experimental practices. Reviews in Fish Biology and Fisheries, (c),
pp.1–30.
Charmaz, K., Denzin, N.K. & Lincoln, Y.S., 2000. Handbook of qualitative research.
Thousand Oaks.
Christie, P., 2011. Creating space for interdisciplinary marine and coastal research: five
dilemmas and suggested resolutions. Environmental Conservation, 38(02), pp.172–
186. Available at: http://www.journals.cambridge.org/abstract_S0376892911000129
[Accessed September 19, 2011].
Clement, F., 2009. Analysing decentralised natural resource governance: proposition for
a “politicised” institutional analysis and development framework. Policy Sciences,
43(2), pp.129–156. Available at: http://www.springerlink.com/index/10.1007/s11077-
009-9100-8 [Accessed July 30, 2011].
Coleman, W.D. & Bernstein, S.F., 2009. Unsettled Legitimacy: Political Community, Power,
and Authority in a Global Era, UBC Press. Available at:
http://books.google.com/books?id=JTDbXY1se_wC&pgis=1 [Accessed September
11, 2012].
Collins, H.M. & Evans, R., 2002. The Third Wave of Science Studies: Studies of Expertise
and Experience. Social Studies of Science, 32(2), pp.235–296. Available at:
http://sss.sagepub.com/cgi/doi/10.1177/0306312702032002003 [Accessed July 19,
2011].
Commission, C.B., 2011. Chesapeake Bay Commission 2011: Policy for the Bay,

248
Cooke, B. & Kothari, U., 2001. Participation: the New Tyranny?, Zed Books. Available at:
http://books.google.com/books?hl=en&lr=&id=aoeTa0OWDnMC&pgis=1 [Accessed
November 14, 2012].
Courtemanch, D.L., Davies, S.P. & Laverty, E.B., 1989. Incorporation of biological
information in water quality planning. Environmental Management, 13(1), pp.35–41.
Cronon, W., 1996. The Trouble with Wilderness: Or, Getting Back to the Wrong Nature.
Environmental History, 1(1), pp.7–28.
Crutzen, P.J., 2002. Geology of mankind. Nature, 415(6867), p.23. Available at:
http://www.ncbi.nlm.nih.gov/pubmed/11780095.
Cvetkovich, G. & Earle, T.C., 1994. The Construction of Justice: A Case Study of Public
Participation in Land Management. Journal of Social Issues, 50(3), pp.161–178.
Available at: http://doi.wiley.com/10.1111/j.1540-4560.1994.tb02425.x.
Dale, A. & Armitage, D., 2011. Marine mammal co-management in Canada’s Arctic:
Knowledge co-production for learning and adaptive capacity. Marine Policy, 35(4),
pp.440–449. Available at:
http://linkinghub.elsevier.com/retrieve/pii/S0308597X1000206X [Accessed March 14,
2012].
Daniell, K.A. et al., 2010. Co-engineering Participatory Water Management Processes :
Theory and. Ecology And Society, 15(4).
Dierking, J. et al., 2009. Spatial patterns in PCBs, pesticides, mercury and cadmium in
the common sole in the NW Mediterranean Sea, and a novel use of contaminants as
biomarkers. Marine pollution bulletin, 58(11), pp.1605–14. Available at:
http://dx.doi.org/10.1016/j.marpolbul.2009.07.008 [Accessed September 23, 2011].
Doesken, N. & Reges, H., 2010. The Value of the Citizen Weather Observer. , pp.37–41.
Eby, L.A. & Crowder, L.B., 2002. Hypoxia-based habitat compression in the Neuse River
Estuary: context-dependent shifts in behavioral avoidance thresholds. Canadian
Journal of Fisheries and Aquatic Sciences, 59(6), pp.952–965.
EDF, 2011. Designating Seafood a Health Alert. Available at:
http://apps.edf.org/page.cfm?tagID=16263 [Accessed October 18, 2012].

249
Ellis, E.C. & Ramankutty, N., 2008. Putting people in the map: anthropogenic biomes of
the world. Frontiers in Ecology and the Environment, 6(8), pp.439–447.
Ellis, R. & Waterton, C., 2005. Caught between the cartographic and the ethnographic
imagination: the whereabouts of amateurs, professionals, and nature in knowing
biodiversity. Environment and Planning D, 23(5), p.673.
EPA, 2009. Coastal Fish Tissue Contaminants. Available at:
http://cfpub.epa.gov/eroe/index.cfm?fuseaction=detail.viewInd&lv=list.listByAlpha
&r=188214&subtop=405.
EPA, 2010a. Health Effects | Mercury. Available at: http://www.epa.gov/hg/effects.htm
[Accessed September 15, 2011].
EPA, 2010b. Health Effects| Polychlorinated Biphenyls (PCBs). Available at:
http://www.epa.gov/epawaste/hazard/tsd/pcbs/pubs/effects.htm [Accessed
September 15, 2011].
EPA, 2002. Method 1631, Revision E: Mercury in Water by Oxidation, Purge and Trap, and
Cold Vapor Atomic Fluorescence Spectrometry,
Etherington, L.L. & Eggleston, D.B., 2000. Large-scale blue crab recruitment : linking
postlarval transport , post-settlement planktonic dispersal , and multiple nursery
habitats. Marine Ecology Progress Series, 204(Pulliam 1988), pp.179–198.
Evans, R.D., 1986. Sources of mercury contamination in the sediments of small
headwater lakes in south-central Ontario, Canada. Archives of Environmental
Contamination and Toxicology, 15(5), pp.505–512. Available at:
http://www.springerlink.com/content/r327w8116187mqm9/ [Accessed September
15, 2011].
Fairhead, J. & Leach, M., 1996. Misreading the African landscape: society and ecology in a
forest-savanna mosaic, Cambridge Univ Pr.
Fairhead, J. & Leach, M., 2003. Science, society and power: environmental knowledge and
policy in West Africa and the Caribbean, Cambridge Univ Pr.
FDA, 2000. Chemical Contaminants and Pesticides - Guidance for Industry: Action
Levels for Poisonous or Deleterious Substances in Human Food and Animal Feed.
Available at:
http://www.fda.gov/Food/GuidanceComplianceRegulatoryInformation/GuidanceD

250
ocuments/ChemicalContaminantsandPesticides/ucm077969.htm#merc [Accessed
October 18, 2012].
Fischer, F., 2002. Citizens, experts, and the environment: The politics of local knowledge.
Planning Theory & Practice, 3(2), pp.249–255.
Forsyth, T., 2003. Critical political ecology: The politics of environmental science, Psychology
Press.
Fortmann, L & Ballard, H., 2009. Sciences, knowledges, and the practice of forestry.
European Journal of Forest Research, pp.1–11.
Fortmann, Louise, 1996. Gendered Knowledge: Rights and Space in Two Zimbabwe
Villages. In Feminist Political Ecology: Global Issues and Local Experiences. London:
Routledge, pp. 211–23.
Freitag, A. et al., 2012. The geography of mercury and PCBs in North Carolina’s local
seafood. Marine pollution bulletin, 64(7), pp.1330–8. Available at:
http://www.ncbi.nlm.nih.gov/pubmed/22658912 [Accessed November 13, 2012].
Gallardo, J.H. & Stein, T. V., 2007. Participation, Power and Racial Representation:
Negotiating Nature-Based and Heritage Tourism Development in the Rural South.
Society & Natural Resources, 20(7), pp.597–611. Available at:
http://www.tandfonline.com/doi/abs/10.1080/08941920701216545 [Accessed January
3, 2012].
Gardner, H. & Hatch, T., 1989. Educational Implications of the Theory of Multiple
Intelligences. Educational Researcher, 18(8), pp.4–10. Available at:
http://edr.sagepub.com/cgi/doi/10.3102/0013189X018008004 [Accessed October 17,
2011].
Garrity-blake, B.J. & Nash, B., 2007. An Inventory of North Carolina Fish Houses,
George, A.L. & Bennett, A., 2005. Case studies and theory development in the social sciences,
MIT Press. Available at: http://books.google.com/books?id=JEGzE6ExN-gC&pgis=1
[Accessed March 12, 2012].
Gerhardinger, L.C., Godoy, E. a. S. & Jones, P.J.S., 2009. Local ecological knowledge and
the management of marine protected areas in Brazil. Ocean & Coastal Management,
52(3-4), pp.154–165. Available at:

251
http://linkinghub.elsevier.com/retrieve/pii/S096456910800166X [Accessed August 3,
2011].
Gibbs, M., 2001. Toward a Strategy for Undertaking Cross-Cultural Collaborative
Research. Society and Natural Resources, 14, pp.673–687.
Giglioli, I. & Swyngedouw, E., 2008. Let’s Drink to the Great Thirst! Water and the
Politics of Fractured Techno-natures in Sicily. International Journal of Urban and
Regional Research, 32(2), pp.392–414.
Goodman, E.J., 2000. Indian Tribal Sovereignty and Water Resources: Watersheds,
Ecosystems and Tribal Co-Management. Journal of Land, Resources, & Environmental
Law, 20. Available at:
http://heinonline.org/HOL/Page?handle=hein.journals/lrel20&id=191&div=&collecti
on=journals [Accessed March 30, 2012].
Gopnik, M. et al., 2012. Coming to the table: Early stakeholder engagement in marine
spatial planning. Marine Policy, 36(5), pp.1139–1149. Available at:
http://linkinghub.elsevier.com/retrieve/pii/S0308597X1200019X [Accessed April 27,
2012].
Graham, M.H. & Dayton, P.K., 2002. ON THE EVOLUTION OF ECOLOGICAL IDEAS :
Paradigms and the Scientific Process. Ecology, 83(6), pp.1481–1489.
Grandjean, P. et al., 2001. Neurobehavioral deficits associated with PCB in 7-year-old
children prenatally exposed to seafood neurotoxicants. Neurotoxicology and
Teratology, 23(4), pp.305–317. Available at: http://dx.doi.org/10.1016/S0892-
0362(01)00155-6 [Accessed September 15, 2011].
Grandjean, P. et al., 1995. Relation of a seafood diet to mercury, selenium, arsenic, and
polychlorinated biphenyl and other organochlorine concentrations in human milk.
Environmental research, 71(1), pp.29–38. Available at:
http://dx.doi.org/10.1006/enrs.1995.1064 [Accessed September 15, 2011].
Gratani, M. et al., 2011. Is Validation of Indigenous Ecological Knowledge a
Disrespectful Process? A Case Study of Traditional Fishing Poisons and Invasive
Fish Management from the Wet Tropics, Australia. Ecology and Society, 16(3).
Available at: http://www.ecologyandsociety.org/vol16/iss3/art25/.
Griffith, D.C., 1999. The estuary’s gift: an Atlantic Coast cultural biography, Pennsylvania
State Univ Pr.

252
Gunderson, L. & Holling, C.S., 2002. Panarchy Synopsis: Understanding Transformations in
Human and Natural Systems, Island Pr.
Hanak, E. et al., 2011. Managing California’s Water: From Conflict to Reconciliation, Public
Policy Instit. of CA. Available at:
http://books.google.com/books?hl=en&lr=&id=90hLp8aGrgIC&pgis=1 [Accessed
March 21, 2013].
Haraway, D., 1991. Simians, cyborgs, and women: the reinvention of nature, New York, NY:
Routledge.
Heikkila, T. & Gerlak, A.K., 2005. The Formation of Large-scale Collaborative Resource
Management Institutions: Clarifying the Roles of Stakeholders, Science, and
Institutions. Policy Studies Journal, 33(4), pp.583–612. Available at:
http://doi.wiley.com/10.1111/j.1541-0072.2005.00134.x.
Hicks, D., Pivarnik, L. & McDermott, R., 2008. Consumer perceptions about seafood - an
Internet survey. Journal of Foodservice, 19(4), pp.213–226. Available at:
http://doi.wiley.com/10.1111/j.1748-0159.2008.00107.x [Accessed August 5, 2011].
Hilgartner, S., 2002. Science on stage: Expert advice as public drama. New Genetics and
Society, 21(2).
Hillery, B.R. et al., 1997. Temporal and Spatial Trends in a Long-Term Study of Gas-
Phase PCB Concentrations near the Great Lakes. Environmental Science &
Technology, 31(6), pp.1811–1816. Available at: http://dx.doi.org/10.1021/es960990h
[Accessed September 23, 2011].
Hinton, D., 1998. CALFED Phase II Interim Report: Watershed Management.
Hoppe, R., 2005. Rethinking the science-policy nexus: from knowledge utilization and
science technology studies to types of boundary arrangements. Poiesis & Praxis,
3(3), pp.199–215. Available at: http://www.springerlink.com/index/10.1007/s10202-
005-0074-0 [Accessed July 20, 2012].
Horton, T., 2008. GROWING ! GROWING ! GONE ! The Chesapeake Bay and the Myth of
Endless Growth,
Hotchkiss, A.K. et al., 2008. Fifteen years after “Wingspread”--environmental endocrine
disrupters and human and wildlife health: where we are today and where we need
to go. Toxicological sciences : an official journal of the Society of Toxicology, 105(2),

253
pp.235–59. Available at:
http://www.pubmedcentral.nih.gov/articlerender.fcgi?artid=2721670&tool=pmcentr
ez&rendertype=abstract [Accessed August 23, 2011].
Huntington, H.P., 2000. USING TRADITIONAL ECOLOGICAL KNOWLEDGE IN
SCIENCE : METHODS AND APPLICATIONS. Ecological Applications, 10(5),
pp.1270–1274.
Imperial, M.T. & Hennessey, T.M., 1996. An ecosystem‐based approach to managing
estuaries: An assessment of the National Estuary program. Coastal Management,
24(2), pp.115–139. Available at: http://dx.doi.org/10.1080/08920759609362286
[Accessed September 26, 2012].
Ingram, H. & Lejano, R.P., 2010. Transitions: transcending multiple ways of knowing
water resources in the United States. In Water Policy Entrepreneurs: A Research
Companion to Water Transitions Around the Globe. pp. 77–94.
Irvin, R. a. & Stansbury, J., 2004. Citizen Participation in Decision Making: Is It Worth
the Effort? Public Administration Review, 64(1), pp.55–65. Available at:
http://doi.wiley.com/10.1111/j.1540-6210.2004.00346.x.
Irwin, A., 1995. Citizen Science: A Study of People, Expertise, and Sustainable Development,
Psychology Press. Available at:
http://books.google.com/books/about/Citizen_Science.html?id=MFiuIsC5hAUC
[Accessed January 17, 2013].
Jacquet, J. & Pauly, D., 2007. The rise of seafood awareness campaigns in an era of
collapsing fisheries. Marine Policy, 31(3), pp.308–313. Available at:
http://dx.doi.org/10.1016/j.marpol.2006.09.003 [Accessed August 4, 2011].
Jasanoff, S., 2004. States of knowledge: the co-production of science and social order, Routledge.
Jasanoff, S., 2003. Technologies of Humility: Citizen Participation in Governing Science.
Minerva, 41(3), pp.223–244. Available at:
http://link.springer.com/article/10.1023/A:1025557512320 [Accessed December 4,
2012].
Jawahar, I.M. & McLaughlin, G.I., 2001. Toward a Descriptive Stakeholder Theory: An
Organizational Life Cycle Approach. The Academy of Management Review, 26(3),
pp.397–414.

254
Jentoft, S., 2000. The community : a missing link of " sheries management. Marine Policy,
24, pp.53–59.
Jentoft, S., McCay, B.J. & Wilson, D C, 1998. Social theory and fisheries co-management.
Marine Policy, 22(4-5), pp.423–436.
Johnson, T.R., 2010. Cooperative research and knowledge flow in the marine commons.
International Journal of the Commons, 4(1), pp.251–272. Available at:
http://www.thecommonsjournal.org/index.php/ijc/article/view/URN:NBN:NL:UI:1
0-1-100211/110 [Accessed September 23, 2012].
Johnson, T.R., 2011. Fishermen, Scientists, and Boundary Spanners: Cooperative
Research in the U.S. Illex Squid Fishery. Society & Natural Resources, 24(3), pp.242–
255. Available at: http://www.tandfonline.com/doi/abs/10.1080/08941920802545800
[Accessed April 18, 2012].
K Greenfield, B. et al., 2011. Predicting mercury levels in yellow perch: use of water
chemistry, trophic ecology, and spatial traits. Available at:
http://www.nrcresearchpress.com/doi/abs/10.1139/f01-088 [Accessed September 23,
2011].
Kamman, N.C. et al., 2005. Mercury in Freshwater Fish of Northeast North America ? A
Geographic Perspective Based on Fish Tissue Monitoring Databases. Ecotoxicology,
14(1-2), pp.163–180. Available at:
http://www.springerlink.com/content/u4142h3252036331/ [Accessed August 4,
2011].
Karnieli-Miller, O., Strier, R. & Pessach, L., 2009. Power relations in qualitative research.
Qualitative health research, 19(2), pp.279–89. Available at:
http://www.ncbi.nlm.nih.gov/pubmed/19150890 [Accessed June 15, 2011].
Kearney, J. et al., 2007. The Role of Participatory Governance and Community-Based
Management in Integrated Coastal and Ocean Management in Canada. Coastal
Management, 35(1), pp.79–104. Available at:
http://www.tandfonline.com/doi/abs/10.1080/10.1080/08920750600970511 [Accessed
September 4, 2011].
Keller, A. a & Cavallaro, L., 2008. Assessing the US Clean Water Act 303(d) listing
process for determining impairment of a waterbody. Journal of Environmental
Management, 86(4), pp.699–711. Available at:
http://www.ncbi.nlm.nih.gov/pubmed/17270339 [Accessed September 5, 2012].

255
Kim, E.-H. et al., 2006. The impact of resuspension on sediment mercury dynamics, and
methylmercury production and fate: A mesocosm study. Marine Chemistry, 102(3-4),
pp.300–315. Available at:
http://linkinghub.elsevier.com/retrieve/pii/S0304420306001022 [Accessed March 15,
2013].
Kline, B., 2011. First along the river: a brief history of the U.S. environmental
movement (Google eBook), Rowman & Littlefield. Available at:
http://books.google.com/books?id=HDp0re4UrBUC&pgis=1 [Accessed March 30,
2012].
Knapp, C.N. et al., 2011. Using Participatory Workshops to Integrate State-and-
Transition Models Created With Local Knowledge and Ecological Data. Rangeland
Ecology & Management, 64(2), pp.158–170. Available at:
http://www.bioone.org/doi/abs/10.2111/REM-D-10-00047.1 [Accessed March 2,
2012].
Knobeloch, L. et al., 2005. Fish consumption, advisory awareness, and hair mercury
levels among women of childbearing age. Environmental research, 97(2), pp.220–7.
Available at: http://dx.doi.org/10.1016/j.envres.2004.07.001 [Accessed August 5,
2011].
Von Korff, Y. et al., 2012. Implementing Participatory Water Management : Recent
Advances in Theory , Practice , and Evaluation. Ecology And Society, 17(1).
Kothari, B., 2002. Theoretical streams in Marginalized Peoples ’ Knowledge ( s ):
asystems , and Subaltern Knowledge ( s ) Systems ,. Agriculture and Human Values,
19, pp.225–237.
Kreuter, M.W. et al., 2004. Understanding wicked problems: a key to advancing
environmental health promotion. Health education & behavior : the official publication
of the Society for Public Health Education, 31(4), pp.441–54. Available at:
http://www.ncbi.nlm.nih.gov/pubmed/15296628 [Accessed March 13, 2012].
Lach, D., Rayner, S. & Ingram, H., 2005. Taming the water: strategies to domesticate the
wicked problems of water resource management. International Journal of Water, 3(1).
Lasrado, J.A. et al., 2003. Determination of PCBs in Fish Using Enzyme linked
Immunosorbent Assay (ELISA). Journal of Food Science, 68(1), pp.133–136.

256
Latour, B., 2005. Reassembling the social: an introduction to actor-network-theory (Google
eBook), Oxford University Press. Available at:
http://books.google.com/books?id=DlgNiBaYo-YC&pgis=1 [Accessed March 14,
2012].
Lauber, T.B. et al., 2011. Linking knowledge to action in collaborative conservation.
Conservation biology : the journal of the Society for Conservation Biology, 25(6), pp.1186–
94. Available at: http://www.ncbi.nlm.nih.gov/pubmed/21967145 [Accessed March
28, 2012].
Lazorchak, J.M. et al., 2003. Contamination of fish in streams of the Mid-Atlantic Region:
An approach to regional indicator selection and wildlife assessment. Environmental
Toxicology and Chemistry, 22(3), pp.545–553. Available at:
http://doi.wiley.com/10.1002/etc.5620220312 [Accessed September 23, 2011].
Leigh Star, S., 2010. This is Not a Boundary Object: Reflections on the Origin of a
Concept. Science, Technology & Human Values, 35(5), pp.601–617. Available at:
http://sth.sagepub.com/cgi/doi/10.1177/0162243910377624 [Accessed October 27,
2012].
Lejano, R.P. & Ingram, H., 2009. Collaborative networks and new ways of knowing.
Environmental Science & Policy, 12(6), pp.653–662. Available at:
http://linkinghub.elsevier.com/retrieve/pii/S1462901108001093 [Accessed March 6,
2012].
Lindberg, S. et al., 2007. A Synthesis of Progress and Uncertainties in Attributing the
Sources of Mercury in Deposition. AMBIO: A Journal of the Human Environment,
36(1), pp.19–33. Available at: http://dx.doi.org/10.1579/0044-
7447(2007)36[19:ASOPAU]2.0.CO;2 [Accessed September 15, 2011].
Linton, J., 2008. Is the Hydrologic Cycle Sustainable? A Historical–Geographical Critique
of a Modern Concept. Annals of the Association of American Geographers, 98(3),
pp.630–649. Available at:
http://www.tandfonline.com/doi/abs/10.1080/00045600802046619 [Accessed
September 19, 2011].
Lowe, J.I. et al., 1972. Effects of the polychlorinated biphenyl Aroclor� 1254 on the
American oyster Crassostrea virginica. Marine Biology, 17(3), pp.209–214. Available
at: http://www.springerlink.com/content/vn80q26771640x6l/ [Accessed September
23, 2011].

257
St. Martin, K., 2006. The impact of “community” on fisheries management in the US
Northeast. Geoforum, 37(2), pp.169–184.
Martínez-Abraín, A., 2007. Are there any differences? A non-sensical question in
ecology. Acta Oecologica, 32(2), pp.203–206. Available at:
http://dx.doi.org/10.1016/j.actao.2007.04.003 [Accessed March 11, 2012].
Maurstad, A., 2002. Fishing in murky watersFethics and politics of research on fisher
knowledge. Marine Policy, 26, pp.159–166.
May, C.K., 2012. Active non-participation among local natural resource-dependent
communities: the case of North Carolina fisheries governance. Journal of
environmental management, 113, pp.407–16. Available at:
http://www.ncbi.nlm.nih.gov/pubmed/23092935 [Accessed February 7, 2013].
McCarthy, J., 2002. First World political ecology: lessons from the Wise Use movement.
Environment and planning A, 34(7), pp.1281–1302.
McCormick, S., 2007. Democratizing Science Movements: A New Framework for
Mobilization and Contestation. Social Studies of Science, 37(4), pp.609–623. Available
at: http://sss.sagepub.com/cgi/content/abstract/37/4/609 [Accessed September 13,
2011].
Mcinerny, S. & Bianchi, A.J., 2009. An Economic Profile Analysis of the Commercial Fishing
Industry of North Carolina Including Profiles for Interjurisdictionally-Managed Species,
Meijer, S.N. et al., 2003. Spatial and Temporal Trends of POPs in Norwegian and UK
Background Air: Implications for Global Cycling. Environmental Science &
Technology, 37(3), pp.454–461. Available at:
http://pubs.acs.org/doi/abs/10.1021/es025620+ [Accessed September 23, 2011].
Miller, T., 2005. Appendix B1: Coastal Habitat Protection Plan Meeting Data Analysis,
Miller-Rushing, A., Primack, R. & Bonney, R., 2012. The history of public participation in
ecological research. Frontiers in Ecology and the Environment, 10(6), pp.285–290.
Available at: http://www.esajournals.org/doi/abs/10.1890/110278 [Accessed
November 12, 2012].
Mirabilio, S., 2005. Utilization of Cultural Models and Collaborative Learning to
Advance Management of the North Carolina Blue Crab Fishery. , (NRLI 04
Practicum Report), p.18.

258
Mueller, M., Tippins, D. & Bryan, L., 2012. The Future of Citizen Science. Democracy and
Education, 20(1).
Murphy, T.J. et al., 1985. Polychlorinated biphenyl emissions to the atmosphere in the
Great Lakes region. Municipal landfills and incinerators. Environmental Science &
Technology, 19(10), pp.942–946. Available at: http://dx.doi.org/10.1021/es00140a009
[Accessed September 15, 2011].
Nadasdy, P., 1999. The politics of TEK: Power and the“ integration” of knowledge. Arctic
Anthropology, pp.1–18.
NCDENR, 2012. NCDENR - Classification and Standards Unit: Classifications. Available
at: http://portal.ncdenr.org/web/wq/ps/csu/classifications [Accessed March 30,
2012].
Neis, B. et al., 1999. Fisheries assessment: what can be learned from interviewing
resource users? Canadian Journal of Fisheries and Aquatic Sciences, 56(10), pp.1949–
1963.
Newell, B. & Proust, K., 2009. I See How You Think : Using Influence Diagrams to
Support Dialogue. , pp.1–5.
Newman, G. et al., 2011. The art and science of multi-scale citizen science support.
Ecological Informatics, 6(3-4), pp.217–227. Available at:
http://linkinghub.elsevier.com/retrieve/pii/S157495411100029X [Accessed October 8,
2012].
North, D.C., 1990. Institutions, Institutional Change and Economic Performance, Cambridge
University Press. Available at:
http://books.google.com/books?hl=en&lr=&id=oFnWbTqgNPYC&pgis=1 [Accessed
January 31, 2013].
Nowotny, H., 2003. Democratising expertise and socially robust knowledge. Science and
Public Policy, 30(3), pp.151–156.
Oken, E. et al., 2003. Decline in fish consumption among pregnant women after a
national mercury advisory. Obstetrics and gynecology, 102(2), pp.346–51. Available
at:
http://www.pubmedcentral.nih.gov/articlerender.fcgi?artid=1989666&tool=pmcentr
ez&rendertype=abstract [Accessed August 5, 2011].

259
Osborne, L.L. & Kovacic, D. a., 1993. Riparian vegetated buffer strips in water-quality
restoration and stream management. Freshwater Biology, 29(2), pp.243–258.
Osterblom, H. et al., 2010. Adapting to regional enforcement: fishing down the
governance index. PloS one, 5(9), p.e12832. Available at:
http://www.pubmedcentral.nih.gov/articlerender.fcgi?artid=2941461&tool=pmcentr
ez&rendertype=abstract [Accessed October 1, 2011].
Ostrom, E, 2009. A general framework for analyzing sustainability of social-ecological
systems. Science, 325(5939), p.419.
Ostrom, Elinor, 2005. Trust and Reciprocity: Interdisciplinary Lessons for Experimental
Research, Russell Sage Foundation. Available at:
http://books.google.com/books?id=zYo5n1mXyT8C&pgis=1 [Accessed October 21,
2011].
Page, B. & Bakker, K, 2005. Water governance and water users in a privatised water
industry: participation in policy-making and in water services provision: a case
study of England and Wales. International Journal of Water, 3(1), pp.38–60.
Pahl-Wostl, C., 2006. Transitions towards adaptive management of water facing climate
and global change. Water Resources Management, 21(1), pp.49–62. Available at:
http://www.springerlink.com/index/10.1007/s11269-006-9040-4 [Accessed
November 7, 2012].
Patton, M.Q., 2002. Qualitative Research and Evaluation Methods, SAGE. Available at:
http://books.google.com/books?id=FjBw2oi8El4C&pgis=1 [Accessed April 24, 2012].
Peluso, N.L., Humphrey, C.R. & Fortmann, L.P., 1994. The rock, the beach, and the tidal
pool: people and poverty in natural resource-dependent areas. Society & Natural
Resources, 7(1), pp.23–38.
Petre, S.J., Sackett, D.K. & Aday, D.D., 2012. Do national advisories serve local
consumers: an assessment of mercury in economically important North Carolina
fish. Journal of environmental monitoring : JEM. Available at:
http://pubs.rsc.org/en/Content/ArticleHTML/2012/EM/C2EM30024A [Accessed
April 23, 2012].
Petty, J.D. et al., 2000. An approach for assessment of water quality using semipermeable
membrane devices (SPMDs) and bioindicator tests. Chemosphere, 41(3), pp.311–321.

260
Pomeroy, R.S., 1996. Community-based and co-management institutions for sustainable
coastal fisheries management in Southeast Asia. Science, 27(3), pp.143–162.
Popper, K.R., 1959. The logic of scientific discovery, Psychology Press. Available at:
http://books.google.com/books?id=T76Zd20IYlgC&pgis=1 [Accessed March 29,
2012].
Pretty, J., 1995. Participatory Learning for Sustainable Agriculture. World Development,
23(8), pp.1247–1263.
Pretty, J., 2003. Social capital and the collective management of resources. Science (New
York, N.Y.), 302(5652), pp.1912–4. Available at:
http://www.ncbi.nlm.nih.gov/pubmed/14671287 [Accessed February 13, 2013].
Raffles, H., 2002. Intimate knowledge. International Social Science Journal, 54(173), pp.325–
335.
Rathwell, K.J. & Peterson, G.D., 2012. Connecting Social Networks with Ecosystem
Services for Watershed Governance: a Social-Ecological Network Perspective
Highlights the Critical Role of Bridging Organizations. Ecology and Society, 17(2).
Raymond, C.M. et al., 2010. Integrating local and scientific knowledge for environmental
management. Journal of environmental management, 91(8), pp.1766–77. Available at:
http://www.ncbi.nlm.nih.gov/pubmed/20413210 [Accessed March 9, 2012].
Reid, K. a., Williams, K.J.H. & Paine, M.S., 2011. Hybrid Knowledge: Place, Practice, and
Knowing in a Volunteer Ecological Restoration Project. Ecology and Society, 16(3).
Available at: http://www.ecologyandsociety.org/vol16/iss3/art19/.
Reid, W. V, 2004. Bridging the science-policy divide. PLoS biology, 2(2), p.E27. Available
at:
http://www.pubmedcentral.nih.gov/articlerender.fcgi?artid=340939&tool=pmcentre
z&rendertype=abstract [Accessed July 23, 2012].
Ringquist, E.J., 1995. Political Control and Policy Impact of Water Quality in EPA ’ s
Office. American Journal of Political Science1, 39(2), pp.336–363.
Rittschof, D & McClellan-Green, P., 2005. Molluscs as multidisciplinary models in
environment toxicology. Marine pollution bulletin, 50(4), pp.369–373.

261
Robbins, P, 2003. Beyond ground truth: GIS and the environmental knowledge of
herders, professional foresters, and other traditional communities. Human Ecology,
31(2), pp.233–253.
Robbins, P, 2002. Obstacles to a First World political ecology? Looking near without
looking up. Environment and planning A, 34(8), pp.1509–1514.
Robbins, P, 2006. The politics of barstool biology: environmental knowledge and power
in greater Northern Yellowstone. Geoforum, 37(2), pp.185–199.
Robbins, Paul, 2002. Obstacles to a First World political ecology? Looking near without
looking up. Environment and Planning A, 34(08), pp.1509–1513. Available at:
http://www.envplan.com/epa/abstracts/a34/a34217.html [Accessed October 5, 2011].
Robinson, C.J. & Wallington, T.J., 2012a. Boundary Work: Engaging Knowledge Systems
in Co-management of Feral Animals on Indigenous Lands. Ecology and Society,
17(2). Available at: http://www.ecologyandsociety.org/vol17/iss2/art16/.
Robinson, C.J. & Wallington, T.J., 2012b. Boundary Work: Engaging Knowledge Systems
in Co-management of Feral Animals on Indigenous Lands. Ecology and Society,
17(2). Available at: http://www.ecologyandsociety.org/vol17/iss2/art16/.
Roheim, C., 2009. An Evaluation of Sustainable Seafood Guides: Implications for
Environmental Groups and the Seafood Industry. Marine Resource Economics.
Available at:
http://www.ffc.org.au/FFC_files/sustainable_fishing_papers/Evaluation_guides.pdf
[Accessed August 4, 2011].
Roux, D.J. et al., 2006. Bridging the Science – Management Divide : Moving from
Unidirectional Knowledge Transfer to Knowledge Interfacing and Sharing. , 11(1).
Ruddle, K., 1994. Local Knowledge in the Folk Management of Fisheries and Coastal
Marine Environments. In Folk Management in the World’s Fisheries1. p. 161.
Ruddle, K., 2000. Systems of Knowledge : Dialogue, Relationships and Process.
Environment, Development and Sustainability, 2(3-4), p.277.
Ruhl, L. et al., 2010. Environmental impacts of the coal ash spill in Kingston, Tennessee:
an 18-month survey. Environmental science & technology, 44(24), pp.9272–8.

262
Rydin, Y., 2007. Re-Examining the Role of Knowledge Within Planning Theory. Planning
Theory, 6(1), pp.52–68. Available at:
http://plt.sagepub.com/cgi/doi/10.1177/1473095207075161 [Accessed November 20,
2012].
Samara, F., Tsai, C.W. & Aga, D.S., 2006. Determination of potential sources of PCBs and
PBDEs in sediments of the Niagara River. Environmental pollution (Barking, Essex :
1987), 139(3), pp.489–97. Available at: http://dx.doi.org/10.1016/j.envpol.2005.06.001
[Accessed September 15, 2011].
Schumann, S., 2011. Navigating the Knowledge Interface: Fishers and Biologists Under
Co-Management in Chile. Society & Natural Resources, 24(11), pp.1174–1188.
Available at: http://www.tandfonline.com/doi/abs/10.1080/08941920.2010.521810
[Accessed April 18, 2012].
Selman, P. et al., 2010. Re-connecting with a Recovering River through Imaginative
Engagement. Ecology And Society, 15(3).
Shackeroff, J.M. & Campbell, L.M., 2007. Traditional Ecological Knowledge in
Conservation Research : Problems and Prospects for their Constructive
Engagement. Conservation and Society, 5(3), pp.343–360.
Shilling, F.M., London, J.K. & Liévanos, R.S., 2009. Marginalization by collaboration:
Environmental justice as a third party in and beyond CALFED. Environmental
Science & Policy, 12(6), pp.694–709. Available at:
http://linkinghub.elsevier.com/retrieve/pii/S1462901109000471 [Accessed March 6,
2012].
Shirk, J.L. et al., 2012. Public Participation in Scientific Research: a Framework for
Deliberate Design. Ecology and Society, 17(2). Available at:
http://www.ecologyandsociety.org/vol17/iss2/art29/.
Silvertown, J., 2009. A new dawn for citizen science. Trends in ecology & evolution, 24(9),
pp.467–71. Available at: http://www.ncbi.nlm.nih.gov/pubmed/19586682.
Van Sittert, L., 2005. the other seven tenths. Environmental History, 10(1), pp.106–109.
Star, S.L. & Griesemer, J.R., 1989. Institutional Ecology, `Translations’ and Boundary
Objects: Amateurs and Professionals in Berkeley's Museum of Vertebrate Zoology,
1907-39. Social Studies of Science, 19(3), pp.387–420. Available at:

263
http://sss.sagepub.com/cgi/doi/10.1177/030631289019003001 [Accessed November 7,
2012].
Street, M W et al., 2005. North Carolina coastal habitat protection plan. North Carolina
Department of Environment and Natural Resources, Division of Marine Fisheries,
Morehead City, North Carolina.
Street, Michael W et al., 2005. Coastal Habitat Protection Plan,
Swyngedouw, E., 1999. Modernity and hybridity: Nature, regeneracionismo, and the
production of the Spanish waterscape, 1890–1930. Annals of the Association of
American Geographers, 89(3), pp.443–465.
Swyngedouw, E., 2004. Social power and the urbanization of water: flows of power, Oxford
University Press, USA.
Swyngedouw, E., 2009. The Political Economy and Political Ecology of the Hydro Social
Cycle. Journal of Contemporary Water Research & Education, 142(1), pp.56–60.
Torkar, G. & McGregor, S.L.T., 2012. Reframing the conception of nature conservation
management by transdisciplinary methodology: From stakeholders to stakesharers.
Journal for Nature Conservation, 20(2), pp.65–71. Available at:
http://linkinghub.elsevier.com/retrieve/pii/S1617138111000653 [Accessed April 18,
2012].
Trumbull, D.J. et al., 2000a. Thinking Scientifically during Participation in a Citizen-
Science Project. Science Education, 84(2), pp.265–275.
Trumbull, D.J. et al., 2000b. Thinking scientifically during participation in a citizen-
science project. Science Education, 84(2), pp.265–275. Available at:
http://doi.wiley.com/10.1002/(SICI)1098-237X(200003)84:2<265::AID-SCE7>3.0.CO;2-
5 [Accessed January 23, 2012].
US EPA, O., 2012. Fish Consumption Advisories - Technical Information. Available at:
http://water.epa.gov/scitech/swguidance/fishshellfish/fishadvisories/technical.cfm
[Accessed October 18, 2012].
USEPA, 1998. Method 7473: Mercury in Solids and Solutions by Thermal
Decomposition, Amalgamation, and Atomic Absorption Spectrophotometry.
Available at: http://www.epa.gov/osw/hazard/testmethods/sw846/pdfs/7473.pdf
[Accessed July 29, 2011].

264
Voiland, M.P., 2010. Testing Better Ideas: FRG at 15. Coastwatch.
Wainwright, J., 2005. The geographies of political ecology: after Edward Said.
Environment and planning A, 37(6), pp.1033–1043.
Wall, V.D. et al., 2001. The effect of mercury and PCBs on organisms from lower trophic
levels of a Georgia salt marsh. Archives of environmental contamination and toxicology,
40(1), pp.10–7. Available at:
http://www.springerlink.com/content/ede4790q7nnebkf1/ [Accessed August 1,
2011].
Ward, K., 2007. Geography and public policy: activist, participatory, and policy
geographies. Progress in Human Geography, 31(5), pp.695–705. Available at:
http://phg.sagepub.com/cgi/doi/10.1177/0309132507078955 [Accessed October 25,
2011].
Watts, M.J., 1993. Development I: power, knowledge, discursive practice. Progress in
Human Geography, 17(2), pp.257–272. Available at:
http://phg.sagepub.com/cgi/doi/10.1177/030913259301700210 [Accessed January 15,
2012].
Weber, E.P. & Khademian, A.M., 2008. Wicked Problems, Knowledge Challenges, and
Collaborative Capacity Builders in Network Settings. Public Administration Review,
(April).
Weeks, P., 1995. Fisher scientists: The reconstruction of scientific discourse. Human
Organization, 54(4), pp.429–436.
Weihe, Pál et al., 1996. Health implications for Faroe Islanders of heavy metals and PCBs
from pilot whales. Science of The Total Environment, 186(1-2), pp.141–148. Available
at: http://dx.doi.org/10.1016/0048-9697(96)05094-2 [Accessed September 15, 2011].
Weiss, K. et al., 2012. Knowledge exchange and policy influence in a marine resource
governance network. Global Environmental Change, 22(1), pp.178–188. Available at:
http://linkinghub.elsevier.com/retrieve/pii/S0959378011001427 [Accessed April 18,
2012].
West, B., 1992. Chapter 19 : Water Quality in the South. In Southern Forest Resource
Assessment: Summary Report. pp. 455–479.

265
West, P., 2005. Translation, Value, and Space: Theorizing an Ethnographic and Engaged
Environmental Anthropology. American Anthropologist, 107(4), pp.632–642.
Available at: http://doi.wiley.com/10.1525/aa.2005.107.4.632.
West, S. & Garrity-Blake, B., 2003. Fish House Opera. Mystic, CT: Mystic Seaport.
Whatmore, S., 2002. Hybrid geographies: natures, cultures, spaces, Sage Publications Ltd.
Wiederhold, B.K., 2011. Citizen scientists generate benefits for researchers, educators,
society, and themselves. Cyberpsychology, behavior and social networking, 14(12),
pp.703–4. Available at: http://www.ncbi.nlm.nih.gov/pubmed/22191517 [Accessed
November 27, 2012].
Wilson, Doug C, 2003. Examining the Two Cultures Theory of Fisheries Knowledge: The
Case of The Northwest Atlantic Bluefish. Society & Natural Resources, 16(6), pp.491–
508.
Yanow, D., 2009. Ways of Knowing: Passionate Humility and Reflective Practice in
Research and Management. The American Review of Public Administration, 39(6),
pp.579–601. Available at: http://arp.sagepub.com/cgi/doi/10.1177/0275074009340049
[Accessed September 13, 2012].
Zillioux, E.J., Porcella, D.B. & Benoit, J.M., 1993. Mercury cycling and effects in
freshwater wetland ecosystems. Environmental Toxicology and Chemistry, 12(12),
pp.2245–2264. Available at: http://doi.wiley.com/10.1002/etc.5620121208 [Accessed
September 15, 2011].
Zint, M. et al., 2002. Evaluation of the Chesapeake Bay Foundation’s Conservation
Education Programs. Conservation Biology, 16(3), pp.641–649. Available at:
http://doi.wiley.com/10.1046/j.1523-1739.2002.00546.x.

266
Biography
I was born in Washington DC on October 2, 1986. I was started down the path to
science at a young age, but strengthened that trajectory during my experiences at
Thomas Jefferson High School for Science and Technology. From there, I attended the
Cornell University College of Agriculture and Life Sciences, where I received dual
degrees in Development Sociology and Biological Sciences (concentration in Ecology
and Evolutionary Biology) in 2008. During that time, I also worked with the Institute for
Arctic Biology at the University of Alaska, Fairbanks.
I have published 5 articles, including chapter 3.1 of this dissertation:
Freitag, A. The promise of coproducing knowledge: a transdisciplinary hope for
solutions from increasing diversity in ways of knowing. Abstract accepted for special
issue of Environment and Society: Advances in Research, expected publication 2014.
Freitag, A., N. Sohn, M. Hooper, D. Rittschof. 2012. Geography of toxins: mercury and
PCBs in the daily catch. Marine Pollution Bulletin 64:1330-1338.
A.D. Thaler, C. McClain, A. Freitag, K. Zelnio, D. Shiffman, H. Bik, R. McPhearson, M.
Goldstein. 2012. Digital Environmentalism. Chapter in Environmental Leadership, Sage
Publications.
Chapin, T, A. Bartuska, S. Collins, C. Duke, A. Freitag, R. Jackson, D. Lodge, S. Pickett,
M. Power, J. Reynolds. 2011. Earth Stewardship: Science and action to sustain the
human-earth ecosystem. Ecosphere 2(8): art89.
Agrawal, A.A., J.P. Sparks, R. Jetter, J.P. Salminen, J.B. Goldstein, A.E. Freitag, M.
Fishbein. 2009. Phylogenetic ecology of leaf surface traits in the milkweeds (Asclepias
spp.): chemistry, ecophysiology, and insect behavior. New Phytologist 183: 848 – 867.
I have also received a number of grants and awards that made this dissertation possible:

267
Japan GCOE/INET Grant, 1,000,000Y (about $12,000) with Devon Dublin and Alexandra
Bancheva
NC Sea Grant Fisheries Resource Grant, under PI Daniel Rittschof, $52,000
Sigma Xi Grants-in-Aid-of-Research, $400, matched by Duke, $400
Kenan Institute for Ethics Rethinking Regulations Grant, $2500
Duke Social Science and Humanities Summer Fellowship, $5000
Ramus Fund, $2200
Graduate School Travel Fellowship, $500 (3 times)
Nicholas School Travel Grant, $500 (4 times)
Research Blogging Editor's Choice for Southern Fried Science