diversification, organization, and value of the firm in practice, the effects of industry...
TRANSCRIPT

DPRIETI Discussion Paper Series 15-E-019
Diversification, Organization, and Value of the Firm
USHIJIMA TatsuoAoyama Gakuin University
The Research Institute of Economy, Trade and Industryhttp://www.rieti.go.jp/en/
RIETI Discussion Paper Series 15-E-019
February 2015
Diversification, Organization, and Value of the Firm*
USHIJIMA Tatsuo Aoyama Gakuin University
Abstract
Because corporate diversification and organization co-evolve, diversification discounts, which are widely reported in the literature, can be caused by organizational structure, rather than by the industrial scope of the firm. The paper examines this possibility based on a large sample of Japanese firms for which the legal (parent-subsidiary) structure of the organization is easily observable. I identified a significant discount for diversified firms with and without control over the organizational structure. I also found that firms with a legally segmented structure (e.g., holding companies) are deeply discounted. My results suggest that both diversification and organization are important determinants of firm value. Keywords: Diversification, Organization, Legal structure, Firm value, Japan JEL classification: G34; L23
RIETI Discussion Papers Series aims at widely disseminating research results in the form of professional
papers, thereby stimulating lively discussion. The views expressed in the papers are solely those of the
author(s), and neither represent those of the organization to which the author(s) belong(s) nor the Research
Institute of Economy, Trade and Industry.
* This study is conducted as a part of the Project “Frontiers of Analysis on Corporate Governance: Growth, value creation and corporate governance” undertaken at Research Institute of Economy, Trade and Industry (RIETI). I am grateful for the helpful comments received from Yoshiro Tsutsui, Hirofumi Uchida, Hideaki Miyajima, Masayuki Morikawa, Ryo Ogawa, Hideo Owan, Christina Ahmadjian and seminar participants at Kobe University, Aoyama Gakuin University, RIETI, the Asian Finance Association, and the World Banking and Finance Symposium. Any remaining errors are mine. This study was funded by KAKENHI (Grant-in-Aid for Scientific Research), Grant Number 24530421.
1
I. Introduction
The effect of industrial diversification on firm value has been an intensely debated
issue in finance since the 1990s. Berger and Ofek (1995) and Lang and Stulz (1994) found
that diversified firms trade at a substantial discount relative to a portfolio of representative
focused (single-business) firms in the same industries. These and other early studies attribute
the discount to inefficiencies caused by diversification. In particular, Shin and Stulz (1998)
and Rajan et al. (2001) suggest that diversification results in inefficient internal capital
markets that allocate funds less (more) than optimally to (un-)promising opportunities.
However, more recent studies suspect that diversification discounts are caused by factors
other than diversification itself. Understanding the true effect of diversification by identifying
such confounding factors is a common theme among recent theoretical and empirical works,1
including those of Klein and Saidenberg (2010) and Sanzhar (2006), which have added an
interesting new perspective to the ongoing debate.
Klein and Saidenberg (2010) found that the market value of bank holding companies
decreases with the number of subsidiary banks, a measure of organizational complexity for
these corporations. Sanzhar (2006) found that pseudo-conglomerates (multiple-segment firms
that operate in only one industry) and real conglomerates are similarly discounted by the
market. He advanced that pseudo-conglomerates are discounted because their organization is
more complex than the organization of single-segment focused firms. Based on these
observations, Klein and Saidenberg (2010) and Sanzhar (2006) hypothesized that the discount
for diversified firms arises, at least in part, from a complex, difficult to manage organization
of these firms rather than from their industrial scope.
1 Matsusaka (2001), Bernado and Chowdhry (2002) and Gomes and Livdan (2004) developed models in which diversification discounts endogenously arise from the value-maximizing behavior of firms. Campa and Kedia (2002) and Villaonga (2004) showed, based on data up to the mid-1990s, that diversification discounts disappear when accounting for the endogeneity of diversification However, based on more recent data, Hoechle et al. (2012) identified a diversification discount that is robust to various controls for endogeneity.

2
In practice, the effects of industry diversification and organizational structure on
firm value may be difficult to separate completely. As suggested by Chandler’s (1962) dictum
“structure follows strategy”, diversification strategy entails not only the enlargement of
industrial scope but also the alignment of internal structure to the increased scope. If the
discount for diversified firms emanates from failures of this strategy, it is certainly an
organizational discount as well as a scope discount. Such ambiguity notwithstanding, that
diversified firms typically have a more complex organizational structure than focused firms is
an indisputable fact. Moreover, the financial implications of the firm’s internal structure are
barely understood by academic researchers. Thus, the hypothesis of Klein and Saidenberg
(2010) and Sanzhar (2006) suggests an interesting new avenue for research. Is organization a
fundamental determinant of firm value, which is potentially more important than industry
scope? If so, how does it affect firm value? This paper seeks to help answer these questions
by jointly estimating the effects of diversification and organization on firm value within the
standard framework of diversification discount research.
A simultaneous estimation of the values of diversification and organization is fraught
with two difficulties. The first is how to observe organizational structure for a large sample of
firms. Unlike diversification that is observable through segmental reporting, a firm’s
organization is difficult to observe based on public data. To collect information on corporate
structure, researchers often rely on proprietary surveys, which naturally limit the size and
scope of a research sample. Second, firm organization is difficult to grasp comprehensively
because it is multi-faceted by nature and many of its aspects defy quantification. Finding an
economically important aspect of organization that is also measurable at low cost is therefore
crucial for empirical studies.
The present paper approaches this task by focusing on the legal (parent-subsidiary)
structure of Japanese firms. For firms forming a new business unit, a fundamental choice is
3
whether to organize the unit as a subsidiary, which is a legal entity distinct from the parent
(headquarters), or as an internal division of the parent.2 The organization of firms that choose
the former option becomes more segmented than it would otherwise be due to internal legal
boundaries. Empirical research on the legal structure of the firm is scant at best. However, as
I will delineate in the next section, the structure can affect firm value through various
channels, such as decision-making incentives of managers, internal differentiation of
financial and non-financial contracts, and inter-divisional fund flows.
My focus on legal structure is motivated by the fact that the structure nontrivially
differentiates the organizations of Japanese firms. In particular, diversified firms tend to have
a legally more segmented structure than focused firms because subsidiaries are often used as
an organizational vehicle for diversification. The legal structure of Japanese firms is also easy
to observe because Japan’s financial reporting system requires firms to file unconsolidated
(parent-only) as well as consolidated (parent plus subsidiaries) financial statements. By
comparing the two types of statements, one can easily grasp the weight of subsidiaries (e.g.,
share of subsidiary employees in total employment) in a firm’s organization. Moreover, the
legal structure of Japanese firms has evolved considerably in this century. A particularly
noteworthy phenomenon is the fast diffusion of the holding-company structure, which had
been prohibited by law until 1997. Such dynamics enable the use of longitudinal variations to
identify the value of organization.
My analyses are based on a large panel of public firms over the period 2001 to 2010.
Using the excess value developed by Berger and Ofek (1995), I estimate the values of
diversification and organizational structure with two distinct methods: regression and
propensity-score matching estimation. My regressions consistently reveal a significant
2 If the business unit is acquired from outside the firm, the decision becomes a choice between takeover, which makes the target a subsidiary of the acquiring firm, and merger, which assimilates the target into the acquiring firm’s organization.
4
discount for diversified firms; ceteris paribus, diversified firms trade at a discount of 5 to 9%
relative to focused firms in the same industries. Although this effect is smaller in magnitude
than discounts typically reported for U.S. firms, it is robust to firm-fixed effects, which show
that excess value contains substantial permanent components. Consistent with the
organizational hypothesis, diversification discount decreases in size when organizational
structure is taken into account but does not disappear. Another important finding is that firms
with a legally segmented structure are discounted by the market. In particular, firms with a
holding-company structure are, on average, valued 8 to 10% lower than firms with a more
centralized structure. Therefore, my regressions reveal an organizational discount that is no
smaller than the discount for industry diversification. These findings survive various
robustness checks including alternative measures of firm value, additional control variables,
and quantile regressions.
The propensity-score matching estimation compares the changes in excess value
after a large discrete shift in diversification status or organizational structure (treatment)
between treated firms (i.e., diversifying/refocusing firms and firms adopting a holding-
company structure) and untreated (comparison) firms that do not exhibit the shift. Probit
regressions show that for each treatment, treated and untreated firms differ systematically
from each other. Therefore, I perform propensity-score matching to create a sample of control
firms that are comparable to treated firms in terms of the ex-ante probability of receiving a
treatment. I compare changes (differences) rather than levels of excess value because
difference-in-differences matching estimation is robust to endogeneity due to unobserved
persistent factors as well as observed time-varying factors. Consistent with the regression
results summarized above, the matching estimates of the values of diversification and
holding-company structure are significantly negative. Specifically, the value of diversifying
firms declined, on average, 6 to 13% vis-à-vis control firms in one to three years following

5
diversification. In contrast, the value of refocusing firms increased 8 to 12% after refocusing
relative to comparable diversified firms that chose not to refocus. The value of firms adopting
a holding-company structure declined 8 to 13% compared with non-adopting firms.
Overall, my findings are summarized as follows. First, diversified firms in Japan
trade at a discount that is smaller than that typically reported for U.S. firms but more robust
to endogeneity controls that are standard in the literature. Second, organizational structure is
no less important than industrial scope as a determinant of firm value. In particular, I found a
large discount for firms with a legally segmented structure, such as holding companies.
Because legal structure is but one aspect of corporate organization, the overall effect of
organizational structure can be greater than that suggested by the results cited herein.
However, it should be noted at the same time that organizational variables do not explain
away the diversification discount even when unobserved aspects of corporate organization are
controlled by firm-fixed effects. The results reported in this paper, therefore, suggest that
diversification and organization are both important determinants of firm value.
This paper contributes to the diversification discount literature by conducting the
first formal test of organizational hypothesis.3 By estimating the value of legal structure, it
also adds to the burgeoning empirical literature on decentralization (delegation of decision
rights to operating managers). Organizational economists have theorized that decentralization
increases firm performance by enabling firms to better adapt to operating environments (e.g.,
Aghion and Tirole, 1997). The discount for legally segmented structure identified in this
paper is not consistent with this view because subsidiary managers are normally delegated
more decision rights than comparable managers within the parent firms. A better
understanding of the cost of decentralized decision making is likely necessary. The discount
3 Klein and Saidenberg (2010) estimated the value of organizational form, but their analysis is based on bank holding companies, which are essentially focused firms. Sanzhar (2006) compared diversified and focused firms but did not directly observe organization.

6
also bears on research regarding stock pyramids. The pyramidal ownership of listed firms can
distort corporate governance by enabling ultimate owners to exercise control rights in excess
of their cash flow rights (La Porta et al., 1999; Morck et al., 2005). The evidence presented in
this paper suggests that linking firms through parent-subsidiary relationships may generate
inefficiencies even without external control problems. A recent working paper by Perez-
Gonzalez (2014) lends support to this view as it found that U.S. public utility holding
companies disbanded in the 1930s were less efficient than non-holding companies. Thus, it is
possible that inefficiencies caused by legally segmented corporate structure are quite a
general problem.
This paper is organized as follows. The next section reviews channels through which
legal structure potentially affects firm value. Section III describes the regression methodology
and data used in this study. Section IV reports the regression results. Propensity-score
matching estimations are performed in Section V, and the final section presents the
concluding remarks.
II. Legal Structure of the Firm A. Concept
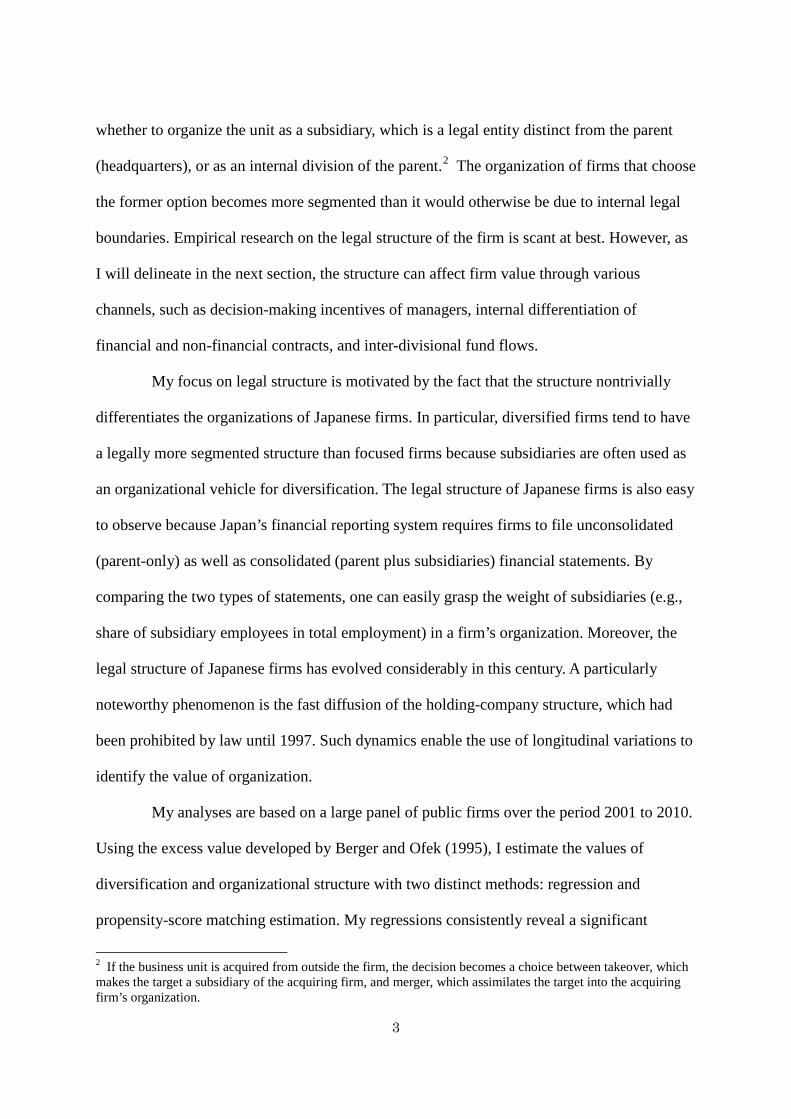
To elucidate the aspect of corporate organization examined in this paper, Figure 1
depicts alternative organizational forms of a diversified firm with two lines of business. In the
case on the left, both businesses are organized as divisions within the parent where the firm’s
headquarters reside. Therefore, the organization of the firm consists of three internal divisions,
including the headquarters, encircled by the same legal boundary (solid lines). In the case on
the right, one business is separated from the parent as a wholly owned subsidiary. Unlike the
former, this organizational form involves a legal segmentation of the firm because the parent,
which now consists of two internal divisions (the headquarters and Business A), and the
7
subsidiary (Business B) have distinct legal identities. If Business A is also spun off from the
parent, the organization of this firm is further segmented into three legal entities – the parent,
which concentrates on headquarter functions as a holding company, and two subsidiaries that
are engaged in separate businesses.
A wholly owned subsidiary and internal division of the parent are no different in
terms of asset ownership, which defines the economic boundary of the firm. The industrial
scope of the firm, as measured by the number of business-lines, also remains the same in the
above example. Accordingly, one may argue that the two cases illustrated in Figure 1 – and
the holding-company structure described above – are economically equivalent. However,
only subsidiaries have legal identity and thus can enter into a contract with third parties in
their own name. Does the legal structure of the firm affect its value? If so, how? I am
unaware of any evidence that may help answer these questions. However, scholars from
various disciplines, such as law, economics, and management, have supplied useful
perspectives on the economic ramifications of a legally segmented corporate structure.
B. Decentralization
The legal segmentation of a firm’s organization may result from decentralization (i.e.,
the delegation of decision rights to operating managers). The fact that subsidiaries are legal
entities that are distinct from the parent firms suggests that subsidiary managers have more
decision rights and responsibilities than managers of internal divisions within the parent firm.
Subsidiaries are also suited for decentralization because their revenues and costs (thus,
profits) are unambiguously measurable. As noted by Acemoglu et al. (2007), decentralized
firms tend to organize operating units as profit centers rather than cost or revenue centers to
hold managers accountable for their decisions. Surveys of Japanese firms show that
subsidiary managers are indeed delegated more decision rights than managers of comparable

8
internal divisions of the parent firm (e.g., Itoh et al., 2009).
Theories suggest that decentralization can increase firm value by providing high-
powered incentives to operating managers. Specifically, managers with more decision rights
have greater incentive to acquire new information and/or use private knowledge more
effectively (Aghion and Tirole, 1997; Dessein, 2002). If the cost of communication between
top executives and operating managers is high, decentralized firms may be able to better
adapt to operating environments than are centralized firms. Baker et al. (2002) note, however,
that a significant barrier to this advantage is that the delegation of decision rights cannot be
formal as managers can always overturn the decisions of subordinates. To reap the benefits of
decentralization, managers must credibly commit themselves not to renege on the informal
authority granted to subordinates. Itoh and Shishido (2001) advance that providing legal
identity to a division serves as a commitment device for decentralized decision making, while
Fan et al. (2013) find that a pyramidal ownership structure insulates state enterprises in China
from the political influence of state governments (ultimate owners) and affords managers
more decision rights.
Decentralization entails costs as well as benefits. If the costs outweigh the benefits,
the value of decentralization is negative. A potential drawback to decentralization is the loss
of control. If higher- and lower-level managers have divergent interests, lower-level managers
may abuse decision rights to pursue private benefits (Aghion and Tirole, 1997). Another
potentially important cost is the difficulty of coordinating decisions across operating units. If
operating managers lack knowledge and incentives to make decisions that are optimal for the
entire firm, coordination must be achieved through centralization. Dessein et al. (2010)
models the optimal tradeoff between synergy (centralization) and high-powered incentives
for lower-level managers (decentralization).

9
C. Differentiation
Firms can use legal boundaries to internally differentiate capital structure. Consider a
firm with two lines of business that have different optimal capital structures. Organizing them
as internal divisions can generate negative financial synergy because a firm can have only
one capital structure that is suboptimal for at least one business (Leland, 2007; Iacobucci and
Triantis, 2007). If the business with higher optimal leverage is spun off as a subsidiary, this
inefficiency is mitigated because subsidiaries can incur their own debt. Hansmann and
Kraakman (2000) claim that legal identity improves the debt access of a business by
increasing transparency to creditors who also benefit from stronger protection from creditors
lending to other parts of the firm. The parent-subsidiary structure can also be used to
differentiate labor contracts within the firm. Itoh et al. (2009) document that differentiating
wages, incentive systems, and personnel policies across affiliates is a major motive for
Japanese firms to form a subsidiary.
D. Compartmentalization
Legal boundaries may cause the compartmentalization of a firm’s organization by
weakening operational and financial links among divisions. As noted by Hansmann and
Kraakman (2000), creditors providing non-guaranteed debt to a subsidiary do not have access
to the parent firm’s other assets because of limited liability. Internal legal boundaries can
therefore block the contagion of operating risks across affiliates, an effect known as
ring-fencing in regulatory debate on global banks. Dell’ariccia and Marquez (2010) show that
the optimal form of a bank varies between subsidiary- and branch (division)-based structures
depending on the nature of foreign risks.
Legal boundaries may also fragment internal capital markets as the flow of funds to/
from a subsidiary is not as smooth as fund flows within the parent, especially when the

10
subsidiary has minority shareholders (Bethel and Liebeskind, 1998; Triantis, 2004). How this
affects firm value depends on the nature of capital allocations. If funds flow efficiently across
divisions, as postulated by Williamson (1975) and Stein (1997), frictions imply value loss.
However, if funds are misallocated, as suggested by Shin and Stulz (1998) and Rajan et al.,
(2001), the frictions can increase firm value by mitigating the power of managers to
reallocate funds for their own benefits (Traiantis, 2004). Kolasinski (2009) demonstrates that
subsidiary debt improves the efficiency of internal capital markets by decreasing the
diversion of cash flows from a promising business.
Last, legal boundaries may create organizational silos by physically and
psychologically detaching subsidiary managers and employees from the rest of the firm. Such
a Balkanization of organization can prevent the realization of positive synergies or even
generate negative synergies by limiting the intra-firm sharing of resources and the
coordination of decision making and operating activities. These inefficiencies are exacerbated
if subsidiaries engage in influence activities and turf battles.
In sum, legal structure can affect firm value through various channels. It should be
noted that the above-described effects could have varied degrees of importance on diversified
and focused firms. For example, if a successful diversification strategy requires the
delegation of decision rights to business-unit managers, as suggested by Chandler (1962) and
Baker (1992) among others, diversified firms may depend relatively more on subsidiaries as
an organizational vehicle for decentralization than focused firms do. Accordingly, if the value
of diversification is estimated without control for legal structure, it can capture the effects of
organization as well as those of industrial scope. This possibility is examined in the following
sections.

11
III. Methodology and Data
A. Model
The regression model is specified as follows:
𝐸𝐸𝑖𝑖 = 𝛼 + 𝛽 ∙ 𝐷𝐷𝐷𝑖𝑖 + 𝛾 ∙ 𝑂𝑂𝑂𝑖𝑖 + 𝛿 ∙ 𝒛𝑖𝑖 + 𝜂𝑖 + 𝜙𝑖 + 𝜖𝑖𝑖, (1)
where the dependent variable (EV) is the excess value proposed by Berger and Ofek (1995),
Div is a measure of diversification, Org is a measure of organizational structure, and z is a
vector of control variables. η denotes a firm-fixed effect that accounts for unobserved aspects
of a firm’s organization that remained stable during the sample period. Firm-fixed effects also
mitigate endogeneity that arises from permanent firm attributes. To address endogeneity
based on time-varying factors, propensity-score matching estimations are performed in
Section V. φ is a year-fixed effect that controls for macroeconomic shocks that differently
affect the values of focused and diversified firms.
In constructing the estimation sample, all firms publicly traded between 2001 and
2010 are considered. The sample begins in 2001 because industrial segmental reporting,
which is essential to the estimation of excess value, was introduced in Japan at the turn of the
last century. Since 2000, all public firms have been required to report segmental revenue,
operating income, assets, and depreciations if they have a segment whose revenue, operating
income, or assets exceed 10% of the sum of all segments. In 2011, the Japanese generally
accepted accounting principles (JGAAP) adopted the management approach for segmental
reporting in place of the traditional industry approach, a shift analogous to the U.S. transition
from FASB14 to SFAS 131. The sample ends in 2010 to avoid potential discontinuities that
may have been the result of this change. A unique feature of JGAAP is that it requires firms
to disclose unconsolidated (parent-only) as well as consolidated (firm-wide) financial
12
statements. By comparing the two types of statements, one can easily observe a firm’s legal
structure. The present paper utilizes this institutional setting to perform a large sample study
of organizational structure.
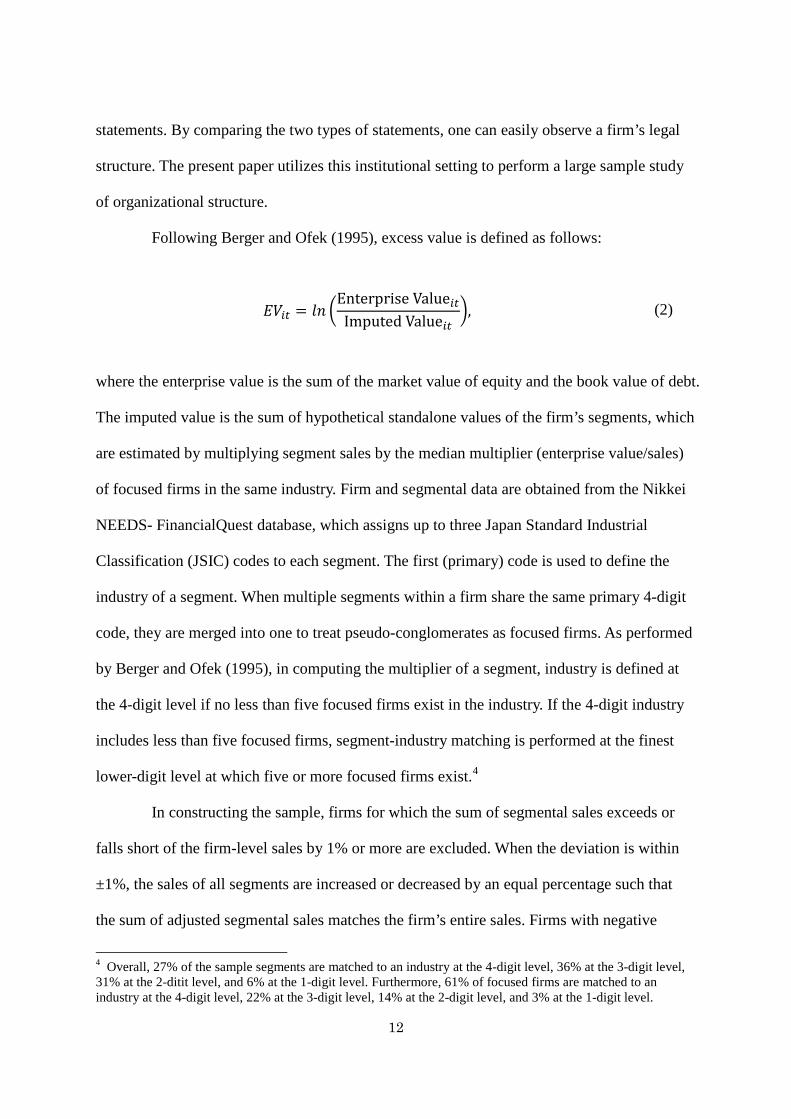
Following Berger and Ofek (1995), excess value is defined as follows:
(2)
where the enterprise value is the sum of the market value of equity and the book value of debt.
The imputed value is the sum of hypothetical standalone values of the firm’s segments, which
are estimated by multiplying segment sales by the median multiplier (enterprise value/sales)
of focused firms in the same industry. Firm and segmental data are obtained from the Nikkei
NEEDS- FinancialQuest database, which assigns up to three Japan Standard Industrial
Classification (JSIC) codes to each segment. The first (primary) code is used to define the
industry of a segment. When multiple segments within a firm share the same primary 4-digit
code, they are merged into one to treat pseudo-conglomerates as focused firms. As performed
by Berger and Ofek (1995), in computing the multiplier of a segment, industry is defined at
the 4-digit level if no less than five focused firms exist in the industry. If the 4-digit industry
includes less than five focused firms, segment-industry matching is performed at the finest
lower-digit level at which five or more focused firms exist.4
In constructing the sample, firms for which the sum of segmental sales exceeds or
falls short of the firm-level sales by 1% or more are excluded. When the deviation is within
±1%, the sales of all segments are increased or decreased by an equal percentage such that
the sum of adjusted segmental sales matches the firm’s entire sales. Firms with negative
4 Overall, 27% of the sample segments are matched to an industry at the 4-digit level, 36% at the 3-digit level, 31% at the 2-ditit level, and 6% at the 1-digit level. Furthermore, 61% of focused firms are matched to an industry at the 4-digit level, 22% at the 3-digit level, 14% at the 2-digit level, and 3% at the 1-digit level.
𝐸𝐸𝑖𝑖 = 𝑙𝑙 �Enterprise Value𝑖𝑖
Imputed Value𝑖𝑖�,
13
equity, financial firms (JSIC 6100-6750), firms with a segment in these industries based on
the primary JSIC code, and firms with a segment coded “9999” (industries unable to classify)
are also excluded. After excising observations with extreme values, the sample includes
31,052 observations for 4,189 firms.5
B. Diversification and organization variables
Two variables are used to measure diversification. One is a dummy variable that
takes a value of one if a firm has multiple 4-digit segments and zero otherwise. The other is a
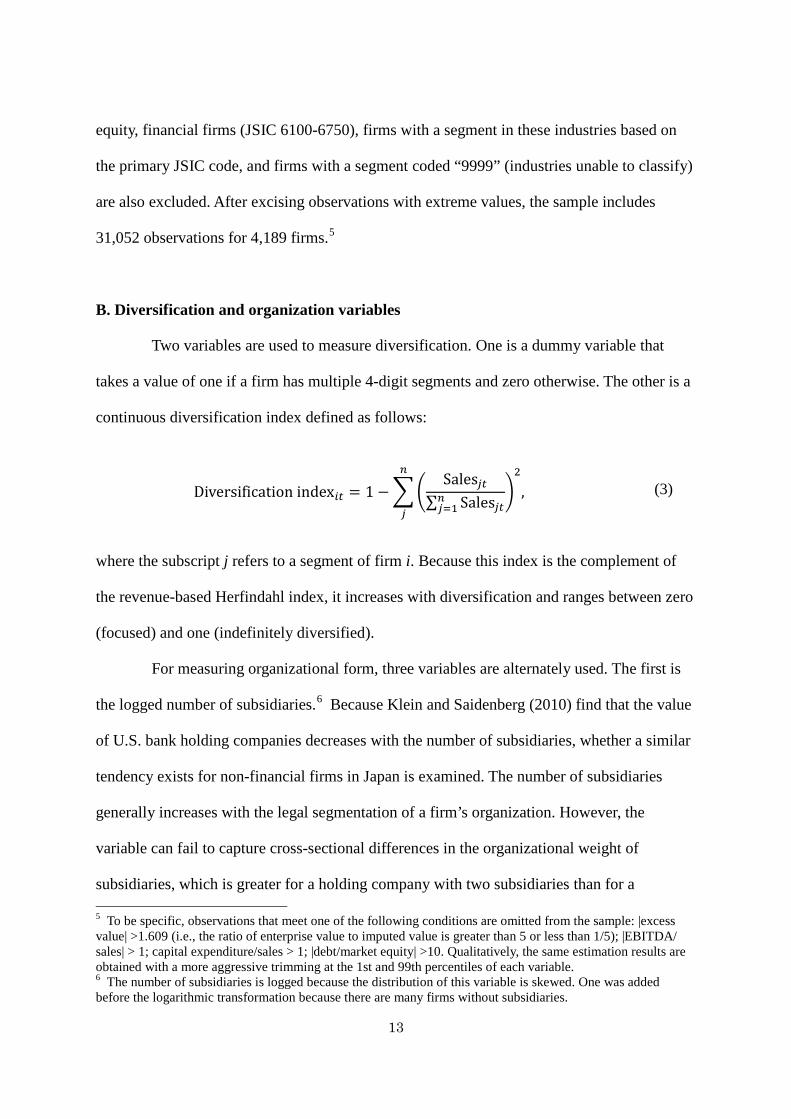
continuous diversification index defined as follows:
(3)
where the subscript j refers to a segment of firm i. Because this index is the complement of
the revenue-based Herfindahl index, it increases with diversification and ranges between zero
(focused) and one (indefinitely diversified).
For measuring organizational form, three variables are alternately used. The first is
the logged number of subsidiaries.6 Because Klein and Saidenberg (2010) find that the value
of U.S. bank holding companies decreases with the number of subsidiaries, whether a similar
tendency exists for non-financial firms in Japan is examined. The number of subsidiaries
generally increases with the legal segmentation of a firm’s organization. However, the
variable can fail to capture cross-sectional differences in the organizational weight of
subsidiaries, which is greater for a holding company with two subsidiaries than for a 5 To be specific, observations that meet one of the following conditions are omitted from the sample: |excess value| >1.609 (i.e., the ratio of enterprise value to imputed value is greater than 5 or less than 1/5); |EBITDA/ sales| > 1; capital expenditure/sales > 1; |debt/market equity| >10. Qualitatively, the same estimation results are obtained with a more aggressive trimming at the 1st and 99th percentiles of each variable. 6 The number of subsidiaries is logged because the distribution of this variable is skewed. One was added before the logarithmic transformation because there are many firms without subsidiaries.
Diversification index𝑖𝑖 = 1 −��Sales𝑗𝑖
∑ Sales𝑗𝑖𝑛𝑗=1
�2𝑛
𝑗
,
14
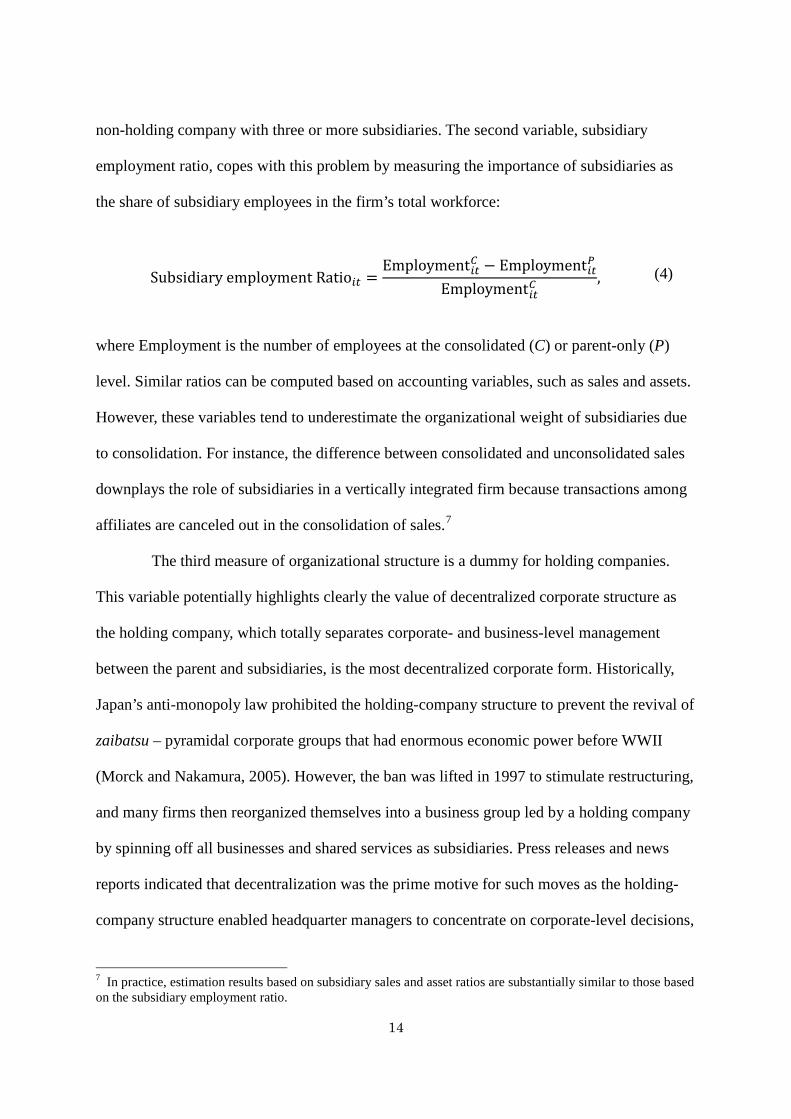
non-holding company with three or more subsidiaries. The second variable, subsidiary
employment ratio, copes with this problem by measuring the importance of subsidiaries as
the share of subsidiary employees in the firm’s total workforce:
(4)
where Employment is the number of employees at the consolidated (C) or parent-only (P)
level. Similar ratios can be computed based on accounting variables, such as sales and assets.
However, these variables tend to underestimate the organizational weight of subsidiaries due
to consolidation. For instance, the difference between consolidated and unconsolidated sales
downplays the role of subsidiaries in a vertically integrated firm because transactions among
affiliates are canceled out in the consolidation of sales.7
The third measure of organizational structure is a dummy for holding companies.
This variable potentially highlights clearly the value of decentralized corporate structure as
the holding company, which totally separates corporate- and business-level management
between the parent and subsidiaries, is the most decentralized corporate form. Historically,
Japan’s anti-monopoly law prohibited the holding-company structure to prevent the revival of
zaibatsu – pyramidal corporate groups that had enormous economic power before WWII
(Morck and Nakamura, 2005). However, the ban was lifted in 1997 to stimulate restructuring,
and many firms then reorganized themselves into a business group led by a holding company
by spinning off all businesses and shared services as subsidiaries. Press releases and news
reports indicated that decentralization was the prime motive for such moves as the holding-
company structure enabled headquarter managers to concentrate on corporate-level decisions,
7 In practice, estimation results based on subsidiary sales and asset ratios are substantially similar to those based on the subsidiary employment ratio.
Subsidiary employment Ratio𝑖𝑖 =Employment𝑖𝑖𝐶 − Employment𝑖𝑖𝑃
Employment𝑖𝑖𝐶,

15
while relegating business-level decisions to subsidiary managers. This structure was also
implemented by merging firms to mitigate the cost of post-merger integration. That is,
acquiring and acquired firms became subsidiaries of a holding company, which was created
for combining ownership without merging organizations.
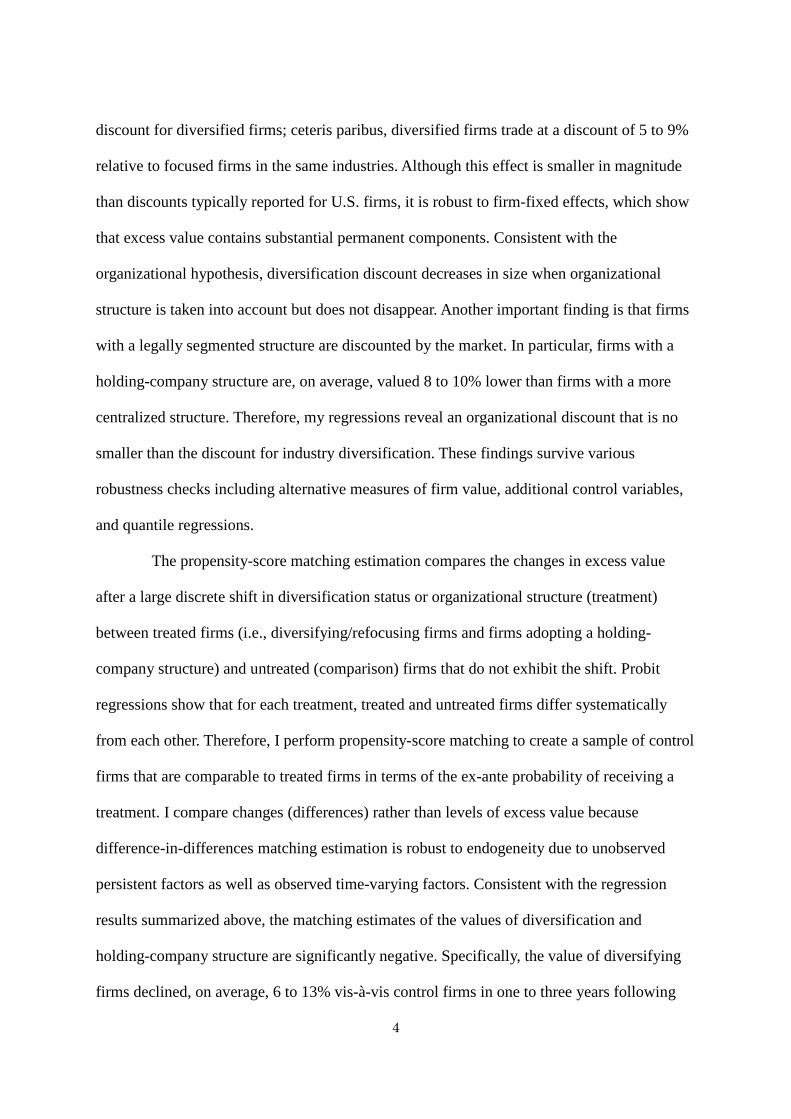
Figure 2 displays the distribution of holding companies by the year and background
of creation. The sample includes 281 holding companies, 219 (78%) of which were created
for reorganization. For firms engaged in reorganization, we observe the change in internal
structure. For the year prior to reorganization, the median subsidiary employment ratio of
these firms was 39%. The ratio increased to 97% in the year following reorganization. The
transition to a holding company, therefore, is an unusually large, discrete transformation of
corporate structure.
C. Descriptive statistics
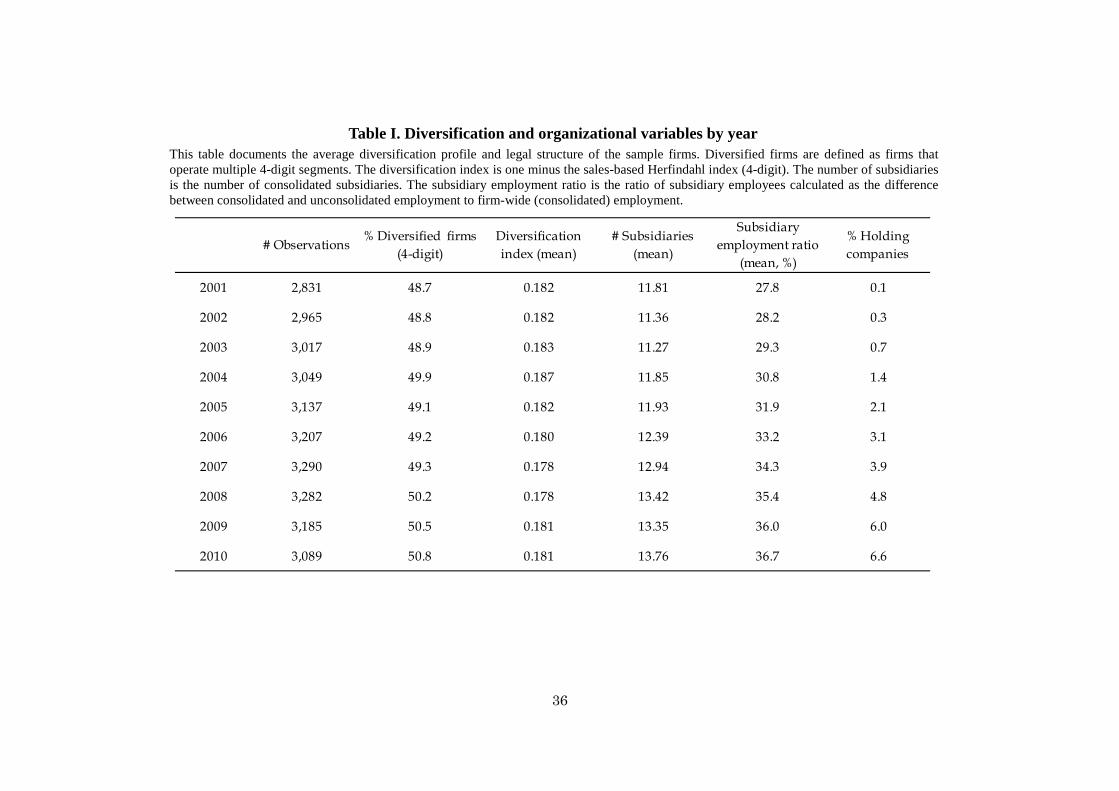
Table I tabulates the diversification and organization variables. The sample includes
approximately 3,100 firms per year. The share of diversified firms was essentially constant at
50% during the 2000s. The mean value of the diversification index was also stable at
approximately .18. This aggregate stability notwithstanding, 388 focused firms in the sample
became diversified by 2010, whereas 348 diversified firms became focused. The existence of
these firms is crucial for the fixed-effects regressions in the next section as well as for the
propensity-score matching estimations performed in Section V.
With respect to organizational variables, it is found that the weight of subsidiaries in
the organization of sample firms increased steadily as the mean value of the subsidiary
employment ratio increased by 9 percentage points from 2001 to 2010. This trend is likely to
be driven, at least in part, by the diffusion of the holding-company structure. As shown in the
last column, the share of holding companies increased from 0 to 7% by 2010. To remove the

16
influence of these extremely decentralized firms, medians are also examined. The median
subsidiary employment ratio also increased from 22 to 31% over the period 2001 to 2010.
Therefore, the trend toward a legally more segmented structure is not entirely attributable to
the increase of holding companies.
Table II displays the descriptive statistics of regression variables, which are jointly
and separately tabulated for focused and diversified firms. The control variables include
logged total assets, EBITDA over sales, capital expenditure over sales, R&D expenditure
over sales, marketing (advertising and sales promotion) expenditure over sales, and debt over
market value of equity. A few points are noteworthy. First, the mean and median excess
values of diversified firms are close to zero. Therefore, diversified firms generally do not
trade at a discount. This is a stark departure from U.S. evidence that the average excess value
of diversified firms is significantly negative. However, this prima facie evidence does not
necessarily imply that diversification is value-neutral in Japan because Table II also indicates
that diversified and focused firms differ in many aspects other than industrial scope. The
value of diversification is unclear without a control for other determinants of firm value.
Second, the organization of diversified firms is, on average, more segmented than
that of focused firms. The mean logged number of subsidiaries and the mean share of
subsidiary employees are twice as high for diversified firms. The share of firms with a
holding-company structure is also higher for diversified firms than for focused firms. These
differences suggest that the effect of diversification on firm value can be confounded by the
effect of legal structure if the latter is left uncontrolled in estimations.
IV. Regression Results
A. Diversification discount
First, regressions without a control for organizational structure are performed to

17
examine whether the present data of Japanese firms replicate diversification discounts widely
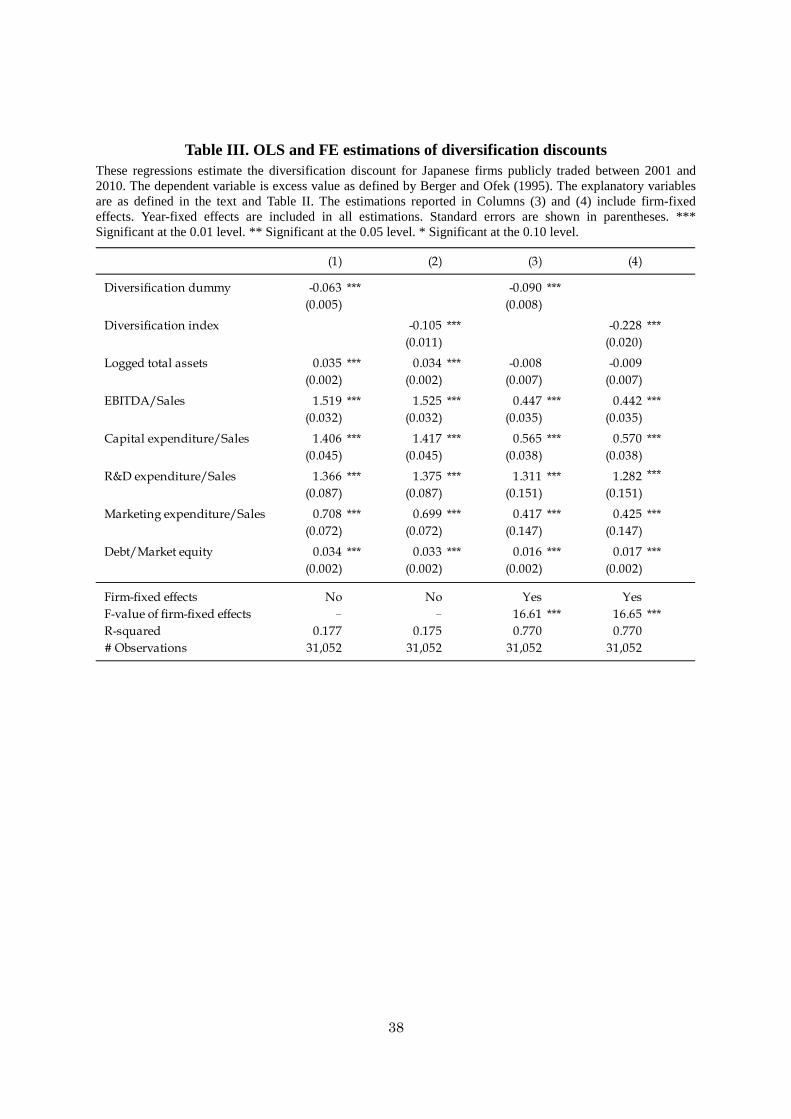
reported in the U.S. literature. The first two columns of Table III report the estimation results
of specifications without firm-fixed effects. The coefficient for the diversification dummy in
Column (1) is negative and highly significant. The estimated coefficient indicates that
diversified firms are, on average, valued 6% lower than comparable focused firms. Although
this effect is smaller in magnitude than the discount typically reported for U.S. firms, it is still
economically important. In Column (2), the continuous diversification index is used in lieu of
the diversification dummy. The effect of the index is also significantly negative, implying that
more diversified firms are more deeply discounted.
Columns (3) and (4) incorporate firm-fixed effects into regressions. For U.S. firms,
Campa and Kedia (2001) report that diversification discount are halved with the introduction
of firm-fixed effects. In contrast, the diversification discount for Japanese firms robustly
appears even when unobserved firm heterogeneity is accounted for. The coefficient for the
diversification dummy in Column (3) is -.09, which is 50% greater in absolute value than the
OLS estimate reported in Column (1). In Column (4), the coefficient for the diversification
index also doubles when firm-fixed effects are introduced.
B. The effect of organizational structure
Table IV introduces organizational variables into the regressions. The claim of Klein
and Saidenberg (2010) and Sanzhar (2006) is essentially that diversification discounts
reported in the literature suffer from an omitted-variable bias due to the exclusion of
organizational factors. In other words, their hypothesis is testable based on the sensitivity of
diversification discount to the inclusion/exclusion of organizational variables. The change in
diversification discount as well as the effect of organizational structure on firm value is
therefore of interest in the following estimations.

18
Columns (1) to (3) report the estimation results without firm-fixed effects. In
Column (1), consistent with Klein and Saidenberg’s (2010) evidence for U.S. bank holding
companies, the effect of the number of subsidiaries on firm value is negative and highly
significant. The coefficient for the subsidiary employment ratio is also significantly negative
in Column (2). However, the coefficient on the holding company dummy is not significantly
different from zero in Column (3). Therefore, the estimated effects of organizational variables
vary. On the other hand, the effect of diversification is negative and highly significant across
the board. In Columns (1) and (2), where the effects of organizational variables are
significant, the estimated size of the diversification discount is 5%, which is 20% less than
that obtained without a control for organization. This decline lends support to the view that
the diversification discount is partly a shadow of organizational structure.
Columns (4) to (6) introduce firm-fixed effects. The within-estimations provide
strong evidence that segmenting a firm with internal legal boundaries causes a decline in firm
value. The coefficients on all organizational variables are negative and highly significant and
greater in absolute value than the estimates in Columns (1) to (3). The effect of organization
is no less important than that of industrial scope. The coefficient on the logged number of
subsidiaries in Column (4) implies that a one-SD increase in this variable results in a value
loss of 7.1%, which is greater than the mean discount for diversified firms (6.2%). Column
(6) shows that, by adopting a holding-company structure, firms, on average, lose 10% in
value.8 As in the OLS estimations, the coefficient on the diversification dummy is negative
and highly significant in all within-estimations. However, compared to those obtained in the
last subsection without a control for organizational structure, the estimated discount for
8 This sizable effect does not emanate from inefficient mergers. The contribution of mergers to the within- estimation of the value of the holding-company structure is small because holding companies created for merger enter the sample only after merger and seldom abolish the structure after merger. The longitudinal variation of the holding-company dummy is predominantly caused by firms that adopted the structure for internal reorganization.
19
diversified firms is 10 to 30% less.
A concern regarding the above regressions is that organizational variables may
capture the effect of diversification, not vice versa, because subsidiaries are often used for
diversification, especially by firms entering a distant/unrelated industry (Kikutani et al.,
2007). This tendency implies that legal structure can assume the effect of diversification level
and/or type that is not captured by the diversification dummy. The regressions reported in
Table V address this concern. In Columns (1) to (3), the diversification index is used in lieu
of the dummy to control for the degree of diversification. The coefficients on the index are
negative and highly significant. Consistent with the organizational hypothesis, these
coefficients are 10 to 30% less in absolute value than those presented in Table III without a
control for organizational structure. In contrast, the effects of organizational variables are
virtually identical to those reported in Columns (4) to (6) of Table IV where the
diversification dummy is used to measure industrial scope. This stability suggests that
organizational variables do not serve as a surrogate for diversification degree.
Column (4) to (6) of Table V examine the effect of diversification type by dividing
the diversification dummy into two components – a dummy for related diversifiers (firms that
are diversified at the 4-digit level but focused at the 2-digit level) and a dummy for unrelated
diversifiers (firms that are diversified at the 2-digit as well as the 4-digit level). If the effect of
legal structure is negative because subsidiaries are used for pursuing unrelated diversification,
the coefficients on organizational variables will decline in size in these specifications.
However, the coefficients on organizational variables barely change from the previous
estimates. Consistent with the view that unrelated diversification is particularly detrimental to
firm value, the estimated discount is greater for unrelated diversifiers. However, in none of
these regressions is the homogeneity of the effects of related and unrelated diversification
rejected at a conventionally significant level.

20
To summarize, the regressions in this subsection yield two important results. First,
the size of diversification discount decreases when a firm’s organization is taken into account.
This pattern suggests that diversification discounts pick up the effects of organization as well
as industrial scope. Second, organizational variables do not explain away the diversification
discount even when firm-fixed effects are used to account for unobserved aspects of
corporate organization. These results suggest that diversification and organization are both
important determinants of firm value.
C. Robustness checks
Various additional tests are performed to confirm the robustness of the above
results.9 First, asset-based excess value is used as an alternative dependent variable. The
preceding estimations are based on sales-based excess value because diversified firms’
segmental assets often do not sum up to the firm’s total assets due to corporate-level assets
that are not allocated to segments. As a result, the sample selection procedure described in
Section III results in an estimation sample that is 45% smaller for asset-based excess value
than for sales-based excess value. To mitigate the under-sampling of diversified firms,
following Berger and Ofek (1995), the estimations performed in Columns (1) to (3) of Table
VI retain firms insofar as the sum of segmental assets deviates from the firm’s total assets by
no more than 25%.10 As the dependent variable is asset-based, firm size is measured by
logged sales in these regressions. As in the previous estimations, the effects of the
diversification dummy and organizational variables are negative. Although the effects of
these variables are smaller in magnitude than those of sales-based excess value, they are
significant at the .01 or higher level. Thus, the diversification and organizational discount are
9 The regressions reported in this subsection use the dummy variable to measure diversification. Similar results are obtained when the diversification index is used instead. 10 Otherwise, the sample selection and data adjustment procedures are as described in Section III.

21
qualitatively robust with respect to how to measure excess value.
One concern regarding organizational variables is that their effects on firm value can
be driven by holding companies that, as we have observed, have an extremely
decentralized/segmented internal structure. To remove the influence of these de facto outliers,
Columns (4) and (5) of Table VI exclude firms that adopted a holding-company structure for
the entire sample period. The estimation results show that the effects of the logged number of
subsidiaries and subsidiary employment ratio on excess value remain negative and significant
at a high level, and accordingly, the legal segmentation of a firm causes a value decline over a
range of organizational settings.
Another concern is the potential confounding effect of foreign operations. Ceteris
paribus, firms with larger operations abroad will have a more segmented legal structure
because foreign operations are normally incorporated as subsidiaries. It is then possible that
legal structure captures the effect of multinationality, which can be negative for Japanese
firms during the sample period due to the substantial appreciations of the yen. To verify this
possibility, Columns (6) to (8) of Table VI include the ratio of foreign sales to total sales as an
additional control variable. As expected, the foreign sales ratio is negatively and significantly
associated with excess value. However, even with this control for foreign exposures, the
effects of organizational variables are significantly negative and similar in magnitude to
earlier estimates. Thus, the confounding effect of multinationality, if it exists at all, appears to
be small.
More robust checks are performed in Table VII. Legal structure may spuriously
correlate with firm value by capturing the effect of earnings quality. If firms tend to organize
operations with low earnings quality as subsidiaries, the legal structure can negatively
correlate with excess value even without a direct effect on firm value. To examine this
scenario, the regressions performed in Columns (1) and (2) divide the EBITDA into profits of

22
the parent (unconsolidated EBITDA) and profits earned by the subsidiaries (consolidated
EBITDA minus unconsolidated EBITDA) and then normalize them by firm-wide
(consolidated) sales. Holding companies are excluded from these estimations because they
perform all profit-generating activities in subsidiaries. The estimated coefficients are smaller
for a subsidiary EBITDA than for a parent EBITDA, thus suggesting that subsidiary profits
are, indeed, valued at a lower rate by investors.11 In both estimations, however, the effect of
legal structure is significantly negative as well as similar in magnitude to previous estimates.
It is possible that high- and low-value firms use subsidiaries for different purposes. If,
for instance, high-value firms use subsidiaries to invest in new growth opportunities and
low-value firms use them for the restructuring of unprofitable businesses, the valuation effect
of legal structure is unlikely to be the same. Columns (3) to (5) perform quantile regressions
to examine such a possibility by comparing the effects of the subsidiary employment ratio on
the first, fifth, and ninth deciles of excess value.12 The estimation results indicate that
diversification is particularly harmful for low-value firms as the effect of diversification is
largest in absolute value at the first decile. In contrast, the effect of the subsidiary
employment ratio does not vary much by the relative level of excess value. Thus, the legal
segmentation of a firm causes a decline in value for superior and inferior performers alike.
In a study of U.S. firms, Hoechle et al. (2012) provide evidence that diversification
discounts partly reflect the poor governance of diversified firms. The regressions reported in
Columns (6) to (8) perform a similar test by including governance factors as additional
control variables. Five variables taken from Nikkei NEEDS-Cges (Corporate Governance
Evaluation System) – board size (number of directors), share of independent directors on the
board, share of equities owned by managers, equity ownership share of the firm’s main bank,
11 The hypothesis that the coefficients on parent and subsidiary EBITDA are the same is rejected at the .1 level for Column (1) but not for Column (2). 12 Qualitatively, the same results are obtained with the logged number of subsidiaries (unreported).
23
and ownership share of foreign investors – are considered. The estimation window is 2004 to
2010, as the initial year in the NEEDS-Cges database is 2004. The estimation results suggest
that the overestimation of diversification and organization discounts due to the exclusion of
governance variables is not a problem in the present data. The effects of diversification and
organizational variables are negative and significant in all regressions. Moreover, most of the
coefficients on diversification and organizational variables increase in absolute value when
controlling for the effects of governance.13 Of the governance variables, ownership variables
are significantly related to firm value with signs anticipated from the past studies of Japanese
firms (e.g., Morck et al., 2000; Nguyen, 2012). That is, firm value increases with managerial
and foreign ownerships and decreases with main bank ownership.
V. Propensity-Score Matching Estimations
A. Probit regressions
In estimating the values of diversification and organization, endogeneity is a serious
concern as managers deliberately chose the industrial scope and organizational form of their
firms. The regressions in the last section use fixed effects to cope with endogeneity due to
permanent firm attributes. However, a firm’s decisions regarding industrial scope and
organization can also be affected by time-varying factors. To address endogeneity of the latter
type, propensity-score matching estimations are performed in this section by focusing on
large discrete changes in diversification status and organizational structure. Villalonga (2004)
and Colak and Whited (2006) performed propensity-score matching estimations based on U.S.
data and found no discount for diversified firms.
13 Due to the difference in estimation windows, regression coefficients are not strictly comparable between the present and previous regressions. When the regressions without governance variables are performed on the estimation samples of Columns (6) to (8) of Table VII, the coefficient on the diversification dummy ranges from -.062 to -.084, while the coefficients for organizational variables is -.058 (logged number of subsidiaries), -.157 (subsidiary employment ratio), and -.097 (holding company dummy).

24
Specifically, to estimate the value of diversification, treated firms whose
diversification status changed from focused to diversified (diversifying firms) or vice versa
(refocusing firms) are matched with untreated (control) firms that were comparable in terms
of ex ante probability (propensity score) of diversifying/refocusing. The value of
diversification is then estimated as the average treatment effect on the treated by comparing
changes in excess value between treated and untreated firms. Similarly, to estimate the value
of organization, changes in excess value are compared between firms that adopted a
holding-company structure for reorganization (reorganizing firms) and non-reorganizing
firms that had a comparable probability of adopting the structure.14 Changes (differences)
rather than levels are compared because the regressions in the last section revealed substantial
persistent heterogeneity in firm value. Difference-in-differences matching estimations are
robust to unobserved permanent heterogeneity as well as selection biases due to time-varying
observed factors (Heckman et al., 1998; Smith and Todd, 2005).
The propensity score for diversifying (refocusing) are estimated based on all firms
that were focused (diversified) in the previous year. That is, a probit model is run to estimate
the probability that a firm focused (diversified) in year t-1 becomes diversified (focused) in
year t conditional on its characteristics in t-1. Similarly, the probability of a firm’s adopting a
holding-company structure is estimated based on all firms that had not adopted the structure
by the previous year. The predictors for the baseline diversification model include subsidiary
employment ratio, logged assets, EBITDA/sales, capital expenditure/sales, R&D expenditure/
sales, marketing expenditure/sales, foreign sales ratio, market leverage, share of diversified
firms in the 3-digit industry, and year dummies. In addition to these variables, the refocusing
model includes the diversification index and a financial distress dummy, which takes the
14 Holding companies created by merger are omitted from estimations because they are not matchable to a single firm prior to the merger.
25
value of one for firms with negative net income. The reorganization model shares the same
predictors with the refocusing model except that the share of diversified firms in the 3-digit
industry is replaced by the share of holding companies in the industry.
The estimation results of baseline probit models are reported in Columns (1) to (3) of
Table VIII. The results show, for each treatment, that treated firms differ from untreated firms
in many respects. In particular, firms with a legally more segmented structure are more (less)
likely to diversify (refocus) as the coefficient for the subsidiary employment ratio is
significantly positive in Column (1) and negative in Column (2), where the dependent
variable is diversifying and refocusing likelihoods, respectively. This pattern underpins the
importance of controlling for legal structure in estimating the value of diversification.
Column (1) also shows that diversifying firms are larger, less profitable, and more dependent
on domestic revenues than firms that stay focused on a single business. In Column (2), the
coefficient for the financial distress dummy is negative and highly significant. Refocusing
firms were, therefore, under strong pressure to restructure. In Column (3), where the firm’s
probability of adopting a holding-company structure is estimated, the effect of profitability is
negative and significant. Thus, poor performance stimulates drastic reorganization as well as
refocusing. Column (3) also shows that firms adopting a holding-company structure had a
segmented organization even before the reorganization as the coefficient for subsidiary
employment ratio is positive and significant.
The propensity scores estimated from these regressions differ non-trivially between
treated and non-treated firms. To create a sample of control firms that are comparable to
treated firms, a caliper-based matching, which ensures that matching is performed on a
common support, is conducted. Specifically, for each treated firm, up to three untreated firms
with a proximate propensity score are chosen as control firms with replacement. Following
Rosenbaum and Rubin (1985), the caliper is set to one-quarter of the standard deviation of
26
estimated propensity scores. In estimating the treatment effect, changes in excess value from
the pre-treatment year (t-1) to the treatment year (t), one year after treatment (t+1), and two
years after treatment (t+2) are compared. As a measure of pre-treatment trend, changes from
three years before treatment (t-3) to t-1 are also examined.
B. Treatment effects
The estimated treatment effects are tabulated in Table IX. As reported in Panel (1),
diversifying firms lost, on average, 7.6% in value from one year before diversification (t-1) to
the year of diversification (t). As the mean value of control firms declined by 1.6% in the
same interval, the average treatment effect estimated as the difference-in-differences was
-6.0%. This estimate of diversification discount is significantly different from zero at the .05
level and comparable to the regression-based discounts reported in the last section. When
changes in excess value are measured over two or three years, the estimated diversification
discount doubles in size and becomes statistically stronger.
If the value of diversification is negative, firms should regain value when they are no
longer diversified. This prediction is confirmed in Panel (2) where changes in excess value
are compared between refocusing firms and non-refocusing firms. That is, refocusing firms
gained 8% in value vis-à-vis non-refocusing firms in the year of refocusing (t). This increase
in value is significant at the.05 level and sustained in the ensuing year. Matching estimations
also confirm that the value of the holding-company structure is negative. As reported in Panel
(3), the value of reorganizing firms, on average, declined by 10 to 12% vis-à-vis the value of
control firms over three years following reorganization.
Notice that in Panels (2) and (3), the difference in changes in excess value is
significant for the pre-treatment period [t-3, t-1] as well. Therefore, the values of refocusing
firms and reorganizing firms exhibit a trend that is not shared by control firms. This result

27
raises a concern that the difference in the post-treatment behavior of excess value might be
driven by unobserved factors that generated the trend. To examine this possibility, refocusing
firms and reorganizing firms are matched to untreated firms based on the change in excess
value in [t-3, t-1] in addition to the baseline predictors. The probit regressions reported in
Columns (4) and (5) of Table VIII demonstrate that, consistent with the negative
pre-treatment trends documented in Table IX, the change in excess value in [t-3, t-1] is
negatively and significantly associated with a firm’s refocusing and reorganization
probabilities. The results of propensity-score matching estimations based on these probit
regressions are tabulated in Panels (4) and (5) of Table IX. Pre-treatment trends are
successfully controlled in these estimations as evidenced by the similar decline in the [t-3,
t-1] values of both treated and untreated firms. Nevertheless, large significant differences
appear in the post-treatment behavior of excess value. Specifically, refocusing firms gained 8
to12% in value compared with control firms, whereas reorganizing firms lost 11 to 13% in
value vis-à-vis control firms.
In Columns (6) to (8) of Table VIII, probit models that incorporate governance
variables are estimated to examine the role of agency motives in the firm’s choices of
industrial scope and organizational form. In Column (6), where the firm’s probability to
diversify is estimated, the effect of the managerial ownership ratio is significantly positive.
This result is consistent with the view that managers whose wealth is closely tied to their firm
have a strong incentive to diversify the firm to reduce personal risks (Amihud and Lev, 1981;
May, 1995). In Column (7), where the dependent variable is the refocusing probability, the
coefficient for board size is negative, which is consistent with the notion that smaller boards
are more effective in disciplining managers (e.g., Yermack, 1996). The effect of main bank
ownership is also negative and significant, lending support to the view that main banks
discourage the restructuring of client firms (Caballero et al., 2008). These results suggest that

28
managerial agency motives play a role in the determination of a firm’s industrial scope. On
the other hand, the effects of governance on the firm’s decision to adopt a holding-company
structure are perplexing. In Column (8), the effect of independent director ratio is positive
and significant, even though board independence is generally associated with
value-increasing corporate decisions. The effect of managerial ownership is also positive and
significant. However, unlike diversification, how managers who are also shareholders of their
firms benefit from the holding-company structure despite its negative effect on firm value is
unclear.
The matching estimations based on the propensity scores estimated from the above
probit regressions incorporating governance variables are reported in Panels (6) to (8) of
Table IX. The patterns identified without a control for governance factors are clearly
replicated. That is, firms lose value when they diversify, and they gain value when they
refocus, thus suggesting that the value of diversification is negative. The estimated value of
the holding-company structure is also negative as reorganizing firms lose value vis-à-vis
non-reorganizing firms after the adoption of the structure. Overall, the propensity-score
matching estimations performed in this section robustly confirm that diversified firms and
holding companies trade at a discount in Japan.
VI. Conclusions
A firm’s industrial scope and organization coevolve. As such, the diversification
discount widely reported in the literature can be caused by the organizational structure as well
as the industrial scope of diversified firms. To examine this possibility, the present paper
estimated jointly the values of diversification and organization based on a large panel of
Japanese firms. Using a standard measure of excess value, a diversification discount that is
robust to alternative controls for endogeneity was identified. A discount for firms with a

29
legally segmented structure, such as holding companies, was also found. Consistent with the
view that the discount for diversified firms is partly caused by organizational structure rather
than industrial scope, taking organization into account in regressions decreases the size of
diversification discounts, albeit to a limited extent. Taken together, the results presented in
this paper suggest that diversification and organization are both important determinants of
firm value.
These findings bear on various strands of academic research. For example, the
diversification discount robustly identified for Japanese firms is in discord with influential
evidence for U.S. firms, such as that presented by Campa and Kedia (2002) and Villalonga
(2004), but is in accord with more recent U.S. evidence supplied by Hoechle et al. (2012).
Further research is needed to reconcile conflicting evidence. The discount for a legally
segmented corporate structure is a novel finding. Understanding why it occurs is important
for organizational researchers as well as financial economists because it can be a revelation of
the cost of decentralized decisions, such as coordination failures and agency hazards of
operating managers. Moreover, unlike diversification, which may be pursued by managers for
private benefits, why firms adopt a value-decreasing organizational structure is not obvious.
Resolving this puzzle is another important avenue for research.

30
References Acemoglu, S., Aghion, P., Lelarge, C., Van Reenen, J., Zilibotti, F., 2007. Technology, information and the decentralization of the firm, Quarterly Journal of Economics 122, 1759- 1799. Aghion, P., Tirole, J., 1997. Formal and real authority in organizations, Journal of Political Economy 105, 1-29. Amihud, Y., Lev, B., 1981, Risk reduction as a managerial motive for conglomerate mergers, Bell Journal of Economics 12, 605-617. Baker, G. P., 1992. Beatrice: A study in the creation and destruction of value, Journal of Finance 47, 1081-1119. Baker, G., Gibbons, R., Murphy, K. J., 1999. Informal authority in organizations, Journal of Law, Economics, and Organization 15, 56-73. Berger, P. G., Ofek, E., 1995. Diversification’s effect on firm value, Journal of Financial Economics 37, 39-65. Bernardo, A.E., Chowdhry, B., 2002. Resources, real options, and corporate strategy, Journal of Financial Economics 63, 211–234. Bethel, J.E., Liebeskind, J. P., 1998. Diversification and the legal organization of the firm, Organization Science 9, 49-67. Caballero, R. J., Hoshi, T., Kashyap, A.K., 2008. Zombie lending and depressed restructuring in Japan, American Economic Review 98, 1943-77. Campa, J. M., Kedia, S., 2002. Explaining the diversification discount, Journal of Finance 57, 1731-1762. Chandler, A.D., Jr., 1962. Strategy and Structure. Cambridge, MA: MIT Press Colak, G., Whited, T. M., 2006. Spin-offs, divestitures, and conglomerate investment, Review of Financial Studies 20, 557-595.
31
Dessein, W., 2002. Authority and communication in organizations, Review of Economic Studies 69, 811-838. Dessein, W., Garciano, L., Gertner, R., 2010. Organizing for synergy, American Economic Journal: Microeconomics 2, 77-114. Dell'ariccia, G., Marquez, R., 2010. Risk and the corporate structure of banks, Journal of Finance 65, 1075–1096. Fan,J. P. H., Wong, T. J., Zhang, T., 2013. Institutions and organizational structure: the case of state-owned corporate pyramids, Journal of Law, Economics, & Organization 29, 1217-1252. Gomes, J., Livdan, D., 2004. Optimal diversification: Reconciling theory and evidence, Journal of Finance 59, 507-535. Hansmann, H., Kraakman, R., 2000. Organizational law as asset partitioning, European Economic Review 44, 807-817. Heckman, J., Ichimura, H., Smith, J., Todd, P., 1998. Characterizing selection bias using experimental data, Econometrica 66, 1017-1098. Hoechle, D., Schmid, M., Walter, I., Yermack, D., 2012. How much of the diversification discount can be explained by poor corporate governance? Journal of Financial Economics 103, 41-60. Iacobucci, E.M., Triantis, G. G., 2007. Economic and legal boundaries of firms, Virginia Law Review 93, 515-570. Itoh, H., Kikutani, T., Hayashida, O., 2008. Complementarities among authority, accountability, and monitoring: Evidence from Japanese business groups, Journal of the Japanese and International Economies 22, 207-228. Itoh, H., Shishido, Z., 2001. The firm as a legal entity: What distinguishes wholly owned subsidiaries from internal divisions in Japan, Working Paper, Hitotsubashi University. Kikutani, T., Itoh, H., Hayashida, O., 2007. Business portfolio restructuring of Japanese firms in the 1990s: Entry and exit analysis. In: M. Aoki, G. Jackson, H. Miyajima, eds., Corporate

32
Governance in Japan: Institutional Change and Organizational Diversity. Oxford: Oxford University Press, 227-256. Klein, P. G., Saidenberg, M. R., 2010. Organizational structure and the diversification discount: evidence from commercial banking, Journal of Industrial Economics 58, 127-158. Kolasinski, A. C., 2009. Subsidiary debt, capital structure and internal capital markets, Journal of Financial Economics 94, 327-343. Lang, L., Stulz, R., 1994. Tobin’s q, corporate diversification, and firm performance, Journal of Political Economy 102, 1248-1280. La Porta, R., Lopez-De-Silanes, F., Shleifer, A. 1999. Corporate ownership around the world, Journal of Finance 54, 471–517. Leland, H. E., 2007. Financial synergies and the optimal scope of the firm: Implications for mergers, spinoffs, and structured finance, Journal of Finance 62, 765-807. Matsusaka, J.G., 2001. Corporate diversification, value maximization, and organizational Capabilities, Journal of Business 74, 409-431. May, D.O., 1995. Do managerial motives influence firm risk reduction strategies? Journal of Finance 50, 1291-1308. Morck, R., Nakamura, M., 2005. A frog in a well knows nothing of the ocean: A history of corporate ownership in Japan. In: Randall K. Morck ed. A History of Corporate Ownership around the World: Family Business Groups to Professional Managers. Chicago, IL: University of Chicago Press. Morck, R., Nakamura, M., Shivdasani, A., 2000. Banks, ownership structure, and firm value in Japan, Journal of Business 73, 539-567. Morck, R., Wolfenzon, D., Yeung, B., 2005. Corporate governance, economic entrenchment, and growth, Journal of Economic Literature 43, 655-720. Nguyen, P., 2012. The impact of foreign investors on the risk-taking of Japanese firms, Journal of the Japanese and International Economies 26, 233-248
33
Perez-Gonzalez, F., 2014. Organizational form and firm performance: Evidence from the 'death sentence' clause of the Public Utility Act of 1935, Stanford University Working Paper. Rajan, R., Servaes, H., Zingales, L., 2000. The cost of diversity: The diversification discount and inefficient investment, Journal of Finance 55, 35-80. Rosenbaum,P. R., Rubin, D. B., 1985. Constructing a control group using multivariate matched sampling methods that incorporate the propensity score, American Statistician 39, 33-38. Sanzhar, S.V., 2006. Discounted but not diversified: Organizational structure and conglomerate discount, Working Paper, University of North Carolina at Chapel hill. Scharfstein, D.S., Stein J.C., 2000. The dark side of internal capital markets: Divisional rent-seeking and inefficient investment, Journal of Finance 55, 2537-2564. Shin, H. H., Stulz, R. M., 1998. Are internal capital markets efficient? Quarterly Journal of Economics 113, 531-52. Smith, J., A., Todd, P. E., 2005. Does matching overcome LaLonde’s critique of nonexperimental estimators? Journal of Econometrics 125, 305-353. Stein, J. C., 1997. Internal capital markets and the competition for corporate resources, Journal of Finance 52, 111-34. Triantis, G.G., 2004. Organizations as internal capital markets: the legal boundaries of firms, collateral, and trust in commercial and charitable enterprises, Harvard Law Review 117, 1102-1162. Villalonga, B., 2004. Does diversification cause the “diversification discount”? Financial Management 33, 5-27. Williamson, O.E., 1975. Markets and Hierarchies: Analysis and Antitrust Implications. New York: Free Press. Yermack, D., 1996. Higher market valuation of companies with a small board of directors, Journal of Financial Economics 40, 185-211.

34
Figure 1. Alternative organizational forms of a diversified firm This figure depicts alternative organizational forms of a firm with two lines of business. The solid line represents the legal boundary of a firm, whereas the dotted line depicts divisional boundaries within the firm as a legal entity. In Case (1), both businesses are organized within the parent, in which corporate headquarters also reside. The organization of the firms therefore consists of three internal divisions encircled by the same legal boundary. Case (2) involves a legal segmentation of the firm as Business B is separated as a subsidiary and therefore has a legal identity that is distinct from that of the parent.

35
Figure 2. The distribution of holding companies by year and reason of creation This figure depicts the distribution of holding companies included in the sample by the year of creation and creation motive. In mergers, acquiring and acquired firms become subsidiaries of a holding company that is created for combining ownership but not organizations. In reorganizations, firms transform themselves to a corporate group topped by a holding company by spinning off all businesses and shared services.
36
Table I. Diversification and organizational variables by year
This table documents the average diversification profile and legal structure of the sample firms. Diversified firms are defined as firms that operate multiple 4-digit segments. The diversification index is one minus the sales-based Herfindahl index (4-digit). The number of subsidiaries is the number of consolidated subsidiaries. The subsidiary employment ratio is the ratio of subsidiary employees calculated as the difference between consolidated and unconsolidated employment to firm-wide (consolidated) employment.
# Observations% Diversified firms
(4-digit)Diversificationindex (mean)
# Subsidiaries(mean)
Subsidiaryemployment ratio
(mean, %)
% Holdingcompanies
2001 2,831 48.7 0.182 11.81 27.8 0.1
2002 2,965 48.8 0.182 11.36 28.2 0.3
2003 3,017 48.9 0.183 11.27 29.3 0.7
2004 3,049 49.9 0.187 11.85 30.8 1.4
2005 3,137 49.1 0.182 11.93 31.9 2.1
2006 3,207 49.2 0.180 12.39 33.2 3.1
2007 3,290 49.3 0.178 12.94 34.3 3.9
2008 3,282 50.2 0.178 13.42 35.4 4.8
2009 3,185 50.5 0.181 13.35 36.0 6.0
2010 3,089 50.8 0.181 13.76 36.7 6.6

37
Table II. Descriptive statistics of regression variables This table tabulates the means, medians, and standard deviations of the main regression variables. Focused firms are firms that operate only one 4-digit segment. Diversified firms are firms that operate multiple 4-digit segments. Excess value is as defined by Berger and Ofek (1995). The diversification dummy takes a value of one for diversified firms and zero for focused firms. The diversification index is the complement of the sales-based Herfindahl index. Logged # subsidiaries is the log of the number of subsidiaries plus one. The subsidiary employment ratio is equal to consolidated employment minus unconsolidated employment normalized by consolidated employment. Holding-company dummy is the dummy for firms with a holding-company structure. The control variables are self-explanatory except for marketing expenditure, which is the sum of advertising and sales promotion expenses. All financial and accounting variables are based on data obtained from the Nikkei NEEDS Financial QUEST database. The reported p-values are based on a t-test for means and a Wilcoxon test for medians.
Mean(median)
SDMean
(median)SD
Mean(median)
SD
Dependent variable
Excess value 0.018 0.485 0.026 0.481 0.009 0.489 0.000(0.000) (0.000) (0.010) (0.453)
Diversification
Diversification dummy 0.495 0.500 0 0 1 0(0) (0) (1)
Diversification index 0.181 0.237 0 0 0.366 0.214(0.000) (0) (0.380)
Organization
Logged # subsidiaries 1.702 1.239 1.118 1.096 2.295 1.083 0.000(1.609) (1.099) (2.079) (0.000)
Subsidiary employment ratio 0.325 0.296 0.207 0.266 0.445 0.275 0.000(0.263) (0.080) (0.430) (0.000)
Holding company dummy 0.030 0.169 0.017 0.129 0.043 0.202 0.000(0) (0) (0) (0.000)
Controls
Logged total assets 10.36 1.530 9.860 1.305 10.87 1.575 0.000(10.20) (9.782) (10.70) (0.000)
EBITDA/Sales 0.082 0.085 0.083 0.092 0.081 0.078 0.000(0.070) (0.069) (0.072) (0.056)
Capital expenditure/Sales 0.044 0.059 0.043 0.061 0.045 0.058 0.006(0.027) (0.025) (0.030) (0.000)
R&D expenditure/Sales 0.015 0.029 0.015 0.031 0.016 0.028 0.000(0.003) (0.002) (0.005) (0.000)
Marketing expenditure/Sales 0.015 0.035 0.017 0.038 0.013 0.032 0.000(0.001) (0.002) (0.001) (0.000)
Debt/Market equity 0.874 1.285 0.703 1.149 1.049 1.389 0.000(0.384) (0.249) (0.550) (0.000)
P-value ofdifference
All firms Focused Diversified
38
Table III. OLS and FE estimations of diversification discounts
These regressions estimate the diversification discount for Japanese firms publicly traded between 2001 and 2010. The dependent variable is excess value as defined by Berger and Ofek (1995). The explanatory variables are as defined in the text and Table II. The estimations reported in Columns (3) and (4) include firm-fixed effects. Year-fixed effects are included in all estimations. Standard errors are shown in parentheses. *** Significant at the 0.01 level. ** Significant at the 0.05 level. * Significant at the 0.10 level.
(1) (2) (3) (4)
Diversification dummy -0.063 *** -0.090 ***(0.005) (0.008)
Diversification index -0.105 *** -0.228 ***(0.011) (0.020)
Logged total assets 0.035 *** 0.034 *** -0.008 -0.009(0.002) (0.002) (0.007) (0.007)
EBITDA/Sales 1.519 *** 1.525 *** 0.447 *** 0.442 ***(0.032) (0.032) (0.035) (0.035)
Capital expenditure/Sales 1.406 *** 1.417 *** 0.565 *** 0.570 ***(0.045) (0.045) (0.038) (0.038)
R&D expenditure/Sales 1.366 *** 1.375 *** 1.311 *** 1.282 ***(0.087) (0.087) (0.151) (0.151)
Marketing expenditure/Sales 0.708 *** 0.699 *** 0.417 *** 0.425 ***(0.072) (0.072) (0.147) (0.147)
Debt/Market equity 0.034 *** 0.033 *** 0.016 *** 0.017 ***(0.002) (0.002) (0.002) (0.002)
Firm-fixed effects No No Yes Yes F-value of firm-fixed effects - - 16.61 *** 16.65 *** R-squared 0.177 0.175 0.770 0.770 # Observations 31,052 31,052 31,052 31,052
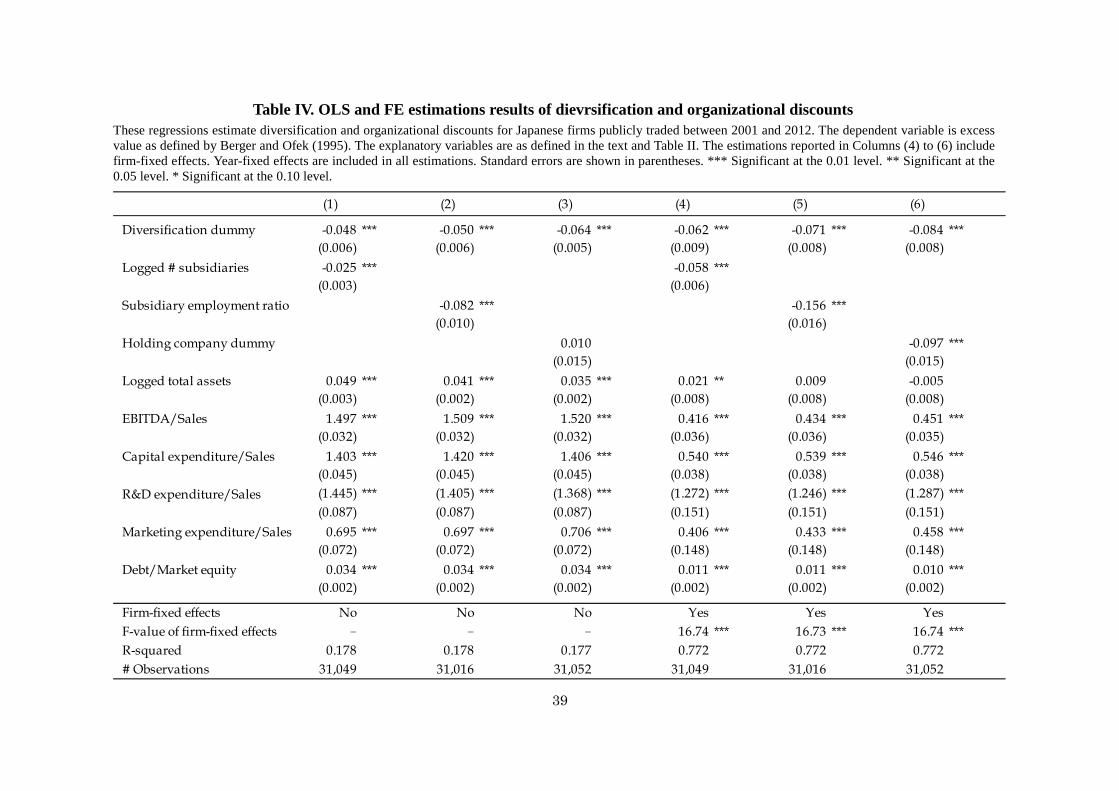
39
Table IV. OLS and FE estimations results of dievrsification and organizational discounts These regressions estimate diversification and organizational discounts for Japanese firms publicly traded between 2001 and 2012. The dependent variable is excess value as defined by Berger and Ofek (1995). The explanatory variables are as defined in the text and Table II. The estimations reported in Columns (4) to (6) include firm-fixed effects. Year-fixed effects are included in all estimations. Standard errors are shown in parentheses. *** Significant at the 0.01 level. ** Significant at the 0.05 level. * Significant at the 0.10 level.
(1) (2) (3) (4) (5) (6)
Diversification dummy -0.048 *** -0.050 *** -0.064 *** -0.062 *** -0.071 *** -0.084 ***(0.006) (0.006) (0.005) (0.009) (0.008) (0.008)
Logged # subsidiaries -0.025 *** -0.058 ***(0.003) (0.006)
Subsidiary employment ratio -0.082 *** -0.156 ***(0.010) (0.016)
Holding company dummy 0.010 -0.097 ***(0.015) (0.015)
Logged total assets 0.049 *** 0.041 *** 0.035 *** 0.021 ** 0.009 -0.005(0.003) (0.002) (0.002) (0.008) (0.008) (0.008)
EBITDA/Sales 1.497 *** 1.509 *** 1.520 *** 0.416 *** 0.434 *** 0.451 ***(0.032) (0.032) (0.032) (0.036) (0.036) (0.035)
Capital expenditure/Sales 1.403 *** 1.420 *** 1.406 *** 0.540 *** 0.539 *** 0.546 ***(0.045) (0.045) (0.045) (0.038) (0.038) (0.038)
R&D expenditure/Sales (1.445) *** (1.405) *** (1.368) *** (1.272) *** (1.246) *** (1.287) ***(0.087) (0.087) (0.087) (0.151) (0.151) (0.151)
Marketing expenditure/Sales 0.695 *** 0.697 *** 0.706 *** 0.406 *** 0.433 *** 0.458 ***(0.072) (0.072) (0.072) (0.148) (0.148) (0.148)
Debt/Market equity 0.034 *** 0.034 *** 0.034 *** 0.011 *** 0.011 *** 0.010 ***(0.002) (0.002) (0.002) (0.002) (0.002) (0.002)
Firm-fixed effects No No No Yes Yes Yes F-value of firm-fixed effects - - - 16.74 *** 16.73 *** 16.74 *** R-squared 0.178 0.178 0.177 0.772 0.772 0.772 # Observations 31,049 31,016 31,052 31,049 31,016 31,052

40
Table V. FE estimations based on alternative diversification measures These regressions check the confounding effect of diversification level and type on the value of legal structure based on a sample of public Japanese firms for 2001 to 2010. The dependent variable is excess value as defined by Berger and Ofek (1995). Related diversification is a dummy for firms that are diversified at the 4-digit level but focused at the 2-digit level. Unrelated diversification is a dummy for firms that are diversified at the 2-digit level. Other explanatory variables are as defined in the text and Table II. All estimations include firm- and year-fixed effects. Standard errors are shown in parentheses. *** Significant at the 0.01 level. ** Significant at the 0.05 level. * Significant at the 0.10 level.
(1) (2) (3) (4) (5) (6) Diversification index -0.165 *** -0.181 *** -0.211 ***
(0.021) (0.021) (0.020) Related diversification dummy -0.046 *** -0.053 *** -0.065 ***
(0.016) (0.016) (0.016) Unrelated diversification dummy -0.064 *** -0.074 *** -0.087 ***
(0.009) (0.008) (0.008) Logged # subsidiaries -0.058 *** -0.057 ***
(0.006) (0.006) Subsidiary employment ratio -0.155 *** -0.155 ***
(0.016) (0.016) Holding company dummy -0.095 *** -0.096 ***
(0.015) (0.015) Logged total assets 0.021 *** 0.009 -0.005 0.021 ** 0.009 -0.004
(0.008) (0.008) (0.008) (0.008) (0.008) (0.008) EBITDA/Sales 0.409 *** 0.428 *** 0.444 *** 0.416 *** 0.434 *** 0.451 ***
(0.036) (0.036) (0.036) (0.036) (0.036) (0.035) Capital expenditure/Sales 0.543 *** 0.543 *** 0.551 *** 0.540 *** 0.538 *** 0.545 ***
(0.038) (0.038) (0.038) (0.038) (0.038) (0.038) R&D expenditure/Sales 1.248 *** 1.223 *** 1.260 *** 1.274 *** 1.249 *** 1.290 ***
(0.151) (0.151) (0.151) (0.151) (0.151) (0.151) Marketing expenditure/Sales (0.405) *** (0.435) *** (0.460) *** (0.407) *** (0.434) *** (0.458) ***
(0.148) (0.148) (0.148) (0.148) (0.148) (0.148) Debt/Market equity 0.011 *** 0.011 *** 0.010 *** 0.011 *** 0.011 *** 0.010 ***
(0.002) (0.002) (0.002) (0.002) (0.002) (0.002) Firm-fixed effects Yes Yes Yes Yes Yes Yes F-value of firm-fixed effects 16.77 *** 16.76 *** 16.78 *** 16.69 *** 16.68 *** 16.69 *** R-squared 0.772 0.772 0.772 0.772 0.772 0.772 # Observations 31,049 31,016 31,052 31,049 31,016 31,052
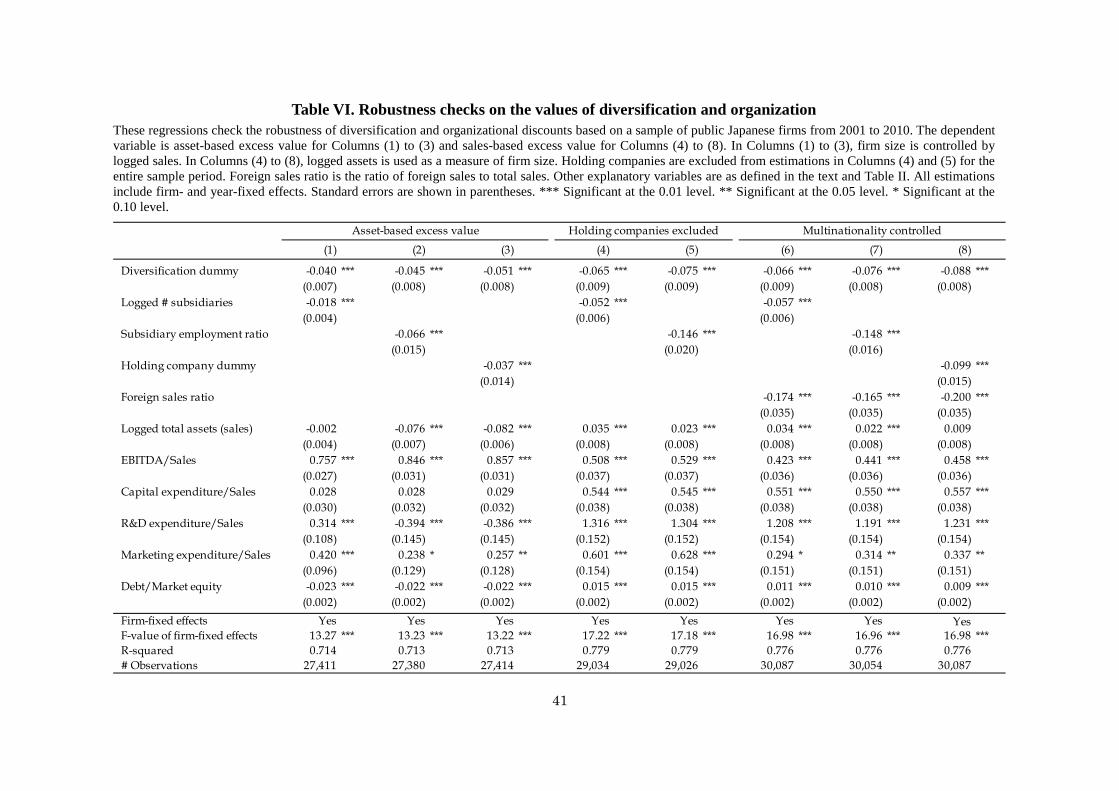
41
Table VI. Robustness checks on the values of diversification and organization These regressions check the robustness of diversification and organizational discounts based on a sample of public Japanese firms from 2001 to 2010. The dependent variable is asset-based excess value for Columns (1) to (3) and sales-based excess value for Columns (4) to (8). In Columns (1) to (3), firm size is controlled by logged sales. In Columns (4) to (8), logged assets is used as a measure of firm size. Holding companies are excluded from estimations in Columns (4) and (5) for the entire sample period. Foreign sales ratio is the ratio of foreign sales to total sales. Other explanatory variables are as defined in the text and Table II. All estimations include firm- and year-fixed effects. Standard errors are shown in parentheses. *** Significant at the 0.01 level. ** Significant at the 0.05 level. * Significant at the 0.10 level.
(1) (2) (3) (4) (5) (6) (7) (8)
Diversification dummy -0.040 *** -0.045 *** -0.051 *** -0.065 *** -0.075 *** -0.066 *** -0.076 *** -0.088 ***(0.007) (0.008) (0.008) (0.009) (0.009) (0.009) (0.008) (0.008)
Logged # subsidiaries -0.018 *** -0.052 *** -0.057 ***(0.004) (0.006) (0.006)
Subsidiary employment ratio -0.066 *** -0.146 *** -0.148 ***(0.015) (0.020) (0.016)
Holding company dummy -0.037 *** -0.099 ***(0.014) (0.015)
Foreign sales ratio -0.174 *** -0.165 *** -0.200 ***(0.035) (0.035) (0.035)
Logged total assets (sales) -0.002 -0.076 *** -0.082 *** 0.035 *** 0.023 *** 0.034 *** 0.022 *** 0.009(0.004) (0.007) (0.006) (0.008) (0.008) (0.008) (0.008) (0.008)
EBITDA/Sales 0.757 *** 0.846 *** 0.857 *** 0.508 *** 0.529 *** 0.423 *** 0.441 *** 0.458 ***(0.027) (0.031) (0.031) (0.037) (0.037) (0.036) (0.036) (0.036)
Capital expenditure/Sales 0.028 0.028 0.029 0.544 *** 0.545 *** 0.551 *** 0.550 *** 0.557 ***(0.030) (0.032) (0.032) (0.038) (0.038) (0.038) (0.038) (0.038)
R&D expenditure/Sales 0.314 *** -0.394 *** -0.386 *** 1.316 *** 1.304 *** 1.208 *** 1.191 *** 1.231 ***(0.108) (0.145) (0.145) (0.152) (0.152) (0.154) (0.154) (0.154)
Marketing expenditure/Sales 0.420 *** 0.238 * 0.257 ** 0.601 *** 0.628 *** 0.294 * 0.314 ** 0.337 **(0.096) (0.129) (0.128) (0.154) (0.154) (0.151) (0.151) (0.151)
Debt/Market equity -0.023 *** -0.022 *** -0.022 *** 0.015 *** 0.015 *** 0.011 *** 0.010 *** 0.009 ***(0.002) (0.002) (0.002) (0.002) (0.002) (0.002) (0.002) (0.002)
Firm-fixed effects Yes Yes Yes Yes Yes Yes Yes Yes F-value of firm-fixed effects 13.27 *** 13.23 *** 13.22 *** 17.22 *** 17.18 *** 16.98 *** 16.96 *** 16.98 *** R-squared 0.714 0.713 0.713 0.779 0.779 0.776 0.776 0.776 # Observations 27,411 27,380 27,414 29,034 29,026 30,087 30,054 30,087
Holding companies excluded Multinationality controlledAsset-based excess value

42
Table VII. More robustness checks on the value of diversification and organization These regressions perform robustness checks of the value of diversification and organizational structure. The dependent variable is sales-based excess value. Columns (3) to (5) represent quantile regressions where the dependent variable is the 1st, 5th, and 9th decile of excess value, respectively. Parent EBITDA is EBITDA taken from the firm’s unconsolidated statement. Subsidiary EBITDA is consolidated EBITDA minus unconsolidated EBITDA. Board size is the number of directors. Independent director ratio is the share of independent external directors on the board. Managerial ownership is the share of equities held by managers. Main bank ownership is the share of equities owned by the firm’s main bank (primary lender). Foreign investor ownership is the share of equities owned by foreign investors. All governance variables are obtained from the Nikkei NEEDS-Cges database. Other explanatory variables are as defined in the text and Table II. All regressions include year-fixed effects. Firm-fixed effects are included in all regressions except Columns (3) to (5). Standard errors are shown in parentheses. *** Significant at the 0.01 level. ** Significant at the 0.05 level. * Significant at the 0.10 level. The R-squared values are reported for all regressions except Columns (3) to (5), for which the pseudo R-squared value is reported.
Continued on next page
1st decile 5th decile 9th decile(1) (2) (3) (4) (5) (6) (7) (8)
Diversification dummy -0.057 *** -0.066 *** -0.107 *** -0.034 *** -0.032 *** -0.082 *** -0.096 *** -0.112 ***(0.009) (0.008) (0.009) (0.006) (0.012) (0.011) (0.011) (0.010)
Logged # subsidiaries -0.051 *** -0.076 ***(0.006) (0.008)
Subsidiary employment ratio -0.149 *** -0.098 *** -0.096 *** -0.120 *** -0.171 ***(0.020) (0.017) (0.011) (0.022) (0.021)
Holding company dummy -0.076 ***(0.017)
Parent EBITDA/Sales 0.500 *** 0.514 ***(0.039) (0.039)
Subsidiary EBITDA/Sales 0.307 *** 0.360 ***(0.101) (0.101)
Board size 0.001 0.001 0.001(0.001) (0.001) (0.001)
Independent director ratio -0.016 -0.013 -0.017(0.028) (0.028) (0.028)
Managerial ownership 0.051 * 0.055 * 0.052 *(0.031) (0.031) (0.031)
Main bank ownership -1.110 *** -1.178 *** -1.084 ***(0.324) (0.325) (0.324)
Foreign investor ownership 0.388 *** 0.394 *** 0.399 ***(0.048) (0.048) (0.048)
Quantile regressionsParent and subsidiary profitsseparated
Corporate governance controlled

43
Table VII continued
Logged total assets (sales) 0.022 *** 0.012 0.092 *** 0.052 *** -0.001 0.006 -0.012 -0.028 ***(0.008) (0.008) (0.003) (0.002) (0.004) (0.011) (0.011) (0.010)
EBITDA/Sales 2.028 *** 1.932 *** 1.646 *** 0.211 *** 0.236 *** 0.260 ***(0.055) (0.035) (0.069) (0.042) (0.041) (0.041)
Capital expenditure/Sales 0.538 *** 0.539 *** 0.801 *** 1.150 *** 2.321 *** 0.401 *** 0.403 *** 0.410 ***(0.038) (0.038) (0.077) (0.049) (0.096) (0.045) (0.045) (0.045)
R&D expenditure/Sales 1.303 *** 1.290 *** 0.492 *** 0.417 *** 2.067 *** 1.265 *** 1.254 *** 1.308 ***(0.152) (0.152) (0.147) (0.093) (0.184) (0.196) (0.196) (0.196)
Marketing expenditure/Sales 0.506 *** 0.534 *** 0.148 0.377 *** 1.662 *** 0.215 0.261 0.292 *(0.152) (0.152) (0.121) (0.077) (0.152) (0.175) (0.175) (0.175)
Debt/Market equity 0.014 *** 0.013 *** 0.056 *** 0.038 *** 0.015 *** 0.011 *** 0.010 *** 0.010 ***(0.002) (0.002) (0.003) (0.002) (0.004) (0.003) (0.003) (0.003)
Firm-fixed effects Yes Yes No No No Yes Yes Yes F-value of firm-fixed effects 17.05 *** 17.02 *** - - - 15.58 *** 15.55 *** 15.56 *** R-squared/Pseudo R-squared 0.779 0.779 0.119 0.097 0.122 0.810 0.809 0.809 # Observations 30,130 30,122 31,016 31,016 31,016 21,753 21,725 21,756
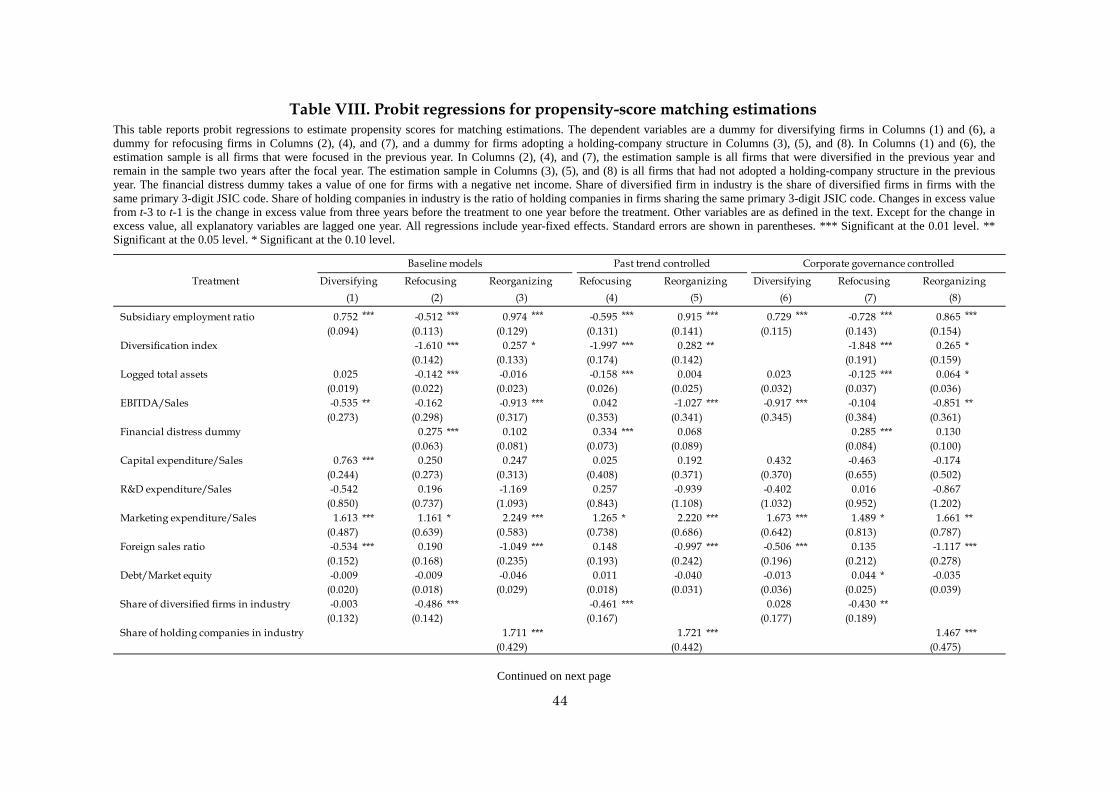
44
Table VIII. Probit regressions for propensity-score matching estimations This table reports probit regressions to estimate propensity scores for matching estimations. The dependent variables are a dummy for diversifying firms in Columns (1) and (6), a dummy for refocusing firms in Columns (2), (4), and (7), and a dummy for firms adopting a holding-company structure in Columns (3), (5), and (8). In Columns (1) and (6), the estimation sample is all firms that were focused in the previous year. In Columns (2), (4), and (7), the estimation sample is all firms that were diversified in the previous year and remain in the sample two years after the focal year. The estimation sample in Columns (3), (5), and (8) is all firms that had not adopted a holding-company structure in the previous year. The financial distress dummy takes a value of one for firms with a negative net income. Share of diversified firm in industry is the share of diversified firms in firms with the same primary 3-digit JSIC code. Share of holding companies in industry is the ratio of holding companies in firms sharing the same primary 3-digit JSIC code. Changes in excess value from t-3 to t-1 is the change in excess value from three years before the treatment to one year before the treatment. Other variables are as defined in the text. Except for the change in excess value, all explanatory variables are lagged one year. All regressions include year-fixed effects. Standard errors are shown in parentheses. *** Significant at the 0.01 level. ** Significant at the 0.05 level. * Significant at the 0.10 level.
Continued on next page
Treatment Diversifying Refocusing Reorganizing Refocusing Reorganizing Diversifying Refocusing Reorganizing(1) (2) (3) (4) (5) (6) (7) (8)
Subsidiary employment ratio 0.752 *** -0.512 *** 0.974 *** -0.595 *** 0.915 *** 0.729 *** -0.728 *** 0.865 ***(0.094) (0.113) (0.129) (0.131) (0.141) (0.115) (0.143) (0.154)
Diversification index -1.610 *** 0.257 * -1.997 *** 0.282 ** -1.848 *** 0.265 *(0.142) (0.133) (0.174) (0.142) (0.191) (0.159)
Logged total assets 0.025 -0.142 *** -0.016 -0.158 *** 0.004 0.023 -0.125 *** 0.064 *(0.019) (0.022) (0.023) (0.026) (0.025) (0.032) (0.037) (0.036)
EBITDA/Sales -0.535 ** -0.162 -0.913 *** 0.042 -1.027 *** -0.917 *** -0.104 -0.851 **(0.273) (0.298) (0.317) (0.353) (0.341) (0.345) (0.384) (0.361)
Financial distress dummy 0.275 *** 0.102 0.334 *** 0.068 0.285 *** 0.130(0.063) (0.081) (0.073) (0.089) (0.084) (0.100)
Capital expenditure/Sales 0.763 *** 0.250 0.247 0.025 0.192 0.432 -0.463 -0.174(0.244) (0.273) (0.313) (0.408) (0.371) (0.370) (0.655) (0.502)
R&D expenditure/Sales -0.542 0.196 -1.169 0.257 -0.939 -0.402 0.016 -0.867(0.850) (0.737) (1.093) (0.843) (1.108) (1.032) (0.952) (1.202)
Marketing expenditure/Sales 1.613 *** 1.161 * 2.249 *** 1.265 * 2.220 *** 1.673 *** 1.489 * 1.661 **(0.487) (0.639) (0.583) (0.738) (0.686) (0.642) (0.813) (0.787)
Foreign sales ratio -0.534 *** 0.190 -1.049 *** 0.148 -0.997 *** -0.506 *** 0.135 -1.117 ***(0.152) (0.168) (0.235) (0.193) (0.242) (0.196) (0.212) (0.278)
Debt/Market equity -0.009 -0.009 -0.046 0.011 -0.040 -0.013 0.044 * -0.035(0.020) (0.018) (0.029) (0.018) (0.031) (0.036) (0.025) (0.039)
Share of diversified firms in industry -0.003 -0.486 *** -0.461 *** 0.028 -0.430 ** (0.132) (0.142) (0.167) (0.177) (0.189) Share of holding companies in industry 1.711 *** 1.721 *** 1.467 ***
(0.429) (0.442) (0.475)
Baseline models Past trend controlled Corporate governance controlled
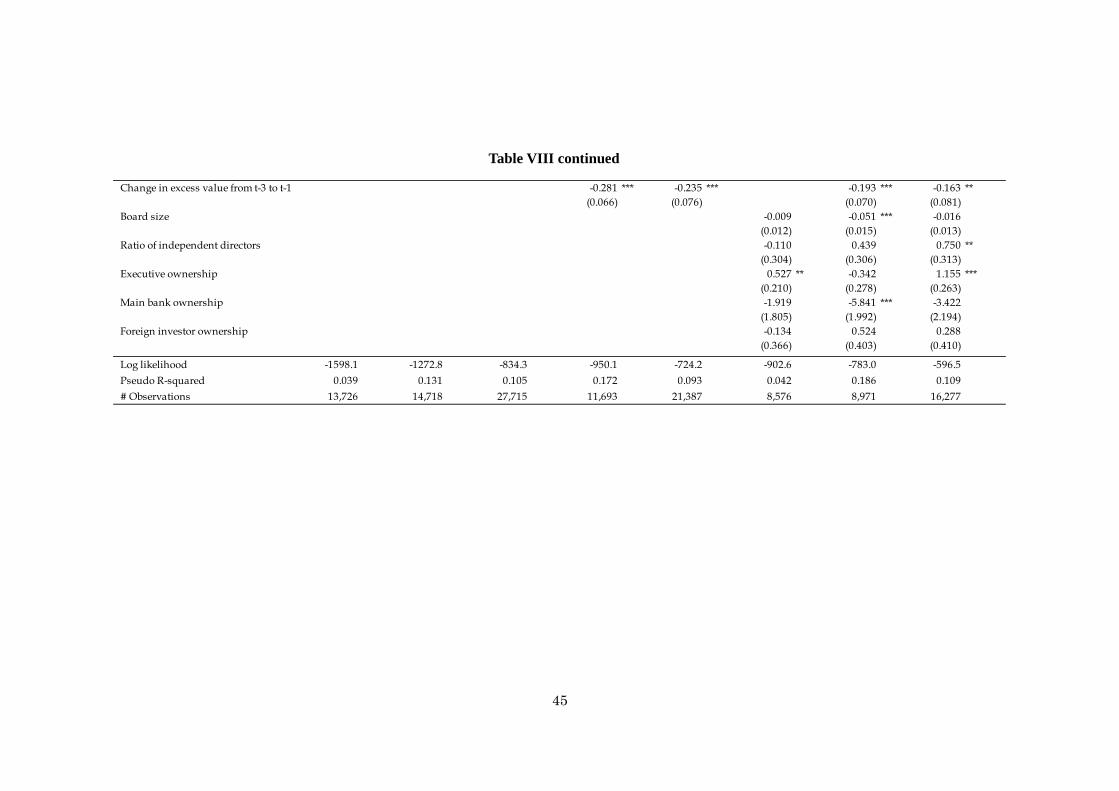
45
Table VIII continued
Change in excess value from t-3 to t-1 -0.281 *** -0.235 *** -0.193 *** -0.163 **(0.066) (0.076) (0.070) (0.081)
Board size -0.009 -0.051 *** -0.016(0.012) (0.015) (0.013)
Ratio of independent directors -0.110 0.439 0.750 **(0.304) (0.306) (0.313)
Executive ownership 0.527 ** -0.342 1.155 ***(0.210) (0.278) (0.263)
Main bank ownership -1.919 -5.841 *** -3.422(1.805) (1.992) (2.194)
Foreign investor ownership -0.134 0.524 0.288(0.366) (0.403) (0.410)
Log likelihood -1598.1 -1272.8 -834.3 -950.1 -724.2 -902.6 -783.0 -596.5 Pseudo R-squared 0.039 0.131 0.105 0.172 0.093 0.042 0.186 0.109 # Observations 13,726 14,718 27,715 11,693 21,387 8,576 8,971 16,277

46
Table IX. Propensity-score matching estimations of the values of diversification and
holding-company structure This table compares the average changes in excess value between treated and untreated (control) firms from one year before the treatment (t-1) to the treatment year (t), from t-1 to one year after the treatment (t+1), from t-1 to two years after the treatment (t+2), and three years before the treatment (t-3) to t-1. The matching of untreated firms to treated firms in each panel is based on the propensity scores estimated from the probit model that is assigned the same number as the column number in Table VIII. Difference reports the mean value of treated firms minus the mean value of untreated firms. The number of observations is in brackets. Standard errors are reported in parentheses. * Significant at the .10 level. ** Significant at the .05 level. *** Significant at the .01 level.
Continued on next page
[t-3, t-1] [t-1, t] [t-1, t+1] [t-1, t+2]
Baseline estimation results
Diversifying -0.022 -0.076 -0.143 -0.135[225] [356] [349] [337]
(1) Control -0.001 -0.016 -0.023 -0.021[640] [997] [977] [946]
Difference -0.021 -0.060 ** -0.120 *** -0.113 ***(0.039) (0.026) (0.032) (0.031)
Refocusing -0.148 0.072 0.084 0.043[234] [300] [291] [275]
(2) Control -0.012 -0.007 0.006 0.027[630] [819] [794] [758]
Difference -0.136 *** 0.080 ** 0.078 ** 0.016(0.040) (0.033) (0.034) (0.036)
Reorganizing -0.130 -0.121 -0.102 -0.092[129] [148] [145] [413]
(3) Control 0.005 0.000 -0.002 0.003[378] [433] [424] [141]
Difference -0.134 ** -0.121 *** -0.100 ** -0.095 **(0.050) (0.038) (0.037) (0.043)
Past trend controlled
Refocusing -0.148 0.107 0.107 0.076[234] [234] [226] [215]
(4) Control -0.129 0.002 -0.014 -0.003[626] [626] [604] [582]
Difference -0.019 0.105 *** 0.121 *** 0.080 *(0.041) (0.037) (0.039) (0.040)
Reorganizing -0.130 -0.103 -0.078 -0.070[129] [129] [126] [124]
(5) Control -0.111 0.013 0.036 0.064[380] [380] [371] [365]
Difference -0.019 -0.116 *** -0.114 *** -0.134 ***(0.052) (0.041) (0.041) (0.043)
Pre-treatment change Post-treatment changes

47
Table IX continued
Corporate governance controlledDiversifying -0.009 -0.087 -0.144 -0.140
[174] [196] [191] [186](6) Control -0.009 -0.023 -0.005 -0.014
[491] [556] [543] [528]Difference 0.000 -0.064 -0.139 *** -0.127 ***
(0.043) (0.039) (0.043) (0.045)
Refocusing -0.127 0.121 0.105 0.077[198] [198] [193] [183]
(7) Control -0.134 0.001 0.004 0.038[530] [530] [515] [491]
Difference 0.008 0.121 *** 0.101 ** 0.039(0.046) (0.043) (0.044) (0.046)
Reorganizing -0.141 -0.091 -0.049 -0.048[111] [111] [108] [106]
(8) Control -0.097 0.006 0.031 0.034[321] [321] [312] [304]
Difference -0.044 -0.096 ** -0.080 * -0.082 *(0.057) (0.045) (0.043) (0.045)