diversity in the new york city department of cultural affairs community€¦ · ·...
TRANSCRIPT
REPORT Diversity in the New York City Department of Cultural Affairs Community
January 28, 2016 (updated on April 21, 2016)
Roger C. Schonfeld Liam Sweeney
DIVERSITY IN THE NEW YORK CITY DEPARTMENT OF CULTURAL AFFAIRS COMMUNITY 1
Ithaka S+R is a strategic consulting
and research service provided by
ITHAKA, a not-for-profit
organization dedicated to helping the
academic community use digital
technologies to preserve the scholarly
record and to advance research and
teaching in sustainable ways. Ithaka
S+R focuses on the transformation of
scholarship and teaching in an online
environment, with the goal of
identifying the critical issues facing
our community and acting as a
catalyst for change. JSTOR, a
research and learning platform, and
Portico, a digital preservation
service, are also part of ITHAKA.
Copyright 2016 ITHAKA. This work is
licensed under a Creative Commons
Attribution-NonCommercial 4.0
International License. To view a copy of
the license, please see http://creative-
commons.org/licenses/by-nc/4.0/.
ITHAKA is interested in disseminating
this brief as widely as possible. Please
contact us with any questions about using
the report: [email protected].
DIVERSITY IN THE NEW YORK CITY DEPARTMENT OF CULTURAL AFFAIRS COMMUNITY 2
Background
New York City is one of the most diverse cities in the United States at a city level, ranking
fourth in the country based on 2010 census data.1 There are over 1,000 cultural
organizations in the five boroughs, each with specific ties to communities, each with
vastly different organizational structures and sizes, and each integral to the diversity of
culture that defines New York City. Over the summer of 2015 many of these
organizations participated in a survey to measure one specific aspect of this diversity—
that of their employees and board members.
Quantifying diversity in labor markets is an inherently fraught pursuit, in part because
our techniques for recording this data, our nomenclature, our definitions must be
necessarily blunt in order to reduce the richness of characteristics we use to categorize
ourselves and others (race, ethnicity, gender, age, disability, to name only a few) into
discrete categories. In spite of this, there is still an opportunity to collect and analyze
existing data for a given community in order to generate a baseline to help measure
change over time.
This diversity survey developed out of a similar effort to measure the diversity of North
American museums, conducted last year.2 With the help of the New York City
Department of Cultural Affairs (known as DCLA) and generous funding from the Mertz
Gilmore and Rockefeller Brothers3 foundations, we have modified our previous survey to
fit the characteristics of the community of cultural organizations that receives support
from DCLA.
1 Several figures in this paper were updated on April 21, 2016. Previously, in the binary analysis of Figures 4-11, those
categorized as “Decline to State” were grouped, in error, with “Female” in the bottom percentage graphs. The updated
graphs exclude “Decline to State.” This change decreased the percentage female of Technical/Production staff by 4%.
Other graphs were affected by 1 or 2%. Figure 20 has also been modified. Board members who were categorized as
“Decline to State” weren’t previously included as a category in Figure 20. While including them now does not change the
percentage totals in other race/ethnicity categories, it does drop the percentage of white board members by 3 %.
As to the diversity of the city, when considering diversity at a neighborhood level New York is much less diverse, dropping
in national rankings from 4th to 49th: Nate Silver, "The Most Diverse Cities Are Often The Most Segregated,"
FiveThirtyEight, May 1, 2015, accessed January 14, 2016, http://fivethirtyeight.com/features/the-most-diverse-cities-are-
often-the-most-segregated/.
2 Roger Schonfeld, Mariët Westermann, and Liam Sweeney, “Art Museum Staff Demographic Survey,” The Andrew W.
Mellon Foundation, July 29, 2015, https://mellon.org/media/filer_public/ba/99/ba99e53a-48d5-4038-80e1-
66f9ba1c020e/awmf_museum_diversity_report_aamd_7-28-15.pdf.
3 This report was made possible in part with support from the Rockefeller Brothers Fund. The opinions and views of the
authors do not necessarily state or reflect those of the Fund.
DIVERSITY IN THE NEW YORK CITY DEPARTMENT OF CULTURAL AFFAIRS COMMUNITY 3
This report presents research findings that analyze the demographics of those
organizations, the way they feel about barriers to increasing diversity, and initiatives that
have been successful toward that end.
Methodology
Ithaka S+R developed the survey with the advice of Deputy Commissioner Edwin Torres
and DCLA staff, as well as an advisory committee comprised of the leadership of several
DCLA grantee organizations, found in Table 1.
Table 1: Advisory Committee
Name Organization
Andrea Louie Asian American Arts Alliance
Lane Harwell Dance/NYC
Sam Miller Lower Manhattan Cultural Council
Gus Schulenberg Theatre Communications Group, Inc.
Caron Atlas Art+Democracy/Naturally-Occurring Cultural Districts NY
Herman Smith Wildlife Conservation Society
The questionnaire was split into two components: a spreadsheet that each DCLA grantee
organization was asked to fill out indicating the demographic categories into which each
of its employees fell, and a survey questionnaire, which focused on perceptions of
diversity, barriers to increasing diversity, and successful initiatives toward fostering
diversity on an organizational level.
DCLA provided Ithaka S+R with a list of 1,061 organizations to be included in the survey
population. This group included fiscal year 2016 Capital Fund recipients, Cultural
Development Fund recipients, and members of the Cultural Institutions Group.

DIVERSITY IN THE NEW YORK CITY DEPARTMENT OF CULTURAL AFFAIRS COMMUNITY 4
In the spreadsheet, we requested demographic and employment information in a variety
of categories. We asked respondents to categorize each employee into one of 22 job types
as listed below:
Conservators
Curators
Designer
Membership/Constituent Services
IT/Web Development
Retail/Merchandise
Editorial
Community Engagement
Librarian
Artist/Performer
Education
Technical/Production
Visitor/Patron Services
Support/Administration
Programming
Facilities
Security
Development
Leadership
Finance
Marketing/PR
Project/Exhibition
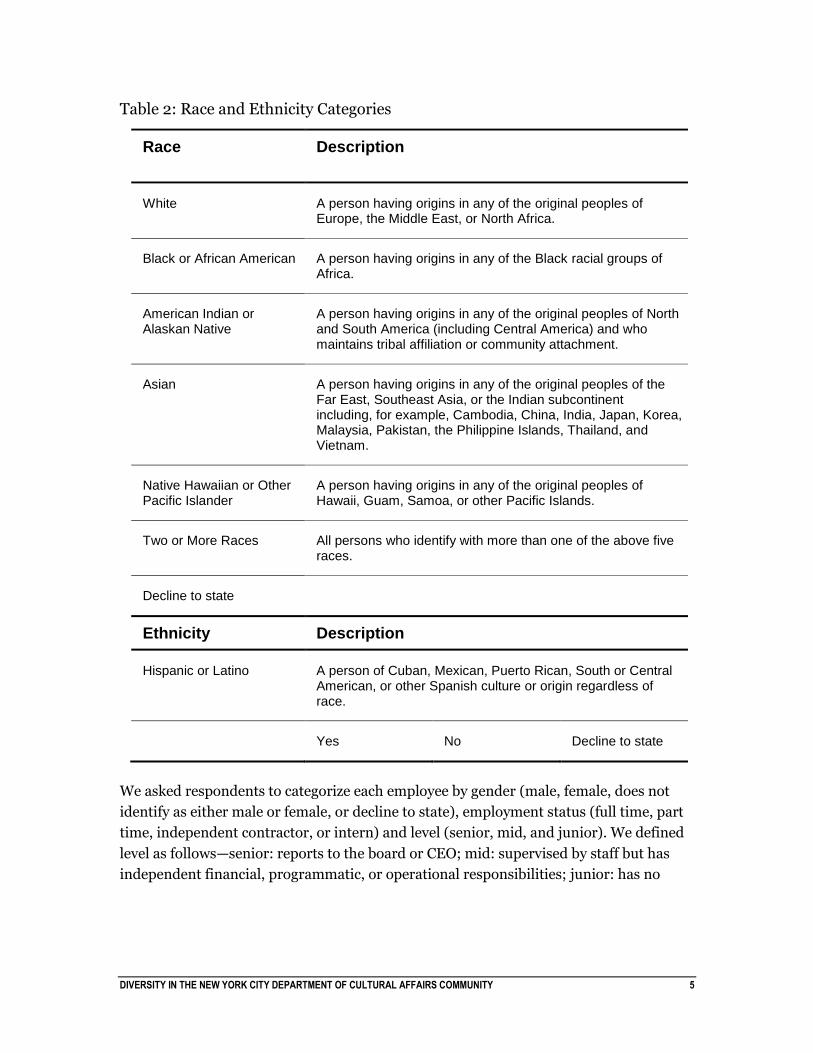
We asked respondents to categorize each employee by race and Hispanic/Latino status
utilizing the 2000 U.S. Census categories that are used for various reporting purposes as
indicated in Table 2.4 We recognize that these categories are inadequate, since many
individuals do not identify with these groups.5 The choice to use census categories was
driven by our project objective to provide a strong community-wide analysis and
comparative analysis against census and other data sources as well as our decision to
gather data from institutions rather than directly from individuals. We supplemented the
category requests with an open-ended option to provide more specific identity
information for a given individual.
4 These categories were adopted by the federal government for equal opportunity reporting purposes and therefore are in
common use at many institutions in our survey population. For more details, see
"EEO-1 Instruction Booklet," EEO-1 Instruction Booklet, 2006, accessed January 13, 2016.
http://www.eeoc.gov/employers/eeo1survey/2007instructions.cfm.
5 The Census is considering several changes for the 2020 census to try to rectify some of these issues:
Ben Casselman, "The Census Is Still Trying To Find The Best Way To Track Race In America," FiveThirtyEight,
November 26, 2014, accessed January 13, 2016, http://fivethirtyeight.com/features/the-census-is-still-trying-to-find-the-
best-way-to-track-race-in-america/.
DIVERSITY IN THE NEW YORK CITY DEPARTMENT OF CULTURAL AFFAIRS COMMUNITY 5
Table 2: Race and Ethnicity Categories
Race Description
White A person having origins in any of the original peoples of Europe, the Middle East, or North Africa.
Black or African American A person having origins in any of the Black racial groups of Africa.
American Indian or Alaskan Native
A person having origins in any of the original peoples of North and South America (including Central America) and who maintains tribal affiliation or community attachment.
Asian A person having origins in any of the original peoples of the Far East, Southeast Asia, or the Indian subcontinent including, for example, Cambodia, China, India, Japan, Korea, Malaysia, Pakistan, the Philippine Islands, Thailand, and Vietnam.
Native Hawaiian or Other Pacific Islander
A person having origins in any of the original peoples of Hawaii, Guam, Samoa, or other Pacific Islands.
Two or More Races All persons who identify with more than one of the above five races.
Decline to state
Ethnicity Description
Hispanic or Latino A person of Cuban, Mexican, Puerto Rican, South or Central American, or other Spanish culture or origin regardless of race.
Yes No Decline to state
We asked respondents to categorize each employee by gender (male, female, does not
identify as either male or female, or decline to state), employment status (full time, part
time, independent contractor, or intern) and level (senior, mid, and junior). We defined
level as follows—senior: reports to the board or CEO; mid: supervised by staff but has
independent financial, programmatic, or operational responsibilities; junior: has no
DIVERSITY IN THE NEW YORK CITY DEPARTMENT OF CULTURAL AFFAIRS COMMUNITY 6
direct reports and work is directly supervised. Finally, we asked for information on
disability status, decade of birth, and decade of employment.6
After submitting the spreadsheet the respondent moved on to a questionnaire about the
organization’s perception of the diversity of their workforce, as well as barriers and
initiatives around increasing diversity of staff and programming. This included multiple
choice, multiple select, free text, and yes/no questions. The questionnaire was designed
so that in some cases the respondents’ answer determined the next question they would
receive.
Under the signature of Commissioner Tom Finkelpearl, the survey invitation message
was sent to the executive directors (or equivalent) of recent DCLA funding recipients on
July 20th, 2015. The invitation stated that participation was required in order to be
eligible for FY2017 funding from DCLA. Several reminder messages were issued by both
Commissioner Finkelpearl and directly from Ithaka S+R. We extended the survey closing
date by a two-week period to allow the late responses to be included.
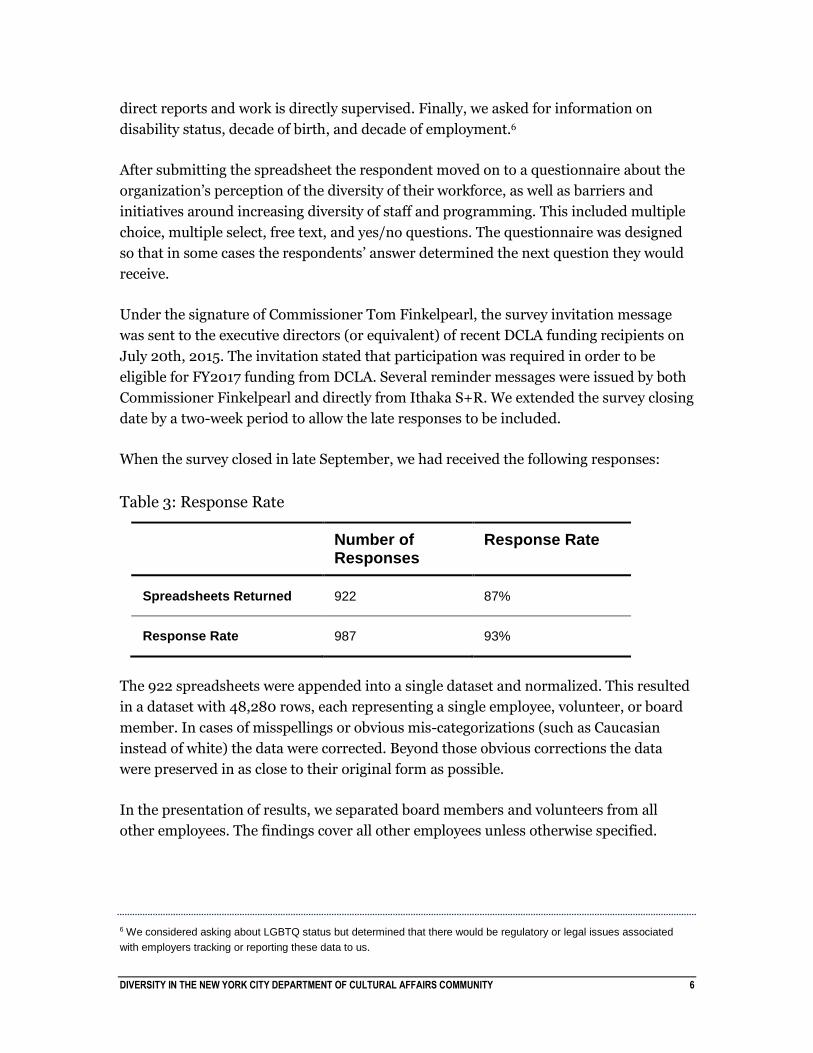
When the survey closed in late September, we had received the following responses:
Table 3: Response Rate
Number of Responses
Response Rate
Spreadsheets Returned 922 87%
Response Rate 987 93%
The 922 spreadsheets were appended into a single dataset and normalized. This resulted
in a dataset with 48,280 rows, each representing a single employee, volunteer, or board
member. In cases of misspellings or obvious mis-categorizations (such as Caucasian
instead of white) the data were corrected. Beyond those obvious corrections the data
were preserved in as close to their original form as possible.
In the presentation of results, we separated board members and volunteers from all
other employees. The findings cover all other employees unless otherwise specified.
6 We considered asking about LGBTQ status but determined that there would be regulatory or legal issues associated
with employers tracking or reporting these data to us.
DIVERSITY IN THE NEW YORK CITY DEPARTMENT OF CULTURAL AFFAIRS COMMUNITY 7
Findings
The final data set included 48,280 total records representing staff, board, and volunteers
at various institution types and sizes. 36,441 of records represent paid staff. Fifty percent
of the organizations have fewer than 10 employees representing 6% of the total staff. On
the other side of the spectrum, four organizations with over 1,000 employees compose
14% of the total employees in the dataset. We will look first at an analysis of the
community as a whole, before focusing on characteristics such as size, budget, discipline,
and others.
We collected total budget data for participating organizations and categorized them
according to the following scale: $0-250,000, $250,000 to 1 million, $1-5 million, $5-10
million, and over $10 million. Most of the organizations have small budgets (371 are in
the lowest bracket, less than $250,000). Only 51 organizations have budgets of over $10
million. However, these organizations include over half the total staff.
DCLA also groups its grantee organizations into the following disciplines:
Folk Arts
Multi-Discipline
Literature
New Media
Zoo
Dance
Museum
Visual Arts
Architecture/Design
Botanical
Humanities
Music
Theater
Film/Visual/Audio
Photography
Science
DCLA includes three separate categories under the umbrella multi-discipline term:
performing, non-performing, and performing+non-performing. Some disciplines, such
as folk arts, science, new media and photography, are very small, each representing
fewer than 200 employees among respondents in the DCLA community. Others are
much larger, such as dance, museums, multi-discipline, music, and theater. These
disciplines include from 2,000 to 10,000 employees each.
DIVERSITY IN THE NEW YORK CITY DEPARTMENT OF CULTURAL AFFAIRS COMMUNITY 8
Gender
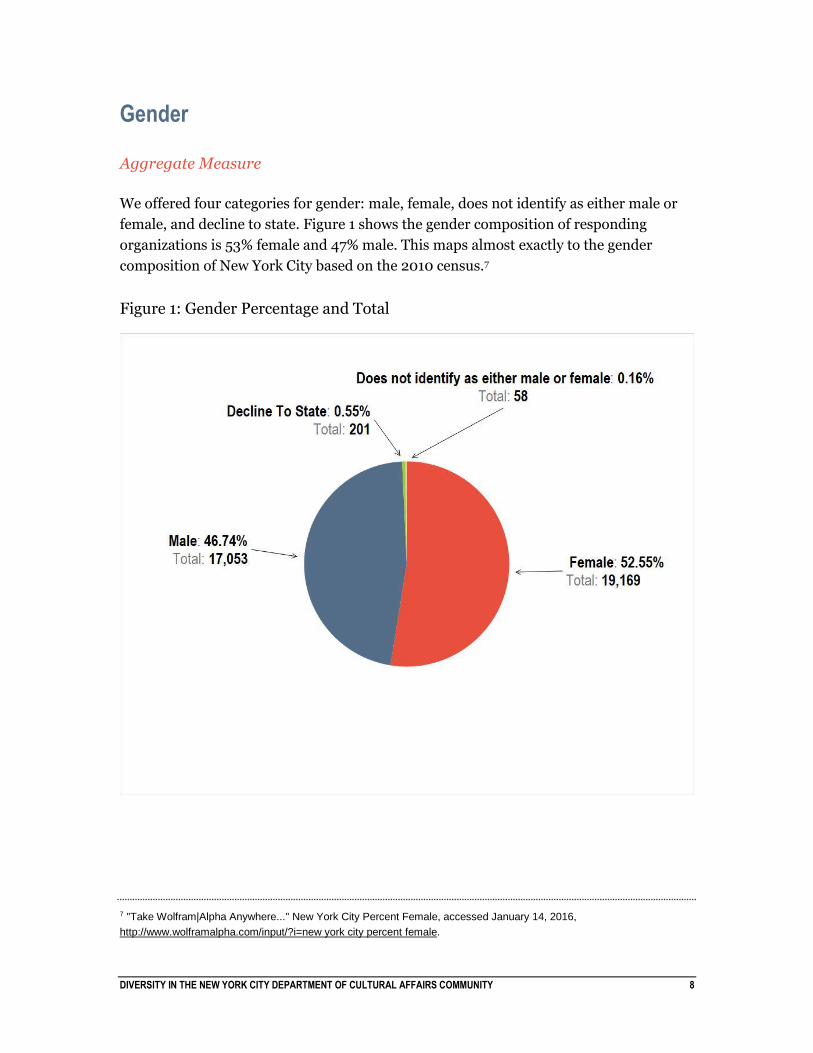
Aggregate Measure
We offered four categories for gender: male, female, does not identify as either male or
female, and decline to state. Figure 1 shows the gender composition of responding
organizations is 53% female and 47% male. This maps almost exactly to the gender
composition of New York City based on the 2010 census.7
Figure 1: Gender Percentage and Total
7 "Take Wolfram|Alpha Anywhere..." New York City Percent Female, accessed January 14, 2016,
http://www.wolframalpha.com/input/?i=new york city percent female.
DIVERSITY IN THE NEW YORK CITY DEPARTMENT OF CULTURAL AFFAIRS COMMUNITY 9
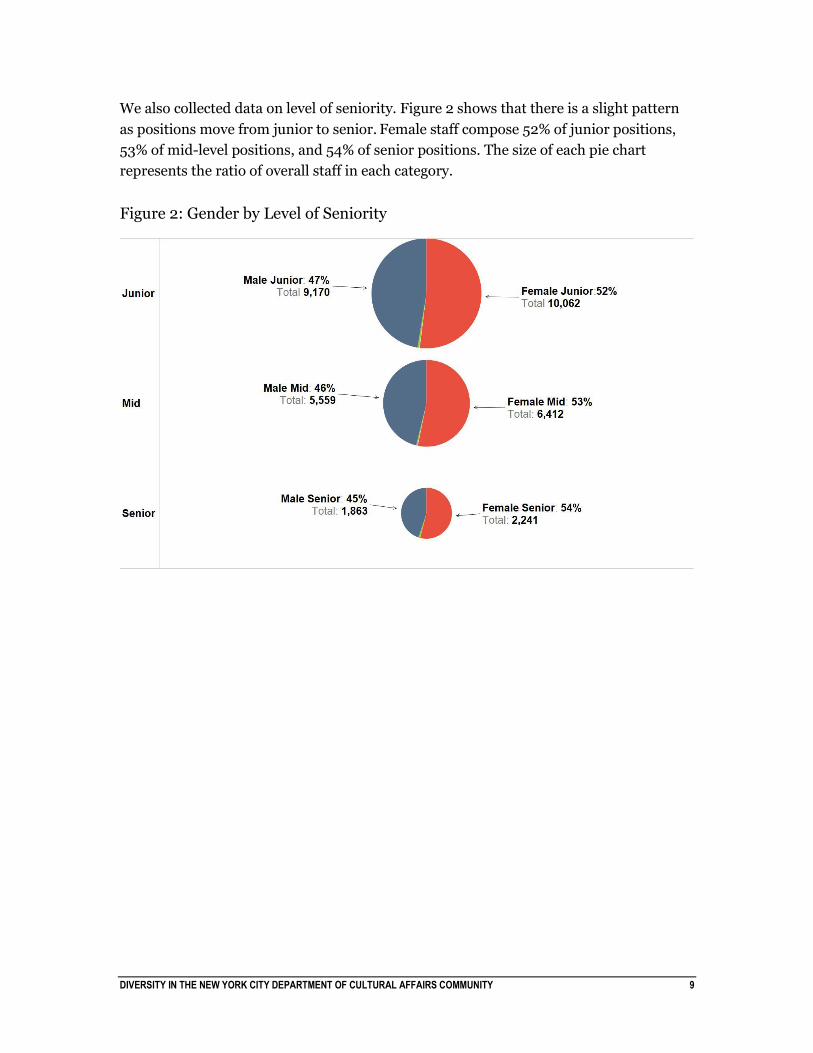
We also collected data on level of seniority. Figure 2 shows that there is a slight pattern
as positions move from junior to senior. Female staff compose 52% of junior positions,
53% of mid-level positions, and 54% of senior positions. The size of each pie chart
represents the ratio of overall staff in each category.
Figure 2: Gender by Level of Seniority
DIVERSITY IN THE NEW YORK CITY DEPARTMENT OF CULTURAL AFFAIRS COMMUNITY 10
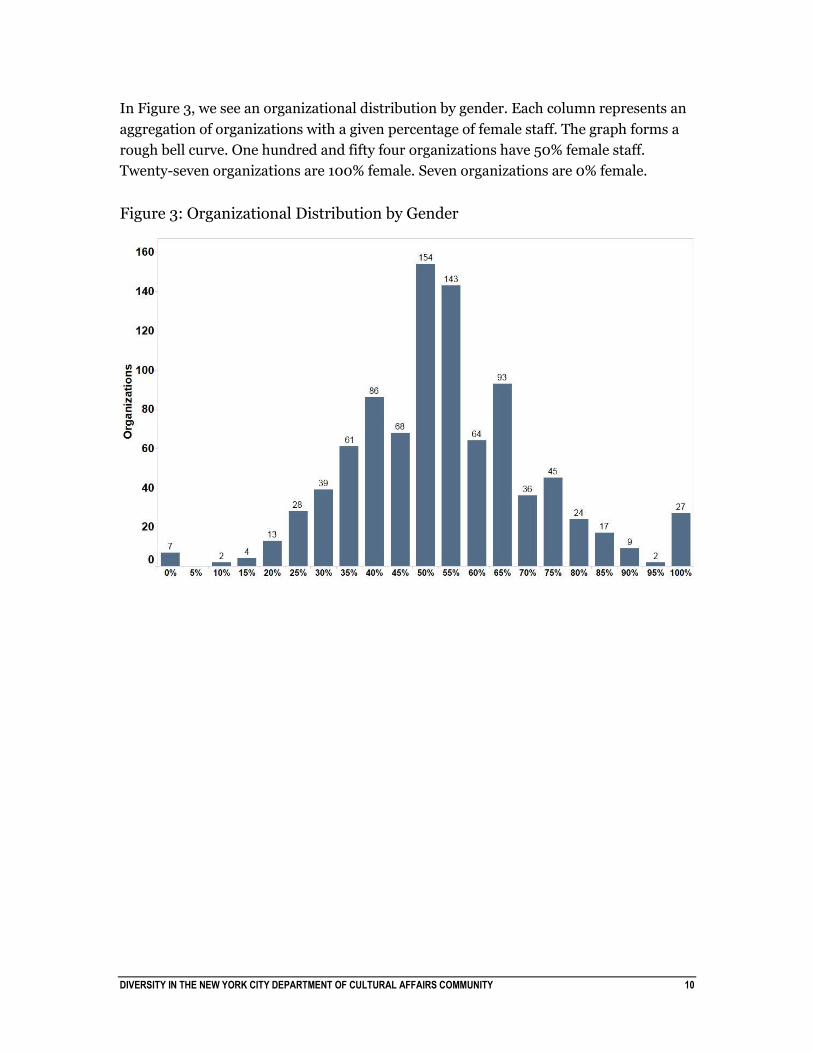
In Figure 3, we see an organizational distribution by gender. Each column represents an
aggregation of organizations with a given percentage of female staff. The graph forms a
rough bell curve. One hundred and fifty four organizations have 50% female staff.
Twenty-seven organizations are 100% female. Seven organizations are 0% female.
Figure 3: Organizational Distribution by Gender

DIVERSITY IN THE NEW YORK CITY DEPARTMENT OF CULTURAL AFFAIRS COMMUNITY 11
Budget
DCLA provided us with the budget categories they use internally by the department for
reporting. Using these budget categories, we analyzed the demographics of staff
employed in each group. In Figure 4, the top graph shows the total number of staff in
each category. The bottom graph shows the percentage of female staff in that total. We
found that organizations with budgets over $10 million have on average 6-9% more male
employees than any other budget category.
Figure 4: Budget: Totals and Percent Female
As positions in the $10+ category move from junior to senior, the percentage female
increases: 48% in junior positions, 50% in mid positions, 52% in senior positions. In
smaller budget categories we find the opposite trend. The percentage female decreases
slightly across other budget categories as positions move from junior to senior.

DIVERSITY IN THE NEW YORK CITY DEPARTMENT OF CULTURAL AFFAIRS COMMUNITY 12
Discipline
We also used discipline categories provided by DCLA. Figure 5 shows the total number of
employees in a given discipline compared to the percentage of female employees in those
disciplines.
Figure 5: Discipline: Totals and Percent Female
We can see there is a wide range in size of discipline. Music and theater are grouped
together to the left of the graph at 46% and 47% female. Of the larger disciplines, dance
has the highest percentage of women at 59%. Museums are 56% and multi-discipline
organizations are 52% female.
Job Type
Based on the 22 job categories we developed with guidance from DCLA, along with level
of seniority, we gained a rich picture of a) the race/ethnicity and gender breakdown of
each position, b) the number of employees in each role, c) the degree of demographic
variance between levels of seniority in those positions.
DIVERSITY IN THE NEW YORK CITY DEPARTMENT OF CULTURAL AFFAIRS COMMUNITY 13
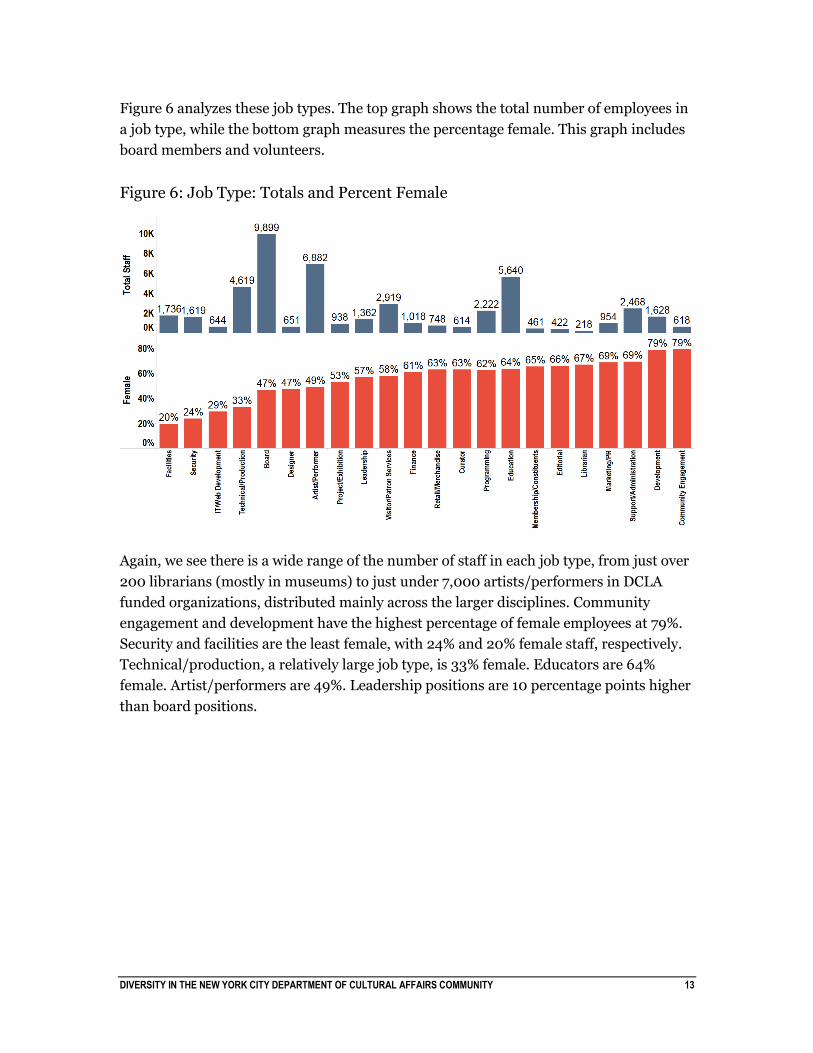
Figure 6 analyzes these job types. The top graph shows the total number of employees in
a job type, while the bottom graph measures the percentage female. This graph includes
board members and volunteers.
Figure 6: Job Type: Totals and Percent Female
Again, we see there is a wide range of the number of staff in each job type, from just over
200 librarians (mostly in museums) to just under 7,000 artists/performers in DCLA
funded organizations, distributed mainly across the larger disciplines. Community
engagement and development have the highest percentage of female employees at 79%.
Security and facilities are the least female, with 24% and 20% female staff, respectively.
Technical/production, a relatively large job type, is 33% female. Educators are 64%
female. Artist/performers are 49%. Leadership positions are 10 percentage points higher
than board positions.
DIVERSITY IN THE NEW YORK CITY DEPARTMENT OF CULTURAL AFFAIRS COMMUNITY 14
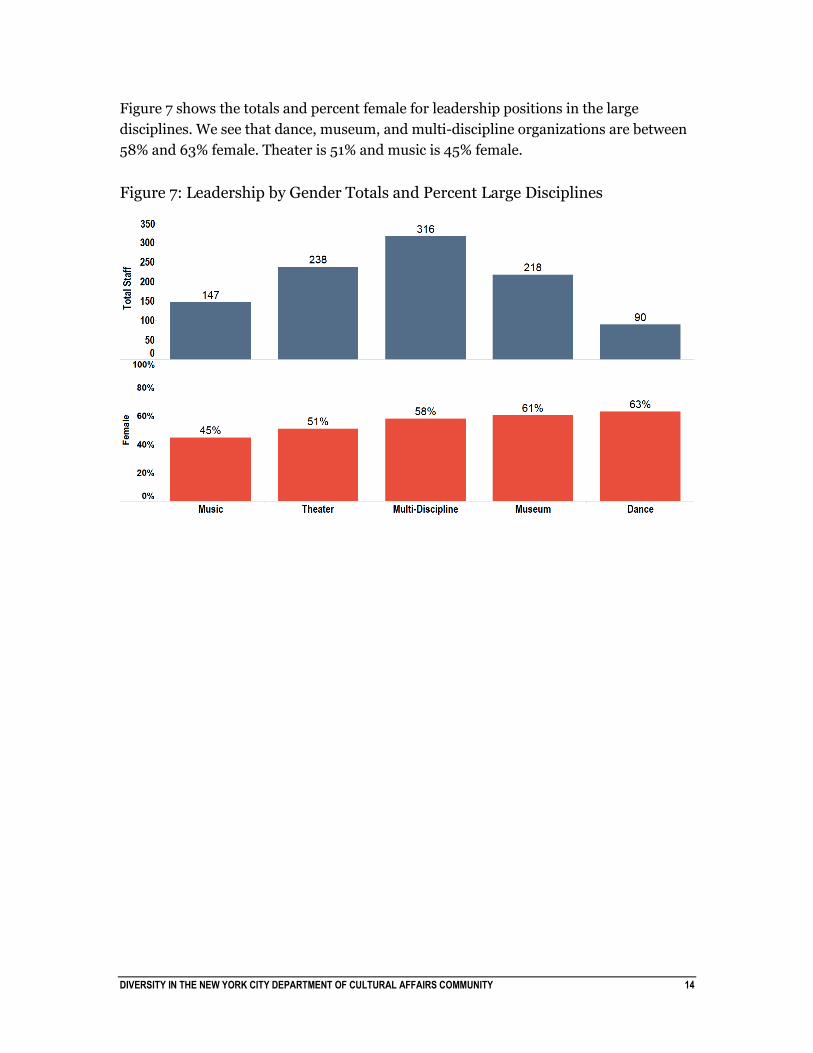
Figure 7 shows the totals and percent female for leadership positions in the large
disciplines. We see that dance, museum, and multi-discipline organizations are between
58% and 63% female. Theater is 51% and music is 45% female.
Figure 7: Leadership by Gender Totals and Percent Large Disciplines

DIVERSITY IN THE NEW YORK CITY DEPARTMENT OF CULTURAL AFFAIRS COMMUNITY 15
Figure 8 shows the totals and percent female for board members in the large disciplines.
Dance is the only discipline above 50%. Multi-Discipline has the most board members
(2,266) and the fewest female board members (43%).
Figure 8: Board by Gender Totals and Percent Large Disciplines
DIVERSITY IN THE NEW YORK CITY DEPARTMENT OF CULTURAL AFFAIRS COMMUNITY 16
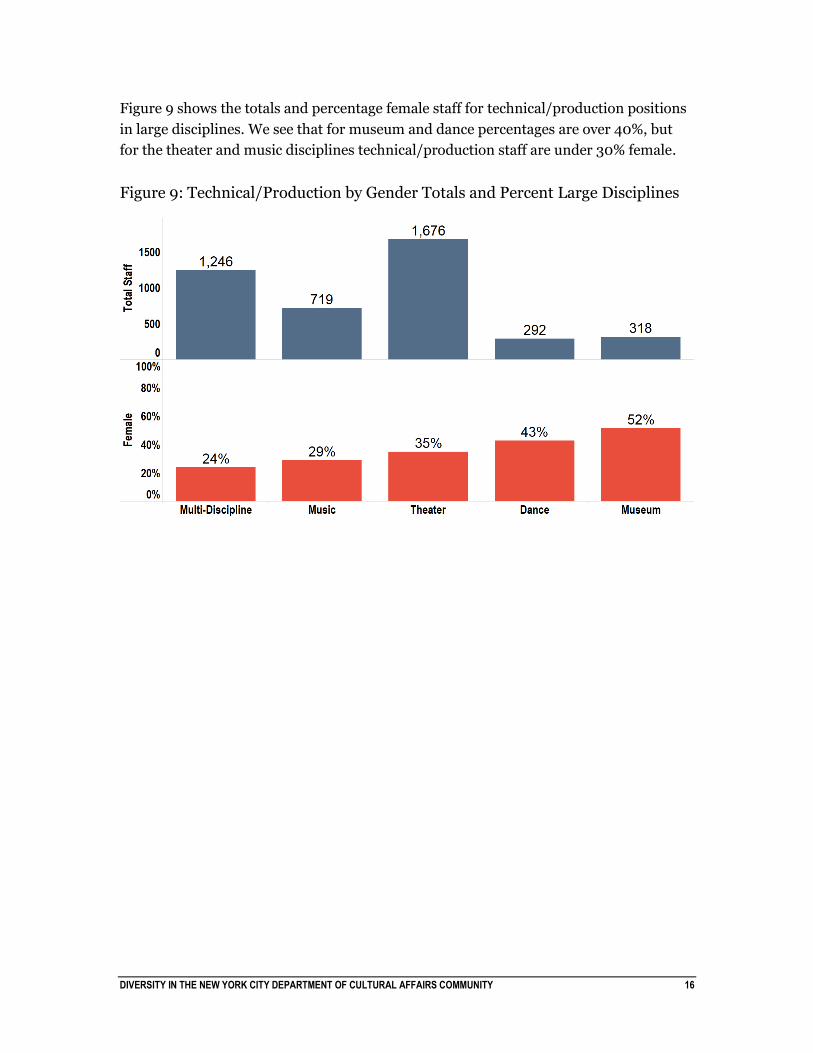
Figure 9 shows the totals and percentage female staff for technical/production positions
in large disciplines. We see that for museum and dance percentages are over 40%, but
for the theater and music disciplines technical/production staff are under 30% female.
Figure 9: Technical/Production by Gender Totals and Percent Large Disciplines

DIVERSITY IN THE NEW YORK CITY DEPARTMENT OF CULTURAL AFFAIRS COMMUNITY 17
Decade Born and Decade Hired
Because this is the only year this survey has been conducted, longitudinal analysis is not
possible. Some inferences toward temporal trends can be made by looking at the most
common age-groups of DCLA employees, as well as the decade most employees were
hired. However, these are not conclusive trends.
Figure 10 shows the total number of employees born in a given decade in relation to the
percentage of female employees born in that decade.
Figure 10: Decade Born Total Staff and Percentage Female
A plurality of staff were born in the 1980s. We can also see from this graph that younger
staff are more female.
DIVERSITY IN THE NEW YORK CITY DEPARTMENT OF CULTURAL AFFAIRS COMMUNITY 18
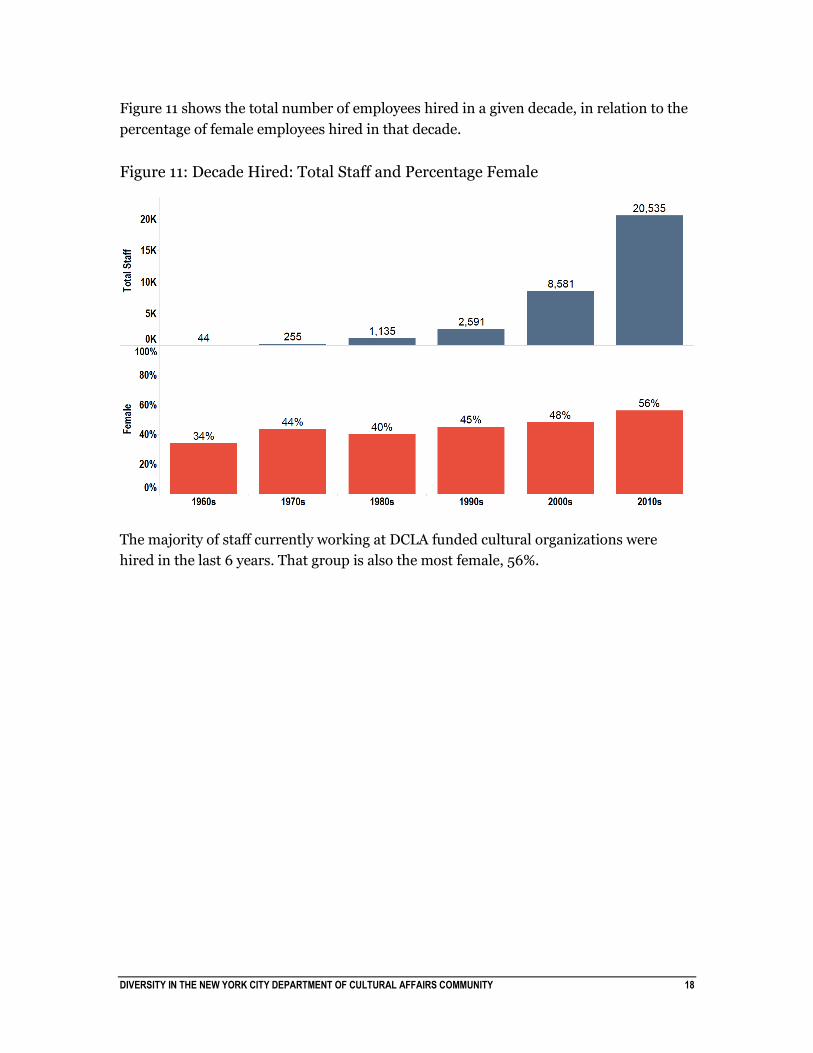
Figure 11 shows the total number of employees hired in a given decade, in relation to the
percentage of female employees hired in that decade.
Figure 11: Decade Hired: Total Staff and Percentage Female
The majority of staff currently working at DCLA funded cultural organizations were
hired in the last 6 years. That group is also the most female, 56%.
DIVERSITY IN THE NEW YORK CITY DEPARTMENT OF CULTURAL AFFAIRS COMMUNITY 19
Volunteers
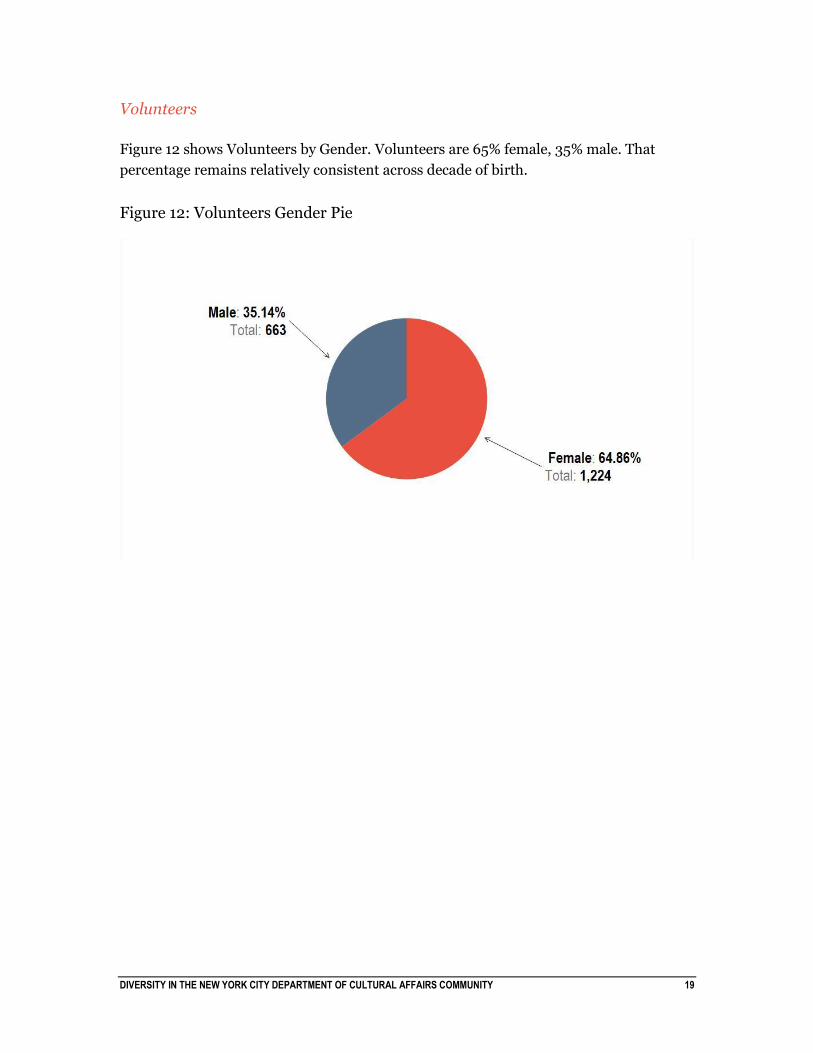
Figure 12 shows Volunteers by Gender. Volunteers are 65% female, 35% male. That
percentage remains relatively consistent across decade of birth.
Figure 12: Volunteers Gender Pie

DIVERSITY IN THE NEW YORK CITY DEPARTMENT OF CULTURAL AFFAIRS COMMUNITY 20
Race/Ethnicity
Aggregate Measure
In the aggregate, DCLA staff is 62% white non-Hispanic and 38% minority, as shown in
Figure 13. Minority groups with over five percent representation include black or African
American (15%), Hispanic (10%) and Asian (8%). White non-Hispanic staff are 17
percentage points above the average population for New York City, based on the 2010
census.8
Figure 13: Race/Ethnicity Staff Percentages
8 "Take Wolfram|Alpha Anywhere..." New York City White Alone, accessed January 13, 2016,
http://www.wolframalpha.com/input/?i=New York City white alone&lk=1.
DIVERSITY IN THE NEW YORK CITY DEPARTMENT OF CULTURAL AFFAIRS COMMUNITY 21
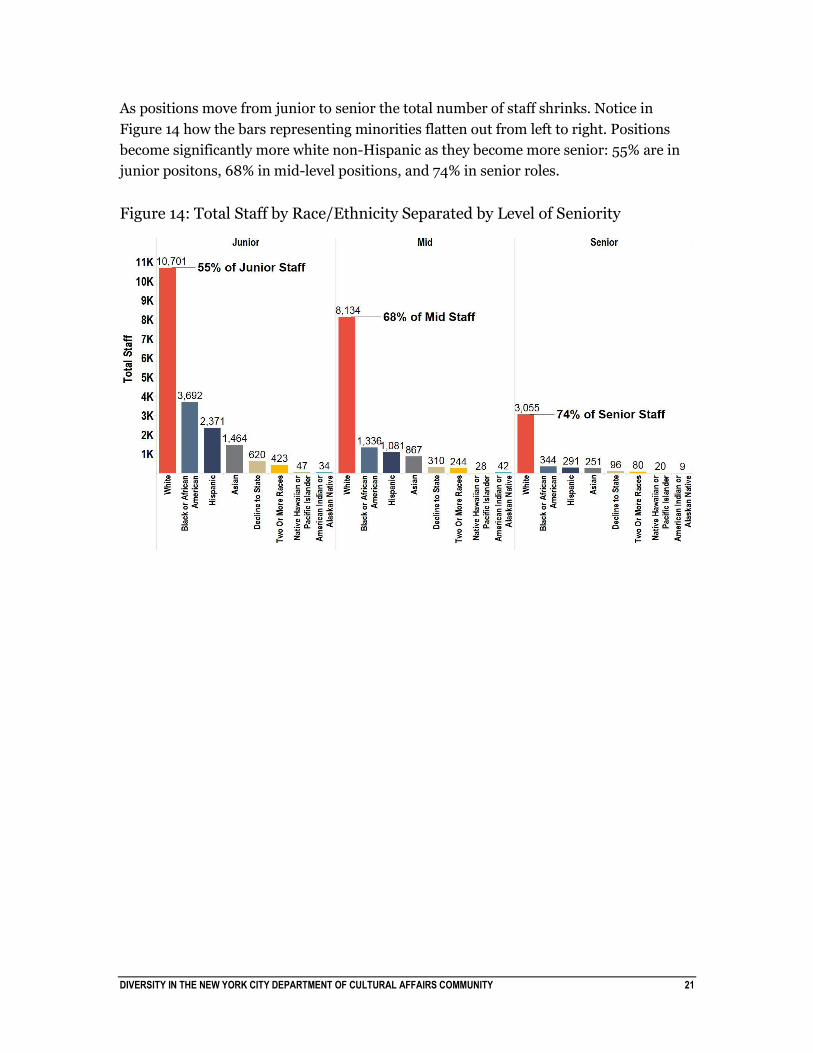
As positions move from junior to senior the total number of staff shrinks. Notice in
Figure 14 how the bars representing minorities flatten out from left to right. Positions
become significantly more white non-Hispanic as they become more senior: 55% are in
junior positons, 68% in mid-level positions, and 74% in senior roles.
Figure 14: Total Staff by Race/Ethnicity Separated by Level of Seniority
DIVERSITY IN THE NEW YORK CITY DEPARTMENT OF CULTURAL AFFAIRS COMMUNITY 22
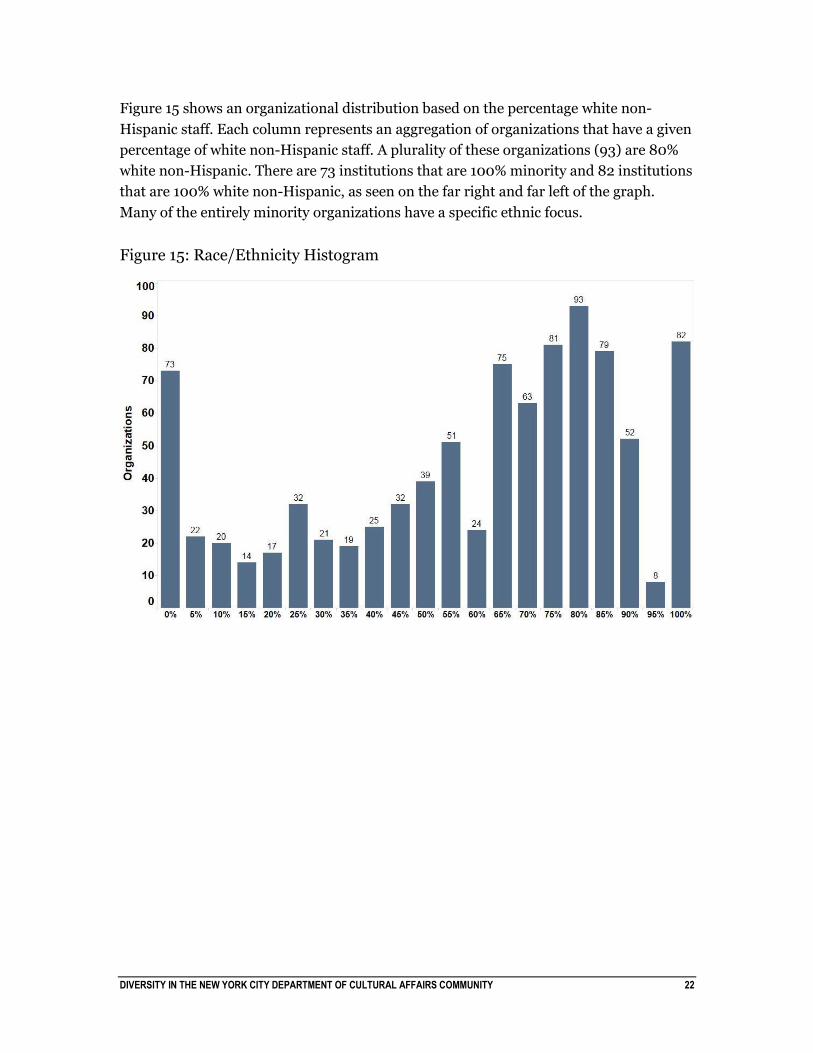
Figure 15 shows an organizational distribution based on the percentage white non-
Hispanic staff. Each column represents an aggregation of organizations that have a given
percentage of white non-Hispanic staff. A plurality of these organizations (93) are 80%
white non-Hispanic. There are 73 institutions that are 100% minority and 82 institutions
that are 100% white non-Hispanic, as seen on the far right and far left of the graph.
Many of the entirely minority organizations have a specific ethnic focus.
Figure 15: Race/Ethnicity Histogram
DIVERSITY IN THE NEW YORK CITY DEPARTMENT OF CULTURAL AFFAIRS COMMUNITY 23
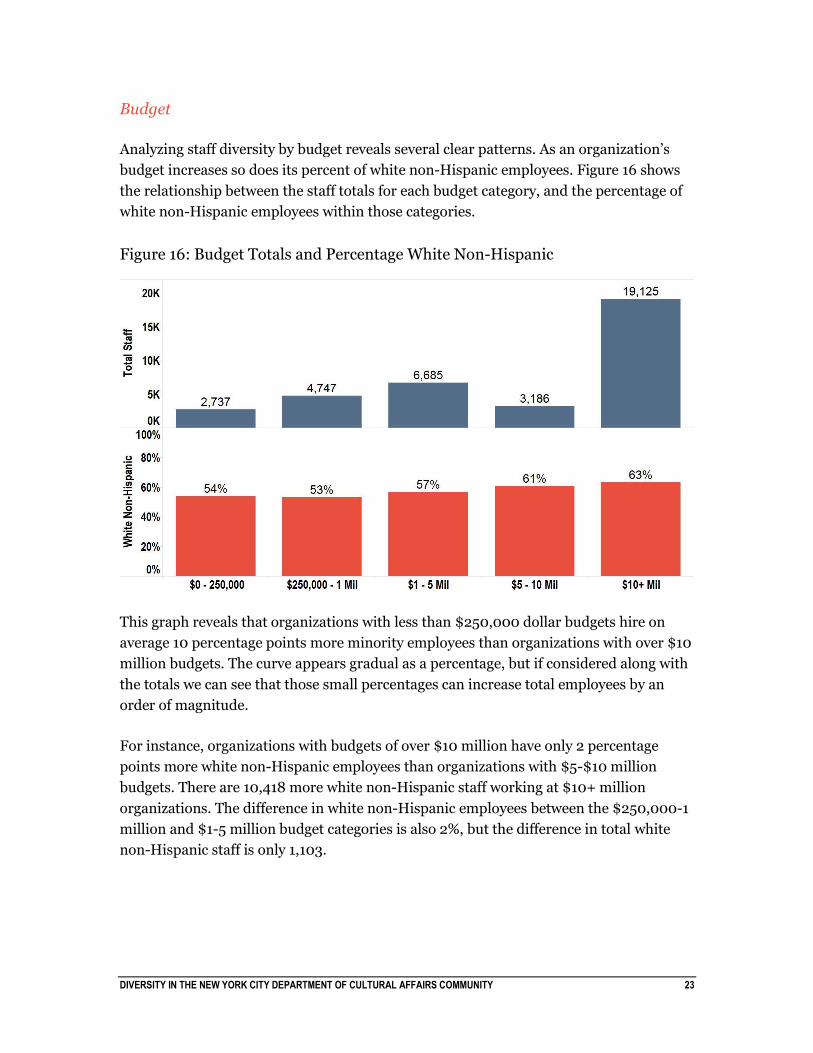
Budget
Analyzing staff diversity by budget reveals several clear patterns. As an organization’s
budget increases so does its percent of white non-Hispanic employees. Figure 16 shows
the relationship between the staff totals for each budget category, and the percentage of
white non-Hispanic employees within those categories.
Figure 16: Budget Totals and Percentage White Non-Hispanic
This graph reveals that organizations with less than $250,000 dollar budgets hire on
average 10 percentage points more minority employees than organizations with over $10
million budgets. The curve appears gradual as a percentage, but if considered along with
the totals we can see that those small percentages can increase total employees by an
order of magnitude.
For instance, organizations with budgets of over $10 million have only 2 percentage
points more white non-Hispanic employees than organizations with $5-$10 million
budgets. There are 10,418 more white non-Hispanic staff working at $10+ million
organizations. The difference in white non-Hispanic employees between the $250,000-1
million and $1-5 million budget categories is also 2%, but the difference in total white
non-Hispanic staff is only 1,103.
DIVERSITY IN THE NEW YORK CITY DEPARTMENT OF CULTURAL AFFAIRS COMMUNITY 24
Discipline
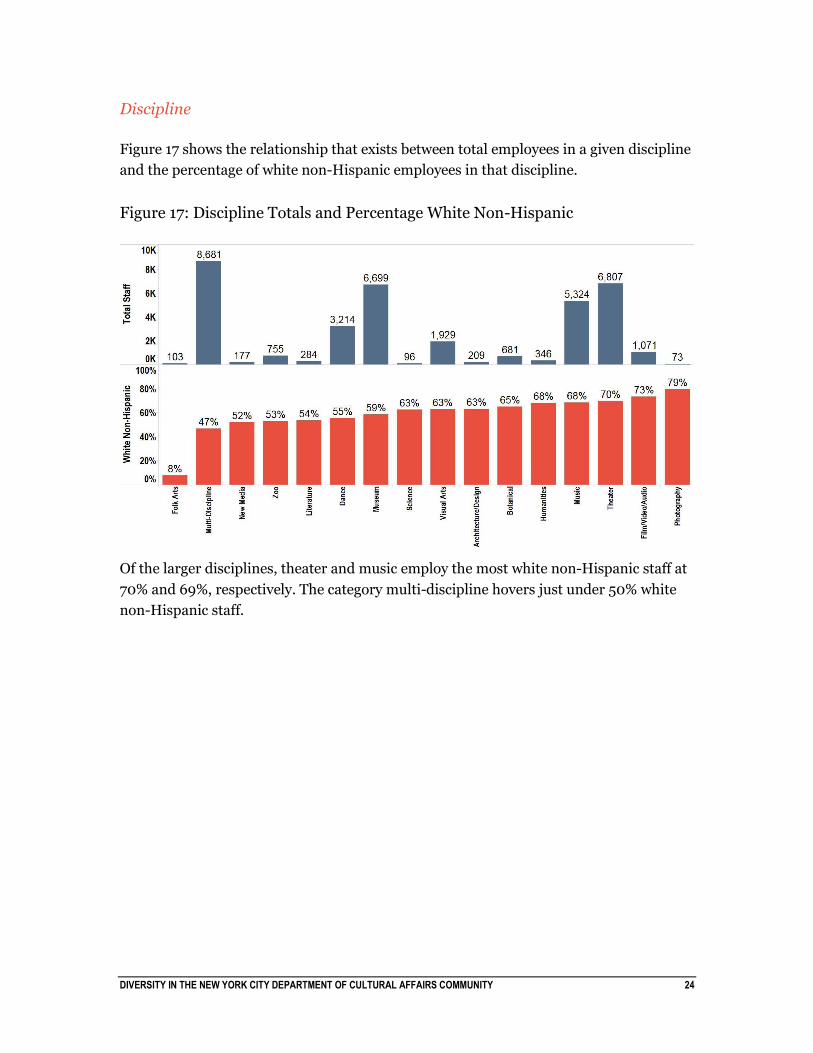
Figure 17 shows the relationship that exists between total employees in a given discipline
and the percentage of white non-Hispanic employees in that discipline.
Figure 17: Discipline Totals and Percentage White Non-Hispanic
Of the larger disciplines, theater and music employ the most white non-Hispanic staff at
70% and 69%, respectively. The category multi-discipline hovers just under 50% white
non-Hispanic staff.
DIVERSITY IN THE NEW YORK CITY DEPARTMENT OF CULTURAL AFFAIRS COMMUNITY 25
Job Type
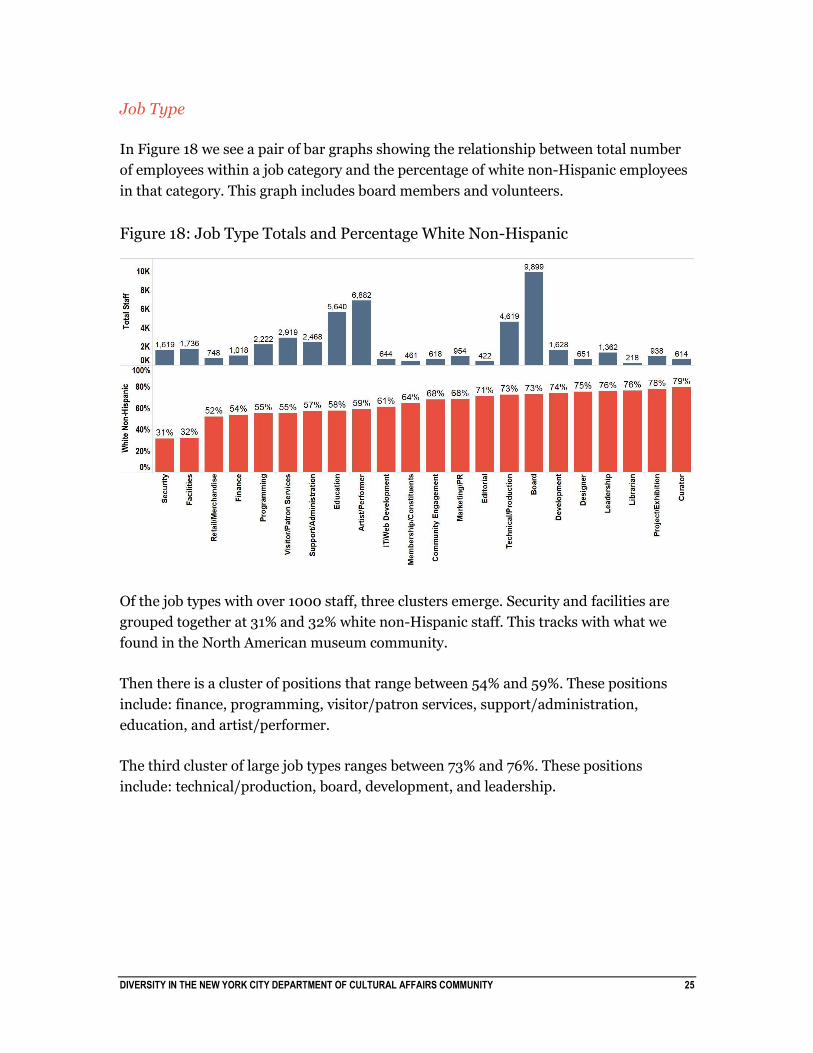
In Figure 18 we see a pair of bar graphs showing the relationship between total number
of employees within a job category and the percentage of white non-Hispanic employees
in that category. This graph includes board members and volunteers.
Figure 18: Job Type Totals and Percentage White Non-Hispanic
Of the job types with over 1000 staff, three clusters emerge. Security and facilities are
grouped together at 31% and 32% white non-Hispanic staff. This tracks with what we
found in the North American museum community.
Then there is a cluster of positions that range between 54% and 59%. These positions
include: finance, programming, visitor/patron services, support/administration,
education, and artist/performer.
The third cluster of large job types ranges between 73% and 76%. These positions
include: technical/production, board, development, and leadership.
DIVERSITY IN THE NEW YORK CITY DEPARTMENT OF CULTURAL AFFAIRS COMMUNITY 26
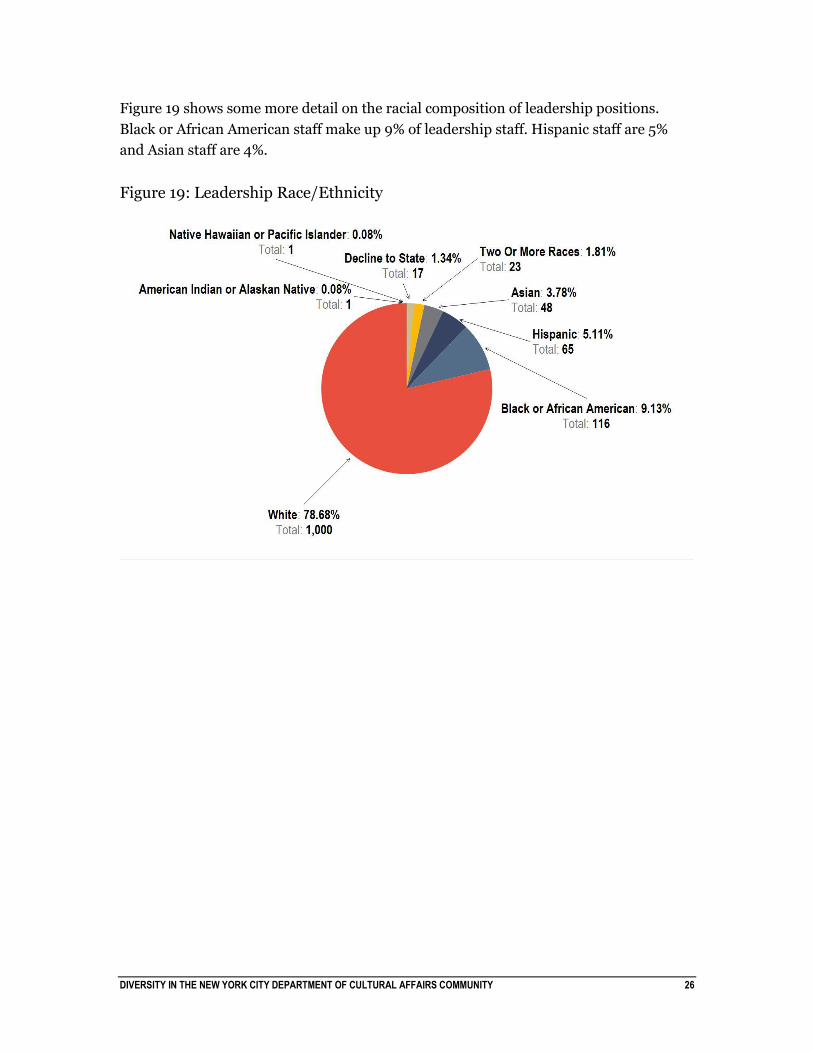
Figure 19 shows some more detail on the racial composition of leadership positions.
Black or African American staff make up 9% of leadership staff. Hispanic staff are 5%
and Asian staff are 4%.
Figure 19: Leadership Race/Ethnicity
DIVERSITY IN THE NEW YORK CITY DEPARTMENT OF CULTURAL AFFAIRS COMMUNITY 27
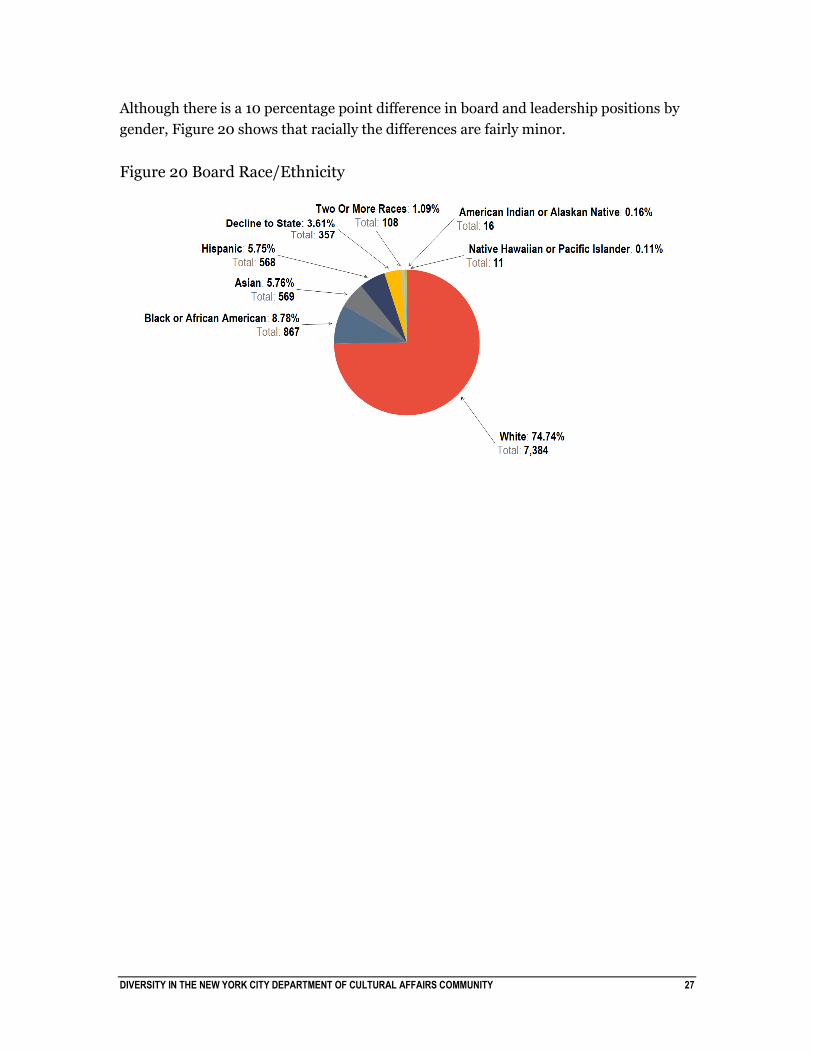
Although there is a 10 percentage point difference in board and leadership positions by
gender, Figure 20 shows that racially the differences are fairly minor.
Figure 20 Board Race/Ethnicity
DIVERSITY IN THE NEW YORK CITY DEPARTMENT OF CULTURAL AFFAIRS COMMUNITY 28
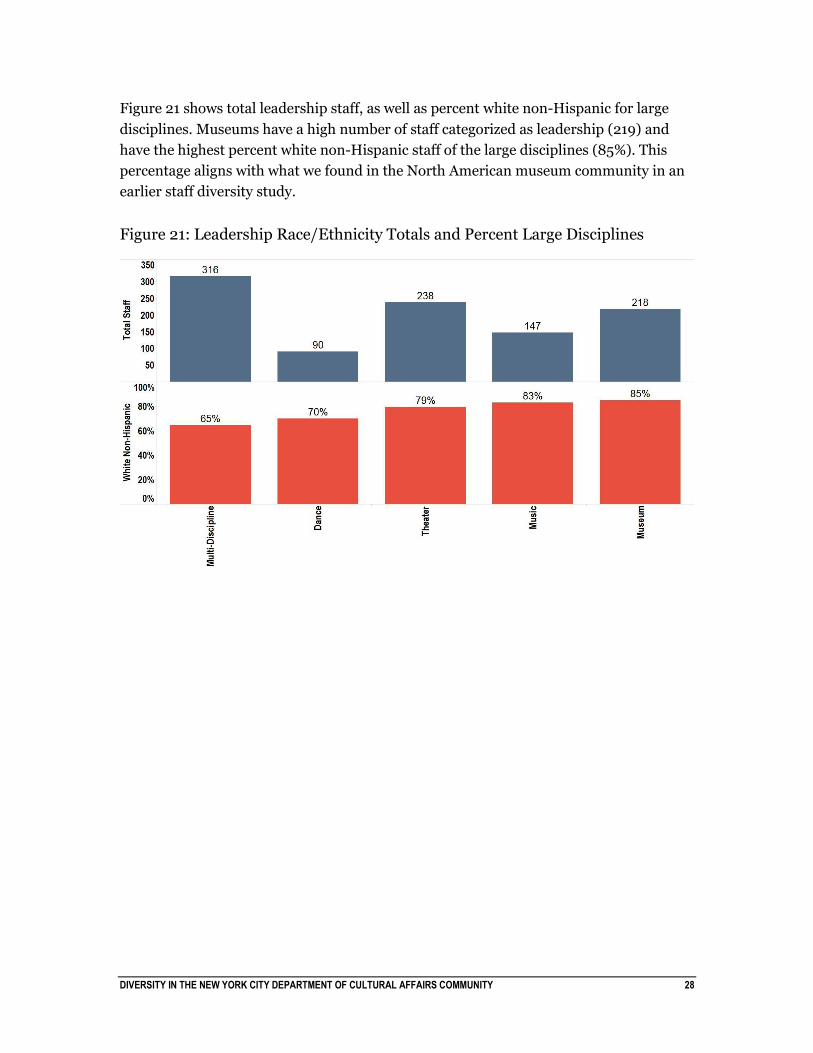
Figure 21 shows total leadership staff, as well as percent white non-Hispanic for large
disciplines. Museums have a high number of staff categorized as leadership (219) and
have the highest percent white non-Hispanic staff of the large disciplines (85%). This
percentage aligns with what we found in the North American museum community in an
earlier staff diversity study.
Figure 21: Leadership Race/Ethnicity Totals and Percent Large Disciplines
DIVERSITY IN THE NEW YORK CITY DEPARTMENT OF CULTURAL AFFAIRS COMMUNITY 29
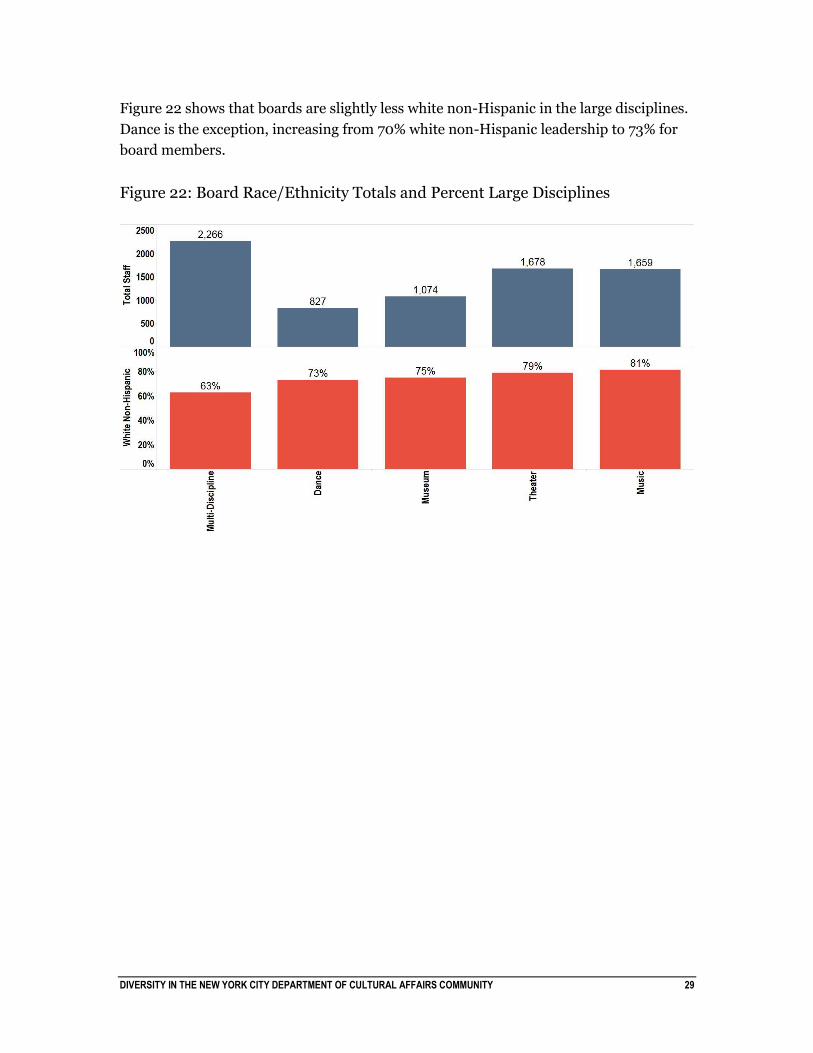
Figure 22 shows that boards are slightly less white non-Hispanic in the large disciplines.
Dance is the exception, increasing from 70% white non-Hispanic leadership to 73% for
board members.
Figure 22: Board Race/Ethnicity Totals and Percent Large Disciplines

DIVERSITY IN THE NEW YORK CITY DEPARTMENT OF CULTURAL AFFAIRS COMMUNITY 30
Figure 23 shows positions in theater that are over three quarters white non-Hispanic.
The graph shows that, among this cluster, there are four times more
technical/production staff than in the next most common job type. Approximately the
same is true of the music discipline.
Figure 23: Theater Job Categories over 75 % White Non-Hispanic

DIVERSITY IN THE NEW YORK CITY DEPARTMENT OF CULTURAL AFFAIRS COMMUNITY 31
Figure 24 shows that museums in New York City map closely to the percentage of white
non-Hispanic staff for North American museums in curatorial (84%) and leadership
(85%) positions. Education is the largest job type for museums in New York, making up
14% of the work force. Educators are as diverse as the overall museum staff, about 60%
white non-Hispanic. The second most common job type for museums is security, which
is 40% white non-Hispanic, 34% black or African American.
Figure 24: Museum Job Categories over 75% White Non-Hispanic
DIVERSITY IN THE NEW YORK CITY DEPARTMENT OF CULTURAL AFFAIRS COMMUNITY 32
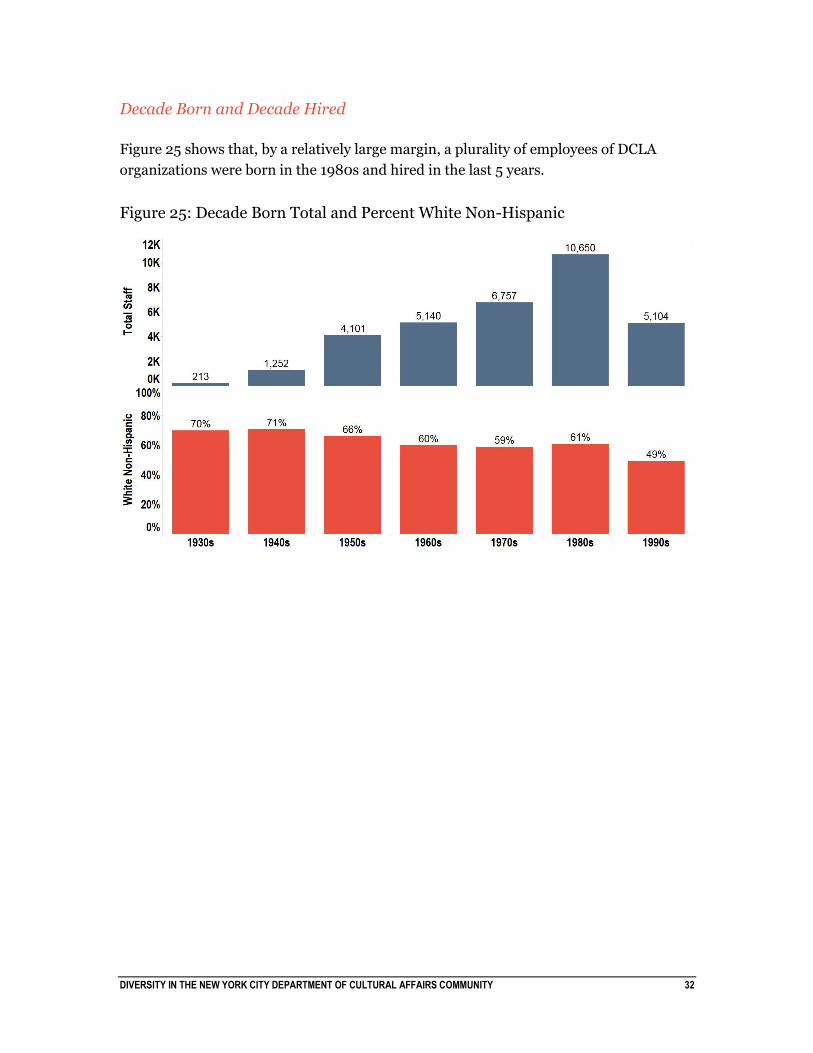
Decade Born and Decade Hired
Figure 25 shows that, by a relatively large margin, a plurality of employees of DCLA
organizations were born in the 1980s and hired in the last 5 years.
Figure 25: Decade Born Total and Percent White Non-Hispanic
DIVERSITY IN THE NEW YORK CITY DEPARTMENT OF CULTURAL AFFAIRS COMMUNITY 33
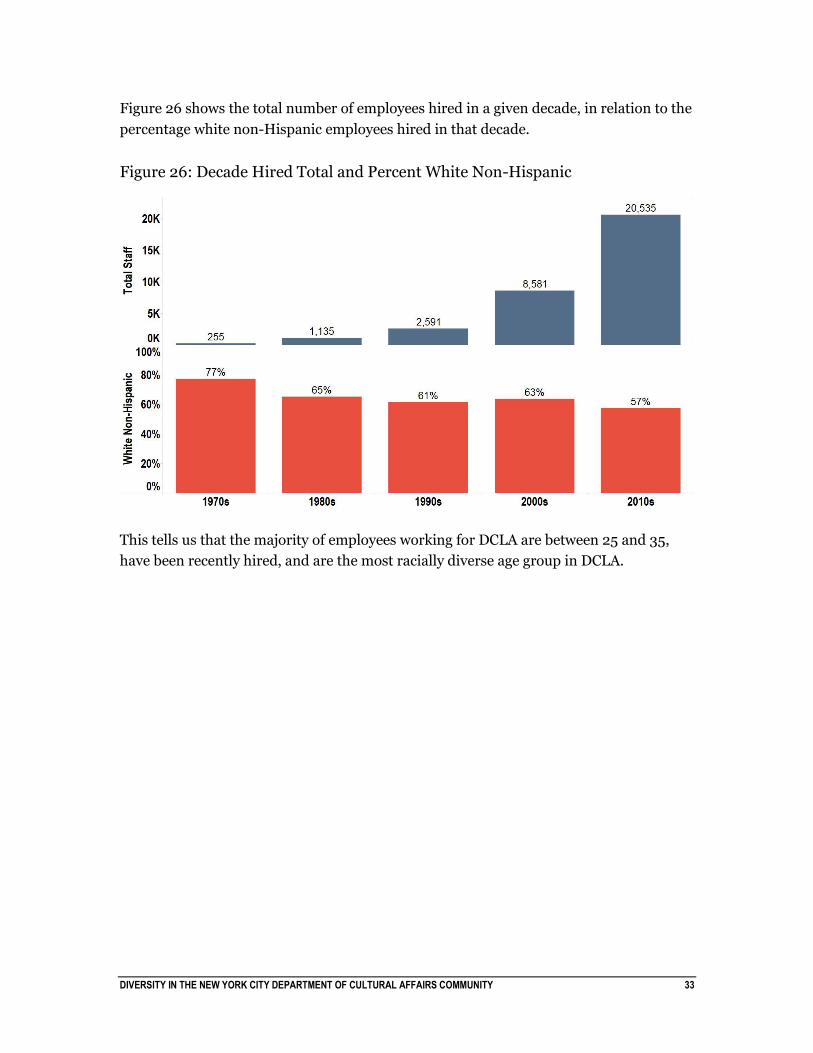
Figure 26 shows the total number of employees hired in a given decade, in relation to the
percentage white non-Hispanic employees hired in that decade.
Figure 26: Decade Hired Total and Percent White Non-Hispanic
This tells us that the majority of employees working for DCLA are between 25 and 35,
have been recently hired, and are the most racially diverse age group in DCLA.

DIVERSITY IN THE NEW YORK CITY DEPARTMENT OF CULTURAL AFFAIRS COMMUNITY 34
Figure 27 shows that from the 2000s to the 2010s there has been a spike in education
positions in the community and also a significant increase in the number of minorities
employed in that field. In the 2000s education was 63% white non-Hispanic. In the
2010s it is 53%. Education appears to be a growth area for racial and ethnic diversity in
the DCLA community.
Figure 27: Education positions by Race/Ethnicity from 2000s to 2010s

DIVERSITY IN THE NEW YORK CITY DEPARTMENT OF CULTURAL AFFAIRS COMMUNITY 35
Figure 28 shows us that the majority of these positions across race and decade are part-
time (though this is not true in the museum community, where education positions are
closer to 50% part-time, 50% full-time). White non-Hispanic staff remain constant
across decades, at around 25% full-time. Minorities in aggregate are 18% full-time in the
2000s and 14% full-time in the 2010s.
Figure 28: Education positions, Full-Time (Blue) and Part-Time (Red) by
Race/Ethnicity from 2000s to 2010s

DIVERSITY IN THE NEW YORK CITY DEPARTMENT OF CULTURAL AFFAIRS COMMUNITY 36
Volunteer
We also collected volunteer status. We heard from our advisory committee that for many
DCLA funded organizations volunteers are critical to daily functions. Over 9,000 staff
were reported as volunteers. Asians are 12% of the volunteer population, compared to
8% of the total, as seen in Figure 29.
Figure 29: Volunteer Race/Ethnicity Percentage
DIVERSITY IN THE NEW YORK CITY DEPARTMENT OF CULTURAL AFFAIRS COMMUNITY 37
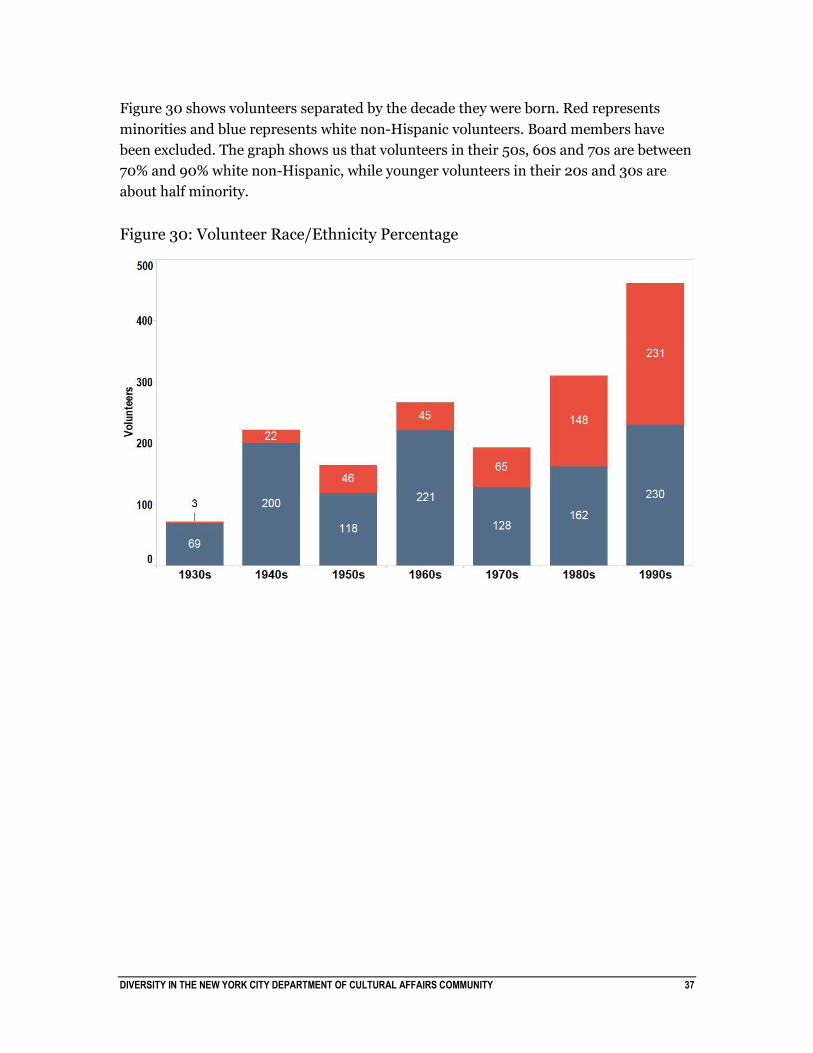
Figure 30 shows volunteers separated by the decade they were born. Red represents
minorities and blue represents white non-Hispanic volunteers. Board members have
been excluded. The graph shows us that volunteers in their 50s, 60s and 70s are between
70% and 90% white non-Hispanic, while younger volunteers in their 20s and 30s are
about half minority.
Figure 30: Volunteer Race/Ethnicity Percentage
DIVERSITY IN THE NEW YORK CITY DEPARTMENT OF CULTURAL AFFAIRS COMMUNITY 38
Perceptions, Obstacles and Initiatives
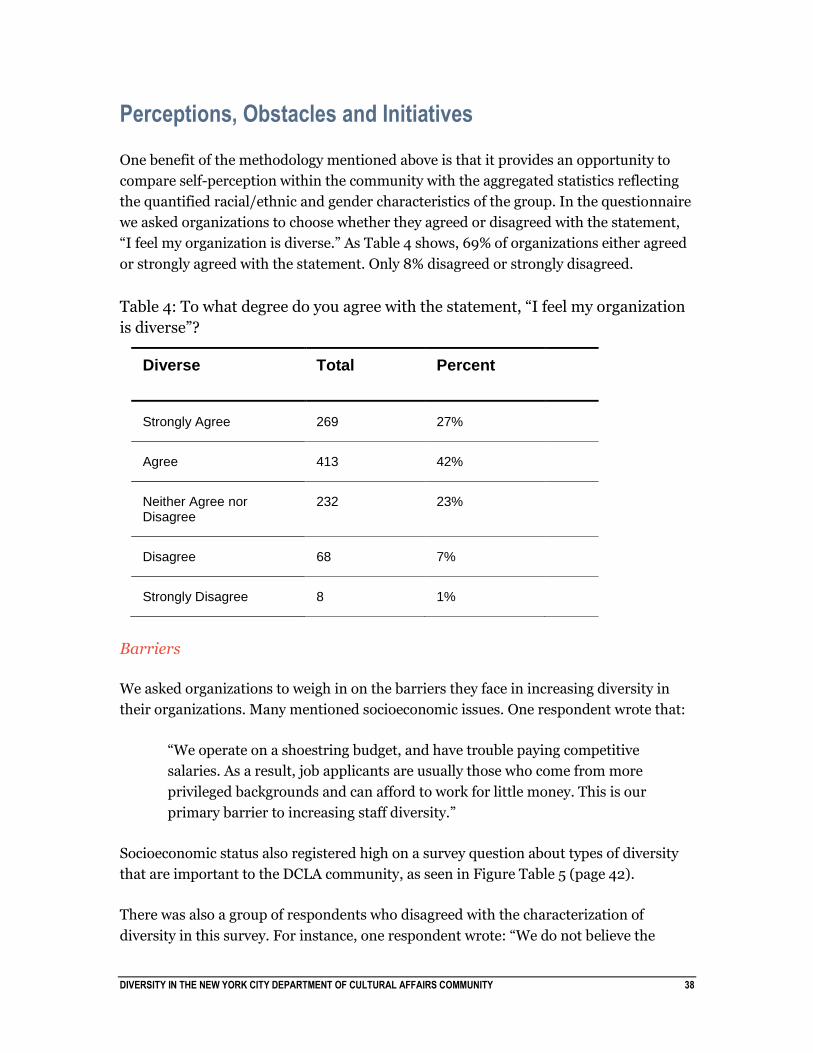
One benefit of the methodology mentioned above is that it provides an opportunity to
compare self-perception within the community with the aggregated statistics reflecting
the quantified racial/ethnic and gender characteristics of the group. In the questionnaire
we asked organizations to choose whether they agreed or disagreed with the statement,
“I feel my organization is diverse.” As Table 4 shows, 69% of organizations either agreed
or strongly agreed with the statement. Only 8% disagreed or strongly disagreed.
Table 4: To what degree do you agree with the statement, “I feel my organization
is diverse”?
Diverse Total Percent
Strongly Agree 269 27%
Agree 413 42%
Neither Agree nor Disagree
232 23%
Disagree 68 7%
Strongly Disagree 8 1%
Barriers
We asked organizations to weigh in on the barriers they face in increasing diversity in
their organizations. Many mentioned socioeconomic issues. One respondent wrote that:
“We operate on a shoestring budget, and have trouble paying competitive
salaries. As a result, job applicants are usually those who come from more
privileged backgrounds and can afford to work for little money. This is our
primary barrier to increasing staff diversity.”
Socioeconomic status also registered high on a survey question about types of diversity
that are important to the DCLA community, as seen in Figure Table 5 (page 42).
There was also a group of respondents who disagreed with the characterization of
diversity in this survey. For instance, one respondent wrote: “We do not believe the
DIVERSITY IN THE NEW YORK CITY DEPARTMENT OF CULTURAL AFFAIRS COMMUNITY 39
above categories determine the quality of a person’s work, and they are therefore not
important for strengthening the quality of the work of our organization.”
Broadly speaking, the qualitative findings reflect the quantitative—some organizations
are enthusiastic about diversity in their workplace, some are confronting challenges and
working towards goals of inclusion and equity, and some are indifferent towards, or in
disagreement with, the claim that these efforts have value.
In the questionnaire portion of the survey 77% stated there were no barriers to
increasing diversity among their organization’s overall employees, 74% said there were
no barriers specifically for senior employees, and 68% said there were no barriers for
board diversity. Of those who said there were barriers, the majority for all three
categories felt there was a “pipeline” issue, meaning they feel that the pool of competitive
candidates for openings in their organizations has not been diverse.
Initiatives
We also asked whether the respondents had implemented successful initiatives meant to
increase diversity. Sixty-eight percent said they had seen success with diversity
initiatives. Of that group, most organizations reported that these were cultural
programming initiatives (86%) and community partnerships (78%). Some had responses
to the set of questions on diversity initiatives, which may be instructive for others in the
community. Two organizations offered best practices for how they recruit diverse
employees:
“We post openings on websites such as Diversity Jobs9 to increase diverse
submissions. About 1 in 3 hires are former interns. To diversify intern pools we
work with and visit CUNY and HBCUs, speaking to students about the internship
program and foster relationships with professors and departments.”
“We recruit diverse employees through partnerships with colleges serving diverse
student populations; recruiting through websites and career fairs focused on
serving diverse job seekers such as Latino Public Radio Consortium, National
Association of Black Journalists, and OUT jobs.”
Since many organizations in the “barriers” portion of the survey expressed difficulty
circumventing pipeline issues, it was encouraging to see that some respondents had
resources they turned to toward that end.
9 Our Company, accessed January 14, 2016, http://diversityjobs.com/about/our-company.

DIVERSITY IN THE NEW YORK CITY DEPARTMENT OF CULTURAL AFFAIRS COMMUNITY 40
Many organizations also reported in the free text portion of the survey that they have
begun to focus on diversity in a more systematic way. For instance, one organization
stated that,
“This summer [we] launched [our] first ever structured learning and
development program for all employees. The workshop that was selected to
launch this high profile initiative was Managing Diversity. A staff run Equity and
Inclusion Task Force was recently formed. It will assist senior employees in
implementing HR policies which guarantee transparency, fairness and improved
morale.”
Others have focused on hiring full-time staff positions to engage with these issues.
Another organization reports:
“[This summer we] hired a full-time Equity and Inclusion Coordinator who works
across research, convening, and technology program areas, and is currently
focused on activities to increase racial equity and expand access and inclusion for
disabled New Yorkers in the field.”
There are certainly leaders in this community who are engaging with issues of diversity
in an open way, and it will be interesting to see the results of their work on this issue.
Disability
The excel spreadsheet portion of the survey included a field for disability status. We
knew this could pose difficulties—many organizations do not keep these records on file,
and participants were asked not to try to guess on any part of the excel spreadsheet, but
rather use existing personnel files. We were nonetheless surprised to receive nearly no
records of anyone with a disability out of the 48,280 employees, volunteers and board
members who were recorded. This confirms what was recently reported in “Discovering
Disability: Data & NYC Dance.”10 One key finding of their extensive study of disability
issues was that there is very little useful data on the subject. As they say, “The data
sources used, individually and collectively, proved insufficient to meaningfully address
the scope of inquiry and assess the state of disability and dance. Better and more
uniform data on programs, education and facilities, and, critically, demographic data to
illuminate the role of disabled people in the workforce and in the audience, are requisite
to advancing an inclusion and equity agenda.”
10 Elissa Hecker and Lane Harwell, "Discovering Disability: Data & NYC Dance," www.dance.nyc, May 28, 2015. accessed January 14, 2016, http://www.dance.nyc/uploads/DanceNYC-ReportDisability-Final(Linco).pdf.
DIVERSITY IN THE NEW YORK CITY DEPARTMENT OF CULTURAL AFFAIRS COMMUNITY 41
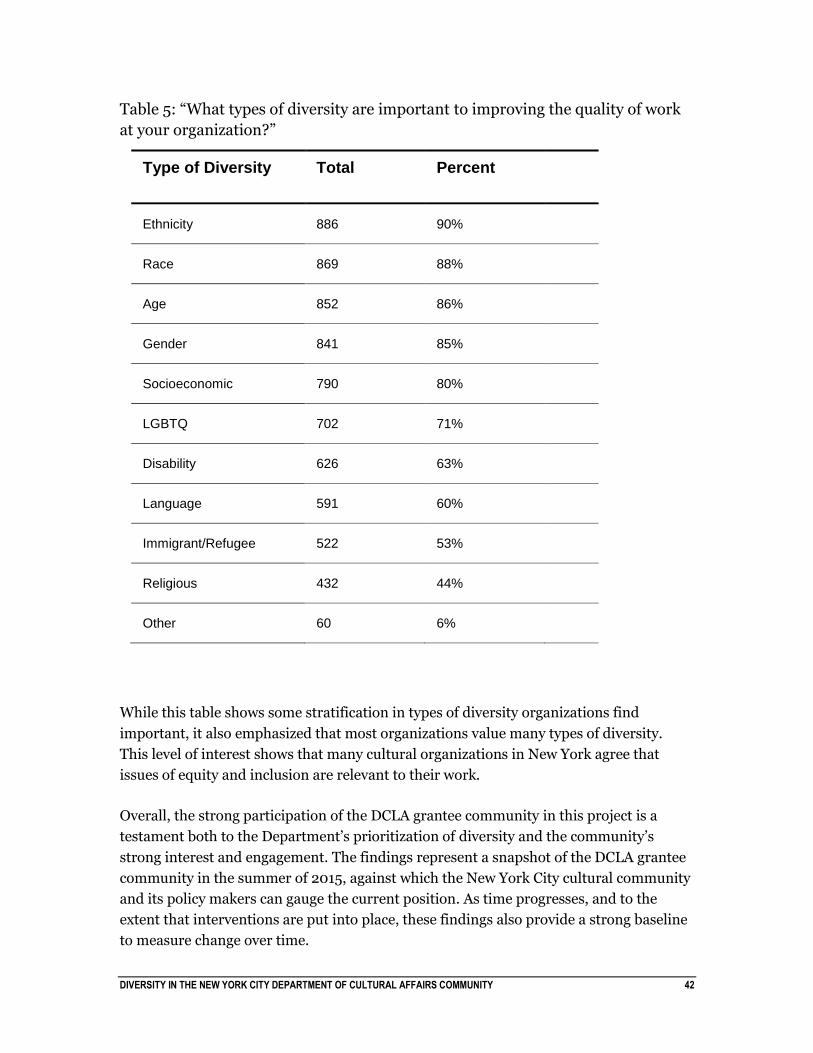
One of the questions on the survey asked respondents what kinds of diversity were
important for their organization’s work. The question was multiple select, meaning that
organizations could choose all of the options if they wanted to. Disability registered 22-
27 percentage points below the other variables we collected in the spreadsheet portion of
the survey as seen in Table 5 (page 42).
But many organizations reported that they are aware and striving towards inclusion and
equity for the disabled community. Here is one response representative of many
organizations who chose to describe their best practices concerning disability:
“[Our] website uses a responsive template design optimized for multiple screen sizes and
screen readers to ensure accessibility by people with visual impairments. We also
provide transcripts of all broadcast content to ensure accessibility by people with hearing
impairments.”
Analyzing disability in a quantitative way is undoubtedly a challenge. But addressing
disability issues on an organizational level remains important, and many in the DCLA
community are deeply engaged in this process.
Conclusion
We asked respondents what types of diversity are important to improving the quality of
work at their organizations. This was a multiple select question, meaning respondents
could select as many options as they liked. Types of diversity appear to have separated
into two distinct categories. Around 80%-90% of respondents selected race, ethnicity,
gender, age, and socioeconomic status. Socioeconomic status was the only category in
that range 80% that wasn’t a part of our data collection instrument.
LGBTQ, Disability, Language, Immigrant/Refugee and Religious diversity were selected
less frequently, at 71%, 63%, 60%, 53% and 44%.
DIVERSITY IN THE NEW YORK CITY DEPARTMENT OF CULTURAL AFFAIRS COMMUNITY 42
Table 5: “What types of diversity are important to improving the quality of work
at your organization?”
Type of Diversity Total Percent
Ethnicity 886 90%
Race 869 88%
Age 852 86%
Gender 841 85%
Socioeconomic 790 80%
LGBTQ 702 71%
Disability 626 63%
Language 591 60%
Immigrant/Refugee 522 53%
Religious 432 44%
Other 60 6%
While this table shows some stratification in types of diversity organizations find
important, it also emphasized that most organizations value many types of diversity.
This level of interest shows that many cultural organizations in New York agree that
issues of equity and inclusion are relevant to their work.
Overall, the strong participation of the DCLA grantee community in this project is a
testament both to the Department’s prioritization of diversity and the community’s
strong interest and engagement. The findings represent a snapshot of the DCLA grantee
community in the summer of 2015, against which the New York City cultural community
and its policy makers can gauge the current position. As time progresses, and to the
extent that interventions are put into place, these findings also provide a strong baseline
to measure change over time.