divided democracy - ippr
TRANSCRIPT

Institute for Public Policy Research
Sarah Birch, Glenn Gottfried and Guy Lodge
November 2013 © IPPR 2013
REPORT
DIVIDEDDEMOCRACYPOLITICAL INEQUALITY IN THE UK AND WHY IT MATTERS

ABOUT THE AUTHORS
Sarah Birch is professor of politics at the University of Glasgow.
Glenn Gottfried is quantitative research fellow at IPPR.
Guy Lodge is an associate director at IPPR and co-editor of Juncture, IPPR’s quarterly journal.
ACKNOWLEDGMENTS
We are grateful to the Joseph Rowntree Charitable Trust for funding this research. We would like to thank
Howard Reed for his help with the analysis of the 2010 spending review. We also thank Harold Clarke, Paul
Whiteley and the British Election Study for their assistance with the survey data.
ABOUT IPPRIPPR, the Institute for Public Policy Research, is the UK’s leading progressive thinktank. We are an independent charitable organisation with more than 40 staff members, paid interns and visiting fellows. Our main office is in London, with IPPR North, IPPR’s dedicated thinktank for the North of England, operating out of offices in Newcastle and Manchester.
The purpose of our work is to assist all those who want to create a society where every citizen lives a decent and fulfilled life, in reciprocal relationships with the people they care about. We believe that a society of this sort cannot be legislated for or guaranteed by the state. And it certainly won’t be achieved by markets alone. It requires people to act together and take responsibility for themselves and each other.
IPPR 4th Floor 14 Buckingham Street London WC2N 6DF T: +44 (0)20 7470 6100 E: [email protected] www.ippr.org Registered charity no. 800065
This paper was first published in November 2013. © 2013 The contents and opinions in this paper are the author(s) only.
BOLDIDEASforCHANGE

IPPR | Divided democracy: Political inequality in the UK and why it matters1
Executive summary ......................................................................................................2
Introduction ..................................................................................................................4
1. Non-voters in the UK ................................................................................................6
Electoral turnout .........................................................................................................6
Electoral inequality by age and income ........................................................................7
International comparisons ...........................................................................................9
Other characteristics of non-voting groups ................................................................10
2. The consequences of electoral inequality .................................................................. 13
The impact of the 2010 spending review for voters and non-voters ............................13
The relationship between electoral participation and political responsiveness ..............15
The wider impact of electoral inequality in the UK ......................................................18
3. Tackling turnout inequality .....................................................................................20
The case for compulsory voting ................................................................................20
The case for compulsory first-time voting ..................................................................21
Addressing criticisms of compulsory first-time voting .................................................22
References .................................................................................................................24
Appendix 1: Multivariate analysis of the correlates of political participation ............27
Appendix 2: Policy preferences of voters and non-voters .........................................29
Appendix 3: Impact of the 2010 spending review on voters and non-voters ............31
CONTENTS

IPPR | Divided democracy: Political inequality in the UK and why it matters2
Falling turnout in British general and local elections has been well documented. But it is not the overall level of turnout that should concern us most. The far greater problem facing British democracy is the growing inequality in turnout: electoral participation is falling fastest among the young and the least affluent, which gives well-off and older voters disproportionate influence at the ballot box.
A dramatic social class divide in electoral participation has opened up in recent decades. In the 1987 general election there was only a four-point gap in the turnout rate between the highest income group and the poorest; by 2010 this had jumped to 23 points.
The age gap is even more striking. Just 44 per cent of 18–24-year-olds voted in the 2010 general election, compared to 76 per cent of those aged 65 and over. Turnout inequality between young and old voters has grown at an alarming rate in recent years – the turnout gap between these two age-groups jumped from 18 points in 1970 to 32 points in 2010 – and shows little sign of being reversed. Worse still, there is now clear evidence of a ‘cohort effect’: younger people today are less likely than previous generations to develop the habit of voting as they move into middle age.
Unequal turnout matters because it reduces the incentives for governments to respond to the interests of non-voters and thus threatens a central claim of democracy: that every citizen’s preference, no matter their status, should count equally.
To illustrate the preferential treatment of voters, IPPR’s analysis of the 2010 spending review shows that those who did not vote in the 2010 general election faced cuts worth 20 per cent of their annual household income, compared to 12 per cent for those who did vote. The cuts have disproportionately affected the young and the poor – precisely those groups that vote with least frequency. People aged 16–24 face cuts to services worth 28 per cent of their annual household income, compared to 10 per cent for those aged 55–74. Those with annual household incomes under £10,000 stand to lose the equivalent of 41 per cent of their average income through cuts; by contrast, those with incomes over £60,000 will lose on average £2,104, which represents just 3 per cent of this group’s average income.
More worryingly, unequal turnout unleashes a vicious cycle of disaffection and under-representation among those groups for which participation is falling. As policy becomes less responsive to their interests, more and more decide that politics has little to say to them. This downward spiral risks permanently excluding these citizens from electoral life.
This cycle can only be broken by radical measures. In this report, we argue that the best way to boost political participation among hard-to-reach groups is to make voting compulsory. Compulsory voting in elections is more widespread than many realise, and is currently practised in approximately a quarter of the world’s democracies, including Belgium and Australia, although in no case is voting itself required by law – rather, what is mandatory is attendance at the polls. Not all of these states actively enforce the legal requirement to turn out on election day, but among those that do, enforcement is usually executed through small fines.
However, compulsory voting is controversial. A more realistic approach is to make electoral participation compulsory for first-time voters only. These young voters would be compelled only to turn out – and would be provided with a ‘none of the above’ option on the ballot.
EXECUTIVESUMMARY

IPPR | Divided democracy: Political inequality in the UK and why it matters3
The logic behind this proposal is that people who vote in the first election for which they are eligible are considerably more likely to vote throughout their lives. Introducing an obligation for new eligible voters to turn out once would thus go a significant way towards breaking the habit of non-voting that often gets passed from generation to generation, and could have a substantial and lasting impact on turnout. It would also go some way toward righting the balance of British electoral politics, which has tilted toward the affluent and ‘grey’ vote in recent years, as it would force politicians to pay attention to other voter groups.
A one-off requirement to take part in elections will undoubtedly not be sufficient on its own to address disaffection with and disengagement from politics. Nonetheless, there is reason to believe that it is an important institutional complement to efforts by politicians and civil society to reconnect with the public and to reinvigorate politics.

IPPR | Divided democracy: Political inequality in the UK and why it matters4
A central claim of every healthy democracy is that government treats all citizens as political equals – that is, that every citizen is believed to have the same chance as any other to influence the political process. When this is not the case – when political influence becomes too skewed towards particular groups, and when political power becomes too concentrated in the hands of a few – democracy itself is said to be threatened (see Gilens 2012).
Since the advent of universal suffrage for British adults in 1928, there has been very limited formal political exclusion in Britain. It is nonetheless widely accepted that some sections of the British population are far more effectively represented politically than others, which gives rise to an equally widespread suspicion that the interests of some in society are given special treatment by the governing class.
More precisely, it is often said that the well-off exercise disproportionate power over the political process. The experience of recent decades has left the impression that the rich can pressure governments by threatening to take their wealth elsewhere; they are able to influence political parties through donations; they have privileged access to political elites, which strengthens their lobbying capacity; they can buy power through the media, enabling them to set the political agenda. In stark contrast, the less affluent, and especially the poor, are often excluded from our politics. They are less likely to vote or to think that their political participation will make a difference.
Indeed, it might be argued that it is the rise of political inequality that represents the real ‘crisis’ of British democracy, and that low levels of public trust in politicians and participation are merely symptoms of this wider malaise. In truth, Britain has not moved from being a high- to a low-trust society – trust has always been relatively low – but the public today undoubtedly feel much less confidence in their ability to influence the political process and even less faith in the idea that government will treat all citizens equally (see Stoker 2006).
The sources of such political inequality and exclusion have, however, rarely been systematically studied in Britain. Despite the clear importance of the issue (and despite the existence of extensive research in other advanced democracies, especially the United States) policymakers know surprisingly little about the causes and consequences of political inequality in Britain. In particular, it is not clear how political inequalities shape government decisions, and how these in turn help to create or perpetuate ‘winners and losers’. The relationship between political inequality and economic inequality deserves much greater attention in public debate.
Britain is not the US, but developments there should be a cause for concern. Research has demonstrated that US politicians are significantly more responsive to the views of higher-income groups than they are to the less well-off. Jacob Hacker and Paul Pierson (2010) argue that the chronic levels of income inequality that have opened up in the US are best explained not by structural conditions in the labour market but by the dominance of corporate and elite interests in the American polity.
A preoccupation with the rise of political inequality is also reflected in developments in contemporary political theory. Here, discussion about the state’s role in addressing material inequality is giving way to questions about the health of democracy itself (see Stears 2012). Sheldon Wolin and John McCormick, for instance, believe that economic elites are able to ‘capture’ the political process, essentially disenfranchising other groups with fewer political resources (see Wolin 2008, McCormick 2011).
INTRODUCTION

IPPR | Divided democracy: Political inequality in the UK and why it matters5
This paper looks at a specific aspect of the debate about political inequality: the rise and consequences of non-voting. The electoral process is the principal institutional device for influencing what governments do and for representing societal interests. Yet following a period in which the franchise was firstly extended, and a subsequent time in the post-war era when turnout grew consistently, electoral participation is now falling – and it is doing so across all major democracies (Schäfer and Streeck 2013).
We argue, however, that the real trouble for representative democracy is less that turnout is falling and more that it is increasingly unequal. Electoral participation is becoming skewed by age and income, which raises profound questions about the degree to which governments can claim to be sufficiently representative of the population. We are interested in particular in the question about whether democratic politics privileges voters over those who choose not to participate. Of course, it might be thought normatively desirable for politics to respond to the wishes of voters. But it is surely undesirable – and deeply problematic for democratic theory – if it is the case that the interests and preferences of non-voters are neglected by parties and governments. Not least, this is problematic because it widens the gap between non-voters and their political institutions, which is likely to put them off voting in the future, thus contributing further to their own political exclusion.
This short paper is a contribution to this debate. It is divided into three parts:
• First, we map recent trends in electoral participation in the UK and ask: how unequal is turnout in the UK?
• Then we ask the ‘so what’ question: does turnout inequality matter? Are governments more inclined to privilege voters over non-voters? If so, what are the implications for democratic participation? To test the degree to which governments treat voters and non-voters differently, we analyse the impacts of the 2010 spending review.
• Finally we explore options for boosting participation to tackle the effects of widening political inequality, including the proposal for compulsory first-time voting.

IPPR | Divided democracy: Political inequality in the UK and why it matters6
In democracies there exists an ingenious mechanism for ensuring that public policy broadly reflects the demands of the population: voting. Yet elections are only able to achieve this if the views of the electorate accurately reflect those of the population as a whole. When the collective desires of the voting population diverge too much from those of the citizenry at large, elections are no longer fit to steer governments according to popular wishes. There are worrying signs that this is beginning to happen in the UK, with potentially profound consequences for the body politic.
The reason is less to do with the well-documented accounts of falling levels of turnout in elections. The real problem confronting British democracy is the degree of turnout inequality. It is the growing demographic distinctiveness of non-voters that makes their non-participation in electoral life increasingly problematic for representative democracy. It is therefore worth pausing to acquaint ourselves with the non-voting section of the electorate and to chart trends over time in the composition of this group.
Electoral turnoutElectoral participation in the UK has dropped precipitously from approximately four-fifths of the electorate in a typical general election in the 1960s to about three-fifths in the general elections held this century. Figure 1.1 shows that for several decades before and up to 1992 election turnout had ranged between 70 and 80 percent; it then plummeted dramatically in 1997 and 2001. Since then we have seen levels of voter participation 10–15 percentage points below previous levels.
50
55
60
65
70
75
80
85
90
201020052001199719921987198319791974
Source: UK Political Info, ‘General election turnout 1945–2010’: http://www.ukpolitical.info/Turnout45.htm
From a democratic perspective, this dramatic fall in turnout might not matter if it occurred uniformly across the electorate as a whole: that is, if the voting population remained broadly representative of the overall population. But this is emphatically not the case: electoral participation is falling fastest among the young and the least affluent. In other words, the non-voting population has characteristics which distinguish it sharply from the population at large and from those who do vote. What is more worrying is that these trends in unequal turnout have grown at alarming rates in recent years and show little sign of being reversed.
1. NON-VOTERSINTHEUK
Figure 1.1 UK general election
turnout, 1974–2010 (%)

IPPR | Divided democracy: Political inequality in the UK and why it matters7
Electoral inequality by age and incomeThat young people vote with less frequency than older members of the population is hardly surprising. But what is striking is the size of the gap that has opened up in the participation rates of different age-groups. In 1970 there was an 18-point gap in turnout rates between 18–24-year-olds and those aged over 65; by 2005 this gap had more than doubled to over 40 points, before narrowing slightly to 32 points in 2010.1 If we focus on participation within these age-groups, we can see that at the 2010 general election the turnout rate for a typical 70-year-old was 36 percentage points higher than that of a typical 20-year-old.
It has been argued that we should be relaxed about low levels of participation among young people since they will start to vote as they move into middle-age, when government policies begin to have a more tangible impact on their lives. While this may have been the case historically, figure 1.2, which charts voting tendencies for age-groups over time, shows only limited evidence of such an ageing effect. In other words, we can no longer count on people to vote with greater frequency as they age.
This is because voting and not voting are habitual. Figure 1.2 confirms the findings of previous research which has shown that if citizens fail to vote the first time they are eligible to do so, they are much less likely to pick up the habit of voting as they get older (see Dinas 2012, Inglehart 1990, Gerber et al 2003, Franklin 2004). Turnout among those born in the 1970 and 1980 cohorts is lower than it is for older cohorts when they are first eligible to vote and – crucially – remains comparatively lower as they age.
Even if some groups do show greater willingness to vote as they get older, virtually every successive generation is starting its voting life with a lower turnout rate than the previous generation (see also Clarke et al 2004). Figure 1.2 suggests that the participation rates among voters who have entered the electorate since the 1990s will never catch up with those of older generations.
DOB 1940
DOB 1950 DOB 1960
DOB 1970 DOB 1980
DOB 1990
20
30
40
50
60
70
80
90
100
201020052001199719921987
Sources: British Election Studies and MORI
1 Ipsos MORI, ‘How Britain Voted in 2010’: http://www.ipsos-mori.com/researchpublications/researcharchive/2613/How-Britain-Voted-in-2010.aspx
Figure 1.2 Estimated turnout by age
cohort, 1987–2010 (%)

IPPR | Divided democracy: Political inequality in the UK and why it matters8
On this evidence we can expect age-based turnout inequality to become more acute in the future, allowing older voters to exercise more influence at the ballot box than younger voters. And this is before taking account of the impact of profound demographic changes that will further tilt the democratic process in favour of the grey vote. Craig Berry shows how in the next couple of decades an ageing population will concentrate voting power among those aged over 50: by 2021 the number of potential voters in an average single-year cohort of 50-somethings (roughly 902,000) will dwarf the equivalent number of 18-year-olds (around 708,000) (Berry 2012).
When it comes to income, the last 30 years has seen the rise of a substantial social class divide in electoral participation. Non-voters are less well off on average than members of the voting population. And as with age, the wealth discrepancy between voters and non-voters has increased significantly in recent years, and once again shows little sign of being reversed. This is clearly evident in the data presented in figure 1.3, which traces the voting behaviour of income groups over the course of recent elections.
40
50
60
70
80
90
100
201020052001199719921987
Quintile 1
Quintile 2 Quintile 4
Quintile 3 Quintile 5
Source: British Election Studies
In the 1980s, turnout among all income groups exceeded 80 per cent. Since then there has been a marked divergence, with electoral participation among the poorest segment of the population falling faster and further than that of other groups. There has also been a considerable increase in the degree of divergence between different income groups. In 1987 the difference between the highest-turnout quintile group and the lowest was only 4 percentage points; by 2010 this gap had increased to 22.7 percentage points – an increase of more than fivefold. Put another way, by 2010 individuals in the highest income group were 43 per cent more likely to vote than those in the lowest income group.
Together, these trends in age and income inequality constitute a toxic mix for British democracy. As younger cohorts’ participation in elections declines over time the gap between wealthier and poorer voters will also increase, as it those young people in the lower income range who are most likely not to participate as they age. Conversely, the people who are more likely to move from the default apathy of their youth to becoming more politically active are those from wealthier backgrounds or those who move up the income ladder. Britain runs the risk, therefore, of an even greater disparity in political influence opening up between rich and poor.
Figure 1.3 Estimated turnout
changes by income group, 1987–2010 (%)

IPPR | Divided democracy: Political inequality in the UK and why it matters9
Unsurprisingly, the starkest participation gap exists between someone who is young and poor and someone who is older and rich. IPPR analysis estimates that the likelihood of voting for an individual under the age of 35 earning less than £10,000 a year is just 34 per cent, whereas the predicted turnout rate of someone who is over 55 with an income of at least £40,000 a year is 79 per cent.2
The data has so far demonstrated that a strong correlation exists between an individual’s age and relative wealth and their likelihood of voting, and more worryingly that the gap in participation rates between older and wealthier voters on the one hand and younger and poorer voters on the other has grown significantly over time. But how does Britain compare with other democracies when it comes to turnout inequality?
International comparisonsFigure 1.4 compares voter turnout rates between under-30 and over-60 age-groups across a number of European democracies.3 With one exception – Belgium, where voting is compulsory – it shows that in all countries electoral participation is higher among over-60s than under-30s. The UK sits towards the bottom of the league table when it comes to turnout among the under-30s, ahead of only Switzerland, France and Ireland. However, the participation rate of older voters in Britain is much more typical of a western European democracy. Together, these two results mean that Britain has one of the greatest imbalances of voting power between young and old voters. The countries which have the lowest levels of voter inequality between age groups are the Nordic countries, Germany, Spain and Belgium.
30 and below 60 and above
0
10
20
30
40
50
60
70
80
90
100
Belgium
Sweden
Spain
Norway
Netherl
ands
German
y
Denmark
Finlan
d
Greece
Cypru
s
Portug
al
Great B
ritain
Irelan
d
Fran
ce
Switzerl
and
Source: European Social Survey, 2010 – Wave 5 Question: ‘Did you vote at the last national election?’ Does not include those who were ineligible to vote at last election.
2 See appendix 1 for details of the model used for these estimates.3 Unfortunately we cannot compare all western European democracies as we are limited to those countries
included in the European Social Survey dataset.
Figure 1.4 Turnout by age-groups,
various European comparator countries (%)

IPPR | Divided democracy: Political inequality in the UK and why it matters10
Britain also fares poorly when we compare turnout inequality by income. Participation rates for those in the poorest income quintile in Britain are among the lowest in Europe (see figure 1.5); however, Britain’s wealthiest also turn out at comparatively lower levels than other European countries. Despite this, the disparity between rich and poor again places Britain closer to the bottom of the league table. And again, the Nordic countries, Spain and Belgium are among those countries which have the more balanced turnout rates between income groups.
Bottom quintile Top quintile
0
10
20
30
40
50
60
70
80
90
100
Cypru
s
Sweden
Denmark
Spain
Belgium
Norway
Greece
Netherl
ands
Finlan
d
German
y
Great B
ritain
Irelan
d
Fran
ce
Switzerl
and
Source: European Social Survey, 2010 – Wave 5 Question: ‘Did you vote at the last national election?’ Does not include those who were ineligible to vote at last election.
The comparative figures also point to a possible relationship between economic inequality and political participation. We can observe that the level of turnout inequality – measured by age and especially income – tends to be lower in the more egalitarian Nordic countries than in less-equal societies such as Britain. This appears to support Frederick Solt’s conclusion that economic inequality depresses political engagement, especially among the least affluent, because it makes them believe that the democratic process is rigged in favour of the rich and thus ‘that politics is simply not a game worth playing’ (Solt 2008: 58). By contrast, voters in countries in which societies are more equal tend to believe that the political process is less likely to be captured by special interests.
Other characteristics of non-voting groupsEthnicity Non-voting is complicated by the problem of non-registration. For instance, voter registration rates are significantly higher among people aged 55–64 (90 per cent) than those aged 18–24 (55 per cent). And it is registration rates – rather than turnout levels – that characterise the political inequality of ethnicity in Britain. Table 1.1 shows that nearly 20 per cent of BME people are not registered to vote, compared to 7 per cent of the ‘white British’ population. Anthony Heath and colleagues put this variance in voter
Figure 1.5 Turnout by income
groups, various European countries (%)

IPPR | Divided democracy: Political inequality in the UK and why it matters11
registration down to socioeconomic and cultural barriers (Heath et al 2013). For example, a higher proportion of BME people live in private rented accommodation and so lack the long-term security of tenure associated with higher registration rates.
Registered to vote at sample address
Said they were registered at
another address Not registered Validated turnout*
All minorities 78 4 19 76
White British 91 2 7 78
Source: Heath et al forthcoming, British Electoral Study, Ethnic Minority British Electoral Survey 2010 * Turnout among those are registered.
EducationEducation – and higher education in particular – is a powerful determinant of whether a person votes or not. When analysing the British Election Study we found that holding a degree has a strong and statistically significant effect on increasing one’s likelihood of voting. In the 2010 election, for example, there was a 10-point gap between the probability of a graduate voting and the probability for a non-graduate, all else being equal (see table 1.2).
The effect of the graduate variable may be partly explained by differences in wages. Graduates are more likely to earn higher wages than non-graduates, thereby accentuating the income effect. Also relevant is the exposure to political debate that comes with university life. University campuses tend to be centres of political activism which all students are subjected to – even if they choose not to participate – thus raising their level of political awareness.
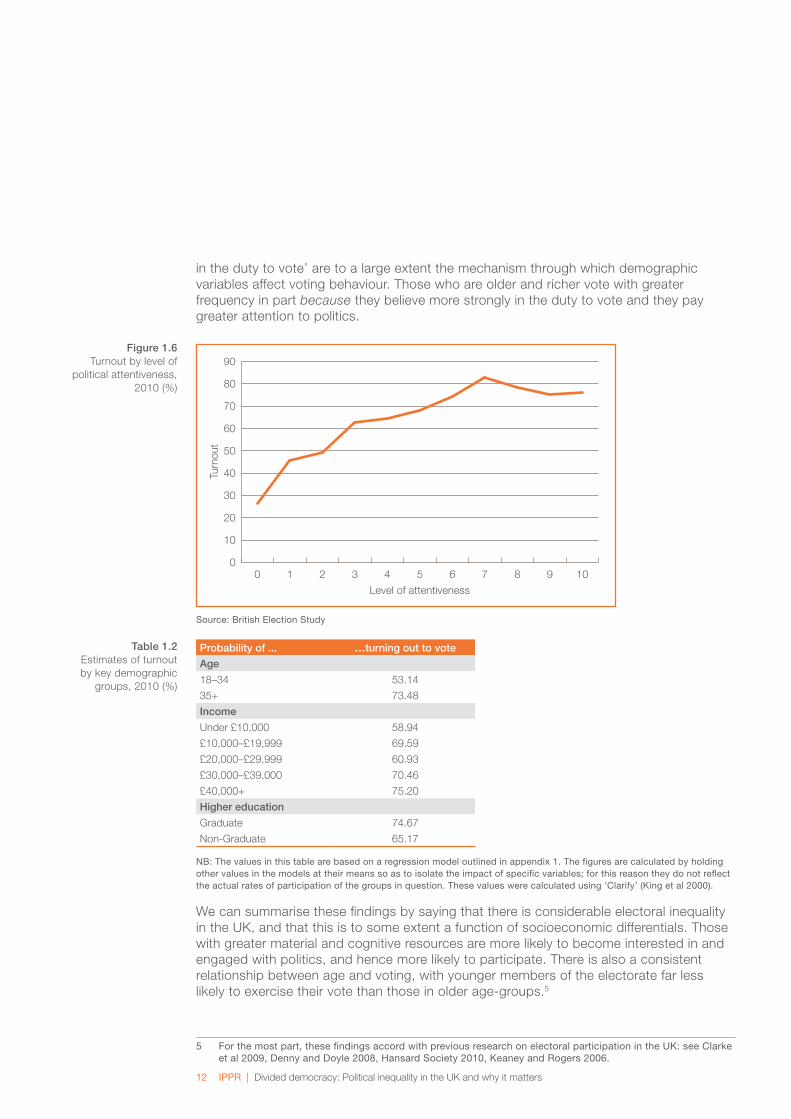
Political attentivenessIn addition to demographic characteristics such as age and income, the non-voting population is also characterised by a number of attitudes and dispositions. There is considerable evidence to suggest that large sections of the electorate who do not vote have ‘tuned out’ of politics. Attentiveness to politics is one of the major attitudinal factors associated with electoral participation, as shown in figure 1.6 (over). Therefore, this tuning-out has significant implications for the way citizens engage in and ‘consume’ politics, and how they link policy agendas to their own lives and concerns.4
IPPR’s analysis of the 2010 British Election Study shows that the propensity to vote – or not vote – is shaped by a mix of demographic and attitudinal factors. When we consider the impact of demographic factors on turnout, we observe several well-established patterns (see table 1.2 and appendix 1): the young are considerably less likely to vote than their older counterparts, as are those on low incomes and non-graduates. But when information about key beliefs and dispositions are added – above all, the level of attention paid to politics and the belief that voting is a duty – these prove stronger determinants in explaining why people went to the polls in May 2010 than the demographic variables on their own.
These findings suggest a causal story. Older citizens with higher incomes and more education develop a greater interest in politics and current affairs, and have a greater sense of electoral duty. In other words, age, income and education lead to political engagement. Political engagement then strengthens the propensity to vote. Another way of saying this is that the political engagement variables of ‘attention to politics’ and ‘belief
4 See appendix 1 for more on the characteristics associated with voting and not voting. See appendix 2 for more on the policy preferences of voters and non-voters.
Table 1.1 Registration and
general election turnout, 2010, British and
Commonwealth citizens (%)
IPPR | Divided democracy: Political inequality in the UK and why it matters12
in the duty to vote’ are to a large extent the mechanism through which demographic variables affect voting behaviour. Those who are older and richer vote with greater frequency in part because they believe more strongly in the duty to vote and they pay greater attention to politics.
0
10
20
30
40
50
60
70
80
90
109876543210
Turn
out
Level of attentiveness
Source: British Election Study
Probability of ... …turning out to vote
Age
18–34 53.14
35+ 73.48
Income
Under £10,000 58.94
£10,000–£19,999 69.59
£20,000–£29,999 60.93
£30,000–£39,000 70.46
£40,000+ 75.20
Higher education
Graduate 74.67
Non-Graduate 65.17
NB: The values in this table are based on a regression model outlined in appendix 1. The figures are calculated by holding other values in the models at their means so as to isolate the impact of specific variables; for this reason they do not reflect the actual rates of participation of the groups in question. These values were calculated using ‘Clarify’ (King et al 2000).
We can summarise these findings by saying that there is considerable electoral inequality in the UK, and that this is to some extent a function of socioeconomic differentials. Those with greater material and cognitive resources are more likely to become interested in and engaged with politics, and hence more likely to participate. There is also a consistent relationship between age and voting, with younger members of the electorate far less likely to exercise their vote than those in older age-groups.5
5 For the most part, these findings accord with previous research on electoral participation in the UK: see Clarke et al 2009, Denny and Doyle 2008, Hansard Society 2010, Keaney and Rogers 2006.
Figure 1.6 Turnout by level of
political attentiveness, 2010 (%)
Table 1.2 Estimates of turnout by key demographic
groups, 2010 (%)
IPPR | Divided democracy: Political inequality in the UK and why it matters13
The distinctiveness of non-voters raises some fundamental questions about the consequences of non-voting for the quality of democratic representation. To what extent does unequal turnout affect the policy decisions of governments? Which is to say, what evidence is there to suggest that governments privilege high-turnout groups over those groups who tend not to vote? Do younger people and those with lower incomes and less education benefit less and suffer more from government policies than their older, better educated and better-off counterparts? Given that electoral participation is skewed by income, what is the relationship between political inequality and economic inequality? And if non-voters are more heavily penalised than voters, what impact will this have on their likelihood of voting in the future?
Despite the degree of turnout inequality identified in chapter 1, these questions remain under-investigated. In analysing the phenomenon of non-voting, political science has tended to focus its energy elsewhere.6 This is beginning to change, particularly in the US, where levels of political inequality are most pronounced (see for instance Solt 2010, Gilens 2005 and 2012, Hacker and Pierson 2010, Bartels 2008). However, even when research has attempted to look at whether policy outcomes favour particular parts of the electorate, it often fails to distinguish between voters and non-voters.7 As Anthony Fowler puts it ‘despite extensive research on voting behaviour, there is little evidence connecting turnout to tangible outcomes’ (Fowler 2013: 179). As an attempt to contribute to the debate about unequal turnout in the UK, then, we will here assess the differential impact of the 2010 spending review on voters and non-voters.
The impact of the 2010 spending review for voters and non-votersSpending reviews are one of the most important interventions a government makes and so are a logical place to study the effects of turnout inequality. The Coalition government’s 2010 spending review is a particularly important example since it led to dramatic cuts to public spending in most policy areas. Although virtually all groups have been affected by the cuts in some way, the hypothesis of a ‘political inequality effect’ would suggest that those groups which vote less frequently ought to be disproportionately affected by the cuts. Table 2.1 (over) presents the results from a statistical model estimating the impact of the cuts – expressed in real cash terms – on survey respondents to the British Election Study, which allows us to compare the position of those who voted in the 2010 election with those who did not.8
6 For instance, there is a vast body of literature that looks at why people choose not to vote. When it comes to the political impact of non-voting, research has tended to focus on issues such as the effect of differential turnout on election outcomes (for an overview of this literature see Lutz and Marsh 2007; see also Bernhagen and Marsh 2007, Fisher 2007, van der Eijk and van Egmond 2007).
7 The US literature, for instance, is much more focused on providing a more general analysis about the relative influence wielded by different social groups. From the UK perspective, the most relevant studies exploring the responsiveness of politics to different segments of the population are those by Adams and Ezrow (2009) and Hakhverdian (2010). In their analysis of 12 European democracies, Adams and Ezrow find that party policy positions respond most to the positions of opinion-leaders (defined as those who participate most in political discussion and persuasion), which suggests that those who are active in the political sphere have more of an influence on policy outcomes than those who are not active. Hakhverdian uses governing party policy positions derived from budget speeches in the UK from 1956 to 2006 combined with Eurobarometer survey data to assess policy responsiveness to different socioeconomic groups under Conservative and Labour governments. He finds that the policy outputs of safe Tory governments are responsive to voters with higher incomes and those of safe Labour governments are responsive to voters with lower incomes. Governments with smaller majorities are found to be more responsive to voters with middle incomes.
8 The predicted cuts used in this model are in cash terms on an annual basis between 2010/11 and 2014/15, uprated to April 2010 prices. For more details on the methodology please refer to appendix 3.
2. THECONSEQUENCESOFELECTORALINEQUALITY

IPPR | Divided democracy: Political inequality in the UK and why it matters14
Category Average net changeAverage change as a proportion of
annual household income
Voting behaviour
Voters -£1,850 -11.56%
Non-voters -£2,135 -20.00%
Gender
Men -£1,818 -12.14%
Women -£2,086 -17.13%
Age
16–24 -£2,850 -27.53%
25–34 -£2,139 -14.47%
35–44 -£2,471 -15.60%
45–54 -£2,204 -15.08%
55–64 -£1,474 -13.41%
55–74 -£1,305 -10.06%
75+ -£1,365 -14.46%
Income
Under £10,000 -£1,926 -40.89%
£10,000–£19,999 -£1,839 -12.72%
£20,000–£29,999 -£1,973 -8.13%
£30,000–£39,000 -£1,970 -5.63%
£40,000–£49,000 -£1,986 -4.40%
£50,000–£60,000 -£2,063 -3.93%
£60,000+ -£2,104 -2.67%
Nation / region
Scotland -£1,970 -17.37%
Wales -£2,009 -14.81%
London -£2,300 -13.92%
South East -£1,828 -10.06%
South West -£1,834 -12.23%
East -£1,827 -9.94%
East Midlands -£2,147 -21.79%
West Midlands -£1,923 -14.84%
North East -£2,038 -20.84%
North West -£1,826 -11.52%
Yorkshire and the Humber -£1,918 -11.85%
Average across all groups -£1,953 -14.64%
The results demonstrate that the average loss in services and benefits amounts to £1,850 per voter compared to £2,135 per non-voter. The difference is even starker when we consider it as a proportion of the average household income of these two groups.9 The cuts are estimated to represent 11.6 per cent of the annual income of voters and a full 20 per cent of the income of non-voters. Thus, non-voters will be almost twice as badly affected by the provisions of the spending review as those who went to the polls in 2010.
9 The income data used are gross annual household income, as reported in the British Election Study survey. The income of respondents is reported in bands. Point estimates are calculated at the mean of each band. Those in the top band, £90,000+, were estimated to have incomes of £100,000. This undoubtedly underestimates the income of some of these respondents, but they constitute only 4.4 per cent of the sample, so the distortion resulting from this estimate ought not to be severe.
Table 2.1 Impact of the 2010 spending review on selected groups, in
terms of spending cuts

IPPR | Divided democracy: Political inequality in the UK and why it matters15
When we use the same model to examine the impact of the cuts on different demographic groups known to characterise the non-voting population, we see that the cuts consistently hit these groups harder than those groups which are known to vote. Those at the lower end of the income ladder have suffered most from the changes in taxes and benefits set out in the 2010 spending review. Those with annual household incomes under £10,000 have lost an average of £1,926 annually from the spending measures, comprising a staggering 40.9 per cent of their average income. By contrast, those with incomes over £60,000 lost an average of £2,104, which represents only 2.7 per cent of this group’s income. The spending cuts have thus had a strongly disproportionate impact on the poor, who tend to vote much less often than more affluent citizens.
This pattern repeats itself when we turn to the impact on different age-groups. It is the 16–24-year-old group that has suffered most from the cuts. People in this age-group face cuts to services worth an estimated 27.5 per cent of their annual household income, while no other age-group faces average cuts worth more than 16 per cent of their income.10
Our analysis of the 2010 spending review provides empirical evidence to support the claim that, in this instance at least, the government’s decisions favoured voters over non-voters. There are, of course, limits to this type of case study analysis. Most obviously it tells us nothing about causality: we know that non-voters got a raw deal from the spending review but we don’t know whether this is because they are non-voters. Doubtless there are other factors – such as the political values and outlook of the Coalition government itself – that shaped the decisions. Nonetheless, given everything else we know about contemporary politics, it is reasonable to assume that electoral considerations played some part in the government’s calculations, even if they were not the most salient. Surely it is not just coincidental that, for instance, the education maintenance allowance for young people was scrapped, while benefits for those over 65 years of age – free TV licences and bus passes, and winter fuel payments – were protected? Or that tuition fees were trebled when pensions were secured with a triple-lock?
The relationship between electoral participation and political responsivenessIn recent decades, political parties and governments have become much more adept at targeting particular voting groups through their communications and policy proposals. Not surprisingly, they tend to target groups that are most likely to vote.11 Moreover, for all its faults, recent analysis has demonstrated that the British political system does a reasonably good job of responding to the electorate – that is, to voters (Soroka and Wlezien 2010). In other words, voting matters, and those who do not participate are less likely to be listened to. This is what Arend Lijphart calls ‘democracy’s unresolved dilemma’ in which unequal turnout spells unequal influence (Lijphart 1997: 1).
This is not to argue that British politics can be said to be characterised by systematic and deliberate discrimination against non-voters. The relationship between electoral participation and political responsiveness is more subtle than this (indeed some decisions may simply reflect an unconscious bias among the political class).12
10 There is also a gender discrepancy – women are experiencing cuts worth 17.1 per cent of their income whereas the corresponding figure for men is only 12.1 per cent. And there are significant regional variations, with the East Midlands, the North East and Scotland being hardest hit and the East of England region faring best.
11 More accurately, they target voters who are most likely to vote for them, and voters in marginal seats. 12 To make a very obvious point, parties can’t afford to completely ignore non-voters because they are still potential
voters. Also relevant here is that there are plenty of examples of parties pursuing policies that favour groups with relatively low participation rates, most obviously redistributive policies targeted at low-income groups.

IPPR | Divided democracy: Political inequality in the UK and why it matters16
Instead, as comparative research suggests, over time, and as a consequence of certain groups’ sustained (self-) exclusion from electoral politics, political parties start to form strategies and policies that favour those groups with relatively high turnout rates and ignore those who are less likely to participate (Offe 2013: 198; see also Streeck 2007: 28, Lijphart 1997: 4).
Whatever the subtleties of this relationship, the consequences for democracy are dire. By tilting politics in favour of high-turnout groups, unequal turnout unleashes a vicious cycle of disaffection and under-representation among those groups for which participation is falling. As policy becomes less responsive to their interests, more and more decide that politics has little to say to them, which further reduces their motivation to vote, which in turn reduces the incentives for politicians to pay them much attention. Claus Offe refers to this self-reinforcing dynamic as the ‘paradox of fatalism’.13
The presence of such a toxic feedback loop between disaffected citizens and the political priorities pursued by governments recalls EE Schattschneider’s classic account of non-voting, set out in The Semi-Sovereign People (1960). He argued that voters choose the route of ‘massive self-disenfranchisement’ when the political agenda ceases to reflect their needs and concerns (ibid: 102). For Schattschneider, patterns of (unequal) political participation are simply a reflection of the political conversation taking place, and determining the content of that conversation depends crucially on the distribution of economic resources. The more unequal a society the more the political agenda will be dominated by the interests of the rich and powerful and the less it will resonate with poorer voters, who eventually come to see voting as a meaningless exercise. Economic inequality more than anything else, argued Schattschneider, explains the differential rates of electoral participation among rich and poor in the US.
While aspects of this thesis have been challenged in the 50 years since publication, the central claim that economic inequality depresses turnout has proved incredibly robust. Indeed, the effect has become more pronounced as economic inequalities have widened. The troubling experience of the US provides the most compelling evidence of the interplay between political and economic inequality: a large number of recent studies have demonstrated that wealthier Americans exercise considerably more influence over the political process than do poorer citizens (Solt 2010, Gilens 2005 and 2012, Hacker and Pierson 2010, Bartels 2008, Hill and Leighley 1992). Larry Bartels has shown how politicians – both Democrats and Republicans – have become increasingly more responsive to the policy preferences of higher-income groups than those who are less well-off. In a powerful conclusion, he writes that ‘economic inequality is, in part, a political phenomenon (Bartels 2008).
As noted in chapter 1, Solt’s multi-country study (which includes the UK) finds that higher levels of income inequality reduce participation in elections ‘among all but the most affluent citizens, providing compelling evidence that greater economic inequality yields greater political inequality’ (Solt 2008: 48). Studies have found that groups with lower rates of participation are also less well represented in politics (Hicks and Swank 1992, Mueller and Stratmann 2003). There has also been a limited number of US-based analyses which have demonstrated that voters are better represented by democratic institutions than non-voters (Griffin and Newman 2005, Martin 2003).
13 He used this term in an email exchange with the authors.

IPPR | Divided democracy: Political inequality in the UK and why it matters17
Conversely, the comparative literature shows that countries with higher levels of political participation tend to have lower levels of economic inequality and higher levels of welfare provision (Birch 2009, Chong and Olivera 2005, Dubrow 2008, Hicks and Swank 1992, Mueller and Stratmann 2003). Solt (2008) also finds evidence to support the theory that because political resources are correlated with economic resources, the more affluent will have a better capacity to control the political debate. The less affluent will find that the policies in discussion are of no interest to them, thus their attentiveness level decreases and they find that participating in elections isn’t worth the time or effort. Therefore, in countries where there is more economic inequality we can expect political participation for the less affluent to fall.
Our own analysis supports this research. When observing west European democracies as a group, we find that lower levels of voter turnout are clearly associated with higher levels of income inequality, as measured by the Gini coefficient (figure 2.1). The countries with more equal societies have the highest levels of voter turnout, while those with higher levels of income inequality tend to have lower levels of turnout. It’s also worth noting that in countries which have compulsory voting, income inequality remains low. Greece is the one exception to this – however, its compulsory voting regime is not backed up by penalties.
20 25 30 35 40 4540
50
60
70
80
90
100
Turn
out l
evel
BEL
CYP
LUX
DEN
SWE
NORGER
NEDITA
SPA GRE
AUT
FINFRA
IREPOR
UK
SWZ
Gini coefficient
Note: Countries with compulsory voting are noted in orange. All Gini coefficients are from 2004 data, except Cyprus from 2003. Turnout is the proportion of the registered population from closest national election to 2004.
The evidence presented in this paper suggests that the effects of economic inequality on electoral participation are likely to be self-reinforcing. To simplify – and no doubt oversimplify – a complex story: growing economic inequality discourages the less affluent from voting, which makes the political process more responsive to the policy preferences of a smaller and wealthier electorate, thus provoking even greater marginalisation and political exclusion among poorer groups in society.
This is especially the case when the cyclical relationship between political and economic inequality generates policies that result in economic disadvantage for non-voters, as was
Figure 2.1 Income inequality vs
voter turnout in western Europe, mid-2000s

IPPR | Divided democracy: Political inequality in the UK and why it matters18
the case with the 2010 spending review. Figure 2.1 shows that in the UK the correlation between high economic inequality and low turnout is one of the strongest among western European democracies. Given the worrying trends in turnout identified above, unless action is taken to boost participation rates we can expect the UK’s position to deteriorate even further, leading to a more divided democracy in the future.
This analysis underlines the need to better understand how political inequalities in the broadest sense shape public policy in the UK. Turnout inequality is but one manifestation (or perhaps it is best to think of it as a symptom) of a range of overlapping political inequalities that sometimes serve to bend the democratic process in favour of a privileged minority at the expense of everyone else. Wealthy citizens, for instance, can pressure governments by threatening to take their money elsewhere; they are able to influence political parties through donations and through their lobbying capacity – they can even (indirectly) buy seats in the legislature. The UK is clearly not in the same league as the US, but recent controversies over lobbying and a string of donation scandals nevertheless paint a troubling picture. Whereas numerous studies have focused on the economic and social drivers of economic inequality, much less attention has been paid to the impact that political inequality has in explaining its prevalence, or the role reducing political inequalities could potentially play in tackling it.
The wider impact of electoral inequality in the UKUnequal turnout is not only bad for democracy, it also poses serious questions about the ability of the UK government to tackle the long-term strategic challenges the country faces. This is most obviously the case when it comes to the age bias of the electorate, in which the rapidly rising proportion of old voters, combined with their higher propensity to vote, means that governments are likely to continue to allocate scarce resources to the health service and state pensions at the expense of investment in things like childcare, long-term infrastructure projects, scientific research and energy innovation (Kaletsky 2011).14
This point is reflected in a recent IPPR and Policy Network report exploring public opinion in France, Denmark and Britain, which detected a hardening of a ‘conservative bias’ in social attitudes towards welfare reform (Diamond and Lodge 2013). It found that entrenched support for the ‘traditional’ welfare state, promising higher pension payments and public expenditure on health, has been reinforced by the financial crisis, while public support for welfare state policies geared towards tackling ‘new’ social risks – related to structural changes in labour markets, demography, gender equality and families that traditional social protection systems are poorly equipped to negotiate – is relatively weak. Support for the traditional welfare state consensus was, however, much higher among older voters, whereas support for policies designed to address new social risks, such as childcare provision, was higher among younger voters. The report warned of a danger that growing inequalities in electoral participation might further entrench the welfare status quo and heighten the onset of intergenerational and distributional conflict.15
14 The point here is emphatically not to suggest that older people should be treated less generously but to draw attention to the broader implications of differential turnout on political life in Britain.
15 In Britain, for example, older voters are strong supporters of prioritising spending on the NHS: 51 per cent compared to 37 per cent for 18–24-year-olds. Support for prioritising spending on state pensions is 44 per cent and 13 per cent respectively, and for policing 36 and 18 per cent respectively. Older voters are less likely to support increased investment in primary and secondary education (16 and 32 per cent respectively). Older respondents also support cutting back maternity and paternity benefit (37 and 15 per cent respectively), child benefit (29 and 12 per cent) and preschool childcare (24 and 9 per cent).

IPPR | Divided democracy: Political inequality in the UK and why it matters19
These findings overlap with comparative studies which have demonstrated that members of different age groups have divergent policy preferences (Busemeyer 2009, Kitschelt and Rehm 2006).16 This suggests that a strong upward skew in the age profile of voters, such as that observed in the UK, will bias policy in favour of older cohorts. A prolonged era of austerity is likely to exacerbate this situation, leaving politicians more vulnerable to the demands of the retiring babyboomers, and so raising the likelihood that public policy will become increasingly distorted against the interests of younger people.17 The controversy in 2012 over the so-called ‘granny tax’ which asked pensioners – and relatively affluent pensioners at that – to make a relatively small contribution to deficit reduction illustrates how difficult it is for governments to resist the pull of the grey vote.
16 See appendix 2 for further discussion about the preferences of voters and non-voters.17 Also, policies intended to appease older voters have consequences for younger generations. The Institute for
Fiscal Studies notes that the new triple-lock pension reform plans will have a disproportionate effect on younger generations of workers who enter the labour market from 2002 onwards. This includes women who take time off to have children and part-time workers, many of whom are in low-income households. Each of these groups will likely end up receiving a comparatively lower pension at the state pension age (Crawford et al 2013).

IPPR | Divided democracy: Political inequality in the UK and why it matters20
Democracy relies on the active participation of the citizenry for its legitimacy. Until the late 20th century, this participation had been taken for granted. Recent generations of Britons had struggled for the vote, had died to defend their democratic institutions, and came out in force to vote at election time. But since the final decades of the millennium, unequal turnout and the rise of political inequality have done damage to our democratic culture, above all by engendering a downward spiral of disaffection and under-representation. This vicious cycle can only be broken by bold and radical action that seeks to strengthen the voice of the politically excluded in the electoral process.
This won’t be easy. There may be other factors, inherent in social change, that make it unlikely that the recent decline in political participation will right itself on its own. It could well be that with the growing influence of market forces, and the culture that goes with it, combined with a secular decline in collective pursuits, people are becoming more self-interested and less willing voluntarily to contribute to the collective good. Some argue that electors, particularly those of the younger generation, are becoming more calculating and more ‘economic’ in their approach to how they use their time, and less willing to contribute to the public good (Stoker 2006, Whiteley 2011).
Since the dramatic decline in turnout that led to fewer than three in five eligible electors taking part in the general election of 2001, there have been a number of concerted efforts to boost electoral participation, particularly among the young. Citizenship education has been enhanced, targeted voter education materials have been developed, ‘get the vote out’ campaigns have been organised, and efforts have been made to make voting more convenient through, for example, the introduction of postal ballots.18 Self-evidently, such initiatives, important as they are, have conspicuously failed to boost the turnout rates of marginalised groups (while attempts to make voting easier have actually heightened concerns about electoral fraud19). At best, it could be argued that without these efforts the problem of turnout inequality may have become more severe, but the idea that a bigger push on this front will have the transformative effect that is required seems highly dubious. The scale of turnout inequality has become so pronounced that we believe these efforts must be combined with a more significant institutional change.
The case for compulsory votingIPPR has argued elsewhere that by far the most effective – albeit controversial – way of boosting participation is to make voting compulsory (Keaney and Rogers 2006; see also Birch 2009). Compulsory voting is more widespread than many realise, and is currently practised in approximately a quarter of the world’s democracies, including Belgium and Australia, although in no case is voting itself required by law – rather, what is mandatory is attendance at the polls. Not all of these states actively enforce the legal requirement to turn out on election day, but among those that do, enforcement is usually executed through small fines.
In states that have adopted compulsory voting since the second world war, there has been an average turnout increase of 14 per cent (Birch 2009: 85) but its impact can often be considerably higher, increasing turnout rates by around 30 per cent (Hill 2011). Turnout in Australia has averaged 95 per cent in the 24 elections since 1946. In Belgium, turnout has averaged 93 per cent in 19 elections since 1946.
18 A raft of experiments and pilot projects have been undertaken to facilitate electoral participation through weekend voting, voting over several days, or voting in supermarkets and kiosks (Norris 2004).
19 See Norris 2004
3. TACKLINGTURNOUTINEQUALITY

IPPR | Divided democracy: Political inequality in the UK and why it matters21
Most importantly, however, compulsory voting drastically reduces turnout inequality by enhancing the representation of marginalised and apathetic groups. Singh’s comparative study shows that the ‘voting population will be more reflective of the entire electorate in compulsory systems’ (Singh forthcoming). Looking at the introduction of compulsory voting in Australia, for instance, Fowler finds that the policy boosted the participation rates of the least affluent more than any other group and therefore helped to redress a systematic bias against non-voters in Australian politics (2011: 27–28). Figures 1.4 and 1.5 above show how in Belgium – where compulsory voting is still law yet not enforced – turnout inequality is almost non-existent.
Calls for compulsory voting are, however, commonly met with the objection that it is a citizen’s right to choose not to vote – this is an argument that has long stuck in the collective gullet of the British public. To allay such fears, we propose a more limited approach, which is to make electoral participation compulsory for first-time voters only.
The case for compulsory first-time votingUnder this model, voters would be obliged to go to the polls once, on the first occasion they were eligible (see Birch 2009). Voters would only be compelled to turn out and would be provided with a ‘none of the above’ option on the ballot paper, should they not wish to cast a vote for any of the candidates. To ensure high participation rates, a small fine should be set to enforce the policy.20 This measure would place a small burden on young people, but its main effect would be to force politicians to pay attention to them and their interests.
What is the case for first-time compulsory voting? The first reason is that voting is habitual. As Mark Franklin’s research shows, if people vote in the first election for which they are eligible then they are far more likely to vote in subsequent elections (Franklin 2004).Therefore, there is good reason to believe that if young people were obliged by law to give voting a try, this could kickstart a life-long habit of voting. In other words, a small element of compulsion could subsequently have a substantial and lasting impact on turnout.
Second, first-time compulsory voting is deliberately targeted at improving the representation of young people, where levels of turnout inequality are highest. Moreover, first-time compulsory voting could easily be combined with a number of other reforms designed to inculcate democratic participation among the young. Andrew Adonis has persuasively argued that young people should be registered to vote at their place of study, with polling stations located in schools and colleges, thereby allowing young people to share the experience of voting rather than seeing it as a solitary, individual act (Adonis and Tyndall 2013). Citizenship education, Adonis writes, would lead not only to mock elections but to real elections. This is right, but we would add that this whole experience could be transformed further if the young people taking part knew they had to cast their first vote.21
Third, and perhaps most important, if politicians realised that young people would be voting in larger numbers then they could not afford, as is often the case now, to ignore their concerns and interests in favour of those of groups that already vote in large numbers. Critics of compulsory voting often fail to acknowledge how this element of compulsion – forcing politicians to engage with voters – could help to address underlying causes of political disaffection, not just their symptoms.
20 We recommend a similar penalty to that used in Australia, which issues fines of AU$20 – the equivalent of about £12.
21 Evidence from the roll-out of citizenship education in schools since 2002 suggests that it has not so far been undertaken with sufficient intensity to generate notably higher levels of political engagement (see Keating et al 2010, Tonge et al 2012). This could change if it was linked with first-time compulsory voting.

IPPR | Divided democracy: Political inequality in the UK and why it matters22
Fourth, if young people from poorer backgrounds were required to vote then this might encourage their non-voting parents and grandparents to exercise this democratic right, thereby closing the political inequality gap between classes as well as generations.
Addressing criticisms of compulsory first-time votingThe objections to compulsory first-time voting are similar to those routinely launched against all forms of compulsory voting. The most common criticism is that it is simply undemocratic to force citizens to engage in political life. There are counterarguments to the position, however; civil liberties go hand in hand with civic duties, one of which is to take part in political decision-making. In fact, a strong version of the duty to vote is intimately bound up with the development of British theories of representation. In 1921, Lord Bryce summarised this view succinctly when he wrote that ‘as individual liberty consists in the exemption from political control, so political liberty consists in participation in legal control’; in other words, the protection of personal freedom is perfectly compatible with the legal obligation to take part in collective decision-making through the election of law-makers.
There are already many aspects of our lives that include an element of compulsion, from annual MOTs to jury service to completion of the census. Electoral registration is effectively compulsory: under the current rules, all those who are resident in the UK are obliged to provide electoral registration officers with the information they request or face a £1,000 fine.22 Young people are required by the law to attend school. Adding one more small task to this list would not represent an undue burden.
Still, not everyone will be convinced by arguments such as this. For this reason, any viable proposal for compulsory first-time voting would have to allow electors to opt out; no first-time elector would be obliged actually to go to the polls and vote, but they would have to take active measures to exempt themselves from this obligation.23 This requirement would encourage young people at least to think about the value that might be attached to voting and, in so doing, to think about what voting means and what role it might play in their lives.
Another complaint levelled at compulsory voting is that, while it might improve participation rates, it does not improve the quality of democratic participation. Those forced to vote will not do so in a meaningful way. This is a serious point, but the claim seems overstated: in Australia, for instance, so-called ‘donkey votes’ – a form of spoilt ballot – account for well under 5 per cent of total votes. Additionally, states with compulsory voting tend to have higher levels of satisfaction with democracy (Birch 2009). However, we fully appreciate that compulsory voting is not a silver bullet for ending political disaffection, the root causes of which are deep and complex.
For these reasons, we believe that first-time compulsory voting is best combined with other reforms designed to overcome the barriers to participation (as in the schools example described above). Indeed, it might strengthen the impact of other reforms. An obvious example here is the call to lower the voting age to 16. There are strong normative reasons for allowing 16 and 17-year-olds to vote, but the evidence is mixed in terms of the potential impact such a move would have on participation rates. Combining the two policies would guarantee that reducing the voting age would not deepen levels of political inequality.
22 The Coalition government recently proposed moving to a system of voluntary enrolment at the time of the planned introduction of individual voter registration, but this idea was subsequently abandoned when it was pointed out that it would exacerbate the problems of political inequality.
23 For instance, a similar provision could be included to that used in Australia where citizens who believe that voting is ‘morally wrong’ can make a case for exemption.
IPPR | Divided democracy: Political inequality in the UK and why it matters23
Would compulsory first-time voting over-represent the young? There are two counter-arguments to this objection. First, no individual voter would be disadvantaged by such a move, as no one would be deprived of the franchise by the measure and all votes cast would still be weighted equally. Second, over time, all members of the electorate would at some point in their lives experience mandatory voting, such that all would be treated equally over the course of the lifecycle. The exception would be those individuals who have already voted once at the time the measure is introduced; but again, there is nothing preventing aggrieved members of this group from exercising their franchise whenever they have the opportunity.
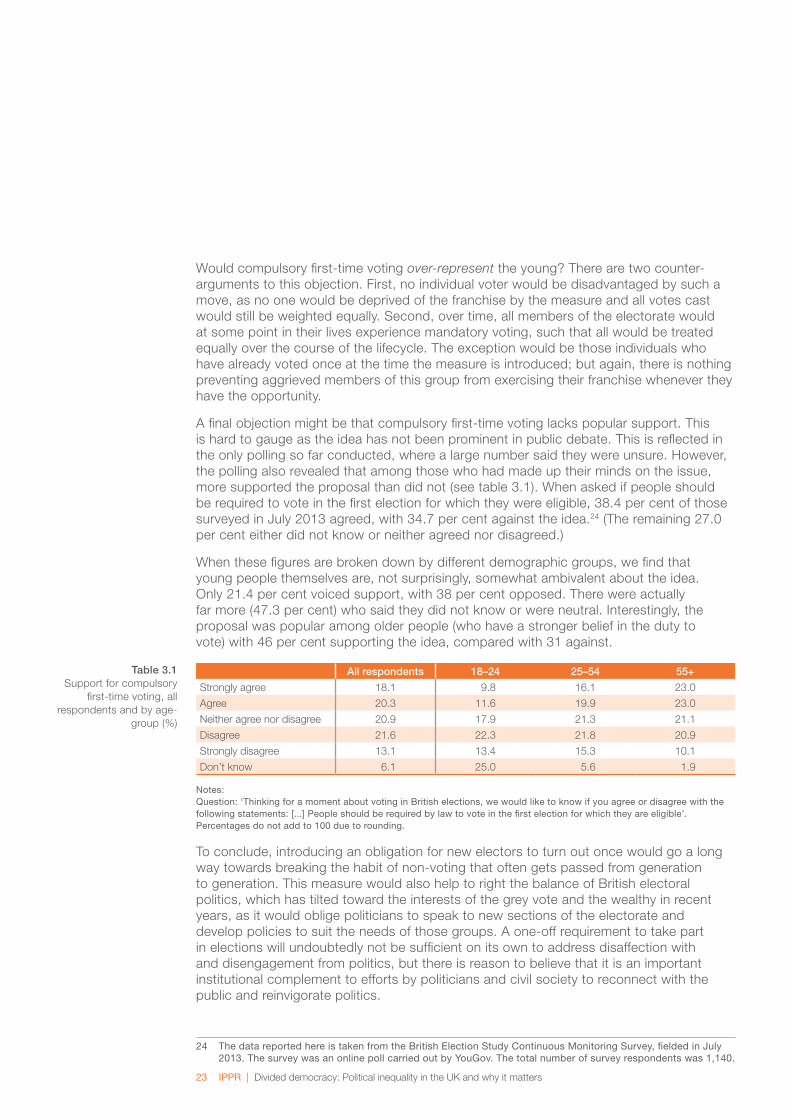
A final objection might be that compulsory first-time voting lacks popular support. This is hard to gauge as the idea has not been prominent in public debate. This is reflected in the only polling so far conducted, where a large number said they were unsure. However, the polling also revealed that among those who had made up their minds on the issue, more supported the proposal than did not (see table 3.1). When asked if people should be required to vote in the first election for which they were eligible, 38.4 per cent of those surveyed in July 2013 agreed, with 34.7 per cent against the idea.24 (The remaining 27.0 per cent either did not know or neither agreed nor disagreed.)
When these figures are broken down by different demographic groups, we find that young people themselves are, not surprisingly, somewhat ambivalent about the idea. Only 21.4 per cent voiced support, with 38 per cent opposed. There were actually far more (47.3 per cent) who said they did not know or were neutral. Interestingly, the proposal was popular among older people (who have a stronger belief in the duty to vote) with 46 per cent supporting the idea, compared with 31 against.
All respondents 18–24 25–54 55+
Strongly agree 18.1 9.8 16.1 23.0
Agree 20.3 11.6 19.9 23.0
Neither agree nor disagree 20.9 17.9 21.3 21.1
Disagree 21.6 22.3 21.8 20.9
Strongly disagree 13.1 13.4 15.3 10.1
Don’t know 6.1 25.0 5.6 1.9
Notes: Question: ‘Thinking for a moment about voting in British elections, we would like to know if you agree or disagree with the following statements: [...] People should be required by law to vote in the first election for which they are eligible’. Percentages do not add to 100 due to rounding.
To conclude, introducing an obligation for new electors to turn out once would go a long way towards breaking the habit of non-voting that often gets passed from generation to generation. This measure would also help to right the balance of British electoral politics, which has tilted toward the interests of the grey vote and the wealthy in recent years, as it would oblige politicians to speak to new sections of the electorate and develop policies to suit the needs of those groups. A one-off requirement to take part in elections will undoubtedly not be sufficient on its own to address disaffection with and disengagement from politics, but there is reason to believe that it is an important institutional complement to efforts by politicians and civil society to reconnect with the public and reinvigorate politics.
24 The data reported here is taken from the British Election Study Continuous Monitoring Survey, fielded in July 2013. The survey was an online poll carried out by YouGov. The total number of survey respondents was 1,140.
Table 3.1 Support for compulsory
first-time voting, all respondents and by age-
group (%)

IPPR | Divided democracy: Political inequality in the UK and why it matters24
Adams J and Ezrow L (2009) ‘Who Do European Parties Represent? How Western European Parties Represent the Policy Preferences of Opinion Leaders’, Journal of Politics, 71(1): 206–223
Adonis A and Tyndall A (2013) ‘For the sake of democracy, we need to get the young voting again. Here’s how’, New Statesman Staggers blog, 18 July 2013. http://www.newstatesman.com/politics/2013/07/sake-democracy-we-need-get-young-voting-again-heres-how
Bartels LM (2008) Unequal Democracy: The Political Economy of the New Gilded Age, New York and Princeton: Russell Sage Foundation and Princeton University Press
Bernhagen P and Marsh M (2007) ‘The Partisan Effects of Low Turnout: Analyzing Vote Abstention as a Missing Data Problem’, Electoral Studies, 26(3): 548–560
Berry C (2012) ‘How the growing grey vote could undermine British democracy’, Open Democracy, 30 April 2012. http://www.opendemocracy.net/ourkingdom/craig-berry/how-growing-grey-vote-could-undermine-british-democracy
Birch S (2009) Full Participation: A Comparative Study of Compulsory Voting, Manchester: Manchester University Press
Bryce J (1921) Modern Democracies, vol 1, New York: Macmillan
Busemeyer MR (2009) ‘Attitudes towards redistributive spending in an era of demographic ageing: the rival pressures from age and income in 14 OECD countries’, Journal of European Social Policy, 19(3): 195–212
Chong A and Olivera M (2005) ‘On Compulsory Voting and Income Inequality in a Cross-Section of Countries’, Inter-American Development Bank Research Department working paper 533
Clarke HD, Sanders D, Stewart MC and Whiteley PF (2004) Political Choice in Britain, Oxford: Oxford University Press
Clarke HD, Sanders D, Stewart MC and Whiteley PF (2009) Performance Politics and the British Voter, Cambridge: Cambridge University Press
Crawford R, Keynes S and Tetlow H (2009) Welcome simplification of state pensions but younger generations lose, London: Institute for Fiscal Studies
Denny K and Doyle O (2008) ‘Political Interest, Cognitive Ability and Personality: Determinants of Voter Turnout in Britain’, British Journal of Political Science, 38(2): 291–310
Diamond P and Lodge G (2013) European Welfare States after the Crisis, London: Policy Network
Dinas E (2012) ‘The Formation of Voting Habits’, Journal of Elections, Public Opinion and Parties, 22(4): 431–456
Dubrow JK (2008) ‘On the Relationship between Political Inequality and Economic Inequality: A Cross-National Study’, unpublished manuscript.
Electoral Commission (2010) The Completeness and Accuracy of Electoral Registers in Great Britain, London
Fisher S (2007) ‘(Change in) Turnout and (Change in) the Left Share of the Vote’, Electoral Studies, 26(3): 598–611
Fowler A (2013) ‘Electoral and Policy Consequences of Voter Turnout: Evidence from Compulsory Voting in Australia’, Quarterly Journal of Political Science, 8: 159–182
REFERENCES

IPPR | Divided democracy: Political inequality in the UK and why it matters25
Franklin M (2004) Voter Turnout and the Dynamics of Electoral Competition in Established Democracies Since 1945, Cambridge: Cambridge University Press
Gerber AS, Green DP and Shachar R (2003) ‘Voting May Be Habit Forming: Evidence from a Randomized Field Experiment’, American Journal of Political Science, 47(3): 540–550
Gilens M (2005) ‘Inequality and Democratic Responsiveness’, Public Opinion Quarterly 69(5): 778–896
Gilens M (2012) Affluence and Influence: Economic Inequality and Political Power in America, Princeton: Princeton University Press
Griffin JD and Newman B (2005) ‘Are Voters Better Represented?’, Journal of Politics 67(4): 1206–1227
Hacker J and Pierson P (2010) Winner-Take-All Politics: How Washington Made the Rich Richer – and Turned Its Back on the Middle Class, New York: Simon & Schuster
Hakhverdian A (2010) ‘Political Representation and Its Mechanism: A Dynamic Left-Right Approach for the United Kingdom’, British Journal of Political Science, 40(4): 835–850
Heath A, Fisher S, Rosenblatt G, Sanders D and Sobolewska M (2013) The Political Integration of Ethnic Minorities in Britain, Oxford: Oxford University Press
Hicks AM and Swank DH (1992) ‘Politics, Institutions, and Welfare Spending in Industrialized Democracies, 1960–82’, American Political Science Review, 86(3): 658–674
Hill KQ and Leighley J (1992), ‘The Policy Consequences of Class Bias in State Electorates’, American Journal of Political Science, 36(2): 351–365
Horton T and Reed H (2010), ‘The Distributional Impact of the 2010 Spending Review’, Radical Statistics, 103: 13–24
Inglehart R (1990) Culture Shift in Advanced Industrial Society, Princeton: Princeton University Press
Kaletsky A (2011) ‘Pensioners’ votes should be given to children’, The Times, 27 April 2011. http://www.thetimes.co.uk/tto/opinion/columnists/anatolekaletsky/article2999516.ece
Keaney E and Rogers B (2006) A Citizen’s Duty: Voter Inequality and the Case for Compulsory Turnout, London: IPPR. http://www.ippr.org/publication/55/1504/a-citizens-dutyvoter-inequality-and-the-case-for-compulsory-turnout
Keating A, Kerr D, Thomas B, Mundy E and Joana Lopes J (2010) Citizenship Education in England 2001-2010: Young People’s Practices and Prospects for the Future: the Eighth and Final Report from the Citizenship Education Longitudinal Study (CELS), DFE-RR059, London: Department for Education
King G, Tomz M and Wittenberg J (2000) ‘Making the Most of Statistical Analyses: Improving Interpretation and Presentation’, American Journal of Political Science, 44(2): 347–361
Kitschelt H and Rehm P (2006) ‘New Social Risks and Policy Preferences’ in Armingeon K and Bonoli G (eds) The Politics of Post-industrial Welfare States: Adapting Post-War Social Policies to New Social Risks, London and New York, Routledge
Lijphart A (1997) ‘Unequal Participation: Democracy’s Unresolved Dilemma’, American Political Science Review, 91(10): 1–14

IPPR | Divided democracy: Political inequality in the UK and why it matters26
Lutz G and Marsh M (2007) ‘Introduction: Consequences of Low Turnout’, Electoral Studies, 26(3): 539–547
Martin PS (2003) ‘Voting’s Rewards: Voter Turnout, Attentive Publics, and Congressional Allocation of Federal Money’, American Journal of Political Science, 47(1): 110–127
McCormick JP (2011) Machiavellian Democracy, Cambridge: Cambridge University Press
Mueller DC and Stratmann T (2003) ‘The Economic Effects of Democratic Participation’, Journal of Public Economics, 87: 2129–2155
Norris P (2004) ‘Will new technology boost turnout?’ in Kersting N and Baldersheim H (eds) Electronic Voting and Democracy: A Comparative Analysis, London: Palgrave
Offe C (2011) ‘Crisis and Innovation of Liberal Democracy: Can Deliberation Be Institutionalised?’ Czech Sociological Review, 47(3): 447–472
Offe C (2013) ‘Participatory Inequality in the Austerity State: A Supply-Side Approach’ in Schäfer A and Streeck W (eds) Politics in the Age of Austerity, Malden, MA: Polity Press
Schäfer A and Streeck W (eds) (2013) Politics in the Age of Austerity, Malden, MA: Polity Press
Schattschneider EE (1960) The Semi-Sovereign People: A Realist’s View of Democracy in America, New York: Holt, Rinehart and Winston
Singh S (forthcoming) ‘Compulsory Voting and the Turnout Decision Calculus’, Political Studies
Solt F (2008) ‘Economic Inequality and Democratic Political Engagement’, American Journal of Political Science, 52(1): 48–60
Solt F (2010) ‘Does Economic Inequality Depress Electoral Participation? Testing the Schattschneider Hypothesis’, Political Behavior, 32(2): 285–301
Soroka SN and Wlezien C (2010) Degrees of Democracy: Politics, Public Opinion, and Policy, London and New York: Cambridge University Press
Stears M (2012) ‘The democratic moment in American political thought’, Juncture, 19(3): 208–211
Stoker G (2006) Why Politics Matters: Making Democracy Work, Basingstoke: Palgrave-Macmillan
Streeck W (2007) Endgame? The fiscal crisis of the German state, discussion paper 07/7, Cologne: Max Planck Institute for the Study of Societies
Tonge J, Mycock A and Jeffery B (2012) ‘Does Citizenship Education Make Young People Better-Engaged Citizens?’, Political Studies, 60: 578–602
Van der Eijk C and van Egmond M (2007) ‘Political Effects of Low Turnout in National and European elections’, Electoral Studies, 26(3): 561–573
Whiteley PF (2011) The Decline (and Revival) of the Civic Culture and Participation in Britain, Basingstoke: Palgrave-Macmillan
Wolin S (2008) Democracy Incorporated: Managed Democracy and the Specter of Inverted Totalitarianism, Princeton: Princeton University Press

IPPR | Divided democracy: Political inequality in the UK and why it matters27
The 2010 British Election Study can be used to analyse the correlates of various types of participation, including turnout at elections.25 Table A1 presents a standard logistic regression of voting in the 2010 general election. When we consider the impact of demographic factors on turnout, we observe several well-established patterns: the young are considerably less likely to vote than their older counterparts, and those in lower income brackets have a significantly lower probability of turning out at the polls than those at the top of the income scale. Graduates are also more likely than non-graduates to vote, all else being equal.
Several other factors found in previous research to affect turnout are not relevant in this analysis, including gender, marital status, ethnicity and the fact of being on benefits. When key beliefs and dispositions are added –- including the level of attention paid to politics, the belief that voting is a duty, frequency of religious practice and efficacy (the perception of influence on politics) – these factors absorb the impact of the demographic indicators. Not all the latter variables are statistically significant at conventional levels, but the two that are significant – attention to politics and belief in the duty to vote – prove to be strong determinants of the willingness of electors to go to the polling station last May.
When it comes to other forms of political participation, the situation is slightly more complicated. The final two columns in table A1 present statistical models based on a 10-point additive scale that combines six different forms of political participation, including willingness to:
• work with a group to solve a problem
• participate in a protest or demonstration
• give money to a political party
• work on an election campaign
• take part in a boycott
• buy products for political or ethical reasons.
In the first model, which includes demographic factors alone, being a graduate and being a member of an ethnic minority are the two factors most closely associated with higher levels of participation.26
When beliefs and dispositions are added to the mix, the picture changes somewhat. Education is still closely associated with propensity to participate in political activities, but gender and ethnicity are no longer significant. Instead, those on incomes between £10,000 and £19,999 are significantly less likely to participate once beliefs and dispositions are take into consideration. This makes sense, in as much as this income bracket mainly includes those who are in work but struggling to get by and with little spare time to take part in politics unless strongly motivated to do so by their belief systems. As might be expected, those who are attentive to politics are considerably more likely to
25 The data used here is from the post-election face-to-face survey, generally recognised as the gold standard in election surveys. See www.bes2009-10.org for details.
26 Separate models for each of the six forms of participation (not shown) demonstrate that there is relatively little variation across the six in the factors that are important, although ethnic minorities were slightly more likely than non-minorities to work with a group to solve problems or to buy products for ethical reasons, and those at higher income levels were significantly more likely to take part in protests, give money to political parties, work for a party or a candidate and buy products for ethical reasons. Finally, younger people were significantly more likely to report being prepared to work with a group to solve a problem and to work for a party, while men say they are more likely than women to work for a party and take part in a boycott. The finding for education was strong and consistent across types of participation.
APPENDIX1MULTIVARIATEANALYSISOFTHECORRELATESOFPOLITICALPARTICIPATION

IPPR | Divided democracy: Political inequality in the UK and why it matters28
participate than the inattentive. Interestingly, religiosity is also weakly related to propensity to take part in political activities. Finally, a sense of efficacy is strongly linked to propensity to participate in the aspects of political life included here, although it was not shown to be a significant determinant of turnout.
Variable Turnout (validated vote) Political participation
Gender – male -.030 -.019 .274* .039
Age < 35 -1.329*** -.555 -.067 .106
Age 35–54 -.403 -.234 .186 .262
Income < £10,000 -.740** -.480 -.433 -.464
Income £10,000–£19,999 -.281 .212 -.303 -.590*
Income £20,000–£29,000 -.661** -.380 -.044 -.354
Income £30,000–£39,999 -.233 -.013 .038 -.011
Graduate .460** -.096 .961*** .456*
On benefits -.368 -.435 -.346 -.111
Pensioner -.294 -.579 -.415 -.399
Married or co-habiting -.076 -.044 -.270 -.100
Ethnic minority -.170 -.516 .692** .346
Attention to politics .179*** .226***
Belief in the duty to vote .427*** .037
Religiosity -.049 .111*
Efficacy -.023 .171***
Constant 1.665 -.899 2.642 .066
Nagelkerke R2/Adjusted R2 .109 .187 .100 .297
N 1068 508 993 474
* p < .05 ** p < .01 *** p < .001 Note: The turnout models presented here are based on the ‘validated vote’ data in the British Election Study. This is data on whether or not the respondent in question actually voted, regardless of what they reported in the survey. There is a category of respondent that is listed as ‘name not registered at this address’. Such respondents are classified as non-voters for the purposes of this analysis, under the assumption that most of them would in fact be eligible to vote had they sought to register themselves. The total of 344 non-registered respondents represents 11.21 per cent of the total. This accords roughly with the Electoral Commission’s estimate of the proportion of the eligible electorate that is not registered to vote for parliamentary elections (approximately 10 per cent) (Electoral Commission 2010).
Table A1 Correlates of turnout
(logistic regressions) and political participation
(OLS regressions)

IPPR | Divided democracy: Political inequality in the UK and why it matters29
An obvious port of call for those interested in understanding whether public policy is more responsive to the views of voters than non-voters is a comparison of the policy preferences of these two groups. However, this raises a number of challenges. For instance, how confident can we be about the strength of the preferences of non-voters? Non-voters’ preferences may well change through the act of participating in elections and associated political engagement (Offe 2011). This relates to a wider characteristic of political inequality.
In his classic investigation of political and economic inequality in the United States, Larry Bartels notes that many people have ‘profound difficulties’ in ‘connecting specific policy proposals to their own values and interests’, and that for this reason:
‘Egalitarian impulses often fail to get translated into policy because ordinary citizens do not grasp the policy implications of their egalitarian values. [...] Almost two-thirds of people who say the rich pay less than they should in taxes nevertheless favour repealing the federal estate tax – a tax that only affects the richest 1–2% of taxpayers.’Bartels 2008: 27
Those who are less informed about and engaged in politics are also less likely to be aware of how specific policy proposals affect their interests. They will thus be less well equipped to use their vote to defend those interests. Indeed, one of the most significant aspects of political inequality may be precisely the differential ability to make sense of the alternative policy proposals put forward by political parties and to link these proposals to one’s personal circumstances. Those who have this ability are far more likely to be able to navigate politics effectively and to participate in ways that serve their needs, whereas those for whom the implications of policy alternatives are less clear are deprived of the capacity to use opportunities to participate effectively. This suggests that differential political literacy is an integral component of political inequality. As we argued in chapter 1 of this paper, political attentiveness can serve as a proxy for likelihood of voting. The concern is not only that non-voters diminish their ability to influence political outcomes, but that in removing themselves from these political conversations they weaken their political attentiveness.
To illustrate this point, it is sufficient to consider the preferences expressed by survey respondents on the central issue of taxation and spending. The British Election Study 2010 asked a question that required respondents to consider the trade-off between reducing taxation and increasing public spending. Respondents were invited to place their view on a 0–10 scale, and answers to these questions were coded such that a higher score indicates a preference for higher levels of both taxation and spending while a low score indicates a preference for lower levels of taxation and spending. Another question on the BES asked respondents to rate their level of attentiveness on a scale of 0–10, higher scores being the most attentive. If we compare those who replied 8, 9 or 10 on attentiveness with those who replied 0, 1, or 2, it is possible to gauge the impact of attentiveness on perceptions of interest.
If all respondents were fully aware of their interests then we might reasonably expect to see an inverse correlation between preferences for higher taxes/spending and income. In fact, we only observe this relationship among those who are highly attentive to politics (see table A2) – among this group, the desire for taxation and spending declines markedly for respondents who earn more than £40,000 per year (and who thus are liable for higher-rate tax). Those who are less attentive to politics are less likely to prefer tax and spending policies which may better serve their personal circumstances.
APPENDIX2POLICYPREFERENCESOFVOTERSANDNON-VOTERS

IPPR | Divided democracy: Political inequality in the UK and why it matters30
Another pattern that immediately stands out from the data in this table is the tendency for those less attentive to politics to prefer considerably lower levels of taxation and spending (save those in the £40,000+ bracket). Given that the majority of people benefit from redistri-bution, this suggests that those who tune out of politics risk cutting themselves off from the information required to develop more intuitive preferences surrounding various policies.
Income All respondents Highly attentive to politics Non-attentive to politics
Under £10,000 6.18 5.78 4.97
£10,000–£19,999 5.55 6.00 4.89
£20,000–£29,999 5.54 5.97 4.39
£30,000–£39,999 5.49 5.97 5.54
£40,000+ 5.54 5.45 5.49
Note: The question employed to measure attentiveness reads: ‘On a scale of 0 to 10 how much attention do you generally pay to politics?’ The highly attentive are defined as those who place themselves at positions 8, 9 or 10 on the scale; the non-attentive are those who place themselves at 0, 1 or 2 on the scale. The tax-and-spend scale also runs from 0–10, with a higher score representing a preference for higher levels of taxation and spending.
This analysis suggests that participation has both qualitative and quantitative elements. In other words, participation is not simply about the numbers of people who go to vote, but also about citizens remaining engaged in political dialogue to make better informed decisions when voting. A societal risk remains that non-voters cut themselves off from political debate altogether, which can affect policy decisions made by our lawmakers. Politicians will have less of an incentive to support the needs of those who not only fail to participate in the electoral process but are also unwilling to assess their policies. Despite this, however, the causal direction between voting and attentiveness is not entirely clear. Individuals who regularly vote may pay attention to politics because they know they’ll have to make a decision on election day, while those who have decided not to vote will find they have no need to follow political discussion. If this is the case then an electoral system which helps to habitualise voting may in turn foster greater political attentiveness.
Table A2 Preferences for
taxation vs income and attentiveness to politics: mean scores on the tax-
and-spend scale

IPPR | Divided democracy: Political inequality in the UK and why it matters31
The estimated spending cuts provided in table 2.1 were carried out through a two-step modelling process.
In the first step, the distributional effects of cuts to public expenditure were predicted using data and methodology identical to that used by Horton and Reed in their analysis of the 2010 spending review (Horton and Reed 2010). The following excerpt provides a detailed account of their modelling:
MethodologyOur model of the distributional effects of cuts to public expenditure analyses public spending using the ‘expenditure-on-services’ accounting framework which HM Treasury uses for the Government’s Public Expenditure Statistical Analysis (PESA) series. This classifies spending in terms of the type of service it is spent on (health, education, etc.) In 2007-08 (the most recent year for which full data was available), public spending comprised around £140 billion of transfer payments to households (benefits and tax credits), and around around £415 billion of spending on public services (e.g. health, education, defence etc.), making a total of £555 billion.
Our analysis uses a breakdown of expenditure on services at a very fine level of detail, decomposing the ten broad categories used in the PESA framework into hundreds of smaller categories which correspond reasonably closely to ‘everyday’ categories of public services which people use. For example, the ‘health’ category is broken down into ‘GP services’, ‘dental services’, ‘in-patient treatment’ and so on.
Allocating public service expenditure by service useHaving identified total government spending in each area of service provision, our model then allocates this spending to households on the basis of a range of information concerning which households receive and use particular services and how much they use them. Our main source of information on service use is household surveys conducted by the Office for National Statistics, which contain data on whether and how much households use different types of services, or variables from which service use can be inferred. For example, the General Household Survey asks people how often they use hospital or GP services; the Expenditure and Food Survey asks people how much they spend on rail travel (an indicator of how much they use rail services), on so on. Overall, we have used five different surveys as data sources for the model (shown in [table A3] below) as no one survey contains all the information we need.
Table A3: Data sources used in the model
Name of datasetExample of public services that the dataset provides information about
British Crime Survey (BCS) police
British Household Panel Survey (BHPS) social care (except residential care for old people)
Expenditure and Food Survey (EFS) transport
General Household Survey (GHS) health
museums and galleries
Family Resources Survey (FRS) education
housing
programmes for the unemployed
APPENDIX3IMPACTOFTHE2010SPENDINGREVIEWONVOTERSANDNON-VOTERS

IPPR | Divided democracy: Political inequality in the UK and why it matters32
For all of these surveys we use a single wave of data from 2007-08 or the nearest available year. This enables us to analyse service use for the same financial year for which we have data on government spending and household incomes.
The Family Resources Survey (FRS) is the dataset which is most often used to analyse the distributional effects of tax and benefit reforms. Therefore we used the FRS as the main dataset for our analysis and matched in data on the probability of using public services such as health, social care, roads and public transport from other datasets using a number of regressions with, in each case, a measure of service use as the dependent variable and household characteristics such as income decile, number and age of adults, number and age of children, region and housing tenure as the explanatory variables. This allowed us to make an estimate of the extent of each FRS household’s use of (for example) health services based on information such as household income, size, age structure and region, even though the FRS itself does not contain information on use of health services. Full details are given in the technical appendix to Horton and Reed (2010).
The analysis also takes account of situations where public funding for a service is subject to income or asset-based means testing (for example, social care services) based on information on income and assets in the FRS.
In the second step, we applied the regression estimates from Horton and Reed’s modelling to the 2010 British Election Study (BES). This allowed us to make similar estimates of the impact the spending cuts will have on BES survey respondents. While we base our estimates on similar demographic groupings such as age, income and region, we were also able to provide predictions on the impact the spending cuts will have on voters compared with non-voters. The predicted cuts used in our model are in cash terms on an annual basis between 2010/11 and 2014/15, uprated to April 2010 prices.