dividend policies in an unregulated market: the london ... · pdf filedividend policies in an...
TRANSCRIPT
Electronic copy available at: http://ssrn.com/abstract=1343046
Dividend Policies in an Unregulated Market: The
London Stock Exchange 1895-1905�
Fabio Braggion and Lyndon Moorey
February 13, 2009
Abstract
In perfect and complete �nancial markets Miller and Modigliani (1961) show that
a �rm�s value is una¤ected by its dividend policy. Taxation, asymmetric information,
incomplete contracts, institutional constraints, and transaction costs make dividend
policy important. We examine the e¤ects of dividend policies on 469 British �rms
between 1895 and 1905. These �rms operated in an environment of very low taxation
and an absence of institutional constraints. We �nd strong support for asymmetric
information theories of dividend policy, and little support for agency models.
JEL Classi�cation: N23, G14, G35
Keywords: Dividend Policy, London Stock Exchange
�The authors would like to thank Franklin Allen, Yakov Amihud, Steve Bank, Federico Barbiellini, GlennBoyle, Riccardo Calcagno, Elena Carletti, Fabio Castiglionesi, David Chambers, Toby Daglish, Harry DeAn-gelo, Frank de Jong, Marc Deloof, Sonia Falconieri, Vasso Ioannidou, Julij Jegorov, Leslie Hannah, EricKemmeren, Ralph Koijen, Martin Lally, Giovanna Nicodano, Steven Ongena, Graham Partington, FabianaPeñas, Tony van Zijl, Bas Werker, and seminar participants at Auckland University of Technology, Centerfor Financial Studies - University of Frankfurt, European Central Bank, Massey University, University ofAuckland, University of Canterbury, University of New South Wales, University of Sydney, Tilburg Uni-versity, the 2009 European Winter Finance Conference (Klosters), the First Workshop in Financial History(Utrecht), Fifth Corporate Finance Day (University of Louvain), and the workshop �Financial Markets,Institutions, and Asset Prices during the First Era of Globalization� at Oxford University for commentsand suggestions. Moore acknowledges support from a Victoria University of Wellington University ResearchFund in the writing of this paper. Beryl Bao, Sebastiaan Dekker, Charlotte Greneche, Mark van der Biezen,and Jeremy Williams provided excellent research assistance.
yMoore is from Université de Montréal, Braggion is from CentER and Tilburg University.E-mail: [email protected] (Moore), [email protected] (Braggion).
1
Electronic copy available at: http://ssrn.com/abstract=1343046
The theorem of Miller and Modigliani (1961) states that, if capital markets are perfect,
a �rm�s decision of if, when, and how much of its cash should be disbursed to shareholders is
irrelevant for the �rm�s value. In practice, the assumption of capital market perfection does
not hold and dividend policy is relevant.
Modern corporate �nance has focused on tax, regulation, asymmetric information, and
behavioral explanations to examine how and why dividend payments a¤ect a �rm�s value.
Although theory has produced clear channels by which dividend policy a¤ects a �rm�s value,
in practice it is di¢ cult to disentangle the relative importance of each explanation. For in-
stance, the stock price increase after an announcement of an increased dividend is consistent
with multiple theories: that of dividend clienteles (some groups may value dividends over
capital gains), investors�reaction to the provision of new information (asymmetric informa-
tion), agency e¤ects (dividends take cash out of the hands of managers), or con�rmation
of previous earnings changes (e.g. Koch and Sun (2004)). Dhaliwal et al. (1999), Graham
and Kumar (2006), Dahlquist et al., (2007), Hotchkiss and Lawrence (2007), and Desai and
Jin (2008) show that clienteles, especially clienteles related to di¤erent tax rates, in�uence
the payout ratio of a �rm and determine the share price reactions after announcements of
dividend changes. The importance of tax e¤ects has been documented by Fama and French
(2001), Allen and Michaely (2003), and Kalay and Lemmon (2008)), who show that contem-
porary U.S. �rms often use stock repurchases as a means of returning wealth to shareholders
to avoid the higher e¤ective tax rate on dividends.
The analysis of dividend policy would be greatly simpli�ed if we could, ex-ante, rule out
some explanations for dividend policy and focus on the remainder. In the pre-World War
One London market, taxes were largely irrelevant and regulation was minimal, which allows
us to discriminate between the remaining theories of why �rms pay dividends - asymmetric
information and incomplete contracts (agency models). We compile a data set of 469 British
�rms that existed between 1895 and 1905. We document the impact of dividend announce-
ments on security prices, we calculate payout ratios of di¤erent industries, and we analyze
which types of �rms were more likely to pay dividends.
There are three elements of turn of the twentieth century U.K. �nancial markets that
2
Electronic copy available at: http://ssrn.com/abstract=1343046
make them interesting for the study of payout policy. First, pre-1907, pro�ts of incorporated
U.K. �rms were treated like personal (labor) income and taxed a rate of about 5%.1 When
dividends were paid, the �rm would deduct the relevant tax from the dividend and send it to
the government (see Arnold (1999)). Dividends and interest income were treated identically
and, unlike modern times, each investor was subject to the same tax rate thus eliminating
the existence of tax clienteles.2 There was no tax levied on capital gains in this period.3
Second, U.K. legislation permitted dividends to be used as a �exible instrument to dis-
tribute cash to shareholders. The only binding legal constraint in place was a common law
rule that prevented a company from harming creditors by paying dividends when it lacked
the �nancial means (see Che¢ ns (2006)). Therefore, the data we examine are generated in
a system very close to the textbook theoretical setting, in which �rms set their payout poli-
cies free of legislative contraints (e.g. Bhattacharya (1979), Easterbrook (1984), and Miller
and Rock (1985)). Dividends were by far the principal means of returning wealth. Stock
repurchases had been forbidden by common law, following Trevor v. Whitworth (1887), and
one-o¤ returns of capital were very infrequent, and required the sanction of a court. As
a result, our paper e¤ectively studies total payout policy rather than a speci�c component
(dividends only or share repurchases only).
The third element is the absence of regulations that constrain how investors allocate
their funds. �Prudent man�rules have been suggested as an explanation for why �rms pay
dividends. In some jurisdictions laws constrain the behavior of certain types of investors
(e.g. private trusts, bank trusts, and pension funds) to invest in �high quality� equities,
such as those that pay dividends (see Del Guercio (1996)). In response to these laws some
�rms will pay dividends to cater to such investors.
Following the literature we focus our analysis on two explanations for payout policies:
asymmetric information and agency theories. Asymmetric information theories state that
1http://www.hmrc.gov.uk/history/taxhis4.htm. The tax rate was 3 13% (8 pence in the pound) in the lateyears of the 19th century. It was raised to 5% at the start of the Boer War (1899), to 5:833% in 1900 and to6:25% in 1901. The rate was cut to 4:583% in 1902, but raised again to 5% in 1904 (see Sabine (1966) pp.129-30).
2It is possible that other types of clienteles, for instance related to behavioral factors, may have existed.3See Daunton (2001), Trusting Leviathan, for a discussion of the U.K. capital gains tax in this period.
3
dividends are a costly signal available to managers to convey information about a �rm�s future
prospects. Agency theories suggest that managers could allocate resources to activities that
bene�t themselves, at the expense of shareholders. From this perspective, dividends are an
e¤ective tool to return any excess cash to the shareholders especially in mature companies
with less investment opportunities and less need of retaining cash. Despite a large amount
of empirical research on the subject the dispute is still unresolved. Some empirical studies
�nd that signaling is the best explanation for payout policies (e.g. Yoon and Starks (1995),
Bernhein and Wantz (1995), Nissim and Ziv (2001), and Chemmanur et al. (2008)) whereas
others maintain that agency e¤ects dominate (e.g. Lang and Litzenberger (1984), Grullon
and Michaely (2004), De Angelo, De Angelo and Stultz (2006), and Michaely and Roberts
(2007)).
We �nd that dividends e¤ectively signalled private information from �rm insiders to the
market. An announcement of a dividend cut or a dividend omission was bad news for �rms
- it tended to generate a negative abnormal return of around 2.0% in the week of the an-
nouncement. The e¤ects of cuts or omissions do not markedly di¤er between �rms ranked
by either age, Tobin�s Q, or retained equity - all measures of maturity of a company. An-
nouncements of dividend increases or commencements generate positive abnormal returns
of around 1.4%. These results suggest that dividend announcements conveyed private in-
formation held by �rm insiders to shareholders, and support the asymmetric information
theory of payout policy. Consistent with Bhattacharya (1979), whose model states that the
informativeness of a dividend change is given by a �rm�s cost of external �nance, the e¤ects
of dividend changes on returns are stronger in smaller �rms that in principle should have had
a harder time to access external sources of �nance. Moreover, we �nd that a �rm�s dividend
policy conveyed information about a �rm�s future pro�tability and that dividend increases
(decreases) were associated with increases (decreases) in earnings in the next �nancial year.
Changes in dividends were stronger predictors of future earnings in companies o¢ cially listed
on the London Stock Exchange. In these companies the asymmetric information problem
between managers and shareholders was more severe (compared to unlisted/narrowly held
�rms) and thus a dividend payment was a more valuable tool to discern future performance.
4
We �nd little support for agency theories. Contrary to the predictions of agency theory,
we �nd that various measure of the maturity of a company such as age, Tobin�s Q, and the
ratio of retained earnings to total common equity did not increase the likelihood of paying a
dividend. It is unlikely that our results are driven by poor investor protection. We �nd that
�rms cared about agency problems, however they resolved them in other ways, for instance
by constraining managers�abilities to incur external debt. A further concern could be that,
due to poor quality (and perhaps malleable) accounting statements in the early twentieth
century, dividends are a useful signalling device only because they are paid with cash. While
poor quality accounts may have increased investors�reliance on dividends as a signal, the
theoretical e¤ect of dubious accounting standards is unclear. Poor quality accounts could
just as easily exacerbate agency problems, since insiders could more easily divert funds for
personal uses. We also investigate other explanations for payout policy, such as transaction
costs, but we �nd no supporting evidence.
A natural concern when investigating an historical market is how the results can be
related to today�s �nancial markets. We �nd that the payout policy of turn of the twentieth
century British �rms is in many respects remarkably similar to contemporary �rms. Firms
in our sample had similar payout ratios to contemporary U.K. �rms: about 52% of earnings
was disbursed to shareholders. Moreover, British directors used dividend policies as a �exible
tool, much like managers use share repurchases in the modern era. We �nd that �rms were
not averse to frequent changes of their dividend levels, and in particular were more than
willing to cut dividends. In fact, 42% of all dividend changes in our sample were made up
of dividend cuts. Skinner (2008) documents that U.S. companies prefer to cut the amount
of cash disbursed to shareholders via share repurchases (not via dividends). He �nds that
around 46% of all changes to share repurchase programs are cuts: a �gure very similar
to our results. Moreover, we also �nd that speed of adjustment of dividends with respect
to transitory earnings shocks in our data is very close to the speed of adjustment of total
payouts to earnings found by Leary and Michaely (2008) for the 2000s. Our results suggest
that the evolution of modern payout policy is towards the situation as it was in the U.K.
a century ago. We believe that these similarities between payout policy today (dividends
5
+ share repurchases) and a hundred years ago (dividends only) make our data particularly
relevant to understand what factors drive companies�payout policies.
In addition to providing new evidence on the dynamics of dividend payments, this paper
contributes to a growing literature that looks at past historical periods as useful enviroments
to gain a better understanding of �nancial issues (e.g. Benmelech (2009), Chambers and
Dimson (2009), Franks, Mayer, and Rossi (2009), Frydman and Saks, (2008), Moore and
Juh (2006), and Rajan and Zingales (2003)).
In Section I we review the main theories of dividend policies. In Section II we describe
the main institutional features of the London �nancial markets at the turn of the twentieth
century. In Section III we describe the data we collect on the London Stock Exchange.
We present our main results in Section IV. We examine robustness issues in Section V and
Section VI, and conclude in Section VII. and conclude in Section VI.
I Theories of Dividend Payouts
Lintner (1956) was the �rst to systematically assess the dividend policies of corporations.
His interviews with senior managers at 28 �rms document that most managers believe stock-
holders prefer a stable rate of dividends, and will place a premium on �rms that can deliver
stable dividends. He �nds behavior of dividend-smoothing by managers (Lintner (1956, p.
99)): �most managements sought to avoid making changes in their dividend rates that might
have to be reversed within a year or so.�
The information signaling models of Bhattacharya (1979), Miller and Rock (1985), and
John and Williams (1985) suggest that �rms will use dividend changes to signal the future
prospects of the �rm. Managers have more information about their �rm�s future cash �ows
than outsiders, and managers may have an incentive to signal this information to the mar-
ket. An unanticipated rise in dividends is good news for the shareholders, and should be
accompanied by a rise in the share price, whereas a fall in the dividend conveys bad news to
shareholders. For these signalling models to hold in equilibrium, dividend changes need to
be followed by earnings changes in the same direction.
6
Agency models recognize that a �rm is comprised of at least three di¤erent stakeholders:
management, shareholders, and bondholders, and the three groups�interests may diverge.
Shareholders in a struggling company may like to pay themselves such large dividends that
bondholders will miss out on their scheduled payments. Management may be tempted to use
the �rm�s resources in a way that is not in the best interests of the shareholders. Solutions to
the con�ict of interest problem that management face have been suggested by Grossman and
Hart (1980), Easterbrook (1984), and Jensen (1986). Management should be constrained in
how much readily accessible cash they have access to. The less cash available to management,
the harder it is for them to spend it in wasteful pursuits. By paying out cash as dividends it
reduces the cash at the disposal of management, and can increase the value of the �rm. One
version of the agency model, by Lang and Litzenberger (1989), is that wasteful uses of cash
are likely to be more pronounced in stable, cash-rich �rms in mature industries without many
growth opportunities. Therefore, an increase in dividends should have a greater (positive)
price impact for �rms that have few investment opportunities than for �rms that have many
investment opportunities. Taken to the extreme, if a �rm has many positive net present
value projects, then increasing the cash distributed to shareholders as dividends could even
decrease the value of the �rm.
The institutional environment of the London Stock Exchange at the turn of the twen-
tieth century rules out the existence of dividend clienteles related to taxes. The idea of
a clientele e¤ects is directly related to Miller and Modigliani (1961) who argue that �rms
have an incentive to supply stocks that minimize the taxes of each group of investors (or
clientele). As a result, investors who pay low taxes on the dividends they receive buy stocks
of companies paying high dividends and conversely investors with high dividend taxes buy
stocks of companies paying low dividends.4
Tax clienteles may generate two confounding elements when testing signaling and agency
theories. First, a share prices reaction to a dividend change could be related to both signal-
ing/agency model and to a reshu ing of tax-clienteles. By increasing its dividend payments,
4Clientele e¤ects could also arise from non-tax considerations such as informational advantages, distinctinvestment styles, or monitoring abilities. For instance, institutions may be better informed than retailinvestors and this informational advantage could manifest itself in di¤ering attitudes towards payout policy.
7
a company may attract a larger number of lightly taxed investors which will increase its
share price. Second, a dividend change may be instituted solely to please a certain in�uen-
tial clientele. As a result, the relationship between dividend changes and future cash �ows
(as predicted by the signaling theory) would be weakened. While the role and the impor-
tance of dividend (tax) clienteles is still the object of investigation (see Allen and Michaely
(2003)) several works suggest that clienteles are empirically important. Dhaliwal et al. (1999)
provide evidence that after a dividend initiation, the �rms�institutional investor clientele
changes based on their tax preferences, with a surge of ownership by tax-exempt/tax-deferred
and corporate investors. Graham and Kumar (2006) and Dahlquist et al. (2007) provide
evidence consistent with the idea that investors�tax characteristics are associated with their
portfolio holdings. Hotchkiss and Lawrence (2007) �nd that institutions persistently hold
stocks with high dividends. When a �rm announces a change in dividend policy, dividend
increases (decreases) are associated with increased (decreased) holdings by institutions that
appear to prefer dividends, based on their portfolio. They also provide evidence that such
dividend clienteles are partly related to tax considerations. Desai and Jin (2008) also �nd a
strong association between the composition of institutional shareholders and dividend pay-
ment behavior. They provide evidence that after a change in a �rm�s dividend policy, the
concentration of dividend-averse institutions in the next year changes in response, suggesting
that pre-determined changes in payout policies leads to future changes in dividend clienteles.
In our data set the tax rate on dividend payments was very low, at about 5%, and even more
importantly, all investors on the London Stock Exchange were subject to the same tax rate,
hence eliminating the existence of tax related clienteles.
Aside from tax issues, the remaining Miller and Modigliani (1961) assumptions, complete
contracting, no transaction costs, and complete markets were not satis�ed in U.K. securities
markets in the early twentieth century. However, it is arguable that violations of these
assumptions were no worse than they are today. Managers were forced to hold stock in
their own �rms, and their salary was voted on at the AGM. Although managers could be
voted out of o¢ ce, complete contracts could not be written that would have prevented the
scandals that did occur from time to time. Markets were incomplete, due to the lack of
8
complete state-contingent contracts, but nor can such contracts be written now (although
the recent development of markets for derivatives has helped). The London Stock Exchange
had low brokerage fees, due to the desire to maintain world preeminence as a �nancial
market, with thousands of competing brokers, yet transaction costs were positive, as they
are today. The �recognized�brokerage fees for equities were 14% per transaction under £ 50,
12% per transaction over £ 50 but this could be negotiated downwards for large dealings (see
The Investor�s Monthly Manual for details).
II Historical Background
Pre-1907, pro�ts of incorporated U.K. �rms were taxed at the same rate as the personal
(labour) tax rate. When dividends were paid, the �rm would deduct the relevant tax from
the dividend and send it to the government, known as taxation at the source (see Arnold
(1999)). Dividends and interest income were treated identically. The relevant tax rate in the
U.K. was around 5% during the period of our study, therefore there was little incentive for
�rms to be creative in how they returned wealth to shareholders.5 Dividends were by far the
principal means of returning wealth. Stock repurchases had been forbidden by common law,
following Trevor v. Whitworth (1887), and one-o¤ returns of capital were very infrequent,
and required the sanction of a court. There was no tax levied on capital gains in this period.
Although charities were tax exempt we do not believe they were major investors in British
�rms. The almost total irrelevance of tax complications allows us to focus on alternative
explanations of dividend policy.
In contrast to the present day, early twentieth century U.K. legislation permitted divi-
dends to be used �exibly. The only binding legal constraints in place were common law rules
that restrained a company from prejudicing creditors by paying dividends when it lacked
the �nancial resources to distribute the cash (see Che¢ ns (2006)). Although the Joint Stock
Companies Registration and Regulation Act (1844) and subsequent Companies Acts required
5The tax rate was 3 13% (8 pence in the pound) in the late years of the 19th century. It was raised to 5%at the start of the Boer War (1899), to 5:833% in 1900 and to 6:25% in 1901. The rate was cut to 4:583%in 1902, but raised again to 5% in 1904 (see Sabine (1966) pp. 129-30).
9
that �rms only paid dividends out of current or retained pro�ts: �it was not until the Com-
panies Act (1980) that a de�nition of distributable pro�ts was incorporated into legislation.
This absence appears to have signi�cantly constrained the British judiciary� (Ardern and
Aiken (2005) p. 24). Therefore, dividends a hundred years ago display the �exibility that
characterizes share repurchases today.
Another feature of our data set is the absence of regulations that constrain how investors
allocate their funds. �Prudent man�rules have been suggested as an explanation for why
�rms pay dividends. In some jurisdictions laws constrain the behavior of certain types of
investors (e.g. private trusts, bank trusts, and pension funds) to invest in �high quality�
equities, such as those that pay dividends (see Del Guercio (1996)). In response to these
laws some �rms will pay dividends to cater to such investors.
The Friendly Societies Act, 1875, Section 16, as originally proposed, forbade the invest-
ment of society funds into any security: �which has not paid (a) dividend for the last two
successive years prior to such purchase ... and the purchase of shares in any company ..., the
liability of whose members is unlimited.�However, the amended Act allowed investment of
society funds into: �any ... security expressly directed by the rules of the society.�6 Invest-
ment trusts (mutual funds) �rst appeared in the U.K. in 1868 and by January 1895 there
were 51 trust companies listed in The Investor�s Monthly Manual. We do not believe that
trusts can be considered to be dividend clienteles since the trusts were not actively man-
aged: �most of the early trusts were ��xed�in the sense that the composition of the portfolio
could be changed only in exceptional circumstances�(see Hutson (2005) p. 449). Although
towards the end of the 19th century there was more discretion shown by managers: �invest-
ment trusts in the 19th century largely comprised foreign securities� (see Hutson p. 450).
There appear to be few regulatory reasons to suspect the formation of dividend clienteles.
Our analysis exploits a distinction between companies quoted in the London o¢ cial list
and companies not quoted in the London o¢ cial list. U.K. companies that were o¢ cially
quoted on the London stock exchange during this period were widely held with a clear
6The Friendly Societies Act covered Friendly Societies, Working Men�s Clubs, Benevolent Societies, Build-ing Societies, Trade Unions, Savings Banks, and Scienti�c and Literary Societies.
10
distinction between ownership and control. Exchange regulations required that at least 2/3
of all issues of stock were o¤ered to the public (see Hannah (2007a)). This rule was intended
to provide a liquid marketplace for equities, and to restrict the formation of controlling
blocks of ownership. Franks, Mayer, and Rossi (2009) show that despite low levels of investor
protection in the U.K. in 1900, ownership was reasonably dispersed, and rapidly becoming
more so. The average number of directors necessary to control 25% of a �rm�s cash �ow
rights was 1.77 in 1900, and 2.80 in 1910, the �rst �gure is little di¤erent from the �gure of
1.67 in 2000 (see their Table 3). Although small shareholders were not explicitly protected
by law, during takeovers: �o¤ers were made without discrimination at equal prices to all
shareholders� (p. 4). Not o¢ cially listed �rms were all public, limited companies. These
�rms were more closely held, had a smaller shareholder base, and little separation between
ownership and control (Michie, 1999 p. 95).
Most of the data we use in this analysis come from the annual reports and balance
sheets of public companies. The quality of information present in published accounts, and
public statements of company o¢ cials during this time in the U.K. is arguably limited
when compared to present day standards. Arnold (1998) claims that: �during the �rst
quarter of the twentieth century, �nancial accounting practice was only lightly regulated,
published accounting statements contained relatively limited amounts of information and
informational asymmetry between senior managers and the suppliers of long-term corporate
�nance was material.�However, other authors argue that �nancial statements were generally
a reliable source. Sylla and Smith (1995) claim that Britain had the best quality accounting
information in the Western world. Similarly, Hannah (2007(b)) reports that �the great
majority of companies published more and better information that was legally required and,
in the absence of evidence to the contrary, this was treated by contemporary investors as
broadly accurate�(Hannah 2007(b) p. 658). Audited accounts were required by banks from
1879 onwards and by all �rms from 1900 onwards (see Hein (1963)). All the �rms�accounting
statements we examine have been certi�ed by auditors. Auditors were elected at the AGM (a
legal requirement from 1900 onwards). The Companies Act, 1900 required auditors to certify
that the accounts re�ected a �true and correct view of the state of the Company�s a¤airs�,
11
before this auditors would usually sign o¤ on the accounts with something similar to the
auditors of Henry Briggs, Son and Company, Ltd. (1899): �examined and found correct.�
Annual balance sheets were required to be furnished by �rms, and although usually provided,
annual pro�t and loss statements were not required by law until 1928 (see Hein (1963)).
III Data
We obtain balance sheets and, where available, pro�t and loss statements for the �rms in our
sample from the Guildhall Library in London. Accounting data for electrical, telegraph, and
telephone �rms comes from Garcke�s Manual of Electricity Undertakings. We collect weekly
data on security prices from the Stock Exchange Daily O¢ cial List (SEDOL), also available
at the Guildhall Library, between 1893 and 1907. The SEDOL contains bid and ask quotes,
transaction prices (if any), issued capital, last two dividend amounts, and the ex-dividend
day for all securities o¢ cially listed on the London Stock Exchange.7 We calculate the price
of a security as the midpoint of the bid and ask quotes.
We �nd dates of annual general meetings (AGMs) from the annual reports in the Guildhall
Library. The protocol for dividend paying British �rms at this time was that the company�s
management would propose a dividend about 2 weeks before the AGM, and the proposed
dividend would usually appear in the London daily newspaper, The Times (available elec-
tronically from The Times Digital Archive 1785-1985 ). The proposed dividend would then
be subject to approval at the AGM. Although management �proposed� the dividend, in
practice it was invariably approved by the vote at the AGM. The Times usually reported a
company�s end of year dividend amount alongside a brief summary of a company�s earnings
for the year. We understand that �rms would mail out the �nancial reports to shareholders
before the AGM at the same time as the dividend �proposal�was made, even if only the
dividend amount was reported in The Times. We therefore have a potentially confounding
e¤ect of dividend and earnings announcements that we address econometrically in Section
V.7Although we would like to collect data on the ownership structure of the �rms in our sample, most early
20th century U.K. ownership data no longer exists (see Franks, Mayer, and Rossi (2009)).
12
The Times reported on the a¤airs of many British companies that were listed on the
London Stock Exchange. We search each day�s �nancial pages between 1895 and 1905 to
�nd dividend announcements. The column �Railway and Other Companies� (changed to
�Public Companies�in 1905) contains dividend announcements and reports on the proceed-
ings of AGMs. We can not �nd all proposed dividends in The Times. Some �rms would
never be reported on by The Times, usually the smaller, infrequently traded companies, and
some companies would only sporadically report their dividends. The only exception to this
protocol was by British banks. Although most banks were easily large enough to justify the
attention of The Times, we can only �nd seven dividend announcements by banks during
this 11 year period. We therefore exclude banks from our analysis.
We �nd the dividend amounts, quoted as a percentage of paid up capital, from the original
annual reports. We cross-check these with the SEDOL, the Investors�Monthly Manual, and
(if announced) The Times. Almost all �rms paid semi-annual dividends, the major exception
was that many telegraph �rms paid quarterly dividends. We �nd that announcements of
dividend increases were most likely to appear in The Times (82% of our �rms� increases
were reported), followed by dividend decreases (68% of our �rms�decreases were reported),
and the least likely announcements to appear were dividends maintained at the same level
(60%).
We construct a value-weighted market index for London that contains 163 securities.
The market index is composed of seven banks, 33 railways, 7 breweries, 63 commercial and
industrial �rms, 19 coal and iron �rms, 12 telegraph �rms, 20 gas and electric �rms, and
two mines. By value the banks comprise around 7% of the index, railways 58%, breweries
7%, commercial and industrial �rms 8%, coal and iron �rms 4%, telegraph �rms 3%, gas
and electric �rms 5%, and mines 4%. The average value of the equities included in our
market index (where the average is calculated from 1895 through 1905 is £ 548 million. By
value this is a little over 60% of the London market, so we are con�dent our market index is
representative.8
Our sample consists of 469 �rms that were in existence part, or all, of the time between
8The value of the entire London equity market is given as £ 887 (see Dimson, Marsh, and Staunton (2002)).
13
1895 and 1905. Of these 469 �rms, 134 were o¢ cially listed on the London Stock Exchange
whereas 335 companies were traded informally on a �supplementary list�(see Franks, Mayer,
and Rossi (2009)).9 We hereafter refer to these companies as �unlisted�. Most of our analysis
concerns the subsample of listed companies, unlisted companies will provide a useful control
group.
Descriptive statistics for the companies in our data set are provided in Table I. While
the pro�tability of the two types of companies, measured as the return on equity (ROE) is
similar, companies quoted in the o¢ cial list were far larger and about twice as old (measured
from a company�s date of incorporation) as the unlisted companies. We follow De Angelo et
al. (2006) and compute the earned equity to ordinary equity ratio, measured as any earnings
not previously distributed to shareholders divided by nominal ordinary equity. We use this
measure as a proxy of the maturity of the company, with the idea that companies at a more
advanced stage of their life cycle should have accumulated a larger amount of reserves. We
�nd that o¢ cially listed companies had a substantially higher earned to contributed capital
ratio than unlisted companies.
IV Results
A Payout Ratio and Dividend Smoothing
This section describes the main characteristics of dividend policy in our sample of 134 o¢ -
cially listed �rms: we focus on payout ratios and dividend smoothing. We leave the discussion
of not o¢ cially listed �rms to Section VI. We reconstruct the dividend history of each �rm
for each year that the �rm was in existence between 1895 and 1905 and when the balance
sheet was found in the Guildhall Library. We compute the payout ratio for each company,
i, as 1T
POrd: DividendstEarningst
, for each year, t, that the company had positive earnings. We then
take an unweighted average of all �rms in the same industry. The results are presented in
9In contrast to most modern �nancial data sets we include public utilities such as electricity suppliers asno regulations determined the amount of their dividend payments.
14
Table II where we display payout ratios for the ordinary or residual equity.10 Engineering,
telegraphs, and electricity had the highest payout ratios of about 60%. Railways had the
lowest payout ratios, of 33%. The equally weighted �gure across all industries is 55%, higher
than contemporary U.S. payout �gures of around 27% (see Allen and Michaely (2003)) but
similar to the 52% reported by von Eije and Meggison (2008) for contemporary U.K. �rms.
The multiple classes of equity that companies (particularly railways) used is one explanation
for the low payout ratios that we obtain. For example, most railway companies were �nanced
with a mix of ordinary, preferred, and guaranteed stock as well as debt. The payout to all
classes of equity (i.e. including �preferred�and �guaranteed�stock) boosts the payout ratio
of railway to 90%.
If we calculate the ordinary payout ratio across all industries as
Pt
PiDividendsi;tP
t
PiEarningsi;t
, which
includes �rms with negative earnings and gives greater weight to the larger �rms, then the
payout ratio declines slightly to 49.7%. This is a lower payout ratio than for U.S. corporations
in the 1990s which was 85%, made up of 58% as dividends and 27% as repurchases (Allen &
Michaely (2003)). If we were to calculate the payout ratio on all classes of equity, not just
ordinary equity, our payout ratio would rise to 91.5%.
The 134 o¢ cially listed �rms in our sample made a total of 1512 dividend announcements.
We �nd announcements of 26 dividend omissions, 290 dividend cuts (together 20.9% of
all announcements), 766 unchanged dividends (50.7% of all announcements), 396 dividend
increases, and 34 dividend initiations (together 28.4%) (see Table III). Dividend cuts and
omissions correspond to about 46% of the total dividend changes in our sample. This is a
much higher �gure than the 18% reported by Grullon et al. (2002) for the U.S. between 1967
and 1993 and the 23% documented by Michaely and Roberts (2007) for the U.K. between
1993 and 2002. Companies were far more willing to cut dividends a hundred years ago than
they are today.
The average size of a dividend increase is about 40%, the average size of cuts is 33%.
These results stand in contrast to what is reported in more recent data. Michaely and
10The residual claimant on a company�s cash �ow was usually denoted as �ordinary�equity. However, forsome companies it was denoted �deferred�, �deferred ordinary�, and once �preferred�.
15
Roberts (2007) �nd that public companies in the U.K. make larger dividend cuts of about
51%, whereas dividend increases are of a more modest size of about 29%. Grullon et al.
(2002) �nd that U.S. increases are about 30%, whereas cuts are about 44.8%. Overall our
results show that at the turn of the twentieth century �rms were willing to cut their dividends
frequently by a smaller amount than what �rms do today. Firms in Victorian-era Britain
were willing to adjust dividends upwards and downwards frequently; they did not slowly
ratchet dividends upwards (and then cut them only in times of distress).
Despite the di¤erences in dividend policies today and a century ago, we �nd interesting
similarities between dividend policies at the turn of the twentieth century and total payout
policies (ordinary dividends plus share repurchases) in the 1990s and 2000s. Skinner (2008)
analyses share repurchases of U.S. companies between 1980 and 2005 and he �nds that
about 46% of changes in the amount of companies� share repurchases are cuts: a �gure
very similar to our �gure for dividend cuts, 42%. Our evidence is also consistent with the
evidence reported by Brav et al. (2005) about share repurchases: managers consider it a
�exible instrument that does not need to be smoothed. To further explore this result, we
run a Lintner smoothing model of dividends (Lintner (1965), Fama and Babiak (1968)). We
�nd that �rms in our sample have a dividend adjustment speed of 0.82 that is substantially
higher than the adjustment speed estimates found with contemporary data for dividends
only, e.g. 0.21 in the U.S. between 1984 and 2002 (see Brav et al. (2005)) and 0.41 in
the U.K. between 1993 and 2002 (see Michaely and Roberts (2007)). However, the mean
speed of adjustment we �nd is very close to the mean speed of adjustment of total payout
(ordinary dividends plus share repurchases) that Leary and Michaely (2008) document for
U.S. companies between 1985 and 2005, 0.78. We interpret the results presented in this
section to mean that payout policies today are increasingly similar to the payout policies
at the beginning of the twentieth century: payout ratios are similar to contemporary U.K.
�rms and dividends were a �exible instrument to distribute cash, as repurchases are today.
The similarity of total payout policy today and dividend policy (only) a century ago suggests
that managers value �exibility. Managers have developed the use of share repurchases as a
means to circumvent the taxation and �prudent man�rules that constrained their behavior
16
for much of the 20th century.
B Announcement E¤ect
We use an event study method to assess the impact of dividend announcements on returns.
For each dividend announcement we calculate the abnormal return on ordinary/residual
equity as:
rj;ann = Rj;ann � baj;ann +bbj;annRm;ann (1)
where Rj;ann is the actual return of security j and Rm;ann is the actual return on the market.
We estimate aj;ann and bj;ann with the market model using weekly data from 18 months before
to 6 months after the dividend announcement, excluding the week preceding and following
the announcement:11
Rj;ann = aj;ann + bj;annRm;ann + ej;ann: (2)
We use our weekly London index to calculate the market return around each announcement
date, Rm;ann.
We average the abnormal returns over all N securities (that �t certain criteria and) and
that are t weeks from a dividend announcement date, ann:
AARt =1
N
NXi=1
ri;ann+t: (3)
We cumulate the average abnormal returns (AAR) from one week before to one week after
the dividend announcement to calculate the cumulative average abnormal return (CAAR).
We are forced to restrict our sample to the 134 companies that were o¢ cially listed on
the London Stock Exchange (and therefore appear in the SEDOL) and between January
1895 and December 1905 had at least one dividend announcement that we can identify as an
increase, commencement, reduction, omission or continuation at the same rate. We observe
the prices and dividends of these companies from January 1893 through December 1907.
11We try both shorter and longer estimation windows. Our results are not a¤ected by the choice of theestimation window.
17
Companies almost always paid two dividends per year, an interim dividend paid partway
through the company�s bookkeeping year, and a �nal dividend paid after the bookkeeping
year was complete. A handful of �rms paid annual dividends or quarterly dividends. The
interim dividend was usually kept constant from year to year, when a company decided to cut
or increase the dividend it would usually change the �nal dividend. We classify a dividend
announcement as an increase (decrease) if the announced dividend less the dividend paid 12
months prior to the announcement is positive (negative).
We present the CAAR results in Table III. Announcements of dividend increases or
commencements are associated with positive CAARs of 1.4% (the average size of a dividend
increase is 40%), signi�cant at the 1% level. Announcements of commencements or increases
of more than 10% are associated with positive CAARs of 1.7%, signi�cant at the 1% level.
The reaction to dividend increases we �nd is similar to what is observed with modern data.
Grullon et al (2002) �nd an average +1.3% abnormal return for an average dividend increase
of 30%.
Announcements of dividend decreases or omissions are associated with negative CAARs
of 2.0% (the average size of a dividend decrease is -33%), whereas omissions or decreases
of more than 10% are associated with CAARs of 2.4%, both of which are signi�cant at
the 1% level. The market did not have an excessively negative reaction to dividend cuts.
The -2.0% we obtain is substantially smaller than the -3.7% found by Grullon et al. (2002)
for an average dividend decrease of 45%. These results we obtain for share price reactions
to dividend announcements are consistent with an asymmetric information story, whereby
dividend announcements are conveying information about future earnings to shareholders.
Announcement of dividend increases are followed by positive abnormal returns, announce-
ments of dividend cuts are followed by negative abnormal returns.
According to Lang and Litzenberger (1989), if agency considerations are important, div-
idend announcements will di¤erentially a¤ect di¤erent types of �rms. We split �rms along
three dimensions: Tobin�s Q, earned to total equity, and age. We calculate the CAAR for
each subset of �rms in Table IV. Firms with a value of Tobin�s Q less than one (those with
fewer pro�table uses for retained earnings) experience a greater drop in share prices (more
18
negative CAAR) when announcements of dividend cuts are made than �rms with Tobin�s Q
greater than or equal to one, although the di¤erence in e¤ects is not statistically signi�cant.
We interpret this as weak evidence of agency e¤ects. There is almost no di¤erence in e¤ects
for announcements of dividend increases. Firms with a lower earned to ordinary equity ratio
are a¤ected more by announcements of dividend increases or decreases, but again the e¤ect is
not statistically signi�cant. Younger �rms are a¤ected more by announcements of dividend
increases or decreases, again not statistically signi�cant (except for dividend increases at the
10% level). If agency e¤ects were important we would expect older �rms to be punished
more in the stock market for cutting dividends, and rewarded more for increasing them - we
�nd the reverse. We do not �nd any serious support for agency theories from examining the
e¤ect of dividend announcements on security returns.
We next regress individual cumulative abnormal returns (CARs) for each �rm-announcement
on �rm characteristics:
CARi;t = 0 + 1�ROEi;tPi;t�1
+ 2�DIVi;tPi;t�1
+ 3SPREADi;t�1 + 4SIZEi;t (4)
+ 5DividendY ieldi;t + 6Controlsi + ei;t:
ROE is a �rm�s total earnings before depreciation divided by total equity; DIV is a �rm�s
dividend paid, Pt�1 is the market price of ordinary equity the day before the dividend
announcement SPREAD is the average bid ask spread in the year before the announcement,
and SIZE is the natural logarithm of a �rm�s assets.12 We use age, the earned to total equity
ratio, Tobin�s Q, and following Yoon and Starks (1995), the dividend yield and �rm size as
controls. The dividend yield gives us an extra check on the existence of dividend clienteles.
We report the results of the regression in Table V. To control for contemporaneous earnings
announcements we include changes in pro�tability, scaled by price, in addition to current
12Following Lasfer (1995) we compute the bid ask spread for �rm i as:
Aski �Bidi�Aski+Bidi
2
�where Ask and Bid are respectively the ask and bid price of company i0s ordinary shares. We calculate
the average bid-ask spread in the calendar year before the announcement. The results are not sensitive tothe time frame over which we calculate the average spread.
19
dividends changes, scaled by price.
We �nd that announcements of increased dividends and increased earnings have separate
and positive e¤ects on a �rm�s cumulative abnormal return. The magnitude of the e¤ect of
dividend changes on abnormal returns is important: a one standard deviation increase in
�DIVi;tPi;t�1
leads to a 1 percentage point CAR increase (Table V, columns 1-7). The positive and
independent e¤ect of dividend changes on abnormal returns is consistent with the dividend
signaling hypothesis. Moreover, we �nd that the share price response to dividend changes is
stronger for smaller companies. The variable size has a negative and statistically signi�cant
coe¢ cient in 3 out of 4 speci�cations. In addition, its economic impact is important: a one
standard deviation increase in a �rm�s size leads to a reduction of 0.7 percentage points in
the CAR (Table V, columns 4-6). To the extent that smaller companies face higher costs
of external �nance, this result is consistent with Bhattacharya�s (1979) dividend signaling
model where the degree of informativeness of the dividend signal depends positively on the
�rm�s cost of external �nance.
We do not �nd that any of the controls are statistically signi�cant. The variable SPREAD,
a proxy for transaction costs, has a negative coe¢ cient and it is never statistically signi�-
cant. This evidence does not support a transaction costs explanation for dividend payments.
Moreover, contrary to the predictions of the agency hypothesis, measures of maturity of the
company are not statistically signi�cant. The results show that dividend changes produce a
sizable reaction in stock prices, beyond the e¤ects of the information contained in earnings
changes. This test also supports the notion that taxes are not of �rst order importance to
determine the information content of dividends.
C Dividend Changes and Future Pro�tability
Following the methods of Bernartzi et al. (1997), Nissim and Ziv (2001), Grullon et al.
(2005) and Michaely and Roberts (2007), we assess whether investors reacted rationally to
announcements of dividend increases (decreases) by driving share prices higher (lower). In
particular we test whether future earnings changes could have been predicted from changes
20
in dividends, which would lend additional support to the dividend signaling hypothesis. We
run the following partial adjustment model:
(ROEi;t+n �ROEi;t) = 0 + 1(DNCi;t �����DIVi;t �DIVi;t�1DIVi;t�1
����) (5)
+ 2(DPCi;t �����DIVi;t �DIVi;t�1DIVi;t�1
����) + Controlsi;t + ei;t:both in its linear (e.g. Nissim and Ziv (2001)) and non-linear version (e.g. Grullon et al.
(2005)). DNC is a dummy variable that takes on the value 1 if the �rm has cut the dividend
from period t� 1 to period t, and 0 otherwise. DPC is a dummy variable that takes on the
value 1 if the �rm has increased the dividend from period t� 1 to period t, and 0 otherwise.
We include controls for past levels and changes of ROE. In particular, ROE could be a
mean reverting process in which case high (low) past levels of ROE should be associated
with decreases (increases) in current and future earnings (see Nissim and Ziv (2001)). In
the non-linear version we also include squared adjustment terms for earnings, to capture the
non-linearities of earnings reversions that Grullon et al. (2005) and Fama and French (2000)
emphasize as crucial. We test if contemporaneous dividend changes can predict earnings
changes one year (n = 1) or two years (n = 2) in the future. We follow the approach
described in Petersen (2009) and cluster the standard errors by �rm. We report the results
in Table VI.
We �nd that we can achieve predictive power by using negative and positive dividend
announcements to forecast earnings one year ahead. Dividend cuts are associated with de-
creases in earnings in the following year, statistically signi�cant at the 10% level. Dividend
increases are associated with increases in earnings the following year, statistically signi�cant
at the 5% level.13 Past ROE has a negative coe¢ cient, which gives support to the notion that
earnings were mean reverting. The coe¢ cients on the change in earnings is also negative,
which provides further support for mean reversion - �rms that experienced an increase (de-
crease) in earnings in one year are more likely to experience a decrease (increase) in earnings
in the current year. We �nd little evidence that dividends or earnings can predict changes in
13The results are similar, albeit slightly weaker, if we exclude outlying observations using Cook�s D criterionand the method of Hadi.
21
earnings two years or more (unreported) in the future. These results strengthen our conclu-
sion that asymmetric information is playing the major role in explaining the dividend policy
of �rms. Firms that announce a dividend increase (decrease) experience positive (negative)
cumulative abnormal returns, and the increases (decreases) of dividends are associated with
higher (lower) earnings one year in the future.
We also investigate Nissim and Ziv�s (2001) idea that dividend changes can predict earn-
ings levels (rather than changes in earnings) using the procedure of Grullon et al (2005). We
�nd that dividend decreases are associated with a lower ROE one year ahead, statistically
signi�cant at the 5% level in both a linear and non-linear model. We do not �nd a robust
correlation between dividend increases and the level of earnings one year in the future. In
addition we do not �nd any evidence that earnings levels two or more years in the future
can be predicted by dividend changes.14
Overall, the evidence we present suggests that dividend changes are correlated with future
earnings changes. These results stand in contrast to the literature on contemporary U.S. �rms
that documents that dividend changes are correlated with past earnings rather than future
prospects (see Bernantzi et al. (1997) and Koch and Sun (2004)). In our data the correlation
between present dividend changes and past earnings changes is close to zero. Moreover, we
�nd no evidence indicating that changes in dividend policies alter investors�assessment on
the permanence of past earnings changes as in Koch and Sun (2004).15
14We also assess whether our inclusion of dividends in (5) increases the model�s predictive power. As inGrullon et al. (2005) (pages 1675-76) we follow the technique of Giacomini and White (2006). The techniqueconsists of forecasting ROE one or two years ahead using only the the information available at that time(ie. no �look ahead�bias). ROE is forecast using (5) both with, and without, the dividend variables. Theforecast error of each earnings level n years ahead, fn, is calculated as ROEt+n � \ROEt+n. Di¤erences insquared and absolute errors are calculated as:
dSE = f2DIV � f2NODIVdAD = jfDIV j � jfNODIV j :
We construct mean squared errors (MSE) and mean absolute deviations and we bootstrap their associatedstandard errors. In contrast to Grullon et al. we �nd that forecasting models that include dividendsoutperform models that exclude dividends one and two years ahead. Dividends were useful information forturn of the century investors to forecast a company�s future earnings.15Following the method proposed by Koch and Sun (2004) we check if the share price reaction surrounding
dividend changes positively depends on past earnings changes. If managers are reluctant to increase dividendsunless earnings increases are persistent, an observed increase in dividend payments should reassure investorsthat past earnings increases are permanent. As a result, abnormal returns around an announcement day
22
The absence of taxes and tax clienteles could provide an explanation for this result.
Contemporary companies may change their dividends to please their tax clienteles, rather
than signalling future earnings to investors. Dividends changes undertaken to satisfy a
certain clientele are not necessarily related to �rms�future economic prospects (see Hotchkiss
and Lawrence (2007) and Desai and Jin (2008)). The existence of clienteles today may have
weakened the relationship between present dividend changes and a �rm�s future earnings.
These �ndings are also related to managerial inhibition to change the dividend rate, both
up and down, in response to economic shocks that we documented in a previous section.
Theory suggests that smoothing is a tool in the hands of managers to conceal a �rm�s
information from shareholders (see Kumar (1988) and Guttman el al. (2007)). In other
words, managers who are more willing to adjust dividend payments up and down are also
more willing to signal to their shareholders valuable information about the future prospects
of the �rm. The results we present are consistent with this picture: managers in our sample
smooth dividends far less than contemporary managers smooth dividend payments, therefore
dividends served as a signaling device to investors.
D To pay or not to pay
We next investigate the characteristics of companies that paid dividends. If agency explana-
tions of dividends are relevant, shareholders of mature companies should exert pressure on
management to pay dividends (to keep the cash from potentially being wasted). In partic-
ular, older companies, companies with higher earned to total equity, and companies with a
lower Tobin�s Q should have been more likely to pay a dividend and should have had higher
payout ratios. Fama and French (2001) document that in the U.S. during the period 1963-98
the �rms that paid dividends were, on average, more pro�table, had fewer investment oppor-
tunities (a lower market to book value, ie. Tobin�s Q), and were larger than non-dividend
payers. DeAngelo et al. (2006) �nd that, in addition to the variables identi�ed by Fama
and French, life cycle considerations are important. Firms that have a high ratio of earned
should depend on the �rms� past earnings changes. We �nd no evidence that abnormal returns aroundannouncements of dividend changes are related to past earnings changes. Results are available upon request.
23
equity to total equity are likely to be those in the mature stage of their life cycle, and are
much more likely to distribute earnings as dividends.
We run a logit regression with a dummy variable equal to one if the company paid a
dividend that year and equal to zero otherwise as the dependent variable:
Payi;t = �1ROEi;t + �2ROEi;t�1 + �3SIZEi;t + �4AGEi;t + �5ETOTi;t + �6OTOTi;t(6)
+�7CASHi;t + �8Qi;t + �9EASSi;t + �7PREVi;t + Controls+ ei;t
ROE is the return on equity, SIZE is the natural logarithm of a company�s total assets,
AGE is the number of years since incorporation, ETOT is any earnings not previously
distributed as dividends to shareholders divided by nominal ordinary equity, CASH is cash
divided by assets, OTOT is nominal ordinary equity divided by total assets, Q is the book
value of debt plus the book value of preferred equity plus the market value of common equity
divided by the book value of total assets, EASS is any earnings not previously distributed
to shareholders divided by total assets, and PREV is a dummy variable that equals one if
the company did not pay an ordinary dividend in the previous year, and zero otherwise. We
also include year and industry dummies. We present our results in Table VII.
We �nd that the most important determinants of the propensity to pay a dividend are
contemporaneous pro�tability and immediate past pro�tability. The coe¢ cient on ROE
is positive and statistically signi�cant at the 5% level in speci�cations 1 through 5. The
economic signi�cance is large: a textile company of average size that increases its ROE from
the �rst to the third quantile would increase its probability of paying a dividend from 76%
to 93% (Table VII, column 4), consistent with the idea that dividends are tightly related to
earnings. We do not �nd a clear relation between either age or size and the probability a
�rm pays a dividend.
Consistent with DeAngelo et al. (2006), we �nd that a higher ratio of earned to total
equity is associated with a higher probability of paying dividends (although this is not
statistically signi�cant). The result holds if we substitute earned equity to total assets in
place of earned to contributed capital (column 3). There does not appear to be an e¤ect of
24
cash to assets on the likelihood to pay a dividend.
We �nd that a �rm with a higher Tobin�s Q is associated with a higher probability
of being a dividend payer, similar to what Denis and Osobov (2008) �nd for France and
Germany in the 1990s and 2000s. Firms that paid a dividend last year are more likely to be
pro�table �rms (ie. higher ROE). When we add a dummy variable for a previous dividend
payer (columns 6 and 7 of Table VII) the estimated coe¢ cient and t-stats of ROE move
towards zero.
We then run Tobit models of a company�s payout ratio on various explanatory variables.
We present our results in Table VIII. Pro�tability, in particular the previous year�s ROE
is a major determinant of companies�ordinary payout levels. An increase of one standard
deviation in the previous year�s ROE leads to an 11 percentage point increase in the ordinary
equity payout ratio (Table VIII, columns 2-5). Tobin�s Q has a positive and statistically
signi�cant e¤ect. However, its economic signi�cance is not large: a one standard deviation
increase of Tobin�s Q leads to an increase in the ordinary payout ratio of 2 percentage point
(Table VIII, column 7). The coe¢ cients associated with the other measures of maturity,
AGE and ETOT , are positive and often statistically signi�cant. The economic signi�cance
of these measures is moderate. A one standard deviation increase in ETOT is associated
with an increase of about 6 percentage points in the ordinary payout ratio (Table VIII,
column 2). Similarly, a one standard deviation increase in AGE (17 years) is associated
with an increase in the ordinary payout ratio of about 4 percentage points (Table VIII,
columns 4-7). Although we �nd some evidence that measures of a company�s maturity are
relevant, pro�tability has a larger impact on the payout ratio. Agency explanations do not
seem to have been an important driver of dividend policies.
Although we do not formally treat the maturity hypothesis as put forward by Grullon
et al. (2002), we �nd no support for it. Under their theory, dividend increases generate
a positive price reaction because they tell investors that a �rm is becoming mature and it
will have lower risk in the future. The evidence we present in this paper is not consistent
with the maturity hypothesis. An implication of the maturity hypothesis is that positive
dividend changes are predictors of negative future earnings changes: we �nd the opposite
25
(see Table VI). Moreover, in this section we show that more mature companies did not pay
larger dividends: evidence inconsistent with the idea that companies use dividends to signal
their maturity.
V Resolving the Agency Problem
Although we do not �nd evidence that more mature companies paid higher dividends, one
potential method to alleviate agency problems, we �nd evidence of alternative strategies.
More mature companies restricted their manager�s borrowing powers, and dealt with more
banks (potential monitors) than did less mature companies.
We collect information from the Stock Exchange O¢ cial Intelligence in 1896, 1897, 1901,
and 1902 on the companies in our sample. We �nd that a one standard deviation increase in
ETOT reduces managers�discretionary borrowing power, measured as loans permitted by
the articles of association without a vote at the AGM divided by nominal ordinary equity,
by about 20%. We �nd this variable is statistically signi�cant at the 5% level in a simple
regression.
We also examine the existence of multiple bank relationships for our �rms. A �rm that
has an association with more than one bank is more likely to be monitored closely, and has at
least partially solved its agency problems. We run a logit model with the dependent variable
equal to one if a �rm a more than one bank relationship and zero otherwise. If we consider
a �rm that moves from the �rst to the third quintile of ETOT we �nd the probability of
having multiple bank relationships increases from 27% to 37%.16
We believe that shareholders alleviated the inherent agency problem they faced by cur-
tailing managers�borrowing powers and using multiple banks to monitor their managers
16We think it is unlikely that this result is driven by �rms�desires to resolve a hold up problem as inSharpe (1990). The Sharpe model predicts that asymmetric information problems between borrowers and asingle lender are resolved over time in a relationship that creates an informational advantage for the lender.Such an informational advantage can be exploited to extract rents. As a result, young and less well-known�rms may engage multiple banks to avoid later hold-ups. Our results suggest that more mature and betterknown companies, in principle �rms that should su¤er fewer hold up problems, were more likely to displaymultiple bank relationships.
26
rather than by paying out higher dividends.
VI O¢ cially Listed and Unlisted Companies
We examine the behavior of the 335 unlisted �rms. These are all �rms for which we observe
accounting data, but not market values of equity (since they do not appear in the SEDOL).
These �rms were all public, limited companies; our data set does not contain any private,
family-held �rms. Unlisted �rms were more closely held, they displayed a smaller shareholder
base, and little separation between ownership and control (Michie, 1999 p. 95). Therefore
unlisted �rms were similar to the wholly owned private companies analyzed by Michaely
and Roberts (2007). In these companies asymmetric and agency issues should be a less
serious problem, compared to public companies, as managers usually held large amounts of
equity mitigating a divergence of interests between insiders and outsiders. As a result, if
agency issues are the main driver of dividend policies, we should expect the payout ratios of
unlisted companies to be lower than those of the listed �rms (there being less need to pay
large amount of cash to shareholders) and mature companies should not have a stronger need
to pay out cash to reassure their investors. If asymmetric information issues were important,
we should expect dividend changes made by unlisted companies to be less related to future
earnings changes, since insiders (management) and outsiders (shareholders) overlapped to a
greater extent. In e¤ect the market would have impounded the e¤ect of �private�information
held by managers before the o¢ cial announcement.
In Table IX we present the results on dividend payout ratios for not o¢ cially listed
companies. 52% of earnings were paid o¤ as ordinary dividends when we equally weight
each company; 56% we sum all dividends and divided them by all earnings (considering also
companies that are running losses). The payout ratios are similar to those of the o¢ cially
listed companies. This evidence does not support an agency explanation of dividends, which
would predict that o¢ cially listed companies (ie. companies where the agency problem
between shareholders and management is more severe), should pay out a larger proportion
of their earnings to reassure their investors. We also do not �nd much di¤erence in the
27
dividend smoothing behavior of unlisted �rms when compared to listed companies. We run
the Lintner model to estimate the speed of adjustment parameter of dividends and we �nd
an estimated of 0.82 very close to the number found for o¢ cially listed companies (0.81) and
close to Michaely and Roberts�(2007) estimate of 0.89 for wholly owned private �rms.
Consistent with asymmetric information theories we �nd that dividend payments in un-
listed �rms were a less powerful predictor of future cash �ows compared to public companies,
perhaps due to a blurring of the distinction between management and shareholders in these
closely held companies. Table X examines the e¤ect of dividend changes on future earnings
changes. We �nd that announcements of dividend decreases are useful to predict negative
changes in earnings in the following year (columns 1 and 2).17 Announcements of dividend
increases are not robustly associated with increased earnings in the following year. We �nd
that dividend announcements have little information content for earnings two (columns 3
and 4) or more (unreported) years in the future. The control variables indicate that earnings
of unlisted �rms are mean reverting, as they are for listed �rms. We �nd little evidence of
di¤erences between listed and unlisted �rms, asymmetric information problems appear to
have existed in both classes of �rms. Dividend announcements were a way of conveying
private information from managers to shareholders.
We study the determinants of the payout ratios of unlisted �rms in Table XI. We �nd
that unlisted �rms with higher pro�ts, higher earned equity, more cash, were more likely to
pay out more of their pro�ts as dividends in a year. In addition, �rms that did not pay a
dividend in the previous year were likely to have had a lower payout ratio, all else equal.
We test if there are statistically signi�cant di¤erences between the coe¢ cient estimates of
listed and unlisted companies. The coe¢ cients on past ROE are bigger for listed �rms
and the di¤erence with unlisted �rms is statistically signi�cant. However, the economic
importance of this di¤erence is small: a one standard deviation increase in past ROE for
listed companies leads to an 11 percentage point increase in the ordinary payout ratio (Table
XI, columns 2-5). Cash appears to be a more important determinant of the payout level
for unlisted �rms than for listed �rms (Table XI, columns 2-5). The coe¢ cient on ETOT
17The results are weaker if we exclude outliers.
28
is not statistically di¤erent from the coe¢ cient found for listed �rms. This evidence works
again agency theories of dividends: managers of listed companies should have been more
careful than managers of unlisted companies to disburse any excess cash to shareholders if
they wished to show investors that resources were not being wasted.
In conclusion, we �nd few di¤erences in the payout policy between �rms o¢ cially listed
on the London Stock Exchange and those �rms not o¢ cially listed there. Information asym-
metry issues were important for both types of �rms, albeit less important for unlisted �rms,
and agency issues appear to be of minor importance.
VII Conclusion
We examine the dividend policy of �rms in the unregulated, very low tax regime of turn
of the 20th century Britain. In this environment we examine the importance of taxes for
signaling and agency based models of dividend policy. We �nd strong support for signaling
(asymmetric information) theories of dividend policy, and little support for agency models.
Dividend cuts appear to convey bad news to shareholders, and �rms that announced div-
idend cuts or omissions su¤ered an abnormal return of around -2.0%. Firms that announced
dividend raises or commencements achieved an abnormal return of around 1.4% around the
time of the announcement. There do not appear to have been di¤erences between classes of
�rms (grouped by age, earned to total equity, or Tobin�s Q) in their responses to dividend
announcements. In addition we �nd that changes in dividends were associated with changes
in earnings in the same direction one year out. Changes in dividends did not appear to signal
earnings changes two or more years in the future.
In addition we �nd that �rms paid out around 50% of current earnings as ordinary
dividends, a similar �gure to contemporary U.K. �rms. An important di¤erence is that
younger U.K. �rms were almost as likely to pay dividends as older �rms. More pro�table
�rms were more likely to pay a dividend and �rms smoothed their dividends, although by
less than modern �rms smooth their dividends.
We �nd that dividends a century ago are similar to share repurchases today. Neither are
29

smoothed heavily, and both convey information from management to shareholders. Share
repurchases appear to provide the necessary �exibility to today�s managers to allow them to
vary their payout policy as much as company directors varied dividends in turn of the 20th
century Britain.
30
References
Allen, Franklin, Antonio Bernardo and Ivo Welch, 2000, A Theory of Dividends based on
Tax Clienteles, Journal of Finance, 55(6), 2499-2536.
Allen, Franklin, and Roni Michaely, 2003, Payout Policy, Handbook of Economics of Finance,
George M. Costantinides, Milton Harris, and René Stulz eds., Amsterdam: North Holland,
337-430.
Ardern, Dean, and Maxwell Aiken, 2005, An Accounting History of Capital Maintenance:
Legal Precedents for Managerial Autonomy in the United Kingdom, Accounting Historians
Journal, 32(1), 23-60.
Arnold, Antony, 1998, U.K. Accounting Disclosure Practices and Information Asymmetry
during the First Quarter of the Twentieth Century: The E¤ect of Book Returns and
Dividend Cover, Journal of Business Finance and Accounting, 25 (7) and (8), 775-794.
Arnold, Antony, 1999, Pro�tability and capital accumulation in British industry during the
transwar period, 1913-1924, Economic History Review, 52(1), 45-68.
Benmelech, Efraim, 2009, Asset Salability and Debt Maturity: Evidence from 19th Century
American Railroads, Review of Financial Studies, forthcoming.
Bernartzi, Shlomo, Roni Michaely and Richard Thaler, 1997, Do Changes in Dividends Signal
the Future or the Past? Journal of Finance, 52(3), 1007-1034.
Bernheim, Douglas, 1991, Tax Policy and the Dividend Puzzle, Rand Journal of Economics,
22, 455-476.
Bhattacharya, Sudipto, 1979, Imperfect Information, Dividend Policy and the �Bird in the
Hand�Fallacy, Bell Journal of Economics, 10(1), 259-270.
Brav, Alon, John Graham, Campbell Harvey and Roni Michaely, 2005, Dividend Policy in
the 21st Century, Journal of Financial Economics, 77(3), 483-527.
31
Chambers, David and Elory Dimson, 2009, IPO Underpricing Over the Very Long Run,
Journal of Finance, forthcoming.
Che¢ ns, Brian, 2006, Dividends as Substitute of Corporate Law: The Separation of Own-
ership and Control in the United Kingdom, European Corporate Governance Institute
Working Paper 69.
Chemmanur, Thomas, Yingmei Cheng and Tanming Zhang, 2008, Why do Firms Undertake
Accelerated Share Repurchase Programs?, Working Paper, Boston College and Florida
State University.
Chetty, Raj and Emmanuel Saez, 2005, Dividend Taxes and Corporate Behaviour: Evidence
from the 2003 Dividend Tax Cut, The Quarterly Journal of Economics, 120(3), 791-833.
Dahlquist, Magnus, Göran Robertsson, and Kristian Rydqvist, 2007, Direct Evidence of
Dividend Tax Clienteles, Swedish Institute for Financial Research.
Daunton, Martin, 2001, Trusting Leviathan: The Politics of Taxation in Britain, 1799-1914,
Cambridge University Press, Cambridge.
DeAngelo, Harry, Linda DeAngelo, and René Stulz, 2006, Dividend Policy and the
Earned/Contributed Capital Mix: A Test of the Lifecycle Theory, Journal of Financial
Economics, 81, 227-254.
Del Guercio, Diane, 1996, The Distorting E¤ects of the Prudent-Man laws on Institutional
Equity Investments, Journal of Financial Economics, 40, 31-62.
Denis, David and Igor Osobov, 2008, Why do Firms Pay Dividends? International Evidence
on the Determinants of Dividend Policy, Journal of Financial Economics, 89(1), 62-82.
Desai, Mihir and Li Jin, 2008, Institutional Tax Clienteles and Payout Policy, Mimeo, Har-
vard Business School.
Dhaliwal, Dan, Merle Erickson, and Robert Trezevant, 1999, A test of the theory of tax
clienteles for dividend policies, National Tax Journal, 52 (1), 179�194.
32
Dimson, Elroy, Paul Marsh, and Mike Staunton, 2002, Triumph of the Optimists: 101 Years
of Global Investment Returns, Princeton University Press, Princeton.
Easterbrook, Frank, 1984, Two Agency-Cost Explanations of Dividends, American Economic
Review, 74(4), 650-659.
Eije, Henk von and William Meggison, 2008, Dividends and Share Repurchases in the Eu-
ropean Union, Journal of Financial Economics, 89(2), 347-374.
Fama, Eugene, and Harvey Babiak, 1968, Dividend Policy: An Empirical Analysis, Journal
of the American Statistical Association, 63(324), 1132-1161.
Fama, Eugene, and Kenneth French, 2000, Forecasting pro�tability and earnings, Journal of
Business, 73(2), 161-75.
Fama, Eugene, and Kenneth French, 2001, Disppearing Dividends: Changing �rm charac-
teristics or lower propensity to pay?, Journal of Financial Economics, 60(1), 3-43.
Franks, Julian, Colin Mayer, and Stefano Rossi, 2009, Ownership: Evolution and Regulation,
Review of Financial Studies, forthcoming.
Frydman, Carola and Raven Saks, 2008, Executive Compensation: A New View from a
Long-Run Perspective, 1936-2005, Working Paper, MIT-Sloan School of Management.
Giacomini, Ra¤aella and Halbert White, 2006, Tests of Conditional Predictive Ability,
Econometrica, 74(6), 1545-1578.
Graham, John, and Alok Kumar, 2006, Do Dividend Clienteles Exist? Evidence on Dividend
Preferences of Retail Investors, Journal of Finance, 61 (3), 1305-1336.
Grossman, Sanford, and Oliver Hart, 1980, Takeover bids, the Free-rider problem, and the
Theory of the Corporation, The Bell Journal of Economics, 11(1), 42-64.
Grullon, Gustavo and Roni Michaely, 2004, The Information Content of Share Repurchase
Programs, Journal of Finance, 59(2), 651-680
33
Grullon, Gustavo, Roni Michaely, Shlomo Bernartzi, and Richard Thaler, 2005, Dividend
Changes Do Not Signal Changes in Future Pro�tability, Journal of Business, 78(5), 1659-
1682.
Grullon, Gustavo, Roni Michaely, and Bhaskaran Swaminathan, 2002, Are Dividend Changes
a sign of Firm Maturity?, Journal of Business, 75(3), 387-424.
Guttman, Ilan, Ohad Kadan, and Eugene Kandel, 2007, A Theory of Dividend Smooth-
ing,Working Paper, Stanford University.
Hannah, Leslie, 2007(a), Global Equity Markets in 1900: Why were East Asia and the USA
so far behind Africa, Australia, and Europe, and did it matter?, Unpublished Manuscript.
Hannah, Leslie, 2007(b), Pioneering Modern Corporate Governance: a view from London in
1900, Enterprise and Society, 8, 642-686.
Hein, Leonard, 1963, The Auditor and the British Companies Acts, The Accounting Review,
38(3), 508-20.
Hotchkiss, Edith and Stephen Lawrence, 2007, Empirical Evidence on the Existence of Div-
idend Clienteles, Mimeo, Boston College.
Hutson, Elaine, 2005, The early managed fund industry: Investment trusts in 19th century
Britain, International Review of Financial Analysis, 14, 439-454.
The Investor�s Monthly Manual, various issues.
Jensen, Michael, 1986, Agency Costs of Free Cash Flows, Corporate Finance, and Takeovers,
American Economic Review, 76(2), 323-329.
John, Kose and Joseph Williams, 1985, Dividends, Dilution and Taxes: A Signaling Equi-
librium, Journal of Finance, 40(4), 1053-1070.
Kalay, Avner and Michael Lemmon, 2008, Payout Policy, Handbook of Corporate Finance:
Empirical Corporate Finance, B. Espen Eckbo ed., Volume 2 (Elsevier/North-Holland).
34
Koch, Adam, and Amy Sun, 2004, Dividend Changes and the Persistence of past Earnings
Changes, Journal of Finance, 59(5), 2093-2116.
Kumar, Praveen, 1988, Shareholder-Manager Con�ict and the Information Content of Divi-
dends, Review of Financial Studies, 1(2), 111-136
Lang, Larry and Robert Litzenberger, 1989, Dividend Announcements: Cash Flow Signaling
vs. Free Cash Flow Hypothesis?, Journal of Financial Economics, 24(1), 181-191.
Lasfer, M. Ameziane, 1995, Ex-Day Behavior: Tax or Short-Term Trading E¤ects, Journal
of Finance, 50(3), 875-897
Leary, Mark, and Roni Michaely, 2008, Why Firms Smooth Dividends: Empirical Evidence,
Johnson School Research Paper Series No. 11-08.
Lintner, John, 1956, Distribution of Incomes of Corporations among Dividends, Retained
Earnings, and Taxes, The American Economic Review, 46(2), 97-113.
Michaely, Roni and Michael Roberts, 2007, Corporate Dividend Policies: Lessons from Pri-
vate Firms, Working Paper, Cornell University.
Michie, Ranald, 1999, The London Stock Exchange: A History Oxford University Press,
Oxford and New York.
Miller, Merton and Franco Modigliani, 1961, Dividend Policy, Growth and the Valuation of
Shares, Journal of Business, 34, 411-433.
Miller, Merton and Kevin Rock, 1985, Dividend Policy Under Asymmetric Information,
Journal of Finance, 40(4), 1031-1051.
Moore, Lyndon and Steve Juh, 2006, Derivative Pricing 60 Years before Black-Scholes: Ev-
idence from the Johannesburg Stock Exchange, Journal of Finance, 61(6), 3069 - 3098.
Nissim, Dorom and Amir Ziv, 2001, Dividend Changes and Future Pro�tability, Journal of
Finance, 56(6), 2111-2133.
35
Petersen, Mitchell, 2009, Estimating Standard Errors in Finance Panel Data Sets: Compar-
ing Approaches, Review of Financial Studies, 22(1), 435-480.
Rajan, Raghuram, and Luigi Zingales, 2003, The Great Reversals: The Politics of Financial
Development in the 20th Century, Journal of Financial Economics, 69(1), 5-50.
Sabine, Basil, 1966, A History of Income Tax, George Allen and Unwin, London.
Sharpe, Steven, 1990, Asymmetric Information, Bank Lending and Implicit Contracts: A
Stylized Model of Customer Relationships, Journal of Finance, 45(4), 1069-1087.
Skinner, Douglas, 2008, The evolving relation between Earnings, Dividends, and Stock Re-
purchases, Journal of Financial Economics, 87, 582-609.
Sylla, Richard and George David Smith, 1995, Information and Capital Market Regulation
in Anglo-American Finance. In Michael D. Bordo and Richard Sylla, eds., Anglo-American
Financial Systems. New York: Irwin, pp.179-205.
Yoon, Pyung and Laura Starks, 1995, Signaling, Investment Opportunities, and Dividend
Announcments, Review of Financial Studies, 8(4), 995-1018.
36
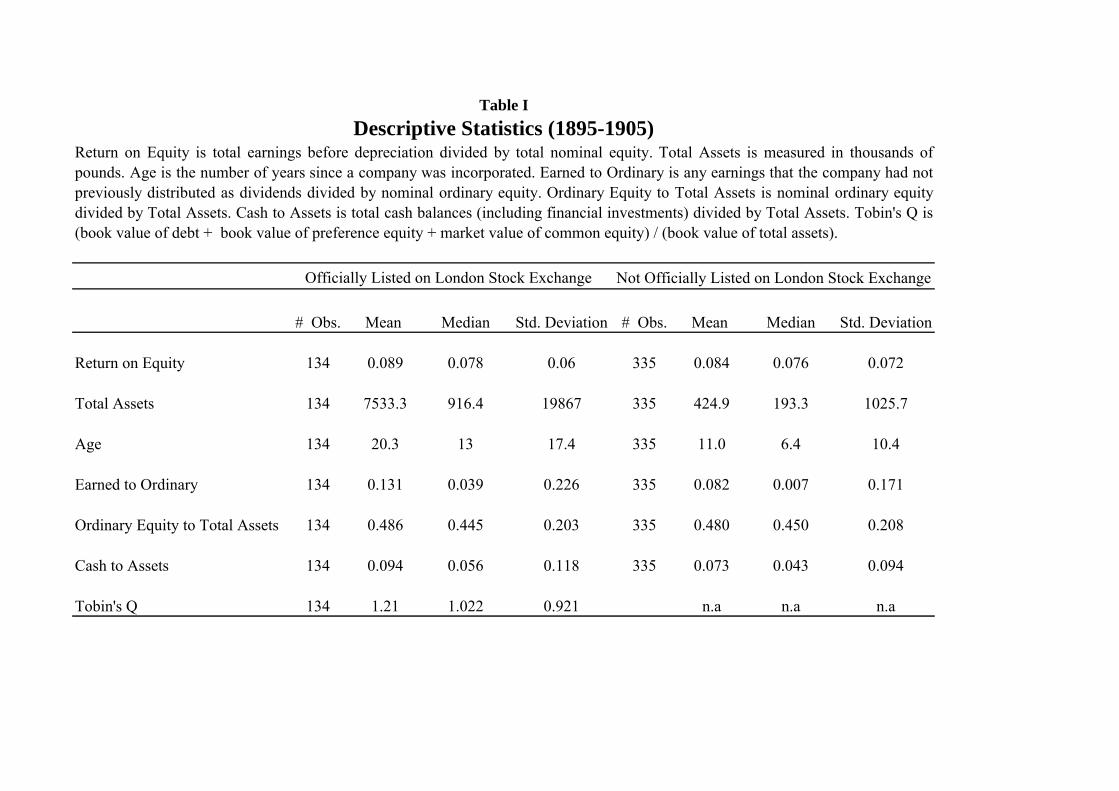
# Obs. Mean Median Std. Deviation # Obs. Mean Median Std. Deviation
Return on Equity 134 0.089 0.078 0.06 335 0.084 0.076 0.072
Total Assets 134 7533.3 916.4 19867 335 424.9 193.3 1025.7
Age 134 20.3 13 17.4 335 11.0 6.4 10.4
Earned to Ordinary 134 0.131 0.039 0.226 335 0.082 0.007 0.171
Ordinary Equity to Total Assets 134 0.486 0.445 0.203 335 0.480 0.450 0.208
Cash to Assets 134 0.094 0.056 0.118 335 0.073 0.043 0.094
Tobin's Q 134 1.21 1.022 0.921 n.a n.a n.a
Table I
Return on Equity is total earnings before depreciation divided by total nominal equity. Total Assets is measured in thousands ofpounds. Age is the number of years since a company was incorporated. Earned to Ordinary is any earnings that the company had notpreviously distributed as dividends divided by nominal ordinary equity. Ordinary Equity to Total Assets is nominal ordinary equitydivided by Total Assets. Cash to Assets is total cash balances (including financial investments) divided by Total Assets. Tobin's Q is(book value of debt + book value of preference equity + market value of common equity) / (book value of total assets).
Officially Listed on London Stock Exchange Not Officially Listed on London Stock Exchange
Descriptive Statistics (1895-1905)
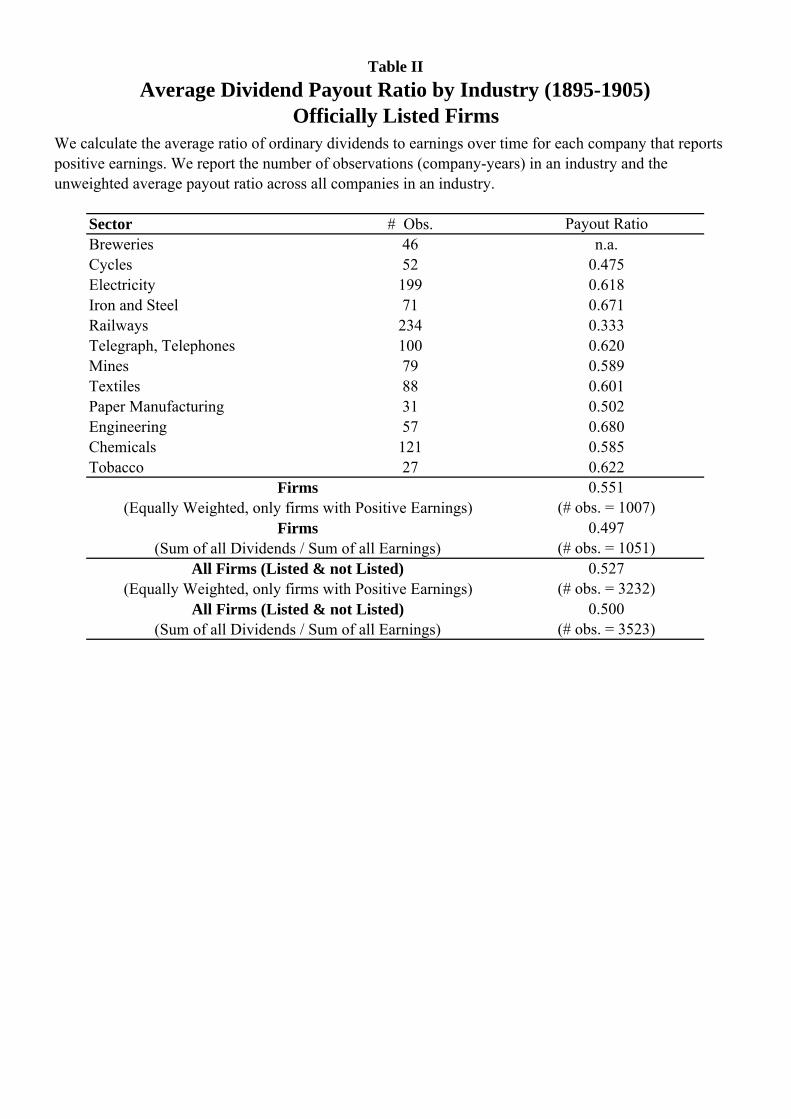
Sector # Obs. Payout RatioBreweries 46 n.a.Cycles 52 0.475Electricity 199 0.618Iron and Steel 71 0.671Railways 234 0.333Telegraph, Telephones 100 0.620Mines 79 0.589Textiles 88 0.601Paper Manufacturing 31 0.502Engineering 57 0.680Chemicals 121 0.585Tobacco 27 0.622
0.551(# obs. = 1007)
0.497(# obs. = 1051)
0.527(# obs. = 3232)
0.500(# obs. = 3523)
Firms(Equally Weighted, only firms with Positive Earnings)
Firms(Sum of all Dividends / Sum of all Earnings)
All Firms (Listed & not Listed)(Equally Weighted, only firms with Positive Earnings)
All Firms (Listed & not Listed)(Sum of all Dividends / Sum of all Earnings)
We calculate the average ratio of ordinary dividends to earnings over time for each company that reports positive earnings. We report the number of observations (company-years) in an industry and the unweighted average payout ratio across all companies in an industry.
Table IIAverage Dividend Payout Ratio by Industry (1895-1905)
Officially Listed Firms
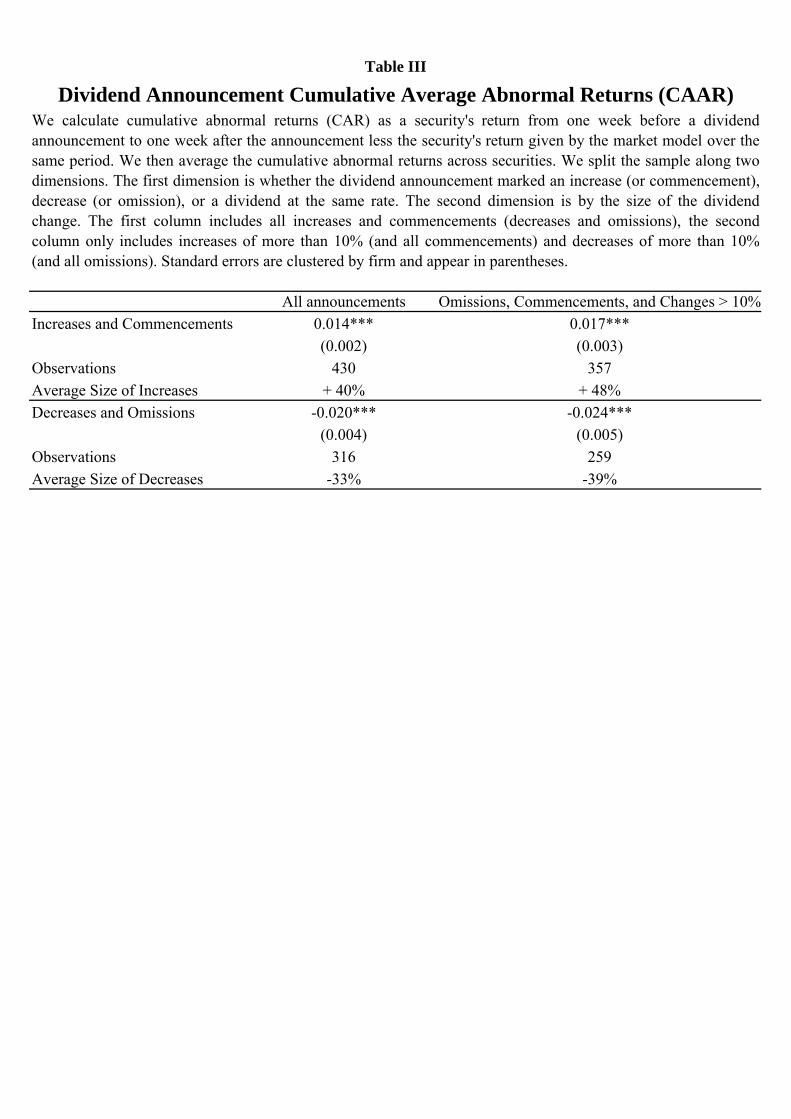
All announcements Omissions, Commencements, and Changes > 10%Increases and Commencements 0.014*** 0.017***
(0.002) (0.003)Observations 430 357Average Size of Increases + 40% + 48%Decreases and Omissions -0.020*** -0.024***
(0.004) (0.005)Observations 316 259Average Size of Decreases -33% -39%
Dividend Announcement Cumulative Average Abnormal Returns (CAAR)Table III
We calculate cumulative abnormal returns (CAR) as a security's return from one week before a dividendannouncement to one week after the announcement less the security's return given by the market model over thesame period. We then average the cumulative abnormal returns across securities. We split the sample along twodimensions. The first dimension is whether the dividend announcement marked an increase (or commencement),decrease (or omission), or a dividend at the same rate. The second dimension is by the size of the dividendchange. The first column includes all increases and commencements (decreases and omissions), the secondcolumn only includes increases of more than 10% (and all commencements) and decreases of more than 10%(and all omissions). Standard errors are clustered by firm and appear in parentheses.
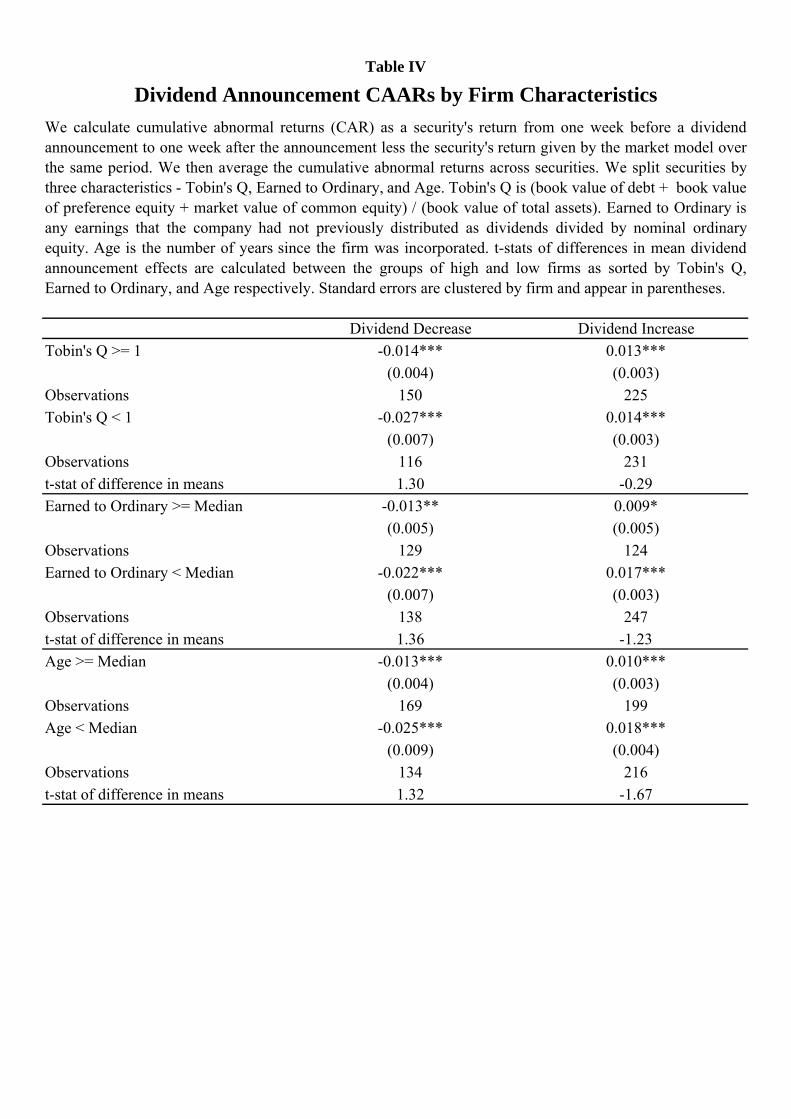
Dividend Decrease Dividend IncreaseTobin's Q >= 1 -0.014*** 0.013***
(0.004) (0.003)Observations 150 225Tobin's Q < 1 -0.027*** 0.014***
(0.007) (0.003)Observations 116 231t-stat of difference in means 1.30 -0.29Earned to Ordinary >= Median -0.013** 0.009*
(0.005) (0.005)Observations 129 124Earned to Ordinary < Median -0.022*** 0.017***
(0.007) (0.003)Observations 138 247t-stat of difference in means 1.36 -1.23Age >= Median -0.013*** 0.010***
(0.004) (0.003)Observations 169 199Age < Median -0.025*** 0.018***
(0.009) (0.004)Observations 134 216t-stat of difference in means 1.32 -1.67
Dividend Announcement CAARs by Firm CharacteristicsTable IV
We calculate cumulative abnormal returns (CAR) as a security's return from one week before a dividendannouncement to one week after the announcement less the security's return given by the market model overthe same period. We then average the cumulative abnormal returns across securities. We split securities bythree characteristics - Tobin's Q, Earned to Ordinary, and Age. Tobin's Q is (book value of debt + book valueof preference equity + market value of common equity) / (book value of total assets). Earned to Ordinary isany earnings that the company had not previously distributed as dividends divided by nominal ordinaryequity. Age is the number of years since the firm was incorporated. t-stats of differences in mean dividendannouncement effects are calculated between the groups of high and low firms as sorted by Tobin's Q,Earned to Ordinary, and Age respectively. Standard errors are clustered by firm and appear in parentheses.
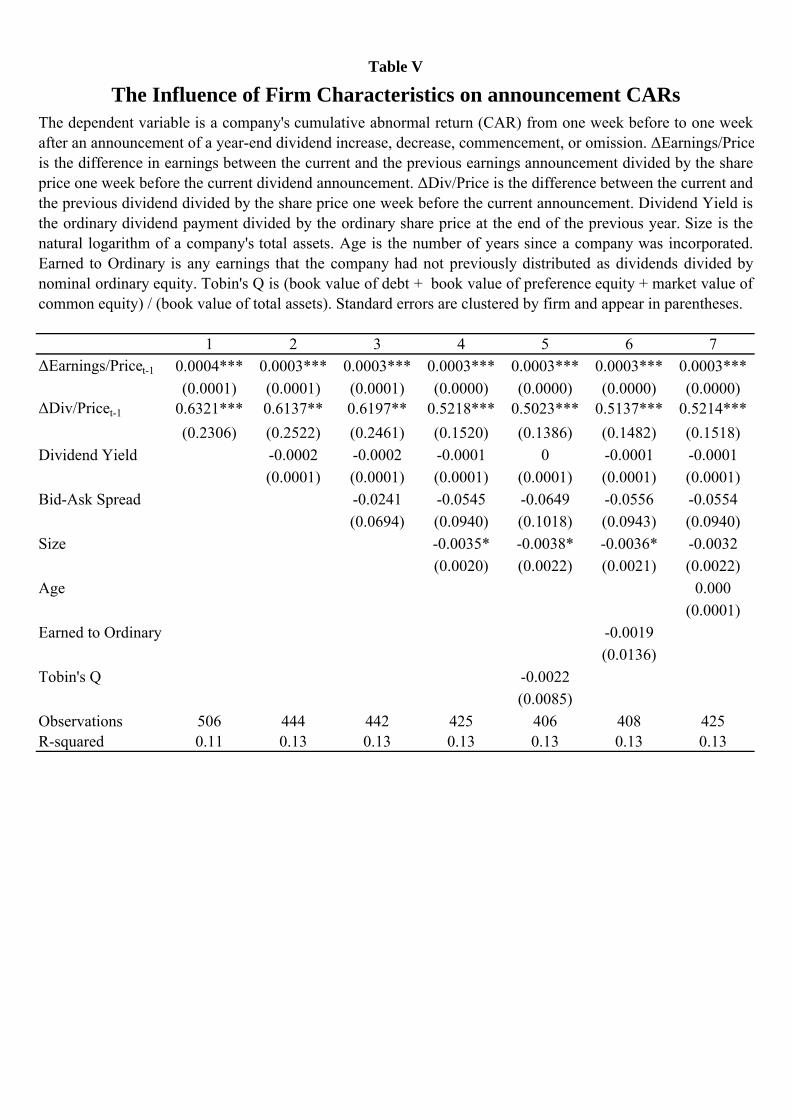
1 2 3 4 5 6 7ΔEarnings/Pricet-1 0.0004*** 0.0003*** 0.0003*** 0.0003*** 0.0003*** 0.0003*** 0.0003***
(0.0001) (0.0001) (0.0001) (0.0000) (0.0000) (0.0000) (0.0000)ΔDiv/Pricet-1 0.6321*** 0.6137** 0.6197** 0.5218*** 0.5023*** 0.5137*** 0.5214***
(0.2306) (0.2522) (0.2461) (0.1520) (0.1386) (0.1482) (0.1518)Dividend Yield -0.0002 -0.0002 -0.0001 0 -0.0001 -0.0001
(0.0001) (0.0001) (0.0001) (0.0001) (0.0001) (0.0001)Bid-Ask Spread -0.0241 -0.0545 -0.0649 -0.0556 -0.0554
(0.0694) (0.0940) (0.1018) (0.0943) (0.0940)Size -0.0035* -0.0038* -0.0036* -0.0032
(0.0020) (0.0022) (0.0021) (0.0022)Age 0.000
(0.0001)Earned to Ordinary -0.0019
(0.0136)Tobin's Q -0.0022
(0.0085)Observations 506 444 442 425 406 408 425R-squared 0.11 0.13 0.13 0.13 0.13 0.13 0.13
The dependent variable is a company's cumulative abnormal return (CAR) from one week before to one weekafter an announcement of a year-end dividend increase, decrease, commencement, or omission. ΔEarnings/Priceis the difference in earnings between the current and the previous earnings announcement divided by the shareprice one week before the current dividend announcement. ΔDiv/Price is the difference between the current andthe previous dividend divided by the share price one week before the current announcement. Dividend Yield isthe ordinary dividend payment divided by the ordinary share price at the end of the previous year. Size is thenatural logarithm of a company's total assets. Age is the number of years since a company was incorporated.Earned to Ordinary is any earnings that the company had not previously distributed as dividends divided bynominal ordinary equity. Tobin's Q is (book value of debt + book value of preference equity + market value ofcommon equity) / (book value of total assets). Standard errors are clustered by firm and appear in parentheses.
The Influence of Firm Characteristics on announcement CARsTable V
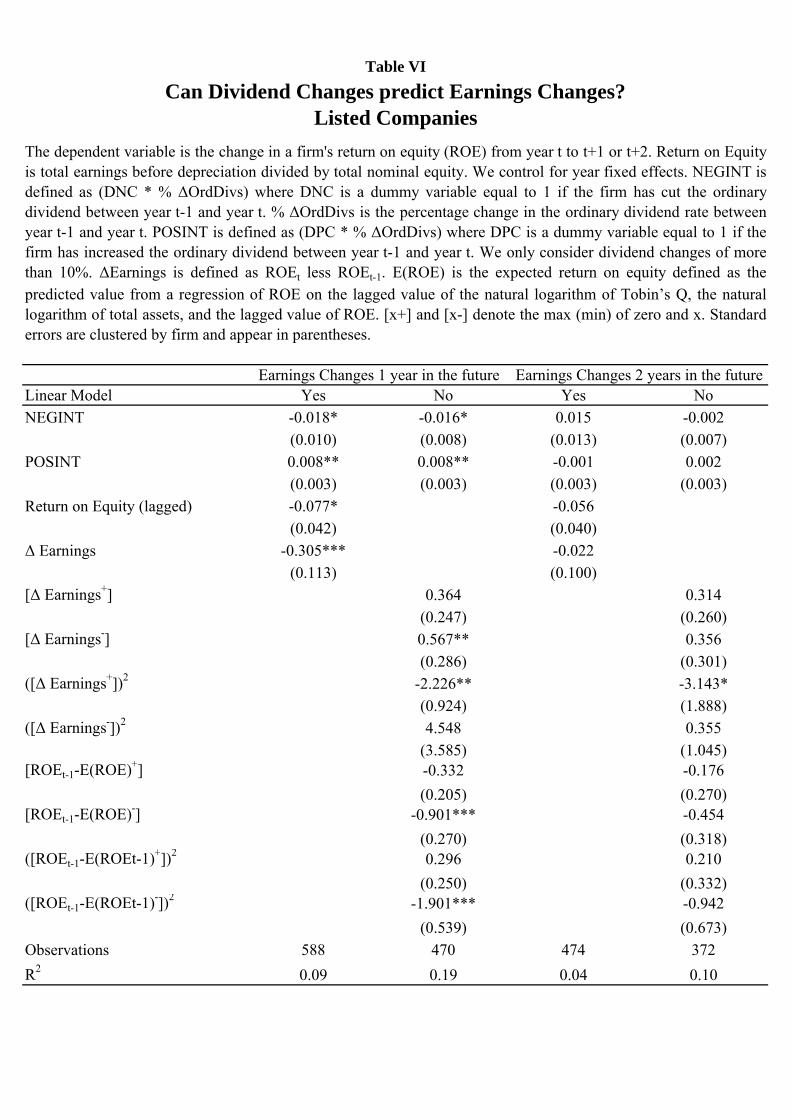
Linear Model Yes No Yes NoNEGINT -0.018* -0.016* 0.015 -0.002
(0.010) (0.008) (0.013) (0.007)POSINT 0.008** 0.008** -0.001 0.002
(0.003) (0.003) (0.003) (0.003)Return on Equity (lagged) -0.077* -0.056
(0.042) (0.040)Δ Earnings -0.305*** -0.022
(0.113) (0.100)[Δ Earnings+] 0.364 0.314
(0.247) (0.260)[Δ Earnings-] 0.567** 0.356
(0.286) (0.301)([Δ Earnings+])2 -2.226** -3.143*
(0.924) (1.888)([Δ Earnings-])2 4.548 0.355
(3.585) (1.045)[ROEt-1-E(ROE)+] -0.332 -0.176
(0.205) (0.270)[ROEt-1-E(ROE)-] -0.901*** -0.454
(0.270) (0.318)([ROEt-1-E(ROEt-1)+])2 0.296 0.210
(0.250) (0.332)([ROEt-1-E(ROEt-1)-])2 -1.901*** -0.942
(0.539) (0.673)Observations 588 470 474 372R2 0.09 0.19 0.04 0.10
The dependent variable is the change in a firm's return on equity (ROE) from year t to t+1 or t+2. Return on Equityis total earnings before depreciation divided by total nominal equity. We control for year fixed effects. NEGINT isdefined as (DNC * % ΔOrdDivs) where DNC is a dummy variable equal to 1 if the firm has cut the ordinarydividend between year t-1 and year t. % ΔOrdDivs is the percentage change in the ordinary dividend rate betweenyear t-1 and year t. POSINT is defined as (DPC * % ΔOrdDivs) where DPC is a dummy variable equal to 1 if thefirm has increased the ordinary dividend between year t-1 and year t. We only consider dividend changes of morethan 10%. ΔEarnings is defined as ROEt less ROEt-1. E(ROE) is the expected return on equity defined as thepredicted value from a regression of ROE on the lagged value of the natural logarithm of Tobin’s Q, the naturallogarithm of total assets, and the lagged value of ROE. [x+] and [x-] denote the max (min) of zero and x. Standarderrors are clustered by firm and appear in parentheses.
Can Dividend Changes predict Earnings Changes?Listed Companies
Table VI
Earnings Changes 1 year in the future Earnings Changes 2 years in the future
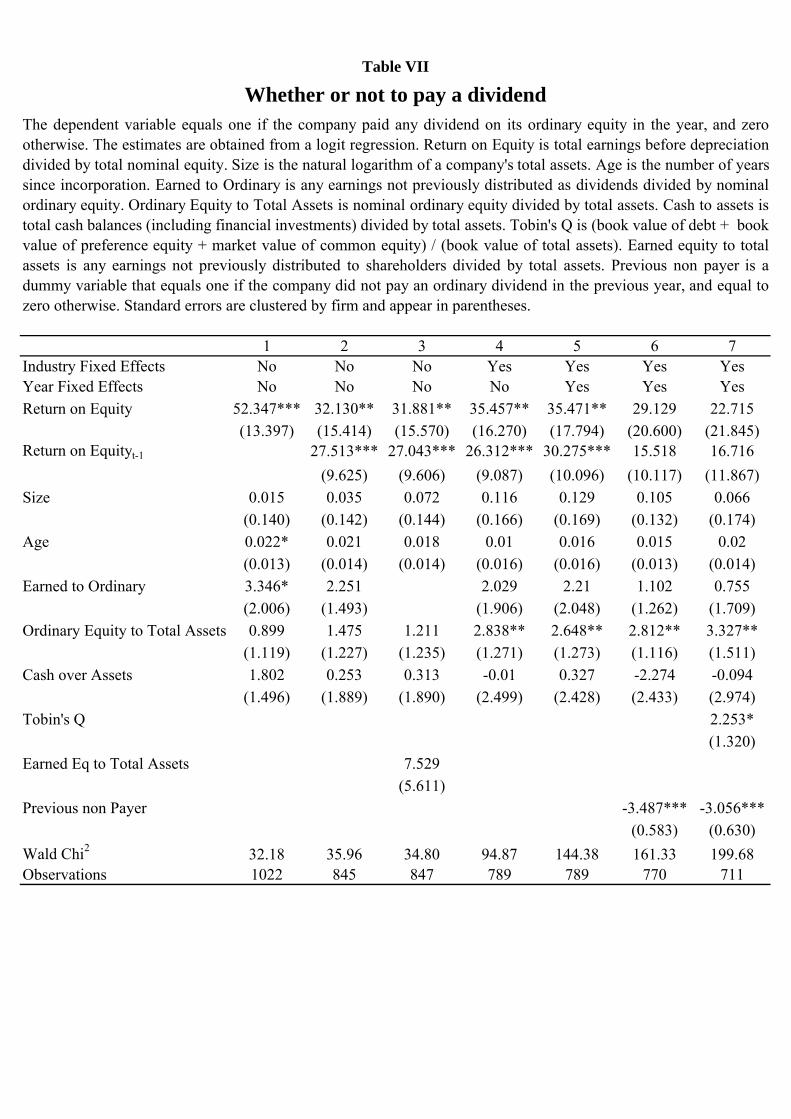
1 2 3 4 5 6 7Industry Fixed Effects No No No Yes Yes Yes YesYear Fixed Effects No No No No Yes Yes YesReturn on Equity 52.347*** 32.130** 31.881** 35.457** 35.471** 29.129 22.715
(13.397) (15.414) (15.570) (16.270) (17.794) (20.600) (21.845)Return on Equityt-1 27.513*** 27.043*** 26.312*** 30.275*** 15.518 16.716
(9.625) (9.606) (9.087) (10.096) (10.117) (11.867)Size 0.015 0.035 0.072 0.116 0.129 0.105 0.066
(0.140) (0.142) (0.144) (0.166) (0.169) (0.132) (0.174)Age 0.022* 0.021 0.018 0.01 0.016 0.015 0.02
(0.013) (0.014) (0.014) (0.016) (0.016) (0.013) (0.014)Earned to Ordinary 3.346* 2.251 2.029 2.21 1.102 0.755
(2.006) (1.493) (1.906) (2.048) (1.262) (1.709)Ordinary Equity to Total Assets 0.899 1.475 1.211 2.838** 2.648** 2.812** 3.327**
(1.119) (1.227) (1.235) (1.271) (1.273) (1.116) (1.511)Cash over Assets 1.802 0.253 0.313 -0.01 0.327 -2.274 -0.094
(1.496) (1.889) (1.890) (2.499) (2.428) (2.433) (2.974)Tobin's Q 2.253*
(1.320)Earned Eq to Total Assets 7.529
(5.611)Previous non Payer -3.487*** -3.056***
(0.583) (0.630)Wald Chi2 32.18 35.96 34.80 94.87 144.38 161.33 199.68Observations 1022 845 847 789 789 770 711
The dependent variable equals one if the company paid any dividend on its ordinary equity in the year, and zerootherwise. The estimates are obtained from a logit regression. Return on Equity is total earnings before depreciationdivided by total nominal equity. Size is the natural logarithm of a company's total assets. Age is the number of yearssince incorporation. Earned to Ordinary is any earnings not previously distributed as dividends divided by nominalordinary equity. Ordinary Equity to Total Assets is nominal ordinary equity divided by total assets. Cash to assets istotal cash balances (including financial investments) divided by total assets. Tobin's Q is (book value of debt + bookvalue of preference equity + market value of common equity) / (book value of total assets). Earned equity to totalassets is any earnings not previously distributed to shareholders divided by total assets. Previous non payer is adummy variable that equals one if the company did not pay an ordinary dividend in the previous year, and equal tozero otherwise. Standard errors are clustered by firm and appear in parentheses.
Whether or not to pay a dividendTable VII
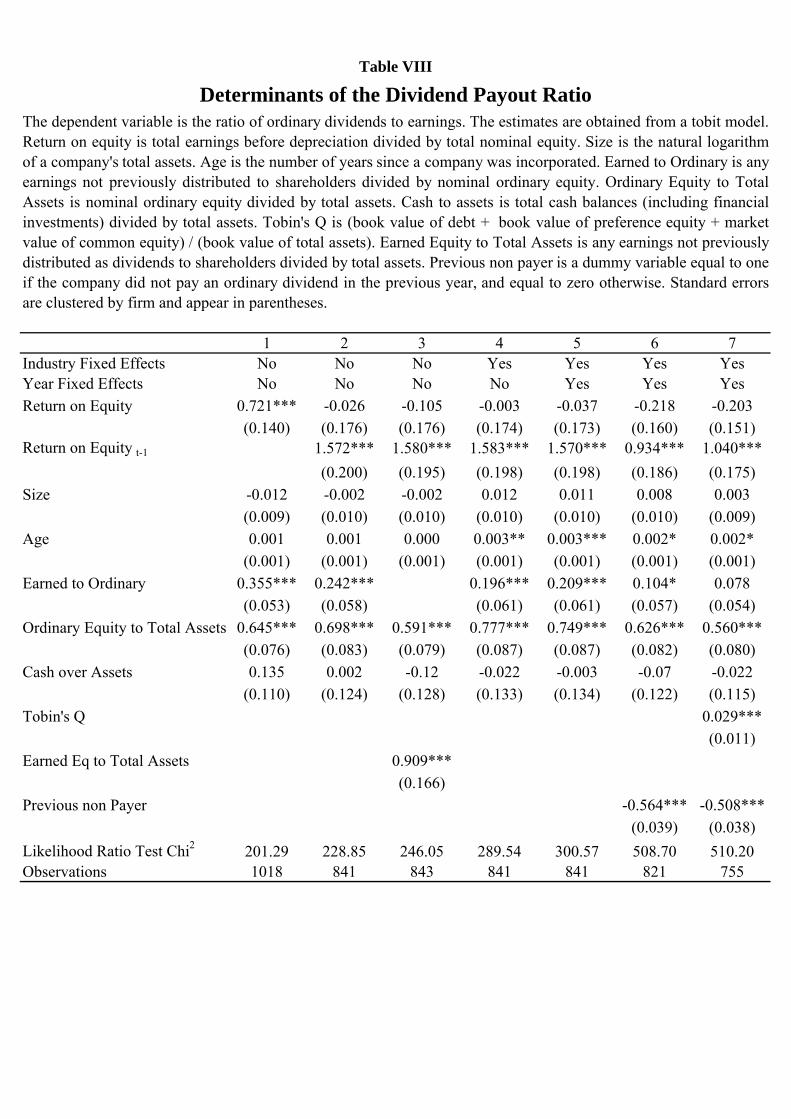
1 2 3 4 5 6 7Industry Fixed Effects No No No Yes Yes Yes YesYear Fixed Effects No No No No Yes Yes YesReturn on Equity 0.721*** -0.026 -0.105 -0.003 -0.037 -0.218 -0.203
(0.140) (0.176) (0.176) (0.174) (0.173) (0.160) (0.151)Return on Equity t-1 1.572*** 1.580*** 1.583*** 1.570*** 0.934*** 1.040***
(0.200) (0.195) (0.198) (0.198) (0.186) (0.175)Size -0.012 -0.002 -0.002 0.012 0.011 0.008 0.003
(0.009) (0.010) (0.010) (0.010) (0.010) (0.010) (0.009)Age 0.001 0.001 0.000 0.003** 0.003*** 0.002* 0.002*
(0.001) (0.001) (0.001) (0.001) (0.001) (0.001) (0.001)Earned to Ordinary 0.355*** 0.242*** 0.196*** 0.209*** 0.104* 0.078
(0.053) (0.058) (0.061) (0.061) (0.057) (0.054)Ordinary Equity to Total Assets 0.645*** 0.698*** 0.591*** 0.777*** 0.749*** 0.626*** 0.560***
(0.076) (0.083) (0.079) (0.087) (0.087) (0.082) (0.080)Cash over Assets 0.135 0.002 -0.12 -0.022 -0.003 -0.07 -0.022
(0.110) (0.124) (0.128) (0.133) (0.134) (0.122) (0.115)Tobin's Q 0.029***
(0.011)Earned Eq to Total Assets 0.909***
(0.166)Previous non Payer -0.564*** -0.508***
(0.039) (0.038)Likelihood Ratio Test Chi2 201.29 228.85 246.05 289.54 300.57 508.70 510.20Observations 1018 841 843 841 841 821 755
The dependent variable is the ratio of ordinary dividends to earnings. The estimates are obtained from a tobit model.Return on equity is total earnings before depreciation divided by total nominal equity. Size is the natural logarithmof a company's total assets. Age is the number of years since a company was incorporated. Earned to Ordinary is anyearnings not previously distributed to shareholders divided by nominal ordinary equity. Ordinary Equity to TotalAssets is nominal ordinary equity divided by total assets. Cash to assets is total cash balances (including financialinvestments) divided by total assets. Tobin's Q is (book value of debt + book value of preference equity + marketvalue of common equity) / (book value of total assets). Earned Equity to Total Assets is any earnings not previouslydistributed as dividends to shareholders divided by total assets. Previous non payer is a dummy variable equal to oneif the company did not pay an ordinary dividend in the previous year, and equal to zero otherwise. Standard errorsare clustered by firm and appear in parentheses.
Determinants of the Dividend Payout RatioTable VIII
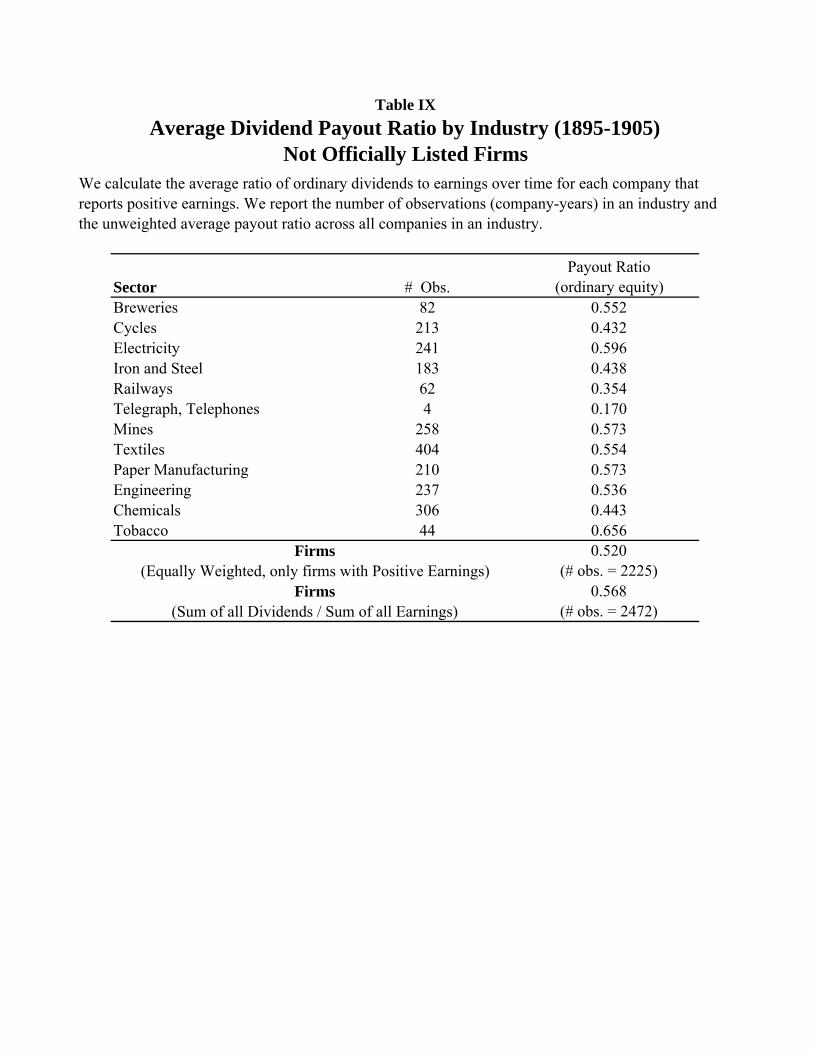
Sector # Obs.Payout Ratio
(ordinary equity)Breweries 82 0.552Cycles 213 0.432Electricity 241 0.596Iron and Steel 183 0.438Railways 62 0.354Telegraph, Telephones 4 0.170Mines 258 0.573Textiles 404 0.554Paper Manufacturing 210 0.573Engineering 237 0.536Chemicals 306 0.443Tobacco 44 0.656
0.520(# obs. = 2225)
0.568(# obs. = 2472)
Firms(Equally Weighted, only firms with Positive Earnings)
Firms(Sum of all Dividends / Sum of all Earnings)
Table IXAverage Dividend Payout Ratio by Industry (1895-1905)
We calculate the average ratio of ordinary dividends to earnings over time for each company that reports positive earnings. We report the number of observations (company-years) in an industry and the unweighted average payout ratio across all companies in an industry.
Not Officially Listed Firms
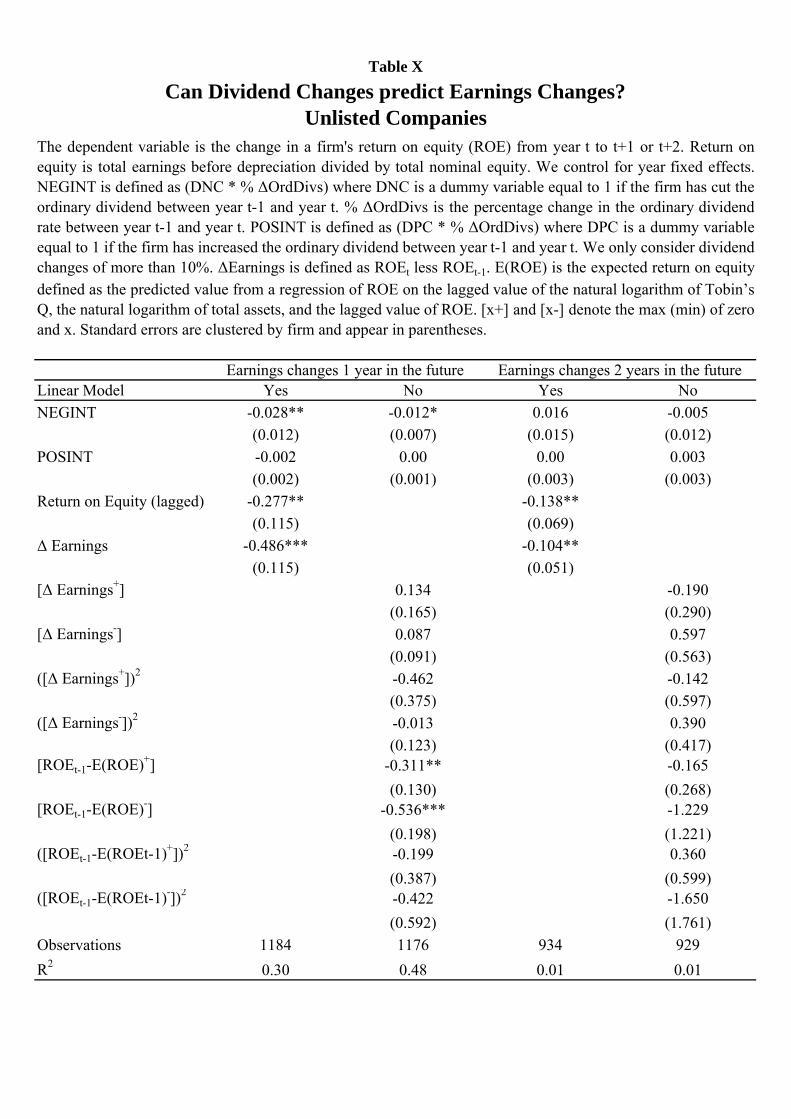
Linear Model Yes No Yes NoNEGINT -0.028** -0.012* 0.016 -0.005
(0.012) (0.007) (0.015) (0.012)POSINT -0.002 0.00 0.00 0.003
(0.002) (0.001) (0.003) (0.003)Return on Equity (lagged) -0.277** -0.138**
(0.115) (0.069)Δ Earnings -0.486*** -0.104**
(0.115) (0.051)[Δ Earnings+] 0.134 -0.190
(0.165) (0.290)[Δ Earnings-] 0.087 0.597
(0.091) (0.563)([Δ Earnings+])2 -0.462 -0.142
(0.375) (0.597)([Δ Earnings-])2 -0.013 0.390
(0.123) (0.417)[ROEt-1-E(ROE)+] -0.311** -0.165
(0.130) (0.268)[ROEt-1-E(ROE)-] -0.536*** -1.229
(0.198) (1.221)([ROEt-1-E(ROEt-1)+])2 -0.199 0.360
(0.387) (0.599)([ROEt-1-E(ROEt-1)-])2 -0.422 -1.650
(0.592) (1.761)Observations 1184 1176 934 929R2 0.30 0.48 0.01 0.01
The dependent variable is the change in a firm's return on equity (ROE) from year t to t+1 or t+2. Return onequity is total earnings before depreciation divided by total nominal equity. We control for year fixed effects.NEGINT is defined as (DNC * % ΔOrdDivs) where DNC is a dummy variable equal to 1 if the firm has cut theordinary dividend between year t-1 and year t. % ΔOrdDivs is the percentage change in the ordinary dividendrate between year t-1 and year t. POSINT is defined as (DPC * % ΔOrdDivs) where DPC is a dummy variableequal to 1 if the firm has increased the ordinary dividend between year t-1 and year t. We only consider dividendchanges of more than 10%. ΔEarnings is defined as ROEt less ROEt-1. E(ROE) is the expected return on equitydefined as the predicted value from a regression of ROE on the lagged value of the natural logarithm of Tobin’sQ, the natural logarithm of total assets, and the lagged value of ROE. [x+] and [x-] denote the max (min) of zeroand x. Standard errors are clustered by firm and appear in parentheses.
Can Dividend Changes predict Earnings Changes?Unlisted Companies
Table X
Earnings changes 1 year in the future Earnings changes 2 years in the future
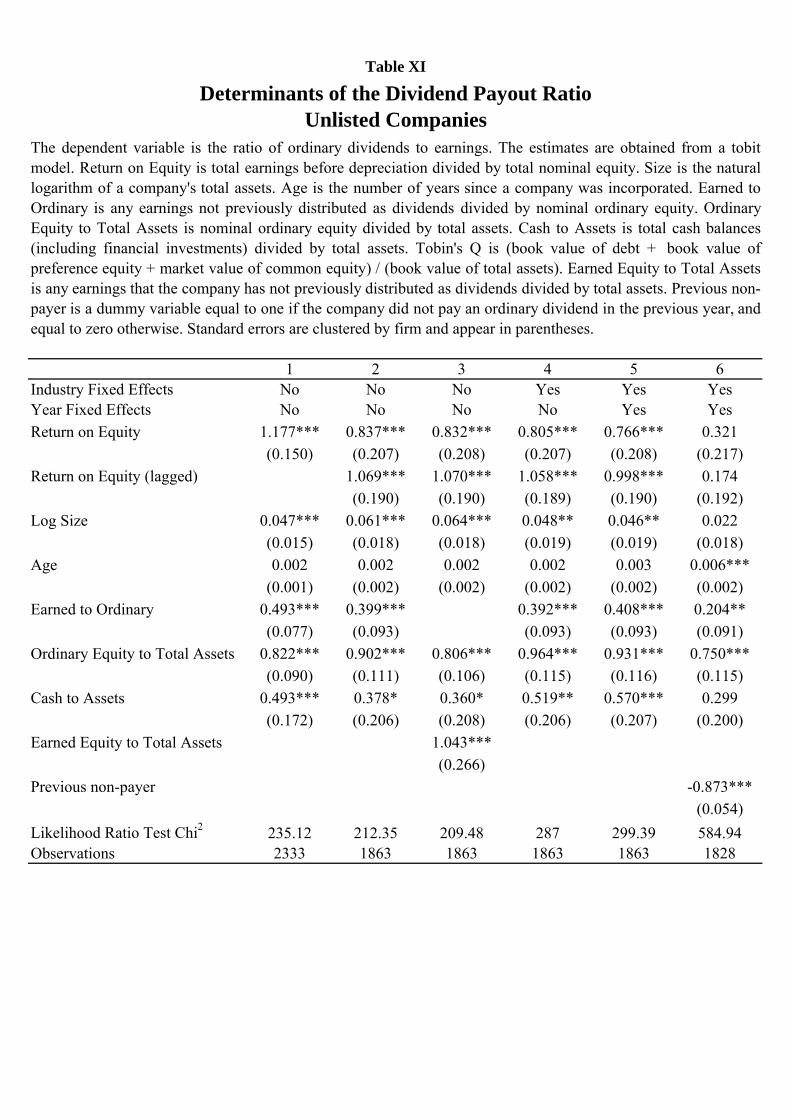
1 2 3 4 5 6Industry Fixed Effects No No No Yes Yes YesYear Fixed Effects No No No No Yes YesReturn on Equity 1.177*** 0.837*** 0.832*** 0.805*** 0.766*** 0.321
(0.150) (0.207) (0.208) (0.207) (0.208) (0.217)Return on Equity (lagged) 1.069*** 1.070*** 1.058*** 0.998*** 0.174
(0.190) (0.190) (0.189) (0.190) (0.192)Log Size 0.047*** 0.061*** 0.064*** 0.048** 0.046** 0.022
(0.015) (0.018) (0.018) (0.019) (0.019) (0.018)Age 0.002 0.002 0.002 0.002 0.003 0.006***
(0.001) (0.002) (0.002) (0.002) (0.002) (0.002)Earned to Ordinary 0.493*** 0.399*** 0.392*** 0.408*** 0.204**
(0.077) (0.093) (0.093) (0.093) (0.091)Ordinary Equity to Total Assets 0.822*** 0.902*** 0.806*** 0.964*** 0.931*** 0.750***
(0.090) (0.111) (0.106) (0.115) (0.116) (0.115)Cash to Assets 0.493*** 0.378* 0.360* 0.519** 0.570*** 0.299
(0.172) (0.206) (0.208) (0.206) (0.207) (0.200)Earned Equity to Total Assets 1.043***
(0.266)Previous non-payer -0.873***
(0.054)Likelihood Ratio Test Chi2 235.12 212.35 209.48 287 299.39 584.94Observations 2333 1863 1863 1863 1863 1828
The dependent variable is the ratio of ordinary dividends to earnings. The estimates are obtained from a tobitmodel. Return on Equity is total earnings before depreciation divided by total nominal equity. Size is the naturallogarithm of a company's total assets. Age is the number of years since a company was incorporated. Earned toOrdinary is any earnings not previously distributed as dividends divided by nominal ordinary equity. OrdinaryEquity to Total Assets is nominal ordinary equity divided by total assets. Cash to Assets is total cash balances(including financial investments) divided by total assets. Tobin's Q is (book value of debt + book value ofpreference equity + market value of common equity) / (book value of total assets). Earned Equity to Total Assetsis any earnings that the company has not previously distributed as dividends divided by total assets. Previous non-payer is a dummy variable equal to one if the company did not pay an ordinary dividend in the previous year, andequal to zero otherwise. Standard errors are clustered by firm and appear in parentheses.
Determinants of the Dividend Payout RatioUnlisted Companies
Table XI