dividends: the case for income-oriented investors
TRANSCRIPT

Investment products: No bank guarantee I Not FDIC insured I May lose value
G L O B A L E Q U I T I E S W H I T E PA P E R
OUTLINE
1 | The “value” of a dividend-investing strategy (page 2)
1.1 Dividends: the basics (page 2)
1.2 Dividends: a compelling source of potential return for
equities (page 3)
1.3 Dividends: attractive risk characteristics (page 5)
1.4 Dividends: a global opportunity (page 7)
1.5 Sustainability of dividends (page 9)
1.6 Dividends as inflation or deflation hedge? (page 10)
2 | Potential buy signals for equities in times of low
bond yields (page 12)
2.1 Slow growth in developed markets increases
attractiveness of dividends (page 12)
2.2 Potential buy signal: flows (page 14)
2.3 Potential buy signal: equity yields vs. government bond
yields (page 15)
2.4 Potential buy signal: equity yields vs. corporate bond
yields (page 16)
3 | Conclusion (page 18)
After 30 years of perpetually declining interest rates, we
believe that the tailwind for fixed-income investments
is waning. Given today’s demographics—older, more
conservative investors seeking income—we believe income
alternatives such as dividend-paying stocks could come
into focus. Thus, in this white paper, we build the case for
dividend-paying stocks. In section 1, we first review the
value of a dividend-investing strategy: We highlight the
impact dividends have had on total equity returns in various
market environments as well as the relatively attractive
risk characteristics of dividend-paying stocks; we examine
the opportunity global dividend-paying stocks present to
enhance portfolios; and we look at the impact of inflation
and deflation on equities and the implications of utilizing a
dividend strategy. In section 2, we examine several potential
buy signals for equities, including a turnaround in fund flow
imbalances and attractive yields relative to bonds.
Dividends: the case for income-oriented investors
Today’s low fixed-income yields and expectations of prolonged slower growth in developed countries could lead to the re-emergence of dividend-paying stocks as an important component of investors’ portfolios. This white paper will explore three core concepts: the intrinsic value of dividend-investing strategies; alternative sources of yield in a low-interest-rate environment; and dividends as a potential inflation hedge.
A U G U S T 2 0 1 2
Contributors » Stephen Noll, CFA, senior product specialist
» David Wertheim, head of DWS U.S. product specialist team
» Kevin Walsh, product specialist
» Dr. Oliver Plein, head of DWS European product specialists (equities)
» Andreas Korsa, European product specialist (equities)
INTERNATIONAL/ GLOBAL EQUITY FUNDS

2 » Dividends: the case for income-oriented investors
GLOBAL EQUITIES WHITE PAPER I AUGUST 2012
1.1. DIVIDENDS: THE BASICS
Near-term changes in asset prices are difficult to predict, but
in this section, we consider the potential long-term benefits
of harnessing income by investing in equities. By investing
in income-generating equities, investors can participate in
real income growth coupled with long-term capital growth.
There are a number of reasons to consider companies
that pay regular dividends. First, dividends return cash to
shareholders, thereby creating confidence in economic
success. Second, scarce resources (such as earnings
after dividends) tend to be used more efficiently (as we
explain in more detail in section 1.5). Third, a consistent
dividend policy sends a strong message about continuity
and reliability. Fourth, dividends, unlike earnings, are rarely
cut, and may offer a cushion on the downside.
Do dividends matter? Yes, but investing in equities should
not be a gamble, and therefore investment decisions need
to be proven by evidence. According to T.H. Huxley, “The
deepest sin against the human mind is to believe things
without evidence.” Therefore it is vital to set forth a number
of studies, largely from academia, analyzing the importance
of dividends and the association of high dividend yields
with attractive investment returns over long periods.
Much has been written about dividends, and what is
contained herein is not meant to be an exhaustive analysis,
but rather a sampling of persuasive arguments examining
the impact of dividends on total investment returns. We
hope it will provide added insight and confidence, as it did to
us long ago, in pursuing a yield-oriented investment strategy.
One of the most important things corporations must
determine is how best to utilize the free cash flow
generated from their operations. Typically, they have
four options: reinvesting in their business to generate
future growth, repurchasing shares of their stock, paying
shareholders via cash dividends or leaving the cash on
1 I The “value” of a dividend strategy
their balance sheets. Which choice a company makes
reflects how management views the company’s growth
prospects, which in turn depends on what industry the
company is in, what stage of its lifecycle the company is
in and where the economy is within the business cycle.
Typically, young companies that are in the early stages
of their growth path need to retain their earnings in order
to reinvest in their business, and therefore tend to not
pay a dividend. In contrast, mature companies that have
achieved more stable cash flows may repurchase shares or
pay dividends. Dividends are often associated with quality
companies because paying regular dividends reflects
the company’s confidence that it will be able to support
payments via expected earnings.
Similarly, dividend policies tend to differ by industry.
Companies in capital-intensive industries, such as airlines,
engineering and construction, need to reinvest their cash
flow in order to support their business models; they
thus will rarely pay a dividend. Companies in industries
with stable cash flows, such as telecommunications and
utilities, typically pay high dividends.
Decisions to pay cash as dividends will also be impacted by
macroeconomic factors. During economic contractions, cash
flows of many cyclical companies are greatly diminished,
increasing these companies’ need to preserve capital in order
to ensure their future existence. During the most recent
recession, the availability of credit dried up, resulting in many
companies hoarding cash. However, in the current economic
environment, companies hold a record high amount of their
net worth in cash. Potential uses are illustrated in Figure 1.
FIGURE 1: POSSIBLE USES OF BALANCE-SHEET CASH
Cash on thebalance sheet
Mergers andacquisitions
Dividends
Share purchases Wage increasesCapital
expenditures

GLOBAL EQUITIES WHITE PAPER I AUGUST 2012
Dividends: the case for income-oriented investors » 3
1.2. DIVIDENDS: A COMPELLING SOURCE
OF POTENTIAL RETURN FOR EQUITIES
One of the most notable statistics about dividends is
the impact they have on long-term equity returns. The
reinvestment of dividends has accounted for 43.5% of
the total returns of the S&P 500 Index since 1926. Over
this period, the average annual price appreciation of the
S&P 500 Index was 5.56%. The return of the index with
Source: Morningstar as of 6/30/12. Performance is historical and does not guarantee future results. Index returns assume reinvestment of all distributions and do not reflect fees or expenses. It is not possible to invest directly in an index. See page 19 for index definitions.
FIGURE 2: AVERAGE ANNUAL RETURNS OF THE S&P 500 INDEX (1/4/26–6/30/12)
Since 1926
2000s
1990s
1980s
1970s
1960s
1950s
1940s
1930s
Total returns
Dividends Price appreciation
–10% –5% 0% 5% 10% 15% 20%
4.28%9.84%
–0.95%
5.56%
1.77%
–2.72%
2.89%
15.32%
4.95%
12.59%
4.25%
1.60%
4.39%
5.77%
13.58%
6.18%
2.98%
5.21%
–5.27%
3.41%
18.21%
17.55%
5.86%
7.81%
9.17%
–0.05%
19.35%
dividends, in contrast, was 9.84%. Moreover, by dissecting
the returns of the S&P 500 Index by decade, we can see
that dividends helped cushion the equity price declines of
the 1930s and 2000s and also helped equity returns during
periods of moderate equity price appreciation—a scenario
that may be more realistic than the strong price appreciation
experienced in the 1980s and 1990s. (See Figure 2.)

4 » Dividends: the case for income-oriented investors
GLOBAL EQUITIES WHITE PAPER I AUGUST 2012
An even longer-term analysis appeared in the Financial
Analysts Journal in 2003. In “Dividends and the Three
Dwarfs,” Robert D. Arnott pointed out that from 1802 to
2002, dividends were by far the main source of the real
return from equities, dwarfing the other constituents, which
included inflation, rising valuation and real dividend growth.
From 1802 to 2002, the average annual return of equities was
7.9%, which broke down as follows: 5.0% from dividends,
1.4% from inflation, 0.8% from real dividend growth and
0.6% from rising valuations. The numbers show that 63%
of the total return of equities has come from dividends and
a combined 73% from dividends and dividend growth. The
author’s conclusion: “Unless corporate managers can provide
sharply higher real growth in earnings, dividends are the main
source of real return we expect from stocks.”
We admit that even for investors primarily focused on
strategic asset allocation, 200 years might not necessarily
be the correct investment horizon. Moreover, for yield
hunters who charge around in markets trying to guess
the next month´s earnings number, the dividend-investing
strategy seems completely irrelevant. However, for
investors between these poles, dividends may be a vital
and essential element of return. To illustrate the importance
of dividends, we review a paper written by James Montier,
a member of the asset management team at GMO, a
privately held global investment management firm, entitled
“A Man from a Different Time.” In it, Montier concludes
that over a one-year time horizon, only roughly 20% of the
total return of the S&P 500 Index has been generated by
dividend yield and real dividend growth. In contrast, roughly
80% has been generated by fluctuations in valuations.
Source: GMO as of August 2010. Performance is historical and does not guarantee future results. Index returns assume reinvestment of all distributions and do not reflect fees or expenses. It is not possible to invest directly in an index. See page 19 for index definitions.
FIGURE 3: S&P 500 INDEX COMPONENT RETURNS BY TIME HORIZON (1971–AUGUST 2010)
0%
20%
40%
60%
80%
100%Change in valuation Change in valuation
Dividend growth
Dividend yieldDividend growth
Dividend yield
5-year1-year
If we switch to a five-year time horizon, the story looks
very different: Fundamentals now play a prominent role in
explaining total return, with the dividend camp accounting
for roughly 80% of the return. (See Figure 3.)

GLOBAL EQUITIES WHITE PAPER I AUGUST 2012
Dividends: the case for income-oriented investors » 5
FIGURE 5: DOWNSIDE AND UPSIDE CAPTURE RATIOS OF HIGH-DIVIDEND-YIELDERS (7/1/27–12/31/11)
1.3. DIVIDENDS: ATTRACTIVE RISK
CHARACTERISTICS
High-dividend-yielding stocks have also provided better
risk attributes than non-dividend-yielding stocks, including
lower volatility and stronger downside protection when
markets decline.
As figure 4 indicates, the standard deviation of high-
dividend-yielding stocks has been significantly lower
than that of non-dividend-yielding stocks over various
long-term periods.
Even more attractive has been the downside protection
provided by high-dividend-yielding stocks. Since 1927,
high-dividend-yielding stocks have held up better than the
broader market during downturns. In fact, the downside
capture ratio of high-dividend-yielding stocks has been
81% or lower over various long-term periods. Put another
way, during months that the S&P 500 Index declined,
dividend-yielding stocks declined by nearly 19% less than
the broader market. (See Figure 5)
Source: Kenneth French as of 12/31/11. Performance is historical and does not guarantee future results. Standard deviation is often used to represent the volatility of an investment; it depicts how widely an investment’s returns vary from the investment’s average return over a certain period. The higher the standard deviation, the greater the volatility. Downside capture ratio measures a portfolio’s performance in down markets relative to the investment universe (with down markets defined as those that have a negative monthly return); the lower the downside capture ratio, the better the portfolio performed during a market downturn. Upside capture ratio measures a portfolio’s performance in up markets relative to the investment universe (with up markets defined as those that have a positive monthly return); the higher the upside capture ratio, the better the portfolio performed during a market upturn. Non-dividend-yielders include all U.S. stocks that do not pay a dividend at the time of reconstitution. The remaining stocks are divided by dividend yield into three categories: highest 30%, middle 40% and lowest 30%. High-dividend-yielders are represented by the highest 30% of dividend yielders. Portfolios are reconstituted annually. Index returns assume reinvestment of all distributions and do not reflect fees |or expenses. It is not possible to invest directly in an index. See page 19 for index definitions.
FIGURE 4: STANDARD DEVIATION OF HIGH-DIVIDEND-YIELDERS VS. NON-DIVIDEND-YIELDERS (8/1/27–12/31/11)
High-dividend-yielders
Non-dividend- yielders
Since 1927 20.31% 30.34%
50-year 14.05% 24.59%
30-year 14.22% 22.90%
10-year 16.41% 19.96%
5-year 19.96% 21.99%
Upside capture ratio
Downside capture ratio
Since 1927 92.14 81.53
50-year 87.69 67.45
30-year 86.06 65.86
20-year 85.95 65.83
10-year 95.30 81.61
While the data in Figure 4 makes a compelling case for
high dividend-yielding stocks, one should not rely on
screening for the highest-yielding stocks. There are several
other characteristics that should also be considered, such
as sustainability of dividend as well as growth of dividends.
To illustrate, consider a recent study by Ned Davis Research,
which looked at the performance of dividend growers
vs. stable dividend payers (those with no change in
dividends) and dividend cutters. From 1/31/72 through
6/30/12, companies that grew their dividends significantly
outperformed companies that cut their dividends, with
annualized returns of 9.46% and –0.41%, respectively.
In addition, dividend growers outpaced stable dividend
payers by an annualized 2.48 percentage points over the
same period.

6 » Dividends: the case for income-oriented investors
GLOBAL EQUITIES WHITE PAPER I AUGUST 2012
The importance of dividends becomes even clearer when you consider the power of compounding those dividends
over time. An initial investment of $100 in non-dividend-yielding stocks starting in 1972 would have grown to $181 by
6/30/12. In comparison, the same amount invested in dividend-growing stocks would have grown to $3,886, or 21.5
times that of non-dividend-yielding stocks. In the end, we believe investors should favor dividend payers over non-payers
and dividend growers over cutters, and should tilt their core equity strategy towards payers and growers. (See Figure 6.)
20112005200019951990198519801975
Dividend growers: 3,786% cumulative return, 9.46% annual return
Constant dividend payers: 1,435% cumulative return, 6.98% annual return
Non-dividend payers: 81% cumulative return, 1.48% annual return
Dividend cutters: –15% cumulative return, –0.41% annual return
$0
$1,000
$2,000
$3,000
$4,000
$5,000
Source: Ned Davis Research as of 6/30/12. Performance is historical and does not guarantee future results. Returns are based on the monthly equal-weighted geometric average of total returns of S&P 500 Equal Weight Index component stocks with components reconstituted monthly. The index returned a cumulative 1,407% and an average annual 6.93% from 1/31/72 to 6/30/12. Index returns assume reinvestment of all distributions and do not reflect any fees or expenses. It is not possible to invest directly in an index. See page 19 for index definitions.
FIGURE 6: U.S. DIVIDEND GROWERS AND DIVIDEND PAYERS HAVE GENERATED LONG-TERM VALUE (growth of $100 in S&P 500 Equal Weight Index stocks, 1/31/72–6/30/12)
U.S. dividend-growing stocks have generated value, returning a cumulative 3,786% from 1/31/72 through 6/30/12.

GLOBAL EQUITIES WHITE PAPER I AUGUST 2012
Dividends: the case for income-oriented investors » 7
In contrast, many other sectors in other regions provide
attractive yields, such as financials in developed Europe
and information technology in emerging Europe. It is
interesting to note that the region with the highest dividend
yield varies by sector, but North America does not have the
highest yield for any of the sectors. (See Figure 8.)
While investors in developed markets often have a certain
appreciation for dividends, this is not the case with most of
them when it comes to emerging markets. Investors with
relative high risk appetites tend to focus more on capital
appreciation than income within the emerging-market
universe. However, they may want to consider dividends, as
income is generally more secure than capital appreciation.
As Figure 9 illustrates, over the past 10 years, dividends have
contributed 19.4% to total returns in emerging markets.
On the other hand, risk-averse investors may consider
emerging-market equity investments relatively risky. While
the returns earned on well diversified and well structured
portfolios in past years may not necessarily support this
view, investors who consider emerging-market equity
investments too risky but don’t want to miss out on the
upside potential of fast-growing markets and companies
may want to consider combining emerging markets
with dividend income. Fast-growing companies can also
pay high dividends, and high dividends may provide a
measure of downside protection in volatile equity markets.
Thus, risk-averse investors who are attracted to potential
dividends do not have to forgo growth opportunities.
1.4. DIVIDENDS: A GLOBAL OPPORTUNITY
The importance of dividends is not just a U.S. phenomenon;
combining dividend yield and real dividend growth in different
regions shows a similar pattern to that of the United States.
In our opinion, dividends often matter even more when
investing globally. In certain developed European markets,
for example, nearly 100% of total returns have come from
dividends because change in valuation has been slightly
negative, according to GMO, a privately held global
investment management firm.
The importance of dividends to overseas stock markets
has resulted in a culture of strong dividend policies, so the
international equity markets also provide a broader universe
of high dividend yielding stocks: While there were 129 U.S.
stocks with a dividend yield greater than 5% as of 6/30/12,
there were 996 non-U.S. stocks that met that criteria, accord-
ing to Morningstar. Thus, we believe investors may want
to consider the vast opportunities available via international
stock markets when implementing a dividend strategy.
As depicted in Figure 7, all regional stock markets outside
of North America, developed and emerging, have offered
higher dividend yields as of 6/30/12. Currently, the average
dividend yield of developed Europe is more than double
the average dividend yield of North America.
Finally, an international or global portfolio may also
improve a portfolio’s diversification by sector. Many of the
highest-yielding U.S. stocks tend to be concentrated in
a few sectors, such as utilities and telecommunications.
Source: FactSet as of 6/30/12. Performance is historical and does not guarantee future results. Regions are MSCI regions. Diversification can neither ensure a profit nor protect against a loss.
FIGURE 7: AVERAGE REGIONAL DIVIDEND YIELD
0%
2%
4%
6%
Developed Europe
EmergingEurope
DevelopedAsia
EmergingAsia
Latin America North America
4.1% 4.0% 2.9% 2.8% 2.3% 1.8%

8 » Dividends: the case for income-oriented investors
GLOBAL EQUITIES WHITE PAPER I AUGUST 2012
Source: FactSet as of 6/30/12. Performance is historical and does not guarantee future results. Sectors are MSCI/S&P sectors. Regions are MSCI regions. Yellow boxes denote highest regional dividend yield per global sector. Diversification can neither ensure a profit nor protect against a loss.
Sector Developed Asia
Developed Europe
Developed North America
Emerging Asia
Emerging Europe
Latin America
Consumer discretionary 2.4% 3.8% 1.4% 2.3% 3.0% 1.6%
Consumer staples 2.7% 2.8% 2.5% 2.1% 1.7% 1.3%
Energy 3.2% 3.8% 1.1% 3.3% 3.7% 0.4%
Financials 3.5% 4.8% 2.6% 2.7% 3.2% 2.1%
Health care 2.8% 2.5% 1.0% 1.2% 1.8% 2.2%
Industrials 2.7% 3.6% 1.9% 2.5% 2.8% 1.8%
Information technology 2.2% 2.6% 1.1% 3.4% 4.5% 3.7%
Materials 3.1% 3.0% 2.0% 3.3% 4.1% 1.8%
Telecommunication services 4.9% 8.8% 3.4% 3.7% 11.0% 5.6%
Utilities 4.1% 6.1% 3.7% 2.0% 3.5% 3.9%
Regional average 2.9% 4.1% 1.8% 2.8% 4.0% 2.3%
FIGURE 8: GOING GLOBAL MAY INCREASE DIVIDENDS
Source: Bloomberg as of 6/30/12. Performance is historical and does not guarantee future results. Index returns assume reinvestment of all distributions and do not reflect fees or expenses. It is not possible to invest directly in an index. See page 19 for index definitions.
FIGURE 9: HISTORIC DIVIDEND AND CAPITAL RETURNS IN EMERGING MARKETS (10 YEARS ENDING 6/30/12)
Annualized capital appreciation
Annualized dividend returns
Annualized total returns
Dividends as % of total return
MSCI Emerging Markets Index 11.35% 2.73% 14.08% 19.4%
GLOBAL EQUITIES WHITE PAPER I AUGUST 2012
Dividends: the case for income-oriented investors » 9
1.5. SUSTAINABILITY OF DIVIDENDS
In sports there is a saying that “offense wins games;
defense wins championships.” We believe this also holds
true for dividend-investing strategies as well.
It is often suggested that by following an income-focused
strategy, investors may suffer because they are investing
only in companies that have low or no growth potential. The
thinking is that dividend-yielding companies are distributing
such large amounts of their cash flow as dividends or
buybacks that they can’t retain sufficient cash for future
growth projects. We believe this argument is flawed. In our
opinion, exposure to companies that are capable of growing
their free cash flows and are trading at reasonable (growth-
adjusted) prices is a sound strategy.
However, when discussing dividend-investing strategies,
it is important to balance all relevant factors. We believe a
successful long-term dividend strategy must get the most
from dividends. Of course, income is important, but we
are cautious about being overexposed to dividend yield.
As illustrated previously in figure 6, investing in companies
that are growing their dividends has historically been a
winning strategy, while investing in companies that pay no
dividends has led to less favorable results. But an additional
factor that must be considered is if the dividend that a
company is paying is sustainable. If it is not, you could end
up owning a stock that falls in the “dividend-cutters” camp.
Dividends are paid from a company’s cash flow, not its
operating earnings. While on the surface this may seem
like a trivial distinction, it actually says quite a bit about
the types of firms that pay dividends. Companies often
manipulate earnings with accounting rules, which allows
some discretion regarding earnings numbers. This can lead
to distorted views of a company’s success, and can make
it appear that struggling firms are actually producing strong
results. In contrast, cash flows do not allow the reporting
discretion of earnings. If a company has more cash going
out than coming in, this is clear in the company’s cash
flow statement. Dividends are paid in cash, so a company
that has paid a consistent dividend over time likely has a
steady stream of incoming cash. Therefore, dividend-paying
companies most likely have solid business models that
may allow them to navigate down markets more easily.
Monitoring a firm’s cash flows will give an investor a strong
indication or whether or not the dividend is sustainable.
Obviously, if firms have negative cash flows but are paying
a dividend anyway, they should be regarded cautiously.
Another important factor to consider regarding dividend
sustainability is a company’s dividend payout ratio, which is
the fraction of net income a firm pays to its shareholders in
dividends. While high dividends are important, if a company
is paying out nearly all of its earnings in dividends, this
may be a sign that the dividend is not sustainable. Also, a
dividend payout ratio that increases over time may indicate
that earnings growth is not keeping up with dividend
growth and the dividend may not be sustainable. However,
companies with strong cash flows and low to moderate
dividend payout ratios may have room to grow the dividend
and also tend to exhibit positive price appreciation.
In a 2003 study published in the CFA Institute’s Financial
Analyst Journal, “Surprise! Higher Dividend = Higher Earnings
Growth,” Robert D. Arnott and Clifford S. Asness argue that
contrary to financial theory, empirical evidence suggests that
companies with high dividend payout ratios have achieved
higher earnings growth than companies with lower payout
ratios. Dividend-paying companies have typically been
viewed as fundamentally strong companies with potentially
slower growth prospects. In essence, the company believes
that paying out dividends will add more value to shareholders
than utilizing cash for new projects. In contrast, non-dividend-
paying companies have traditionally been viewed as higher-
growth companies that can increase shareholder value by
retaining earnings to reinvest in new projects or grow through
mergers and acquisitions. Arnott and Asness concluded that
the higher earnings growth experienced by dividend-paying
companies most likely reflects better allocation of capital.
High dividend payout ratios impose discipline on corporate
management teams to only invest in those projects with the
best chance of adding value, while low dividend payout ratios
may lead to inefficient empire-building in which companies
fund less-than-ideal projects or investments.

10 » Dividends: the case for income-oriented investors
GLOBAL EQUITIES WHITE PAPER I AUGUST 2012
1.6. DIVIDENDS AS INFLATION
OR DEFLATION HEDGE?
Many investors believe we are on the path to a great
inflation spike driven by reckless printing of money by the
world’s central banks. We would therefore like to discuss
the influence of inflation on stocks, especially on high-
dividend-paying stocks.
Historical data shows that equities have generally
performed best when inflation, as represented by the
Consumer Price Index (CPI), has ranged from –3% to
3%. (See Figure 10.) At the extremes, equities have
tended to perform poorly (which is mainly caused by
a compression of price-to-earnings (P/E) ratios, as we
show later in Figure 11).
If we look at growth of equity prices, earnings, dividends
and P/E ratios in different inflationary backdrops, we see
that dividends have tended to grow more than equity
prices in inflationary periods. This is due to the fact that
they are affected by nominal variables and get a lift from
Source: JPMorgan as of June 2009. Performance is historical and does not guarantee future results. Index returns assume reinvestment of all distributions and do not reflect fees or expenses. It is not possible to invest directly in an index. See page 19 for index definitions.
Year-over-year CPI growth % time occurred Year-over-year S&P 500 Index growth
–15% to –10% 3% –0.9%
–10% to –3% 12% 1.9%
–3% to 0% 9% 15.4%
0% to 1.5% 15% 7.7%
1.5% to 3% 21% 10.7%
3% to 5% 17% 2.4%
5% to 8% 14% 0.3%
8% to 15% 7% 5.6%
15%-plus 3% –6.3%
FIGURE 10: AVERAGE ANNUAL S&P 500 PERFORMANCE IN DIFFERENT INFLATION REGIMES (1872–2009)
rising inflation, but do not suffer the same declines
as P/E ratios, which is normally the result of rising
bond yields, which most equities endure. As Figure 11
indicates, dividends continued to grow during periods
of high inflation.
As global growth is likely to fall back to trend following
one of the most severe financial crises in history, a serious
risk exists for the developed world to fall into a Japan-like
deflation. Although we don’t expect to see deflation, it is
a serious risk that one should consider hedging against—
because while equities do not like high inflation, they do
not like deflation, either.
The first way in which deflation affects stocks is corporate
profitability. When interest rates are near zero, a drop in
expected inflation causes real interest rates to rise and
increases the cost of capital, which in turn hurts corporate
profitability. Consumers and companies respond to the
increase in real interest rates by reducing spending, which
in turn hurts growth.

GLOBAL EQUITIES WHITE PAPER I AUGUST 2012
Dividends: the case for income-oriented investors » 11
Source: JPMorgan as of June 2009. Performance is historical and does not guarantee future results. Index returns assume reinvestment of all distributions and do not reflect fees or expenses. It is not possible to invest directly in an index. See page 19 for index definitions.
FIGURE 11: EQUITY PERFORMANCE IN PERIODS OF HIGH INFLATION (>5%)
Inflation period S&P 500 Index return Earnings growth Dividend growth P/E ratio growth
May 1872 to November 1872 –4% 4% 9% –8%
October 1879 to September 1880 23% 28% 26% –4%
August 1881 to August 1882 –3% –6% 8% 3%
January 1893 to June 1893 –16% –15% 2% –2%
June 1899 to August 1900 –4% 19% 32% –19%
April 1902 to March 1903 –1% 14% 4% –13%
October 1906 to October 1907 –34% –8% 13% –28%
February 1909 to July 1910 –5% 25% 13% –24%
April 1912 to February 1913 –4% 11% 2% –13%
March 1916 to November 1920 –19% –18% 13% –1%
August 1941 to September 1943 17% –4% –13% 22%
July 1946 to October 1948 –13% 155% 31% –66%
December 1950 to December 1951 18% –13% –1% 35%
March 1969 to January 1971 –8% –11% 1% 4%
April 1973 to October 1982 18% 95% 116% –39%
August 1990 to February 1991 1% –2% 3% 3%
Median –4% 1% 9% –6%
In addition, wage rigidities mean that deflation reduces
output prices by more than input prices and puts
additional pressure on corporate profitability. The
Japanese experience of the 1990s provides an example
of the erosion in corporate margins in a deflationary
environment. Overall, equities have delivered subdued
returns in these instances, with earnings and dividends
performing particularly poorly.
However, companies with strong pricing power, long-
duration asset bases, unleveraged balance sheets and
strong earnings momentum have performed well in
deflationary environments. Cyclical stocks have tended
to perform poorly compared to defensive stocks during
periods of falling bond yields. Therefore, defensive,
bond-like sectors such as telecommunications, consumer
staples and health care may be preferable, as well as
high-dividend-paying stocks.
Last but not least, investors may want to remember that
deflation fears could turn into inflation risks very suddenly.

12 » Dividends: the case for income-oriented investors
GLOBAL EQUITIES WHITE PAPER I AUGUST 2012
2.1. SLOW GROWTH IN DEVELOPED
MARKETS INCREASES ATTRACTIVENESS OF
DIVIDENDS
The world has changed dramatically for investors, with the
subprime crisis, stimulus packages, ultra-loose monetary
policy and European sovereign debt crisis dominating
discussions. It feels as if we are living in a bipolar world.
(See Figure 12.)
How does this influence the big picture going forward?
Emerging-market countries continue to deliver structurally
better economic growth prospects than developed-market
countries. Therefore, monetary policies around the globe
differ remarkably. In our opinion, loose (or what some
would call ultra-loose) monetary policies of the United
States, Japan, the United Kingdom and the European
Union will likely continue, while tighter monetary
conditions will persist in the emerging markets. This is
partially due to differing outlooks on consumer prices.
2 I Potential buy signals for equities in times of low bond yields
FIGURE 12: DOES A LOW-GROWTH WORLD EQUAL A LOW-RETURN WORLD?
Signs of higher inflation clearly exist in the emerging
markets, primarily as a result of commodity prices and
the heavy weight they hold in price indices. But in the
developed markets, there is a danger of deflation, or at
least strong disinflation. This also reaches into currency
markets, as emerging-market currencies are believed to
be undervalued and are expected to appreciate relative to
their peers in the developed markets. Last but not least,
investors are more than worried about sovereign debt
in the developed markets, especially in the Eurozone,
and the debt problem should not be ignored in the
United States, Japan or the United Kingdom. In contrast,
sovereign debt and budget deficits are not a problem in
the emerging markets, as it appears that emerging-market
countries learned their lessons well during the Asian crisis.
With governments and central banks around the globe
attempting to repair defective credit markets and prevent
recession, yields on most asset classes have changed
significantly. Most notably, interest payments on various
fixed-income instruments have fallen precipitously. In the
United States, the only time 10-year bond yields were
lower than they were during periods in 2010, 2011 and
2012 was in the 1940s (according to according to Bank of
America Merrill Lynch using data dating back to 1800).
High (structural) growthLow sovereign debtStrong currenciesIncreasing inflation
Emerging markets
Low (structural) growthHigh sovereign debtWeak currenciesIncreasing deflation
Advanced markets

GLOBAL EQUITIES WHITE PAPER I AUGUST 2012
Dividends: the case for income-oriented investors » 13
The strong demand for government bonds likely reflects
five factors: fear of a double-dip recession, fear of
deflation, extreme liquidity levels in the global financial
system, high risk aversion and short-term investors buying
bonds in anticipation of more quantitative easing, primarily
from the U.S. Federal Reserve Board (Fed). However, for
this last factor, we must consider that these investors are
buying bonds for capital gains rather than income. If the
growth outlook improves, all of these factors may prove
transitory and yields could rise.
Due to structural effects (such as de-leveraging) that
resulted from the financial crisis, yields could remain low
for longer, especially in real terms. Post-crisis adjustment
processes have previously shown that these adjustments
often take time and that deleveraging is typically coupled
with subdued economic growth. Also, when thinking about
long-term growth prospects in the developed markets,
we must consider that many countries are facing severe
structural debt problems and huge demographic shifts.
Not only have government bond yields fallen significantly,
but so have corporate bond yields. Appetite for yield has
been so great that investors have entered virtually any
fixed-income asset class that offers higher yields. Credit
spreads have tightened significantly as yield-hungry
investors have chosen to take on credit exposure. Credit
yields are usually higher than dividend yields in a growing
economy, as coupons are fixed while dividends grow.
So, a negative yield differential implies that the market
anticipates dividends will be cut over time. As long as
dividend streams are sustainable, as we believe they
will be, investors may want to consider equity dividends
instead of bond yields.
Given today’s yield environment, equity dividend yields
appear more attractive than bond yields. This is true
regardless of whether we are comparing equity dividend
yields to government bond yields or investment-grade
corporate bond yields. While some fixed-income asset
classes offer higher yields, such as emerging-market
bonds or high-yield bonds, the risk-return profile of
these assets is more comparable to equities than to
conventional bonds.
Are dividend yields attractive in current and expected
capital market conditions? We believe they are, because
it appears a tug of war is taking place between debtors
(who have high expected return rates) and creditors
(who are simply seeking the highest and most secure yields
available). The longer interest rates stay low, the more
investors will come under pressure to generate an adequate
return. Thus, since there is little opportunity within fixed
income, we believe many investors will have to turn to
equities—namely, stocks with high dividend yields.

14 » Dividends: the case for income-oriented investors
GLOBAL EQUITIES WHITE PAPER I AUGUST 2012
2.2. POTENTIAL BUY SIGNAL: FLOWS
After two major equity bear markets over the past 10 years, investors have flooded into the perceived safety of fixed-
income products. Net flows into fixed-income funds outpaced net flows into equity funds for nine consecutive quarters
from the third quarter of 2008 through the third quarter of 2010, resulting in a total flow imbalance of nearly $600 billion.
The last time bonds drew in greater net flows relative to equities for nine consecutive quarters was during the recession
of the early 1990s, as highlighted in Figure 13.
FIGURE 13: FLOWS INTO EQUITIES AND FIXED INCOME, IN BILLIONS (Q2 1990 TO Q3 2010)
Source: Simfunds as of 6/30/12.
By the fall of 2010, this flight to safety, combined with expectations that the Fed will maintain low rates for an extended
period of time, had pushed the yield on the 10-Year U.S. Treasury bonds below 2.5% for the first time since 1954,
according to DeAM.
The conclusion of the previous period of robust bond flows (the third quarter of 1992 to the third quarter of 1993)
proved to be a compelling entry point for stock investors, as the MSCI World Index returned 20.24% over the one-year
period, 47.95% over the three-year period and 108.73% over the five-year period on a cumulative basis, according to
Morningstar as of 6/30/12. Of course, past performance does not guarantee future results.
–$90
–$60
–$30
$0
$30
$60
$90
$120
$150
Fixed-income flowsEquity flows
Q2
1990
Q2
1992
Q2
1994
Q2
1996
Q2
1998
Q2
2000
Q2
2002
Q2
2004
Q2
2006
Q2
2008
Q3
2010
Q2
2010

GLOBAL EQUITIES WHITE PAPER I AUGUST 2012
Dividends: the case for income-oriented investors » 15
Source: DeAM as of 6/30/12. Performance is historical and does not guarantee future results. Yield spread refers to the 10-year U.S. Treasury bond yield minus the S&P 500 Index average dividend yield. Fixed-income investments are subject to interest-rate risk, and their value will decline as interest rates rise. The values of equity investments are more volatile than those of other securities. This data is for illustrative purposes and does not represent any DWS fund. Index returns assume reinvestment of all distributions and do not reflect fees or expenses. It is not possible to invest directly in an index. See page 19 for index definitions.
FIGURE 14: DIFFERENCE BETWEEN 10-YEAR U.S. TREASURY BOND YIELD AND S&P 500 INDEX DIVIDEND YIELD (4/30/53–6/30/12)
2.3. POTENTIAL BUY SIGNAL: EQUITY
YIELDS VS. GOVERNMENT BOND YIELDS
We believe equities, especially dividend-paying equities,
appear attractive relative to bonds. Yields on a number of
fixed-income investments, particularly government bonds,
have fallen recently. Typically, government bond yields
exceed the dividend yield of equities. In fact, dating back
to 1953, the earliest records kept by the Fed, the median
spread between the yield of the 10-year U.S. Treasury
bond and the dividend yield of the S&P 500 Index was
326 basis points. However, as of August 10, 2011, the
yield of the 10-year U.S. Treasury bond dipped below
the dividend yield of the S&P 500 Index. Historically, a
convergence between U.S. Treasury yields and equity
yields has been a robust buy signal for equities. Since
1953, U.S. stocks have returned an average 23.53% over
the one-year period following a yield convergence to
50 basis points or less. (See Figure 14.)
An additional factor that must be considered is the
duration risk that exists in bonds. Since 1981, when the
10-year U.S. Treasury bond rate has exceeded 15%, we
have been in a decreasing-interest-rate environment. This
has led to a nearly 30-year bull market in bonds. Now we
face a much different situation: There is little room for
interest rates to move lower, and we believe we could
see interest-rate increases over the next several years.
Since bond prices have an inverse relationship with
interest rates, this could have a devastating effect on bond
prices. For yield-hungry investors, this makes dividend-
paying stocks all the more attractive, as stocks don’t have
duration risk. The perceived safety of bonds has been
based, in part, on a favorable interest rate environment.
When we factor in the duration risk, equities suddenly
don’t look much riskier than bonds. This should only
increase the crossover effect that we anticipate seeing.
Average one-year return following
Best one-year return following
Worst one-year return following
When spread is less than 50 bps 23.53% 53.62% –10.78%
–4%
–2%
0%
2%
4%
6%
8%
10%
7/1953 7/1963 7/1973 7/1983 7/1993 7/2003 6/2012
Median spread3.22%
Potential buy signal spread0.50%
Yields as of 6/30/12S&P 500 Index=2.21%
10-year U.S. Treasury bond=1.67%
16 » Dividends: the case for income-oriented investors
GLOBAL EQUITIES WHITE PAPER I AUGUST 2012
0 5 10 15 20 25 30 4035
Consumer staples
Financials
Utilities
Industrials
Consumer discretionary
Health care
Information technology
Energy
Telecommunications
Materials
36
33
32
30
22
17
15
11
10
4
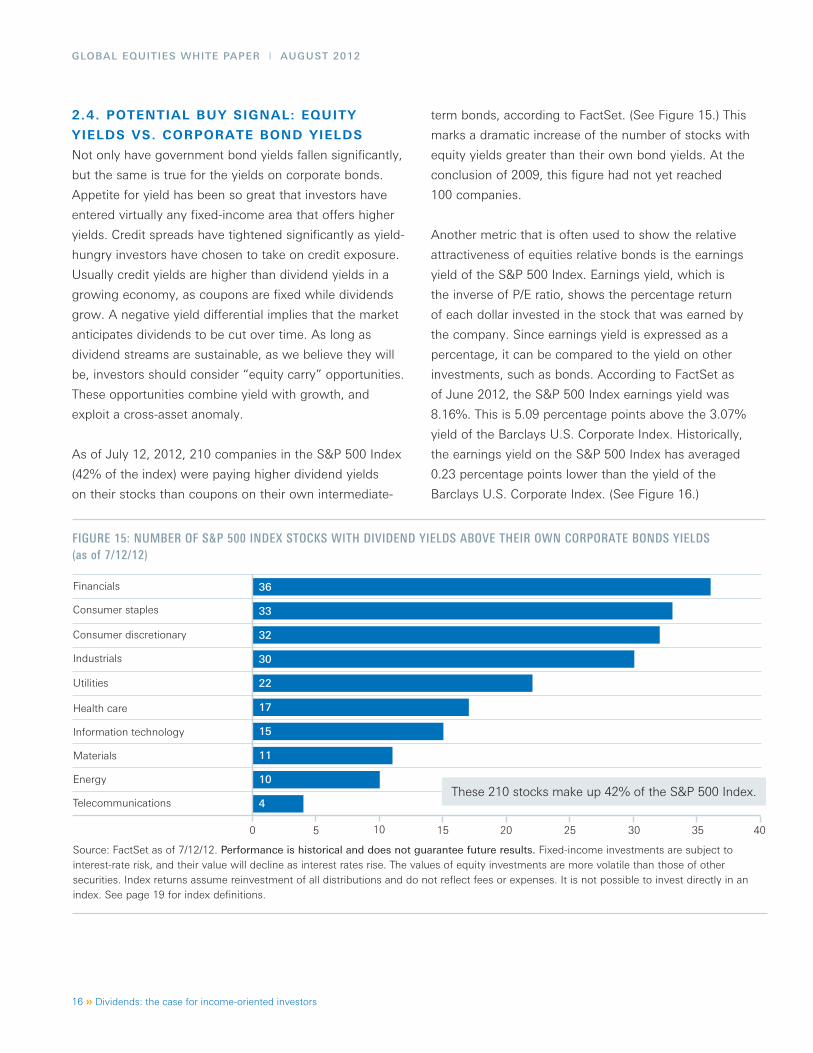
Source: FactSet as of 7/12/12. Performance is historical and does not guarantee future results. Fixed-income investments are subject to interest-rate risk, and their value will decline as interest rates rise. The values of equity investments are more volatile than those of other securities. Index returns assume reinvestment of all distributions and do not reflect fees or expenses. It is not possible to invest directly in an index. See page 19 for index definitions.
FIGURE 15: NUMBER OF S&P 500 INDEX STOCKS WITH DIVIDEND YIELDS ABOVE THEIR OWN CORPORATE BONDS YIELDS (as of 7/12/12)
2.4. POTENTIAL BUY SIGNAL: EQUITY
YIELDS VS. CORPORATE BOND YIELDS
Not only have government bond yields fallen significantly,
but the same is true for the yields on corporate bonds.
Appetite for yield has been so great that investors have
entered virtually any fixed-income area that offers higher
yields. Credit spreads have tightened significantly as yield-
hungry investors have chosen to take on credit exposure.
Usually credit yields are higher than dividend yields in a
growing economy, as coupons are fixed while dividends
grow. A negative yield differential implies that the market
anticipates dividends to be cut over time. As long as
dividend streams are sustainable, as we believe they will
be, investors should consider “equity carry” opportunities.
These opportunities combine yield with growth, and
exploit a cross-asset anomaly.
As of July 12, 2012, 210 companies in the S&P 500 Index
(42% of the index) were paying higher dividend yields
on their stocks than coupons on their own intermediate-
term bonds, according to FactSet. (See Figure 15.) This
marks a dramatic increase of the number of stocks with
equity yields greater than their own bond yields. At the
conclusion of 2009, this figure had not yet reached
100 companies.
Another metric that is often used to show the relative
attractiveness of equities relative bonds is the earnings
yield of the S&P 500 Index. Earnings yield, which is
the inverse of P/E ratio, shows the percentage return
of each dollar invested in the stock that was earned by
the company. Since earnings yield is expressed as a
percentage, it can be compared to the yield on other
investments, such as bonds. According to FactSet as
of June 2012, the S&P 500 Index earnings yield was
8.16%. This is 5.09 percentage points above the 3.07%
yield of the Barclays U.S. Corporate Index. Historically,
the earnings yield on the S&P 500 Index has averaged
0.23 percentage points lower than the yield of the
Barclays U.S. Corporate Index. (See Figure 16.)
These 210 stocks make up 42% of the S&P 500 Index.

GLOBAL EQUITIES WHITE PAPER I AUGUST 2012
Dividends: the case for income-oriented investors » 17
Source: FactSet as of 6/30/12. Performance is historical and does not guarantee future results. Fixed-income investments are subject to interest-rate risk, and their value will decline as interest rates rise. The values of equity investments are more volatile than those of other securities. Index returns assume reinvestment of all distributions and do not reflect fees or expenses. It is not possible to invest directly in an index. See page 19 for index definitions.
FIGURE 16: EQUITIES ARE HISTORICALLY ATTRACTIVE VS. CORPORATE BOND YIELDS (9/1/87–6/30/12)
1987 1989 1991 1993 1995 1997 1999 2001 2003 2005 2007 2009 06/122011
S&P 500 Index earnings yield
S&P 500 Index earnings yield minus Barclays U.S. Corporate Index yield
Barclays U.S. Corporate Index yield to worst
Average S&P 500 Index earnings yield minus Barclays U.S. Corporate Index yield
–6%
–4%
–2%
0%
2%
4%
6%
8%
10%
12%
14%

18 » Dividends: the case for income-oriented investors
GLOBAL EQUITIES WHITE PAPER I AUGUST 2012
In this white paper, we have explored the implications
of corporate dividend policies, the attributes of dividend-
paying and non-dividend-paying stocks, equity dividend
yields relative to fixed-income yields and global
dividend-investing opportunities.
We believe that dividend yields are attractive in the
current capital market environment because it appears
a tug of war is taking place between debtors (who have
high expected return rates) and creditors (who are simply
seeking the highest and most secure yields available).
The longer interest rates stay low, the more investors will
come under pressure to generate an adequate return.
Given this backdrop of extremely low fixed-income yields,
we believe there is a strong potential for “crossover” buyers
to enter the equity markets. In other words, investors who
have historically sought the perceived safety and steady
income of bonds may be drawn into equities.
3 I Conclusion Yields on government and corporate bonds are so low
that dividends, in many cases, offer more income than
bonds. As we have noted, almost half of S&P 500 Index
companies currently pay a dividend that exceeds the yield
on their intermediate-term corporate bond. This means
equity holders not only have the opportunity to benefit
from price appreciation; they are also receiving more
income than bond holders.
At a time when many analysts believe that equity prices
are attractive, it makes sense to think that investors who
would typically flock to bonds might be attracted to
dividend-paying stocks.
In addition, many of these investors have seen significant
deterioration of their portfolios in recent years. While they
might be hesitant to enter the equity markets, they might
also realize that they need to be in stocks if they have any
hope of regaining their wealth.
Thus, in our opinion, many investors will have to turn to
equities—namely, stocks with high dividend yields—and
this will lead dividend-paying stocks to re-emerge as an
important component of investors’ portfolios.

GLOBAL EQUITIES WHITE PAPER I AUGUST 2012
Dividends: the case for income-oriented investors » 19
INDEX DEFINITIONS
The Barclays Capital U.S. Corporate Index tracks the performance of the investment-grade, fixed-rate, taxable,
corporate bond market.
One basis point equals 1/100 of a percentage point.
Credit spread refers to the excess yield various bond sectors offer over Treasuries with similar maturities. When spreads
widen, yield differences are increasing between bonds in the two sectors being compared. When spreads narrow,
the opposite is true.
Duration, which is expressed in years, measures the sensitivity of the price of a bond or bond fund to a change in
interest rates.
The MSCI Emerging Markets Equity Index tracks the performance of stocks in select emerging markets.
Price-to-earnings ratio (P/E) ratio compares a company’s current share price to its per-share earnings.
The S&P 500 Equal Weight Index is the equally-weighted version of the S&P 500 Index, which is capitalization-
weighted; the index has the same constituents as the S&P 500 Index, but each company is allocated a fixed weight of
0.20%, rebalanced quarterly.
The S&P 500 Index tracks the performance of 500 leading U.S. stocks and is widely considered representative
of the U.S. equity market.
The yield curve is a graphical representation of how yields on bonds of different maturities compare. Normally, yield
curves slant up, as bonds with longer maturities typically offer higher yields than short-term bonds.
Yield to worst is the lowest potential yield that can be received on a bond without the issuer actually defaulting. The
opinions and forecasts expressed herein by the authors do not necessarily reflect those of DWS Investments, are as of
9/1/11 and may not come to pass.

© 2012 DWS Investments Distributors, Inc. All rights reserved. PM123918 R-19781-2 (8/12) DIV-WHITE
OBTAIN A PROSPECTUS To obtain a summary prospectus, if available, or prospectus, download one from www.dws-investments.com, talk to your financial representative or call (800) 621-1048. We advise you to carefully consider the product’s objectives, risks, charges and expenses before investing. The summary prospectus and prospectus contain this and other important information about the investment product. Please read the prospectus carefully before you invest.
IMPORTANT RISK INFORMATIONAny fund that concentrates in a particular segment of the market will generally be more volatile than a fund that invests more broadly. The fund may use derivatives, including as part of its global alpha strategy. Investing in derivatives entails special risks relating to liquidity, leverage and credit that may reduce returns and/or increase volatility. Investing in foreign securities, particularly those of emerging markets, presents certain risks, such as currency fluctuations, political and economic changes, and market risks. Dividends are not guaranteed. The fund lends securities to approved institutions. Any decline in value of a portfolio security that is out on loan by the fund will adversely affect performance. Financial failure of the borrower may mean a delay in recovery or loss of rights in the collateral. Stocks may decline in value. See the prospectus for details.
Investment products offered throughDWS Investments Distributors, Inc. Advisory services offered through Deutsche InvestmentManagement Americas, Inc.
The opinions and forecasts expressed herein by the fund managers and product specialist do not necessarily reflect those of
DWS Investments, are as of 6/30/12 and may not come to pass.
C000000
DWS Investments is part of Deutsche Bank’s Asset Management division and, within the U.S., represents the retail asset management activities of Deutsche Bank AG, Deutsche Bank Trust Company Americas, Deutsche Investment Management Americas Inc. and DWS Trust Company.
DWS Investments Distributors, Inc.222 South Riverside Plaza Chicago, IL 60606-5808www.dws-investments.com [email protected] (800) 621-1148