diving into dark pools seminar/fall 2011...diving into dark pools * sabrina buti † barbara rindi...
TRANSCRIPT

Diving Into Dark Pools*
Sabrina Buti
†
Barbara Rindi
‡
and
Ingrid M. Werner§
Fisher College of Business The Ohio State University
Date: November 1, 2011
*We are grateful to SIFMA for assisting us in collecting the Dark Pool share volume data that forms the basis for this study. We also want to thank Jamie Selway for making this study possible, Kewei Hou for helpful comments on the empirical design, and participants at the Hong Kong University of Science and Technology Symposium, the Notre Dame Conference on Current Topics in Financial Regulation, and the University of Cyprus academic conference for comments. † Rotman School of Management, University of Toronto, [email protected] ‡ Bocconi University and IGIER, [email protected] § Fisher College of Business, The Ohio State University, [email protected]

Diving Into Dark Pools
ABSTRACT
This paper examines unique data on dark pool activity for a large cross-section of US stocks in
2009. Dark pool activity is concentrated in liquid stocks. Nasdaq (AMEX) stocks have significantly higher
(lower) dark pool activity than NYSE stocks controlling for liquidity. For a given stock, dark pool activity
is significantly higher on days with high share volume, high depth, low intraday volatility, low order
imbalances relative to share volume, and low absolute returns. Results show that increased dark pool
activity improves market quality measures such as spreads, depth, and short-term volatility. The
relationship between dark pool activity and measures of price-efficiency is more complex.

1
1. INTRODUCTION
There are several reasons for why institutional traders may want to avoid displaying their orders
in the continuous limit order market. Order display invites imitation, potentially reducing the alpha of
the underlying investment strategy. Displayed orders also invite front running and quote matching by
broker-dealers as well as by opportunistic traders, resulting in higher trading costs. Further, traditional
order display is associated with direct broker involvement, generating significant commission costs.
Institutional traders worry about counterparty risk, the risk of trading against informed order flow
especially order flow from proprietary trading desks. Institutional sized orders also face another
problem; average trade and order sizes have fallen dramatically in recent years, making it virtually
impossible to trade in size in the continuous limit order market.
It is therefore not surprising that there is a growing demand for trading venues that make it
possible for institutions to keep their orders secret, offer low commission rates, maximize the chances of
trading with other institutions (as naturals), and allow institutions to trade in size at the mid-quote.
Such non-displayed pools of liquidity have been present in US equity markets for a very long time.
Examples include reserve and hidden orders within exchanges’ and Electronic Communication Networks’
(ECNs) trading systems, floor broker orders and specialist capital on floor-based exchanges, working
orders handled by agency brokers or broker-dealers, dealer capital and stand-alone as well as broker
and exchange/ECN operated crossing networks.1
1 Sofianos (2007).
More recently, non-displayed liquidity pools such as
internalization pools and ping destinations have been added to the list. Nowadays opaque sources of
liquidity are often grouped together under a single label (with unfortunate nefarious connotations): dark
pools.
2
In broad brush terms, dark pools are characterized by limited or no pre-trade transparency,
anonymity, and derivative (almost exclusively mid-quote) pricing. However, they differ in terms of
whether or not they attract order flow through Indications of Interests (IOIs)/advertising and whether or
not they allow interaction with proprietary and black box order flow.2 It is difficult to accurately
measure the amount of volume that is actually matched through dark pools but estimates range from 8-
9% of share volume.3
The SEC has recently openly criticized the impact of dark pools on the price discovery process.
In May, 2009, James Brigagliano, SEC’s Division of Trading and Markets, said dark pools could impair
price discovery by drawing valuable order flow away from the public quoting markets. “To the extent
that desirable order flow is diverted from the public markets, it potentially could adversely affect the
execution quality of those market participants who display their orders in the public markets,” he said.
He added that anything that “significantly detracts from the incentives to display liquidity in the public
markets could decrease that liquidity and, in turn, harm price discovery and worsen short-term
volatility.”
4
SEC Chairman Mary Schapiro announced on June 19th, 2009, that the SEC is “taking a serious
look at what regulatory actions may be warranted” and that she has asked SEC staff to review ways to
“best bring light” to dark pools.
5
2 See Mittal (2009) for a discussion of Dark Pool characteristics.
In testimony before the House Committee on Financial Services’
Subcommittee on Capital Markets, Insurance and Government-Sponsored Enterprises, on July 14, 2009,
Chairman Schapiro further stated: “We have heard concerns that dark pools may lead to lack of
3 Rosenblatt Securities, Inc. started tabulating monthly share volume for Dark Pools of Liquidity in its Trading Talk publication in March 2008 and TABB Group started its Liquidity Matrix publication in April 2007. Efforts to track volume in these venues are problematic due to a lack of uniform Dark Pool reporting standards. 4 Chapman, Peter, SEC Worried About Dark Pools, Traders Magazine, July 2009. 5 David Scheer and Jesse Westbrook, SEC May Force More Disclosure About ‘Dark Pools,’ Schapiro Says, Bloomberg.com, June 19th, 2009.

3
transparency, may result in the development of significant private markets that exclude public investors
(through the use of ‘indications-of-interest’ that function similar to public quotes except with implicit
pricing), and may potentially impair the public price discovery function if they divert a significant
amount of marketable order flow away from the more traditional and transparent markets.”
In its recent Concept Release on Equity Market Structure (SEC, 2010), the SEC raises concerns
about the consequences of a rising dark pool market share on public order execution quality and price
discovery. In Congressional testimony, Dr. Hatheway (Nasdaq OMX) speaks to this issue and argues that
when stocks experience “dark” trading in excess of 40 percent of total volume, execution quality begins
to deteriorate. Weaver (2011) studies broader measures of market fragmentation and also argues that
dark trading is associated with a reduction in market quality. In contrast O’Hara and Ye (2011) find that
fragmentation of trading generally reduces transactions costs and increases execution speed. These
contradictory results are not surprising as the researchers rely on very imprecise proxies for dark
trading. The O’Hara and Ye (2011) study focuses on the effect of fragmentation on market quality
during 2008 and uses volume reported to the Trade Reporting Facilities (TRFs) as a proxy without even
netting out fully transparent venues such as BATS and DirectEdge. The same strategy is used by Weaver
(2011), but his sample is more recent, from October 2009. The Nasdaq OMX study uses TRF volume
minus BATS and DirectEdge as a proxy for dark pools, but this data still includes internalized order flow.
To better inform the regulatory debate, we use more granular data to empirically assess the
relationship between dark pools on market quality and price discovery. Specifically, the Securities
Industry and Financial Market Association (SIFMA) solicited daily stock-level dark pool share volume
data for the 2009 calendar year from all their members operating dark pools. The reporting was
completely voluntary, and in the end SIFMA collected data on daily single-counted share volume from

4
eleven dark pools on our behalf. The data is anonymous, and no attempt to study the data by individual
dark pools will be made.
This study will focus on answering three questions:
1. How does dark pool market share vary across stocks and time?
2. Is Dark Pool activity associated with lower market quality?
3. Is Dark Pool activity associated with impaired price efficiency?
There is very limited empirical evidence on dark pool activity in the cross-section and the time-
series. A few studies have focused on crossing networks. Gresse (2006) finds that crossing networks
have a very limited market share and do not have a detrimental effect on the liquidity of the continuous
market. Conrad, Johnson, and Wahal (2003) find that institutional orders executed in crossing networks
have significantly lower realized execution costs and that traders use the continuous market to trade
their exhaust. Naes and Odegaard (2006) find that institutional orders sent first to crossing networks
and then to the continuous market obtain lower realized execution costs for the crossed component,
but not necessarily for the entire order. Fong, Madhavan, and Swan (2004) find no evidence of a
liquidity drain away from the continuous market when traders can trade in a crossing network. Ready
(2010) studies monthly volume by stock in three dark pools: Liquidnet, POSIT, and Pipeline during June
2005-September 2007. He finds that the market share of these dark pools is less than one percent of
consolidated volume, and that dark pool volume is concentrated in liquid stocks (low spreads, high share
volume). Two more recent papers by Brandes and Domowitz (2010) and Buchanan et al (2011) study
dark pool trading in Europe and find that increased participation of dark pools is beneficial for price
discovery and that it enhances price discovery process. In contrast, Degryse, de Jong, and van Kervel
(2011) find that fragmentation is beneficial for the liquidity of 52 Dutch stocks as long as trading is
5
transparent, but that opaque trading on the local exchange (dark pools and OTC) has a detrimental
effect on global liquidity.
Our sample has several advantages compared to the Ready (2010) sample: it covers more dark
pools, includes daily share volume data, and is more recent. It also has several advantages relative to
the data used in Degryse, de Jong, and van Kervel (2011) in that we have a much broader sample and
more importantly our dark pool data excludes internalized trades. Nevertheless, several caveats apply.
First of all, the SIFMA dark pool data covers only those eleven dark pools that voluntarily responded to
the data request. According to the SECs 2010 Concept Release on Market Structure, there are
approximately 32 active Dark Pools during our sample period. Hence, our sample of eleven dark pools
captures only roughly 1/3rd of Dark Pools operating in the US equity market. Second, to our knowledge
there is no publicly available data on Dark Pools which makes it difficult to check the SIFMA data for
accuracy. To gauge the coverage of our data, we compare it to monthly data reported by Rosenblatt,
Inc. However, we note that this source is based on a combination of self-reported data and Rosenblatt
estimates. Third, while our data permits a study of both time-series and cross-sectional variation in dark
pool activity for the SIFMA sample of dark pools, we have no way of knowing if these eleven dark pools
represent the same fraction of dark pool activity over stocks and over time. Therefore, we cannot claim
that the variation in dark pool activity within our sample is representative of the entire population of
dark pools. These caveats should all be kept in mind when drawing conclusions based on the SIFMA
data.
We describe our sample construction in Section 2, and provide a univariate analysis of dark pool
activity in Section 3. Descriptive statistics for our explanatory variables are in Section 4. Our analysis of
the dark pool activity in the cross-section and in the time series is in Section 5. In Section 6, we study

6
the relationship between dark pool activity and measures of market quality. Section 7 explores the
relationship between dark pool activity and price efficiency. Section 8 concludes.
2. SAMPLE CONSTRUCTION
We first benchmark the raw SIFMA data against the monthly total share volume in dark pools as
reported by Rosenblatt, Inc. in their monthly Let There Be Light publication. Figure 1 shows that the
SIFMA data mirrors the monthly time series variation in the Rosenblatt share volume pretty closely.
Figure 2 shows that Dark Pool share volume as reported in the SIFMA (Rosenblatt) data represents 3.65
(7.74) percent of consolidated volume in January, and 6.10 (10.15) percent of consolidated volume in
December. Finally, Figure 3 shows that the SIFMA data covers roughly half of the Rosenblatt share
volume. Specifically, the market share of the dark pools submitting data for our study increases from
47% in January to 60% in December.
The raw SIFMA data covers 10,178 unique securities and the coverage by individual Dark Pools
ranges from a low of 5,646 to a high of 8,251 securities. In order to merge the SIFMA data with data
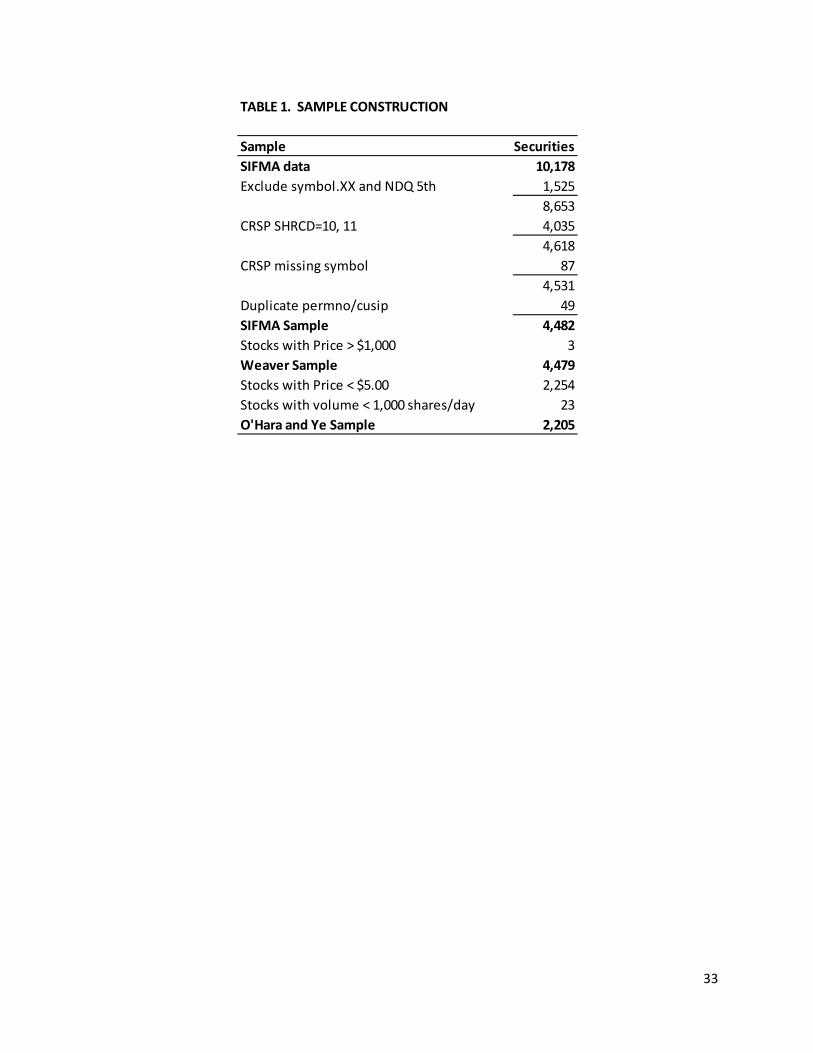
from TAQ, CRSP, etc., we screen the data following standard practice as summarized in Table 1. We first
exclude 1,525 ticker symbols with suffixes (e.g., preferred, warrants, non-voting, etc) and the ticker
symbols with a fifth character (unless also in CRSP as A, B, or K). Second, we exclude 4,035 securities
that are not common stocks (SHRCD 10 or 11) covered by CRSP. As we need to merge CRSP with the
SIFMA data, we also exclude 87 stocks with missing ticker symbols in CRSP and 49 stocks with duplicate
stock identifiers (permno or cusip) for the same ticker symbol. Our SIFMA sample consists of 4,482
stocks with non-zero dark pool volume for at least one day in 2009. Finally, we add the CRSP common
stocks that do not have any SIFMA reported dark pool volume, setting daily dark pool volume to zero.6
6 We also create subsamples that are similar to the samples used by Weaver (2011) and O’Hara and Ye (2011) to benchmark our data against previous samples. Weaver (2011) excludes stocks with price above $1,000 and O’Hara

7
3. UNIVARIATE STATISTICS
To examine the cross-sectional distribution of dark pool activity, we compute dark pool volume
(DPVOL) as the number of shares per stock per day (single-counted) that execute in one of our eleven
dark pools. We also compute the fraction of daily consolidated share volume (VOL) as reported in CRSP
that was executed in one of the dark pools as 100*DPVOL/VOL for every stock in our sample. This
variable will be labeled RELDP. Further, we count the number of different dark pools that are active in a
stock on a given day and call this variable COUNTDP. To get a better sense of the degree of competition
among dark pools, we compute the inverse Herfindahl index (IHERF) based daily stock-level dark pool
market shares. Recall that if the market shares are evenly distributed across dark pools, IHERF will be
equal to COUNTDP. IHERF will be lower than COUNTDP the more concentrated dark pool trading
activity is for a given stock day.
We report the overall results in Table 2, Panel A. Dark pool volume represents on average 4.51
percent of consolidated volume. Dark pool activity is skewed as the median is lower, at 3.05 percent.
On average almost half the SIFMA reporting dark pools (5.27) are active in a stock on any given day.
However, dark pool activity is concentrated based on the inverse of the Herfindahl Index (IHERF=2.43).
Previous research has found significant differences across Nasdaq and NYSE when it comes to
fragmentation. Specifically, fragmentation has been found to be higher for small stocks on Nasdaq by
both O’Hara and Ye (2011) and Weaver (2011). To examine the extent to which the SIFMA sample has a
similar pattern, we compare dark pool activity across primary listing venues in Table 2, Panels B, C, and
D. AMEX/ARCA-listed stocks represent 8% of the stock-day observations, Nasdaq-listed stocks represent
and Ye (2011) exclude stocks with price below $5.00 and with less than 1,000 shares average daily volume. The discussion of these samples and replication of methodologies pursued by previous authors is in the online Appendix.

8
60%, and NYSE-listed stocks 32% of stock-day observations. Dark pool activity is much lower on
AMEX/ARCA with 1.87 percent of consolidated volume on average. In fact, the median stock day in this
subsample has no dark pool activity. Nasdaq dark pool activity is 4.32 percent and NYSE dark pool
activity is 5.49 percent of consolidated volume on average. Again, the distributions are skewed,
particularly on Nasdaq. This is not surprising as the Nasdaq sample includes many low priced stocks.
Recall from Table 1 that 2,254 stocks in the overall sample have a price below $5.00 and these are
mostly listed on Nasdaq. The median NYSE stock has as many as nine out of eleven active dark pools
trading on any given day. However, note that dark pool activity is more concentrated based on the
Inverse Herfindahl Index (IHERF=3.35).
Finally, we subsample based on market capitalization to show how dark pool activity varies with
firm size. We sort stocks on market capitalization based on the number of shares outstanding multiplied
by the closing price from CRSP. SMALL capitalization stocks have market capitalization less than $50
million, MEDIUM capitalization stocks have market capitalization between $50 million and $1 billion,
and LARGE capitalization stocks have market capitalization above $1 billion. These groups represent
23%, 51% and 26% of the stock-days respectively.
In Table 2, Panel E, we find that there is relatively limited dark pool activity for SMALL
capitalization stocks, 1.82 percent of share volume and only 0.97 active dark pools on average. By
contrast, the MEDIUM capitalization category in Panel F has more dark pool activity on average, 5.11
percent, but there is also much more variation across stocks and days. Moreover, there appears to be
more specialization for this group of stocks judging by the distribution of COUNTDP and the IHERF.
Panel G of Table 2 shows that dark pool activity is highest for the LARGE capitalization stocks with an
average RELDP of 5.74 percent. For LARGE capitalization stocks, 75 percent of the stock days have nine
or more active dark pools. In other words, dark pools appear to compete intensively for this group of

9
stocks. However, the dark pool share volume is much more concentrated based on the Inverse
Herfindahl index (median IHERF=3.70).
4. DESCRIPTIVE STATISTICS
Our first goal is to examine both what factors explain the cross-sectional distribution and the
time-series evolution of dark pool activity. To do so, we gather additional information for our sample
stocks from CRSP and from TAQ. We get daily market capitalization, share volume, closing stock price,
intraday price range (defined as (high-low)/high) based on quotes, stock returns and market (S&P 500)
returns from CRSP. We compute daily time-weighted quoted and share-weighted effective spreads, bid
depth at the National Best Bid Offer (NBBO), (bid) depth, (buy) order imbalances (defined as the
absolute value of (buys-sells)/share volume where buys are classified using a modified Lee and Ready
(1991) algorithm),7
We have over one million stock-day observations in the SIFMA sample. The average firm in our
sample has a $2.6 billion market capitalization. The average stock in our sample has a price of 40 dollars
and trades 1.6 million shares per day. The average quoted depth is 124 shares, and the average quoted
spread is 175 basis points or 13 cents. The average effective spread is 41 basis points or 2.6 cents.
and the standard deviation of mid-quote returns from TAQ. Table 3 provides the
descriptive statistics for our SIFMA sample.
5. DETERMINANTS OF DARK POOL ACTIVITY
To better understand how dark pool activity varies with market characteristics, we first sort
stocks every day into quintiles based on a particular market characteristic. We then compute the daily
average dark pool activity, RELDP, and the average number of active dark pools, COUNTDP, for each
quintile portfolio. This gives us 252 daily observations of means for RELDP and COUNTDP for each
7 We classify trades as buys (sells) if the execution price is above (below) the mid-quote in effect at the time of the trade, and use a tick-test to classify trades that execute at the mid-quote.

10
quintile. We test whether RELDP or COUNTDP are higher for the fifth quintile (High) than for the first
quintile (Low) portfolio based on a particular market characteristic using a time-series t-test of the
difference in means. The market characteristics are market capitalization, volume, price, intraday range,
absolute return, spreads, depth, order imbalance, and the standard deviation of mid-quote returns. The
results are in Table 4.
Panel A of Table 4 shows that dark pool activity is higher for the fifth quintile than for the first
quintile based on firm size, volume, and price. Dark pool activity is significantly higher for the low
spread portfolio than for the high spread portfolio. By comparison, the differences across quintile
portfolios based on depth are small and insignificant. Dark pool activity is significantly lower for the high
volatility than for the low volatility portfolio. The results also show that dark pool activity is significantly
lower on days with high order imbalances relative to share volume. This makes sense as the likelihood
of getting an order executed in a dark pools should be lower when the market is one-sided, i.e., when
there is significant buying or selling pressure in the market. Finally, dark pool activity is significantly
lower for stock days with large absolute returns than for stock days with small absolute returns. This is
consistent with the result that dark pool activity is significantly lower for high volatility portfolios.
We report the corresponding results for the number of active dark pools, COUNTDP, by quintile
portfolios in Panel B of Table 4. The results are very similar to those reported for RELDP. Specifically,
more dark pools are active for: large firms, stocks with high share volume, high price, low spreads, and
low volatility. Fewer dark pools are active for stock-days with large relative order imbalances and on
days with large absolute returns.
Our next step is to examine the cross-sectional and time series variation in dark pool activity.
We explore the cross-sectional variation using monthly Fama-Macbeth cross-sectional regressions with
RELDP on the left hand side and a number of stock and market characteristics on the right hand side.

11
The average monthly estimated coefficients and t-statistics are reported in Table 5. The t-statistics are
based on the Newey-West adjusted standard errors.
In our first specification (1), we control for listing exchange by including a dummy variable for
Nasdaq-listing and one for AMEX/ARCA –listing. We also control for the logarithm of market
capitalization. The results show that dark pool activity is increasing in market capitalization and is higher
(lower) for Nasdaq (AMEX) stocks than for NYSE stocks after controlling for market capitalization. In
specification (2) we replace market capitalization with share volume and price, and the results show that
dark pool activity is increasing in share volume and price. In other words, more liquid stocks have more
dark pool activity. We add the quoted spread in cents and the bid depth in specification (3) as added
measures of liquidity and find that stocks with narrower quoted spreads holding listing exchange, share
volume, and price constant have higher dark pool activity. More depth is also associated with more dark
pool volume, but the effect is not significant. We replace quoted spread in cents and price with quoted
spread in basis points in specification (4) and find that this variable is highly statistically significant.
Stocks with narrower basis point spreads have more dark pool activity, controlling for listing exchange
and share volume. Note also that with this measure of spreads, the coefficient on bid depth is
statistically significant and positive. Finally, in specification (5) we drop share volume and include the
relative order imbalance in percent of share volume and volatility as measured by the intraday range
divided by the high as reported by CRSP. We find that dark pool volume decreases significantly in
relative order imbalances and volatility. For robustness, we also rerun specification (5) on the O’Hara
and Ye (2011) sample and report the results in column (6). Our conclusions are generally robust to
applying their sample screens (excluding low priced and low volume stocks), but for this sample the
associations between dark pool activity and bid depth and between dark pool activity and volatility are
not statistically significant.

12
In sum, the multivariate Fama-Macbeth regression analysis shows that dark pool activity is
significantly higher (lower) for NASDAQ (AMEX) stocks than for NYSE stocks all else equal. Liquid stocks
have more dark pool activity as predicted by Buti, Rindi, and Werner (2011). Stocks with higher price
have more dark pool activity than low-price stocks. We also find that dark pool activity is higher for
stocks with narrow quoted spreads and high inside bid depth. These results confirm that dark pools are
more active the higher the degree of competition in the limit order book as predicted by Buti, Rindi, and
Werner (2011). Dark pool activity is higher for stocks with low intraday volatility as measured by the
intraday range. Finally, dark pool activity is significantly higher for stocks with low average order
imbalances relative to share volume. As mentioned in the discussion of the univariate results, this
makes sense as the likelihood of getting an order executed in a dark pool should be lower when the
market tends to be one-sided.
We explore the time-series variation in dark pool activity in Table 6. We de-mean all variables to
take stock fixed effects into account and cluster standard errors by firm and day. Specification (1) shows
that dark pool activity is significantly higher on days with higher share volume, narrower quoted spreads
and higher bid depth. The results are very similar when we add order imbalances relative to share
volume in specification (2). The new variable has a statistically significant and negative coefficient which
means that dark pool activity is low on days with unusually large order imbalances relative to share
volume. As mentioned above, this is natural as it is more difficult to obtain an execution in a dark pool
when the market is one-sided. It also confirms the prediction from Buti, Rindi, and Werner (2011) that
institutions rationally submit fewer orders to dark pools when the order flow in the transparent market
is more one-sided. We add both intraday range and the absolute return in specification (3) and the
coefficients are both significant and negative. In other words, dark pool activity is significantly lower on
unusually volatile days and on days with unusually large market moves. Note that with these additional
variables included in the panel regressions, the sign of the coefficient on quoted spread flips – the

13
coefficient is now positive and significant. The most likely explanation for this sign reversal is that the
quoted spread and volatility tend to be positively related for a particular stock. Moreover, days with
unusually large amounts of uncertainty tend to be days with unusually wide spreads for a particular
stock. Finally we include lagged dark pool activity and lagged absolute returns in specification (4). The
results show that unusually large lagged dark pool activity is associated with unusually large
contemporaneous dark pool activity, i.e., dark pool activity is auto-correlated. This result is consistent
with Buti, Rindi, and Werner (2011) who predict that dark pools generate a liquidity externality effect.
Furthermore, we find that large lagged absolute returns are associated with lower dark pool activity.
For robustness, we rerun this specification for the O’Hara and Ye (2011) sample and the results are in
column (5). Our conclusions are robust to applying their sample screen (excluding low price and low
volume stocks), but note that the association between the quoted spread and dark pool activity is not
statistically significant for the O’Hara and Ye (2011) sample.
In sum, the time-series analysis shows that after controlling for stock fixed effects, days with
unusually high share volume, unusually high bid depth, unusually low degree of one-sided order flow,
and unusually low volatility tend to have higher dark pool activity. These results make sense as it is
more likely that dark pool orders execute when trading interest is high and two-sided (balance between
buyers and sellers). The relationship between dark pool activity and quoted spreads is more complex.
As described in Buti, Rindi, and Werner (2011), wider quoted spreads makes it relatively more attractive
to send an order to a dark pool that would execute at the mid-quote instead of sending a marketable
order to the limit order book and incur the spread. At the same time, a wider spread makes it more
attractive for a patient trader to submit a limit order to the book. In equilibrium, Buti, Rindi, and
Werner (2011) show that the latter effect dominates so that an unusually wide spread is predicted to
discourage dark pool order submission. This theoretical prediction is consistent with the result that an
unusually wide spread is associated with unusually low dark pool activity (specifications (1) and (2)).

14
Similarly, as explained by Buti, Rindi, and Werner (2011), higher limit order bid depth reduces the
incentives for an institution to submit a limit order relative to submitting an order to a dark pool. The
reason is that the limit order would have to compete with the orders already in the limit order book,
reducing the probability of the order getting filled without offering price improvement. Finally, during
periods of unusually high volatility traders are all else equal more likely to forgo the uncertain
executions associated with dark pools and instead rely on marketable orders to gain immediacy.
However, controlling for volatility (specifications (3) and (4)), an unusually wide spread is associated
with more dark pool activity (i.e., a substitution away from marketable orders to dark pool orders).
Having analyzed the cross-sectional and time-series patterns of dark pool activity as captured by
the SIFMA sample, we now move on to examining the relationship between dark pool activity and
market quality and price efficiency, respectively.
6. DARK POOLS AND MARKET QUALITY
A central question is whether there are any detrimental effects of dark pool activity on public
market quality. This question is challenging to answer as causality is notoriously difficult to prove. In
our case, this is particularly complicated as dark pool activity and market quality measures are jointly
determined. For example, the theoretical model developed in Buti, Rindi, and Werner (2011) predicts
that dark pool market share is higher when limit order depth is high, when limit order spreads are
narrow, and when the tick size is larger. In other words, strategic traders decide whether to submit an
order to a dark pool or to the public limit order book based on observing the depth and the spread.
Therefore, we cannot simply run a regression of contemporaneous market quality measures on dark
pool activity and interpret the coefficients as evidence of a causal relationship.
To deal with the inherent endogeneity of dark pool activity and market quality, we need to find
good instruments for dark pool activity and market quality respectively. In a recent paper studying the

15
impact of low latency trading on market quality, Hasbrouck and Saar (2011) propose using low latency
trading in other stocks during the same time period as an instrument for low latency trading in a
particular stock. We follow their suggestion and use dark pool trading for other stocks (not i) on day t as
an instrument for dark pool trading in stock i. We refine their instrument slightly by requiring that the
other stocks (not i) be listed on the same exchange as stock i, that their market capitalization is in the
same size-grouping (LARGE, MEDIUM, SMALL) as stock i, and that they are in the same two-digit SIC
code. The idea is that we have observed that there are systematic differences between exchanges and
across size grouping in dark pool trading. The matching on SIC code serves to control for industry
effects. We use the same logic in creating instruments for each of our market quality measures: the
time-weighted percent and cent quoted spread, the share-weighted percent and cent effective spread,
the (log of) time-weighted bid-depth, (log of) share volume, the standard deviation of mid-quote
returns, and the intraday range divided by the intraday high.8
We estimate a two-equation simultaneous model for dark pool activity (RELDP) and market
quality measures (MQMs) using Two Stage Least Squares (2SLS). Specifically, we estimate the following
system of equations:
MQM i,t = a1 RELDPi,t + a2 MQMnot i,t + e1,t
RELDPi,t = b1 MQMi,t + b2 RELDPnot i,t + e2,t
As instruments for RELDPi,t, we use RELDPnoti,t which is the average dark pool activity of other stocks
listed on the same exchange, in the same market capitalization grouping (LARGE, MEDIUM, SMALL), and
with the same two-digit SIC code. Note that we exclude stock i. Similarly, as an instrument for MQMi,t,
we use MQMnoti,t, which is the average market quality measure for other stocks listed on the same 8 Hasbrouck and Saar (2011) were able to use the spreads for other markets quoting the same security in their analysis of low latency orders on the Nasdaq. We unfortunately do not know in which market dark pool trades are executed so we cannot follow their strategy.

16
exchange, in the same market capitalization grouping (LARGE, MEDIUM, SMALL), and with the same
two-digit SIC code. We again exclude stock i.
Since both RELDPi,t and MQMi,t are endogenous in this system, the 2SLS estimation of the first
equation involves replacing RELDPi,t with the fitted value from a regression of RELDPi,t on MQMi,t and
RELDPnoti,t. Similarly, the estimation of the second equation involves replacing MQMi,t by the fitted
value from a regression of MQMi,t on RELDPi,t and MQMnoti,t. We estimate the above system of
equations for all stocks and days in a panel. To control for stock fixed effects, we de-mean all variables
by deducting the in-sample average and divide the de-meaned variables by their in-sample standard
deviation. As a result, the estimated coefficients can be interpreted as the response to a one standard
deviation shock.
Table 7 reports the results from estimating the simultaneous equation model for the SIFMA
sample in Panel A. We are primarily interested in the a1 and b1 coefficients: a1 measures the effect of
dark pool activity on market quality and b1 measures the effect of market quality on dark pool activity.
The estimated a1 coefficients show that dark pool is significantly negatively related to quoted and
effective spreads. For example, a one standard deviation increase in dark pool activity is associated with
a 0.119 (0.357) standard deviation decrease in the quoted (effective) percent spread. Further, we find
that dark pool activity is significantly positively related to bid-depth and significantly negatively related
to volatility. A one standard deviation increase in dark pool activity is associated with a 0.092 standard
deviation increase in bid-depth and a 0.283 standard deviation reduction in the intraday range.
Interestingly, dark pool activity is significantly negatively related to consolidated share volume: a one
standard deviation increase in dark pool activity is associated with a 0.233 standard deviation decrease
in share volume. Similarly, the estimated b1 coefficients show that poorer market quality (wider
spreads, lower depth, and more volatility) is significantly negatively related to dark pool activity as

17
predicted by Buti, Rindi, and Werner (2011). The coefficients (a2 and b2) on our instruments are positive
and highly significant across the board. In other words, they appear to be good instruments.
We repeat the analysis for NYSE-listed stocks in Panel B and Nasdaq-listed stocks in Panel C of
Table 7. The results are qualitatively similar to the results for the overall sample. However, the
magnitude of the effect of dark pool activity on quoted spreads is several times larger for NYSE-listed
than Nasdaq-listed stocks (e.g., the coefficients for percent quoted spreads are -0.179 for NYSE-listed
and -0.050 for Nasdaq-listed). The magnitude of the effect of dark pool activity on share volume is also
much larger for NYSE-listed than for Nasdaq-listed stocks (-0.306 for NYSE-listed and -0.126 for Nasaq-
listed stocks). Interestingly, the effect of dark pool activity on volatility is similar for NYSE-listed and
Nasdaq-listed stocks.
One concern raised by regulators is that opaque trading venues may be particularly detrimental
for small cap stocks, where fragmentation and information asymmetries are more likely to affect
liquidity and price formation. Therefore, we repeat the simultaneous equation analysis for stocks sorted
by size-grouping in Table 8. Recall that the size-groupings are: SMALL with a market capitalization less
than $50 million, MEDIUM with a market capitalization between $50 million and $1 billion, and LARGE
with a market capitalization of $1 billion and above. The results in Table 8 show that dark pool activity
is associated with better market quality for all size groupings. In fact, the positive effect of dark pool
activity on market quality is generally stronger for SMALL stocks in Panel A than for MEDIUM and LARGE
stocks in Panels B and C. For example, a one standard deviation increase in dark pool activity is
associated with a 0.793 (0.780) standard deviation decrease in quoted (effective) percent spreads and a
0.380 standard deviation increase in bid-depth for SMALL caps. The corresponding numbers for LARGE
caps are 0.077 (0.333) and 0.072. The magnitude of the effect of dark pool activity on volatility is also
much larger for SMALL caps than LARGE caps: a one standard deviation increase in dark pool activity for

18
a SMALL cap results in a 0.843 standard deviation reduction in the intraday range. The corresponding
number for a LARGE cap is 0.215. Finally, note that more dark pool activity is associated with
significantly higher share volume for SMALL caps, but significantly lower share volume for MEDIUM and
LARGE caps.
For robustness, we estimate the simultaneous equation system stock-by-stock. The results of
this estimation are summarized in Table 9. We report the median estimated coefficients and the p-
values from a rank test which tests whether the coefficients are different from zero. The results are
weaker than in Table 7, Panel A, but the conclusions are the same: dark pool activity is associated with
better market quality as measured by spreads, bid-depth, and volatility. However, as noted above, dark
pool activity appears to be associated with lower consolidated share volume.
7. DARK POOLS AND PRICE EFFICIENCY
In the previous section, we showed that increased dark pool activity leads to an improvement in
measures of market quality such as spreads, depth, and volatility. However, it is possible that an
increased reliance on dark pool trading could impair price efficiency. To study the relationship between
dark pool activity and the efficiency of market prices, we rely on three standard measures of price
efficiency: short-term volatility, return autocorrelations, and the variance ratio. Short-term volatility is
here the variance of mid-quote log returns measured over 15-minute and 30-minute intervals.9
9 These measures complement our previously calculated volatility measures: the intraday range (low frequency measure) and the standard deviations of mid-quote returns (ultra high-frequency measure).
Short-
term volatility can be viewed as a measure of trading frictions, and a market with lower volatility is
viewed as more efficient in this context. Return autocorrelations are simply the first order
autocorrelation of the 15-minute log returns. In an efficient market, returns should be uncorrelated
since prices should follow a random walk. In other words, markets with return autocorrelations close to

19
zero are considered more efficient in that price changes are less predictable. Finally, the variance ratio
(see Lo and MacKinlay (1988)) is defined as the absolute value of the ratio of the variance of the 30-
minute log returns divided by the two times the variance of the 15-minute log returns. The closer this
number is to one, the more prices behave like a random walk and hence the more efficient is the
market.
There are alternative measures of price efficiency in the literature. For example, Hasbrouck
(1993) suggests using a decomposition approach to measure price efficiency. His approach uses signed
order flow to distinguish the noise variance component (related to frictions and hence inefficiency) from
the information-based variance component. As emphasized by O’Hara and Ye (2011), this approach is
less appropriate for studying today’s fragmented trading environment. The approach also requires the
researcher to classify trades as buyer and seller initiated, which is increasingly difficult to do in a reliable
fashion. Therefore, we follow O’Hara and Ye (2011) and concentrate on our three simple price
efficiency measures.
We divide each trading day into 26 15-minute intervals starting at 9:30am. We also need to take
a stand on how to deal with the overnight return. O’Hara and Ye (2011) propose including the overnight
return, while Bollerslev and Andersen (1997) argue that the overnight return as well as the first interval
return of the day has very different statistical properties from the rest of the intraday returns and
propose that these returns therefore should be excluded. Technically, the correction for overlapping
returns proposed by Lo and MacKinlay (1988) assumes that the overnight return is included, and our
primary analysis therefore includes the overnight return. However, for robustness we also analyze
variance ratios excluding the overnight and the first and last return interval of the day.10
10 The non-trading period overnight is problematic as information typically arrives at a lower rate than during the trading day. To assume that the overnight return volatility should be the same as a 15-minute volatility is clearly

20
We first calculate both the log 15-minute returns and the (overlapping) log 30-minute returns.
The short-term volatility is defined as the standard deviation of the 15-minute (30-minute) log returns
for each stock and month (year). As mentioned above, a market with lower short-term volatility is
considered to be more efficient. Return autocorrelations are estimated monthly for each stock based
on the 15-minute log returns. A market with return autocorrelations closer to zero is considered to be
more efficient. Significantly positive return autocorrelations (continuations) suggests that prices under-
react, while negative return autocorrelations (reversals) suggest that prices over-react.
Slightly more work is required to conduct the variance ratio test. The idea behind this test is
that if prices follow random walks the variance of a 30-minute log return should be twice as large as the
variance of a 15-minute log return. Following Lo and MacKinlay (1988), we correct for the bias induced
by using overlapping returns. We also correct for the bias in estimating the variance of returns before
computing the monthly variance ratio. Specifically, we first compute the mean 15-minute return as
�̂� = 1𝑛𝑞∑ (𝑙𝑛𝑃𝑘 − 𝑙𝑛𝑃𝑘−1)𝑛𝑞𝑘=1 , where 𝑃𝑘 is the mid-quote at the end of interval k and nq+1 is the number
of mid-quote observations in the sample. The estimator of the 15-minute log return variance is given by
𝜎�12 = 1𝑛𝑞−1
∑ (𝑙𝑛𝑃𝑘 − 𝑙𝑛𝑃𝑘−1 − �̂�)2𝑛𝑞𝑘=1 and the estimator for half of the 30-minute log return variance is
given by 𝜎�22(𝑞) = 1𝑚∑ �𝑙𝑛𝑃𝑘 − 𝑙𝑛𝑃𝑘−𝑞 − 𝑞�̂��2𝑛𝑞𝑘=2 where 𝑚 = 𝑞(𝑛𝑞 − 𝑞 + 1) �1 − 𝑞
𝑛𝑞� and in our case,
q=2. We define the variance ratio statistic as: 𝑉𝑅����(𝑞) = 𝜎�22(𝑞)𝜎�12
− 1.
Lo and MacKinlay (1988) show that a transformation of the variance ratio asymptotically follows
a standard normal distribution:
𝑟𝑎𝑡𝑖𝑜 ≡ 𝜃(𝑞) ≡ �𝑛𝑞�𝑉𝑅����(𝑞)��2(2𝑞 − 1)(𝑞 − 1)
3𝑞 �−12
~𝑁(0,1)
arbitrary. Volatility is also not homoscedastic within the trading day, but rather strongly U-shaped. These facts motivate the execution of both the overnight return, and the first and last interval of the day.

21
where nq is the number of observations and q is the number of periods in the longer-horizon return, in
our case q=2. We compute the variance ratio for each stock in our sample for each month (year). A
variance ratio close to zero indicates that the market is efficient. If the variance ratio is significantly
positive, the 30-minute variance is higher than twice the 15-minute variance, which suggests that the
market price under-reacts. By contrast, if the variance ratio is significantly negative, the 30-minute
variance is lower than twice the 15-minute variance, which suggests that the market price over-reacts.
In other words, the market displays “excess” short-term volatility.
We first report descriptive statistics for our price efficiency measures in Table 10. Panel A
reports the efficiency measures including the overnight return, while Panel B excludes both the
overnight and the open and closing 15-minute returns. Recall that we calculate (12) monthly
observations for each stock of short-term volatility, the variance ratio, and estimate autocorrelation
based on daily mid-quote return data. Panel A shows that the average standard deviation of 15-minute
mid-quote returns is lower than the average standard deviation of 30-minute mid-quote returns.
However, the variance ratio is negative suggesting that stocks on average over-react to information. In
other words, the 15-minute return volatility is too high relative to the 30-minute return volatility. A
similar conclusion can be drawn from the negative average autocorrelation of mid-quote returns. The
results in Panel B show less evidence of market inefficiency: the 15- and 30-minute standard deviations
are lower and both the variance ratio and the autocorrelation of returns are closer to zero. This means
that the overnight return and the returns around the open and close contribute significantly to market
inefficiency.
Under the null-hypothesis of market efficiency, both the variance ratio and the return-
autocorrelation should be zero. In other words, either a positive or a negative deviation from zero
implies that the market is inefficient. Therefore, we henceforth follow O’Hara and Ye (2011) and define

22
our second and third price-efficiency measures as the absolute value of the variance ratio and the
absolute return-autocorrelation respectively.
In Table 11, we explore how dark pool activity varies with our measures of price efficiency. We
sort stocks into price-efficiency quintiles and then examine dark pool activity (RELDP) on average for
each quintile in Panel A, and how many dark pools (COUNTDP) are active for each quintile on average in
Panel B. The analysis is repeated in Panels C and D excluding the overnight and the first and last return
interval of the day. Stocks with higher short-term volatility have significantly lower dark pool activity
and fewer active dark pools than those with lower short-term volatility. Similarly, stocks with higher
absolute variance ratios and larger absolute return- autocorrelations have significantly less dark pool
activity and a significantly lower number of active dark pools. The differences in the High-Low columns
are highly statistically significant. In other words, there is more dark pool activity for more efficient
stocks and this conclusion is not affected by whether or not we exclude the overnight and the open and
close return intervals.
The third question our paper seeks to answer is the effect of dark pool activity on price
efficiency. From Table 11, we know that dark pools are more active in stocks with more efficient prices.
We would like to answer how an unusual amount of dark pool activity relates to price efficiency, taking
the potential joint determination of dark pool activity and price efficiency into account. We therefore
again estimate a simultaneous equation model using 2SLS with dark pool activity and our four price
efficiency measures: standard deviation of 15-minute returns, standard deviation of 30-minute returns,
the absolute variance ratio, and the absolute return-autocorrelations. We follow the same strategy as in
the previous section and use the dark pool activity for other stocks listed on the same exchange, from
the same size grouping (LARGE, MEDIUM, SMALL), and with the same two-digit SIC code as an
instrument for dark pool activity in stock i. Similarly, we use the average price efficiency measures for

23
other stocks as instrument for price efficiency measures for stock i. The results including the overnight
return are reported in Table 12 for the SIMFA Sample in Panel A, and for NYSE-listed stocks and Nasdaq-
listed stocks separately in Panels B and C. Table 12A repeats the analysis when we exclude the
overnight return and the first and last return interval of the day.
As mentioned before, we are mostly interested in coefficients a1 and b1. The estimated
coefficients for instruments a2 and b2 are positive and highly significant in all regressions reported in
Tables 12 and 12A suggesting that our instruments work well. The effect of unusual dark pool activity
on short-term volatility, a1, is negative and statistically significant for both the overall sample in Panel A
and for the sub-samples by listing exchange in Panels B and C. Similarly, unusually high short-term
volatility is associated with significantly lower dark pool activity (b1) as predicted by Buti, Rindi, and
Werner (2011). Note also that the effect of a standard deviation shock on dark pool activity has a larger
effect on short-term volatility for NYSE- than for Nasdaq-listed stocks. These conclusion are robust to
excluding the overnight and adjacent returns (compare Table 12 and 12A), but note that the magnitude
of the effect of a standard deviation increase in dark pool activity on short-term volatility is much
smaller in Table 12A.
By contrast, an unusual amount of dark pool activity is associated with higher absolute return-
autocorrelations and higher absolute variance ratios for the overall sample in Panel A, indicating less
efficient pricing. Based on comparing Panels B and C in Table 12, we conclude that this result appears to
derive from Nasdaq-listed stocks (Panel C). There is a negative but not statistically significant effect of
unusual dark pool activity on these measures of price efficiency for NYSE-listed stocks (Panel B). As can
be seen from Table 12A, the results for the absolute variance ratio are qualitatively the same if we
exclude the overnight and adjacent returns. However, the effect of dark pool activity on the absolute
autocorrelation is instead negative for all Panels of Table 12A. In other words, the effect of dark pool

24
activity on the autocorrelation of returns derives entirely from the overnight and the first and last
periods of the day.
The results in Tables 12 and 12A may mask significant differences between SMALL and LARGE
stocks. Regulators are typically especially concerned about possible detrimental effects of trading
activity on price efficiency for less liquid securities. To evaluate whether there are systematic
differences in the effect of dark pool activity on price efficiency across firms of different size, we
therefore repeat the exercise for stocks grouped by market capitalization in Tables 13 and 13A. The
results for SMALL stocks are in Panel A, and for MEDIUM and LARGE stocks in Panels B and C
respectively.
Overall, the conclusion that an unusual amount of dark pool activity is associated with lower
short-term volatility holds for all subsamples of stocks grouped by market capitalization. Table 13 also
shows that while an unusual amount of dark pool activity is associated with higher absolute
autocorrelations of returns and absolute variance ratios, the magnitude of the effect is monotonically
declining in size. For example, when dark pool activity increases by one standard deviation the absolute
variance ratio for SMALL (MEDIUM) caps increases by 0.343 (0.085) standard deviations. The response
for LARGE cap stocks is small (0.011) and not statistically significant. Similarly, when dark pool activity
increases by one standard deviation the absolute value of the autocorrelation of 15-minute returns
increases by 0.326 standard deviations for SMALL caps, by 0.088 standard deviations for MEDIUM caps,
but the response for LARGE cap stocks is again small (0.006) and not statistically significant.
Comparing Table 13 and 13A, we find that the overnight and the first and last periods of the day
are responsible for the apparent relationship between dark pool activity and lower price efficiency as
measured by the absolute autocorrelation of returns. Eliminating these periods, an unusual amount of
dark pool activity is instead beneficial for market efficiency for SMALL and MEDIUM stocks, while it does

25
not significantly affect market efficiency for LARGE stocks. The results are also slightly different for the
absolute variance ratio without the overnight and adjacent returns. Specifically, in this case we find a
statistically significant positive relationship between unusual dark pool activity and the absolute
variance only for MEDIUM cap stocks.
We estimate the simultaneous system of equations stock-by-stock and report the results in
Table 14. Based on the stock-by-stock analysis, we conclude that both short-term volatility measures
decline significantly in dark pool volume whether or not we include the overnight and the first and last
returns of the day. However, neither the absolute variance ratio nor the absolute autocorrelation of
returns is significantly affected by dark pool activity. Moreover, this conclusion is robust to the
exclusion of the overnight and adjacent returns. Hence, the stock-by-stock results generally support the
conclusion from the panel regressions that higher dark pool activity is associated with lower short-term
volatility or more efficient pricing but the results do not suggest that the absolute autocorrelation and
variance ratios are significantly affected by an unusual amount of dark pool activity.11
In sum, our results show that increased dark pool activity improves price efficiency as measured
by 15- and 30-minute return volatility for both NYSE and Nasdaq stocks and for stocks sorted into groups
by size. By contrast, the relationship between unusual dark pool activity and the absolute variance ratio
and the absolute return autocorrelations depends on the listing market, the liquidity of the stock,
whether or not we follow Andersen and Bollerslev (1997) and exclude the overnight and adjacent
returns, and whether or not we estimate the relationship using a panel or stock-by-stock. Generally,
unusually high levels of dark pool activity have no statistically significant effect on absolute variance
ratios and absolute return autocorrelations for LARGE stocks, but are associated with higher variance
ratios for Nasdaq-listed stocks, and for MEDIUM and SMALL stocks when overnight returns are included.
11 There are only 12 monthly observations per firm, rendering the sample for each 2SLS estimation small.
26
Interestingly, when we exclude the overnight and adjacent returns, unusual dark pool activity is
associated with lower absolute autocorrelations indicating greater price efficiency for all subsamples.
However, unusual amounts of dark pool activity appear to be associated with higher absolute variance
ratios (less efficient prices) for Nasdaq-listed and for MEDIUM stocks even when we exclude overnight
and adjacent returns.
The results above are based on the absolute variance ratio. However, we are also interested in
whether unusually high dark pool activity is associated with more short-term overreaction (decreasing
signed variance ratios) or more short-term under reaction (increasing signed variance ratios). Therefore,
we study the link between unusual dark pool activity and the signed variance ratio in unreported results.
Recall that the average variance ratio in the sample is negative indicating that sample stocks exhibit
short-term overreaction on average. Except in the case of LARGE caps, we find that an unusual amount
of dark pool activity is associated with a significant decrease in the signed variance ratio -in other words
an increased amount of short-term overreaction. When we exclude the overnight and adjacent returns,
the relationship between an unusual amount of dark pool activity and the signed variance ratio is
positive and statistically significant only for Nasdaq-listed stocks and for MEDIUM caps respectively.
8. SUMMARY AND CONCLUSIONS
In this paper, we study dark pool trading activity for a large cross-section of stocks based on a
unique self-reported sample of daily dark pool share volume during 2009. The sample was collected by
SIFMA and covers eleven out of roughly 32 dark pools active in the US equity markets during our sample
period. We find that our SIFMA sample represents roughly 50 to 60 percent of dark pool volume as
reported by Rosenblatt Securities Inc. The market share of reported dark pools increase over the
sample period, from slightly below 4 percent of consolidated share volume in January to above 6
percent of consolidated share volume in December. Moreover, we note that SIFMA sample dark pools

27
report activity in over 10,000 distinct securities. For individual dark pools, this figure ranges from a low
of 5,646 to a high of 8,251 securities. In other words, the dark pools in our sample are active for a very
large cross-section of stocks.
The average daily market share of our SIFMA dark pools based on the benchmark sample of
common stocks also in CRSP with non-zero share volume is 4.5 percent of share volume. If we exclude
low price and low liquidity stocks, dark pool activity increases to 5.3 percent of share volume on
average. While we do not have data on all dark pools, we surmise that the overall market share of dark
pools is roughly twice as large based on the overall market share of our SIFMA reporting dark pools.
We examine whether dark pools specialize by computing the number of different dark pools
active on the typical stock-day as well as the inverse of the Herfindahl index which measures market
concentration. The average stock-day in our SIFMA screened sample has five active dark pools, and the
market-share equivalent number of dark pools is 2.4. If we screen out low-price stocks, the median
stock-day has 8 active dark pools with a market share equivalent number of dark pools of 3.1. In other
words, there is significant competition among dark pools for institutional order flow.
We study dark pool activity separately for stocks based on the primary listing exchange and
based on market capitalization. Generally, we find that dark pool activity is higher for the NYSE (5.5
percent of share volume) than for Nasdaq (4.3 percent of share volume). There are also more active
dark pools for a typical NYSE stock-day (9) than for a Nasdaq stock-day (4). SIFMA dark pool activity is
strongly increasing in market capitalization, with a market share of 1.8 percent for firms below $50
million, 5.1 percent for firms between $50 million and $1 billion, and 5.7 percent for firms with market
capitalization above $1 billion. For firms above $1 billion, a typical stock-day has ten active SIFMA dark
pools with a market share equivalent number of dark pools of 3.7.
In a preliminary analysis of dark pool activity and market quality, we sort stocks into quintiles by
dark pool activity and test for differences in market quality measures between the group of high dark

28
pool and the group of low dark pool activity. We find strong evidence that stocks with high dark pool
activity are significantly larger, more liquid stocks with higher average price. Stocks with higher dark
pool activity are also associated with lower quoted and effective spreads, lower intraday volatility, and
lower measures of absolute buy-sell imbalances relative to share volume. From this analysis, we cannot
conclude that dark pool activity causes higher market quality as we have not yet controlled for
characteristics that are likely to affect market quality such as market capitalization and price.
Taken together, our univariate results confirm aggregate market statistics from for example
Rosenblatt Securities Inc. indicating that dark pool activity is a significant component of equity trading in
US markets. Moreover, our results show that dark pool activity is concentrated in stocks with higher
market capitalization and higher price. Statistics commonly referred to in the regulatory debate do not
address this cross-sectional variation in dark pool activity so we have no benchmarks to compare our
study to in this regard.
A unique feature of the SIFMA sample is that it permits us to examine the cross-sectional and
time-series variation in dark pool activity at a more granular level. Our cross-sectional analysis shows
that dark pool activity is increasing in average share volume and price, but is decreasing in average
quoted and effective spreads, average intraday volatility, average absolute order imbalances relative to
share volume. We also find that dark pool activity is higher (lower) for NASDAQ (AMEX) stocks
controlling for size, share volume, and stock price. In the time-series, we find that dark pool activity is
significantly higher on days when a stock is experiencing unusually high share volume, unusually narrow
quoted spreads, unusually high depth at the inside, and unusually low intraday volatility. We also find
that dark pool activity is lower on days with more imbalanced order flow and larger absolute return for a
particular stock. In other words, holding the stock constant, dark pool activity is lower when the market
is one-sided.

29
Given that dark pool activity is not only significant on average, but also displays significant cross-
sectional and time-series variation, it is clearly important to understand how dark pool activity is related
to measures of market quality and market efficiency. We investigate this important question using a
simultaneous equation system to account for the fact that market quality and dark pool activity are
jointly determined. Our results show that more dark pool activity is associated with better market
quality: narrower spreads, more depth, and lower volatility. These results are robust to sub-sampling by
listing exchange, market capitalization, and to using stock-by-stock instead of panel regression
estimation. By contrast, we find that more dark pool activity is generally associated with lower share
volume, suggesting that dark pool trading has a crowding-out effect overall and for both NYSE-listed and
NASDAQ-listed stocks. This effect is notably absent for small cap stocks where dark pool activity is
instead associated with higher share volume.
Finally, we use the same simultaneous equation system estimation to investigate the effect of
dark pool activity on measures of price efficiency. Our results show that more dark pool activity is
associated with lower short-term volatility across the board suggesting an improvement in price
efficiency. By contrast, the absolute autocorrelation of returns and the absolute variance ratio suggest
that an unusual amount of dark pool activity is associated with less efficient prices for Nasdaq-listed
stocks and for small and medium sized stocks. A closer examination shows that this result derives from
an increase in short-term overreaction (a more negative variance ratio). Further, we find that the
association between unusual dark pool activity and the absolute autocorrelation of returns is driven by
the overnight and adjacent returns. During the trading day, an unusual amount of dark pool activity is
instead associated with improved market efficiency as measured by the absolute autocorrelation of
returns. Similarly, if we exclude the overnight and adjacent returns the significant positive relationship
between dark pool activity and the absolute variance ratio only survives for Nasdaq-listed and for
medium sized firms respectively.

30
Buti, Rindi, and Werner (2011) predict that there should be more reversals for less liquid stocks
and more continuations for liquid stocks in the presence of dark pool trading activity. Reversals would
tend to produce a more negative variance ratio, and our results are therefore broadly consistent with
this prediction. However, the fact that the inference regarding the effect of unusual amounts of dark
pool activity and price efficiency is heavily dependent on the specific measure of price efficiency is
troubling. Note also that our results are very different from the beneficial effects of market
fragmentation on price efficiency found by O’Hara and Ye (2011). It is tempting to attribute this
difference to the fact that our sample consists exclusively of dark pools and that we use a different
methodology. However, in unreported results (see online Appendix) we are able to replicate O’Hara and
Ye’s (2011) findings of improvements in price efficiency for our sample using their matching sample
methodology.
Thus, while our results show that an unusual amount of dark pool activity is associated with
better market quality and lower short-term volatility across the board, the results also suggest that it
may be associated with more short-term overreaction for certain groups of stocks. This is particularly
true when price-changes over non-trading periods are included in the analysis. An important caveat is
that we are using daily data for our analysis of market quality but the tests of price efficiency are based
on twelve months of monthly data. It is possible that our ability to relate unusual dark pool activity to
price efficiency is hampered by the relatively low sampling frequency. While it would in principle be
possible to increase the sampling frequency to weekly or even daily, this would come at the cost of
much noisier estimates of price efficiency. Our conclusion is that more research is still needed on the
important question of the effect of dark pool activity on price efficiency for different types of stocks in
the cross-section.

31
References
Andersen, T., and T. Bollerslev, 1997, Intraday Periodicity and Volatility Persistence in Financial Markets, Journal of Empirical Finance 4, 115-158.
Buti, S., Rindi, B., and I.M. Werner, 2011, Dark Pool Trading Strategies, Fisher College of Business Working Paper, October.
Brandes, Y. and I. Domowitz, 2010, Alternative Trading Systems in Europe, Trading Performance by European Venues Post MiFID, Working Paper, ITG, Inc., May.
Buchanan, M., J. Tse, D. Vincent, X. Lin, and A. Kumar, 2011, Measuring Dark Pools’ Impact, Portfolio Strategy, Credit Suisse Europe, January.
Concept Release on Equity Market Structure, Securities and Exchange Commission, 17CFR PART 242 [Release No. 34-61358; File No. S7-02-10].
Conrad, J., Johnson, K., and S. Wahal, 2003, Institutional Trading and Alternative Trading Systems, Journal of Financial Economics 70, 99-134.
Davies, R.J., and S.S. Kim, 2008, Using Matched Samples to Test for Differences in Trade Execution Costs, Journal of Financial Markets.
Degryse, H., F. de Jong, and V. van Kervel, 2011, The Impact of Dark and Visible Fragmentation on Market Quality, TILEC Discussion Paper DP 2011-026, Tilburg University.
Fong, K., Madhavan, A., and P. Swan, 2004, Upstairs, Downstairs: Does the Upstairs Market Hurt the Downstairs? Working Paper, University of New South Whales.
Gawronski, J., and J. Schack, 2010, Let There be Light, Rosenblatt’s Monthly Dark Liquidity Tracker, Special Issue: 2009 In Review, Rosenblatt Securities Inc., January.
Gresse, C., 2006, The Effect of Crossing-Network Trading on Dealer Market’s Bid-Ask Spreads, European Financial Management 12, 143-160.
Hasbrouk , J., 1993, Assessing the Quality of a Security Market: A New Approach to Transaction- Cost Measurement, Review of Financial Studies 6, 191-212.
Hasbrouck, J., and G. Saar, 2011, Low Latency Trading, Working Paper, New York University.
Hatheway, F., 2009, Testimony for the Senate Banking, Housing, and Urban Affairs Committee: The Securities Insurance and Investment Subcommittee, Wednesday, October 28, 2009.
Lo, A., and A. C. MacKinlay, 1988, Stock Market Prices Do Not Follow Random Walks: Evidence from a simple Specification Test, Review of Financial Studies, 1, 41-66.

32
Lee, S., 2009, Dark pools 2009: Not So Dark Anymore, Aite Group White paper, September.
Lee, C., and M. Ready, 2009, Inferring Trade Direction from Intraday Data, Journal of Finance 46, 733-746.
Mittal, H., 2008, Are You Playing in a Toxic Dark Pool? A Guide to Preventing Information Leakage, ITG, June.
Naes, R., and B. Odegaard, 2006, Equity Trading by Institutional Investors: To Cross or Not to Cross? Journal of Financial Markets 9, 79-99.
O’Hara, M., and M. Ye, 2011, Is Market Fragmentation Harming Market Quality? Cornell University Journal of Financial Economics 100, 459-474.
Ready, M., 2010, Determinants of Volume in Dark Pools, working paper, University of Wisconsin, November.
Sofianos, G., 2007, Dark Pools and Algorithmic Trading, Chapter 6 in Algorithmic Trading: A Buy-Side Handbook.
Weaver, D., 2011, Off-exchange Reporting and Market Quality in a Fragmented Market Structure, Rutgers Business School Working Paper, May.
33
Sample SecuritiesSIFMA data 10,178Exclude symbol.XX and NDQ 5th 1,525
8,653CRSP SHRCD=10, 11 4,035
4,618CRSP missing symbol 87
4,531Duplicate permno/cusip 49SIFMA Sample 4,482Stocks with Price > $1,000 3Weaver Sample 4,479Stocks with Price < $5.00 2,254Stocks with volume < 1,000 shares/day 23O'Hara and Ye Sample 2,205
TABLE 1. SAMPLE CONSTRUCTION

34
TABLE 2. UNIVARIATE DARK POOL ACTIVITY
A. SIFMA SAMPLE Average StDev Q1 Median Q3DPVOL 85.08 794.03 0.21 5.55 37.90RELDP 4.51 5.74 0.65 3.05 6.22COUNTDP 5.27 3.97 1 5 9IHERF 2.43 1.74 1.00 2.40 3.70B. AMEX/ARCA (8%) Average StDev Q1 Median Q3DPVOL 3.60 20.22 0.00 0.00 0.95RELDP 1.87 5.19 0.00 0.00 1.58COUNTDP 1.34 2.11 0 0 2IHERF 0.84 1.14 0 0 1.34C. NASDAQ (60%) Average StDev Q1 Median Q3DPVOL 41.74 221.90 0.10 2.12 15.90RELDP 4.32 6.19 0.15 2.45 5.87COUNTDP 4.27 3.7 1 4 7IHERF 2.13 1.7 1 2 3.34D. NYSE (32%) Average StDev Q1 Median Q3DPVOL 184.08 1,355.02 8.55 35.15 125.07RELDP 5.49 4.64 2.51 4.48 7.16COUNTDP 8.02 3.05 6 9 11IHERF 3.35 1.46 2.33 3.32 4.34E. SMALL (23%) Average StDev Q1 Median Q3DPVOL 1.83 12.79 0.00 0.00 0.40RELDP 1.82 5.47 0.00 0.00 1.24COUNTDP 0.97 1.6 0 0 1IHERF 0.68 0.98 0 0 1F. MEDIUM (51%) Average StDev Q1 Median Q3DPVOL 22.67 86.72 0.80 5.00 18.91RELDP 5.11 6.23 1.27 3.31 6.68COUNTDP 5.16 3.26 2 5 8IHERF 2.56 1.53 1.47 2.5 3.6G. LARGE (26%) Average StDev Q1 Median Q3DPVOL 283.23 1,541.20 27.52 82.04 228.46RELDP 5.74 3.87 3.14 4.98 7.40COUNTDP 9.34 2.15 9 10 11IHERF 3.73 1.34 2.79 3.7 4.63
The table reports univariate statistics based on daily stock level data. DPVOL is SIFMA reported daily Dark Pool single-counted share volume per stock in thousands. RELDP is 100 times DPVOL divided by daily consolidated volume as reported in CRSP. COUNTDP is the number of active Dark Pools per day per stock. IHERF is the inverse of the Herfindahl Index for Dark Pools. The SIFMA sample is defined in Table 1. SMALL includes stocks with market capitalization less than $50 million, MEDIUM includes stocks with market capitalization between $50 million and $1 billion, and LARGE includes stocks with market capitalization of $1 billion and more. Numbers in parentheses indicate the fraction of the sample in each subsample.

35
Variable Observations Mean StDevMarket Capitalization (CRSP) 1,011,760 2.59 12.45Share Volume (CRSP) 1,011,760 1.59 13.26Price (CRSP) 1,011,760 39.78 1485.09(High-Low)/High (CRSP, quotes) 1,011,760 5.88 5.21Absolute Return (CRSP) 1,011,643 0.27 6.47Quoted Spread Basis Points (TAQ) 1,010,740 174.98 352.28Quoted Spread Cents (TAQ) 1,010,740 13.23 246.70Effective Spread Basis Points (TAQ) 1,001,464 41.25 127.95Effective Spread Cents (TAQ) 1,001,464 2.61 1.08Bid Depth (TAQ) 1,010,740 124.08 750.81Relative Order Imbalance in Percent (TAQ) 1,001,464 20.42 23.92StDev Midquote Returns (TAQ) 1,010,388 26.59 60.02
TABLE 3. DESCRIPTIVE STATISTICSThe table reports descriptive statistics based on daily stock level data for the SIFMA sample. Market capitalization is in billion dollars, share volume is in million shares, and bid depth is in shares. Relative order imbalance is defined as the absolute value of buys - sells in percent of consolidated share volume., where buys (sells) are classified based on a modified Lee and Ready (1991) algorithm. Percent spreads are in basis points. (High-Low)/High measures and returns are multiplied by 100. Standard Deviation of midquote returns are multipled by 10,000.

36
A. RELDPVariable Low 2 3 4 High High-Low t-statisticMarket Capitalization (CRSP) 1.642 4.013 5.473 5.789 5.673 4.031 53.97Share Volume (CRSP) 1.872 3.820 5.399 5.791 5.547 3.675 52.21Price (CRSP) 2.311 4.430 5.115 5.571 5.164 2.853 38.15(High-Low)/High (CRSP, quotes) 4.294 5.319 5.123 4.632 3.221 -1.073 -15.16Absolute Return (CRSP) 4.702 5.040 4.875 4.537 3.438 -1.264 -17.92Quoted Spread Percent (TAQ) 5.760 5.986 5.460 3.769 1.625 -4.134 -53.08Quoted Spread Cents (TAQ) 4.818 5.348 5.302 5.542 2.590 -2.229 -31.89Effective Spread Percent (TAQ) 5.161 6.063 5.688 4.051 1.848 -3.313 -42.58Effective Spread Cents (TAQ) 4.415 5.726 5.268 4.592 2.809 -1.606 -22.22Bid Depth (TAQ) 4.461 4.441 4.659 4.581 4.459 -0.002 -0.02Relative Order Imbalance in Percent (TAQ) 5.231 5.334 5.161 4.504 2.551 -2.710 -36.81StDev Midquote Returns (TAQ) 5.646 5.839 5.382 3.949 1.792 -3.854 -49.92
B. COUNTDPVariable Low 2 3 4 High High-Low t-statisticMarket Capitalization (CRSP) 0.878 2.778 5.472 7.581 9.647 8.769 250.70Share Volume (CRSP) 0.464 2.695 5.560 7.830 9.808 9.344 280.11Price (CRSP) 2.163 4.042 5.229 6.996 7.929 5.766 130.88(High-Low)/High (CRSP, quotes) 4.873 6.457 6.017 5.255 3.755 -1.118 -17.43Absolute Return (CRSP) 5.147 5.907 5.794 5.353 4.158 -0.988 -14.95Quoted Spread Percent (TAQ) 9.736 7.796 5.589 2.648 0.599 -9.136 -258.84Quoted Spread Cents (TAQ) 7.668 6.936 6.014 4.327 1.422 -6.246 -140.06Effective Spread Percent (TAQ) 7.943 7.901 6.087 3.597 1.083 -6.860 -154.97Effective Spread Cents (TAQ) 4.904 7.700 6.836 5.180 1.989 -2.914 -54.26Bid Depth (TAQ) 5.307 5.233 5.334 5.277 5.217 -0.090 -1.93Relative Order Imbalance in Percent (TAQ) 7.462 7.141 6.171 4.355 1.482 -5.981 -136.08StDev Midquote Returns (TAQ) 9.185 7.861 5.539 2.856 0.936 -8.249 -198.62
TABLE 4. DARK POOL ACTIVITY AND CONTEMPORANEOUS STOCK AND MARKET QUALITYThe table reports average dark pool activity for quintile portfolios sorted daily by market characteristics based on stock level data for the SIMFA sample. RELDP is 100 times SIFMA reported daily Dark Pool single-counted share volume divided by daily consolidated volume as reported in CRSP. COUNTDP is the number of active Dark Pools per day per stock. Market quality statistics are described in Table 3. The table reports time-series averages of daily means based on daily sorts of stocks into quintile market characteristics portfolios. The t-tests are based on the time series of the difference in the daily average dark pool activity between the High and Low portfolios.

37
Explanatory Variable (1) (2) (3) (4) (5) (6)Intercept 5.250 -3.029 -2.967 1.944 6.554 5.961
20.67 -12.91 -12.47 6.48 10.77 10.42NASDAQ 0.250 0.424 0.424 0.044 0.204 0.341
4.80 6.88 7.13 0.32 2.38 7.17AMEX -1.320 -0.982 -0.973 -2.097 -1.352 -1.758
-10.10 -16.84 -15.75 -15.51 -22.33 -14.00Market Capitalization (CRSP) 0.660
10.29Share Volume (CRSP) 0.512 0.501 0.257
27.21 28.58 8.12Price (CRSP) 0.549 0.572
5.78 5.79Quoted Spread Cents (TAQ) -0.090
-4.34Quoted Spread Percent (TAQ) -0.315 -0.143 -0.420
-15.80 -5.06 -21.18Bid Depth (TAQ) 0.008 0.027 0.028 -0.010
1.16 3.18 2.94 -1.19Relative Order Imbalance in Percent (TAQ) -0.057 -0.034
-6.78 -3.82(High-Low)/High (CRSP, quotes) -0.152 -0.021
-2.85 -0.62
TABLE 5. DARK POOL ACTIVITY IN THE CROSS SECTIONThe table reports the results of regressions of RELDP on contemporaneous market characteristics based on monthly cross-sectional Fama-Macbeth regressions for the SIFMA sample in columns (1) through (5) and for the O'Hara and Ye (2011) sample in column (6). RELDP is 100 times SIFMA reported daily Dark Pool single-counted share volume divided by daily consolidated volume as reported in CRSP. Market quality measures are described in Table 5. We take the log of market capitalization, volume, depth and price. Cent spreads are divided by 100. NASDAQ, and AMEX are dummy variables which take the value of 1 for stocks whose primary listing exchange is NASDAQ, and AMEX respectively. We report the average monthly coefficients on top and t-statistics below .

38
Explanatory Variable (1) (2) (3) (4) (5)Share Volume (CRSP) 0.335 0.318 0.509 0.437 0.760
13.64 11.09 15.38 12.81 11.70Quoted Spread Percent (TAQ) -0.029 -0.028 0.026 0.026 0.021
-5.12 -4.56 2.72 2.82 0.81Bid Depth (TAQ) 1.346 1.372 1.068 0.813 1.321
10.44 10.35 8.70 7.04 8.59Relative Order Imbalance in Percent (TAQ) -0.006 -0.009 -0.009 -0.007
-10.14 -14.13 -14.76 -6.33(High-Low)/High (CRSP, quotes) -0.083 -0.073 -0.171
-17.44 -16.78 -14.52Absolute Return (CRSP) -0.014 -0.012 -0.015
-3.99 -4.01 -2.04Lag RELDP 0.225 0.221
43.40 36.04Lag Absolute Return (CRSP) -0.002 0.004
-1.09 0.21
Number of Observations 1,010,710 1,004,410 1,001,295 996,879 505,006Adjusted R-square 0.008 0.009 0.013 0.063 0.073
TABLE 6. DARK POOL ACTIVITY IN THE TIME-SERIESThe table reports the results of regressions of RELDP on contemporaneous and lagged market characteristics based on panel regressions for the SIFMA sample in columns (1) to (4) and for the O'Hara and Ye (2011) sample in column (5). RELDP is 100 times SIFMA reported daily Dark Pool single-counted share volume divided by daily consolidated volume as reported in CRSP. Market quality measures are described in Table 5. We take the log of volume, depth, and order imbalance. All variables are de-meaned to control for stock fixed effects. We report the estimated coefficients on top and t-statistics below . T-statistics are based on standard errors clustered by stock and day.

39
A. SIFMA SampleMarket Quality Measure a1 a2 b1 b2Time-weighted Quoted Spread in Basis Points -0.119 0.887 -0.102 0.300
(<.001) (<.001) (<.001) (<.001)Time-weighted Quoted Spreads in Cents -0.099 0.839 -0.064 0.329
(<.001) (<.001) (<.001) (<.001)Share-weighted Effective Spreads in Basis Points -0.357 0.551 -0.227 0.279
(<.001) (<.001) (<.001) (<.001)Share-weighted Effective Spreads in Cents -0.249 0.274 -0.275 0.316
(<.001) (<.001) (<.001) (<.001)Time-weighted Bid-depth in Shares 0.092 0.950 0.093 0.291
(<.001) (<.001) (<.001) (<.001)Share volume -0.233 0.646 -0.092 0.340
(<.001) (<.001) (<.001) (<.001)Standard Deviation of Mid-quote Returns -0.326 0.740 -0.181 0.262
(<.001) (<.001) (<.001) (<.001)High-Low/High (CRSP) -0.283 0.736 -0.156 0.288
(<.001) (<.001) (<.001) (<.001)
TABLE 7. SIMULTANEOUS EQUATION MODEL: DARK POOL ACTIVITY AND MARKET QUALITY BY EXCHANGEThe table reports the results of analyzing the relationship between Dark Pool activity and Market Quality. We measure Dark Pool activity as RELDP, which is defined as 100 times SIFMA reported daily Dark Pool single-counted share volume divided by daily consolidated volume as reported in CRSP. Market quality measures are described in Table 3. Due to the potential simultaneity between market quality and dark pool activity, we estimate the following two-equation simultaneous equation model for RELDP and the following market quality measures (MQMs): Time-Weighted Quoted Spread in Percent and Cents; Share-weighted Effective Spread in Percent and Cents; (log of) Time-weighted Bid-depth; (log) of Share volume; Standard deviation of Mid-quote Returns; and High-Low/High:
MQMi,t = a1RELDPi,t + a2MQMnoti,t + e1,tRELDPi,t = b1MQMi,t + b2RELDPnoti,t + e2,t
As an instrument for RELDPi,t we use RELDPnoti,t, which is the average Dark Pool activity of other stocks listed on the same exchange, in the same market capitalization grouping (LARGE, MEDIUM, SMALL), and with the same two-digit SIC code (excluding stock i). Similarly, as an instrument for MQMi,t we use MQMnoti,t, which is the average Market Quality Measure for other stocks listed on the same exchange, in the same market capitalization grouping (LARGE, MEDIUM, SMALL), and with the same two-digit SIC code (excluding stock i). We estimate the simultaneous equation model by pooling observations across all stocks and days in the sample. To make the pooling meaningful, we de-mean all variables by deducting the stock-specific average and scale all variables by dividing by the stock-specific standard deviation to control for stock fixed effects. We report the estimated coefficients on top and p-values below . The results for the SIFMA sample are reported in Panel A, for Nasdaq stocks in Panel B, and for NYSE stocks in Panel C.

40
B. NYSE-listed StocksMarket Quality Measure a1 a2 b1 b2Time-weighted Quoted Spread in Basis Points -0.179 0.860 -0.163 0.322
(<.001) (<.001) (<.001) (<.001)Time-weighted Quoted Spreads in Cents -0.239 0.666 -0.176 0.369
(<.001) (<.001) (<.001) (<.001)Share-weighted Effective Spreads in Basis Points -0.287 0.610 -0.212 0.354
(<.001) (<.001) (<.001) (<.001)Share-weighted Effective Spreads in Cents -0.169 0.370 -0.175 0.409
(<.001) (<.001) (<.001) (<.001)Time-weighted Bid-depth in Shares 0.078 0.949 0.115 0.355
(<.001) (<.001) (<.001) (<.001)Share volume -0.306 0.693 -0.145 0.392
(<.001) (<.001) (<.001) (<.001)Standard Deviation of Mid-quote Returns -0.298 0.771 -0.197 0.313
(<.001) (<.001) (<.001) (<.001)High-Low/High (CRSP) -0.221 0.810 -0.153 0.352
(<.001) (<.001) (<.001) (<.001)
C. NASDAQ-listed StocksMarket Quality Measure a1 a2 b1 b2Time-weighted Quoted Spread in Basis Points -0.050 0.931 -0.058 0.328
(<.001) (<.001) (<.001) (<.001)Time-weighted Quoted Spreads in Cents -0.034 0.933 -0.041 0.340
(<.001) (<.001) (<.001) (<.001)Share-weighted Effective Spreads in Basis Points -0.343 0.575 -0.216 0.282
(<.001) (<.001) (<.001) (<.001)Share-weighted Effective Spreads in Cents -0.311 0.236 -0.371 0.297
(<.001) (<.001) (<.001) (<.001)Time-weighted Bid-depth in Shares 0.084 0.961 0.076 0.297
(<.001) (<.001) (<.001) (<.001)Share volume -0.126 0.652 -0.036 0.351
(<.001) (<.001) (<.001) (<.001)Standard Deviation of Mid-quote Returns -0.267 0.768 -0.152 0.281
(<.001) (<.001) (<.001) (<.001)High-Low/High (CRSP) -0.241 0.744 -0.139 0.300
(<.001) (<.001) (<.001) (<.001)

41
A. SMALLMarket Quality Measure a1 a2 b1 b2Time-weighted Quoted Spread in Basis Points -0.793 0.659 -0.113 0.069
(<.001) (<.001) (<.001) (<.001)Time-weighted Quoted Spreads in Cents -0.537 0.481 -0.150 0.074
(<.001) (<.001) (<.001) (<.001)Share-weighted Effective Spreads in Basis Points -0.780 0.310 -0.179 0.074
(<.001) (<.001) (<.001) (<.001)Share-weighted Effective Spreads in Cents -0.449 0.086 -0.354 0.075
(<.001) (<.001) (<.001) (<.001)Time-weighted Bid-depth in Shares 0.380 0.904 0.072 0.071
(<.001) (<.001) (<.001) (<.001)Share volume 1.041 0.274 0.245 0.064
(<.001) (<.001) (<.001) (<.001)Standard Deviation of Mid-quote Returns -0.843 0.561 -0.128 0.071
(<.001) (<.001) (<.001) (<.001)High-Low/High (CRSP) -0.658 0.329 -0.149 0.085
(<.001) (<.001) (<.001) (<.001)
TABLE 8. SIMULTANEOUS EQUATION MODEL: DARK POOL ACTIVITY AND MARKET QUALITY BY SIZEThe table reports the results of analyzing the relationship between Dark Pool activity and Market Quality. We measure Dark Pool activity as RELDP, which is defined as 100 times SIFMA reported daily Dark Pool single-counted share volume divided by daily consolidated volume as reported in CRSP. Market quality measures are described in Table 3. Due to the potential simultaneity between market quality and dark pool activity, we estimate the following two-equation simultaneous equation model for RELDP and the following market quality measures (MQMs): Time-Weighted Quoted Spread in Percent and Cents; Share-weighted Effective Spread in Percent and Cents; (log of) Time-weighted Bid-depth; (log) of Share volume; Standard deviation of Mid-quote Returns; and High-Low/High:
MQMi,t = a1RELDPi,t + a2MQMnoti,t + e1,tRELDPi,t = b1MQMi,t + b2RELDPnoti,t + e2,t
As an instrument for RELDPi,t we use RELDPnoti,t, which is the average Dark Pool activity of other stocks listed on the same exchange, in the same market capitalization grouping (SMALL, MEDIUM, LARGE), and with the same two-digit SIC code (excluding stock i). Similarly, as an instrument for MQMi,t we use MQMnoti,t, which is the average Market Quality Measure for other stocks listed on the same exchange, in the same market capitalization grouping (LARGE, MEDIUM, SMALL), and with the same two-digit SIC code (excluding stock i). We estimate the simultaneous equation model by pooling observations across all stocks and days in the sample. To make the pooling meaningful, we de-mean all variables by deducting the stock-specific average and scale all variables by dividing by the stock-specific standard deviation to control for stock fixed effects. We report the estimated coefficients on top and p-values below . The results for the SMALL caps are reported in Panel A, for MEDIUM caps in Panel B, and for LARGE caps in Panel C. SMALL includes stocks with market capitalization less than $50 million, MEDIUM includes stocks with market capitalization between $50 million and $1 billion, and LARGE includes stocks with market capitalization of $1 billion and more.
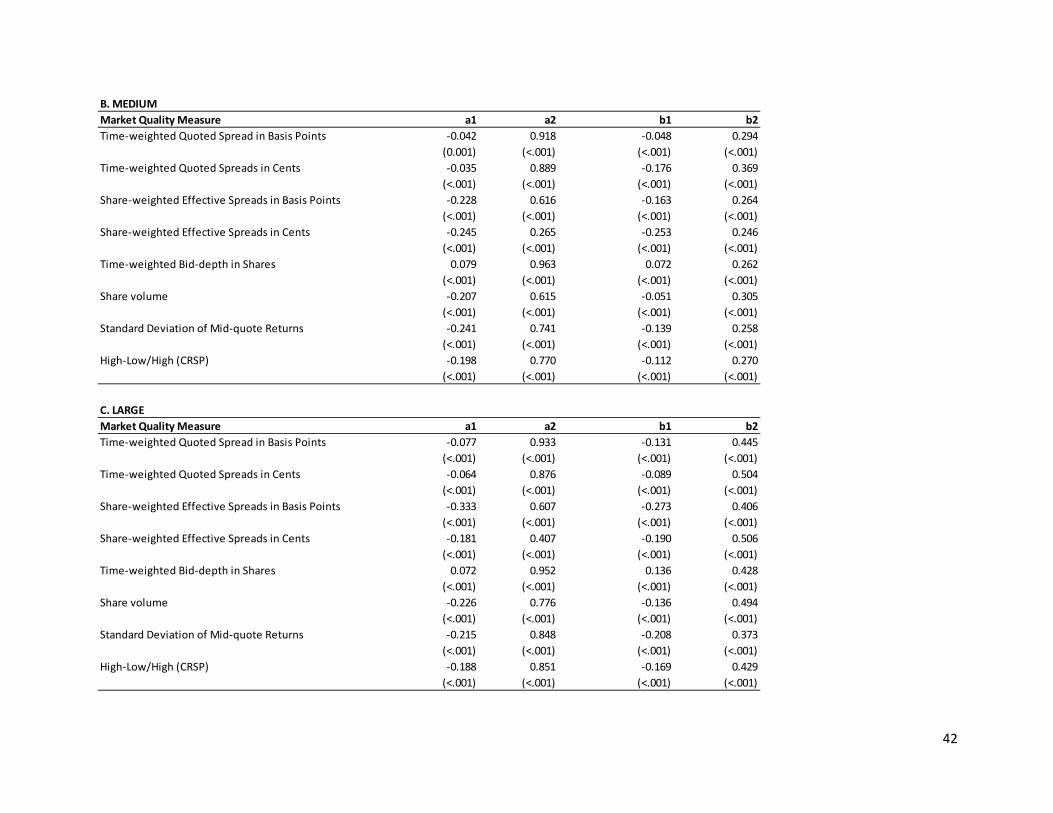
42
B. MEDIUMMarket Quality Measure a1 a2 b1 b2Time-weighted Quoted Spread in Basis Points -0.042 0.918 -0.048 0.294
(0.001) (<.001) (<.001) (<.001)Time-weighted Quoted Spreads in Cents -0.035 0.889 -0.176 0.369
(<.001) (<.001) (<.001) (<.001)Share-weighted Effective Spreads in Basis Points -0.228 0.616 -0.163 0.264
(<.001) (<.001) (<.001) (<.001)Share-weighted Effective Spreads in Cents -0.245 0.265 -0.253 0.246
(<.001) (<.001) (<.001) (<.001)Time-weighted Bid-depth in Shares 0.079 0.963 0.072 0.262
(<.001) (<.001) (<.001) (<.001)Share volume -0.207 0.615 -0.051 0.305
(<.001) (<.001) (<.001) (<.001)Standard Deviation of Mid-quote Returns -0.241 0.741 -0.139 0.258
(<.001) (<.001) (<.001) (<.001)High-Low/High (CRSP) -0.198 0.770 -0.112 0.270
(<.001) (<.001) (<.001) (<.001)
C. LARGEMarket Quality Measure a1 a2 b1 b2Time-weighted Quoted Spread in Basis Points -0.077 0.933 -0.131 0.445
(<.001) (<.001) (<.001) (<.001)Time-weighted Quoted Spreads in Cents -0.064 0.876 -0.089 0.504
(<.001) (<.001) (<.001) (<.001)Share-weighted Effective Spreads in Basis Points -0.333 0.607 -0.273 0.406
(<.001) (<.001) (<.001) (<.001)Share-weighted Effective Spreads in Cents -0.181 0.407 -0.190 0.506
(<.001) (<.001) (<.001) (<.001)Time-weighted Bid-depth in Shares 0.072 0.952 0.136 0.428
(<.001) (<.001) (<.001) (<.001)Share volume -0.226 0.776 -0.136 0.494
(<.001) (<.001) (<.001) (<.001)Standard Deviation of Mid-quote Returns -0.215 0.848 -0.208 0.373
(<.001) (<.001) (<.001) (<.001)High-Low/High (CRSP) -0.188 0.851 -0.169 0.429
(<.001) (<.001) (<.001) (<.001)

43
Market Quality Measure a1 a2 b1 b2Time-weighted Quoted Spread in Basis Points -0.014 0.939 -0.065 0.359
(0.027) (<.001) (<.001) (<.001)Time-weighted Quoted Spreads in Cents 0.000 0.868 -0.048 0.381
(0.627) (<.001) (<.001) (<.001)Share-weighted Effective Spreads in Basis Points -0.140 0.556 -0.145 0.367
(<.001) (<.001) (<.001) (<.001)Share-weighted Effective Spreads in Cents -0.106 0.310 -0.114 0.395
(<.001) (<.001) (<.001) (<.001)Time-weighted Bid-depth in Shares 0.153 1.025 0.058 0.371
(<.001) (<.001) (<.001) (<.001)Share volume -0.085 0.705 -0.015 0.403
(<.001) (<.001) (<.001) (<.001)Standard Deviation of Mid-quote Returns -0.105 0.785 -0.109 0.344
(<.001) (<.001) (<.001) (<.001)High-Low/High (CRSP) -0.092 0.790 -0.087 0.377
(<.001) (<.001) (<.001) (<.001)
TABLE 9. STOCK-BY-STOCK ESTIMATION OF SIMULTANEOUS EQUATION MODEL: DARK POOL ACTIVITY AND MARKET QUALITY The table reports the results of analyzing the relationship between Dark Pool activity and Market Quality. We measure Dark Pool activity as RELDP, which is defined as 100 times SIFMA reported daily Dark Pool single-counted share volume divided by daily consolidated volume as reported in CRSP. Market quality measures are described in Table 3. Due to the potential simultaneity between market quality and dark pool activity, we estimate the following stock-by-stock two-equation simultaneous equation model for RELDP and the following market quality measures (MQMs): Time-Weighted Quoted Spread in Percent and Cents; Share-weighted Effective Spread in Percent and Cents; (log of) Time-weighted Bid-depth; (log) of Share volume; Standard deviation of Mid-quote Returns; and High-Low/High:
MQMi,t = a1RELDPi,t + a2MQMnoti,t + e1,t
RELDPi,t = b1MQMi,t + b2RELDPnoti,t + e2,t
As an instrument for RELDPi,t we use RELDPnoti,t, which is the average Dark Pool activity of other stocks listed on the same exchange, in the same market capitalization grouping (LARGE, MEDIUM, SMALL), and with the same two-digit SIC code (excluding stock i). Similarly, as an instrument for MQMi,t we use MQMnoti,t, which is the average Market Quality Measure for other stocks listed on the same exchange, in the same market capitalization grouping (LARGE, MEDIUM, SMALL), and with the same two-digit SIC code (excluding stock i). We estimate the simultaneous equation model by pooling observations across all stocks and days in the sample. To make the pooling meaningful, we de-mean all variables by deducting the stock-specific average and scale all variables by dividing by the stock-specific standard deviation to control for stock fixed effects. We report the median estimated coefficients on top and the p-valuefor a Signed Rank Test below .

44
A. INCLUDING OVERNIGHT RETURNPrice Efficiency Measure Observations Mean StDevStandard Deviation of 15-minute Returns 48,723 1.049 0.723Standard Deviation of 30-minute Returns 48,723 1.374 0.927Variance Ratio 48,723 -0.111 0.141Absolute Variance Ratio 48,723 0.139 0.113Autocorrelation of 15-minute Returns 48,723 -0.110 0.135Absolute Autocorrelation of 15-min Returns 48,723 0.137 0.108
B. EXCLUDING OVERNIGHT, OPEN AND CLOSE RETURNSPrice Efficiency Measure Observations Mean StDevStandard Deviation of 15-minute Returns 48,196 0.774 0.537Standard Deviation of 30-minute Returns 48,196 1.051 0.717Variance Ratio 48,196 -0.068 0.101Absolute Variance Ratio 48,196 0.094 0.077Autocorrelation of 15-minute Returns 48,196 -0.023 0.090Absolute Autocorrelation of 15-min Returns 48,196 0.071 0.060
TABLE 10. DESCRIPTIVE STATISTICS PRICE EFFICIENCYThe table reports descriptive statistics based on monthly stock level data for the SIFMA sample. Standard Deviations are based on midquote returns and the Variance Ratio is defined as (σ22(2)/σ12 - 1), where σ22(2) is the adjusted estimator of the variance of 30-minute midquote returns and σ12 is the adjusted estimator of the variance of 15-midquote minute returns. Standard Deviations of midquote returns are multipled by 100.

45
A. RELDPPrice Efficiency Measure Low 2 3 4 High High-Low t-statisticStandard Deviation of 15-minute Returns 5.373 5.590 5.126 4.065 2.190 -3.183 -10.78Standard Deviation of 30-minute Returns 5.324 5.483 5.090 4.132 2.287 -3.037 -10.37Absolute Variance Ratio 5.329 5.165 4.750 4.011 3.062 -2.267 -9.34Absolute Autocorrelation of 15-minute Returns 5.286 5.137 4.724 4.048 3.120 -2.167 -8.82
B. COUNTDPPrice Efficiency Measure Low 2 3 4 High High-Low t-statisticStandard Deviation of 15-minute Returns 7.752 6.891 5.603 3.828 1.921 -5.831 -24.92Standard Deviation of 30-minute Returns 7.509 6.663 5.566 4.044 2.215 -5.294 -22.08Absolute Variance Ratio 7.435 6.954 5.823 3.830 1.953 -5.483 -28.93Absolute Autocorrelation of 15-minute Returns 7.375 6.920 5.791 3.901 2.008 -5.368 -28.09
C. RELDPPrice Efficiency Measure Low 2 3 4 High High-Low t-statisticStandard Deviation of 15-minute Returns 5.301 5.550 5.147 4.147 2.263 -3.038 -14.90Standard Deviation of 30-minute Returns 5.264 5.477 5.101 4.210 2.356 -2.909 -14.41Absolute Variance Ratio 5.128 5.025 4.748 4.210 3.297 -1.831 -10.03Absolute Autocorrelation of 15-minute Returns 5.044 4.974 4.724 4.271 3.395 -1.649 -8.81
D. COUNTDPPrice Efficiency Measure Low 2 3 4 High High-Low t-statisticStandard Deviation of 15-minute Returns 7.601 6.802 5.608 4.021 2.091 -5.511 -32.36Standard Deviation of 30-minute Returns 7.434 6.650 5.569 4.150 2.320 -5.114 -30.82Absolute Variance Ratio 6.835 6.555 5.835 4.439 2.459 -4.376 -19.73Absolute Autocorrelation of 15-minute Returns 6.754 6.496 5.774 4.500 2.599 -4.155 -18.88
TABLE 11. DARK POOL ACTIVITY AND PRICE EFFICIENCYThe table reports average dark pool activity for quintile portfolios sorted monthly by price efficiency measure based on stock level data for the SIMFA sample. RELDP is 100 times SIFMA reported monthly average daily Dark Pool single-counted share volume divided by average daily consolidated volume as reported in CRSP. COUNTDP is the monthly average daily number of active Dark Pools per stock. Standard Deviations are based on midquote returns and the Variance Ratio is defined as (σ22(2)/σ12 - 1), where σ22(2) is the adjusted estimator of the variance of 30-minute returns and σ12 is the adjusted estimator of the variance of 15-minute returns. Standard Deviations of midquote returns are multipled by 100. The table reports time-series averages of monthly means based on monthly sorts of stocks into quintile price efficiency portfolios. Panels A and B include overnight returns and Panels C and D exclude overnight and the open and the close return. The t-tests are based on the time series of the difference in the monthly average dark pool activity between the High and Low portfolios.

46
TABLE 12. SIMULTANEOUS EQUATION MODEL: DARK POOL ACTIVITY AND PRICE EFFICIENCY BY EXCHANGE
A. SIFMA SamplePrice Efficiency Measure a1 a2 b1 b2Standard Deviation of 15-minute Returns -0.234 0.815 -0.233 0.464
(<.001) (<.001) (<.001) (<.001)Standard Deviation of 30-minute Returns -0.221 0.826 -0.229 0.465
(<.001) (<.001) (<.001) (<.001)Absolute Variance Ratio 0.070 0.323 0.108 0.654
(<.001) (<.001) (0.003) (<.001)Absolute Autocorrelation of 15-minute Returns 0.069 0.309 0.104 0.655
(<.001) (<.001) (0.007) (<.001)
The table reports the results of analyzing the relationship between Dark Pool activity and Price Efficiency at the monthly frequency. We measure Dark Pool activity as RELDP, which is defined as 100 times the monthly average SIFMA reported daily Dark Pool single-counted share volume divided by daily consolidated volume as reported in CRSP. Standard Deviations and Autocorrelations are monthly averages based on midquote returns including the overnight return. The monthly Variance Ratio is defined as (σ22(2)/σ12 - 1), where σ22(2) is the adjusted estimator of the variance of 30-minute returns and σ12 is the adjusted estimator of the variance of 15-minute returns (Lo and MacKinley (1988)). Standard Deviations of midquote returns are multipled by 100. Due to the potential simultaneity between Price Efficiency and dark pool activity, we estimate the following two-equation simultaneous equation model for RELDP and the following price efficiency (PEs): Standard Deviation of 15-minute Returns, Standard Deviation of 20-minute Returns, Variance Ratio, and Autocorrelation:
PEi,t = a1RELDPi,t + a2PEnoti,t + e1,tRELDPi,t = b1PEi,t + b2RELDPnoti,t + e2,t
As an instrument for RELDPi,t we use RELDPnoti,t, which is the average Dark Pool activity of other stocks listed on the same exchange, in the same market capitalization grouping (LARGE, MEDIUM, SMALL), and with the same two-digit SIC code (excluding stock i). Similarly, as an instrument for PEi,t we use PEnoti,t, which is the average Price Efficiency for other stocks listed on the same exchange, in the same market capitalization grouping (LARGE, MEDIUM, SMALL), and with the same two-digit SIC code (excluding stock i). We estimate the simultaneous equation model by pooling observations across all stocks and months in the sample. To make the pooling meaningful, we de-mean all variables by deducting the stock-specific average and scale all variables by dividing by the stock-specific standard deviation to control for stock fixed effects. We report the estimated coefficients on top and p-values below . The results for the SIFMA sample are reported in Panel A, for Nasdaq stocks in Panel B, and for NYSE stocks in Panel C.

47
B. NYSE-listed StocksPrice Efficiency Measure a1 a2 b1 b2Standard Deviation of 15-minute Returns -0.242 0.829 -0.292 0.434
(<.001) (<.001) (<.001) (<.001)Standard Deviation of 30-minute Returns -0.216 0.848 -0.279 0.446
(<.001) (<.001) (<.001) (<.001)Absolute Variance Ratio -0.032 0.245 -0.093 0.727
(0.091) (<.001) (0.222) (<.001)Absolute Autocorrelation of 15-minute Returns -0.030 0.249 -0.091 0.727
(0.113) (<.001) (0.230) (<.001)
C. NASDAQ-listed StocksPrice Efficiency Measure a1 a2 b1 b2Standard Deviation of 15-minute Returns -0.149 0.832 -0.170 0.525
(<.001) (<.001) (<.001) (<.001)Standard Deviation of 30-minute Returns -0.141 0.869 -0.168 0.523
(<.001) (<.001) (<.001) (<.001)Absolute Variance Ratio 0.156 0.377 0.213 0.625
(<.001) (<.001) (<.001) (<.001)Absolute Autocorrelation of 15-minute Returns 0.153 0.343 0.226 0.626
(<.001) (<.001) (0.002) (<.001)
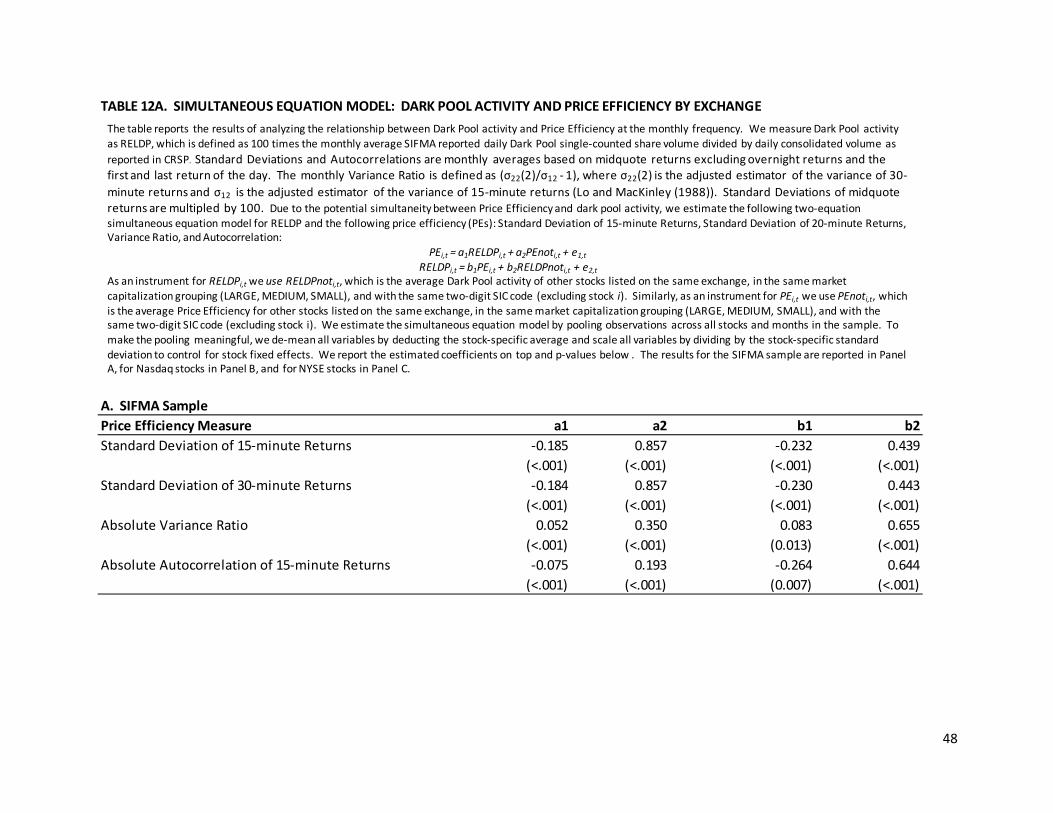
48
TABLE 12A. SIMULTANEOUS EQUATION MODEL: DARK POOL ACTIVITY AND PRICE EFFICIENCY BY EXCHANGE
A. SIFMA SamplePrice Efficiency Measure a1 a2 b1 b2Standard Deviation of 15-minute Returns -0.185 0.857 -0.232 0.439
(<.001) (<.001) (<.001) (<.001)Standard Deviation of 30-minute Returns -0.184 0.857 -0.230 0.443
(<.001) (<.001) (<.001) (<.001)Absolute Variance Ratio 0.052 0.350 0.083 0.655
(<.001) (<.001) (0.013) (<.001)Absolute Autocorrelation of 15-minute Returns -0.075 0.193 -0.264 0.644
(<.001) (<.001) (0.007) (<.001)
The table reports the results of analyzing the relationship between Dark Pool activity and Price Efficiency at the monthly frequency. We measure Dark Pool activity as RELDP, which is defined as 100 times the monthly average SIFMA reported daily Dark Pool single-counted share volume divided by daily consolidated volume as reported in CRSP. Standard Deviations and Autocorrelations are monthly averages based on midquote returns excluding overnight returns and the first and last return of the day. The monthly Variance Ratio is defined as (σ22(2)/σ12 - 1), where σ22(2) is the adjusted estimator of the variance of 30-minute returns and σ12 is the adjusted estimator of the variance of 15-minute returns (Lo and MacKinley (1988)). Standard Deviations of midquote returns are multipled by 100. Due to the potential simultaneity between Price Efficiency and dark pool activity, we estimate the following two-equation simultaneous equation model for RELDP and the following price efficiency (PEs): Standard Deviation of 15-minute Returns, Standard Deviation of 20-minute Returns, Variance Ratio, and Autocorrelation:
PEi,t = a1RELDPi,t + a2PEnoti,t + e1,t
RELDPi,t = b1PEi,t + b2RELDPnoti,t + e2,tAs an instrument for RELDPi,t we use RELDPnoti,t, which is the average Dark Pool activity of other stocks listed on the same exchange, in the same market capitalization grouping (LARGE, MEDIUM, SMALL), and with the same two-digit SIC code (excluding stock i). Similarly, as an instrument for PEi,t we use PEnoti,t, which is the average Price Efficiency for other stocks listed on the same exchange, in the same market capitalization grouping (LARGE, MEDIUM, SMALL), and with the same two-digit SIC code (excluding stock i). We estimate the simultaneous equation model by pooling observations across all stocks and months in the sample. To make the pooling meaningful, we de-mean all variables by deducting the stock-specific average and scale all variables by dividing by the stock-specific standard deviation to control for stock fixed effects. We report the estimated coefficients on top and p-values below . The results for the SIFMA sample are reported in Panel A, for Nasdaq stocks in Panel B, and for NYSE stocks in Panel C.

49
B. NYSE-listed StocksPrice Efficiency Measure a1 a2 b1 b2Standard Deviation of 15-minute Returns -0.143 0.898 -0.281 0.417
(<.001) (<.001) (<.001) (<.001)Standard Deviation of 30-minute Returns -0.137 0.902 -0.274 0.427
(<.001) (<.001) (<.001) (<.001)Absolute Variance Ratio 0.032 0.411 0.030 0.728
(0.085) (<.001) (0.454) (<.001)Absolute Autocorrelation of 15-minute Returns -0.069 0.285 -0.160 0.719
(<.001) (<.001) (0.013) (<.001)
C. NASDAQ-listed StocksPrice Efficiency Measure a1 a2 b1 b2Standard Deviation of 15-minute Returns -0.116 0.889 -0.171 0.503
(<.001) (<.001) (<.001) (<.001)Standard Deviation of 30-minute Returns -0.121 0.887 -0.172 0.503
(<.001) (<.001) (<.001) (<.001)Absolute Variance Ratio 0.083 0.343 0.150 0.646
(<.001) (<.001) (<.001) (<.001)Absolute Autocorrelation of 15-minute Returns -0.076 0.134 -0.416 0.635
(<.001) (<.001) (0.009) (<.001)

50
TABLE 13. SIMULTANEOUS EQUATION MODEL: DARK POOL ACTIVITY AND PRICE EFFICIENCY BY SIZE
A. SMALLPrice Efficiency Measure a1 a2 b1 b2Standard Deviation of 15-minute Returns -0.238 0.688 -0.168 0.381
(<.001) (<.001) (<.001) (<.001)Standard Deviation of 30-minute Returns -0.254 0.692 -0.184 0.358
(<.001) (<.001) (<.001) (<.001)Absolute Variance Ratio 0.343 0.221 0.502 0.335
(<.001) (<.001) (<.001) (<.001)Absolute Autocorrelation of 15-minute Returns 0.326 0.243 0.451 0.347
(<.001) (<.001) (<.001) (<.001)
The table reports the results of analyzing the relationship between Dark Pool activity and Price Efficiency at the monthly frequency. We measure Dark Pool activity as RELDP, which is defined as 100 times the monthly average SIFMA reported daily Dark Pool single-counted share volume divided by daily consolidated volume as reported in CRSP. Standard Deviations and Autocorrelations are monthly averags based on midquote returns. The monthly Variance Ratio is defined as (σ22(2)/σ12 -1), where σ22(2) is the adjusted estimator of the variance of 30-minute returns and σ12 is the adjusted estimator of the variance of 15-minute returns (Lo and MacKinley (1988)). Standard Deviations of midquote returns are multipled by 100. Due to the potential simultaneity between Price Efficiency and dark pool activity, we estimate the following two-equation simultaneous equation model for RELDP and the following price efficiency (PEs): Standard Deviation of 15-minute Returns, Standard Deviation of 20-minute Returns, Variance Ratio, and Autocorrelation:
PEi,t = a1RELDPi,t + a2PEnoti,t + e1,t
RELDPi,t = b1PEi,t + b2RELDPnoti,t + e2,tAs an instrument for RELDPi,t we use RELDPnoti,t, which is the average Dark Pool activity of other stocks listed on the same exchange, in the same market capitalization grouping (LARGE, MEDIUM, SMALL), and with the same two-digit SIC code (excluding stock i). Similarly, as an instrument for PEi,t we use PEnoti,t, which is the average Price Efficiency for other stocks listed on the same exchange, in the same market capitalization grouping (LARGE, MEDIUM, SMALL), and with the same two-digit SIC code (excluding stock i). We estimate the simultaneous equation model by pooling observations across all stocks and months in the sample. To make the pooling meaningful, we de-mean all variables by deducting the stock-specific average and scale all variables by dividing by the stock-specific standard deviation to control for stock fixed effects. We report the estimated coefficients on top and p-values below . The results for the SMALL caps are reported in Panel A, for MEDIUM caps in Panel B, and for LARGE caps in Panel C.

51
B. MEDIUMPrice Efficiency Measure a1 a2 b1 b2Standard Deviation of 15-minute Returns -0.217 0.853 -0.194 0.393
(<.001) (<.001) (<.001) (<.001)Standard Deviation of 30-minute Returns -0.198 0.866 -0.187 0.396
(<.001) (<.001) (<.001) (<.001)Absolute Variance Ratio 0.085 0.337 0.123 0.549
(0.002) (<.001) (0.021) (<.001)Absolute Autocorrelation of 15-minute Returns 0.088 0.291 0.141 0.548
(0.002) (<.001) (0.026) (<.001)
C. LARGEPrice Efficiency Measure a1 a2 b1 b2Standard Deviation of 15-minute Returns -0.207 0.837 -0.322 0.498
(<.001) (<.001) (<.001) (<.001)Standard Deviation of 30-minute Returns -0.192 0.850 -0.310 0.511
(<.001) (<.001) (<.001) (<.001)Absolute Variance Ratio 0.011 0.332 0.003 0.834
(0.496) (<.001) (0.962) (<.001)Absolute Autocorrelation of 15-minute Returns 0.006 0.336 -0.007 0.834
(0.588) (<.001) (0.898) (<.001)

52
TABLE 13A. SIMULTANEOUS EQUATION MODEL: DARK POOL ACTIVITY AND PRICE EFFICIENCY BY SIZE
A. SMALLPrice Efficiency Measure a1 a2 b1 b2Standard Deviation of 15-minute Returns -0.280 0.676 -0.208 0.329
(<.001) (<.001) (<.001) (<.001)Standard Deviation of 30-minute Returns -0.294 0.669 -0.214 0.326
(<.001) (<.001) (<.001) (<.001)Absolute Variance Ratio 0.010 0.053 -0.357 0.422
(0.850) (0.047) (0.468) (<.001)Absolute Autocorrelation of 15-minute Returns -0.158 0.110 -0.650 0.374
(0.003) (<.001) (0.010) (<.001)
The table reports the results of analyzing the relationship between Dark Pool activity and Price Efficiency at the monthly frequency. We measure Dark Pool activity as RELDP, which is defined as 100 times the monthly average SIFMA reported daily Dark Pool single-counted share volume divided by daily consolidated volume as reported in CRSP. Standard Deviations and Autocorrelations are monthly averages based on midquote returns excluding overnight returns and the first and last return of the day. The monthly Variance Ratio is defined as (σ22(2)/σ12 - 1), where σ22(2) is the adjusted estimator of the variance of 30-minute returns and σ12 is the adjusted estimator of the variance of 15-minute returns (Lo and MacKinley (1988)). Standard Deviations of midquote returns are multipled by 100. Due to the potential simultaneity between Price Efficiency and dark pool activity, we estimate the following two-equation simultaneous equation model for RELDP and the following price efficiency (PEs): Standard Deviation of 15-minute Returns, Standard Deviation of 20-minute Returns, Variance Ratio, and Autocorrelation:
PEi,t = a1RELDPi,t + a2PEnoti,t + e1,t
RELDPi,t = b1PEi,t + b2RELDPnoti,t + e2,tAs an instrument for RELDPi,t we use RELDPnoti,t, which is the average Dark Pool activity of other stocks listed on the same exchange, in the same market capitalization grouping (LARGE, MEDIUM, SMALL), and with the same two-digit SIC code (excluding stock i). Similarly, as an instrument for PEi,t we use PEnoti,t, which is the average Price Efficiency for other stocks listed on the same exchange, in the same market capitalization grouping (LARGE, MEDIUM, SMALL), and with the same two-digit SIC code (excluding stock i). We estimate the simultaneous equation model by pooling observations across all stocks and months in the sample. To make the pooling meaningful, we de-mean all variables by deducting the stock-specific average and scale all variables by dividing by the stock-specific standard deviation to control for stock fixed effects. We report the estimated coefficients on top and p-values below . The results for the SMALL caps are reported in Panel A, for MEDIUM caps in Panel B, and for LARGE caps in Panel C.

53
B. MEDIUMPrice Efficiency Measure a1 a2 b1 b2Standard Deviation of 15-minute Returns -0.144 0.895 -0.183 0.388
(<.001) (<.001) (<.001) (<.001)Standard Deviation of 30-minute Returns -0.143 0.897 -0.180 0.390
(<.001) (<.001) (<.001) (<.001)Absolute Variance Ratio 0.089 0.337 0.161 0.547
(0.002) (<.001) (0.020) (<.001)Absolute Autocorrelation of 15-minute Returns -0.136 0.110 -0.664 0.503
(0.002) (<.001) (0.001) (<.001)
C. LARGEPrice Efficiency Measure a1 a2 b1 b2Standard Deviation of 15-minute Returns -0.081 0.938 -0.314 0.470
(<.001) (<.001) (<.001) (<.001)Standard Deviation of 30-minute Returns -0.082 0.937 -0.307 0.481
(<.001) (<.001) (<.001) (<.001)Absolute Variance Ratio 0.031 0.577 0.034 0.832
(0.056) (<.001) (0.234) (<.001)Absolute Autocorrelation of 15-minute Returns -0.027 0.343 -0.031 0.833
(0.104) (<.001) (0.590) (<.001)

54
A. INCLUDING OVERNIGHT RETURNPrice Efficiency Measure a1 a2 b1 b2Standard Deviation of 15-minute Returns -0.051 0.903 -0.130 0.496
(<.001) (<.001) (<.001) (<.001)Standard Deviation of 30-minute Returns -0.048 0.921 -0.147 0.474
(<.001) (<.001) (<.001) (<.001)Absolute Variance Ratio 0.035 0.386 0.000 0.687
(0.999) (<.001) (0.520) (<.001)Absolute Autocorrelation of 15-minute Returns 0.000 0.334 0.000 0.636
(0.820) (<.001) (0.416) (<.001)
B. EXCLUDING OVERNIGHT AND OPEN CLOSE RETURNSPrice Efficiency Measure a1 a2 b1 b2Standard Deviation of 15-minute Returns -0.031 0.971 -0.229 0.544
(<.001) (<.001) (<.001) (<.001)Standard Deviation of 30-minute Returns -0.042 0.967 -0.224 0.584
(<.001) (<.001) (<.001) (<.001)Absolute Variance Ratio 0.000 0.625 0.000 0.908
(0.788) (<.001) (0.885) (<.001)Absolute Autocorrelation of 15-minute Returns -0.005 0.354 0.000 0.917
(0.403) (<.001) (0.433) (<.001)
TABLE 14. STOCK-BY-STOCK SIMULTANEOUS EQUATION MODEL: DARK POOL ACTIVITY AND PRICE EFFICIENCYThe table reports the results of analyzing the relationship between Dark Pool activity and Price Efficiency at the monthly frequency. We measure Dark Pool activity as RELDP, which is defined as 100 times the monthly average SIFMA reported daily Dark Pool single-counted share volume divided by daily consolidated volume as reported in CRSP. Standard Deviations and Autocorrelations are monthly averages based on midquote returns. The monthly Variance Ratio is defined as (σ22(2)/σ12- 1), where σ22(2) is the adjusted estimator of the variance of 30-minute returns and σ12 is the adjusted estimator of the variance of 15-minute returns (Lo and MacKinley (1988)). Standard Deviations of midquote returns are multipled by 100. Due to the potential simultaneity between Price Efficiency and dark pool activity, we estimate the following two-equation simultaneous equation model for RELDP and the following price efficiency (PEs): Standard Deviation of 15-minute Returns, Standard Deviation of 20-minute Returns, Variance Ratio, and Autocorrelation:
PEi,t = a1RELDPi,t + a2PEnoti,t + e1,t
RELDPi,t = b1PEi,t + b2RELDPnoti,t + e2,tAs an instrument for RELDPi,t we use RELDPnoti,t, which is the average Dark Pool activity of other stocks listed on the same exchange, in the same market capitalization grouping (LARGE, MEDIUM, SMALL), and with the same two-digit SIC code (excluding stock i). Similarly, as an instrument for PEi,t we use PEnoti,t, which is the average Price Efficiency for other stocks listed on the same exchange, in the same market capitalization grouping (LARGE, MEDIUM, SMALL), and with the same two-digit SIC code (excluding stock i). We estimate the simultaneous equation model stock-by-stock. To make the pooling meaningful, we de-mean all variables by deducting the stock-specific average and scale all variables by dividing by the stock-specific standard deviation to control for stock fixed effects. We report the median estimated coefficients on top and p-values for a Signed Rank test below.

55
FIGURE 1. Dark Pool Share Volume
FIGURE 2. Dark Pool Relative to Consolidated Volume
0.00
100.00
200.00
300.00
400.00
500.00
600.00
700.00
800.00
900.00
1000.00
Jan Feb Mar Apr May Jun Jul Aug Sep Oct Nov Dec
Mill
ion
Shar
es p
er d
ay
Rosenblatt SIFMA Sample
0.00
2.00
4.00
6.00
8.00
10.00
12.00
Jan Feb Mar Apr May Jun Jul Aug Sep Oct Nov Dec
Perc
ent
Rosenblatt SIFMA Sample

56
FIGURE 3. SIFMA Dark Pool Activity Relative to Rosenblatt
0.00
10.00
20.00
30.00
40.00
50.00
60.00
70.00
Jan Feb Mar Apr May Jun Jul Aug Sep Oct Nov Dec
Perc
ent