division of equity and inclusion december 10, 2020 yvette
TRANSCRIPT

IDEAL: Our Roadmap for a Fully-Inclusive and Resilient Campusi
Division of Equity and Inclusion December 10, 2020
Yvette M. Alex-Assensoh Professor of Political Science &
Vice President, Equity and Inclusion

IDEAL: Our Roadmap for a Fully-Inclusive and Resilient Campus
Page 2 of 25
Contents Executive Summary: ............................................................................................................................... 3
List of Tables and Charts:........................................................................................................................ 5
Introduction: .......................................................................................................................................... 6
Historical Context of IDEAL: .................................................................................................................... 6
Inclusion ............................................................................................................................................. 7
Diversity ............................................................................................................................................. 7
Evaluation ........................................................................................................................................... 7
Achievement ...................................................................................................................................... 7
Leadership .......................................................................................................................................... 7
Outcomes for campus ............................................................................................................................ 8
Goals Met ....................................................................................................................................... 8
Categories of Tactics ...................................................................................................................... 8
Highlights from Figure 4: .............................................................................................................. 10
Communities of Practice .............................................................................................................. 10
Climate ......................................................................................................................................... 11
Developmental Impact of the DAP work .............................................................................................. 12
DAP Constituencies ...................................................................................................................... 13
Catalyzing Change ................................................................................................................................ 14
From Mono-culturalism to Resiliently Inclusive: Data Highlights on the Journey Forward .................. 14
University Leadership and Officers of Administration.................................................................. 15
Faculty, Classified Staff, and Graduate Employees ...................................................................... 16
Student Success ........................................................................................................................... 20
Faculty Achievement .................................................................................................................... 21
Failing Forward and Recommended Next Steps ................................................................................... 24

IDEAL: Our Roadmap for a Fully-Inclusive and Resilient Campus
Page 3 of 25
Executive Summary: In Spring term of 2017, the UO launched the IDEALii framework, activating Diversity Action Plans (DAPs) in 35 units, with the audacious goal of implementing 657 tactics. Just 2.5 years later:
• 58% of DAP tactics were met or in progress. • Our top DAP focus areas: improving departmental climate, student success, professional
development and community outreach. • Our top three focal groups: undergraduate or graduate students, campus at large, and staff.
Very few protected classes received targeted focus. • Promising practices emerged from our DAP work in the following areas: student internships,
implicit bias, active recruitment, institutionalizing diversity committees and professional development. This work will be shared through the communities of practice framework, and as part of the UO implementation of HB2864.
• IDEAL and the DAP work that it generated received the following state-wide, national and professional recognitions: (i) Oregon Department of Education used aspects of IDEAL to build its own internal diversity plan; (ii) the UO Department of Intercollegiate Athletics identified IDEAL as a major partner in BEOREGON, which received the National 2020 NCAA/MOAA Diversity and Inclusion Award; (iii) Communications received 2020 Best of CASE (Council for Advancement and Support of Education) for PATOS: a multimedia approach to supporting the UO Latinx community; and (iv) the UO received its first Insight into Diversity Higher Education Excellence in Diversity (HEED) recognition for excellence in diversity and equity on their campus.
The aforementioned successes provide a firm foundation for the UO to be bolder and more focused in tackling the stubborn, but surmountable inequities that remain: Retention: Black faculty are almost three times more likely to leave the UO than any other under-represented faculty group. Representation:
Native and Pacific Islander faculty continue to comprise the smallest group of UO faculty. While promotions among women of color through the ranks is improving and representation of women in science is increasing, the movement is much too small and too slow.
Leadership Ranks: While the university has made some progress in diversifying its administrative ranks, Native, Pacific Islander and Asian leaders are largely invisible among senior UO leadership ranks. Ongoing attention and support are needed to protect recent gains in gender and racial diversity. Awards: In 2020, campus awards for teaching and research are still disproportionately awarded to faculty who are white and male, leaving much of the expertise that Black, Indigenous, Native, Asian, Desi, Pacific Islander and women bring to our campus under-recognized and under-valued.

IDEAL: Our Roadmap for a Fully-Inclusive and Resilient Campus
Page 4 of 25
Student Success: Student achievement is improving among most students, with the exception of Black students, who are lagging behind every other group. Data Deserts: There are members of our UO community, for whom we do not collect data in ways that can be shared, including but not limited to our LGBTQIA and disabled students, staff and faculty as well as data faith communities, etc. To that end, DEI’s future work focuses intentionally on (i) leveraging research to better identify and institutionalize accountabilities around retention, achievement, inclusive teaching, employee engagement, and enhancing transformational and anti-oppressive leadership; (ii) building additional capacity for faculty, staff, students and leadership to unlearn behavior that facilitates institutional underperformance and underachievement; (iii) institutionalizing ethics of care and respect as a basis for building a respectful campus climate (iv) leveraging our institutional focus on cultural humility to work more consistently and intentionally against anti-black racism and other forms of racism, colonialism, xenophobia, sexism, homophobia, ableism as well as other forms of harm including discrimination based on religion, language, ideology and geography on campus and in society more generally.

IDEAL: Our Roadmap for a Fully-Inclusive and Resilient Campus
Page 5 of 25
List of Tables and Charts: Figure 1 Geography of DAP Tactics ......................................................................................................... 8 Figure 2 Percentage of tactics met by administrative units and academic units .................................... 8 Figure 3 Distribution of met tactics from unit DAPs to the five pillars of the IDEAL Framework ............ 9 Figure 4 Categories of tactics; number of units engaged in work in that category, and percentage of tactics that the work represents. ........................................................................................................... 9 Figure 5 Units across campus employing similar DAP tactics .............................................................. 11 Figure 6 Update on Climate Survey Work ............................................................................................. 11 Figure 7 Impact that units' met tactics have in affecting change across campus ................................. 12 Figure 8 Constituencies served through units' met DAP tactics ........................................................... 13 Figure 9 Underrepresented groups specifically served through units' met DAP tactics ...................... 14 Figure 10 Compares UO Administrators' gender and ethnicity in 2015 to 2020. Source: UO Institutional Research ........................................................................................................................... 15 Figure 11 Officers of administration of color as a percentage of all OAs from AY 2010 to AY 2019. Source: UO Institutional Research ........................................................................................................ 16 Figure 12 Tenure track faculty of color as a percentage of all TTF from AY 2010 to AY 2019. Source: UO Institutional Research. .................................................................................................................... 16 Figure 13 Non-tenure track faculty of color as a percentage of all NTTF from AY 2010 to AY 2019. Source: UO Institutional Research ........................................................................................................ 17 Figure 14 Women in the Sciences 2015 V 2020 ................................................................................... 17 Figure 15 Classified staff of color as a percentage of all classified staff from AY 2010 to AY 2020. Source: UO Institutional Research ........................................................................................................ 18 Figure 16 Graduate employees of color as a percentage of all GEs from AY 2010 to AY 2019. Source: UO Institutional Research ..................................................................................................................... 18 Figure 17 Percent of faculty hired since AY 2013-14 who are no longer at the UO in AY 2019-20. Source: UO Institutional Research ........................................................................................................ 19 Figure 18 Female tenure related faculty of color in 2015 and in 2019. Source: UO Institutional Research. .............................................................................................................................................. 19 Figure 19 Other graduation rate trends. Source: Undergraduate Education & Student Success ......... 20 Figure 20 Six-year graduation rates based on beginning cohort years 2010-2014. Source: UO Institutional Research ........................................................................................................................... 20 Figure 21 Gender distribution of tenure-related faculty from AY 2010 to AY 2019. Source: UO Institutional Research ........................................................................................................................... 21 Figure 22 Gender distribution of non-tenure related faculty from AY 2010 to AY 2019. Source: UO Institutional Research ........................................................................................................................... 21 Figure 23 Race/ethnicity distribution of faculty research awards 2013-14 through 2019-20. Source: UO Institutional Research. .................................................................................................................... 22 Figure 24 Gender distribution of Faculty Research Awards from 2013-14 through 2019-20. Source: UO Institutional Research ..................................................................................................................... 22 Figure 25 Race/ethnicity distribution of faculty teaching awards 2013-14 through 2019-20. Source: UO Institutional Research. .................................................................................................................... 23 Figure 26 Gender distribution of faculty teaching awards 2013-14 through 2019-20. Source: UO Institutional Research. .......................................................................................................................... 23

IDEAL: Our Roadmap for a Fully-Inclusive and Resilient Campus
Page 6 of 25
Introduction: Nationwide, higher education leaders are working with uncommon speed; some might even say scrambling, to address the inequities and institutional racism clearly exposed by COVID-19iii and the murders of George Floyd, Breonna Taylor and many others. During this time, it is impossible to turn away from the inculpating evidence of racial, gender, class, ableist, religious, immigrant and sexual oppression that undergirds American life. Yet, the onset of this Report began almost 5 years ago, when our campus embarked on the work of incorporating IDEAL (Inclusion, Diversity, Evaluation, Achievement and Leadership) into the fabric of campus life. IDEAL represents an important milestone in the UO’s overall journey to build capacity for equity and inclusion. Indeed, it is foundational to the more targeted, generative and creative work that lies ahead. The goal of the report is to provide an overview of what we, as a campus, accomplished together. This report provides:
• an introduction to newcomers, • a high-level analysis for those who were deeply involved in the work, and • an invitation to the courageous and intentional work that lies ahead.
From the onset of IDEAL in 2016, our goal was to encourage 100% participation. We strove to inspire our UO community members to lean in and dream big as they engaged in the deep, uncomfortable and systemic work that is necessary to achieve transformative change. And dream big they did. At the end of the Diversity Action planning phase, our 35 units had proposed 657 tactics. We encouraged units to design living documents to guide the work moving forward, with the goal of checking in on our status in about three years. Fall 2019 marked the end of the approximately three-year implementation period. We spent the Winter and Spring terms meeting with colleagues, then used the summer to analyze the findings. This report describes what we accomplished together, but more importantly, it sets the stage for more transformative anti-racism, broader anti-oppression and equity work that lies ahead.
Historical Context of IDEAL: At the core of the IDEAL framework is a deep love for the people and the State of Oregon. We hope to encourage Oregon to create a better version of itself, one that mirrors the breathtaking beauty of its environment. While Oregon is known for its abundance of trees, lush landscapes, and progressive reputation, much of its history is built on an ugly foundation of racial exclusion and oppression. For example, the University of Oregon is located on Kalapuya Ilihi, the traditional indigenous homeland of the Kalapuya people. Following treaties between 1851 and 1855, Kalapuya people were dispossessed of their indigenous homeland by the United States government and forcibly removed to the Coast Reservation in Western Oregon. Today, descendants are citizens of the Confederated Tribes of Grand Ronde Community of Oregon and the Confederated Tribes of the Siletz Indians of Oregon. They continue to make important contributions in their communities, at UO, and across the land we now refer to as Oregon. Additionally, Oregon also distinguished itself as the only State in the union to ban Black people from settling within its borders with a series of Black exclusion laws starting in 1844. Other major historical atrocities include, but are not limited to, the exploitation of Chinese and Latinx labor and the use of Japanese internment camps. Yet, Black, ADPI, Latinx, Native

IDEAL: Our Roadmap for a Fully-Inclusive and Resilient Campus
Page 7 of 25
and Whites contributed to the building of the place that is now known as Oregon. As a leading institution of higher learning, it is important to acknowledge the ways in which racism, oppression and exclusion live on in institutions, policies and processes across our State. With Oregon’s history as an important context, the IDEAL framework is one mechanism for re-fashioning the State and the UO into the better versions of themselves. At the UO, we feel that acknowledging this history is deeply American, patriotic and an essential entry point for creating the type of systemic change that benefits all in our campus community, and ultimately the entire State. Comprising two levels of interlocking engagement at the campus and unit levels, respectively, IDEAL is designed to engage these complexities. The framework relies on five pillars:
Inclusion: Cultivating a welcoming environment for all. Diversity: Developing and implementing equitable strategies for recruiting, retaining and advancing students, faculty and staff from all backgrounds and experiences. Evaluation: Using assessment and measurement to evaluate our progress in meeting the university’s goals for equity and inclusion. Achievement: Ensuring that our policies, processes and practices provide access for all in reaching their personal best. Leadership: Developing, nurturing and coaching leadership to facilitate inclusive environments as well as the resources for success.
At the unit level, individual academic and administrative units employ IDEAL to embed promising practices, improvements and change. Building on the work of the UO’s first strategic plan, the coordinating piece of IDEAL was birthed amid rapid campus change and transition. With the support of the University Wide Diversity Committee (UWDC), the initial scope of the plan was formulated in 2013, with the initial rollout in 2014. Before it could it be implemented, two new presidents and the UO Board of Trustees came on the scene. In the midst of previous ongoing change, the UWDC and the President’s Diversity Advisory Committee (PDACC) served as steadying bulwarks consistently working with the Division of Equity and Inclusion (DEI) to remind our campus that broad participation and a plan for embedding equity and inclusion were critical to successfully realizing the UO’s mission. After President Michael Schill’s appointment in July 2015, the Division of Equity, Inclusion and Diversity— and the UWDC—worked to ensure IDEAL aligned with and supported his three university priorities. An updated committee report was presented to President Schill in early 2016, and a final framework was prepared by the president in spring 2016 in consultation with the VPEI and UWDC. In fall 2016, President Schill announced the implementation of IDEAL as a campus-wide initiative in which every unit was required to engage and develop Diversity Action Plans (DAPs). As part of the charge, President Schill stipulated that each unit should have local control over what it decided to undertake (within the context of best practices and legal guidelines), rather than adhering to university-wide objectives. DEI and a small team of leaders from across campus led the way in providing direction and consultation to help design and review plans for each of the 35 units, and evaluate the extent to which proposals were consistent with best practices. We also convened several working groupsiv to examine areas of common concern across campus. Faculty, staff and students lent their time and talent to help address a variety of issues with varying levels of completion, including climate surveys, staff onboarding, leadership development and implicit bias.

IDEAL: Our Roadmap for a Fully-Inclusive and Resilient Campus
Page 8 of 25
Our team of three DEI colleaguesv, with support from our broader DEI team, worked to provide the units with professional development opportunities, individual consultations and support for implementation questions and challenges, all while championing the learning challenges and successes that occurred along the way. In the section below, we outline the overall outcomes of the Diversity Action Planning process.
Outcomes for campus Goals Met Through the DAP development process, faculty, staff and students across 35 academic and administrative units proposed 657 tactics. Two and one-half years later, our colleagues made progress on almost 60% of those goals, while fully meeting about a third of all the goals that were set.
We defined “met” as reaching a stage of completion for each of the specified tactics. As part of the reporting process, each unit specified their progress with tactics, and we used language from their reports to categorize whether tactics were met. We simply trusted each unit to describe what tactics were met, ongoing, or had yet to be started. Since work that is ongoing is not included in the “met” category, there is a much higher percentage of continuing movement taking place than what is represented in Figure I. Consistent with our goals to encourage ongoing engagement with the diversity action planning/implementation process, we encouraged units to see their DAPs as living and ongoing work that is not only responsive but anticipatory. In that vein, units
engaged 20 new tactics along the way because of changing contexts, new leadership, or improved ideas about what should be done.
While administrative and academic units used the same IDEAL framework to plan and execute their tactics, our analysis showed differences in the way that the tactics were accomplished. For example, Figure 2 shows that academic units completed a little more than half of the overall campus DAP work, likely because academic units have more bodies to contribute to the work. Categories of Tactics The initial implementation of IDEAL was all about providing a framework for choice to allow units to “get in
Figure 1 Geography of DAP Tactics
47.3% "Met" tactics
completed by administrative
units
52.7% "Met" tactics
completed by academic units
Figure 2 Percentage of tactics met by administrative units and academic units

IDEAL: Our Roadmap for a Fully-Inclusive and Resilient Campus
Page 9 of 25
where they fit in”. In the section below, we examine how the tactics aligned with the different pillars of IDEAL. Figure 3 illustrates that work in the areas of inclusion (cultivating a welcoming environment for all) and diversity (developing and implementing equitable strategies for recruiting, retaining and advancing students, faculty and staff from all backgrounds and experiences) together represented 60% of DAP implementation tactics. This was followed by a focus on achievement. Less than 15% of the units focused on leadership, and only a small segment of our campus targeted evaluation, which was required during the design phase,
but not during the implementation phase. Within each of the IDEAL pillars, units had an opportunity to design their own programs, policies and processes. Figure 4 provides an overview of the major categories of tactical areas, including three types of information: categories of tactics, the number of units engaged, and the percentage of met tactics represented in this tactical area.
Figure 4 Categories of tactics; number of units engaged in work in that category, and percentage of tactics that the work represents.
3 4 5 17 18 21 22 32 37 39 531.20% 1.59% 1.99%
6.77% 7.17% 8.37% 8.76%
12.75%14.74% 15.54%
21.12%
0.00%
5.00%
10.00%
15.00%
20.00%
25.00%
0
10
20
30
40
50
60
Count % of all met tactics
Figure 3 Distribution of met tactics from unit DAPs to the five pillars of the IDEAL Framework

IDEAL: Our Roadmap for a Fully-Inclusive and Resilient Campus
Page 10 of 25
Highlights from Figure 4: • Over 50 tactics across academic and administrative units focused on efforts to enhance our
campus climate, which represented about one-fifth of all tactics that were met. • At the lower end of the DAP tactics are research programs, which represent 5 tactics and just
under 2% of all met tactics overall. • Community outreach covered a range of areas that engaged students, suppliers, alumni and
friends of UO in efforts to build capacity for equity, inclusion and diversity. It also highlights efforts to nurture development among our community members through professional development opportunities, build a more inclusive leadership culture at the UO and allocate our resources in ways that are more equitable.
• While 8% of all tactics focused on better faculty, staff and student recruitment, another 7% focused on implementing processes to nurture retention across faculty, staff and student populations. These efforts, along with a wide swath of programming focused on student success, are examples of promising work as we focus more intentionally as a campus on ensuring that our students are thriving and prepared for leadership on a global stage.
Communities of Practice The decision to allow each unit to select its own focus led to many different types of work. Figure 5, shows the tactics that units approached in common, along with the units engaged in this work. Moving forward, there is an opportunity to bring these units together to create communities of practice--groups that work collaboratively to address issues across our campus. In a forthcoming companion “Happy Talk” report, we highlight contributions from each of our units, providing an opportunity for campus to learn more about what other units worked on as part of the DAP implementation process. Communities of practice also provide the opportunity to scale up best practices for campus-wide use.
TACTIC UNITS EMPLOYING TACTIC Implicit Bias and other trainings ADV, KC, OGC, OtP, SSEM, VPFA,
VPRI, VPSL, CAS, CHC, DGE, GRAD, IS, LAW, LERC, LIBR,
Active recruitment strategies for hiring, recruitment and retention
KC, OGC, OtP, CAS, COE, IS, LAW, LCB, LIBR UESS
Active and engaged diversity committee ADV, KC, VPFA, CAS, LCB, LIBR Performance evaluations include diversity/inclusion component
ADV, OtP, VPFA, VPSL, ATH
Increase services and impact related to student achievement and success
ADV, OGC, OMB, VPFA
Policies and procedures reflect an inclusive and welcoming environment
KC, OGC, OMB
Provide professional development and service opportunities to staff
SSEM, VPFA, UESS
Integrate education on a culture of diversity, equity, and inclusion into divisional employee orientation
SSEM, VPSL, IS

IDEAL: Our Roadmap for a Fully-Inclusive and Resilient Campus
Page 11 of 25
TACTIC UNITS EMPLOYING TACTIC Develop programs that support, mentor, and prepare members of underrepresented groups for leadership opportunities, including internship programs
OGC, LAW, UOPDX, VPSL, VPFA, ADV, DEI
Exit/Stay Surveys VPFA, OtP, DEI KEY: ADV = Advancement | ATH = Athletics | CAS = College of Arts & Sciences | CHC = Clark Honors College | COE = College of Education | COMM = University Communications | DEI = Equity & Inclusion | GRAD = Graduate School | IS = Information Services | KC = Knight Campus | LAW = School of Law | LCB = Lundquist College of Business | LERC = Labor Education & Research Center | LIBR = Libraries | OGC = Office of the General Counsel | OMB = Ombuds Office | OtP = Office of the Provost | SOJC = School of Journalism & Communication | SOMD = School of Music & Dance | SSEM = Student Services & Enrollment Management | VPFA = Finance & Administration | VPRI = Research & Innovation | VPSL = Student Life | UESS = Undergraduate Education & Student Success |UOPDX = UO Portland
Figure 5 Units across campus employing similar DAP tactics
Climate Over 70% of the unit plans included a desire to implement a unit-level climate survey. This is understandable because campus climate is linked to retention. Based on that feedback, we convened a team of colleagues from academic and administrative units to assess the viability of a campus-wide climate survey focused on inclusion and a respectful workplace. This group made recommendations to the President that we commission a climate survey for our entire campus. Figure 6 outlines the process that was established, including proposal review and the selection of a firm to do the work. However, the contracting process ended during the onset of COVID-19. For understandable reasons, we decided to postpone the campus survey until AY21/22. In the meantime, we are advising units to move forward in rectifying known climate issues in their units and departments, including, but not limited to disrespectful colleagues, unhealthy communication patterns, and micro-aggressions.
Climate Survey Working Group formed and…
Climate Survey Steering Committee formed…
RFP submitted to Purchasing & Contracting
Steering Committee evaluated the six…
Gallup, Inc. selected as top vendor
CAMPUS CLIMATE SURVEY TIMELINE
Figure 6 Update on Climate Survey Work

IDEAL: Our Roadmap for a Fully-Inclusive and Resilient Campus
Page 12 of 25
In keeping with IDEAL’s goal of making equity and inclusion commonplace, the next section of our report examines the depth of engagement that each of the tactics catalyzed.
Developmental Impact of the DAP work Equity and Inclusion work is categorized into three different types of impact. We painstakingly categorized each met tactic into one of the following categories based on typologies from research on equity and inclusion in higher education:vi Emerging: Work that focuses on raising awareness about equity, inclusion and diversity. It is often symbolic, occurring at the surface of the organization. Typically, it is transactional in nature and not directly
linked to levers of institutional change. Although this work is usually driven by leadership, some emerging efforts may build upon local grassroots ideas and initiatives. Developing: Efforts focused on putting infrastructure, policies and processes into place. Developing efforts usually build on either pilot efforts or previous “emerging work.” Developing work often focuses on building relationships and making connections between awareness and practice. Transformative: Efforts focused on the bones and sinew of the organization, with intentionality about shifting the culture, norms, policies and process toward significantly increased inclusion, equity and diversity. Program design at this stage is highly participative, including actors at different levels of the organization, while focusing on developing high-impact processes within units and across campus. While emerging and developing work are important in building muscle for change, it is transformative work that actually shifts the climate and culture of institutions, often in inclusive and anti-oppressive ways. Thirty-eight percent of the met tactics fall into the emerging category (Figure 7). These included one-time programs, beginning efforts or transactional events. It is work aimed at getting faculty, staff and students who are either new to the work or resistant to the work, involved. Efforts include inviting URM researchers to give talks on campus (LCB), convening events that celebrate different cultures and experiences (PDX), community collaborations on immigration issues (LERC); highlighting URM populations in newsletters (VPRI); embedding diversity in website design (DGE); encouraging professional development for women and minorities (GC); increasing awareness of implicit bias (SOMD) and promoting inclusion in the work environment (OMBUDS). Just over 50% of the met tactics fall into the developing category: developing and empowering diversity committees (CAS), establishing equity research groups (COD), prioritizing hiring in programmatic areas that enhance diversity (COE), developing an engagement plan focused on staff retention (IS), developing internship programs that bring Black, Indigenous, Latinx, Asian, Desi, Pacific Islanders and women into careers where they are previously underrepresented (VPFA, SSEM, DEI,
Emerging, 38%
Developing, 52%
Transformative, 9%
Figure 7 Impact that units' met tactics have in affecting change across campus

IDEAL: Our Roadmap for a Fully-Inclusive and Resilient Campus
Page 13 of 25
ADV,VPSL), embedding equity and inclusion into annual performance reviews (SSEM, VPSL), collaborating with Latinx community partners to create a more welcoming environment (JSMA), incorporating accessibility as a criteria for library collections (LIBR); embedding diversity into curriculum (CHC); leadership development and consulting with unions on Labor issues (LERC); Everyday Inclusion, a robust professional development series (VPFA); and incorporating implicit bias into hiring procedures (UESS). The smallest percentage of met tactics is in the transformative category: employing universal design for building (Knight Campus), or sharing authority with the diversity committee to evaluate a VP’s performance in ways that generate meaningful accountability around equity and inclusion (Advancement); conducting exit interviews to ensure that departing employees have opportunities to express concerns and incorporate relevant feedback into policies and processes (LAW); Revising RFP and RFQ documentation to make processes more accessible to small, minority and women-owned businesses (PCS); changing performance evaluation processes to include diversity/inclusion components (ATH); institutionalizing the work of diversity committees in college-level decision-making (CAS) and reforming the multicultural requirement in ways that focus on power, agency and difference (TEP and OtP). In the section below, we examine how IDEAL impacted our staff, students, faculty, community partners and alumni, as it was being implemented. DAP Constituencies Each unit had the opportunity to choose constituency groups. Figure 8 shows that nearly a quarter of all of our DAPs focused on either undergraduate or graduate students, followed by a general focus on all campus constituents. Staff were the third most popular focus of the DAPs, with other foci including community, faculty, and mixed-constituency. In keeping with our goal to become an IDEAL campus, community and State, DAP work also extended to community partners, with a sliver of the work impacting our alumni as well.
Another important over-arching goal of IDEAL is to create a campus where underrepresented groups can grow and thrive. Figure 9 explores how DAP implementation was distributed among underrepresented constituencies on our campus. Of the DAPs that focused on underrepresented
Alumni, 1%
Campus, 21%
Community, 14%
Faculty, 13%
Multi-group,
12%
Staff, 16%
Students, 24%
Figure 8 Constituencies served through units' met DAP tactics
IDEAL: Our Roadmap for a Fully-Inclusive and Resilient Campus
Page 14 of 25
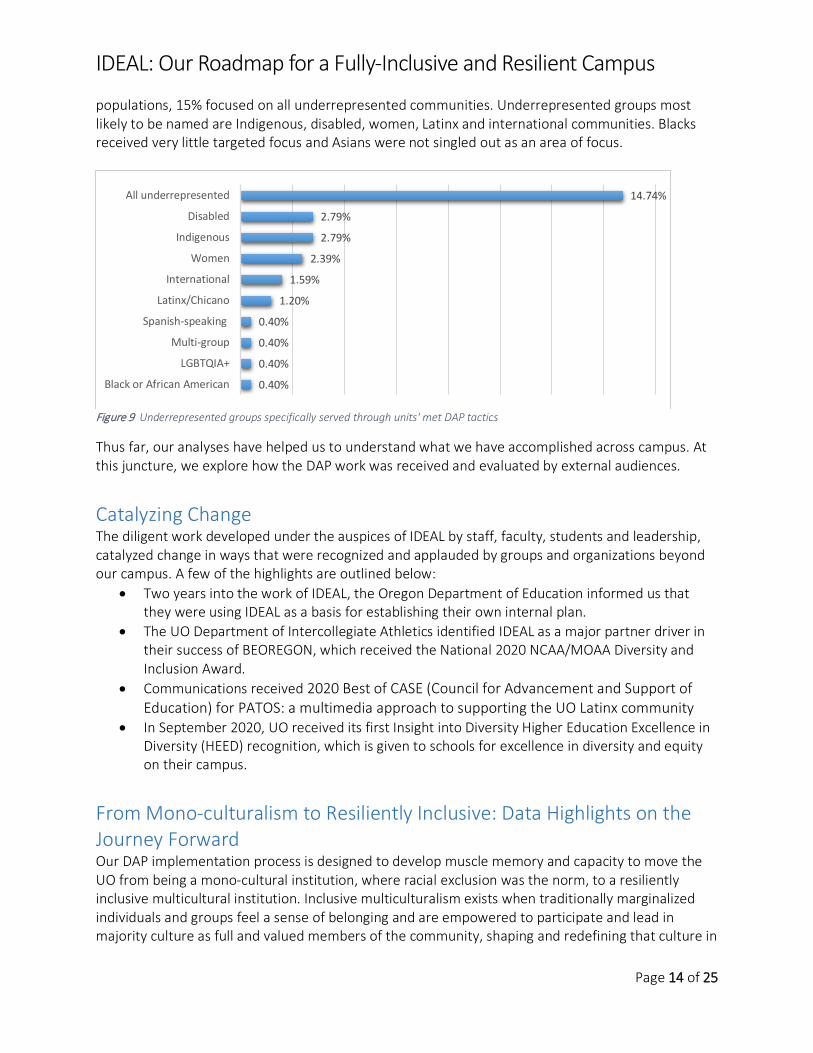
populations, 15% focused on all underrepresented communities. Underrepresented groups most likely to be named are Indigenous, disabled, women, Latinx and international communities. Blacks received very little targeted focus and Asians were not singled out as an area of focus.
Figure 9 Underrepresented groups specifically served through units' met DAP tactics
Thus far, our analyses have helped us to understand what we have accomplished across campus. At this juncture, we explore how the DAP work was received and evaluated by external audiences.
Catalyzing Change The diligent work developed under the auspices of IDEAL by staff, faculty, students and leadership, catalyzed change in ways that were recognized and applauded by groups and organizations beyond our campus. A few of the highlights are outlined below:
• Two years into the work of IDEAL, the Oregon Department of Education informed us that they were using IDEAL as a basis for establishing their own internal plan.
• The UO Department of Intercollegiate Athletics identified IDEAL as a major partner driver in their success of BEOREGON, which received the National 2020 NCAA/MOAA Diversity and Inclusion Award.
• Communications received 2020 Best of CASE (Council for Advancement and Support of Education) for PATOS: a multimedia approach to supporting the UO Latinx community
• In September 2020, UO received its first Insight into Diversity Higher Education Excellence in Diversity (HEED) recognition, which is given to schools for excellence in diversity and equity on their campus.
From Mono-culturalism to Resiliently Inclusive: Data Highlights on the Journey Forward Our DAP implementation process is designed to develop muscle memory and capacity to move the UO from being a mono-cultural institution, where racial exclusion was the norm, to a resiliently inclusive multicultural institution. Inclusive multiculturalism exists when traditionally marginalized individuals and groups feel a sense of belonging and are empowered to participate and lead in majority culture as full and valued members of the community, shaping and redefining that culture in
0.40%
0.40%
0.40%
0.40%
1.20%
1.59%
2.39%
2.79%
2.79%
14.74%
Black or African American
LGBTQIA+
Multi-group
Spanish-speaking
Latinx/Chicano
International
Women
Indigenous
Disabled
All underrepresented
IDEAL: Our Roadmap for a Fully-Inclusive and Resilient Campus
Page 15 of 25
equitable and anti-oppressive ways. The data below provides a snapshot of representation among senior leadership, officers of administration, faculty, women in science, classified staff, graduate employees and female faculty of color. University Leadership and Officers of Administration
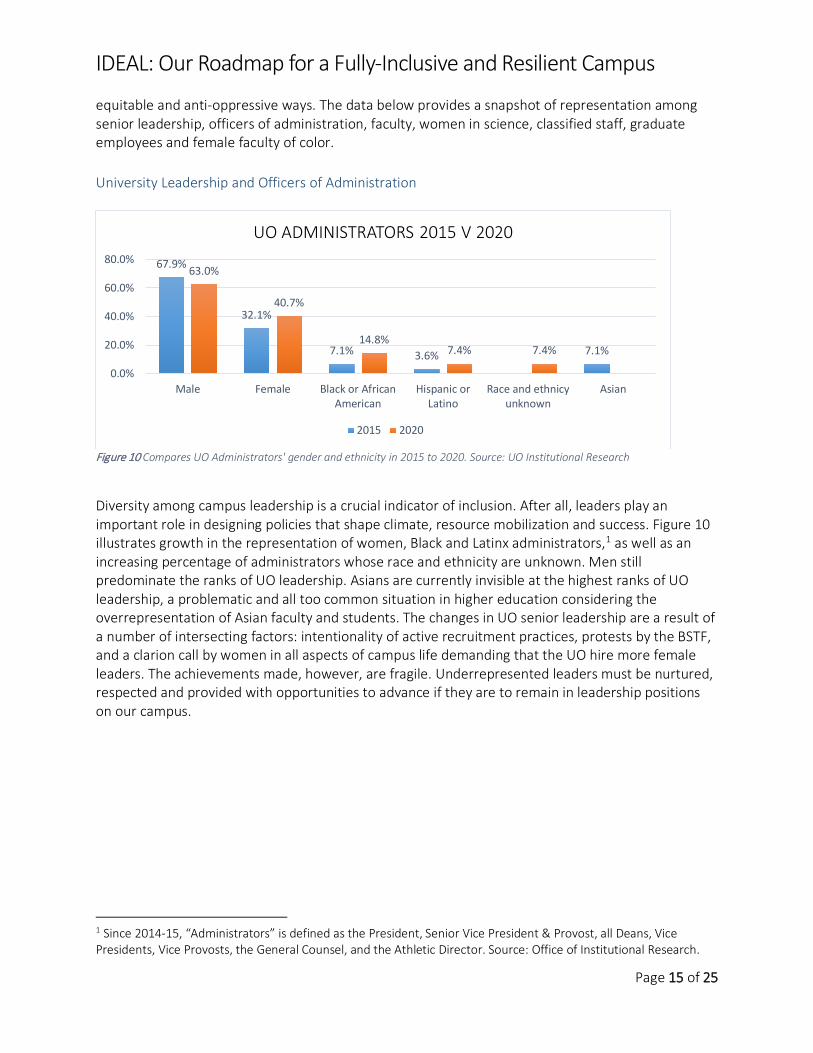
Figure 10 Compares UO Administrators' gender and ethnicity in 2015 to 2020. Source: UO Institutional Research
Diversity among campus leadership is a crucial indicator of inclusion. After all, leaders play an important role in designing policies that shape climate, resource mobilization and success. Figure 10 illustrates growth in the representation of women, Black and Latinx administrators,1 as well as an increasing percentage of administrators whose race and ethnicity are unknown. Men still predominate the ranks of UO leadership. Asians are currently invisible at the highest ranks of UO leadership, a problematic and all too common situation in higher education considering the overrepresentation of Asian faculty and students. The changes in UO senior leadership are a result of a number of intersecting factors: intentionality of active recruitment practices, protests by the BSTF, and a clarion call by women in all aspects of campus life demanding that the UO hire more female leaders. The achievements made, however, are fragile. Underrepresented leaders must be nurtured, respected and provided with opportunities to advance if they are to remain in leadership positions on our campus.
1 Since 2014-15, “Administrators” is defined as the President, Senior Vice President & Provost, all Deans, Vice Presidents, Vice Provosts, the General Counsel, and the Athletic Director. Source: Office of Institutional Research.
67.9%
32.1%
7.1% 3.6% 7.1%
63.0%
40.7%
14.8%7.4% 7.4%
0.0%
20.0%
40.0%
60.0%
80.0%
Male Female Black or AfricanAmerican
Hispanic orLatino
Race and ethnicyunknown
Asian
UO ADMINISTRATORS 2015 V 2020
2015 2020
IDEAL: Our Roadmap for a Fully-Inclusive and Resilient Campus
Page 16 of 25
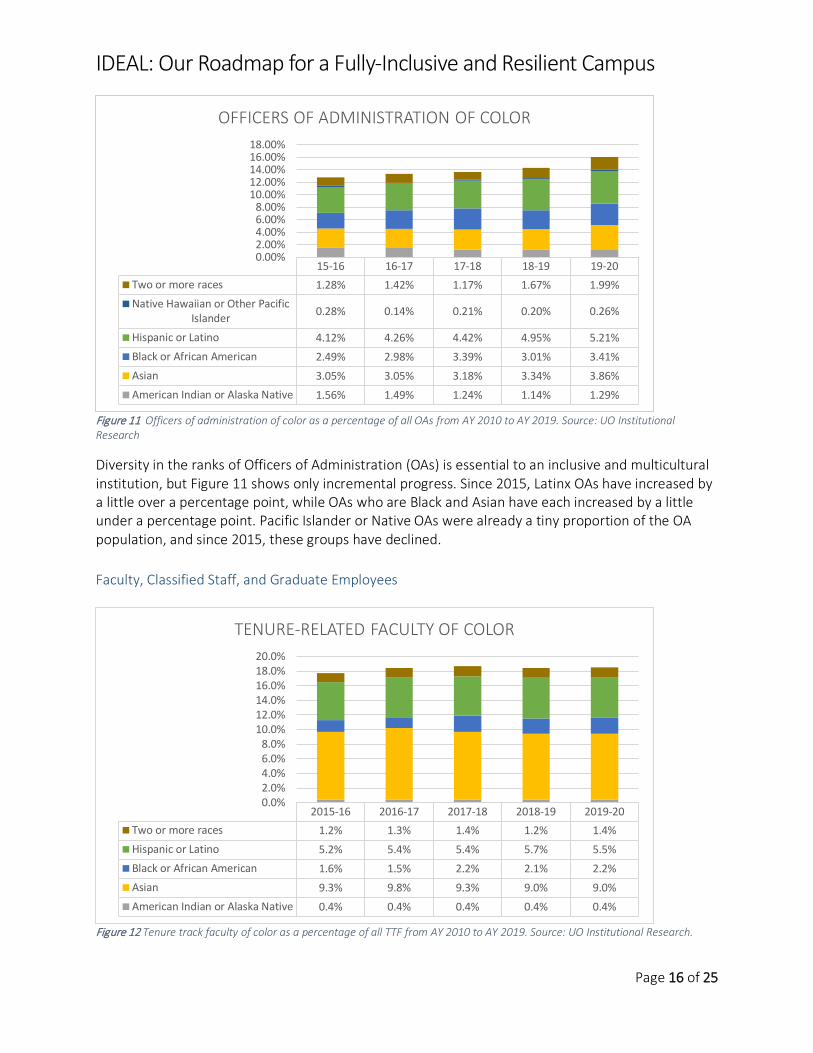
Figure 11 Officers of administration of color as a percentage of all OAs from AY 2010 to AY 2019. Source: UO Institutional Research
Diversity in the ranks of Officers of Administration (OAs) is essential to an inclusive and multicultural institution, but Figure 11 shows only incremental progress. Since 2015, Latinx OAs have increased by a little over a percentage point, while OAs who are Black and Asian have each increased by a little under a percentage point. Pacific Islander or Native OAs were already a tiny proportion of the OA population, and since 2015, these groups have declined. Faculty, Classified Staff, and Graduate Employees
Figure 12 Tenure track faculty of color as a percentage of all TTF from AY 2010 to AY 2019. Source: UO Institutional Research.
15-16 16-17 17-18 18-19 19-20Two or more races 1.28% 1.42% 1.17% 1.67% 1.99%Native Hawaiian or Other Pacific
Islander 0.28% 0.14% 0.21% 0.20% 0.26%
Hispanic or Latino 4.12% 4.26% 4.42% 4.95% 5.21%Black or African American 2.49% 2.98% 3.39% 3.01% 3.41%Asian 3.05% 3.05% 3.18% 3.34% 3.86%American Indian or Alaska Native 1.56% 1.49% 1.24% 1.14% 1.29%
0.00%2.00%4.00%6.00%8.00%
10.00%12.00%14.00%16.00%18.00%
OFFICERS OF ADMINISTRATION OF COLOR
2015-16 2016-17 2017-18 2018-19 2019-20Two or more races 1.2% 1.3% 1.4% 1.2% 1.4%Hispanic or Latino 5.2% 5.4% 5.4% 5.7% 5.5%Black or African American 1.6% 1.5% 2.2% 2.1% 2.2%Asian 9.3% 9.8% 9.3% 9.0% 9.0%American Indian or Alaska Native 0.4% 0.4% 0.4% 0.4% 0.4%
0.0%2.0%4.0%6.0%8.0%
10.0%12.0%14.0%16.0%18.0%20.0%
TENURE-RELATED FACULTY OF COLOR

IDEAL: Our Roadmap for a Fully-Inclusive and Resilient Campus
Page 17 of 25
Since 2015, the UO has made some progress in faculty diversity but the larger landscape of faculty diversity remains unchanged, with increases of less than 1% change over the last five years. Modest increase have occurred with Latinx and Black faculty. The percentage of Native faculty remained unchanged, while the percentage of Asian faculty slightly decreased.
Figure 13 Non-tenure track faculty of color as a percentage of all NTTF from AY 2010 to AY 2019. Source: UO Institutional Research Racial diversity among our non-tenure related faculty remains largely unchanged with tiny shifts in the representation of Latinx faculty and minor gains of less than one percent among Asian and Native Hawaiian faculty. The ranks of Black and Native NTTF decreased.
Figure 14 Women in the Sciences 2015 V 2020
Figure 14 shows changes in the placement of women in STEM. Advocacy among women scientists as well as active recruitment strategies were important in breaking through stagnation. While modest hiring and/or promotions have taken place across the sciences, the largest increases have occurred in biology and psychology. Except for moderate increases in classified staff (Figure 15) who identify as Latinx or biracial, classified staff also remain mostly white.
2015-16 2016-17 2017-18 2018-19 2019-20Two or more races 1.2% 1.1% 1.4% 1.3% 1.0%Native Hawaiian or Other Pacific
Islander 0.20% 0.20% 0.20% 0.30% 0.20%
Hispanic or Latino 3.90% 4.10% 4.10% 4.10% 4.10%Black or African American 1.10% 1.10% 1.00% 1.00% 1.00%Asian 4.40% 4.90% 4.70% 4.70% 4.90%American Indian or Alaska Native 0.70% 0.80% 0.50% 0.40% 0.30%
0.00%2.00%4.00%6.00%8.00%
10.00%12.00%14.00%
NON-TENURE TRACK FACULTY OF COLOR
IDEAL: Our Roadmap for a Fully-Inclusive and Resilient Campus
Page 18 of 25
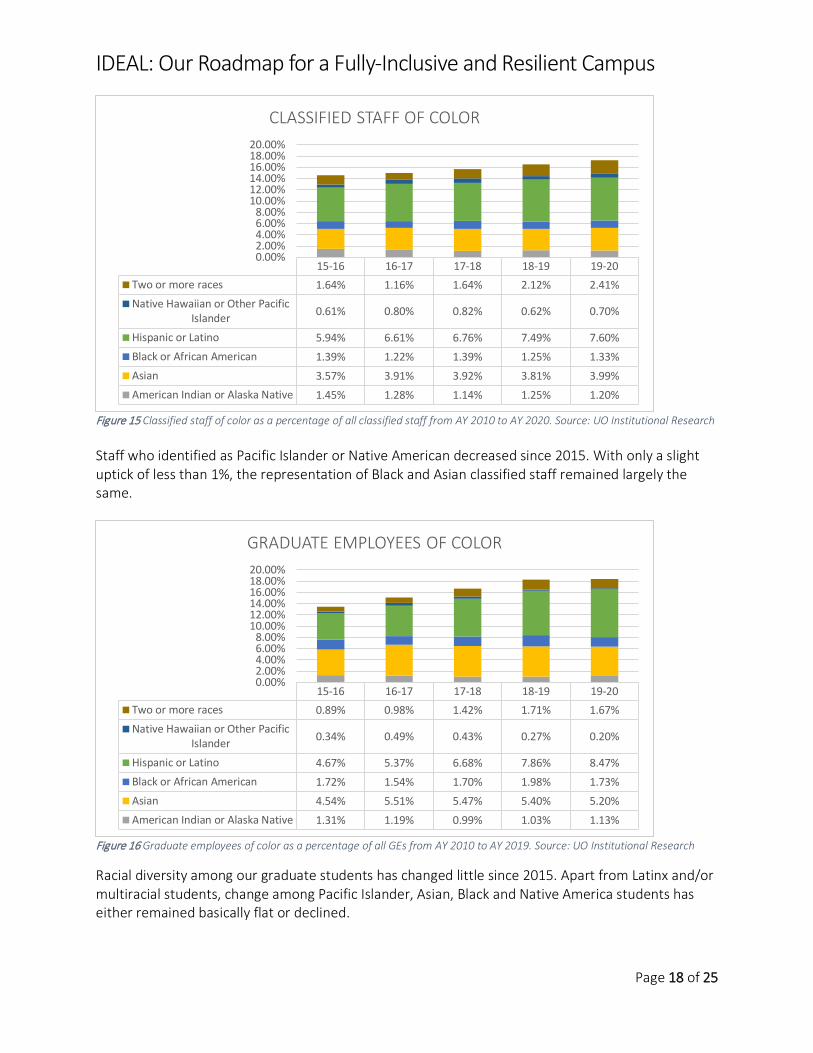
Figure 15 Classified staff of color as a percentage of all classified staff from AY 2010 to AY 2020. Source: UO Institutional Research Staff who identified as Pacific Islander or Native American decreased since 2015. With only a slight uptick of less than 1%, the representation of Black and Asian classified staff remained largely the same.
Figure 16 Graduate employees of color as a percentage of all GEs from AY 2010 to AY 2019. Source: UO Institutional Research
Racial diversity among our graduate students has changed little since 2015. Apart from Latinx and/or multiracial students, change among Pacific Islander, Asian, Black and Native America students has either remained basically flat or declined.
15-16 16-17 17-18 18-19 19-20Two or more races 1.64% 1.16% 1.64% 2.12% 2.41%Native Hawaiian or Other Pacific
Islander 0.61% 0.80% 0.82% 0.62% 0.70%
Hispanic or Latino 5.94% 6.61% 6.76% 7.49% 7.60%Black or African American 1.39% 1.22% 1.39% 1.25% 1.33%Asian 3.57% 3.91% 3.92% 3.81% 3.99%American Indian or Alaska Native 1.45% 1.28% 1.14% 1.25% 1.20%
0.00%2.00%4.00%6.00%8.00%
10.00%12.00%14.00%16.00%18.00%20.00%
CLASSIFIED STAFF OF COLOR
15-16 16-17 17-18 18-19 19-20Two or more races 0.89% 0.98% 1.42% 1.71% 1.67%Native Hawaiian or Other Pacific
Islander 0.34% 0.49% 0.43% 0.27% 0.20%
Hispanic or Latino 4.67% 5.37% 6.68% 7.86% 8.47%Black or African American 1.72% 1.54% 1.70% 1.98% 1.73%Asian 4.54% 5.51% 5.47% 5.40% 5.20%American Indian or Alaska Native 1.31% 1.19% 0.99% 1.03% 1.13%
0.00%2.00%4.00%6.00%8.00%
10.00%12.00%14.00%16.00%18.00%20.00%
GRADUATE EMPLOYEES OF COLOR
IDEAL: Our Roadmap for a Fully-Inclusive and Resilient Campus
Page 19 of 25
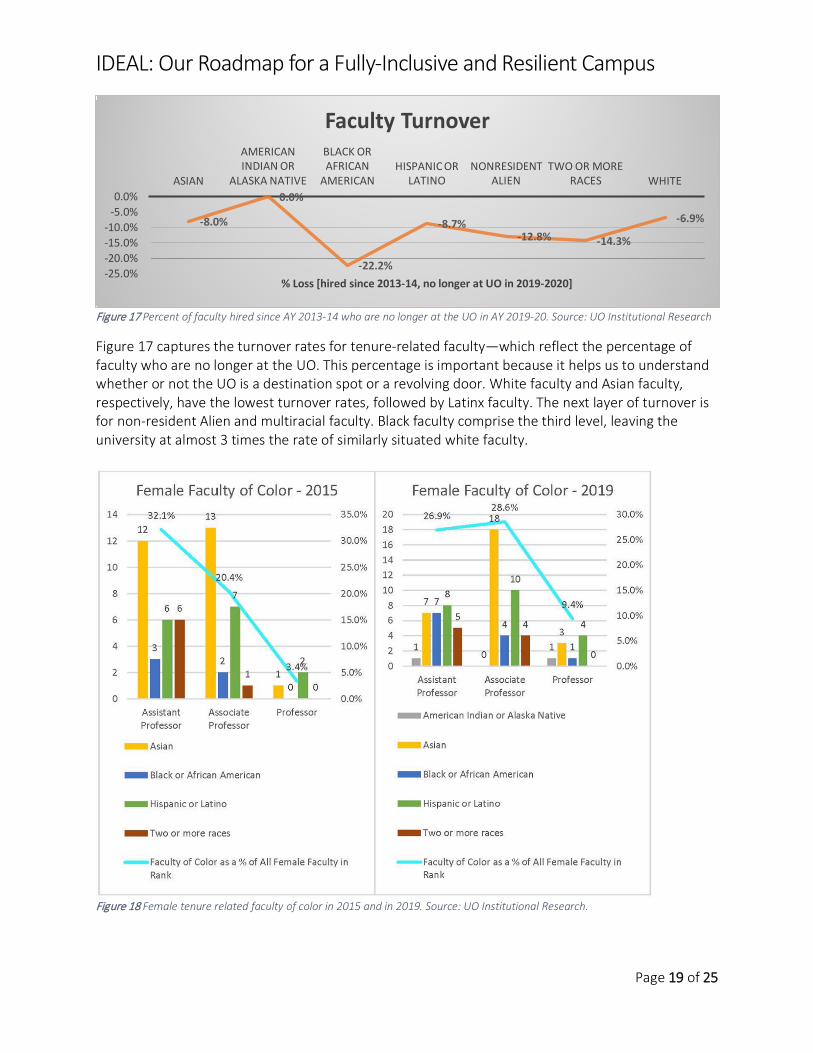
Figure 17 Percent of faculty hired since AY 2013-14 who are no longer at the UO in AY 2019-20. Source: UO Institutional Research
Figure 17 captures the turnover rates for tenure-related faculty—which reflect the percentage of faculty who are no longer at the UO. This percentage is important because it helps us to understand whether or not the UO is a destination spot or a revolving door. White faculty and Asian faculty, respectively, have the lowest turnover rates, followed by Latinx faculty. The next layer of turnover is for non-resident Alien and multiracial faculty. Black faculty comprise the third level, leaving the university at almost 3 times the rate of similarly situated white faculty.
Figure 18 Female tenure related faculty of color in 2015 and in 2019. Source: UO Institutional Research.
-8.0%
0.0%
-22.2%
-8.7%-12.8% -14.3%
-6.9%
-25.0%-20.0%-15.0%-10.0%
-5.0%0.0%
ASIAN
AMERICAN INDIAN OR
ALASKA NATIVE
BLACK OR AFRICAN
AMERICANHISPANIC OR
LATINONONRESIDENT
ALIENTWO OR MORE
RACES WHITE
% Loss [hired since 2013-14, no longer at UO in 2019-2020]
Faculty Turnover
IDEAL: Our Roadmap for a Fully-Inclusive and Resilient Campus
Page 20 of 25
For women of color who stay at the UO, there is increased progress in movement through the ranks, thanks in part to the efforts of the CSWS Women of Color Working Group. Women of color faculty comprise almost 29% of the associate professor ranks compared to 20% three years ago. Additionally, as compared with 2015, when there were no Black or Native womenvii who were full professors, 2019 saw the promotion/hiring of Native and Black faculty in each of these categories. Asian, Latina and biracial/multicultural women faculty continue to be promoted. As we will see below, faculty turnover and advancement have implications for student belonging and success. In the next section, we examine student success for all our under-represented students. Student Success
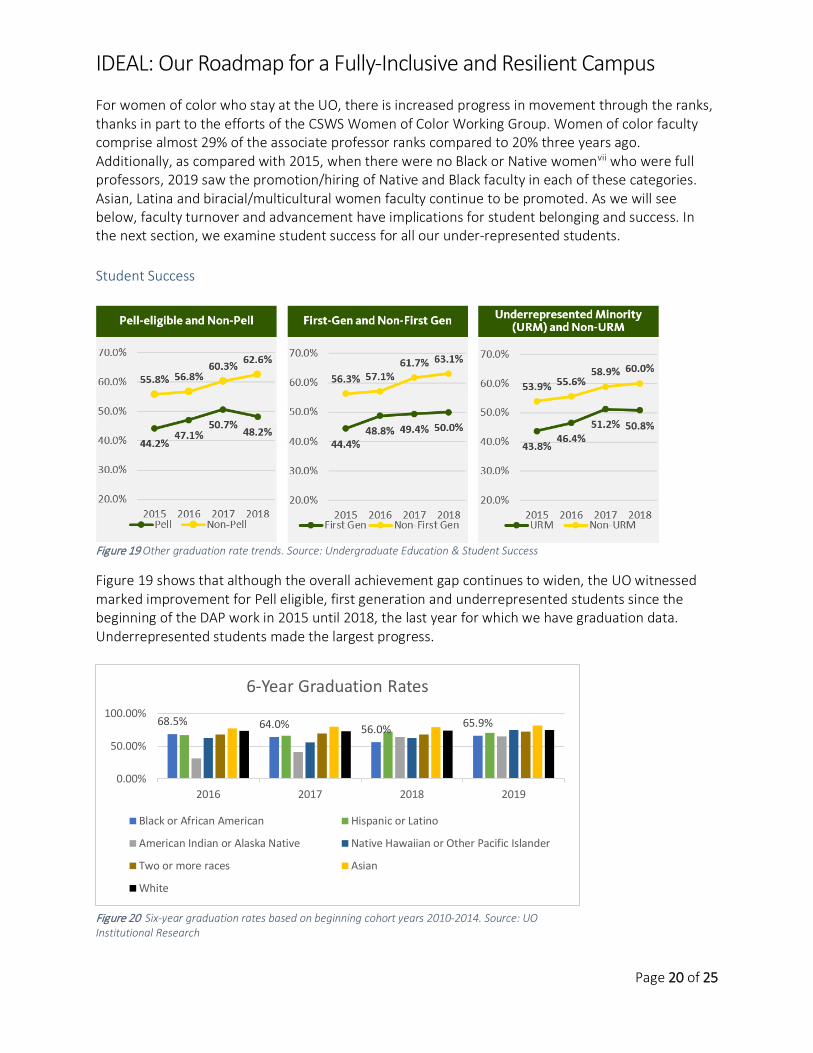
Figure 19 Other graduation rate trends. Source: Undergraduate Education & Student Success
Figure 19 shows that although the overall achievement gap continues to widen, the UO witnessed marked improvement for Pell eligible, first generation and underrepresented students since the beginning of the DAP work in 2015 until 2018, the last year for which we have graduation data. Underrepresented students made the largest progress.
68.5% 64.0% 56.0% 65.9%
0.00%
50.00%
100.00%
2016 2017 2018 2019
6-Year Graduation Rates
Black or African American Hispanic or Latino
American Indian or Alaska Native Native Hawaiian or Other Pacific Islander
Two or more races Asian
White
Figure 20 Six-year graduation rates based on beginning cohort years 2010-2014. Source: UO Institutional Research

IDEAL: Our Roadmap for a Fully-Inclusive and Resilient Campus
Page 21 of 25
When we review disaggregated data, however, we see improvements across each of these groups, with the stark exception of Black students. Black students’ 6-year graduation rate was just shy of 69% in 2016, and worsened to 66% in 2019. Perhaps, there is a link between the high turnover rate for black faculty and lower patterns of success for black students. Research shows that black faculty historically play a crucial role in the success of black students. Thus, the final aspect of building a multicultural institution is to ensure equity in what we value and how we recognize success. Faculty Achievement In this section, we focus on faculty achievement as measured by tenure, promotion and faculty awards. In addition to being shaped by race, the UO institutions are also gendered. Little changed since 2015, with women predominating among the non-tenure ranks and men predominating among the tenured ranks. This is not just a matter of semantics, but equity too. Tenure provides access to life-long job security and higher pay, while non-tenure positions constantly search for stability.
Figure 21 Gender distribution of tenure-related faculty from AY 2010 to AY 2019. Source: UO Institutional Research
Figure 22 Gender distribution of non-tenure related faculty from AY 2010 to AY 2019. Source: UO Institutional Research
Between 70 and 80% of all UO research awards are awarded to White faculty, with Asian and Latinx faculty, garnering few of these awards. In terms of gender, there is almost parity between men and women.
39% 39% 40% 40% 40%
61% 61% 60% 60% 60%
0%
20%
40%
60%
80%
2 0 1 5 - 1 6 2 0 1 6 - 1 7 2 0 1 7 - 1 8 2 0 1 8 - 1 9 2 0 1 9 - 2 0
TENURE RELATED FACULTY
Female Male
56% 58% 56% 56% 58%
44% 42% 44% 44% 42%
0%
20%
40%
60%
80%
2 0 1 5 - 1 6 2 0 1 6 - 1 7 2 0 1 7 - 1 8 2 0 1 8 - 1 9 2 0 1 9 - 2 0
NON-TENURE RELATED FACULTY
Female Male

IDEAL: Our Roadmap for a Fully-Inclusive and Resilient Campus
Page 22 of 25
Figure 23 Race/ethnicity distribution of faculty research awards 2013-14 through 2019-20. Source: UO Institutional Research.
Figure 24 Gender distribution of Faculty Research Awards from 2013-14 through 2019-20. Source: UO Institutional Research
When it comes to teaching awards (Figure 25), almost 80% of awards consistently go to white faculty. Only recently have Black faculty and Native faculty received these awards. In terms of gender, men have received almost 2 of every 3 awards.
2015-16
2016-17
2017-18
2018-19
2019-20
Two or more races 1 2 1 1 3Race and ethnicity unknown 3 2 7 3 1Nonresident alien 3 3 7 6 7Hispanic or Latino 2 3 10 3 9Black or African American 2 1 3 1 2Asian 4 6 4 4 10American Indian or Alaska
Native 0 4 0 0 4
White 59 51 49 41 5
010203040506070
05
10152025303540
Faculty Research Awards
Two or more races
Race and ethnicity unknown
Nonresident alien
Hispanic or Latino
Black or African American
Asian
American Indian or AlaskaNative
50.7%
43.8%
52.7%50.0%
55.6%52.5%
48.8%
49.3%
56.3%
47.3%50.0%
44.4%47.5%
51.2%
0.0%
10.0%
20.0%
30.0%
40.0%
50.0%
60.0%
2013-14 2014-15 2015-16 2016-17 2017-18 2018-19 2019-20
Faculty Research Awards
Female Male

IDEAL: Our Roadmap for a Fully-Inclusive and Resilient Campus
Page 23 of 25
Figure 25 Race/ethnicity distribution of faculty teaching awards 2013-14 through 2019-20. Source: UO Institutional Research.
Figure 26 Gender distribution of faculty teaching awards 2013-14 through 2019-20. Source: UO Institutional Research.
The racialized and gendered patterns observed in the awards process demonstrate the need to examine and redesign these processes to ensure the talents and contributions made by women and people of color are recognized and valued. Without such recognition, their work and contributions are often appropriated without adequate compensation. In some ways, the data raise additional and important questions about intersectionality, as well as how our disabled and LGBTQ students and colleagues are faring. The lack of data transparency,
2015-16 2016-17 2017-18 2018-19 2019-20Nonresident alien 0 0 0 1 0American Indian or Alaska
Native 0 0 0 1 0
Asian 2 2 2 2 2Hispanic or Latino 2 4 3 3 4Two or more races 1 1 2 1 1Black or African American 0 0 0 1 1Race and ethnicity unknown 2 1 3 2 1White 42 44 49 49 39
0102030405060
012345
Faculty Teaching Awards
37.5% 39.6% 38.8% 36.5%42.4% 43.3%
39.6%
62.5% 60.4% 61.2% 63.5%57.6% 56.7%
60.4%
0.0%
10.0%
20.0%
30.0%
40.0%
50.0%
60.0%
70.0%
2013-14 2014-15 2015-16 2016-17 2017-18 2018-19 2019-20
Teaching Awards
Female Male

IDEAL: Our Roadmap for a Fully-Inclusive and Resilient Campus
Page 24 of 25
especially around issues of race, limits our ability to intentionally track progress on these important issues.
Failing Forward and Recommended Next Steps In many respects, the DAP implementation process is reminiscent of Dickens’ Tale of Two Cities, largely because of the specter of dualism. On one hand, the DAP implementation showcased the UO’s innovative, scrappy, can-do attitude. Our work helped our campus develop a common language, collaborate in building the UO’s muscles in these areas and focus campus efforts on issues that have, for too long, lacked consistent focus. In less than 3 years, campus units contributed over 250 programs, events, processes and policies. Considering Oregon’s history of exclusion and colonization, this progress is significant. However, the DAP implementation process tells only part of our story. The other side, told by the data about representation, student success and faculty achievement, presents a less flattering story—one of a campus that is mired in incrementalism—as it relates to diversity, equity and inclusion. This incrementalism chains the UO to its racially segregated past on a campus where colorblind ideologyviii and whiteness prevail.ix To the extent that change has occurred in diversifying the ranks of women in science, UO senior administration and in the promotion of women faculty of color to associate and full professor ranks, they have been the exception to the rule. Specifically, these gains have occurred as a result of intentional outreach, targeted recruitment, student protests and organized faculty mobilization. Yet, absent from this progress are any Vice Presidents or Deans who identify as Native, Asian or Pacific Islander as well as the precarious representation of women in senior leadership ranks. This means that if the UO really intends to be a resilient, fully-inclusive institution, it must embed a culture of intentionality throughout its systems and processes. It must stridently and consistently choose a path of anti-oppression in word and as well as deed. Since a climate of belonging for all is important for faculty, staff and student retention, and since climate lives in structures, future work must focus on dismantling the behaviors and processes that make the UO a largely unwelcoming place for underrepresented faculty, staff and students across all identity lines, while embedding our practices, processes and systems with love, authenticity, courage and empathy. Future work must also gauge our performance on key indicators of success, with consistent work in dismantling the attitudes, systems and processes that uphold implicit as well as explicit bias and discrimination. The journey ahead is too important, and the work too consequential to leave it undone. We invite your renewed commitment to and participation in the next leg of our journey.

Endnotes
i It takes a team to complete any worthwhile project. Such is the case with this Report. I am grateful to each colleague in the Division of Equity and Inclusion for their commitment and support. I am also grateful to the President’s Diversity Advisory Community Council (PDACC), for their consistent support and untiring commitment to helping shape our campus into a more just and hospitable place. Tracy Bars served as the project manager for DAP implementation, and I am grateful for her data management skills and creativity. JP Monroe provided data access along the way. Members of the DEI Executive Team—including Vickie (2017-2019), Charlotte, Lesley-Anne and Kelly, were invaluable thought partners in helping to execute the DAPs across campus. Many thanks as well to President Schill, our supportive Board of Trustees, Senior Staff colleagues, Deans and Directors who provided support along the way. Above all, I am grateful to everyone who helped to design IDEAL, and who worked hard to implement DAPs across our campus. This report celebrates our collaborative work and invites everyone’s leadership for the next leg of our journey. ii For a timeline of IDEAL, please see the following: https://inclusion.uoregon.edu/framework-development-history iiiFor more information about the equity work on our campus, please see the report below: https://inclusion.uoregon.edu/sites/inclusion1.uoregon.edu/files/9_17_20_v8_uo_equity_document_fall_2020.pdf. iv Climate Survey Development and Analytics; Evaluate Existing Workshops, Professional Development Programs / Gap Analysis; Implicit Bias Professional Development; Leadership Succession Planning; Onboarding and Training for New Employees & New Supervisors; Professional Development Pilot Projects; Recruiting Processes, Outlets & Retention Tools v Our initial team of three include Vickie DeRose, Lesley-Anne Pittard and myself (Yvette Alex-Assensoh). When Vickie completed her term as CoDaC Director, Charlotte Moats-Gallagher, the new CoDaC Director joined the team and helped to complete the review process. vi Damon Williams. 2013. Strategic Diversity Leadership: Activating Change and Transformation in Higher Education. New York Stylus. vii There has been at least one black female faculty member at full professor rank, but she is counted in the administrative rather than the faculty ranks. viii Color blindness is the idea that race-based differences don't matter. It ignores the realities of systemic racism. ix For example, in 2020, there are entire departments that have never hired a Black or Indigenous faculty member or postdoc.