division of state facilities business process improvement and performance measurement robert cramer...
TRANSCRIPT

Division of State Facilities
Business Process Improvement and
Performance Measurement
Division of State Facilities
Business Process Improvement and
Performance Measurement
Robert CramerJuly 25, 2006

2
DSF OverviewReal Estate Service Provider for State Government
DSF OverviewReal Estate Service Provider for State Government
• Responsibilities include:– Capital project management– Lease procurement and management– Operation of 30 facilities– Capital budget development– Staff for the State of Wisconsin Building Commission– Lead energy conservation and sustainability efforts
• Organized into four bureaus:– Portfolio Management– Facilities Management– Operations Management– Architecture and Engineering

3
DSF OverviewReal Estate Service Provider for State Government
DSF OverviewReal Estate Service Provider for State Government
• DSF – formed from divisions of Buildings and Police Services and Facilities Development in 2003
• Restructured through phases – 9 bureaus to 7 bureaus to current structure of 4 bureaus
• 242 FTE positions• Operating budgets total approximately $60
million

4
DSF OverviewCamp RandallDSF OverviewCamp Randall

5
Business Process ImprovementPerformance MeasurementBusiness Process ImprovementPerformance Measurement
• Understanding what we do• Identifying what is important• Measuring the results• Trying to get better
– the Baldrige Criteria provides a framework for these activities -

6
Baldrige Criteria for Performance ExcellenceBaldrige Criteria for Performance Excellence
1. Leadership1. Leadership
2. Strategy2. Strategy
3. Customers3. Customers
5. People5. People
6. Processes6. Processes
7. Get Results7. Get Results
Measurement, Analysis and Knowledge ManagementMeasurement, Analysis and Knowledge Management
Optimum Performance Group, IncOptimum Performance Group, Inc
7
Baldrige Criteria for Performance Excellence Baldrige Criteria for Performance Excellence
• Using this framework helps us ensure that we:– Have an Approach (define a business
process)– Deploy the Approach (use the process and
measure the results)– Learn and improve the approach (continuous
improvement)– Integrate efforts by aligning approaches
across the organization (alignment)
8
DSF Business Process ImprovementDSF Business Process Improvement

9
Understanding Our Business ProcessesUnderstanding Our Business Processes
• More than 35 processes that cover the majority of DSF’s primary functions were mapped or had new processes developed.
– Bureau of Portfolio Mgmt : 7 new processes were developed– Bureau of Facilities Mgmt: 5 processes were reviewed and
updated for specific operational activities– Bureau of Architecture & Engineering: More than 18
processes were reviewed and updated– Bureau of Operations Mgmt: 10 new process were
developed to document the bureaus procedures
• Over 20 DSF staff participated in the business process mapping effort.

10
Process Improvement Example Bureau of Facilities ManagementTenant Work Request for Corrective Services
Process Improvement Example Bureau of Facilities ManagementTenant Work Request for Corrective Services
• Then: Paper process for a building tenant making a request on a form 8181 or requesting corrective action through DSF staff
• Now: Web-based work requests submitted by tenant staff and select DSF staff with tenant and staff status on the request (documentation example follows)
• The improvement allows for a common approach for all tenants and provides a tool for workload management.
• Keith Beck and his team as well Claire Franz and her team have been instrumental in this process improvement

11
Example of DSF Documentation of this ProcessExample of DSF Documentation of this Process

12
Process Improvement ExampleBureau of Portfolio ManagementReal Estate (RE) Strategic Planning
Process Improvement ExampleBureau of Portfolio ManagementReal Estate (RE) Strategic Planning
• Then: An ad hoc process for identifying preferred RE solutions focused on tactical priorities
• Now: Apply consistent workflow and uses a common metric (TCO; total cost of occupancy) and include forecasts of state space needs across a regional area
• TCO provides a common metric to assess all RE opportunities, allowing for a consistent approach to decision making
• Regional area planning encourages the identification of enterprise solutions to agency specific RE needs
• Bill Peterson and Lori Richter were instrumental in this improvement

13
Process Improvement ExampleBureau of Architecture and EngineeringArchitect/Engineering Contract Processing
Process Improvement ExampleBureau of Architecture and EngineeringArchitect/Engineering Contract Processing
• Then: AE contracts were signed using a linear flow from DSF to AE to Secretary to Governor to DSF
• Now: AE contracts are processed in parallel from DSF through signatories and back to DSF
• Processing time has decreased from an average of 51 days (initiation to completion) to 18 days
• Sharon Blattner-Held was instrumental in implementing this improvement

14
Process Improvement ExampleBureau of Operations ManagementFacilities Management Information Center (Call Center)
Process Improvement ExampleBureau of Operations ManagementFacilities Management Information Center (Call Center)
• Then: Three building management offices serviced the tenants of their assigned buildings; building-related service requests were received via phone and e-mail with information transferred to appropriate staff via email, paper message or pager
• Now: The call center (FMIC) receives service requests from tenants via web, email or phone. The web is preferred and pre-fills information for the tenant, verify GSB billing codes and automatically updates tools for tracking and reporting purposes
• Administrative staff from three offices were brought together into the new call center office. Several other staff were relocated to provide shared administrative services across the division
• Claire Franz and her team along with John Vingelen have been instrumental in this process improvement.

15
DSF Business Process ImprovementCriteria that Guide DSF DecisionsDSF Business Process ImprovementCriteria that Guide DSF Decisions
• Customer Focus• Enterprise Focus• Operational Efficiency• Agility / Sustainability• Emphasis on Core Business• Quality Work Place & Organization• Managing Risk• Performance Management• Communications

16
DSF Business Process EngineeringContinuous Improvement ActivitiesDSF Business Process EngineeringContinuous Improvement Activities
• Monitor and use as required Industry Best Practices• Make use of the interagency real estate management team• Keep the Organizational Design up-to-date• Keep Business Processes Up-to-date • Administer and Monitor the Performance Mgmt Plan• Continue with Knowledge Transfer at all Levels• Continue with Effective Communications• Ensure TCO is part of all investment decision making• Continue with the Technology Development• Use Service Level Definitions to meet customer expectations• Keep the Continuous Improvement Plan up-to-date and
monitor outcomes
17
DSF Performance MeasurementDSF Performance Measurement
18
DSF Division Action PlanDSF Division Action Plan
• ACE Initiative• Emergency Planning• Conserve Wisconsin• Investing in Our Employees

19
DSF Performance MeasurementDSF Performance Measurement
• Performance Measures are used to:– Clearly communicate the results of an
activity– Enhance performance over time– Inform the planning, budgeting and
controlling processes– Align strategies with management practices– Provide objective information to evaluate
results and determine where value is created

20
Performance Management MethodologyPerformance Management Methodology
• Based on industry best practices and aligned with the department’s goals
• Measures are designed to track activities in each bureau and roll up to a division summary
• Each bureau has identified one person to be responsible for developing and tracking the measures and:
– Analyze results and be the bureau expert on the topic– Recommend corrective action for continuous improvement– Work with the division performance manager for division
summary and progress
21
DSF Performance Management TeamDSF Performance Management Team
• Bureau of Portfolio Mgmt SME - Lori Richter • Bureau of Facilities Mgmt SME- Keith Beck• Bureau of Architecture & Engineering SME- Dave
Kaul• Bureau of Operations Management SME - Ralph
Warner• DSF Performance Manager - Naomi Babler
22
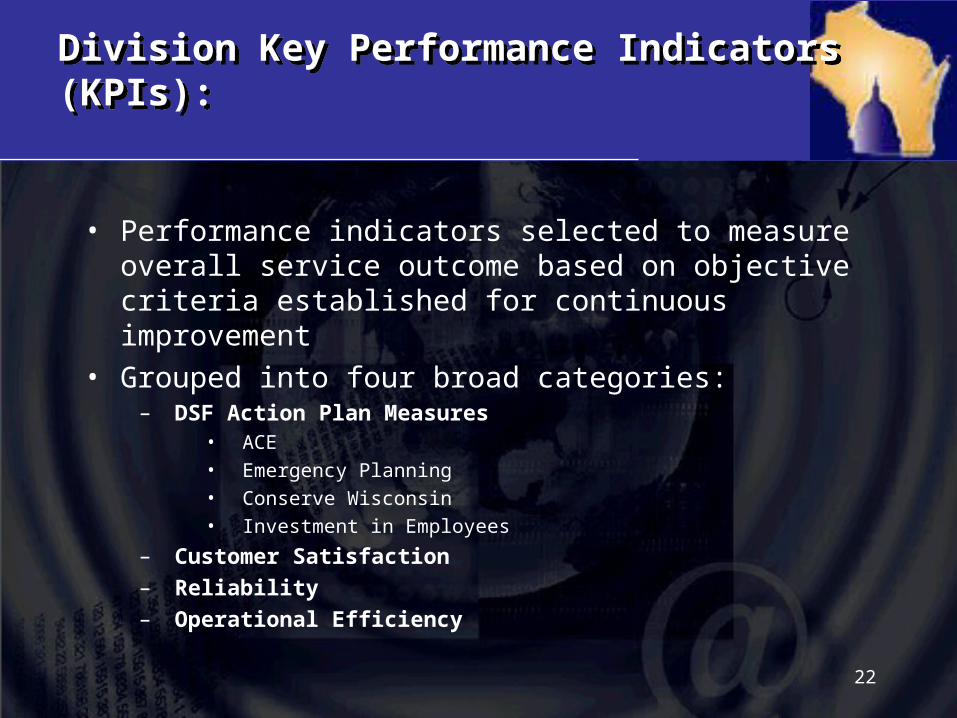
Division Key Performance Indicators (KPIs):Division Key Performance Indicators (KPIs):
• Performance indicators selected to measure overall service outcome based on objective criteria established for continuous improvement
• Grouped into four broad categories:– DSF Action Plan Measures
• ACE
• Emergency Planning
• Conserve Wisconsin
• Investment in Employees
– Customer Satisfaction– Reliability– Operational Efficiency

23
Action Plan Measures
Customer Satisfaction
Reliability Operational Efficiency
Portfolio Management
•Training •Succession Plan
•Space Requests (Future) •TCO tracking•Space Utilization
Facilities Management
•Training •Succession Plan
•Work Order Requests •Service Disruptions•Preventive Maint•Critical Systems
•Operating Costs (TCO)
Architecture & Engineering
•Training •Succession Plan
•Project Completion •Design / Constr Standards
•Project Mgmt
Operations Management
•Training •Succession Plan
•Call Center Requests (Future) •Operating Budget•Contract Mgmt•Accounts Payable
Key Performance Indicator (KPI)
Bu
reau
Bureau Functional Measures by KPIsBureau Functional Measures by KPIs
24
BuildingTotal FY06 Occupancy
% Vacant SpaceTotal Cost of Occupancy
(1 W. Wilson St., Madison) 1,440 0% $10.46
Administration Bldg. 617 0% $15.54
Badger Rd State Ofc. Bldg. Total 217 0% $13.68
Central Services Bldg. 52 0% $7.21
Eau Claire State Office Bldg. 144 1% $9.92
Green Bay State Office Bldg. 197 5% $11.75
Hill Farms Building D 46 33% $8.38
State Hill Farms Bldg – E 90 11% $8.38
State Hill Farms Bldg – L 62 19% $8.38
La Crosse State Office Bldg. 191 2% $9.95
Main Hangar 12 9% $8.61
Milwaukee State Office Bldg. 572 5% $8.67
Public Broadcasting Bldg. 86 27% $15.03
Risser Justice Center 448 6% $33.82
State Agriculture Bldg. 374 1% $19.26
State Crime Lab - Milwaukee 54 0% $15.03
State Education Bldg. (GEF III) 486 0% $8.14
State Hygiene Lab $39.17
State Industry & Labor Bldg. (GEF I 1,028 0% $13.71
State Natural Resources Bldg. (GEF II) 1,035 0% $8.68
State Revenue Bldg. 1,015 1% $20.40
State Transportation Bldg A & B 1,714 0% $10.93
Waukesha State Office Bldg. 552 1% $16.45
Wis. Rapids State Office Bldg. 162 4% $17.76
Totals: 10,595 3.59%
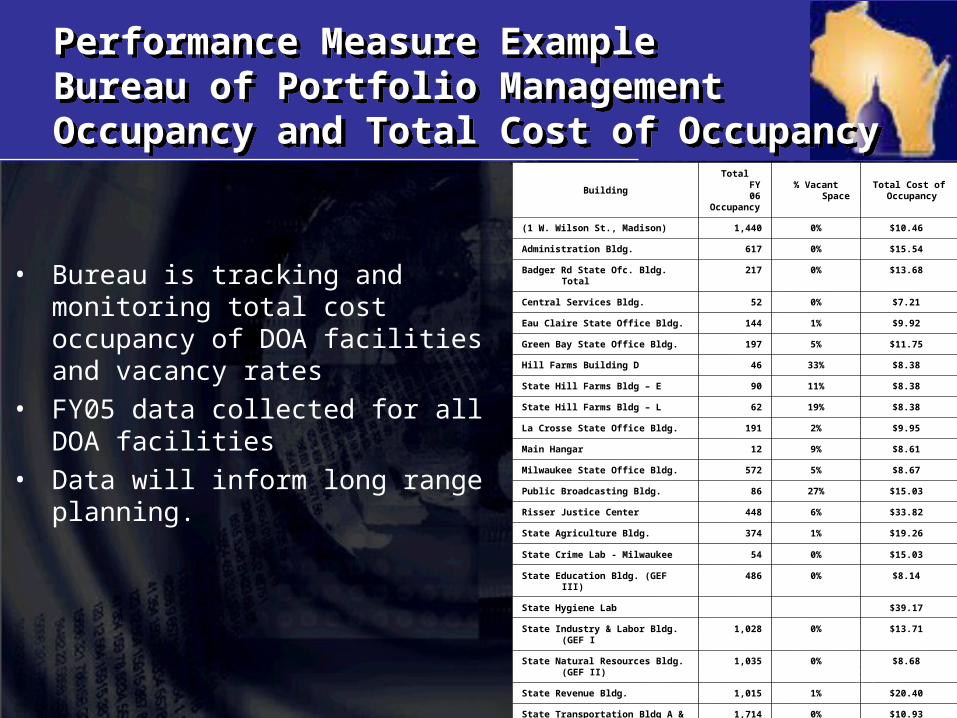
• Bureau is tracking and monitoring total cost occupancy of DOA facilities and vacancy rates
• FY05 data collected for all DOA facilities
• Data will inform long range planning.
Performance Measure ExampleBureau of Portfolio Management Occupancy and Total Cost of Occupancy
Performance Measure ExampleBureau of Portfolio Management Occupancy and Total Cost of Occupancy

25
Performance Measure ExampleBureau of Architecture and EngineeringChange Orders within Capital Projects
Performance Measure ExampleBureau of Architecture and EngineeringChange Orders within Capital Projects
Current Month Data Year to date data
% to total Change Order
value
% to total Change Order
Count
% to Construction
Value
Change Orders Values
& Count
% to total Change Order
Value
% to total change order
count
Change Order Values ratio to Construction contract value
Design Oversight Sum of COValue 18.3% 0.10% $1,383,486 11.90% 0.22%Design Oversight Count 22% 351 24.14%Major Scope Changes Sum of COValue 0.0% 0.00% $0 0.00% 0.00%Major Scope Changes Count 0% - 0.00%Minor Sum of COValue 31.2% 0.16% $1,691,092 14.55% 0.27%Minor Count of CO ount 21% 305 20.98%Other Scope Changes Sum of COValue 1.9% 0.01% $3,772,858 32.46% 0.59%Other Scope Changes Count of CO 6% 103 7.08%Program Work Reinstated CO Value 1.4% 0.01% $984,876 8.47% 0.15%Program Work Reinstated Count 0% 20 1.38%Quality/Value Reevaluation CO Value 12.9% 0.07% $1,695,739 14.59% 0.27%Quality/Value Reevaluation Count 27% 319 21.94%Unforeseen Conditions CO Value 34.2% 0.18% $2,096,149 18.03% 0.33%Unforeseen Conditions Count 24% 356 24.48%Total Sum of Change Order Values 100.00% 100.00% 0.52% $11,624,200 100.00% 100.00% 1.83%Total Count of Change Order 1454
Total Construction Contracts affected Value For Year to Date Monthly Year to Date344,158,085$ 636,318,082$
June
56%
44%
Completed>=4days Completed<=4days
April
77%
23%
Completed>=4days Completed<=4days
May
60%
40%
Completed>=4days Completed<=4days
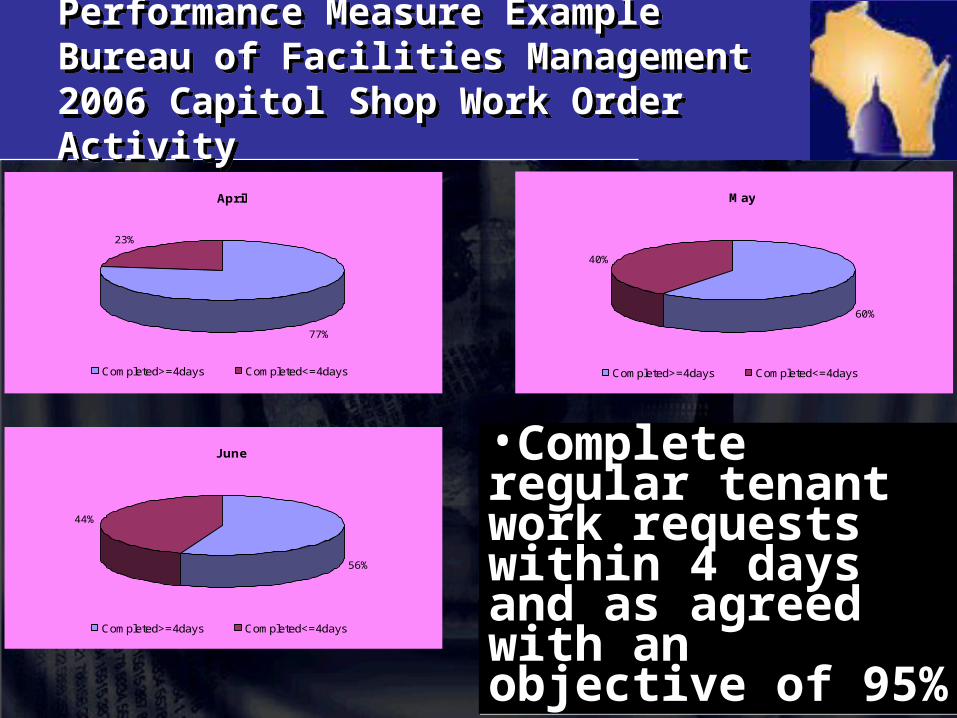
Performance Measure ExampleBureau of Facilities Management2006 Capitol Shop Work Order Activity
Performance Measure ExampleBureau of Facilities Management2006 Capitol Shop Work Order Activity
•Complete regular tenant work requests within 4 days and as agreed with an objective of 95%
•Complete regular tenant work requests within 4 days and as agreed with an objective of 95%

27
2006 Service Requests Processed by Facilities Management Info Center
0 10 20 30 40 50 60 70 80 90 100
February
March
April
May
June
July
Mo
nth
s
Requests
Requests exceeding 4 hours performancemeasures
4 4 7 0 7 0
Requests Processed (received andassigned to FM group)
66 96 101 97 92 34
February March April May June July
Performance Measure ExampleBureau of Operations ManagementFMIC Service Requests Processing Time
Performance Measure ExampleBureau of Operations ManagementFMIC Service Requests Processing Time