division: worldwide development retention category: … · retention category:grs019 information...
TRANSCRIPT
Confidential 2012N152078_00
ATN117309, ATN117321, ATN117322, ATN117183
1
Division: Worldwide DevelopmentRetention Category: GRS019Information Type: Clinical Pharmacology Population Pharmacokinetic/ Pharmacodynamic Reporting and Analysis Plan
Title: Longitudinal Analysis of Efficacy and Safety of Alitretinoin in Patients with Severe Chronic Hand Eczema Refractory to Corticosteroids
Compound Number: GF188742
Effective Date: 26 Oct 2012
Description:
The purpose of this reporting and analysis plan (RAP) is to describe the planned exposure-response analysis for alitretinoin (Toctino) in severe chronic refractory hand eczema, where dose represents exposure and response represents the Physicians’ Global Assessment (PGA) and triglycerides or cholesterol. Triglyceride (or cholesterol) data over time following placebo or alitretinoin 10 mg, 20 mg, 30 mg, or 40 mg once daily will be combined across Phase II and III studies including ATN117309 (BAP00003),ATN117321 (BAP00089), ATN117322 (BAP00091), and ATN117183 (BAP01346). PGA data will be combined across Phase III studies only [ATN117321 (BAP00089), ATN117322 (BAP00091), and ATN117183 (BAP01346)], given that the scoring method changed between Phase II and III.
Identifier/Version Number: 2012N152078_00
Subject: alitretinoin, Toctino, exposure-response, physicians’ global assessment, triglycerides, cholesterol,
Author’s Name and Functional Area:
CPMS
CPMS
CPMS
Approved by:
CPMS 26 Oct 2012
Confidential 2012N152078_00
ATN117309, ATN117321, ATN117322, ATN117183
2
TABLE OF CONTENTS
PAGE
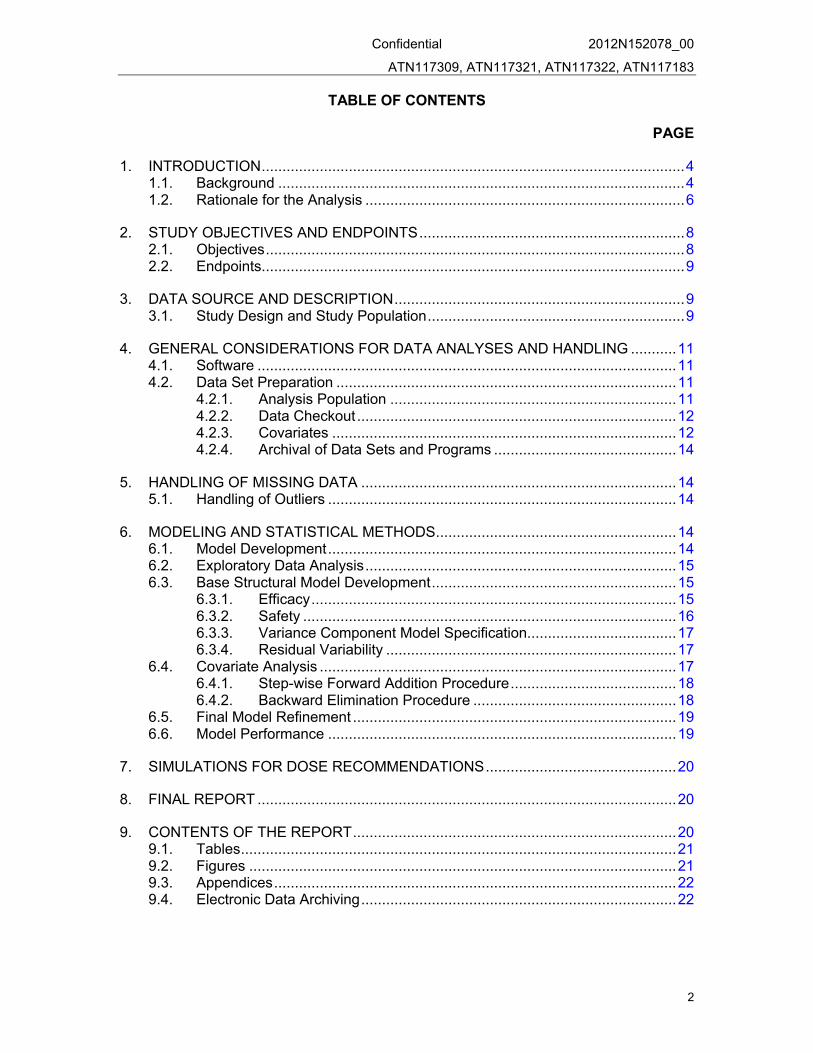
1. INTRODUCTION......................................................................................................41.1. Background ..................................................................................................41.2. Rationale for the Analysis .............................................................................6
2. STUDY OBJECTIVES AND ENDPOINTS................................................................82.1. Objectives.....................................................................................................82.2. Endpoints......................................................................................................9
3. DATA SOURCE AND DESCRIPTION......................................................................93.1. Study Design and Study Population..............................................................9
4. GENERAL CONSIDERATIONS FOR DATA ANALYSES AND HANDLING ...........114.1. Software .....................................................................................................114.2. Data Set Preparation ..................................................................................11
4.2.1. Analysis Population .....................................................................114.2.2. Data Checkout.............................................................................124.2.3. Covariates ...................................................................................124.2.4. Archival of Data Sets and Programs ............................................14
5. HANDLING OF MISSING DATA ............................................................................145.1. Handling of Outliers ....................................................................................14
6. MODELING AND STATISTICAL METHODS..........................................................146.1. Model Development....................................................................................146.2. Exploratory Data Analysis...........................................................................156.3. Base Structural Model Development...........................................................15
6.3.1. Efficacy........................................................................................156.3.2. Safety ..........................................................................................166.3.3. Variance Component Model Specification....................................176.3.4. Residual Variability ......................................................................17
6.4. Covariate Analysis ......................................................................................176.4.1. Step-wise Forward Addition Procedure........................................186.4.2. Backward Elimination Procedure .................................................18
6.5. Final Model Refinement ..............................................................................196.6. Model Performance ....................................................................................19
7. SIMULATIONS FOR DOSE RECOMMENDATIONS..............................................20
8. FINAL REPORT .....................................................................................................20
9. CONTENTS OF THE REPORT..............................................................................209.1. Tables.........................................................................................................219.2. Figures .......................................................................................................219.3. Appendices.................................................................................................229.4. Electronic Data Archiving............................................................................22
Confidential 2012N152078_00
ATN117309, ATN117321, ATN117322, ATN117183
3
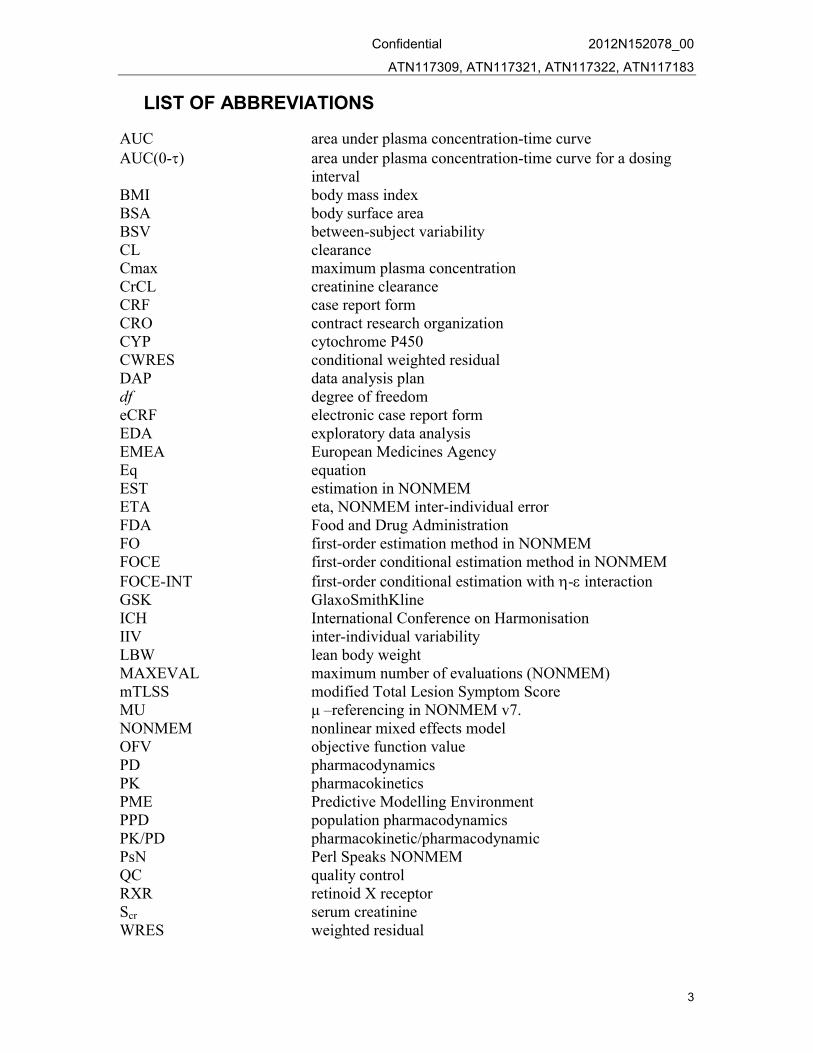
LIST OF ABBREVIATIONS
AUC area under plasma concentration-time curveAUC(0-) area under plasma concentration-time curve for a dosing
intervalBMI body mass indexBSA body surface areaBSV between-subject variabilityCL clearanceCmax maximum plasma concentrationCrCL creatinine clearanceCRF case report form CRO contract research organizationCYP cytochrome P450CWRES conditional weighted residualDAP data analysis plandf degree of freedomeCRF electronic case report formEDA exploratory data analysisEMEA European Medicines AgencyEq equationEST estimation in NONMEMETA eta, NONMEM inter-individual errorFDA Food and Drug AdministrationFO first-order estimation method in NONMEMFOCE first-order conditional estimation method in NONMEMFOCE-INT first-order conditional estimation with - interactionGSK GlaxoSmithKlineICH International Conference on HarmonisationIIV inter-individual variabilityLBW lean body weightMAXEVAL maximum number of evaluations (NONMEM)mTLSS modified Total Lesion Symptom ScoreMU μ –referencing in NONMEM v7.NONMEM nonlinear mixed effects modelOFV objective function valuePD pharmacodynamicsPK pharmacokineticsPME Predictive Modelling EnvironmentPPD population pharmacodynamicsPK/PD pharmacokinetic/pharmacodynamicPsN Perl Speaks NONMEMQC quality controlRXR retinoid X receptorScr serum creatinineWRES weighted residual

Confidential 2012N152078_00
ATN117309, ATN117321, ATN117322, ATN117183
4
1. INTRODUCTION
1.1. Background
Alitretinoin (BAL4079, GF188742, Toctino), the 9-cis isomer of retinoic acid (RA), is a physiological metabolite of vitamin A (retinol) and belongs to the chemical class of retinoids comprising natural as well as synthetic compounds. Alitretinoin is an investigational product in the United States (US) and an approved product in multiple European countries, Canada, and Israel for the treatment of severe chronic hand eczema(CHE) unresponsive to treatment with potent topical corticosteroids. Alitretinoin has been in-licensed to Stiefel from Basilea Pharmaceutica after completion of multipledouble-blind, placebo-controlled efficacy and safety clinical studies, including the following studies relevant to exposure-response analysis:
A Phase II study of the efficacy and safety of alitretinoin in patients with moderate to severe chronic hand eczema refractory to topical treatment randomized to treatment with placebo or 10, 20, or 40 mg alitretinoin, given once daily for a duration of 12 weeks [Basilea# BAP00003 (GSK# ATN117309)];
A European and Canadian Phase III study of the efficacy and safety of alitretinoin in patients with severe chronic hand eczema refractory to topical treatment randomized to treatment with placebo or 10 or 30 mg alitretinoin, given once daily for a duration of 12 to 24 weeks, with a 24 week follow-up [Basilea# BAP00089 (GSK# ATN117321);
A European and Canadian Phase III study of the efficacy and safety of retreatment with alitretinoin for 12 weeks in patients who responded as part of Study BAP00089randomized to retreatment with either placebo, 10 mg or 30 mg of alitretinoin for an additional 12 weeks (Part A) or the continuation of treatment in patients who did not respond by 12 weeks in Study BAP00089 (Part B: open-labelled) [Basilea #BAP00091 (GSK# ATN117322)]; and
The US Phase III study of the efficacy and safety of alitretinoin in patients meeting the criteria of severe chronic refractory hand eczema after a 2-16 week run-in period, where patients were randomized to receive alitretinoin 30 mg or placebo once daily for up to 24 weeks, with a 72 week follow-up visit [Basilea# BAP01346 (GSK# ATN117183); and
A double-blind pharmacokinetic study in 32 subjects with moderate to severe hand eczema who received alitretinion 10 mg or 30 mg once daily for 12 to 24 weeks with full pharmacokinetic profiles and efficacy/safety throughout treatment [Basilea# BAP00200 (GSK#ATN 117327)]1
In all studies, the main parameter of disease severity was the physician global assessment (PGA), and response to treatment was defined as a PGA rating of “Clear” or “Almost
1 From here on, all studies will be referred to by their Basilea #, not GSK #
Confidential 2012N152078_00
ATN117309, ATN117321, ATN117322, ATN117183
5
Clear” hands at the end of therapy, with the modified Total Lesion Symptom Score(mTLSS) as a secondary endpoint.
The Phase II dose finding study and studies BAP00089 and BAP00091 were the basis for approval of alitretinoin in multiple European countries, Canada, and Israel. The BAP001346 study was undertaken in the US to address some of the issues raised by the US Food and Drug Administration (FDA) to Basilea during the development of alitretinoin.
The Phase II study (BAP0003) showed that alitretinoin was clinically effective, with the degree of efficacy being dose-dependent. Alitretinoin was well tolerated but exhibited typical retinoid class effects, the most frequent dose-related adverse event (AE) being headache. In an effort to reduce the frequency of expected AEs, the maximal dose tested in phase III studies was 30 mg.
Two Phase III studies have been conducted (BAP00089 and BAP001346) along with a retreatment/extension protocol (BAP00091). The Phase III studies showed a clinically meaningful benefit at the end of dosing.
In all placebo-controlled studies, response rates were significantly higher for patients given alitretinoin than for those given placebo. Secondary efficacy parameters, comprising reductions in specific CHE signs and symptoms, patient ratings of improvement, and extent of disease, were consistent with the primary PGA response ratings. Higher doses of alitretinoin led to more rapid improvement in CHE and greater efficacy overall.
Safety evaluations revealed a pattern of adverse reactions consistent with known class effects of retinoids and retinoid X receptor (RXR) agonists. The most frequently reported adverse events were headache and mucocutaneous events, and event frequencies were dose-related. Laboratory tests showed abnormal increases in serum levels of triglycerides, cholesterol, ; and decreases in hemoglobin, thyroid-stimulating hormone (TSH), and thyroxine (T4). Serious adverse events followed a pattern consistent with the age and overall health of the patients. Treatment had no detectable adverse effect on bone, vision, or psychiatric disorders.
Generally, exposure-response analysis can help define the optimal dose of a product where exposure refers to the dose (drug input to the body) and various measures of acute or integrated drug concentrations in plasma and other biological fluid (e.g., Cmax, Cmin, Css, AUC), and response refers to both safety and efficacy endpoints. Although Study BAP00200 has both safety and efficacy endpoints as well as PK endpoints, the number of subjects is too small (n=16 per dose overall, less with severe disease) to establish the exposure-response of alitretinoin in patients with chronic severe refractory hand eczema. Therefore, exposure-response analysis using efficacy and safety data from Phase II and/or Phase III studies, along with dose as a measure of exposure provides a better method for characterizing the optimal dose and duration of treatment with alitretinoin.

Confidential 2012N152078_00
ATN117309, ATN117321, ATN117322, ATN117183
6
1.2. Rationale for the Analysis
Because the well known risks associated with tretinoins, it seems logical that only patients with the potential to benefit significantly should be treated for the minimal time to respond. Because the duration of treatment could vary between patients during study conduct, standard statistical analysis may not describe the true magnitude of drug effect. In addition, the relapse has been defined differently in the two Phase III protocols
time to 75% of the baseline modified Total Lesion Symptom Score (mTLSS) for BAP00089; or
time between the last day of treatment and (1) date of first documentation of mild, moderate, or severe CHE (response duration) and (2) date of first documentation of severe CHE (time to relapse) for BAP001346).
Since the highest potential for benefit is in those subjects that are refractory to corticosteroids, it seems logical that the clinically meaningful relapse is related to the time to reach baseline disease severity (i.e., when they cannot be managed on topical corticosteroids). PGA scores over time were chosen for the longitudinal efficacy analysisover the mTLSS, given that PGA was the primary endpoint in Phase III studies and was collected at more timepoints than the mTLSS (particularly in BAP00091). In addition, comments from FDA suggest that the mTLSS may not have regulatory utility. Because the PGA scoring system changed between Phase II and III, the longitudinal population pharmacodynamic (PPD) analysis of PGA scores over time to be conducted will be based on Phase III data to address the clinically relevant questions related to efficacy and relapse. Assessment of safety was made on multiple endpoints including data from Phase II and III, but only one endpoint (triglycerides) was chosen for longitudinal PPD analysis given that:
1. Data from BAP00003 suggest that there is a subtle increase in triglycerides with increasing dose, even though the values are not above the accepted laboratory range in most patients;
2. Data are collected approximately regularly during treatment and post-treatment, while much less frequently for most other assessments (e.g., thyroid function); and
3. A change in triglycerides can become clinically relevant and can be treated, if needed.
Given that fasting status was collected in all patients in Phase III, but not Phase II, studies, an initial analysis using a mixture model (e.g., where the computer decides whether the subject is fasted or fed) for the Phase II data will be attempted for triglycerides. If this mixture model is not successful, the endpoint for exposure-response analysis will be switched to cholesterol which is much less dependent on fasting status.
The longitudinal PPD analysis of efficacy and safety are planned to help address the following questions/issues raised by the FDA:

Confidential 2012N152078_00
ATN117309, ATN117321, ATN117322, ATN117183
7
Definition of optimal dose and duration of treatment not defined
Efficacy studies using the PGA from Phase III studies included placebo and doses of 10 mg and 30 mg (with or without dose reductions for safety). The longitudinal analysis can evaluate the differences in efficacy at the two doses and describe the improvement in the time to onset of clear or almost clear hands(if any) with the 30 mg dose.
Longitudinal PPD analysis of safety can be based on patients receiving placebo or a wider range of doses including the 10, 20 and 40 mg from BAP00003; 10 and 30 mg from BAP00089 and 30 mg (with dose reductions) from BAP001346.
The benefit: risk profile can then be described further for the 10 and 30 mg doses.
Duration of treatment can be used as a covariate to evaluate whether the duration of treatment appears to influence the time for patient to return to baseline severity
Retreatment may be used as a covariate to evaluate any differences between the first treatment and future treatments
Specify one time for primary efficacy as well as relapse
Because subjects are treated for various durations (i.e., the minimum to respond)in order to balance benefit: risk, clinical trial simulations can be conductedassuming all subjects were treated for 3 or 6 months, to assess the magnitude of efficacy and the time of relapse to severe disease (a time when refractory to corticosteroids), a more clinically relevant endpoint
Define factors that predict both early disease control and the ability to achieve control without relapse
Can include multiple covariates include disease severity, disease type, gender, and age in the longitudinal model
Lack of a run-in period in BAP00089 (assuming the need for a run-in period makes sure patients are truly severe and refractory)
BAP001346 had run-in of 2-16 weeks; duration of run-in can be evaluated as a covariate in the longitudinal analysis and if found to be significant can be accounted for in the assessment of the magnitude of efficacy; if no relationship is seen, then efficacy from BAP00089 is more convincing
Inclusion of pain/pruritus in the PGA scale
Although we cannot change the way the variable was collected, we can add a covariate which answers whether baseline PGA score is affected by pain/pruritus score (based on subscore of mTLSS). For example, in order for pain/pruritus to contribute to PGA for severe disease at baseline, the mTLSS pain/pruritus subscore had to be equal to 3. If patient had moderate disease, thenthe mTLSS pain/pruritus subscore had to be equal to 2. Assessing whether this
Confidential 2012N152078_00
ATN117309, ATN117321, ATN117322, ATN117183
8
covariate had any effects on the magnitude of drug effect or the duration prior to relapse may give insight into this question.
Definition of severe disease at baseline
Can use mTLSS (without pain and pruritus) or PGA at baseline as a covariate to assess whether disease severity had an effect on the magnitude of efficacy and/or safety. If effects due to alitretinoin are not different between moderate and severe disease, this could increase the reliance on efficacy from all subjects in Phase III studies
Address pharmacokinetics in special populations (e.g., gender, elderly, renal and hepatic impairment)
Because pharmacokinetic data are not available in these special population, age, gender, and renal function can be used as a covariate in the longitudinal safety and efficacy analysis to evaluate the benefit: risk in these populations, assuming a wide range of ages and estimated creatinine clearances (CrCL) were studied. Hepatic impairment cannot be addressed by this analysis.
2. STUDY OBJECTIVES AND ENDPOINTS
2.1. Objectives
To characterize PGA scores over time; evaluate the covariates that may explain variability in response; and relapse and address the following questions:
Is 30 mg dose optimal?
Are there subpopulations most likely to respond?
Does the run-in affect the magnitude or time course of efficacy?
Does disease severity affect efficacy?
Is relapse (time to return of severe disease) related to duration of therapy (i.e., is there an optimal duration of therapy based on available data) or any other covariate?
Is response similar after second treatment?
To characterize triglycerides over time; evaluate the covariates that may explain variability; and address the following questions:
When does increase occur and does it continue to go up or does it stabilize?
How quickly does it come back to baseline?
Are there subpopulations that are more prone to increases?
Are women, elderly, or renal impairment patients at higher risk?

Confidential 2012N152078_00
ATN117309, ATN117321, ATN117322, ATN117183
9
2.2. Endpoints
Efficacy:
Magnitude of efficacy in PGA
Time to onset
Time to relapse (return to severe disease, PGA=5)
Safety:
Magnitude of change
Time to change
Time to return of baseline triglycerides
3. DATA SOURCE AND DESCRIPTION
3.1. Study Design and Study Population
Longitudinal PPD analysis of safety will include data from double-blind, placebo-controlled studies in:
patients administered placebo or alitretinoin 10, 20 or 40 mg QD [ BAP00003];
patients administered placebo or alitretinoin 10 or 30 mg QD [BAP00089]
patients administered placebo or alitretinoin 10 or 30 mg [ BAP00091, as part of Part A (a double blind retreatment); but not Part B (an open-labelled study in nonresponders)]
patients administered placebo or alitretinoin 30 mg (with dose reductions to 20 or 10 mg) [ BAP01346]
Longitudinal PPD analysis of efficacy will only include data from the studies used in the assessment of safety, with one exception. Data from BAP0003 will not be included in the efficacy analysis because the PGA endpoint was measured using a different scale than that used during Phase III. The important design features of the double-blind, placebo-controlled studies used in the analysis are summarized in Table 1.

Confidential 2012N152078_00
ATN117309, ATN117321, ATN117322, ATN117183
10
Table 1 Double-Blind Placebo-Controlled Studies Included In Exposure-Response Analysis
Study No. Study DescriptionDose and Administration Number of Subjects1 Collection of Efficacy and Safety Markers
BAP00003 An Efficacy and Safety Study of Alitretinoin (BAL4079) in the Treatment of Moderate or SevereChronic Hand Dermatitis
DB, PC, noRI, ModSev
Placebo, 10, 20 or 40 mg QD x 12 weeks; responders followed for additional 12 weeks post-treatment
Placebo=78 total (27 severe)
10 mg=80 total (28 severe)
20 mg=80 total (24 severe)
40 mg=81 total (29 severe)
Triglycerides/Cholesterol: screening, 2, 4, 8, 12, 13 wks
PGA scale used was different than those used in phase III studies, so this study not included in longitudinal efficacy PPD analysis
BAP00089 An Efficacy and Safety Study of Alitretinoin (BAL4079) in the Treatment of Severe Refractory Chronic Hand Dermatitis
DB, PC, noRI, Sev
Placebo, 10 or 30 mg QD x 12-24 weeks; responders followed for additional 12 weeks post-treatment
Placebo=205
10 mg=418
30 mg=409
PGA: screen, baseline, 4,8,12,16,and 24 wks during treatment (all patients),and 4,8,16, 24 post treatment (responders only)
Triglycerides/Cholesterol: screen, 4,8,12,16,and 24 during treatment, and4 wk post treatment
BAP00091
(Part A only)
Follow-up Efficacy and Safety Study of BAL4079 in the Treatment of Chronic Hand Dermatitis Refractory to Topical Therapy (Part A only)
DB, PC, noRI, Sev
Placebo, 10 mg, or 30 mg QD for 12-24 wks to patients who relapsed in BAP00091
Placebo=47
10 mg=21
30 mg=49
PGA: screen, baseline, 4,8,12,16,and 24 wks during treatment (all patients),and 4wks post treatment (responders only)
Triglycerides//Cholesterol: screen, 4, 12,20,and 24 during treatment, and4 wk post treatment
BAP001346 An Efficacy and Safety Study of Alitretinoin (BAL4079) in the Treatment of Severe Chronic Hand Eczema Refractory to Topical Therapy
DB, PC, RI, Sev
Placebo or 30 mg (with dose reductions of 20 mg or 10 mg based on AEs)
Placebo=298
30 mg=298
44 subjects reduced the dose to 20 mg or 10 mg
PGA: screen, every 4 wks during run-in, baseline, 4,8,12,16,and 24 wks during treatment (all patients),and every 4 wks during followup to 72 wks (responders only)
Triglycerides//Cholesterol: screen, 4,8,12,16,and 24 during treatment, and every 4 wk during follow-up
DB=double blind; PC=placebo-controlled; noRI=no run-in period; RI=run-in period; ModSev=moderate and severe patients; Sev= Severe patients only.
Confidential 2012N152078_00
ATN117309, ATN117321, ATN117322, ATN117183
11
4. GENERAL CONSIDERATIONS FOR DATA ANALYSES AND HANDLING
Data from Basilea will be transferred to the shared area merged and
formatted into NONMEM datasets by CPMS. The NONMEM datasets will contain PGA over time or triglycerides and cholesterol over time, with relevant covariates as defined by the data file structure specification in the data specification table (Appendix 1).
The dataset will be randomly divided into a model development dataset (accounting for 70% of the data) and a model validation dataset (accounting for 30% of the data). Whether data will be included in the model development dataset or the model validation dataset will be randomly assigned by study and treatment. This will be conducted separately for the safety and efficacy longitudinal models (i.e., the same random numberwill not be used for safety and efficacy datasets), given that some patients may have missing triglycerides but have observed PGA and vice versa.
If data sets are modified over the course of the analysis, the file name of each version of the data set must be unique. This allows verification of the different data sets utilized for the various NONMEM control streams. For each generated data file, the source file and the SAS or R/S-Plus script file used for data manipulation will be archived.
4.1. Software
The datasets will be made using SAS and/or R/S-Plus. The analysis will be performed in a validated environment with NONMEM, PsN and R used for data manipulation, estimation, graphical, and statistical summaries. Additional plots using SAS version 9.2 may be included.
4.2. Data Set Preparation
4.2.1. Analysis Population
All patients who have taken the study drug and for whom dosing information is available from their eCRF and have at least one PGA or fasted triglyceride measurement will be included in the analysis of efficacy and safety, respectively. However, if critical data are missing or critical violations in the protocol are made, then individual subject data are to be excluded. If data was excluded from longitudinal PPD analyses due to critical protocol violations (see Table 2), the data are to be included in the NONMEM dataset with a “C” at the beginning of the row to indicate to NONMEM not to use this data.

Confidential 2012N152078_00
ATN117309, ATN117321, ATN117322, ATN117183
12
Table 2 List of Exclusions for Longitudinal Efficacy and/or Safety Analyses
Prohibited medications (including topical or systemic steroids or immunosuppressant)
Concomitant medications that may increase exposure to alitretinoin (e.g., ketoconazole), excluded from efficacy analysis only
Active bacterial, fungal or viral infection of hands
Blind broken
4.2.2. Data Checkout
A QC procedure should be in place prior to transfer of data to CPMS. This QC procedure remains the responsibility of stats and programming. The purpose of data cleaning/checkout is to evaluate the consistency of the dataset. Inconsistencies can occur either in the database(s) from which the data file is constructed or in the transcription from that database.
Because the datasets were sent from various vendors, the first step in analysis will be to plot and summarize data across studies, looking for errors that may have occurred when combining across studies. This step will be done prior to finalizing this RAP.
4.2.3. Covariates
The following covariates may be included in either the safety and/or efficacy longitudinal modelling:
1. Gender
2. Age and body weight
a. As continuous variable and using quartiles or median
3. Body surface area (BSA) and estimated creatinine clearance (CrCL)
a. As continuous variable and using quartiles or median
Body surface area (BSA) in square meters will be calculated using height (cm) and weight (kg) according to Equation 1 (Mosteller 1987).
Equation 1
)3600/))(*)(((BSA kgweightcmheightsqrt
For adults, CrCL should be calculated from the serum creatinine (Scr) concentration measured at screening using the Cockcroft and Gault formula (Cockcroft et al, 1976), as shown in Equation 2 and Equation 3.

Confidential 2012N152078_00
ATN117309, ATN117321, ATN117322, ATN117183
13
Equation 2
Males: CrCL [mL/min] = ((140-Age [yrs])•Weight [kg])/(72• Scr [mg/dL])
Equation 3
Females: CrCL [mL/min] = ((140-Age [yrs])•Weight [kg])/(72• Scr [mg/dL]) • 0.85
For those subjects with a body mass index (BMI) > 27, the lean body weight (LBW) will be used instead of the total body weight for calculations of CrCL. LBW (kg) will be calculated using height (cm) and weight (kg) according to the Equation 4 for males and Equation 5 for females (Hallynck et al, 1981; James, 1976).
Equation 4
Male: LBW = (1.1weight)-[128(weight2/height2)]
Equation 5
Female: LBW = (1.07weight)-[148(weight2/height2)]
4. Disease type: hyperkerototic eczema; pompholyx; fingertip dermatitis; or other
5. History of allergens or irritants
a. Whether they are related to CHE (related; not related; not evaluated)
b. Whether avoidance led to substantial improvement (no; yes; not evaluated)
6. Duration of run-in
a. continuous variable and as categorical variable (<2, 2-4, 4-8, 8-12, 12-16, >16weeks)
7. Measures of disease severity at baseline:
a. PGA at baseline
b. mTLSS (minus pruritus/pain score) at baseline
c. Is baseline PGA score affected by pain/pruritus score (based on pain/pruritussubscore of mTLSS)
d. Extent of disease at baseline
All as continuous variables or using quartiles or median
8. Duration of disease overall
a. As continuous variable and using quartiles or median
9. Duration of present illness
a. As continuous variable and using quartiles or median

Confidential 2012N152078_00
ATN117309, ATN117321, ATN117322, ATN117183
14
10. Region (North America (NA: includes US and Canada) vs Europe)
11. First or second dose trial
4.2.4. Archival of Data Sets and Programs
All scripts used in data set manipulation and formatting, data sets (after data cleaning and during model building); NONMEM control stream files; NONMEM output files; relevant modelling and simulation files obtained from processing of NONMEM output will be archived.
5. HANDLING OF MISSING DATA
If PGA or triglycerides are missing, these observations will not be included in the NONMEM dataset. Missing covariate data were to be set to the median value for that particular variable overall. Data in which the time the subjects was receiving treatment (e.g., start or end date) are missing are not be included in the dataset.
5.1. Handling of Outliers
An outlier is defined as an aberrant observation that significantly deviates from the rest of observations in a particular individual and does not refer to a subject as an outlier. Generally, exclusions of outliers will be avoided. However, because the potential for these observations to negatively impact the convergence and/or parameter estimates (i.e., which may cause a bias) (FDA Guidance, February 1999), outliers (e.g., data points identified with a WRES >6 or CWRES>3) may need to be excluded. If any outliers are excluded, the final model will be retested with and without inclusion of these data points. The exclusions and reason for exclusions will be included in the report. It should be noted that outliers in one model may not be an outlier in another and as such the declaration of an outlier is model dependent.
6. MODELING AND STATISTICAL METHODS
6.1. Model Development
The exposure-response analysis will be performed in the following sequence of steps:
1. Exploratory data analysis/data check out (see Section 6.2).
2. Base structural model development (see Section 6.3).
3. Covariate analysis (see Section 6.4).
4. Model refinement (see Section 6.5).
5. Model evaluation (see Section 6.6).
6. Simulations (see Section 7)
Confidential 2012N152078_00
ATN117309, ATN117321, ATN117322, ATN117183
15
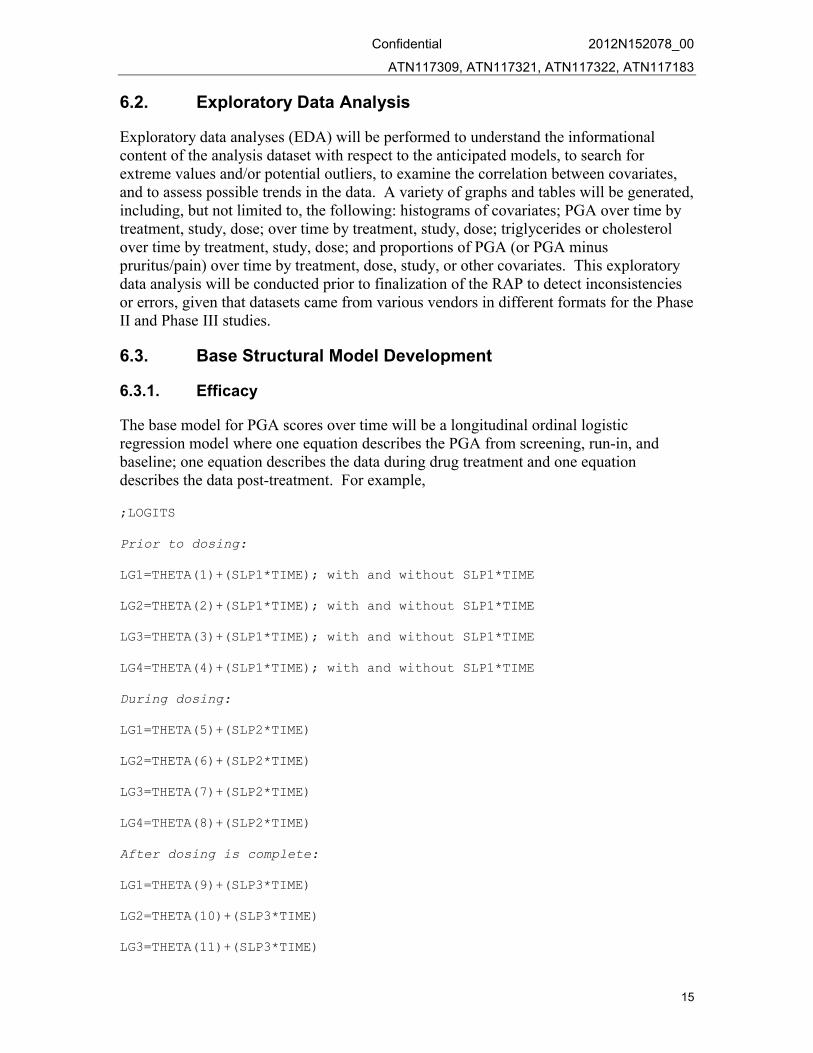
6.2. Exploratory Data Analysis
Exploratory data analyses (EDA) will be performed to understand the informational content of the analysis dataset with respect to the anticipated models, to search for extreme values and/or potential outliers, to examine the correlation between covariates, and to assess possible trends in the data. A variety of graphs and tables will be generated, including, but not limited to, the following: histograms of covariates; PGA over time by treatment, study, dose; over time by treatment, study, dose; triglycerides or cholesterolover time by treatment, study, dose; and proportions of PGA (or PGA minus pruritus/pain) over time by treatment, dose, study, or other covariates. This exploratory data analysis will be conducted prior to finalization of the RAP to detect inconsistencies or errors, given that datasets came from various vendors in different formats for the Phase II and Phase III studies.
6.3. Base Structural Model Development
6.3.1. Efficacy
The base model for PGA scores over time will be a longitudinal ordinal logistic regression model where one equation describes the PGA from screening, run-in, and baseline; one equation describes the data during drug treatment and one equation describes the data post-treatment. For example,
;LOGITS
Prior to dosing:
LG1=THETA(1)+(SLP1*TIME); with and without SLP1*TIME
LG2=THETA(2)+(SLP1*TIME); with and without SLP1*TIME
LG3=THETA(3)+(SLP1*TIME); with and without SLP1*TIME
LG4=THETA(4)+(SLP1*TIME); with and without SLP1*TIME
During dosing:
LG1=THETA(5)+(SLP2*TIME)
LG2=THETA(6)+(SLP2*TIME)
LG3=THETA(7)+(SLP2*TIME)
LG4=THETA(8)+(SLP2*TIME)
After dosing is complete:
LG1=THETA(9)+(SLP3*TIME)
LG2=THETA(10)+(SLP3*TIME)
LG3=THETA(11)+(SLP3*TIME)

Confidential 2012N152078_00
ATN117309, ATN117321, ATN117322, ATN117183
16
LG4=THETA(12)+(SLP3*TIME)
;PROBABILITY
P1=EXP(LG1)/(1+EXP(LG1))
P2=EXP(LG2)/(1+EXP(LG2))
P3=EXP(LG3)/(1+EXP(LG3))
P4=EXP(LG4)/(1+EXP(LG4))
The effect of dose will be evaluated using two approaches.
Assuming slope (SLP2) is linearly (or log-linearly) related to dose between 0 and 30 mg
Assuming a different slope(SLP2) for placebo, 10 mg, and 30 mg
6.3.2. Safety
Two modeling approaches will be used to characterize the relationship between dose and changes in triglycerides over time.
The first model will be a continuous model strategy. The base model for triglycerides over time will be a continuous model where one equation describes the PGA from screening, run-in, and baseline; one equation describes the data during drug treatment,and one equation describes the data post-treatment. Each equation will be based on the shape of the relevant data and will be chosen as a linear, log linear, exponential or sine function depending on the exploratory plots and standard NONMEM criteria around goodness of fit. The fed status was collected in Studies BAP0089, BAP0091, and BAP01346 with approximately 1/3 of patients having unfasted triglycerides. In BAP00003, the fed status was not collected. Because the fasting or fed status is important to understanding triglycerides over time, a mixture model will be attempted to see if the uncharacterized food status can be handled appropriately within NONMEM. If attempts are unsuccessful, then cholesterol will be modelled, instead of triglycerides, as cholesterol is much less influenced by fed status.
The second approach will be a repeated time-to-event approach. In this case the triglycerides values for each individual and at each measurement time will be classified in 2 classes: 1=normal, 2=above the normality range. The dose and the duration of treatment will be tested as a potential covariate (in addition to the pre-defined list of covariates).
The effect of dose will be evaluated using a model appropriate with the graphics.

Confidential 2012N152078_00
ATN117309, ATN117321, ATN117322, ATN117183
17
6.3.3. Variance Component Model Specification
Random effect models will be evaluated to estimate the inter-individual variability of appropriate parameters and residual variability. Inter-individual or between-subject variability (IIV or BSV) will be initially modelled using an additive (PGA) or exponential (triglycerides) error model. If the goodness-of-fit plots (e.g., histogram of ETA’s) reveal potential biases in the error model, alternative error models may be considered. Estimation of off-diagonal random effects will be tested at this stage of model development but will be retested during the final model refinement stage.
6.3.4. Residual Variability
An additive (PGA) or proportional (triglycerides) error model will be used to describe the residual variability. If the goodness-of-fit plots reveal potential biases in the residual variability model, other residual error models.
6.4. Covariate Analysis
Graphical and statistical approaches along with consideration of the underlying scientific rationale will be used to identify which covariates will be examined on the appropriate pharmacodynamic parameters and to assess the mathematical form of their relationships. In situations, where there is collinearity between covariates (e.g., age and gender, PGA and TLSS without pruritus/pain, age and CrCL), careful consideration should be choice of covariates to be selected (the covariate that is most likely to be the causal factor altering the parameter). One will avoid including more than one parameter on the same parameter when collinearity exists, unless model suggests it is necessary.
For efficacy analysis, the first covariate to be evaluated will be baseline PGA, mTLSS (without pruritus/pain), and extent of disease. Because these are collinear, whichever covariate is most appropriate based on goodness of fit criteria (including bias in plots) will be chosen and may remain in the model (i.e., no backward elimination) to account for the dependence in each score on the previous score. This is done because observations are not frequent enough to model using Markov Chain logistic regression, to account for dependence of each score on the previous score. The second covariate for efficacy will be dose.
For the safety analysis, the first covariate to be analyzed will be the fasting/fed status, followed by dose.
Covariate model building is a step-wise process consisting of a forward and a backward selection procedure. The likelihood ratio test will be used to evaluate the significance of incorporating or removing fixed effects into the population model based on alpha levels that are set a priori. For forward and backward selections, a significance level of 0.01 for FOCE-I will be used. For efficacy analysis, backward elimination of baseline disease and dose will not undergo backward elimination. For safety analysis, fasting/fed status and dose will not undergo backward elimination.

Confidential 2012N152078_00
ATN117309, ATN117321, ATN117322, ATN117183
18
6.4.1. Step-wise Forward Addition Procedure
Initially, each covariate individually will be included in the base model to identify significant covariates where significance is a reduction in the objective function value
(OFV) of 6.64, 2 <0.01 for 1 degree of freedom (df) using FOCE-I. Next, the significant covariates and/or those considered clinically important from previous experience will be added to the base model one covariate into one parameter at a time. The most significant covariate will be included into the model first. This new model will then serve as a new starting model for the next iteration. The test of significance and adding-on steps will be repeated until all significant covariates are included and the final model is defined.
In addition to a significant reduction in the OFV, the goodness-of-fit will be assessed by the examination of the following:
• Convergence of the estimation and covariance routines;
• Scientific plausibility of parameter estimates;
• Agreement in scatter plots of predicted and individual predicted values vs measured values (lack of increased bias);
• Lack of trend or pattern in scatter plots of weighted (conditional weighted for FOCE) residuals vs predicted values (lack of increased bias);
• Lack of trend or pattern in scatter plots of weighted residuals (conditional weighted for FOCE) vs time (lack of increased bias).
• Lack of trend or pattern in scatter plots of individual weighted (conditional weighted for FOCE) residuals and absolute values of individual weighted (conditional weighted for FOCE) residuals vs individual predicted values (lack of increased bias);
• Decrease in the standard error of the model parameter estimates;
• Decrease in the inter-individual variability and/or residual error;
• Distribution and shrinkage of inter-individual random effects;
• OFV and number of estimated parameters; e.g., Akaike criteria
• Correlation between pairs of model parameters;
• Reasonably low condition number of the model (<1000). The condition number can be obtained by taking the ratio of the largest and smallest eigenvalue of the covariance matrix of the estimate from the NONMEM output.
6.4.2. Backward Elimination Procedure
After the full model has been defined, the significance of each covariate (with the exception of disease severity) will be tested individually by removal one at a time from the full model. The following evaluation criteria will be used to determine the significance of the covariates tested:
A covariate will be retained in the model if , upon removal, the OFV increases by
more than 6.64 points (2 < 0.01 for 1 df)) using FOCE-I.

Confidential 2012N152078_00
ATN117309, ATN117321, ATN117322, ATN117183
19
In addition to the OFV, the same criteria described above will be used to assess the significance of a covariate in the procedure. The least non-significant covariate will be excluded from the model. A more stringent criterion can be used for e.g., if OFV increase
by more than 10.83 points (2 < 0.001 for 1 df) using FOCE-I [commentary from Stuart Beal 2002]. The elimination steps will be repeated until all non-significant covariates are excluded and the final model is defined. A covariate may be retained in the final model, despite not meeting the criteria above, if there is a strong pharmacological, clinical, orphysiological rationale for its inclusion.
6.5. Final Model Refinement
Model refinement steps will be performed, including, where appropriate, exploration of model improvement through reparameterization or the estimation of off-diagonal random effects, interpretation of magnitude of the variability, interpretation of standard errors of the fixed and random effects parameters, and simplification of covariate models.Additionally, simulations may be performed to illustrate the effect of various covariatesand their combinations on derived parameters. Those covariates with minimal clinical relevance (e.g., <10%) may be excluded from the final model.
6.6. Model Performance
Model performance/validation and stability can be examined through a variety of internal approaches (e.g., boot strapping, visual predictive check) and internal validation (30% of the data randomly selected by study and treatment).
Nonparametric bootstrapping: For this purpose, new datasets (n=1000) are built using sampling with replacement techniques. The parameters of interest are then estimated from each of the new datasets resulting in a series of model fits each with its own set of parameters. The 90% confidence intervals are determined for the parameters of interestusing either the appropriate tails of the sorted bootstrap distribution, which are thencompared to the original parameters obtained for the final model. The bias is the difference between the bootstrap mean and the final parameter estimate.
Visual Predictive Check: The Visual predictive check method can be utilized to evaluate the adequacy of the final model, including the effects of statistically significant covariates. This assumes that parameter uncertainty is negligible, relative to inter-individual and residual variance (Yano et al, 2001). The basic premise is that a model and parameters derived from an observed data set should produce simulated data that are similar to the original observed data.
At least 200 replicates (typically 500 to 1000 if run times permit) of the original dataset should be simulated, based on the final model, and a 90% prediction interval computed based on the simulated datasets. The observed concentration versus time data will be plotted on the prediction interval to visually assess the concordance between the simulated and observed data. Statistics of interest including the mean will be calculated from the simulated and observed data for comparison. The distributions of simulated data will be compared graphically to the observed data.
Confidential 2012N152078_00
ATN117309, ATN117321, ATN117322, ATN117183
20
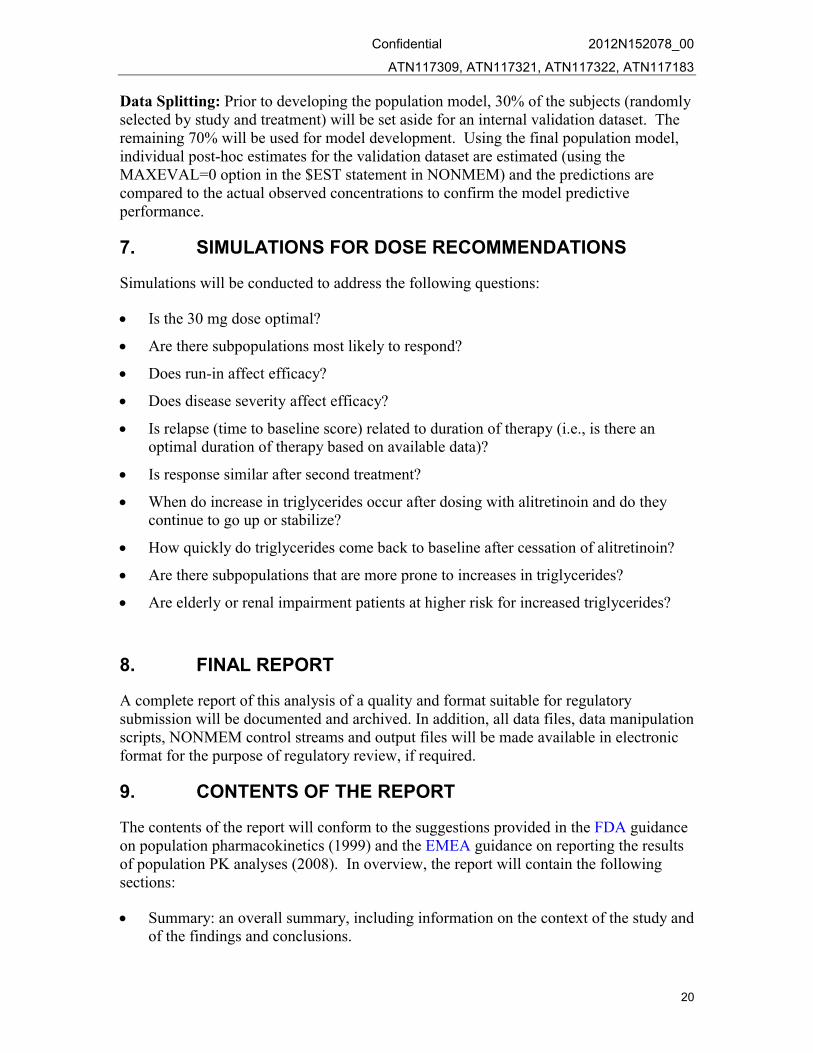
Data Splitting: Prior to developing the population model, 30% of the subjects (randomly selected by study and treatment) will be set aside for an internal validation dataset. The remaining 70% will be used for model development. Using the final population model, individual post-hoc estimates for the validation dataset are estimated (using the MAXEVAL=0 option in the $EST statement in NONMEM) and the predictions are compared to the actual observed concentrations to confirm the model predictive performance.
7. SIMULATIONS FOR DOSE RECOMMENDATIONS
Simulations will be conducted to address the following questions:
Is the 30 mg dose optimal?
Are there subpopulations most likely to respond?
Does run-in affect efficacy?
Does disease severity affect efficacy?
Is relapse (time to baseline score) related to duration of therapy (i.e., is there an optimal duration of therapy based on available data)?
Is response similar after second treatment?
When do increase in triglycerides occur after dosing with alitretinoin and do theycontinue to go up or stabilize?
How quickly do triglycerides come back to baseline after cessation of alitretinoin?
Are there subpopulations that are more prone to increases in triglycerides?
Are elderly or renal impairment patients at higher risk for increased triglycerides?
8. FINAL REPORT
A complete report of this analysis of a quality and format suitable for regulatory submission will be documented and archived. In addition, all data files, data manipulation scripts, NONMEM control streams and output files will be made available in electronic format for the purpose of regulatory review, if required.
9. CONTENTS OF THE REPORT
The contents of the report will conform to the suggestions provided in the FDA guidance on population pharmacokinetics (1999) and the EMEA guidance on reporting the results of population PK analyses (2008). In overview, the report will contain the following sections:
Summary: an overall summary, including information on the context of the study and of the findings and conclusions.

Confidential 2012N152078_00
ATN117309, ATN117321, ATN117322, ATN117183
21
Introduction: states the purpose of the study, gives the context of the study within the drug's clinical development, and indicates any special features of the study.
Objectives, Hypotheses, and Assumptions: clearly states the primary and secondary objectives of the study. Any assumptions made or hypotheses tested should be clearly stated.
Data Analysis Methods: provides a detailed description of the model building process, including the population analysis method, model assumptions, the model-fitting method, and the treatment of outliers and missing data.
Results: results of the analysis are presented in this section.
Discussion: should include interpretation of the results and the consequences of the modelling.
Application of Results: discusses how the results of the analysis will be used (for example, to support labelling), including distinctions between statistical significance and clinical relevance.
Appendix: should contain a representative portion of the data set, control streams and output files for the base and final models.
Electronic Files: data files, control streams, output files, and reports should be available for submission in electronic format.
9.1. Tables
Summary of the Distribution of Covariates
Parameter Estimates and Standard Errors from Base Structural Model.
Summary of Forward Selection and Backward Elimination for Model.
Parameter Estimates and Standard Errors from Final Model, including covariate effects.
Parameter Estimates and 90% Confidence Intervals from Bootstrap Final Model, including covariate effects.
Summary of Simulations Related to Understanding Relevance of Covariate Effects
9.2. Figures
Key Exploratory Data Analysis Figures
Observed vs Population Predicted Concentration, as appropriate.
Observed vs Individual Predicted Concentration, as appropriate.
Conditional Weighted Residuals vs Population Predicted Concentration.
A Histogram and/or QQ Plot of the Weighted and/or Conditional Weighted Residuals.

Confidential 2012N152078_00
ATN117309, ATN117321, ATN117322, ATN117183
22
Weighted and/or Conditional Weighted Residuals vs Covariate Variables.
Inter-individual Random Effects (ETA1, ETA2, …) vs Covariate Variables
9.3. Appendices
Population PK Analysis Reporting and Analysis Plan, which includes data item abbreviations and descriptions as implemented in NONMEM datasets
Summary of all models in model building process with parameter estimates (if applicable), objective function and comments
NONMEM control streams, NONMEM output files (PsN settings file(s) and PsNoutput files as needed) for the base model and final model
9.4. Electronic Data Archiving
The following will be available on CD:
a. Final report
b. Control streams for base and final model
c. Relevant data sets
d. Relevant output files
Confidential 2012N152078_00
ATN117309, ATN117321, ATN117322, ATN117183
23
References
Cockcroft DW, Gault MH. Prediction of creatinine clearance from serum creatinine. Nephron. 1976;16:31-41.
EMEA, 2008. Guidelines on reporting the results of population pharmacokinetic analyses.
FDA, Guidance for Industry on Population Pharmacokinetics; HHS. Notice. Fed Regist 1999;64(27):6663-4.
Hallynck TH, Soep HH, Thomis JA, Boelaert J, Daneels R, Dettli L. Should clearance be normalised to body surface or to lean body mass? Br J Clin Pharmacol. 1981;11:523-26.
James WPT. Research on obesity. London. Her Majesty's Stationery Office. (ISBN 0-11-4500347). 1976.
Mosteller RD. Simplified calculation of body surface area. N Engl J Med 1987;317:1098.
Yano Y, Beal SL, Sheiner LB. Evaluating pharmacokinetic/pharmacodynamic models using the posterior predictive check. J Pharmacokinet Pharmacodyn 2001;28(2):171-92.
Confidential 2012N152078_00
ATN117309, ATN117321, ATN117322, ATN117183
24
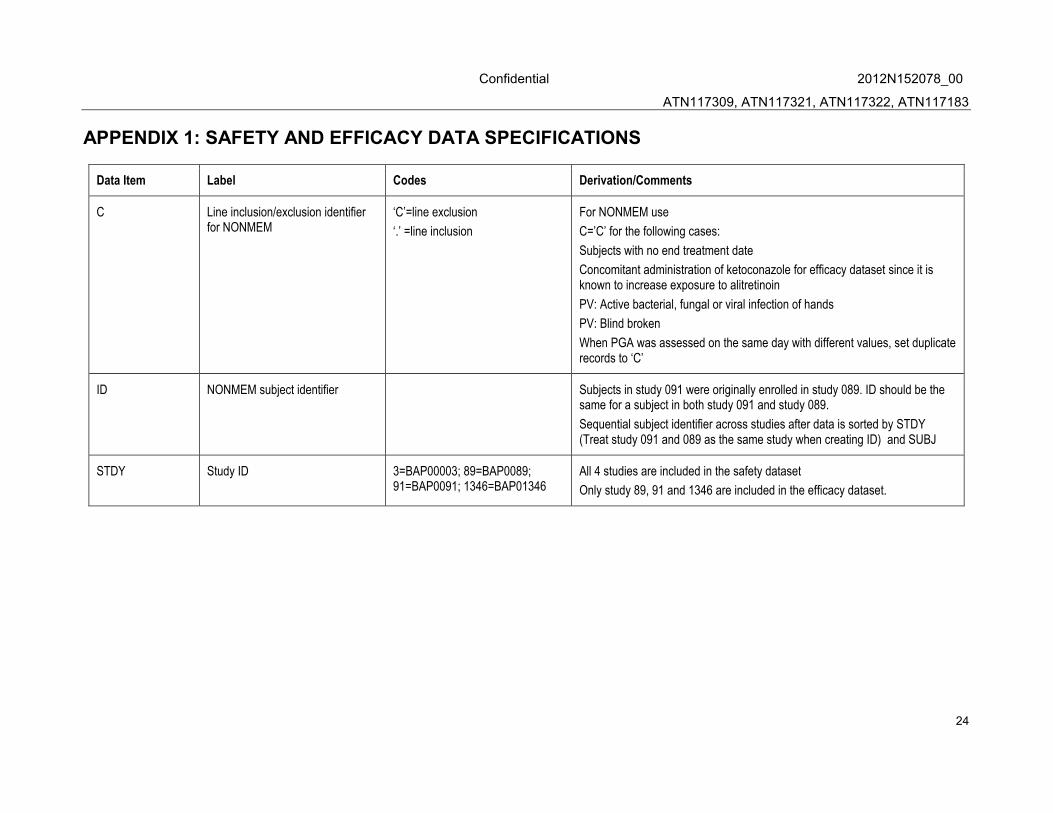
APPENDIX 1: SAFETY AND EFFICACY DATA SPECIFICATIONS
Data Item Label Codes Derivation/Comments
C Line inclusion/exclusion identifier for NONMEM
‘C’=line exclusion
‘.’ =line inclusion
For NONMEM use
C=’C’ for the following cases:
Subjects with no end treatment date
Concomitant administration of ketoconazole for efficacy dataset since it is known to increase exposure to alitretinoin
PV: Active bacterial, fungal or viral infection of hands
PV: Blind broken
When PGA was assessed on the same day with different values, set duplicate records to ‘C’
ID NONMEM subject identifier Subjects in study 091 were originally enrolled in study 089. ID should be the same for a subject in both study 091 and study 089.
Sequential subject identifier across studies after data is sorted by STDY (Treat study 091 and 089 as the same study when creating ID) and SUBJ
STDY Study ID 3=BAP00003; 89=BAP0089; 91=BAP0091; 1346=BAP01346
All 4 studies are included in the safety dataset
Only study 89, 91 and 1346 are included in the efficacy dataset.
Confidential 2012N152078_00
ATN117309, ATN117321, ATN117322, ATN117183
25
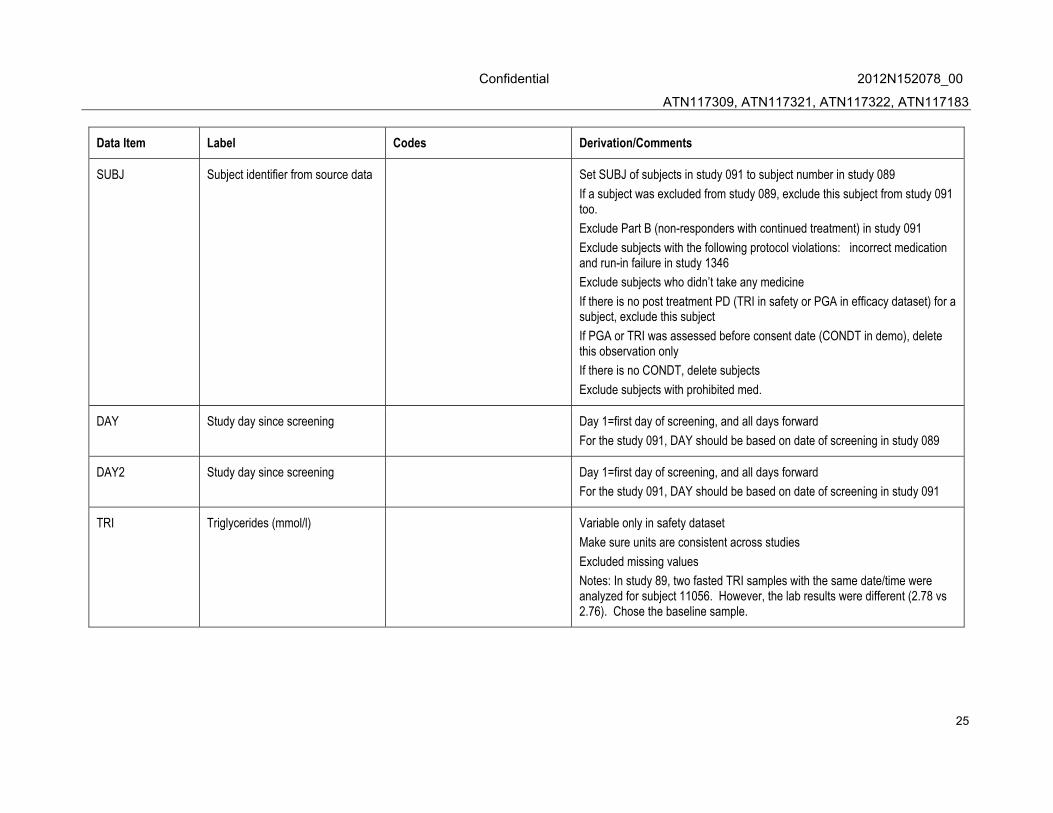
Data Item Label Codes Derivation/Comments
SUBJ Subject identifier from source data Set SUBJ of subjects in study 091 to subject number in study 089
If a subject was excluded from study 089, exclude this subject from study 091 too.
Exclude Part B (non-responders with continued treatment) in study 091
Exclude subjects with the following protocol violations: incorrect medication and run-in failure in study 1346
Exclude subjects who didn’t take any medicine
If there is no post treatment PD (TRI in safety or PGA in efficacy dataset) for a subject, exclude this subject
If PGA or TRI was assessed before consent date (CONDT in demo), delete this observation only
If there is no CONDT, delete subjects
Exclude subjects with prohibited med.
DAY Study day since screening Day 1=first day of screening, and all days forward
For the study 091, DAY should be based on date of screening in study 089
DAY2 Study day since screening Day 1=first day of screening, and all days forward
For the study 091, DAY should be based on date of screening in study 091
TRI Triglycerides (mmol/l) Variable only in safety dataset
Make sure units are consistent across studies
Excluded missing values
Notes: In study 89, two fasted TRI samples with the same date/time were analyzed for subject 11056. However, the lab results were different (2.78 vs 2.76). Chose the baseline sample.
Confidential 2012N152078_00
ATN117309, ATN117321, ATN117322, ATN117183
26
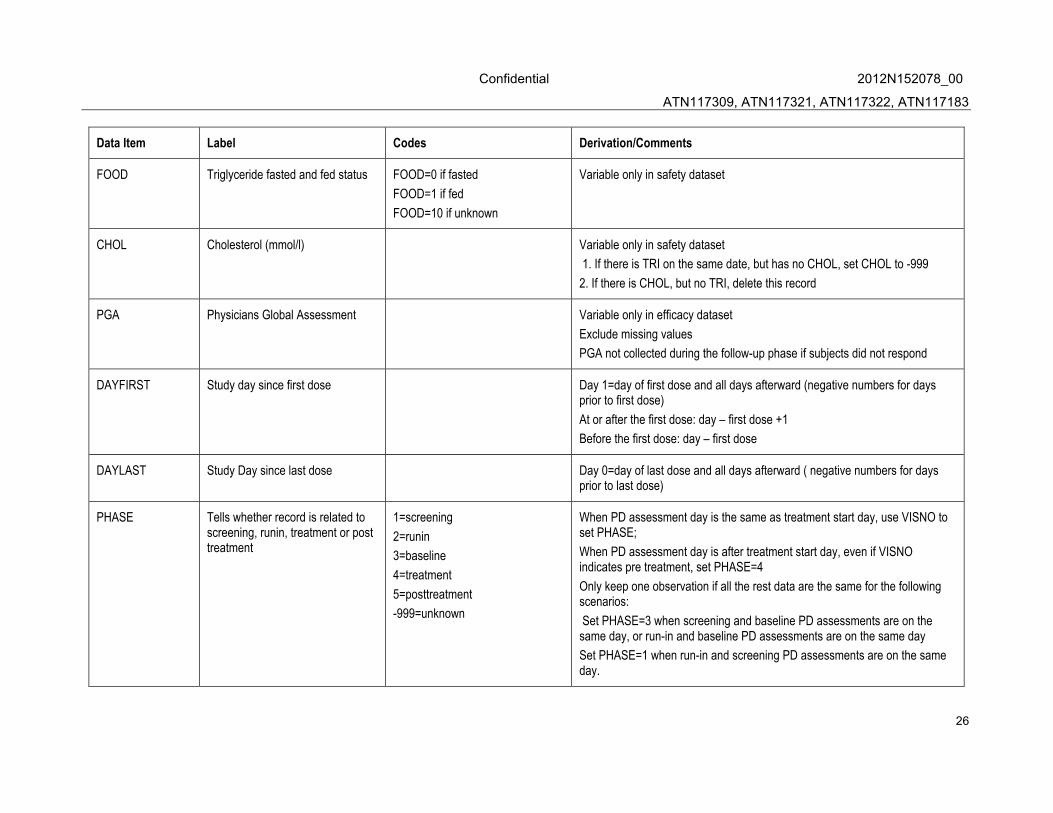
Data Item Label Codes Derivation/Comments
FOOD Triglyceride fasted and fed status FOOD=0 if fasted
FOOD=1 if fed
FOOD=10 if unknown
Variable only in safety dataset
CHOL Cholesterol (mmol/l) Variable only in safety dataset
1. If there is TRI on the same date, but has no CHOL, set CHOL to -999
2. If there is CHOL, but no TRI, delete this record
PGA Physicians Global Assessment Variable only in efficacy dataset
Exclude missing values
PGA not collected during the follow-up phase if subjects did not respond
DAYFIRST Study day since first dose Day 1=day of first dose and all days afterward (negative numbers for days prior to first dose)
At or after the first dose: day – first dose +1
Before the first dose: day – first dose
DAYLAST Study Day since last dose Day 0=day of last dose and all days afterward ( negative numbers for days prior to last dose)
PHASE Tells whether record is related to screening, runin, treatment or post treatment
1=screening
2=runin
3=baseline
4=treatment
5=posttreatment
-999=unknown
When PD assessment day is the same as treatment start day, use VISNO to set PHASE;
When PD assessment day is after treatment start day, even if VISNO indicates pre treatment, set PHASE=4
Only keep one observation if all the rest data are the same for the following scenarios:
Set PHASE=3 when screening and baseline PD assessments are on the same day, or run-in and baseline PD assessments are on the same day
Set PHASE=1 when run-in and screening PD assessments are on the same day.

Confidential 2012N152078_00
ATN117309, ATN117321, ATN117322, ATN117183
27
Data Item Label Codes Derivation/Comments
DOSE Dose amount(mg) Fill in the actual dose amount in all rows for each subject while they are receiving active treatment; before dosing and after dosing, this should be “0”
For study 003, 089 and 091, DOSE=planned dose
For study 1346, actual dose is in table tt.TTD
DSGP Dose group 0=placebo subject; 10=10 mg subject; 20=20 mg subject; 30=30 mg subject; 40=40 mg subject
CENT Study Centre Code
RG Region 0=Europe;
1=North America (Canada and US)
AGE Subject Age. (Years) Set to median age in study. The median for the study should be based on only those subjects that are included in analysis (except records with ‘C’ )
For ‘C’ record, if covariate is missing, set to -999.
AGECT1 Age as a categorical variable 0=<65;
1=>=65
AGEC Age as a categorical variable but as quartiles
1=Q1;
2=Q2;
3=Q3;
4=Q4
Across all the studies but after exclusion of C=’C’ subjects
AGEC= 1: AGE <= Q1=25%
AGEC=2: Q1 < AGE <= Q2=50%
AGEC=3: Q2 < AGE <= Q3 =75%
AGEC=4: AGE > Q3=75%
For ‘C’ record, if covariate is missing, set to -999.
SEX Subject gender 0=Male,
1=Female
set to whichever gender is most prominent for study
Confidential 2012N152078_00
ATN117309, ATN117321, ATN117322, ATN117183
28
Data Item Label Codes Derivation/Comments
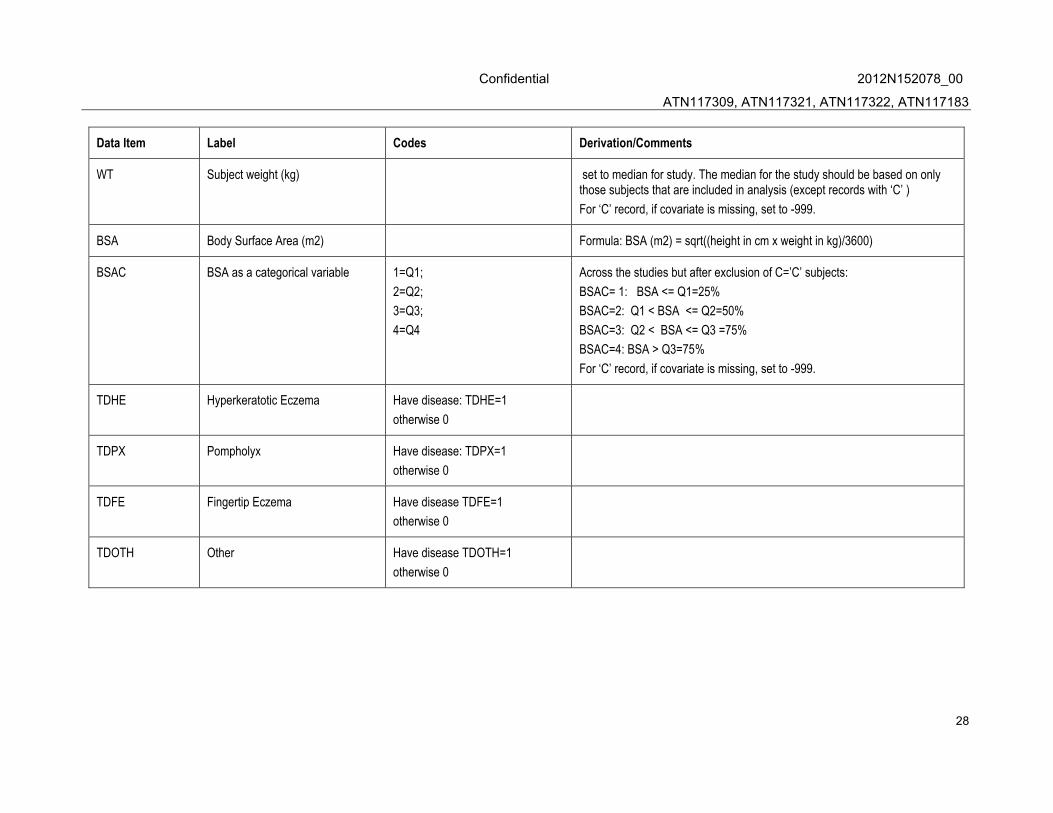
WT Subject weight (kg) set to median for study. The median for the study should be based on only those subjects that are included in analysis (except records with ‘C’ )
For ‘C’ record, if covariate is missing, set to -999.
BSA Body Surface Area (m2) Formula: BSA (m2) = sqrt((height in cm x weight in kg)/3600)
BSAC BSA as a categorical variable 1=Q1;
2=Q2;
3=Q3;
4=Q4
Across the studies but after exclusion of C=’C’ subjects:
BSAC= 1: BSA <= Q1=25%
BSAC=2: Q1 < BSA <= Q2=50%
BSAC=3: Q2 < BSA <= Q3 =75%
BSAC=4: BSA > Q3=75%
For ‘C’ record, if covariate is missing, set to -999.
TDHE Hyperkeratotic Eczema Have disease: TDHE=1
otherwise 0
TDPX Pompholyx Have disease: TDPX=1
otherwise 0
TDFE Fingertip Eczema Have disease TDFE=1
otherwise 0
TDOTH Other Have disease TDOTH=1
otherwise 0
Confidential 2012N152078_00
ATN117309, ATN117321, ATN117322, ATN117183
29
Data Item Label Codes Derivation/Comments
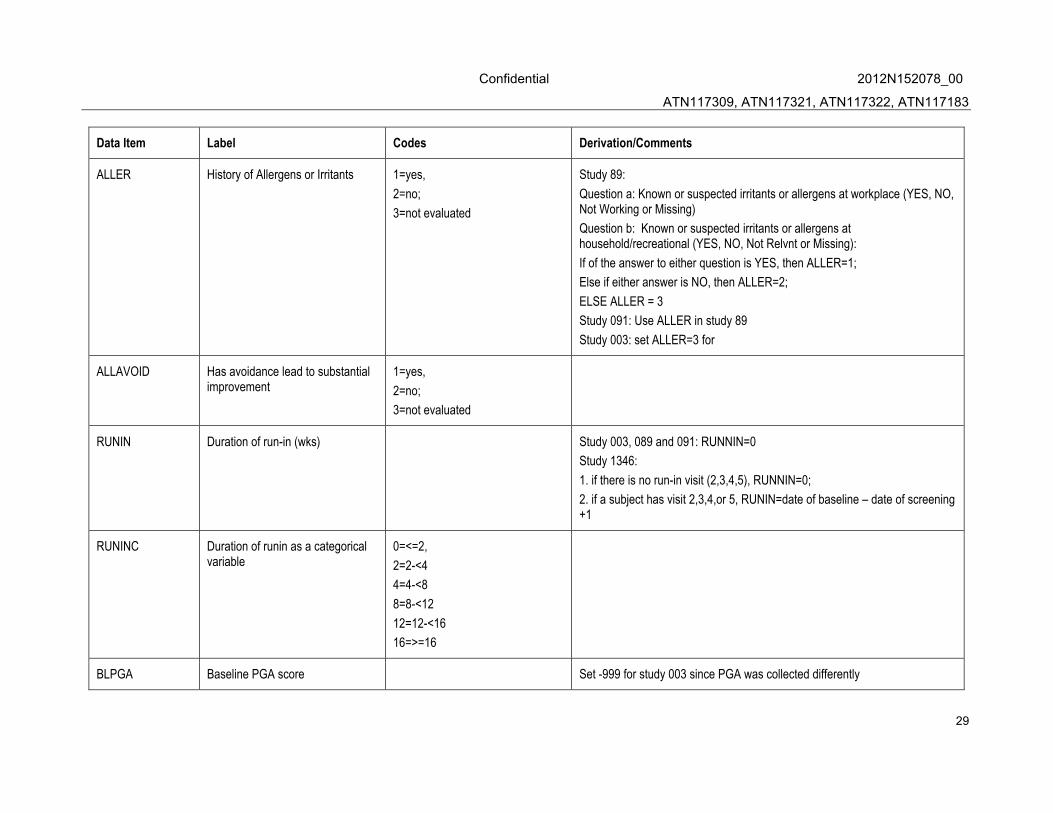
ALLER History of Allergens or Irritants 1=yes,
2=no;
3=not evaluated
Study 89:
Question a: Known or suspected irritants or allergens at workplace (YES, NO, Not Working or Missing)
Question b: Known or suspected irritants or allergens at household/recreational (YES, NO, Not Relvnt or Missing):
If of the answer to either question is YES, then ALLER=1;
Else if either answer is NO, then ALLER=2;
ELSE ALLER = 3
Study 091: Use ALLER in study 89
Study 003: set ALLER=3 for
ALLAVOID Has avoidance lead to substantial improvement
1=yes,
2=no;
3=not evaluated
RUNIN Duration of run-in (wks) Study 003, 089 and 091: RUNNIN=0
Study 1346:
1. if there is no run-in visit (2,3,4,5), RUNNIN=0;
2. if a subject has visit 2,3,4,or 5, RUNIN=date of baseline – date of screening +1
RUNINC Duration of runin as a categorical variable
0=<=2,
2=2-<4
4=4-<8
8=8-<12
12=12-<16
16=>=16
BLPGA Baseline PGA score Set -999 for study 003 since PGA was collected differently
Confidential 2012N152078_00
ATN117309, ATN117321, ATN117322, ATN117183
30
Data Item Label Codes Derivation/Comments
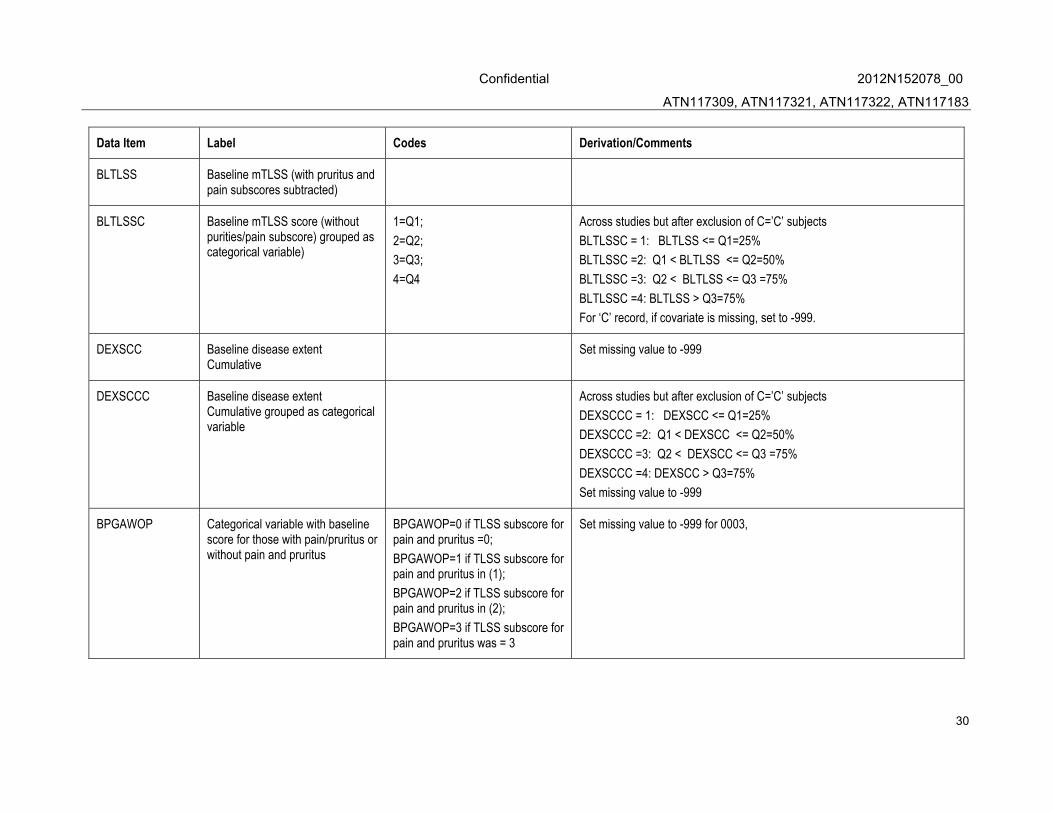
BLTLSS Baseline mTLSS (with pruritus and pain subscores subtracted)
BLTLSSC Baseline mTLSS score (without purities/pain subscore) grouped as categorical variable)
1=Q1;
2=Q2;
3=Q3;
4=Q4
Across studies but after exclusion of C=’C’ subjects
BLTLSSC = 1: BLTLSS <= Q1=25%
BLTLSSC =2: Q1 < BLTLSS <= Q2=50%
BLTLSSC =3: Q2 < BLTLSS <= Q3 =75%
BLTLSSC =4: BLTLSS > Q3=75%
For ‘C’ record, if covariate is missing, set to -999.
DEXSCC Baseline disease extent Cumulative
Set missing value to -999
DEXSCCC Baseline disease extent Cumulative grouped as categorical variable
Across studies but after exclusion of C=’C’ subjects
DEXSCCC = 1: DEXSCC <= Q1=25%
DEXSCCC =2: Q1 < DEXSCC <= Q2=50%
DEXSCCC =3: Q2 < DEXSCC <= Q3 =75%
DEXSCCC =4: DEXSCC > Q3=75%
Set missing value to -999
BPGAWOP Categorical variable with baseline score for those with pain/pruritus or without pain and pruritus
BPGAWOP=0 if TLSS subscore for pain and pruritus =0;
BPGAWOP=1 if TLSS subscore for pain and pruritus in (1);
BPGAWOP=2 if TLSS subscore for pain and pruritus in (2);
BPGAWOP=3 if TLSS subscore for pain and pruritus was = 3
Set missing value to -999 for 0003,

Confidential 2012N152078_00
ATN117309, ATN117321, ATN117322, ATN117183
31
Data Item Label Codes Derivation/Comments
DURD Duration of Disease overall (years) In study 91, there is no data collected for start of primary diagnosis date. Date from study 89 will be used calculate DURD
Time to disease start: baseline date - date of disease start +1
Use SAS function: yrdif with option ‘ACT/ACT’
Set missing value to -999
DURDC Duration of Disease overall as a categorical variable
1=Q1;
2=Q2;
3=Q3;
4=Q4
Across studies but after exclusion of C=’C’ subjects
DURDC = 1: DURD <= Q1=25%
DURDC =2: Q1 < DURD <= Q2=50%
DURDC =3: Q2 < DURD
<= Q3 =75%
DURDC =4: DURD > Q3=75%
Set missing value to -999
DURDPS Duration of present illness (months)
Time to present illness: baseline date - date of present illness +1;
Set missing value to -999
Use SAS function: yrdif with option ‘ACT/ACT’
DURDPSC Duration of present illness as a categorical variable
1=Q1;
2=Q2;
3=Q3;
4=Q4
Across studies but after exclusion of C=’C’ subjects
DURDPSC = 1: DURDPS <= Q1=25%
DURDPSC =2: Q1 < DURDPS <= Q2=50%
DURDPSC =3: Q2 < DURDPS <= Q3 =75%
DURDPSC =4: DURDPS > Q3=75%
Set missing value to -999
FORS Was this the first or second dose trial
0=all except those in 0091;
1=those in 0091

Confidential 2012N152078_00
ATN117309, ATN117321, ATN117322, ATN117183
32
Data Item Label Codes Derivation/Comments
CRCL Baseline Creatinine Clearance Value (mL/min)
Creatinine Clearance will be calculated based on the Cockcroft-Gault equation Use first equation for all people with BMI less than 29 and second formula for all people with BMI of >=29.
CrCL (ml/min) = [140 – AGE (in years)]*Weight(kg)*0.85 (for female patients) / [72* Serum Creatinine (µmol /L) * 0.0113]
Or CrCl (mL/min) = (140 – Age (yr)) * IBW (kg) / [72 • SCr (µmol/L) * 0.0113] * [0.85 if female]
IBW (kg) = 50 (kg) [ - 4.5 (kg) if female]+ 2.3 (kg) * (HT (inch) - 60)
Set missing CRE values to median for the study. The median for the study should be based on only those subjects that are included in analysis (Except records with ‘C’ )
For ‘C’ record, if covariate is missing, set to -999.
CRCLCAT Baseline Creatinine Clearance Category
1=normal (>= 90 ml/min)
2= mild (60-89 ml/min)
3=moderate (35-59 ml/min)
4 = severe (15-35 mL/min)
5 = end stage renal disease (<15 mL/min)
TRIBL Baseline Triglycerides (mmol/l) Set missing as ‘-999’
Only for safety dataset
OSUBJ Original Subject identifier in each study
Confidential 2012N152078_00
ATN117309, ATN117321, ATN117322, ATN117183
33
Data Item Label Codes Derivation/Comments
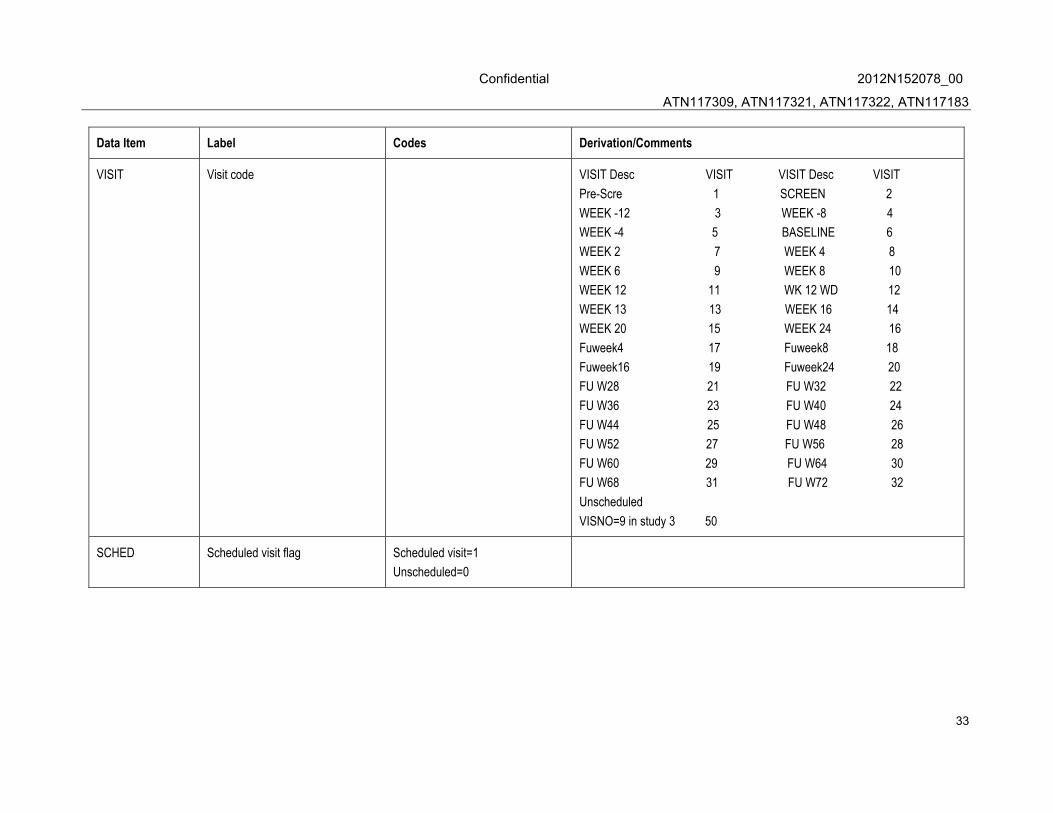
VISIT Visit code VISIT Desc VISIT VISIT Desc VISIT
Pre-Scre 1 SCREEN 2
WEEK -12 3 WEEK -8 4
WEEK -4 5 BASELINE 6
WEEK 2 7 WEEK 4 8
WEEK 6 9 WEEK 8 10
WEEK 12 11 WK 12 WD 12
WEEK 13 13 WEEK 16 14
WEEK 20 15 WEEK 24 16
Fuweek4 17 Fuweek8 18
Fuweek16 19 Fuweek24 20
FU W28 21 FU W32 22
FU W36 23 FU W40 24
FU W44 25 FU W48 26
FU W52 27 FU W56 28
FU W60 29 FU W64 30
FU W68 31 FU W72 32
Unscheduled
VISNO=9 in study 3 50
SCHED Scheduled visit flag Scheduled visit=1
Unscheduled=0