divisional findings for university of north texas 2018 ... everbach professor, journalism lorenzo...
TRANSCRIPT

Divisional Findings for University of North Texas2018-2019 COACHE Report
COACHE Steering [email protected]
October 14, 2019

Table 1: COACHE Steering Committee
Member Rank and Department
Brian Ayre Professor, Biological SciencesRobert Bland Professor, Public AdministrationDenise Catalano Associate Professor, Rehabilitation and HealthTracy Everbach Professor, JournalismLorenzo Garcia Professor, Dance and TheatreLinda Holloway Co-Chair and Interim Associate Vice ProvostVeronica Jones Assistant Professor, Counseling and Higher EdJennifer Lane Professor, Vocal StudiesEugene Martin Associate Professor, Media ArtsShawne Miksa Associate Professor, Information SciencesSanjukta Pookulangara Asso Professor, Merchandising & Digital RetailingChuck Tarantino Assistant VP for Grants and ContractsLee Walker Co-Chair and Associate Professor, Political ScienceJennifer Way Professor, Art History & Art EducationMelody White Lecturer, Information Technology & Decision SciencesJoanne Woodard VP for Institutional Equity and Diversity
Divisional Findings for University of North Texas 2018 COACHE Report
Abstract
The Collaborative on Academic Careers in Higher Education (COACHE) Survey
provides a summary of faculty satisfaction and or dissatisfaction with their jobs at
UNT. The COACHE survey was conducted in Spring of 2018, and 619 of 1105 eligible
full time faculty responded to the survey. The findings from the 2018 COACHE Survey
are presented in terms of benchmarks. Each benchmark represents the average of
several survey items that share a common theme. Moreover, findings are presented
in comparison to five peer institutions and 109 cohort institutions. This summary,
however, focuses on cross-division, cross discipline and cross demographic categories at
UNT.
1
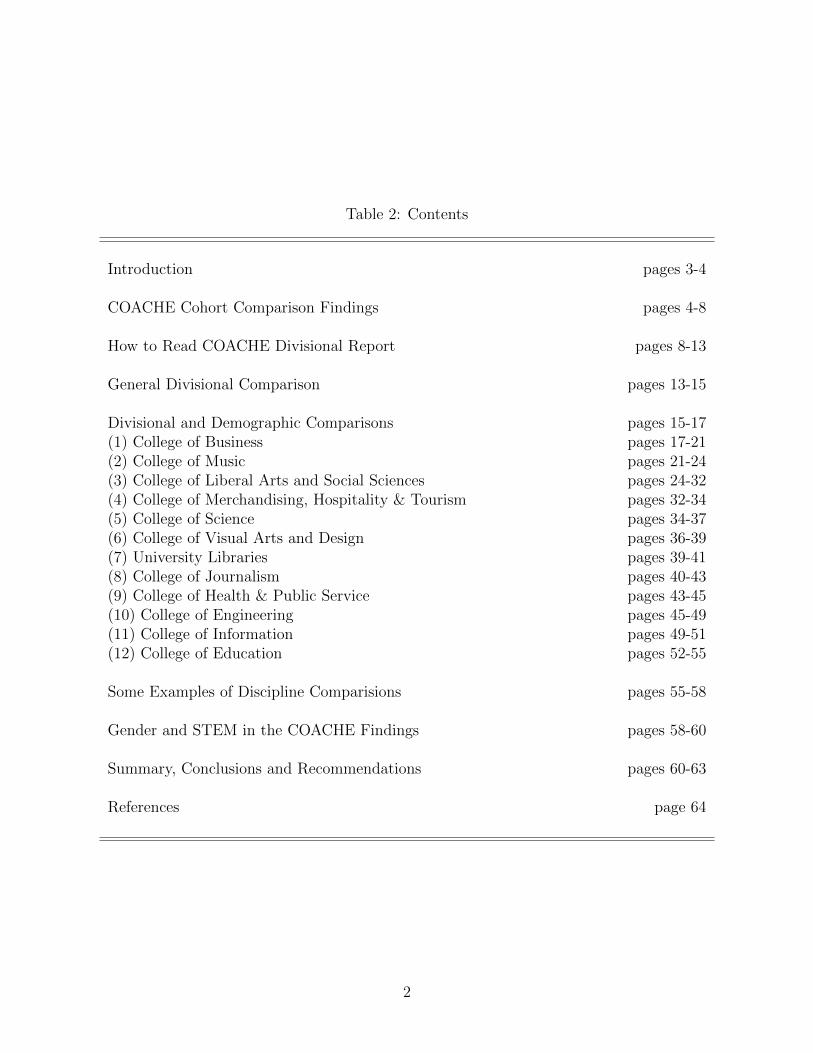
Table 2: Contents
Introduction pages 3-4
COACHE Cohort Comparison Findings pages 4-8
How to Read COACHE Divisional Report pages 8-13
General Divisional Comparison pages 13-15
Divisional and Demographic Comparisons pages 15-17(1) College of Business pages 17-21(2) College of Music pages 21-24(3) College of Liberal Arts and Social Sciences pages 24-32(4) College of Merchandising, Hospitality & Tourism pages 32-34(5) College of Science pages 34-37(6) College of Visual Arts and Design pages 36-39(7) University Libraries pages 39-41(8) College of Journalism pages 40-43(9) College of Health & Public Service pages 43-45(10) College of Engineering pages 45-49(11) College of Information pages 49-51(12) College of Education pages 52-55
Some Examples of Discipline Comparisions pages 55-58
Gender and STEM in the COACHE Findings pages 58-60
Summary, Conclusions and Recommendations pages 60-63
References page 64
2

Introduction
The 2018 UNT COACHE Survey of Faculty Satisfaction is a snapshot of the UNT faculty
in 2018. This document is a summary of faculty responses to the COACHE survey in
terms of divisions (colleges), disciplines and demographic categories. The Collaborative on
Academic Careers in Higher Education at Harvard University administers the COACHE
Survey to university and colleges of many different types. UNT is included in a group of
109 universities. Like UNT, many of these universities are research-one institutions and
have high research and teaching expectations. The COACHE team provides an executive
summary that focuses on cross-university comparison. The comparison reveals that UNT
faculty are more likely to respond to the COACHE survey and less likely to respond positively
to the survey questions than are faculty at the 109 universities in the UNT cohort. While
this cross university comparison is useful, there is much variation in the responses of UNT
faculty. This report highlights the variation between and within UNT divisions.
This study will be presented in the following form. In the first section, we discuss some
important cohort findings from the COACHE Executive Summary. In the second section, we
present the method that we use to examine the findings within and between UNT divisions
in the COACHE survey. We establish five analytical dimensions ( 1) Resources and Support,
2) Work, 3) Work Environment, 4) Institutional Leadership, and 5) Shared Governance) that
are constructed from the 25 COACHE benchmarks. In the third section, we present some
general division findings from the survey, including a ranking of divisions for each of the five
analytical dimensions. In the fourth and fifth sections of this summary, we present examples
of divisional and discipline-based demographic comparisions. In the sixth section, we briefly
discuss the COACHE gender findings in the STEM context. The final section summarizes
and concludes.
3

Table 3: COACHE Response Rates
Category UNT Peers CohortOverall 56% 44% 46%Tenured 56% 45% 48%Pre-Tenure 59% 50% 48%Non-Tenure Track 57% 38% 41%Full 54% 45% 47%Associate 57% 45% 48%Men 50% 39% 43%Women 65% 50% 53%White 58% 46% 49%Faculty of Color 52% 37% 41%Asian/Asian American 49% 35% 38%Underrepresented Minorities 55% 40% 45%
COACHE Cohort Comparison Findings
Table 3 shows that UNT participated in the COACHE survey at higher rates in all
demographic categories than did faculty at our five peer and 109 cohort institutions. The
five peer institutions are Florida International University, Texas Tech University, University
of Central Florida, University of Tennessee and Virginia Commonwealth University. Overall,
UNT’s response rate is 12% higher than the avearage of our five peer institutions, and 10%
higher than the average of the 109 cohort institutions. This high response rate appears to
reflect a higher level of engagement among UNT faculty as compared to faculty at cohort
institutions (Watanabe, Olson, and Falci 2017).
The COACHE findings are presented in terms of benchmarks. These COACHE bench-
marks relate to five dimensions of academic job satisfaction. Table 3 shows that the five
dimensions of the academic job are (1) Resources and Support, (2) Work, (3) Work Envi-
ronment, (4) Institutional Leadership, and (5) Shared Governance. These five dimensions
are used to explain the findings of the between and within division analysis of the UNT
COACHE responses.
4
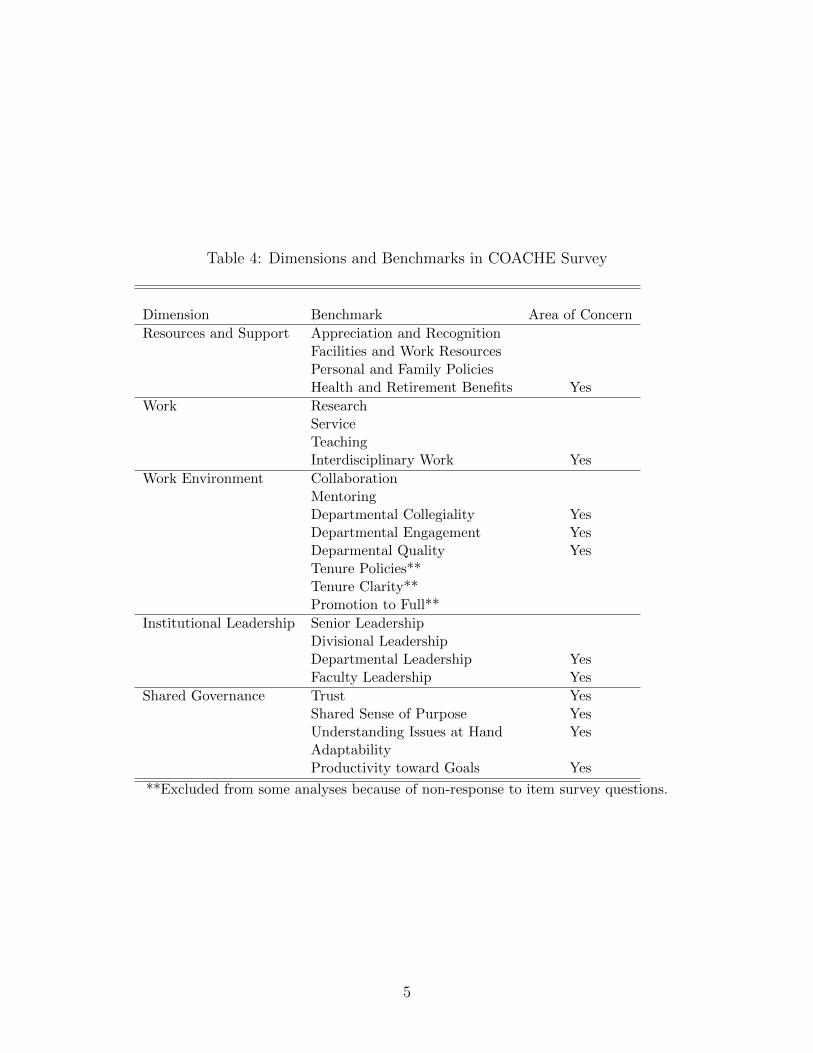
Table 4: Dimensions and Benchmarks in COACHE Survey
Dimension Benchmark Area of Concern
Resources and Support Appreciation and RecognitionFacilities and Work ResourcesPersonal and Family PoliciesHealth and Retirement Benefits Yes
Work ResearchServiceTeachingInterdisciplinary Work Yes
Work Environment CollaborationMentoringDepartmental Collegiality YesDepartmental Engagement YesDeparmental Quality YesTenure Policies**Tenure Clarity**Promotion to Full**
Institutional Leadership Senior LeadershipDivisional LeadershipDepartmental Leadership YesFaculty Leadership Yes
Shared Governance Trust YesShared Sense of Purpose YesUnderstanding Issues at Hand YesAdaptabilityProductivity toward Goals Yes
**Excluded from some analyses because of non-response to item survey questions.
5

As a starting point, the COACHE and Executive Summary reports that (in comparison
to the peer institutions) UNT has no areas of strength and 11 areas of concern among the 25
benchmarks. At the same time, these findings are somewhat misleading. While Department
Collegiality is listed as an area of concern, it is also the benchmark on which UNT faculty
rated the University most highly (see Figure 1). It is also important to note that research
finds that socially isolated people tend to have a greater probability of non-participation in
surveys (Watanabe, Olson and Falci 2017). The higher non-participation among the peer and
cohort institutions may reflect on these cohort institutions’ slighly higher mean collegiality
scores. Additionally, Departmental leadership (while an Area of Concern) generates the
highest mean score amoung the four Institutional Leadership measures for UNT faculty.
Using the demographic areas in Table 4, we can also assess the effect of these demo-
graphic categories on UNT faculty responses. Figure 2 shows the relationship between gen-
der, race/ethnicity, and academic rank in faculty responses. We plot COACHE Benchmarks
in which there are significant differences or benchmarks that may be of substantive interest.
The Gender Plot of Figure 2 shows that Women differ significantly from men in their satis-
faction in the areas of Resource and Support (Appreciation and Recognition, Facilities, and
Personal) and Work (Research and Service). On these two dimensions, UNT women are less
satisfied in their job than are UNT men. Meanwhile on Institutional Leadership dimension,
women are less likely to be satisfied with divisional leadership but do not differ with men on
faculty leadership.
The Race/Ethnic Plot of Figure 2 shows the findings concerning Race and Ethnic job sat-
isfaction. The figure shows that Under-represented Minority (URM) faculty and Asian/Asian-
American faculty do not express lower satisfaction on any dimension than do White faculty.
In fact, Asian/Asian American faculty express higher job satisfaction than White faculty on
the Shared Governance dimension (Adaptability, Shared Purpose, and Understanding). Ad-
ditionally, URM faculty express greater satisfaction with mentoring than do White faculty
members.
6

Black Diamond = UNT score. Green lines represent the top 30 percent of institutional means, red lines represent the bottom 30 percent, and grey lines represent institutions in
the middle 40 percent. The circles locate the five peer institutions. The black line represents your prior results from 2011 Associate Professor only UNT COACHE findings.
Figure 1: COACHE Mean Results for UNT and Peer and Cohort Institutions
Finally, The Rank Plot of Figure 2 shows that associate professors are less likely to
express satisfaction in their jobs than are faculty of other ranks. This finding is consistent
with research that shows that mid-career faculty are more dissatisfied with the academic
job (Mamiseishvili, Miller and Lee 2016). Interestingly, we also find that full professors are
less likely to express satisfaction with Shared Governance (Productivity, Adaptability, and
Shared Purpose) than are assistant professors and lecturers. On the other hand, lecturers
are less likely to express satisfaction with Teaching than are full professors. In the next
section, we explain how the between and within UNT findings are assessed.
7

Area of Concern
CO
AC
HE
me
an
App DLead Facility FacLead Mentor Res Serv Pers Prom
2.5
3.0
3.5
4.0
Women: highest n=313Men: highest n=306
COACHE Findings by Gender
Vertical line indicates 90% confidence interval
Area of Concern
CO
AC
HE
me
an
Adaptability Product Purpose Trust Understand Interdisp Mentor
2.0
2.5
3.0
3.5
4.0
White: highest n=430URM: highest n=108Asian: highest n=83
COACHE Findings by Race/Ethnic Group
Vertical line indicates 90% confidence interval
Area of Concern
CO
AC
HE
me
an
App Coll Cllg DLead DQl DivL Adapt Prod Purp Serv Teac Pers
2.5
3.0
3.5
4.0 Full: highest n=175
Associate: highest n=167Assistant: highest n=94Lecturer: highest n=150
COACHE Findings by Rank
Vertical line indicates 90% confidence interval
Figure 2: UNT Findings by Demographics and Areas of Concern
How to Read COACHE Divisional Report
This report seeks to understand more fully the UNT responses to the COACHE survey.
While comparing UNT findings to peer and cohort universities does place the responses into
greater context, situating the responses at the UNT divisional level provides useful frames
of reference for the responses. Given this goal, we seek to explain the findings through
the five academic job dimensions that we discussed earlier: (1) Resources and Support, (2)
Work, (3) Work Environment, (4) Institutional Leadership, and (5) Shared Governance. In
this section, we present a discussion of the five dimensions and the COACHE benchmarks
that align with these dimensions. We also show the items that constitute each of the 25
8

benchmarks.
Resources and Support
Resources and Support consists of the following COACHE benchmarks:
• Appreciation and Recognition: 1) Recognition: For teaching; 2) Recognition: For ad-
vising; 3) Recognition: For scholarship; 4) Recognition: For service; 5) Recognition:
For outreach; 6) Recognition: From colleagues; 7) Recognition: From Chief Adminis-
trative Officer (CAO); 8) Recognition: From Dean; 9) Recognition: From Head/Chair;
10) School/college is valued by Pres/Provost; 11) Dept. is valued by Pres/Provost.
• Facilities and Work Resources: 1) Support for improving teaching; 2) Office; 3)Labo-
ratory, research, studio space; 4) Equipment; 5) Classrooms; 6) Library resources; 7)
Computing and technical support; Clerical/administrative support.
• Personal and Family Policies: 1) Right balance between professional/personal; 2) In-
stitution supports family/career compatibility; 3) Housing benefits; 4) Tuition waivers,
remission, or exchange; 5) Spousal/partner hiring program; 6) Childcare; 7) Eldercare;
8) Family medical/parental leave; 9) Flexible workload/modified duties; 10 Stop-the-
clock policies; 11) Commuter benefits; 12) Parking benefits.
• Health and Retirement Benefits: 1) Health benefits for yourself; 2) Health benefits for
family; 3) Retirement benefits; 4) Phased retirement options.
Work
Work consists of the following COACHE benchmarks:
• Nature of Work: Research: 1) Time spent on research; 2) Expectations for finding
external funding; 3) Influence over focus of research; 4) Quality of graduate students
to support research; 5) Support for research; 6) Support for engaging undergraduates
in research; 7) Support for obtaining grants (pre-award); 8) Support for maintaining
9

grants (post-award); 9) Support for securing grad student assistance; 10) Support for
travel to present/conduct research; 11) Availability of course release for research.
• Nature of Work: Service: 1)Time spent on service; 2) Support for faculty in leadership
roles; 3) Number of committees; 4) Attractiveness of committees; 5) Discretion to
choose committees; 6) Equitability of committee assignments; 7) Number of student
advisees; Support for being a good advisor; Equity of the distribution of advising
responsibilities.
• Nature of Work: Teaching: 1) Time spent on teaching; 2) Number of courses taught;
3) Level of courses taught; 4) Discretion over course content; 5) Number of students
in classes taught; 6) Quality of students taught; 7) Equitability of distribution of
teaching load; 8) Quality of grad students to support teaching; 9) Teaching schedule;
10) Support for teaching diverse learning styles; 11) Support for assessing student
learning; 12) Support for developing online/hybrid courses; 13) Support for teaching
online/hybrid courses.
• Interdisciplinary Work: 1) Budgets encourage interdiscipinary work; 2) Facilities con-
ducive to interdisciplinary work; 3) Interdisciplinary work is rewarded in merit; 4)
Interdisciplinary work is rewarded in promotion; 5) Interdisciplinary work is rewarded
in tenure; 6) Department knows how to evaluate interdisciplinary work.
Work Environment
Work Environment consists of the following COACHE benchmarks:
• Collaboration: 1) Opportunities for collaboration within dept; 2) Opportunities for
collaboration outside inst; 3) Opportunities for collaboration outside dept.
• Mentoring: 1) Effectiveness of mentoring within dept; 2) Effectiveness of mentoring
outside dept; 3) Mentoring of pre-tenure faculty in dept; 4) Mentoring of tenured
associate profs in dept; 5) Support for faculty to be good mentors.
10

• Departmental Collegiality: 1) Colleagues support work/life balance; 2) Meeting times
compatible with personal needs; 3) Amount of personal interaction w/Pre-tenure;
4) How well you fit; 5) Amount of personal interaction w/Tenured; 6) Colleagues
pitch in when needed; 7) Department is collegial; 8) Colleagues committed to diver-
sity/inclusion.
• Departmental Engagement: 1) Discussions of undergrad student learning; 2)Discus-
sions of grad student learning; 3) Discussions of effective teaching practices; 4) Dis-
cussions of effective use of technology; 5) Discussions of current research methods; 6)
Amount of professional interaction w/Pre-tenure; 7) Amount of professional interaction
w/Tenured.
• Departmental Quality: 1) Intellectual vitality of tenured faculty; 2)Intellectual vitality
of pre-tenure faculty; 3) Scholarly productivity of tenured faculty; 4) Scholarly produc-
tivity of pre-tenure faculty; 5) Teaching effectiveness of tenured faculty; 6) Teaching
effectiveness of pre-tenure faculty; 7) Dept. is successful at faculty recruitment; 8)
Dept. is successful at faculty retention; 9) Dept. addresses sub-standard performance.
• Tenure Policies: 1) Clarity of tenure process; 2) Clarity of tenure criteria; 3) Clarity
of tenure standards; 4) Clarity of body of evidence for deciding tenure; 5) Clarity of
whether I will achieve tenure; 6) Clarity of tenure process in department; 7) Consistency
of messages about tenure; 8) Tenure decisions are performance-based.
• Tenure Clarity: 1) Clarity of expectations: Scholar; 2) Clarity of expectations: Teacher;
3) Clarity of expectations: Advisor; 4) Clarity of expectations: Colleague; 5) Clarity
of expectations: Campus citizen; 6) Clarity of expectations: Broader community.
• Promotion to Full: 1) Dept. culture encourages promotion; 2) Reasonable expectations:
Promotion; 3) Clarity of promotion process; 4) Clarity of promotion criteria; 5) Clarity
of promotion standards; 6) Clarity of body of evidence for promotion; 7) Clarity of
11

time frame for promotion; 8) Clarity of whether I will be promoted.
Institutional Leadership
Institutional Leadership consists of the following COACHE benchmarks:
• Senior Leadership: 1) Pres/Chancellor: Pace of decision making; 2) Pres/Chancellor:
Stated priorities; 3) Pres/Chancellor: Communication of priorities; 4) Provost: Pace of
decision making; 5) Provost: Stated priorities; 6) Provost: Communication of priorities;
7) Provost: Ensuring faculty input.
• Divisonal Leadership: 1) Dean: Pace of decision making; 2) Dean: Stated priorities; 3)
Dean: Communication of priorities; 4) Dean: Ensuring faculty input.
• Departmental Leadership: 1) Head/Chair: Pace of decision making; 2) Head/Chair:
Stated priorities; 3) Head/Chair: Communication of priorities; 4) Head/Chair: Ensur-
ing faculty input; 5) Head/Chair: Fairness in evaluating work.
• Faculty Leadership: 1) Faculty leaders: Pace of decision making; 2) Faculty leaders:
Stated priorities; 3) Faculty leaders: Communication of priorities; 4) Faculty leaders:
Ensuring faculty input.
Shared Governance
Shared Governance consists of the following COACHE benchmarks:
• Trust: 1) I understand how to voice opinions about policies; 2) Clear rules about the
roles of faculty and administration; 3) Faculty and admin follow rules of engagement;
4) Faculty and admin have an open system of communication; 5) Faculty and admin
discuss difficult issues in good faith.
• Shared Sense of Purpose: 1) Important decisions are not made until there is consensus;
2) Admin ensures sufficient time for faculty input; 3) Faculty and admin respectfully
consider the other’s view; 4) Faculty and admin have a shared sense of responsibility.
12

• Understanding Issues at Hand: 1) Faculty governance structures offer opportunities for
input; 2) Admin communicate rationale for important decisions; 3) Faculty and admin
have equal say in decisions; 4) Faculty and admin define decision criteria together.
• Adaptability: 1) Shared governance holds up in unusual circumstances; 2) Institution
regularly reviews effectiveness of governance; 3) Institution cultivates new faculty lead-
ers.
• Productivity toward Goals: 1) Overall effectiveness of shared governance; 2) My com-
mittees make measureable progress towards goals; 3) Public recognition of progress.
The divisional analysis is restricted by the number of respondents in subunits of the
divisions. The provisions of the COACHE contract restrict demographical analysis on sub-
units with fewer than five respondents. This restriction is designed to insure the anonymity
of respondents. In the next section of this report, we present division-level findings at the
overall level to demonstrate that there is a high level of variation in divisional responses.
General Division Comparison
Table 5 shows the twelve UNT Colleges ranked for each of the five dimensions of the
COACHE survey. The table ranks the Colleges based on the average (mean) score on
a 5-point scale for each of the benchmarks in that dimension. For example, Resources
and Support consists of the benchmarks of Appreciation, Facilities, Personal, and Health.
The College of Business means for the four benchmarks are 3.421, 4.512, 3.453 and 3.596,
respectively. We sum these four means and divide by four to achieve a dimension mean of
3.655. Table 5 is useful because it allows us to form expectations about demographical mean
response scores. In general, we can expect that Work Environment related scores will be
higher than Shared Governance related scores. Figure 1 on page 6 shows that there is a
similar pattern among UNT peer and cohort institutions.
Business, Music, and Library are the divisions that perform best in terms of overall
faculty satisfaction, as these three divisions are above the global mean on all five dimensions.
13

Table 5: Ranking Divisions within the Five COACHE Dimensions
Resources Work Institutional SharedSupport Work Environment Leadership Governance
Rank (mean) (mean) (mean) (mean) (mean)1 Business(3.655) HPS(3.424) Music(3.705) Library(3.558) Library(3.328)2 Library (3.586) Music (3.358) Library(3.694) Music(3.478) MHT(3.168)3 HPS(3.537) Library(3.336) HPS(3.652) Business(3.414) Music(3.122)4 Music(3.347) Business(3.259) MHT(3.578) Journalism(3.349) Business(3.114)5 MHT(3.287) Journalism(3.176) Journalism(3.553) MHT(3.242) HPS(2.924)6 Journalism(3.283) Engineering(3.161) Business(3.534) CLASS(3.233) Information(2.895)7 Engineering(3.259) COS(3.080) Information(3.496) HPS(3.230) Education(2.880)8 Education(3.223) Information(3.079) CLASS(3.442) Education(3.193) Journalism(2.809)9 COS(3.224) CLASS(3.051) CVAD(3.374) COS(3.160) CVAD(2.741)10 Information(3.204) MHT(3.027) Engineering(3.369) Information(3.099) COS(2.739)11 CLASS(3.163) Education(3.002) Education(3.322) Engineering(2.977) CLASS(2.725)12 CVAD(2.963) CVAD(2.994) COS(3.239) CVAD(2.933) Engineering(2.670)
Mean(624) 3.289 3.147 3.477 3.241 2.878C Mean 3.353 3.213 3.544 3.295 2.988
Rankings mean developed by adding mean score for each benchmark in the dimension and dividing by
the number of benchmarks. Work Environment Dimension excludes Tenure Policies, Tenure Clarity and
Promotion to Full due to non-ignorable missingness in each of these three benchmarks. Mean = UNT Mean.
C Mean = COACHE men for the 109 Cohort universities.
Alternatively, Visual Arts and Design, Liberal Arts and Social Sciences, and the College of
Science perform comparably poorly in overall faculty satisfaction, as these three colleges are
below the global mean on all five dimensions.
The Figures 2, 3, and 4 show UNT divisional level findings for the 25 COACHE bench-
marks and reveal considerable variation across the twelve divisions that the COACHE survey
documents. Figure 2 and 3 show that faculty in both the College of Liberal Arts and Social
Sciences (CLASS) and College of Sciences (COS) have concerns about Shared Governance,
as both colleges are at the bottom of their respective graph in all five Shared Governance
indicators. These findings may relate to the separation of the College of Arts and Sciences
into CLASS and COS. Additionally, Figure 2 shows that CLASS ranks lower than Business,
Music and Health and Public Service on the Work dimension. Again, CLASS is lower on
all four Work benchmarks, even though CLASS faculty members do express a high level of
satisfaction in Teaching.
14

Figure 3: Divisional Findings for Business, Health and Public Service, Liberal Arts andSocial Sciences, and Music
Meanwhile, Figure 3 shows that Library faculty are quite positive relative to faculty in
other divisions on most measures of the COACHE survey. Mean Library faculty responses are
indicated by the blue X. Library faculty have particularly high mean values on Appreciation
and Recognition, Collegiality, Collaboration, and Mentoring. In contrast to CLASS and
COS faculty, Library faculty members also express relatively high satisfaction with Shared
Governance. Figure 4 shows that faculty in the College of Merchandising, Hospitality, and
Tourism also express consistently high (relative) satisfaction with Shared Governance.
Divisional and Demographic Comparisons
In this section, we extend demographic comparison to divisional analyses of the COACHE
findings. We examine findings for twelve units of the University. We make this comparision
15

Figure 4: Divisional Findings for Education, Information, Library, and Science
in several ways. Firstly, we compare the assessment of the overall faculty concerning the five
COACHE dimensions to UNT as a whole and to the 109 Cohort universities that partici-
pated in the COACHE survey. This comparison highlights areas in which UNT units differ
siginifcantly from the UNT as a whole and from the Cohort universites.1.
We also highlight areas in which general patterns, that may or may not be statistically
significant difference, emerge in the comparison of UNT as a whole and Cohort universities
to the UNT unit.
For each unit, we also compare subgroups in each UNT unit. The size of each UNT
unit conditions our ability to perform meaningful subunit comparisons. For the most part,
1To determine statistical significance, we examine mean values and compare mean values using a 90%confidence interval to determine if a mean value is outside of the generated interval. To create the confidence
interval we calculate a pooled standard deviation using the following formula: pooled sd =
√∑K1 ((nk−1)∗(sd2
k))
(n1+n2+nk)−K
16

Figure 5: Divisional Findings for Engineering; Journalism; Merchandising, Hospitality, andTourism; and Visual Arts and Design
our subunit comparisons are performed in three demographic groupings: (1) Gender, (2)
Race/Ethncity, and (3) Academic Rank or Tenure Status. Like the overall analysis of each
unit, we compare findings for each subgrouping to the UNT as a whole findings and to Cohort
universities findings. We also compare the findings for each subgroup with other subgroups
within its demographic group.
College of Business
Overall, the College of Business fairs well when compared to other units at UNT and to
the 109 Cohort universities included in the COACHE study. Table 6 shows that College of
Business faculty has higher mean values on all five COACHE dimensions than does UNT
faculty as a whole and higher mean values than the COACHE Cohort universities. To be
clear, these higher mean values are not significantly greater than the University or Cohort
17

Table 6: Business COACHE Findings by Demographics
Resources Work Institutional Sharedand Support Work Environment Leadership Governance
Demographic(n) mean mean mean mean mean
GenderWomen(18) 3.645 3.229 3.406 3.361 3.084Men (30) 3.689 3.315 3.663 3.496 3.215
Race/EthnicityURM (7) 3.899 3.532 3.851 3.423 2.936Asian /Asian American(10) 3.573 3.384 3.385 3.313 3.138White (29) 3.627 3.406 3.517 3.443 3.159
RankAssistant (10) 3.972 3.515 4.051 3.873 3.721Associate (12) 3.509 3.047 3.263 3.108 2.756Full (14) 3.691 3.296 3.620 3.504 3.187Lecturer (12) 3.581 3.329 3.404 3.385 3.117
College Mean (48) 3.655 3.259 3.534 3.414 3.114University Mean (624) 3.289 3.147 3.477 3.241 2.878Cohort Mean 3.353 3.213 3.544 3.295 2.988
Rankings mean developed by adding mean score for each benchmark in the dimension and dividing
by the number of benchmarks. Work Environment Dimension excludes Tenure Policies, Tenure
Clarity, and Promotion to Full due to non-ignorable missingness in each of these three benchmarks.
means, but when placed in context with other UNT units, these higher mean values are
suggestive of somewhat greater job satisfaction.
Diving deeper into the College’s demographics, Figure 6 shows Business faculty mean
responses to the COACHE job satisfaction survey by Gender, Race/Ethnicity, and Rank.
The Gender Plot of Figure 6 shows that Business women faculty’s job satisfaction does
not differ significantly from that of Business men faculty’s job satisfaction. Again, we only
plot areas of concern in which there are significant demographic differences or interesting
substantive similarities. Women Business faculty responses only differ from men Business
faculty responses on Departmental Leadership and Trust benchmarks.
Table 6 places these gendered findings into greater perspective. While Business women
faculty do have lower means than do men for all five COACHE dimensions, none of the
dimensional differences is significant. The non-significant difference in Institutional Leader-
18

ship likely relates to women Business faculty members’ concerns about divisional ledership.
The non-significant difference in Shared Governance likely relates to women Business faculty
members’ concerns about trust. Moreover, in all cases but one (Work Environment=3.406),
women Business faculty mean scores exceed the University mean score. Meanwhile, men
Business faculty responses exceed the University COACHE means on all five dimensions.
Men Business faculty means are particularly higher on Resources and Support and Shared
Goverrnance.
The Race/Ethnicity Plot of Figure 6 shows that Business faculty responses generally
conform to the University wide findings that we discuss earlier in this summary. The fig-
ure shows that URM Business faculty and Asian/Asian-American Business faculty do not
express lower satisfaction on any dimension than do White Business faculty. In fact, URM
faculty members express higher job satisfaction than do White faculty on the Work Envi-
ronment dimension. We can attribute the higher satisfaction of URM Business faculty to
faculty members’ feelings concerning Collaboration, Departmental Collegiality and Mentor-
ing. Furthermore, the COACHE dimensional means of URM Business faculty is higher than
the University mean on all five dimensions.
Meanwhile, we find that Asian/Asian-American Business faculty members do have some
concern about the Work Evironment dimension. Asian/Asian American Business faculty
has a lower mean value on Work Environment than do URM Business faculty and a lower
mean value than the overall University mean. The Asian/Asian-American Business faculty’s
Work Environment mean value is the only Business Race/Ethnicity mean that is lower than
any University dimensional mean value.
The Rank Plot of Figure 6 shows that associate professors in the College of Business
express lower job satisfaction than do Business faculty of other ranks. Nevertheless, the plot
shows that associate professors are generally no less satisfied than full professors in most
aspects of their job. Table 6 tells a somewhat different story. While Business faculty are
generally more satisfied with their jobs than are the average University faculty member,
19

Area of Concern
CO
AC
HE
me
an
DeptLead Trust Mentor Research Service Teach
2.5
3.0
3.5
4.0
Women: highest n=17Men: highest n=29
Business COACHE Findings by Gender
Vertical line indicates 90% confidence interval
Area of Concern
CO
AC
HE
me
an
Collab Colleg Engag Resear Serv Teach Personal Promotion
2.0
2.5
3.0
3.5
4.0
4.5
5.0
White: highest n=29URM: highest n=7Asian: highest n=10
Business COACHE Findings by Race/Ethnic Group
Vertical line indicates 90% confidence interval
Area of Concern
CO
AC
HE
me
an
App Collab Colleg Engag Adapt Purp Trust Unders Teac Pers SLead
2.0
2.5
3.0
3.5
4.0
4.5
5.0
Full: highest n=13Associate: highest n=12Assistant: highest n=10Lecturer: highest n=11
Business COACHE Findings by Rank
Vertical line indicates 90% confidence interval
Figure 6: Business COACHE Findings
the statisfaction of the mean Business associate professors is below that of the average
University faculty member on the Work, Work Environment, Institutional Leadership, and
Shared Governance dimensions. The mean full professors and mean assistant professors in
the College of Business are above the mean University professor on all five dimensions, and
the mean Business assistant professor is substantially above the mean University and mean
Cohort professor on all five of the dimensions.
Meanwhile, lecturers in the College of Business are also generally positive (as compared
to other University faculty and the COACHE Cohort faculty) about their jobs, as Business
lecturers have mean values on all five dimensions that do not differ significantly from the mean
values of Business full professors. Additionally, Business lecturers have mean values on four
20

Table 7: Summary of Business Findings from COACHE
Grouping Dimension Group EffectCollege Overall Resources and Support All +College Overall Shared Governance All +College Overall Institutional Leadership All +Race/Ethnicity Work Environment URM +Academic Rank Shared Governance Full Professors +Academic Rank All dimensions Assistant Professors +Academic Rank Shared Governance Associate Professors -
of the five dimesnions that exceed the University and Cohort means on the five dimensions.
The sole exception is the Work Environment dimension. Here, Business lecturers have a
mean value that is only slightly lower than the University mean value (3.404 to 3.477 and
3.544).
To conclude this summary, Table 7 summarizes the major findings of this analysis of
College of Business COACHE responses. The table list the summaries for the College overall,
the demographic group, the COACHE dimension of interest, the subgroup affected, and
whether the effect is positive or negative.
College of Music
The College of Music fairs well concerning the job satisfaction of its faculty when com-
pared to other units at UNT and to the 109 Cohort universities included in the COACHE
study. Table 8 shows that College of Music faculty has higher mean values on all five
COACHE dimensions than the University overall, and higher mean values on four of the
five COACHE dimensions as compared to the COACHE Cohort universities. The Resources
and Support dimension is the sole exception, and this dimensional difference is very small
at only 0.006 (3.347 to 3.353).
Figure 7 shows that there are few demographic differences in the job satisfaction of
Music faculty. The Gender Plot of Figure 7 shows that women Music faculty are more
21

Table 8: Music COACHE Findings by Demographics
Resources Work Institutional Sharedand Support Work Environment Leadership Governance
Demographic(n) mean mean mean mean mean
GenderWomen(18) 3.290 3.366 3.750 3.516 3.285Men (30) 3.392 3.350 3.672 3.459 3.007
Race/EthnicityURM (6) 3.054 3.490 3.552 3.425 2.865White (40) 3.394 3.454 3.731 3.489 3.170
RankAssistant (8) 3.533 3.474 3.907 3.738 3.428Associate (11) 3.117 3.038 3.531 3.308 3.060Full (22) 3.373 3.409 3.711 3.426 3.006Lecturer (7) 3.476 3.362 3.731 3.699 3.381
College Mean (48) 3.347 3.358 3.705 3.478 3.122University Mean (624) 3.289 3.147 3.477 3.241 2.878Cohort Mean 3.353 3.213 3.544 3.295 2.988
Rankings mean developed by adding mean score for each benchmark in the dimension and dividing
by the number of benchmarks. Work Environment Dimension excludes Tenure Policies, Tenure
Clarity, and Promotion to Full due to non-ignorable missingness in each of these three benchmarks.
likely to express satisfaction with Service and Shared Purpose benchmarks than are men
Music faculty. Alternatively, women Music faculty members are only less likely to express
satisfaction with Interdisciplanary Research than are men Music faculty members.
In fact, Table 8 more explicitly shows the lack of gender differences among College of
Music Faculty. The mean value for men and women Music faculty are similar across all five
COACHE dimensions. Moreover, the mean values for both women and men Music faculty
on all five COACHE dimensions are above the University mean values for all five dimensions.
Additionally, with one exception (women Music faculty concerning Resources and Support),
the mean values of women and men Music faculty exceed the values of the average Cohort
faculty member.
The Race/Ethnicity plot of Figure 7 shows that Music Faculty of Color (URM) only
differ from White Music faculty on the Personal and Family Policies benchmark. Please
note the COACHE data for the College of Music does not list or separate out Asian/Asian-
22

Area of Concern
CO
AC
HE
me
an
Purpose Trust Health IntDiscip Service Teach
1.5
2.0
2.5
3.0
3.5
4.0
4.5
Women: highest n=18Men: highest n=29
Music COACHE Findings by Gender
Vertical line indicates 90% confidence interval
Area of Concern
CO
AC
HE
me
an
Quality Trust Health Personal Teach Unders
1.5
2.0
2.5
3.0
3.5
4.0
4.5
White: highest n=40Faculty of Color: highest n=7
Music COACHE Findings by Race/Ethnic Group
Vertical line indicates 90% confidence interval
Area of Concern
CO
AC
HE
me
an
Apprec Engag Adapt Prod Purpose Trust Mentor Serv Teac SenLd
2.0
2.5
3.0
3.5
4.0
4.5
5.0
Full: highest n=22Associate: highest n=11Assistant: highest n=7Lecturer: highest n=7
Music COACHE Findings by Rank
Vertical line indicates 90% confidence interval
Figure 7: Music COACHE Findings
American faculty from other FOC. Table 8 does show a pattern that suggests that URM
faculty in the College of Music may be less satisfied overall than their White counterparts.
This pattern emerges on the Shared Governance and Resources and Support dimensions.
While not statistically significant, URM Music faculty have lower mean values on these two
dimensions than White Music faculty (2.865 to 3.170, and 3.054 to 3.394, respectively).
Additionally, URM Music faculty’s mean values on these two dimensions are below both the
University means and the Cohort means. We point out however that these differences are
not significant.
The Rank Plot in Figure 7 is of interest because it generally shows that lecturers in the
College of Music generally have a mean level of job satisfaction that is similar to Music
23

Table 9: Summary of Music Findings from COACHE
Grouping Dimension Group EffectCollege Overall All dimensions All +Gender All dimensions Both +Race/Ethnicity Shared Governance URM slight -Academic Rank All dimensions Assistant Professors +Academic Rank Institutional Leadership Lecturers +
Faculty of all other ranks. In fact, lecturers are more likely to express satisfaction with
Senior Leadership and Service than are Music full professors. The plot is also interesting
in that associate professors in the College of Music generally express job satisfaction at the
same levels as full professors in the College. Table 8 generally confirms all of these favorable
findings. Lecturers, assistant professors, and full professors in the College of Music have
mean vaules on all five COACHE dimensions that exceed the University and Cohort means.
Meanwhile, Music associate professors have mean values that are lower than the University
and Cohort mean on Resources and Support and the Work dimensions.
To conclude this summary, Table 9 summarizes the major findings of this analysis of
College of Music COACHE responses. The table list the summaries for the College overall,
the demographic group, the COACHE dimension of interest, the subgroup affected, and
whether the effect is positive or negative.
College of Liberal Arts and Social Sciences
Given the size and diversity of the College of Liberal Arts and Social Sciences, it is logical
to expect variation in the satisfaction that faculty express for their respective jobs. Indeed,
we do find that there is significant variation in the job satisfaction of CLASS faculty. Of
great importance, we find that CLASS faculty mean values on all five COACHE dimensions
are below the mean values for both the University and the Cohort of universities. Table 10
shows that the greatest disparity between CLASS means and University and Cohort means
24

Table 10: CLASS COACHE Findings by Demographics
Resources Work Institutional Sharedand Support Work Environment Leadership Governance
Demographic(n) mean mean mean mean mean
GenderWomen(97) 3.054 2.979 3.420 3.146 2.699Men (95) 3.305 3.156 3.461 3.346 2.779
Race/EthnicityURM (32) 3.025 2.897 3.329 3.062 2.328Asian/Asian American (16) 3.257 3.296 3.687 3.494 3.098White (140) 3.183 3.058 3.438 3.239 2.763
RankAssistant (25) 3.361 3.293 3.792 3.652 2.885Associate (58) 3.064 3.037 3.333 3.224 2.683Full (55) 3.223 3.138 3.488 3.135 2.640Lecturer (55) 3.176 2.905 3.350 3.188 2.841
College Mean (193) 3.163 3.051 3.442 3.233 2.725University Mean (624) 3.289 3.147 3.477 3.241 2.878Cohort Mean 3.353 3.213 3.544 3.295 2.988
Rankings mean developed by adding mean score for each benchmark in the dimension and dividing
by the number of benchmarks. Work Environment Dimension excludes Tenure Policies, Tenure
Clarity, and Promotion to Full due to non-ignorable missingness in each of these three benchmarks.
are on the Work and Shared Governence dimensions. On the Work dimension, CLASS faculty
has a mean value of 3.051, while the University and the Cohort have means of 3.147 and
3.213, resepctively.2 On the Shared Governance dimension, CLASS faculty has a mean value
of 2.725, while the University and the Cohort have means of 2.878 and 2.988, resepctively.3
These finding are particularly interesting given that the CLASS faculty mean for Instituional
Leadership is only slightly lower than both the University and Cohort means in the leadership
area.
Figure 8 shows that there are substantial Gender and Race/Ethnicity differences in
CLASS concerning faculty job satisfaction using the individual COACHE benchmarks. The
Gender plot of Figure 8 shows that there are differences between women and men on 11 of
2The pooled standard deviation for CLASS faculty is .811, and the 90% confidence interval is (2.954,3.148).
3The pooled standard deviation for CLASS faculty is .903, and the 90% confidence interval is (2.611,2.838).
25

Area of Concern
CO
AC
HE
me
an
App Coll DLead Fac Trust Health Res Serv Pers Prom SLead
2.5
3.0
3.5
4.0
Women: highest n=94Men: highest n=92
COACHE Findings for CLASS by Gender
Vertical line indicates 90% confidence interval
Area of Concern
CO
AC
HE
me
an
Adaptability Purpose Trust Understand Interdisp
2.0
2.5
3.0
3.5
4.0
White: highest n=140URM: highest n=32Asian: highest n=16
COACHE Findings for CLASS by Race/Ethnic Group
Vertical line indicates 90% confidence interval
Area of Concern
CO
AC
HE
me
an
Teach Service Apprec Collab Adapt Product Purpose
2.5
3.0
3.5
4.0 Full: highest n=54
Associate: highest n=57Assistant: highest n=23Lecturer: highest n=54
COACHE Findings for CLASS by Rank
Vertical line indicates 90% confidence interval
Figure 8: CLASS COACHE Findings
the 25 benchmarks, and CLASS women have lower mean values (in relation to CLASS men)
on all 11 of these benchmarks. Women’s mean responses on these 11 benchmarks seem to
indicate that women have less job satisfaction on the Resources and Support, Institutional
Leadership, and Work dimensions.
Table 10 shows that the lower mean values of CLASS women faculty translate to lower
mean values on all five COACHE dimensions as compared to CLASS men faculty. In partic-
ular, there are significant differences in CLASS women and men concerning Resources and
Support, Work, and Institutional Leadership. On all three dimensions, men in the College of
Liberal Arts and Social Sciences are more likely to express satisfaction than are their women
counterparts.4 Moreover, CLASS women faculty have lower mean values on all five COACHE
4The pooled standard deviations for Resources and Support, Work and Institutional Leadership are 0.886,
26

dimensions as compared to the means for the University as a whole and compared to the
means for the 109 Cohort universities. In contrast, CLASS men have higher mean values
than do the University as a whole on four of the five COACHE dimensions. Additionally,
CLASS men have a more favorable apprasial of institutional leadership than do the average
University faculty member and the average faculty member among the Cohort universities.
These trends suggest that CLASS women tend to have less job satisfaction than CLASS
men.
The Race and Ethnicity plot of Figure 8 reveals that URM faculty members in CLASS
express lower job satisfaction on the Shared Governance dimension than do White and
Asian/Asian-American faculty. The URM CLASS faculty difference is particulary stark on
the Trust benchmark. These URM findings are consistent with research that link URM fac-
ulty job satisfaction with the academic climate more than with tangible resources (Price, et
al 2005; Wubreh 2011). Table 8 vividly confirms the findings of the figure in that URM mean
value on the Shared Governance. URM CLASS faculty members have a significantly lower
Shared Governance mean (2.328) than do Asian (3.098) or White (2.763) CLASS faculty.
Moreover, this mean value is substantially lower than the Asian-Asian American faculty
mean, White faculty mean, College mean, University mean and the Cohort mean. Further-
more, the URM mean on Shared Governance is the lowest mean value of any dimension for
any demographic group in Table 8.
In addition, on the Shared Governance dimension, the Rank plot in Figure 8 reveals
that full professors in CLASS have lower levels of satisfaction with Shared Governance as
compared to assistant professors and lecturers in CLASS. This finding is evident by the
lower means for full professors on the Adaptability, Productivity and Purpose benchmarks
as compared to assistant professors and lecturers. Table 8 also shows that the full professors’
Shared Governance mean is substantially lower than the mean value for the College, the
University as a whole and the Cohort universities.
0.876 and 1.055, respectively.
27

Additionally, the Rank plot of Figure 8 shows that CLASS lecturers are less likely to
express satisfaction with Teaching than are CLASS faculty of other ranks. This lower mean
value on the Teaching benchmark for lecturers is the primary factor in the Work dimension
results that are shown in Table 10. CLASS lecturers have the lowest overall mean value on
the Work dimension at 2.905. This mean value is also lower than the CLASS mean, the
University mean and the Cohort mean. Meanwhile CLASS assistant professors have a mean
value on the Work dimension that exceeds both the University and the Cohort mean values.
Because CLASS is such a large and diverse college, it is useful to examine demographic
means among the disciplines of the college. Table 11 shows CLASS COACHE findings
by demographics and discipline type. CLASS Social Sciences faculty expresses greater job
satisfaction on the Work and Work Environment dimensions than do CLASS Humanities and
CLASS Visual and Performing Arts faculty. Moreover, the means of CLASS Social Sciences
Faculty on these two dimensions are the only means among CLASS disciplinary means that
meet or exceed the University means on these two dimensions.
Again, one of the interesting CLASS findings is that CLASS faculty generally have a
negative view of Shared Governance within the University. This finding is reinforced by the
fact that CLASS faculty in all three disciplinary areas share this relatively negative view
on Shared Governance. Note the fact that the mean value for all three CLASS subdivisions
is below the University mean value of 2.878. Meanwhile, two of the three subdivisions are
relatively positive about Institutional Leadership. Humanities and Social Sciences faculty
mean values on Institutional Leadership slightly exceed the mean value of the University
and equal the mean value of the Cohort universities. Alternatively, CLASS Visual and
Performing Arts faculty is quite negative about Institutional Leadership with a mean value
of 2.818. Consequently, we can conclude that CLASS Visual and Performing Arts faculty is
more negative about institutional leadesrship than are other CLASS faculty. These findings
also somewhat suggest that CLASS faculty’s negative apprasial of Shared Governance is not
directly related to institutional leadership.
28
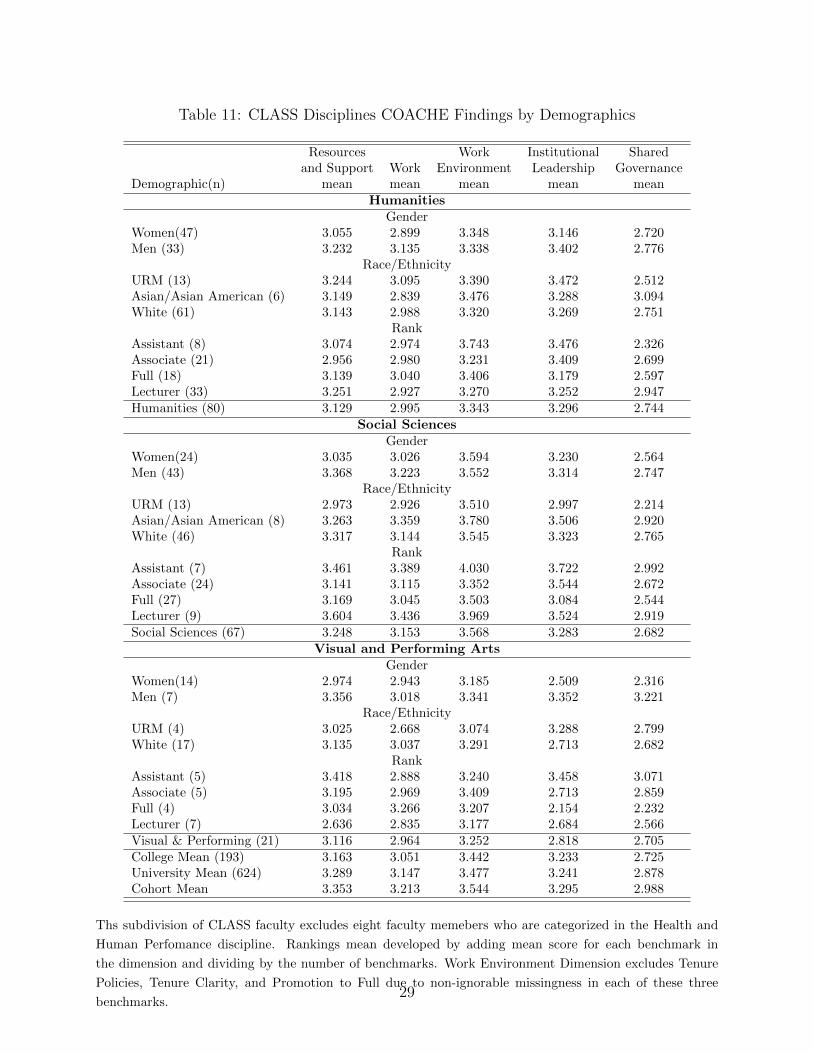
Table 11: CLASS Disciplines COACHE Findings by Demographics
Resources Work Institutional Sharedand Support Work Environment Leadership Governance
Demographic(n) mean mean mean mean meanHumanities
GenderWomen(47) 3.055 2.899 3.348 3.146 2.720Men (33) 3.232 3.135 3.338 3.402 2.776
Race/EthnicityURM (13) 3.244 3.095 3.390 3.472 2.512Asian/Asian American (6) 3.149 2.839 3.476 3.288 3.094White (61) 3.143 2.988 3.320 3.269 2.751
RankAssistant (8) 3.074 2.974 3.743 3.476 2.326Associate (21) 2.956 2.980 3.231 3.409 2.699Full (18) 3.139 3.040 3.406 3.179 2.597Lecturer (33) 3.251 2.927 3.270 3.252 2.947Humanities (80) 3.129 2.995 3.343 3.296 2.744
Social SciencesGender
Women(24) 3.035 3.026 3.594 3.230 2.564Men (43) 3.368 3.223 3.552 3.314 2.747
Race/EthnicityURM (13) 2.973 2.926 3.510 2.997 2.214Asian/Asian American (8) 3.263 3.359 3.780 3.506 2.920White (46) 3.317 3.144 3.545 3.323 2.765
RankAssistant (7) 3.461 3.389 4.030 3.722 2.992Associate (24) 3.141 3.115 3.352 3.544 2.672Full (27) 3.169 3.045 3.503 3.084 2.544Lecturer (9) 3.604 3.436 3.969 3.524 2.919Social Sciences (67) 3.248 3.153 3.568 3.283 2.682
Visual and Performing ArtsGender
Women(14) 2.974 2.943 3.185 2.509 2.316Men (7) 3.356 3.018 3.341 3.352 3.221
Race/EthnicityURM (4) 3.025 2.668 3.074 3.288 2.799White (17) 3.135 3.037 3.291 2.713 2.682
RankAssistant (5) 3.418 2.888 3.240 3.458 3.071Associate (5) 3.195 2.969 3.409 2.713 2.859Full (4) 3.034 3.266 3.207 2.154 2.232Lecturer (7) 2.636 2.835 3.177 2.684 2.566Visual & Performing (21) 3.116 2.964 3.252 2.818 2.705College Mean (193) 3.163 3.051 3.442 3.233 2.725University Mean (624) 3.289 3.147 3.477 3.241 2.878Cohort Mean 3.353 3.213 3.544 3.295 2.988
Ths subdivision of CLASS faculty excludes eight faculty memebers who are categorized in the Health and
Human Perfomance discipline. Rankings mean developed by adding mean score for each benchmark in
the dimension and dividing by the number of benchmarks. Work Environment Dimension excludes Tenure
Policies, Tenure Clarity, and Promotion to Full due to non-ignorable missingness in each of these three
benchmarks.29

While we find earlier that CLASS women faculy has lower mean values on all five
COACHE dimensions as compared to CLASS men faculty, Table 11 shows that these five di-
mension differences are not uniform across the three CLASS subdivisions. To begin, CLASS
Humanities women’s mean values differ from their men counterparts on only three of the
five dimensions: Resources and Support, Work, and Institutional Leadership. Meanwhile,
CLASS Social Sciences women faculty’s means also differ from the means of their men coun-
terparts on only three of the five dimensions: Resources and Support, Work, and Shared
Governance. Lastly, CLASS Visual and Perfoming Arts women faculty’s means also differ
from their men counterparts on only three of the five dimensions: Resources and Support, In-
stitutional Leadership, and Shared Governance. CLASS Visual and Performing Arts women
have substantially lower satisfaction with the University’s performance on Institutional Lead-
ership and Shared Governance dimensions.
While we find that overall that CLASS URM faculty members have a significantly lower
Shared Governance mean (2.328) than do Asian (3.098) or White (2.763) CLASS faculty
members, this finding is not uniform across all subdividsions of CLASS. Table 11 shows that
CLASS URM Social Sciences and CLASS URM Humanities faculty’s appraisal of Shared
Governance is far more distinctive and negative as compared to their CLASS URM Visual
and Perfoming Arts counterparts. Nonetheless, CLASS URM faculty members in all three
CLASS subdivisions have mean values on Shared Governance that are lower than the Uni-
versity and Cohort mean values. Furthermore, CLASS White faculty members in all three
CLASS subdividions have Shared Governance mean values that are lower than the University
and Cohort mean values. Still, the difference between the job satisfaction of CLASS URM
Humanities and Social Sciences faculty members is significant lower than that of CLASS
White and Asian/Asian-American faculty members in these two CLASS subdivisions.
Table 11 also reveals interesting information about differences among CLASS faculty as
related to rank and job satisfaction. Recall that Class lecturers have lower mean value on
the Work dimension than do CLASS faculty of other ranks. CLASS Social Sciences lecturers
30

Table 12: Summary of CLASS Findings from COACHE
Grouping Dimension Group EffectCollege Overall Work All -College Overall Shared Governance All -Gender Resources and Support Women -Gender Work Women -Gender Institutional Leadesrhip Women -Race/Ethnicity Shared Governance URM -Academic Rank Shared Governance Full Professors -Academic Rank Institutional Leadership Assistant Professors +Academic Rank Work Environment Assistant Professors +Academic Rank Work Lecturers -Gender Work Humanities Women -Gender Shared Governance Social Sciences Women -Gender Institutional Leadership Visual & Performing Women -Gender Shared Governance Visual &Performing Women -Race/Ethnicity Shared Governance Humanities URM -Race/Ethnicity Shared Governance Social Sciences URM -Race/Ethnicity Institutional Leadership Visual & Performing White faculty -Academic Rank Shared Governance Humanities Full Professors -Academic Rank Shared Governance Social Sciences Full Professors -Academic Rank Shared Governance Visual & Performing Full Professors -Academic Rank Institutional Leadership Visual & Performing Full Professors -
are distinctive from other CLASS lecturers in that CLASS Social Sciences lecturers have
a higher Work mean value than CLASS Social Sciences faculty of other ranks. Moreover,
the Work mean value for CLASS Social Sciences lecturers is higher than the University and
Cohort means. In contrast, the mean values for both CLASS Humanities and CLASS Visual
And Performing Arts lecturers are the lowest of their rank counterparts and lower than the
University and Cohort means.
Table 11 also shows CLASS full professor faculty members in all subdivisions have lower
mean values on the Institutional Leadership dimension than their CLASS counterparts of
other ranks. What is interesting about these differences is that the average assessment of
a CLASS Visual and Performing Arts full professor is a full point lower than the average
31

assessment of a CLASS Humanities full professor (2.154 and 3.179, respectively). Further-
more, the mean Institutional Leadership value of CLASS full professors is lower than the
University and Cohort means. CLASS full professors follow this same general pattern on
the Shared Governance dimension. While all UNT faculty generally have a concern about
Shared Governance, CLASS full professors are even more concerned about this aspect of
their job.
To conclude this summary, Table 12 summarizes the major findings of this analysis of
College of Liberal Arts and Social Sciences COACHE responses. The table list the summaries
for the College overall, the demographic group, the COACHE dimension of interest, the
subgroup affected, and whether the effect is positive or negative.
Merchandising, Hospitality & Tourism
Overall, the College of Merchandising, Hospitality & Tourism (MHT) does relatively well
when compared to other UNT units in that four of the five MHT dimension mean values
exceed the UNT five dimension mean values. Table 13 shows that the average MHT faculty
member’s job satisfaction is lower than that of the average University faculty member only
on the Work dimension. Furthermore, MHT faculty has higher mean responses than Cohort
faculty on the Work Environment and Shared Governance dimensions.
Even given these positive findings, demographic differences do emerge among MHT fac-
ulty. There is a clear gender split in the level of job satisfaction among MHT faculty. MHT
women faculty are more likely to express satisfaction with their jobs than are men on three
of the five COACHE dimensions (Work Environment, Institutional Leadership, and Shared
Governance). More specifically, the mean value of MHT women faculty on the Shared Gover-
nance dimension is significantly greater than the mean value of MHT men faculty.5 Moreover,
the mean values of MHT women faculty on four of the five COACHE dimensions meet or
exceed the University’s mean values on these five dimensions. Strikingly, MHT women fac-
ulty’s Shared Governance mean far exceeds the University’s mean on the Shared Governance
5The pooled standard deviation is .845, and the 90% confidence interval is (2.981, 3.820).
32

Table 13: Merchandising, Hospitality & Tourism COACHE Findings by Demographics
Resources Work Institutional Sharedand Support Work Environment Leadership Governance
Demographic(n) mean mean mean mean mean
GenderWomen(11) 3.332 3.050 3.488 3.412 3.401Men (8) 3.224 2.989 3.171 3.031 2.873
Race/EthnicityFaculty of Color (11) 3.186 2.974 3.437 3.202 3.173White Faculty (8) 3.461 3.109 3.783 3.355 3.164
Tenure StatusNon-Tenure Track (10) 3.602 3.470 3.736 3.696 3.334Tenure-Track (2) 2.654 2.326 3.221 3.018 2.718Tenured (7) 3.026 2.731 3.475 3.141 3.229
College Mean (19) 3.287 3.027 3.578 3.242 3.168University Mean (624) 3.289 3.147 3.477 3.241 2.878Cohort Mean 3.353 3.213 3.544 3.295 2.988
Rankings mean developed by adding mean score for each benchmark in the dimension and dividing
by the number of benchmarks. Work Environment Dimension excludes Tenure Policies, Tenure
Clarity, and Promotion to Full due to non-ignorable missingness in each of these three benchmarks.
dimension. In contrast, the mean values of MHT men faculty on all five COACHE dimen-
sions are lower than the University’s mean values on all five dimensions. For MHT men
faculty, the mean value for Work Environment (3.171) is particularly low when compared to
the UNT mean (3.477) and the Cohort mean (3.544).
Meanwhile, there is little difference in the job satisfaction of MHT FOC and MHT White
faculty. The relatively high satisfaction (in relation to other UNT units) that MHT faculty
express on the Shared Governance dimension is shared by both MHT FOC and MHT White
faculty. Furthermore, both MHT FOC and MHT White faculty have Shared Governance
means that exceed both the UNT mean and the Cohort mean.
Given the size of the College of Merchandising, Hospitality & Tourism, we examine job
satisfaction by tenure status rather than rank. Table 13 shows a divide in job satisfaction
between MHT non-tenure track faculty and MHT tenure-track/tenured faculty. MHT non-
tenure track faculty are more satisfied with their jobs than are MHT tenure-track/tenured
33

Table 14: Summary of MHT Findings from COACHE
Grouping Dimension Group EffectGender Shared Governance Men -Academic Rank Shared Governance Non-Tenure Track +Academic Rank Institutional Leadership Non-Tenure Track +Academic Rank Work Non-Tenure Track +
faculty. There are substantial differences in the satisfaction of MHT non-tenure track and
MHT tenure-track/tenured faculty on the Resources and Support, Work, and Institutional
Leadership dimensions. MHT non-tenure track faculty are far more positive on all three of
these dimensions. It is also important to note that the mean values for MHT non tenure-
track faculty exceed the UNT and Cohort means on all five dimensions. Conversely, the
mean values for MHT tenure track/tenured faculty is less than the UNT and Cohort means
on all five dimensions.
To conclude this summary, Table 14 summarizes the major findings of this analysis
of College of Merchandising, Hospitality & Tourism COACHE responses. The table list
the summaries for the College overall, the demographic group, the COACHE dimension of
interest, the subgroup affected, and whether the effect is positive or negative.
College of Science
The College of Science (COS) fairs less favorably on the five dimensions of the COACHE
job satisfaction survey than do other UNT units. Table 15 shows that the average College
of Science faculty member’s job satisfaction is lower than that of the average University
faculty member and the average Cohort faculty member on all five COACHE dimensions.
Furthermore, COS faculty has a significantly lower mean response on the Work Environment
dimension as compared to both UNT and Cohort faculty.6 Moreover, the mean value for
COS faculty on Shared Governance dimension is significant lower than the mean of Cohort
6The pooled standard deviation for the Work Environment dimension is .941, and the 90% confidenceinterval is (3.016, 3.462).
34

Table 15: Science COACHE Findings by Demographics
Resources Work Institutional Sharedand Support Work Environment Leadership Governance
Demographic(n) mean mean mean mean mean
GenderWomen(20) 2.889 2.873 3.140 3.054 2.632Men (30) 3.452 3.212 3.354 3.238 2.765
Race/EthnicityURM (6) 2.922 2.819 2.667 2.945 2.411Asian/Asian American (10) 3.033 2.934 3.053 3.465 3.012White (34) 3.124 3.176 3.403 3.114 2.695
RankAssistant (2) 3.453 2.958 3.609 3.802 3.658Associate (15) 3.000 2.975 3.016 3.258 2.622Full (21) 3.210 3.052 3.183 3.009 2.611Lecturer (12) 3.481 3.292 3.511 3.230 2.817
College Mean (50) 3.224 3.080 3.239 3.160 2.739University Mean (624) 3.289 3.147 3.477 3.241 2.878Cohort Mean 3.353 3.213 3.544 3.295 2.988
Rankings mean developed by adding mean score for each benchmark in the dimension and dividing
by the number of benchmarks. Work Environment Dimension excludes Tenure Policies, Tenure
Clarity, and Promotion to Full due to non-ignorable missingness in each of these three benchmarks.
faculty.7
There is much discussion about women in STEM fields. Furthermore, using the five
COACHE dimensions, findings do reveal gender differences in job satisfaction of COS faculty.
COS women faculty have lower mean values on all five COACHE dimensions than their
COS men counterparts.8 Moreover, COS women faculty have lower mean values on all five
COACHE dimensions than UNT faculty as a whole and Cohort faculty. Furthermore, the
mean of COS women faculty on the Work Environment dimension is significantly different
from the Cohort.9
7The pooled standard deviation for the Shared Governance dimension dimension is .903, and the 90%confidence interval is (2.518, 2.960).
8Nonetheless, the mean of COS women faculty is significantly different from COS men faculty only onthe Resources and Support dimension. The pooled standard deviation for COS women faculty is 1.114 witha 90% CI of (2.479, 3.299).
9The pooled standard deviation for COS women faculty is 1.054 with a 90% CI of (2.740, 3.542) for theWork Environment dimensions.
35

The Race/Ethnicity findings from Table 15 shows that COS URM faculty has a mean
value on the Work Environment that is significantly less than the mean value for COS White
faculty.10 Moreover, the mean values for COS URM faculty on all five COACHE dimensions
are less than the mean values for UNT faculty as a whole and for Cohort faculty.11
In the area of faculty rank, Table 15 shows that there is little variation in the job satis-
faction of COS faculty. While COS associate professors have lower mean values on four of
the five COACHE dimensions (the sole exception is the Institutional Leadership dimension)
than do COS faculty of other ranks, these mean values are not significantly different from the
mean values of other COS faculty. Meanwhile, while COS assistant professors have higher
mean values on four of the five COACHE dimensions (the sole exception is the Work di-
mension), the small sample of COS assistant professors prevents the difference from reaching
significance. Lastly, while not statistically significant in relation to COS full professors, COS
lecturers have relatively high mean values on the Work and Work Environment dimensions.
For COS lecturers, their mean values on Work and Work Environment exceeds the mean
values for UNT as a whole.
To conclude this summary, Table 16 summarizes the major findings of this analysis of
College of Science COACHE responses. The table list the summaries for the College overall,
the demographic group, the COACHE dimension of interest, the subgroup affected, and
whether the effect is positive or negative.
College of Visual Arts and Design
The College of Visual Arts and Design (CVAD) fairs somehat poorly on the five di-
mensions of the COACHE job satisfaction survey. Table 17 shows that the average CVAD
faculty member’s job satisfaction is lower than that of the average UNT faculty member and
the average Cohort faculty member on all five COACHE dimensions. Furthermore, CVAD
10The pooled standard deviation for COS URM faculty is 1.040 with a 90% CI of (1.967, 3.365) for theWork Environment dimensions.
11Even given the small sample of COS URM faculty, the mean values of COS URM faculty are signifcantlydifferent from Cohort facultyand UNT faculty on the Work Environment dimension.
36

Table 16: Summary of Science Findings from COACHE
Grouping Dimension Group EffectCollege overall Work Environment All -College overall Shared Governance All -Gender Resources and Support Women -Gender Work Women -Race/Ethnicity Work Environment URM -Race/Ethnicity Shared Governance URM -Academic Rank Shared Governance Full Professors -Academic Rank Work Environment Lecturers +
faculty has significantly lower mean response on the Resources dimensions.12
Diving deeper into Table 17, we find little gender difference in the job satisfaction of
CVAD faculty. The table shows that CVAD women faculty has lower mean values than
CVAD men faculty on three of the five COACHE dimensions. Meanwhile, CVAD men faculty
has lower mean values on the Institutional Leadership and Shared Governance dimensions.
Nonetheless, none of these differences is significant. Additionally, only the mean value Work
Evironment of CVAD men faculty is greater than a mean value at the University level (3.5
to 3.477). While this difference is not significant, it is nonetheless noteworthy in that it is
the only mean value that exceeds the University means on the five COACHE dimension.
Furthermore, the Race/Ethnicity findings for CVAD faculty are interesting in that CVAD
FOC has higher means on four of the five COACHE dimensions than do CVAD White faculty.
Because of the small sample size of CVAD FOC, we combine both CVAD Asian/Asian-
American faculty and CVAD URM faculty. The small sample also contributes to the fact
that the differences between the CVAD FOC and CVAD White FOC are not significant.
Nevertheless, the large differences between CVAD FOC and CVAD White faculty on the
Institutional Leadership and Shared Governance is noteworthy. Moreover, the mean values
of CVAD FOC on the Work Environment, Institutional Leadership, and Shared Governance
12The pooled standard deviation is .928, and the 90% confidence interval is (2.701, 3.225).
37

Table 17: CVAD COACHE Findings by Demographics
Resources Work Institutional Sharedand Support Work Environment Leadership Governance
Demographic(n) mean mean mean mean mean
GenderWomen(22) 2.908 2.964 3.318 2.934 2.865Men (12) 3.100 3.083 3.500 2.907 2.727
Race/EthnicityFaculty of Color (6) 3.114 2.969 3.732 3.552 3.434White Faculty (27) 2.936 3.111 3.311 2.802 2.732
RankAssistant (9) 2.698 2.916 3.041 2.586 2.678Associate (11) 2.954 2.881 3.231 2.726 2.678Full (8) 2.844 2.901 3.572 3.229 2.822Lecturer (6) 3.769 3.534 4.069 3.732 3.654
College Mean (34) 2.963 2.994 3.374 2.933 2.741University Mean (624) 3.289 3.147 3.477 3.241 2.878Cohort Mean 3.353 3.213 3.544 3.295 2.988
Rankings mean developed by adding mean score for each benchmark in the dimension and dividing
by the number of benchmarks. Work Environment Dimension excludes Tenure Policies, Tenure
Clarity, and Promotion to Full due to non-ignorable missingness in each of these three benchmarks.
dimensions exceed the mean values for both the University as a whole and those of the Cohort
universities. Meanwhile, the mean values of CVAD White faculty on the Work Environment,
Institutional Leadership, and Shared Governance dimensions are less than the mean values
for both the mean values of the University as a whole and the Cohort universities.
Table 17 shows that CVAD lecturers are quite positive about their jobs as compared to
CVAD faculty of other ranks. CVAD lecturers are the only CVAD rank that have mean values
on all five COACHE dimensions that are higher than UNT faculty and Cohort universities’
faculty. Indeed, all other CVAD assistant professors and CVAD associate professors have
mean values on all five COACHE dimensions that are lower than UNT faculty and Cohort
universities faculty.
To conclude this summary, Table 18 summarizes the major findings of this analysis of
College of Visual Arts and Design COACHE responses. The table list the summaries for the
College overall, the demographic group, the COACHE dimension of interest, the subgroup
38

Table 18: Summary of CVAD Findings from COACHE
Grouping Dimension Group EffectCollege overall Resources and Support All -College overall Shared Governance All -Gender Resources and Support Women -Gender Work Environment Men (related to UNT faculty) +Race/Ethnicity Work Environment URM +Race/Ethnicity Shared Governance URM +Academic Rank Shared Governance Assistant Professors -Academic Rank Institutional Leadership Assistant Professors -Academic Rank Shared Governance Associate Professors -Academic Rank All dimensions Lecturers +
affected, and whether the effect is positive or negative.
University Libraries
Overall, the UNT Libraries fair very well on the five dimensions of the COACHE survey
when compared to other units at UNT and to the 109 Cohort universities included in the
COACHE study. Table 19 shows that Library faculty has higher mean values on all five
COACHE dimensions than does UNT faculty as a whole and higher mean values than the
COACHE Cohort universities. Furthermore, the higher mean values for Library faculty on
Institutional Leadership on Shared Governance are significantly greater than the mean values
for both the UNT generally and for the Cohort universities.13
From a gender standpoint, Library women faculty have higher mean values on the five
COACHE dimensions than do the Library men faculty. While none of the differences in
the means of Library women and men are significant, the mean values of Library women
on the five COACHE dimensions are all greater than the mean values of UNT and of the
Cohort universities. Meanwhile, Library men have lower mean values on the Work and Work
13The pooled standard deviation for Library faculty on Institutional Leadership and Shared Governanceare .895 and .771, respectively. These two standard deviations result in 90% convidence intervals are (3.311,3.819) and (3.104, 3.552), respectively.
39

Table 19: Library COACHE Findings by Demographics
Resources Work Institutional Sharedand Support Work Environment Leadership Governance
Demographic(n) mean mean mean mean mean
GenderWomen(22) 3.655 3.454 3.826 3.663 3.397Men (10) 3.398 3.088 3.421 3.356 3.197
Race/EthnicityFaculty of Color (6) 3.690 3.420 3.677 3.470 3.512White Faculty (27) 3.555 3.302 3.690 3.588 3.281
College Mean(32) 3.586 3.336 3.694 3.558 3.328University Mean (624) 3.289 3.147 3.477 3.241 2.878Cohort Mean 3.353 3.213 3.544 3.295 2.988
Rankings mean developed by adding mean score for each benchmark in the dimension and dividing
by the number of benchmarks. Work Environment Dimension excludes Tenure Policies, Tenure
Clarity, and Promotion to Full due to non-ignorable missingness in each of these three benchmarks.
Environment dimensions as compared to UNT and the Cohort universities.14
As for Race/Ethnicity effects among Library faculty, both Library FOC and Library
White faculty have mean values on the five COACHE dimensions that are substantially
higher than the mean values of UNT and of the Cohort universities. Because of the small
sample size of Library FOC, we combine both Library Asian/Asian-American faculty and
Library URM faculty.
To conclude this summary, Table 20 summarizes the major findings of this analysis of
University Libraries’ COACHE responses. The table list the summaries for the unit overall,
the demographic group, the COACHE dimension of interest, the subgroup affected, and
whether the effect is positive or negative.
College of Journalism
Overall, the College of Journalism falls in the middle of UNT’s units as related to the
five dimensions of the COACHE survey in that three of the five Journalism dimension mean
values meet or exceed the UNT five dimension mean values. Table 21 shows that the average
14These differences are not statistically different.
40

Table 20: Summary of University Libraries Findings from COACHE
Grouping Dimension Group EffectCollege overall Institutional Leadership All +College overall Shared Governance All +Gender All dimensions Women +Race/Ethnicity All dimensions FOC +
Journalism faculty member’s job satisfaction is greater than that of the average University
faculty member on the Work, Work Environment, and Institutional Leadership dimensions.
Furthermore, Journalism faculty has greater mean values on the Work Environment and
Instituional Leadership dimensions than do Cohort faculty. In both cases, none of the
differences reaches statistical significance. Nevertheless, given the small sample of Journalism
faculty, the differences are suggestive of the faculty’s overall job satisfaction.
Gender findings for the College of Journalism are not significant, but there is still useful
information in the data. Firstly, Journalism men faculty have greater mean values on four
of the five COACHE dimensions than do UNT faculty and Cohort universities faculty. The
sole exception is the Shared Governance dimension. The mean value for Journalism men on
Shared Governance is only 2.566, while the UNT and Cohort means are 2.878 and 2.988,
respectively. Meanwhile, Journalism women faculty are above the UNT and Cohort means
on this dimension at 3.066. Additionally, the mean values of Journalism women faculty on
the Work Environment and Institutional Leadership dimensions are greater than the UNT
mean values on these two dimensions.
Table 21 shows that Journalism FOC has less job satisfaction on all five dimensions than
their Journalism White faculty counterparts. Again, because of the small sample, we are
unable to say that these differences are significant. Nonetheless, the pattern that emerges
from the mean data suggest that Journalism FOC does have less job satisfaction than their
Journalism White faculty counterparts. This pattern is reinforced by the fact that mean
41

Table 21: Journalism COACHE Findings by Demographics
Resources Work Institutional Sharedand Support Work Environment Leadership Governance
Demographic(n) mean mean mean mean mean
GenderWomen(6) 3.154 3.119 3.482 3.497 3.066Men (7) 3.440 3.300 3.646 3.375 2.566
Race/EthnicityFaculty of Color (2) 2.627 2.455 2.918 2.838 2.265White Faculty (10) 3.416 3.329 3.679 3.487 2.941
RankNon-Tenure Track (8) 3.365 3.322 3.498 3.528 2.870Tenured (4) 3.101 2.905 3.662 3.138 2.724
College Mean (13) 3.283 3.176 3.553 3.349 2.809University Mean (624) 3.289 3.147 3.477 3.241 2.878Cohort Mean 3.353 3.213 3.544 3.295 2.988
Rankings mean developed by adding mean score for each benchmark in the dimension and dividing
by the number of benchmarks. Work Environment Dimension excludes Tenure Policies, Tenure
Clarity, and Promotion to Full due to non-ignorable missingness in each of these three benchmarks.
values of Journalism FOC on all five COACHE dimensions are less than the mean values of
UNT faculty and Cohort universities Faculty, while the mean values of Journalism White
faculty are greater than the mean values for UNT faculty.
As for faculty rank based on Tenure Status, Table 21 shows that there are no significant
differences between the mean values of the five dimensions for non-tenure track and tenured-
track Journalism faculty. While the mean values of non-tenure track Journalism faculty are
somewhat greater on Resources and Support, Work and Institutional Leadership than are
the mean values for tenured and tenured-track Journalism faculty, these differences are not
significant. What is of interest is that the mean values of non-tenure track Journalism faculty
is also somewhat greater than the mean values of UNT and Cohort faculty on these three
dimensions, while the mean values of tenured and tenure-track Journalism faculty are less
than the mean values of UNT and Cohort faculty.
To conclude this summary, Table 22 summarizes the major findings of this analysis of
College of Journalism COACHE responses. The table list the summaries for the College
42

Table 22: Summary of College of Journalism Findings from COACHE
Grouping Dimension Group EffectCollege overall Institutional Leadership All +College overall Work Environment All +Gender Shared Governance Men -Race/Ethnicity Shared Governance FOC -Race/Ethnicity Work FOC -Tenure Status Work Tenured faculty -Tenure Status Institutional Leadership Non-Tenure Track faculty +
overall, the demographic group, the COACHE dimension of interest, the subgroup affected,
and whether the effect is positive or negative.
The College of Health and Public Service
Overall, the College of Health and Public Service (HPS) fairs quite well on the five
dimensions of the COACHE survey when compared to other units at UNT and to the 109
Cohort universities included in the COACHE study. Table 23 shows that HPS faculty has
higher mean values on four of the five COACHE dimensions than does UNT faculty as a
whole. Furthermore, the mean values on the Resources and Support and Work dimensions
are significantly greater than the mean values for UNT faculty on these two dimensions.15
Additionally, HPS faculty has somewhat greater mean values on three of the five COACHE
dimensions than does the COACHE Cohort universities faculty.
On the gender front, there are few differences between men and women HPS faculty on
the five COACHE dimensions. The one difference that standout among HPS women and
men faculty is on the Work dimension. HPS women faculty has a significantly lower mean
values on the Work dimension than do HPS men faculty.16 The other slight gender difference
is the mean values of HPS men faculty on all five COACHE dimensions are higher than the
15Based on pooled standarded deviations of .842 for Resources and .841 for Work, the 90% confidenceinterval for HPS faulty on these two dimensions are (3.35, 3.724), and (3.237, 3.611), respectively.
16The pooled standard deviation for HPS women faculty on the Work dimension is .820. The 90% confi-dence interval is (3.067, 3.537).
43

Table 23: Health & Public Service COACHE Findings by Demographics
Resources Work Institutional Sharedand Support Work Environment Leadership Governance
Demographic(n) mean mean mean mean mean
GenderWomen(33) 3.501 3.302 3.617 3.116 2.809Men (22) 3.595 3.610 3.725 3.330 3.077
Race/EthnicityURM (13) 3.733 3.618 3.872 3.472 3.350Asian/Asian American (10) 3.440 3.361 3.733 3.379 3.360White (32) 3.490 3.364 3.532 3.076 2.592
RankAssistant (13) 3.638 3.518 3.868 3.338 3.265Associate (19) 3.244 3.188 3.548 3.105 2.837Full (12) 3.958 3.700 3.919 3.371 2.956Lecturer (11) 3.395 3.405 3.263 3.019 2.592
College Mean (55) 3.537 3.424 3.652 3.230 2.924University Mean (624) 3.289 3.147 3.477 3.241 2.878Cohort Mean 3.353 3.213 3.544 3.295 2.988
Rankings mean developed by adding mean score for each benchmark in the dimension and dividing
by the number of benchmarks. Work Environment Dimension excludes Tenure Policies, Tenure
Clarity, and Promotion to Full due to non-ignorable missingness in each of these three benchmarks.
mean values of both UNT faculty and Cohort universities faculty.
Meanwhile, there are very few differences among HPS faculty based on race and ethnicity.
Table 23 shows that the mean values for URM, Asian/Asian-American, and White HPS
faculty on the Resources and Support, Work, and Work Environment dimensions all exceed
the mean values for UNT and Cohort faculty. On the one hand, while the mean value of
HPS White faculty on the Institutional Leadership dimension is lower than the mean values
for HPS URM and Asian/Asian-American faculty, this difference is not significant. On the
other hand, the mean value of HPS White faculty on the Shared Governance dimension is
significantly less than the mean values for HPS URM and Asian/Asian-American faculty.17
Importantly, the mean values on all five COACHE dimensions of both URM and Asian/Asian
17The pooled standard deviations for HPS URM and Asian/Asian-American faculty on the Work dimen-sion are 1.022 and 1.150, respectively. The 90% confidence intervals are (2.884, 3.816) and (2.729, 3.991),respectively.
44

Table 24: Summary of Health & Public Service Findings from COACHE
Grouping Dimension Group EffectCollege overall Resources and Support All +College overall Work All +Gender Work Women -Gender Work Environment Men +Gender Work Men +Race/Ethnicity Shared Governance White faculty -Race/Ethnicity Work Asian/Asian American +Race/Ethnicity Work URM +Academic Rank Shared Governance Lecturers -Academic Rank Work Environment Full Professors +Academic Rank Work Environment Assistant Professors +Academic Rank Work Full Professors +
American HPS faculty exceed the mean values of UNT and Cohort universities faculty.
The Shared Governance dimension also is one dimension on which we find a bit of differ-
ence among HPS faculty based on rank. HPS lecturers and associate professors have mean
values on the Shared Governance dimension that are less than the UNT mean and Cohort
means on this dimesnion. Additionally, the mean value of HPS lecturers on the Shared
Governance dimension is significantly different from the Shared Governance mean value of
HPS assistant professors.18
To conclude this summary, Table 24 summarizes the major findings of this analysis of
College of Health & Public Service COACHE responses. The table list the summaries for the
College overall, the demographic group, the COACHE dimension of interest, the subgroup
affected, and whether the effect is positive or negative.
College of Engineering
Overall, Table 25 shows that the College of Engineering has mean values on the five
COACHE dimensions that are less than the mean values for the Cohort universities. Fur-
18Based on pooled standarded deviations of .977, the 90% confidence interval for HPS lecturers is (2.023,3.166).
45

thermore, the College of Engineering has mean values on four of the five COACHE dimensions
that are less than the mean values for UNT faculty. At the same time, none of the College
of Engineering mean values is significantly different from the mean values of UNT faculty
mean values. Engineering faculty’s mean value on Shared Governance is signifcantly less
than Cohort universities’ mean value on Shared Governance.19 It is also worth noting that
Engineering faculty’s mean value on Institutional Leadership is quite low even though it is
not significantly different from that means of UNT faculty and Cohort faculty.20
On the gender front, there are few significant differences between men and women En-
gineering faculty on the five COACHE dimensions. The one difference that is noteworthy
among Engineering women and men faculty is on the Work dimension. The mean value
for Engineering women on the Work dimesnion is significantly greater than the mean value
of Engineering men.21 Additionally, the mean values of Engineering women on Resources
and Support, Work, and Work Environment dimensions are greater than the mean values for
both UNT faculty and Cohort universities faculty, while the mean values of Engineering men
on Resources and Support, Work, and Work Environment dimensions are less than the mean
values for both UNT faculty and Cohort universities faculty. The other gender difference
of note is that the Shared Governance mean of Engineering men is significantly less than
the Shared Governance mean of Cohort faculty.22 In contrast, while the Shared Governance
mean of Engineering women is less than the Cohort mean, it is not significantly less.
Furthermore, there are very few differences among Engineering faculty based on race and
ethnicity. Table 25 shows that the mean values for URM, Asian/Asian-American, and White
Engineering faculty on four of the five COACHE dimensions are less than the mean values of
UNT and Cohort faculty on these four dimensions. While these differences are not significant,
19The pooled standard deviation for Engineering faculty is .960, and the 90% confidence interval is (2.410,2.930).
20The pooled standard deviation for Engineering faculty is 1.178, and the 90% confidence interval is (2.658,3.296).
21The pooled standard deviation for Engineering women faculty on the Work dimension is 1.111. The 90%confidence interval is (3.329, 3.929).
22The pooled standard deviation for Engineering women faculty on the Work dimension is .957. The 90%confidence interval is (2.354, 2.920).
46

Table 25: College of Engineering COACHE Findings by Demographics
Resources Work Institutional Sharedand Support Work Environment Leadership Governance
Demographic(n) mean mean mean mean mean
GenderWomen(7) 3.463 3.629 3.577 3.112 2.883Men (32) 3.216 3.063 3.327 2.950 2.637
Race/EthnicityURM (7) 3.332 3.178 3.438 3.144 2.825Asian/Asian American (13) 3.262 3.242 3.407 2.838 2.608White (19) 3.288 3.101 3.327 3.002 2.637
RankAssistant (7) 3.623 3.443 3.771 3.794 3.288Associate (8) 2.781 3.095 3.060 2.455 2.274Full (17) 3.262 2.994 3.345 2.753 2.506Lecturer (7) 3.516 3.216 3.367 3.220 2.836
College Mean (39) 3.259 3.161 3.369 2.977 2.670University Mean (624) 3.289 3.147 3.477 3.241 2.878Cohort Mean 3.353 3.213 3.544 3.295 2.988
Rankings mean developed by adding mean score for each benchmark in the dimension and dividing
by the number of benchmarks. Work Environment Dimension excludes Tenure Policies, Tenure
Clarity, and Promotion to Full due to non-ignorable missingness in each of these three benchmarks.
47

Table 26: Summary of College of Engineering Findings from COACHE
Grouping Dimension Group EffectCollege overall Shared Governance All -College overall Institutional Leadership All -Gender Work Women +Gender Work Men -Gender Shared Governance Men -Gender Work Environment Women +Race/Ethnicity Shared Governance White faculty -Race/Ethnicity Institutional Leadership Asian/Asian American -Academic Rank Shared Governance Full Professors -Academic Rank Institutional Leadership Full Professors -Academic Rank All dimensions Assistant Professors +Academic Rank Institutional Leadership Associate Professors -Academic Rank Shared Governance Associate Professors -
they reflect a pattern among Engineering faculty to have a lower level of job satisfaction. Also
of note, while not significantly different from URM and Asian/Asian-American Engineering
faculty, the mean value of Engineering White faculty on the Shared Governance dimension
is significantly less than the mean values Cohort faculty on this dimension.23
As for accademic rank, Engineering assistant professors have mean values on the five
COACHE dimensions that are greater than those of Engineering associate professors, full
professors, and lecturers. Moreover, the five mean values for Engineering assistant professors
are also greater than the mean values for UNT and Cohort faculty. For other Engineering
ranks, only the mean value for Engineering lecturers on the Resources and Support dimension
exceeds the mean values of UNT and Cohort faculty on the five COACHE dimensions.
For Engineering full professors, the mean values on Institutional Leadership and Shared
Governance for full professors are significantly less than the Cohort means on these two
dimensions.24 While the low mean values of Engineering associate professors on these two
23The pooled standard deviation for Engineering White faculty is .906, and the 90% confidence interval is(2.295, 2.979).
24The pooled standard deviations for Engineering full professors are 1,242 and .963, and the 90% confidenceintervals are (2.242, 3.264) and (2.110, 2.902).
48

dimensions are not significantly different from UNT and Cohort faculties, the low mean
values are noteworthy.
To conclude this summary, Table 26 summarizes the major findings of this analysis of
College of Engineering COACHE responses. The table list the summaries for the College
overall, the demographic group, the COACHE dimension of interest, the subgroup affected,
and whether the effect is positive or negative.
College of Information
Overall, the College of Information falls among the middle of UNT units as it relates to
the five COACHE dimensions. Table 27 shows that none of the College’s five mean values
on the five COACHE dimensions is significantly different from the mean values of UNT
faculty and Cohort universities faculty. In fact, the mean values for Information on the
Work Environment and Shared Governance dimensions are slightly greater than the mean
values of UNT faculty generally.
For the College of Information, there are significant gendered differences on all five
COACHE dimensions. Table 27 shows that the mean values of Information women faculty
are significantly greater than the mean values of Information men faculty.25 Furthermore,
four of the five mean values of Information women faculty exceed the mean values of UNT
faculty and Cohort faculty on the five COACHE dimensions. In contrast, all five mean values
of Information men faculty are less than the mean values of UNT faculty and Cohort faculty
on the five COACHE dimensions.
Meanwhile, there are no substantial differences in the job satisfaction of College of In-
formation faculty based on race and ethnicity. While there are some differences across the
mean values of the race/ethnicity groups of Table 27, none of these differences are significant.
Moreover, none of the mean values are significantly different from the mean values of UNT
25The pooled standard deviations for the Resourses, Work, Work Environment, Instituional Leadership,and Shared Governance dimensions for Information women faculty are .736, .782, .773, .825, and .903,respectively. The confidience intervals for these five dimensions are (3.039,3.595), (2.933,3.509), (3.344,3.944),(3.022, 3.680), and (2.911, 3.653), respectively.
49

Table 27: College of Information COACHE Findings by Demographics
Resources Work Institutional Sharedand Support Work Environment Leadership Governance
Demographic(n) mean mean mean mean mean
GenderWomen(20) 3.317 3.221 3.644 3.351 3.282Men (10) 2.996 2.810 3.232 2.693 2.245
Race/EthnicityURM (7) 3.330 3.146 3.358 3.223 2.869Asian/Asian American (4) 2.872 3.230 3.464 3.264 3.858White (19) 3.228 3.038 3.538 3.021 2.778
RankAssistant (5) 3.420 3.251 3.672 3.429 3.445Associate (7) 2.928 3.129 3.216 2.933 2.973Full (12) 3.168 2.987 3.355 3.100 2.636Lecturer (6) 3.432 3.048 3.566 3.033 3.030
College Mean (30) 3.204 3.079 3.496 3.099 2.895University Mean 3.289 3.147 3.477 3.241 2.878Cohort Mean 3.353 3.213 3.544 3.295 2.988
Rankings mean developed by adding mean score for each benchmark in the dimension and dividing
by the number of benchmarks. Work Environment Dimension excludes Tenure Policies, Tenure
Clarity, and Promotion to Full due to non-ignorable missingness in each of these three benchmarks.
50

Table 28: Summary of College of Information Findings from COACHE
Grouping Dimension Group EffectGender Work Men -Gender Work Environment Men -Gender Shared Governance Men -Gender Institutional Leadership Men -Gender Resources and Support Men -Gender Shared Governance Women +Race/Ethnicity Shared Governance Asian/Asian American +Academic Rank Shared Governance Full Professors -Academic Rank All dimensions Assistant Professors +Academic Rank Institutional Leadership Associate Professors -
faculty and Cohort universities faculty. One mean of note is the Asian/Asian-American mean
on Shared Governance (3.858). While this mean seems disproportionally high in comparison
to Information URM and White faculty, the small sample of Asian/Asian American faculty
produces a large standard deviation quite large and a wide confidence interval.
Additionally, there are patterns of difference in the job satisfaction of College of Informa-
tion faculty based on rank. By patterns of difference, we contend there are non-significant
differences that are suggestive of systematic difference between Information faculty of dif-
ferent academic ranks. For example, Table 27 shows that all five dimensional means of In-
formation assistant professors exceed the mean vaules of Information faculty of other ranks,
UNT faculty and Cohort faculty. In contrast, all five dimensional means of Information full
professors are less than the mean vaules of Information faculty of other ranks, UNT faculty
and Cohort faculty.
To conclude this summary, Table 28 summarizes the major findings of this analysis of
College of Information COACHE responses. The table list the summaries for the College
overall, the demographic group, the COACHE dimension of interest, the subgroup affected,
and whether the effect is positive or negative.
51

College of Education
Overall, the College of Education falls among the middle of UNT units on three of the
five dimensions of the COACHE survey. Moreover, Table 29 shows that the mean values for
Education faculty on Resources and Support, Instituional Leadership and Shared Governance
are roughly the same (not significantly different from) the mean values of UNT faculty as a
whole and for Cohort universities faculty. Alternatively, Education faculty mean values on
the Work and Work Environment dimensions are significantly less than the mean values for
Cohort faculty on these two dimensions.26 These findings suggest that Education faculty has
concerns about these two dimensions as they relate to the faculty’s overall job satisfaction.
From a gender standpoint, Table 29 shows that there is little difference between the
job satisfaction of Education men and women faculty. While the mean values of Educa-
tion women faculty are greater than the mean values of Education men faculty on all five
COACHE dimensions, none of these differences reaches statistical significance. Nonetheless,
we do find a distinctive pattern among the mean values of Education men in that all five of
their mean values are less than the mean values of UNT and Cohort faculties. In contrast,
three of the five mean values of Education women faculty are greater than the mean values
of UNT faculty as a whole. Again, these differences are not significant but are suggestive of a
pattern in which Education women and men differ slightly in their respective job satisfaction.
Meanwhile College of Education findings concerning job satisfaction based on race and
ethncity confirm the College’s overall lower satisfaction on the Work dimension. While not
statistically significant for any grouping of faculty, Table 29 shows that the mean values
for Education URM, Asian/Asian-American, and White faculty members on the Work di-
mension are less than the mean values for UNT and Cohort faculties. At the same time,
the mean values of Education URM faculty on the other four COACHE dimensions are
greater than the mean values for UNT faculty generally. Alternatively, the mean values of
26The pooled standard deviations for Education faculty on Work and Work Environment are .882 and1.000, respectively. These two standard deviations yield 90% confident intervals of (2.827,3.117) and (3.12,3.524), respectively.
52

Table 29: College of Education COACHE Findings by Demographics
Resources Work Institutional Sharedand Support Work Environment Leadership Governance
Demographic(n) mean mean mean mean mean
GenderWomen(45) 3.316 3.059 3.429 3.273 2.929Men (26) 3.174 2.978 3.262 3.123 2.863
Race/EthnicityURM (14) 3.374 2.987 3.516 3.331 3.087Asian/Asian American (9) 2.983 2.740 3.078 2.950 2.384White (45) 3.236 3.059 3.306 3.195 2.912
RankAssistant (18) 3.202 3.024 3.424 3.475 2.995Associate (20) 2.939 2.654 3.071 3.016 2.552Full (13) 3.268 3.168 3.486 2.959 2.916Lecturer (17) 3.632 3.336 3.352 3.353 3.140
College Mean (71) 3.223 3.002 3.322 3.193 2.880University Mean (624) 3.289 3.147 3.477 3.241 2.878Cohort Mean 3.353 3.213 3.544 3.295 2.988
Rankings mean developed by adding mean score for each benchmark in the dimension and dividing
by the number of benchmarks. Work Environment Dimension excludes Tenure Policies, Tenure
Clarity, and Promotion to Full due to non-ignorable missingness in each of these three benchmarks.
53

Education Asian/Asian-American faculty on the other four COACHE dimensions are less
than the mean values for UNT and Cohort faculties. Moreover, the Education Asian/Asian-
American faculty have significantly less satisfaction on the Shared Governance dimension
than do Education URM faculty.27
The Shared Governance dimension is also an area of concern for the College of Educa-
tion when faculty satisfaction is assessed based on academic rank. Associate professors in
the College of Education have a significanly lower mean value on the Shared Governance
dimension than do Cohort faculty.28 Additionaly, the mean value on the Shared Governance
dimension for Education lecturers is significantly greater than the mean value for Education
associate professors.29
Education associate professors are also less satisfied with their jobs as they relate to the
Work dimension. The mean value of Education associate professors is significantly less than
that of Education professors of other academic ranks.30 Additionally, the Work mean of
Education associate professors is also significantly different from UNT faculty generally and
from Cohort faculty. Meanwhile, while not statistically significant, Education lecturers have
mean values on four of the five COACHE dimensions that are greater than the mean values
of UNT faculty generally and Cohort faculty. These findings suggest that lecturers in the
College of Education are somewhat more satisfied than associate professors in the College.
To conclude this summary, Table 30 summarizes the major findings of this analysis of
College of Education COACHE responses. The table list the summaries for the College
overall, the demographic group, the COACHE dimension of interest, the subgroup affected,
and whether the effect is positive or negative.
27The pooled standard deviation for Asian/Asian-American faculty is 1.120, and the 90% confidenceinterval is (1.733, 3.035).
28The pooled standard deviation for Education associate professors is 1.021, and the 90% confidenceinterval is (2.159, 2.946).
29The pooled standard deviation for Education lecturers is .821, and the 90% confidence interval is (2.75,3.43).
30The pooled standard deviation for Education associate professors is .812, and the 90% confidence intervalis (2.355, 2.953).
54

Table 30: Summary of College of Education Findings from COACHE
Grouping Dimension Group EffectCollege overall Work All -College overall Work Environment All -Gender Work Men -Gender Work Environment Men -Race/Ethnicity Work Asian/Asian American -Race/Ethnicity Shared Governance Asian/Asian American -Race/Ethnicity Shared Governance URM +Academic Rank Institutional Leadership Assistant Professors +Academic Rank Shared Governance Lecturers +Academic Rank Shared Governance Associate Professors -Academic Rank Work Associate Professors -
Some Examples of Discipline Comparisions
In this section of the summary, we examine UNT faculty job satisfaction at the discipline
level. We highlight findings from the Humanities, Visual and Performing Arts, and the
Social Sciences. Figure 9 plots Humanities faculty mean responses to the COACHE job
satisfaction survey by Gender, Race/Ethnicity, and Rank. The Gender Plot of Figure 9
shows that women in the Humanities differ most prominantly from men on job satisfaction
in the area of Work (Research and Teaching).
Meanwhile, the Race/Ethnic plot of Figure 9 shows that URM faculty members differ
positively from White faculty members in the area of Work (Research and Service). By
”positively,” we mean URM faculty members are more satisfied with their job in the areas of
Research and Service. Alternatively, the plot also shows that Asian/Asian-American faculty
members are less satisfied with Research than both URM and White faculty.
Humanities findings concerning Rank indicate two important findings. First, lecturers
in the Humanities are less satisfied with Teaching than are Humanities faculty of other
ranks. Humanities lecturers are also more satisfied with Shared Governance than are full
professors. The second finding concerns associate professors. In prior analyses, we have found
55

Area of Concern
CO
AC
HE
me
an
App Coll DivLead Facil Trust Res Teac Prom
2.5
3.0
3.5
4.0 Women: highest n=47
Men: highest n=33
Humanities COACHE Findings by Gender
Vertical line indicates 90% confidence interval
Area of Concern
CO
AC
HE
me
an
Apprec Adapt Prod Purp Trust Intdis Res Serv SLead
1.5
2.0
2.5
3.0
3.5
4.0
White: highest n=61URM: highest n=13Asian: highest n=6
Humanities COACHE Findings by Race/Ethnic Group
Vertical line indicates 90% confidence interval
Area of Concern
CO
AC
HE
me
an
App Coll Engag Adapt Prod Purp Trust Unders Serv Teac Pers
1.5
2.0
2.5
3.0
3.5
4.0
4.5
Full: highest n=18Associate: highest n=21Assistant: highest n=8Lecturer: highest n=33
Humanities COACHE Findings for CLASS by Rank
Vertical line indicates 90% confidence interval
Figure 9: Humanities COACHE Findings
that assistant professors are generally more satisfied than faculty of other ranks. Humanities
assistant professors are less likely to be satisfied with Shared Governance than are lecturers
in the areas of Productivity, Shared Purpose, and Trust.
Figure 10 plots Visual and Performing Arts faculty mean responses to the COACHE job
satisfaction survey by Gender, Race/Ethnicity, and Rank. The figure shows that differences
in Visual and Performing Arts faculty job satisfaction appear to exist mostly between men
and women faculty. The Gender plot of Figure 10 reveals gender differences on the Work
Environment (Collegiality, Engagement, and Promotion) and Resource and Support (Facili-
ties and Health) dimensions.Women faculty members in Visual and Performing Arts are less
likely to be satisfied with Work Environment and Resources and Support than are their men
counterparts. Meanwhile, women faculty in Visual and Performing Arts have roughly the
same level of job satisfaction as men on the Work dimension.
56
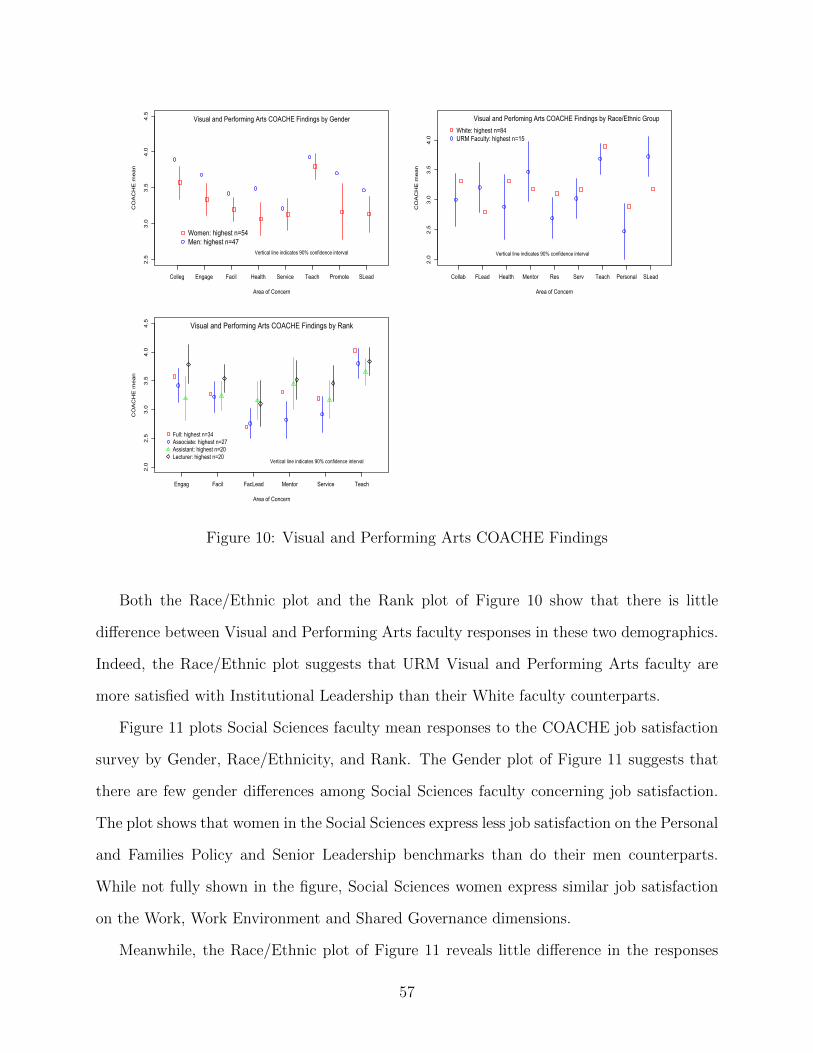
Area of Concern
CO
AC
HE
me
an
Colleg Engage Facil Health Service Teach Promote SLead
2.5
3.0
3.5
4.0
4.5
Women: highest n=54Men: highest n=47
Visual and Performing Arts COACHE Findings by Gender
Vertical line indicates 90% confidence interval
Area of Concern
CO
AC
HE
me
an
Collab FLead Health Mentor Res Serv Teach Personal SLead
2.0
2.5
3.0
3.5
4.0
White: highest n=84URM Faculty: highest n=15
Visual and Perfoming Arts COACHE Findings by Race/Ethnic Group
Vertical line indicates 90% confidence interval
Area of Concern
CO
AC
HE
me
an
Engag Facil FacLead Mentor Service Teach
2.0
2.5
3.0
3.5
4.0
4.5
Full: highest n=34Associate: highest n=27Assistant: highest n=20Lecturer: highest n=20
Visual and Performing Arts COACHE Findings by Rank
Vertical line indicates 90% confidence interval
Figure 10: Visual and Performing Arts COACHE Findings
Both the Race/Ethnic plot and the Rank plot of Figure 10 show that there is little
difference between Visual and Performing Arts faculty responses in these two demographics.
Indeed, the Race/Ethnic plot suggests that URM Visual and Performing Arts faculty are
more satisfied with Institutional Leadership than their White faculty counterparts.
Figure 11 plots Social Sciences faculty mean responses to the COACHE job satisfaction
survey by Gender, Race/Ethnicity, and Rank. The Gender plot of Figure 11 suggests that
there are few gender differences among Social Sciences faculty concerning job satisfaction.
The plot shows that women in the Social Sciences express less job satisfaction on the Personal
and Families Policy and Senior Leadership benchmarks than do their men counterparts.
While not fully shown in the figure, Social Sciences women express similar job satisfaction
on the Work, Work Environment and Shared Governance dimensions.
Meanwhile, the Race/Ethnic plot of Figure 11 reveals little difference in the responses
57

Area of Concern
CO
AC
HE
me
an
Mentor Research Personal SeniorLead
2.5
3.0
3.5
4.0
Women: highest n=34Men: highest n=58
Social Sciences COACHE Findings by Gender
Vertical line indicates 90% confidence interval
Area of Concern
CO
AC
HE
me
an
Purpose Trust Intdiscip Mentor Personal Promotion Health
1.5
2.0
2.5
3.0
3.5
4.0
White: highest n=61URM: highest n=18Asian: highest n=12
Social Sciences COACHE Findings by Race/Ethnic Group
Vertical line indicates 90% confidence interval
Area of Concern
CO
AC
HE
me
an
App Coll Engag Adapt Prod Purp Trust Unders Serv Teac Pers
1.5
2.0
2.5
3.0
3.5
4.0
4.5
Full: highest n=33Associate: highest n=36Assistant: highest n=12Lecturer: highest n=12
Social Sciences COACHE Findings by Rank
Vertical line indicates 90% confidence interval
Figure 11: Social Sciences COACHE Findings
of URM Social Sciences faculty, Social Sciences Asian/Asian-American faculty and White
Social Sciences faculty. Additionally, the Rank plot of Figure 11 shows that Social Sciences
lecturers express grater satisfaction on the WORK (Service and Teaching) dimension than
do Social Sciences full professors.
Gender and STEM in the COACHE Findings
Science, Technology, Engineering and Mathematics (STEM) is a major concern of re-
search institutions, and the underrepresentation of women in STEM fields is a major concern
of the academy, generally. Figure 12 plots mean responses of UNT faculty to the COACHE
job satisfaction survey by Gender in four STEM areas: 1) Biological Sciences, 2) Engineer-
ing, 3) Physical Sciences, and 4) Social Sciences. There are clear differences across these four
areas of STEM. In Biological Sciences, women faculty are less likely to express satisfaction
58

Area of Concern
CO
AC
HE
me
an
Colleg DepLead Facil Intdiscip Res Service Teach Promote
1.0
1.5
2.0
2.5
3.0
3.5
4.0
4.5
Women: highest n=6Men: highest n=13
Biological Sciences COACHE Findings by Gender
Vertical line indicates 90% confidence interval
Area of Concern
CO
AC
HE
me
an
Colleg DvLd FLead Adapt Prod Purp Trust Und IntDisc Res SLead
2.0
2.5
3.0
3.5
4.0
4.5
Women: highest n=19Men: highest n=42
Engineer/CompSci/Math/Stats COACHE Findings by Gender
Vertical line indicates 90% confidence interval
Area of Concern
CO
AC
HE
me
an
Apprec Facil Purpose Trust Intdiscip Personal SeniorLead
0.5
1.0
1.5
2.0
2.5
3.0
3.5
4.0
Women: highest n=6Men: highest n=11
Physical Sciences COACHE Findings by Gender
Vertical line indicates 90% confidence interval
Area of Concern
CO
AC
HE
me
an
Mentor Research Personal SeniorLead
2.5
3.0
3.5
4.0
Women: highest n=34Men: highest n=58
Social Sciences COACHE Findings by Gender
Vertical line indicates 90% confidence interval
Figure 12: STEM COACHE Findings
in all four benchmarks of the Work dimension (Interdisciplanry Work, Research, Service and
Teaching) than are men faculty. In Engineering, women faculty generally express greater
job satisfaction than do men. Women in Engineering express this greater satisfaction most
prominently on the Institutional Leadership (Division Leadership, Department Leadership,
and Senior Leadership) and Shared Governance (Adaptability, Productivity, Purpose, Trust
and Understanding). In the Physical Sciences, women faculty are less likely to express sat-
isfaction on the Resources and Support (Appreciation, Facilities, and Personal) dimension.
Finally, and as discussed in the prior section, there are few gender differences among Social
Sciences faculty concerning job satisfaction.
59

Table 31: Findings from COACHE Divisional Analysis
Unit Dimension Group EffectUniversity Resources and Support Women -University Work Women -University Shared Governance Asian/Asian Amer +University Shared Governance Full Professors -University All Areas Associate Professors -University Work Lecturers -
Summary and Conclusions
This study is an analysis of the rich survey data that is available from the COACHE
Survey of Faculty Satisfaction. There is still much to be learned from placing these survey
findings into context with other surveys that have been conducted with UNT faculty. The
findings from the COACHE survey can be further contextualized through comparison with
findings from the 2018 Gallup Survey, 2017-18 Faculty Separation Survey, 2018 Climate and
2017 Lecturers’ Survey that have been conducted recently at UNT.
We also point out that the restriction on using data from departments and units with
small number of faculty in certain demographics is important. It is possible, and likely,
that faculty members in departments in which they are one of a small group of faculty may
tend to “satisfice,” (that is to give a more favorable response than one would normally give)
because they are somewhat isolated. Focus groups are being used to overcome this potential
problem. To conclude this summary, Table 6 summarizes our major findings. The table lists
the unit(division or discipline), the COACHE dimension of interest, the group affected, and
whether the effect is positive or negative. This brief tabular summary is followed by a list of
recommendations that are derived from our analysis of the COACHE and focus group data.
60

Recommendations
Several recommendations have emerged from the COACHE Steering Committee’s data
analysis process. We present these recommendations in relation to the five COACHE di-
mensions.
Resources and Support
• In response to Appreciation and Recognition Concern
– Continue to have a Salute to Faculty Excellence Award event each year to increase
public recognition of outstanding faculty.
– Ensure that diversity, equity and inclusion are values that are incorporated in
faculty appreciation and recognition.
• In response to Personel and Family Policy
– Establish a Parental and Family Leave Workload Modification process.
– Initiate Workload Modification guidelines that accommodate parental and family
issues. Begin with workload modification related to paternal issues and develop
guidelines for other major family issues after this is implemented.
– Offer more programs that address the physical and mental health of faculty.
– Improve and centralize website that highlights Work/life balance activities.
• In response to Facilities and Resources
– Develop programs that engage faculty at Discovery Park.
– Establish regular OFS office hours at Discovery Park.
– Implement additional Faculty Professional Development Programs.
– Continue funding of National Council of Faculty Development and Diversity
(NCFDD) membership.
61
– Establish an affinity group for lecturers that is supported by Office of Faculty
Success.
– There is clear need for professional development opportunities for lecturers. Lec-
turers face restrictions on the availability of professional development and travel
funds by design.
Work
• Teaching
– Establish greater workload transparency and equity for lecturers, including clari-
fication of lecturers’ roles in upper division and graduate-level courses.
– Report all workload distribution in FIS system.
– Establish task force to examine gender and racial/ethnic biases in student evalu-
ations in the annual review and tenure and promotion evaluations.
• Service
– Find ways to acknowledge the invisible work that women and under-represented
minorities do, especially hard to quantify informal or unofficial advising of stu-
dents.
– Evaluate lecturers’ service in comparison to workload.
• Interdisciplinary Work
– Offer more grant writing workshops to empower and support interdisciplinary
research.
Work Environment
• Collegiality
62
– Similar to Title IX and Security training, require (annual or every two year)
diversity training for all faculty designed to improve departmental environment
concerning diversity and inclusion.
• Department Quality
– Require mandatory search committee training for all university search commit-
tees.
– Require that every search committee has a diversity advocate or officer.
• Promotion to Full
– Establish a mentoring process for associate professors
– Establish programs to facilitate the promotion of women to full professor.
• Lecturer Promotion
– Reconcile departmental and college-level lecturer promotion process with Univer-
sity lecturer promotion process.
Institutional Leadership
• Departmental Leadership
– Establish a leadership academy for faculty who aspire to leadership opportunities
that are not at the chair’s level.
– Create mechanisms that produce greater transparency and accountability from
department chairs.
– Provide additional training and support for department chairs.
63

References
[1] Price, Eboni G., A. Gozu, D. E. Kern, N. R. Powe, G. S. Wand, S. Golden, and L.
A. Cooper. 2005. “The Role of Cultural Diversity Climate in Recruitment, Promotion,
and Retention of Faculty in Academic Medicine.” Journal of General Internal Medicine
20(3): 565–71.
[2] Mamiseishvili, Ketevan, Michael T. Miller and Donghan Lee. 2016. “Beyond Teaching and
Research: Faculty Perceptions of Service Roles at Research Universities.” Innovations in
Higher Education 41(4): 273-285.
[3] Wubneh, Mubneh. 2011. “Commentary: Diversity and Minority Faculty Perception of
Institutional Climate of Planning Schools—Results from the Climate Survey.” Journal
of Planning Education and Research 31(3): 340-350.
[4] Watanabe, Megumi, Kristen Olson and Christina Falci. 2017. “Social isolation, survey
nonresponse, and nonresponse bias: An empirical evaluation using social network data
within an organization.” Social Science Research 63(2): 324-338.
64