divya
TRANSCRIPT
Management has been described as a social process involving responsibility for economical and effective planning & regulation of operation of an enterprise in the fulfillment of given purposes. It is a dynamic process consisting of various elements and activities. These activities are different from operative functions like marketing, finance, purchase etc. Rather these activities are common to each and every manger irrespective of his level or status.
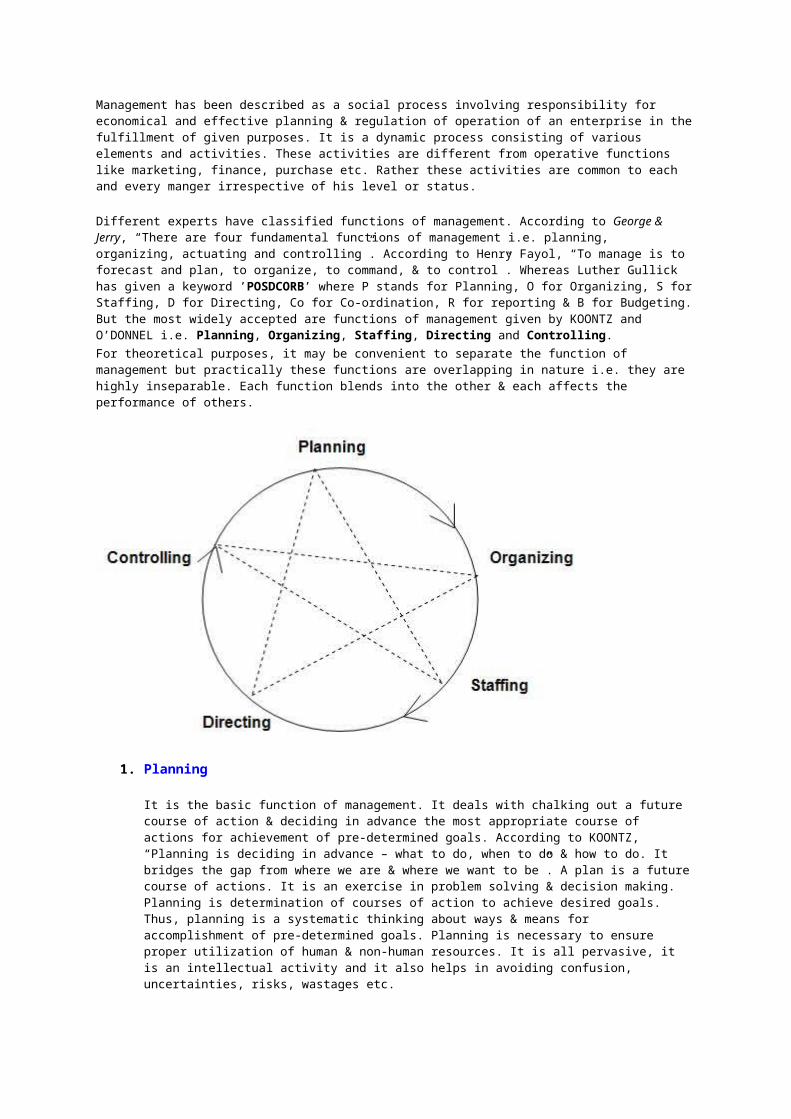
Different experts have classified functions of management. According to George & Jerry, “There are four fundamental functions of management i.e. planning, organizing, actuating and controlling”. According to Henry Fayol, “To manage is to forecast and plan, to organize, to command, & to control”. Whereas Luther Gullick has given a keyword ’POSDCORB’ where P stands for Planning, O for Organizing, S for Staffing, D for Directing, Co for Co-ordination, R for reporting & B for Budgeting. But the most widely accepted are functions of management given by KOONTZ and O’DONNEL i.e. Planning, Organizing, Staffing, Directing and Controlling.For theoretical purposes, it may be convenient to separate the function of management but practically these functions are overlapping in nature i.e. they are highly inseparable. Each function blends into the other & each affects the performance of others.
1. Planning
It is the basic function of management. It deals with chalking out a future course of action & deciding in advance the most appropriate course of actions for achievement of pre-determined goals. According to KOONTZ, “Planning is deciding in advance – what to do, when to do & how to do. It bridges the gap from where we are & where we want to be”. A plan is a future course of actions. It is an exercise in problem solving & decision making. Planning is determination of courses of action to achieve desired goals. Thus, planning is a systematic thinking about ways & means for accomplishment of pre-determined goals. Planning is necessary to ensure proper utilization of human & non-human resources. It is all pervasive, it is an intellectual activity and it also helps in avoiding confusion, uncertainties, risks, wastages etc.
2. Organizing
It is the process of bringing together physical, financial and human resources and developing productive relationship amongst them for achievement of organizational goals. According to Henry Fayol, “To organize a business is to provide it with everything useful or its functioning i.e. raw material, tools, capital and personnel’s”. To organize a business involves determining & providing human and non-human resources to the organizational structure. Organizing as a process involves:
Identification of activities. Classification of grouping of activities. Assignment of duties. Delegation of authority and creation of responsibility.
Coordinating authority and responsibility relationships. 3. Staffing
It is the function of manning the organization structure and keeping it manned. Staffing has assumed greater importance in the recent years due to advancement of technology, increase in size of business, complexity of human behavior etc. The main purpose o staffing is to put right man on right job i.e. square pegs in square holes and round pegs in round holes. According to Kootz & O’Donell, “Managerial function of staffing involves manning the organization structure through proper and effective selection, appraisal & development of personnel to fill the roles designed un the structure”. Staffing involves:
Manpower Planning (estimating man power in terms of searching, choose the person and giving the right place).
Recruitment, selection & placement. Training & development. Remuneration. Performance appraisal. Promotions & transfer.
4. Directing
It is that part of managerial function which actuates the organizational methods to work efficiently for achievement of organizational purposes. It is considered life-spark of the enterprise which sets it in motion the action of people because planning, organizing and staffing are the mere preparations for doing the work. Direction is that inert-personnel aspect of management which deals directly with influencing, guiding, supervising, motivating sub-ordinate for the achievement of organizational goals. Direction has following elements:
Supervision Motivation Leadership Communication
Supervision- implies overseeing the work of subordinates by their superiors. It is the act of watching & directing work & workers.
Motivation- means inspiring, stimulating or encouraging the sub-ordinates with zeal to work. Positive, negative, monetary, non-monetary incentives may be used for this purpose.
Leadership- may be defined as a process by which manager guides and influences the work of subordinates in desired direction.
Communications- is the process of passing information, experience, opinion etc from one person to another. It is a bridge of understanding.
5. Controlling
It implies measurement of accomplishment against the standards and correction of deviation if any to ensure achievement of organizational goals. The purpose of controlling is to ensure that everything occurs in conformities with the standards. An efficient system of control helps to predict deviations before they actually occur. According to Theo Haimann, “Controlling is the process of checking whether or not proper progress is being made towards the objectives and goals and acting if necessary, to correct any deviation”. According to Koontz & O’Donell “Controlling is the measurement & correction of performance activities of subordinates in order to make sure that the enterprise objectives and plans desired to obtain them as being accomplished”. Therefore controlling has following steps:
a. Establishment of standard performance. b. Measurement of actual performance. c. Comparison of actual performance with the standards and finding out deviation if any. d. Corrective action.
Henri Fayol, the father of the school of Systematic Management, was motivated to create a theoretical foundation for a managerial educational program based on his experience as a successful managing director of a mining company. In his day, managers had no formal training and he observed that the increasing complexity of organisations would require more professional management.
Fayol's legacy is his generic Principles of Management. Of Fayol's six generic activities for industrial undertakings (technical, commercial, financial, security, accounting, managerial), the most important were The Five Functions of Management that focused on the key relationships between personnel and its management.
The Five Functions are:
1. PLANNING
drawing up plans of actions that combine unity, continuity, flexibility and precision given the organisation's resources, type and significance of work and future trends. Creating a plan of action is the most difficult of the five tasks and requires the active participation of the entire organisation. Planning must be coordinated on different levels and with different time horizons;
2. ORGANISING
providing capital, personnel and raw materials for the day-to-day running of the business, and building a structure to match the work. Organisational structure depends entirely on the number of employees. An increase in the number of functions expands the organisation horizontally and promotes additional layers of supervision;
3. COMMANDING
optimising return from all employees in the interest of the entire enterprise. Successful managers have personal integrity, communicate clearly and base their judgments on regular audits. Their thorough knowledge of personnel creates unity, energy, initiative and loyalty and eliminates incompetence;
4. COORDINATING
unifying and harmonizing activities and efforts to maintain the balance between the activities of the organisation as in sales to production and procurement to production. Fayol recommended weekly conferences for department heads to solve problems of common interest;
5. CONTROLLING
identifying weaknesses and errors by controlling feedback, and conforming activities with plans, policies and instructions. Fayol's management process went further than Taylor's basic hierarchical model by allowing command functions to operate efficiently and effectively through co-ordination and control methods. For Fayol, the managing director overlooked a living organism that requires liaison officers and joint committees.
The American Luther Gulick and Brit Lydnall Urwick expanded Fayol's list to seven executive management activities summarised by the acronym POSDCORB:
planning: determine objectives in advance and the methods to achieve them; organising: establish a structure of authority for all work; staffing: recruit, hire and train workers; maintain favourable working conditions; directing: make decisions, issue orders and directives; coordinating: interrelate all sectors of the organisation; reporting: inform hierarchy through reports, records and inspections; budgeting: depend on fiscal planning, accounting and control.
assets:
five tasks of management
ProvenModels editor PM version 0.2 62 KB
pros:Fayol provided a language to communicate management theory and establish a foundation for management training.
Managers should perceive organisations as living organisms that require constant attention rather than as mechanical machines.
cons:The principles describe a vision rather than reality and are based on Fayol's own experience rather than empirical research. Later studies by Mintzberg and Kotter found that successful managers spend little time carrying out Fayol's activities and rely more on cultivating networks and personal contacts.
references:General and industrial management (Administration, industrielle et generale)
Henri Fayol 1949 Pitman
United Kingdom ISBN 0879421789
Management theory
John Sheldrake 1996 Thomson United Kingdom ISBN 1861521995
Notes on the Theory of Organization
Luther Halsey Gulick 1937 Institute of Public
Definition, Meaning and characteristics of Management.
Management is a continuous, lively and fast developing science. Management is needed to convert the disorganized resources of men, machines, materials and methods into a useful and effective enterprise. management is a pipeline, the inputs are fed at the end and they are proceeded through management functions and ultimately we get the end results or inputs in the form of goods, services, productivity, information and satisfaction. Management is a comprehensive word which is used in different sciences in the modern business and industrial world. In the narrow sense, it signifies the technique of taking work from others. In this way a person who can take work from others is called manager. In the wide sense, the management is an art, as well as science, which is concerned with the different human efforts so as achieve the desired objective.
Management has been defined by different authors in a number of ways. Some call it a process of managing. Some call it a coordination of resources, some call it body of personnel challenged in the task of managing while others call it as an organized distinct discipline. The following are some of the main definitions of management:
1. Management as process:
Kimball, koontz and O'Donnell, Newmann and Summer, Stanley Vance, Theo Haimann, F.C. Hooper and E.F.T Breach they all call it a process. It is evident from the following definitions also:
According the Kimball-management may be broadly defined as the art of applying the economic principles that underlie the control of men and materials in the enterprise under consideration.
According to Koontz, "Management is the art of getting things done through and with people in formally organized groups."
According to Theo haimann, "Management is the function of getting things done through people and directing the efforts of individuals towards a common objective."
According to Sisks, "Management is the process of working of with and other to effectively achieve organizational objectives by efficiently using limited resources in changing environment."
2. Management as an Activity:
According to this approach management consists of those activities, which are performed by managers in attaining the predetermined objectives of the business. This approach may be referred to Henry Fayol, who classified management activities into the following categories:
Technical - referred to production department. Commercial - relates to buying, selling and exchange. Financial concerned with maximum utilization of capital. Security concurred with protection of property and person. According concerned with maintenance of accounts, presentation and statistics and
Management concerned to planning, organizing, commanding, coordinating and controlling.
3. Management as a group of personnel:
According to this approach human factor plays an important role in accomplishing business objectives. management is concerned with those who have been managing the affairs of the business. Managers are assigned duties and are also granted requisite authority to perform their duties efficiently and thus, management is effective direction, coordination and control of individual and group efforts to accomplish business objective.
This approach is advocated by management authorities like Taylor, Wilson and others. They have defined management as following. As per F.W. Taylor's approach, "Management is the art of knowing exactly what you want your men to do and then seeing that they do it in the best and cheapest way."
4. Management as a discipline:
Some times the term 'Management' is used to connote neither the activity nor the personnel who exercise it, but as a substantive describes the subject, the body of knowledge and practices of management as a subject of study. Management is being taught in different college and universities as a district subject.
Thus, management, as such is a process, an activity, a discipline and as effort to coordination, control and direct individual and group efforts towards desired goal of the business.
Characteristics / Nature / Features of Management:
The main characteristics of management are as follows:
Management is an activity: Management is an activity which is concerned with the efficient utilization of human and non-human resources of production.
Invisible Force: Management is an invisible force. Its existence can be felt through the enterprise or institution it is managing.
Goal Oriented: Management is goal oriented as it aims to achieve some definite goals and objectives. According to the Haimann, "Effective management is always management by objectives". Managers and other personnel officers apply their knowledge, experience and skills to achieve the desired objectives.
Accomplishment through the efforts of Others: Managers cannot do everything themselves. They must have the necessary ability and skills to get work accomplished through the efforts of others.
Universal activity: Management is universal. Management is required in all types or organizations. Wherever there are some activities, there is management. The basic principles of management are universal and can be applied anywhere and in every field, such as business, social, religious, cultural, sports, administration, educational, politics or military.
Art as well as Science: Management is both an art and a science. It is a science as it has an organized body of knowledge which contains certain universal truths and an art as managing requires certain skills which apply more or less in every situation.
Multidisciplinary Knowledge: Though management is a distinct discipline, it contains principles drawn from many social sciences like psychology, sociology etc.
Management is distinct from ownership: In modern times, there is a divorce of management from ownership. Today, big corporations are owned by a vast number of shareholders while their management is in the hands of paid qualified, competent and experienced managerial personnel.
Need at all levels: According to the nature of task and scope of authority, management is needed at all levels of the organization, i.e., top level, middle and lower level.
Integrated process: Management is an integrated process. It integrates the men, machine and material to carryout the operations of the enterprise efficiently and successfully. This integrating process is result oriented.
Submitted to RB by Girish Sharmaa
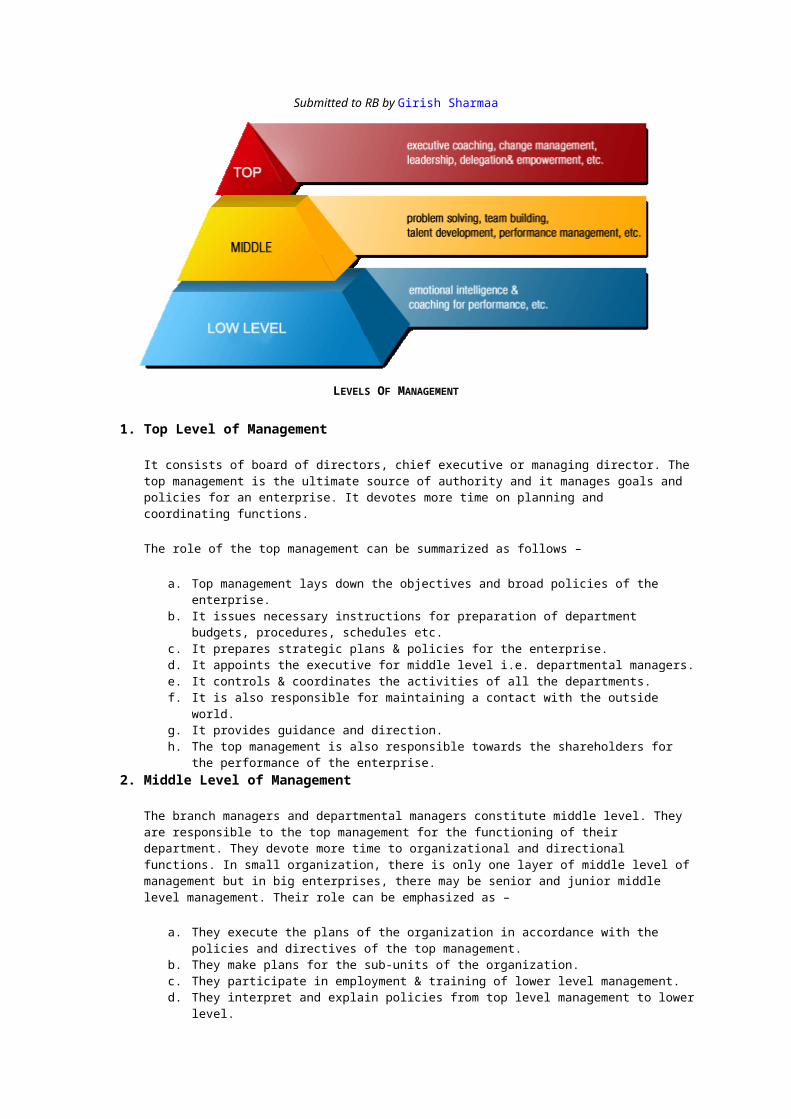
LEVELS OF MANAGEMENT
1. Top Level of Management
It consists of board of directors, chief executive or managing director. The top management is the ultimate source of authority and it manages goals and policies for an enterprise. It devotes more time on planning and coordinating functions.
The role of the top management can be summarized as follows –
a. Top management lays down the objectives and broad policies of the enterprise. b. It issues necessary instructions for preparation of department budgets, procedures, schedules
etc. c. It prepares strategic plans & policies for the enterprise. d. It appoints the executive for middle level i.e. departmental managers. e. It controls & coordinates the activities of all the departments. f. It is also responsible for maintaining a contact with the outside world. g. It provides guidance and direction. h. The top management is also responsible towards the shareholders for the performance of the
enterprise. 2. Middle Level of Management
The branch managers and departmental managers constitute middle level. They are responsible to the top management for the functioning of their department. They devote more time to organizational and directional functions. In small organization, there is only one layer of middle level of management but in big enterprises, there may be senior and junior middle level management. Their role can be emphasized as –
a. They execute the plans of the organization in accordance with the policies and directives of the top management.
b. They make plans for the sub-units of the organization. c. They participate in employment & training of lower level management. d. They interpret and explain policies from top level management to lower level. e. They are responsible for coordinating the activities within the division or department. f. It also sends important reports and other important data to top level management. g. They evaluate performance of junior managers. h. They are also responsible for inspiring lower level managers towards better performance.
3. Lower Level of Management
Lower level is also known as supervisory / operative level of management. It consists of supervisors, foreman, section officers, superintendent etc. According to R.C. Davis, “Supervisory management refers to those executives whose work has to be largely with personal oversight and direction of operative
employees”. In other words, they are concerned with direction and controlling function of management. Their activities include –
a. Assigning of jobs and tasks to various workers. b. They guide and instruct workers for day to day activities. c. They are responsible for the quality as well as quantity of production. d. They are also entrusted with the responsibility of maintaining good relation in the organization. e. They communicate workers problems, suggestions, and recommendatory appeals etc to the
higher level and higher level goals and objectives to the workers. f. They help to solve the grievances of the workers. g. They supervise & guide the sub-ordinates. h. They are responsible for providing training to the workers. i. They arrange necessary materials, machines, tools etc for getting the things done. j. They prepare periodical reports about the performance of the workers. k. They ensure discipline in the enterprise. l. They motivate workers. m. They are the image builders of the enterprise because they are in direct contact with the
workers
4. Managerial Ethics5. The word ethics is derived from the Greek work ethos, which refers to 6. the character and sentiment of the community, and standards of behavior. 7. Ethical means conforming to the standards of a given profession or group. Any 8. group can set its own ethical standards and then live by them or not. Ethical 9. standards, whether they are established by an individual, a corporation, a 10. profession, or a nation, help to guide a person's decisions and actions. The 11. commonly accepted definition of ethics is rules or standards that govern 12. behavior. Managerial decision making is the type of behavior that managers 13. are paid to do. They must make choices among alternatives and these may 14. vary in terms of their perceived ethicality. 15. The argument might be that ethics and morality ought to be kept as an 16. exclusive part of religious and educational organizations. When morality 17. intrudes on the business organization, it has a potential of diverting from the 18. organization's main objective, to make money, and as a result lead to deprive 19. stockholders returns. But there is an increased realization that managers 20. needs to be more responsible, not just to their stockholders but also to their
Harvard Business Online June 20, 2008, 3:40PM EST text size: TT
Today's Top 10 Talent-Management Challenges
Tammy Erickson on the dilemmas and problems managers and companies must contend with
by Tammy Erickson
Related Items
Visit HarvardBusiness.org Subscribe to Harvard Business Review Visit Harvard Business Review Online Visit Leadership & Managing People Resource Center Visit Harvard Business Review Answers
Story Tools
post a comment e-mail this story print this story order a reprint digg this save to del.icio.us
Posted on Across the Ages: June 19, 2008 11:12 PM
I had the pleasure last week of moderating a panel of senior talent development officers representing three very different industries and diverse geographies: Deb Wheelock of Mercer (a high-end professional services firm, recruiting highly educated knowledge workers), Pamela Stroko of The Gap (a retailer faced with the classic industry challenges of creating a differentiating employee proposition and enhancing retention of its large workforce), and Sujaya Banerjee of the Essar Group (a diversified India-based enterprise participating in a variety of industrial sectors, including steel, energy, and communications).
Interestingly, even with this diversity of perspectives, we found our views on today's top talent challenges to be surprisingly aligned. I thought you might like to see our list—and would love to hear your thoughts on things you're wrestling with that we missed.
Here goes:
1. Attracting and retaining enough employees at all levels to meet the needs of organic and inorganic growth. All three companies are facing a talent crunch. Essar, for example, has grown from 20 thousand employees to a staggering 60 thousand in the past 3 years. Fifty-five percent of their employees have less than two years of tenure.
2. Creating a value proposition that appeals to multiple generations. With four generations in today's workplace, most companies are struggling to create an employee experience that appeals to individuals with diverse needs, preferences and assumptions. The Gap, for example, has 153,000 people in its workforce. The stores have a high percentage of Gen Y employees, while corporate roles and leadership ranks are primarily made up of Gen X'ers and Boomers. How does one create a compelling employee value proposition for the organization?
3. Developing a robust leadership pipeline. I believe one of the biggest potential threats to many corporations is a lack of a robust talent pool from which to select future leaders. This is in part a numbers issue—the Gen X cohort is small and therefore, as I like to say, precious. But it's also an interest issue—many members of Gen X are simply not particularly excited about being considered for these roles. There was wide agreement among the panelists that a lack of individuals ready to move into senior client manager and leadership roles is a critical challenge.
4. Rounding out the capabilities of hires who lack the breadth of necessary for global leadership. It's relatively straightforward to identify and assess experts in specific functional or technical arenas, but much more difficult to determine whether those individuals have the people skills, leadership capabilities, business breadth, and global diversity sensibilities required for the nature of leadership today. Increasingly, the challenge of developing these broader skill sets falls to the corporations. Essar has formed an academy specifically to develop and groom its own leaders.
5. Transferring key knowledge and relationships. The looming retirement of a significant portion of the workforce challenges all companies, but particularly those who are dependant on the strength of tacit knowledge, such as that embedded in customer relationships, a key to Mercer's business success.
6. Stemming the exodus of Gen X'ers from corporate life. A big threat in many firms today is the exodus of mid-career talent—people in whom the organization has invested heavily and in whom it has pinned it hopes for future leadership. For example, developing talent management practices and programs calibrated to leverage technology and create greater work/life balance has been a priority for Mercer over recent years.
7. Redesigning talent management practices to attract and retain Gen Y's. The challenge of calibrating talent management practices and programs to attract and engage our young entrants is critically important to all firms and particularly so for firms that depend on a strong flow of top talent, such professional service firms like Mercer. All three panelists agreed that making the business infrastructure more attractive to Gen Y is a high priority.
8. Creating a workplace that is open to Boomers in their "second careers." Age prejudice still exists, but smart companies are looking for ways to incorporate the talents of Boomers and even older workers in the workforce. In many cases, this requires rethinking roles and work relationships.
9. Overcoming a "norm" of short tenure and frequent movement. Some industries, such as specialty retail, are known for having a very disposable view of talent. Companies intent on changing that norm, such as The Gap, must address both external influences in the marketplace and an internal mindset. The Gap believes retaining employees in roles for 3+ years will be a key to their future earnings growth.
10. Enlisting executives who don't appreciate the challenge. Many talent executives complain that business leaders still believe that people are lined up outside the door because of the power of the company's brand. The challenge of enlisting the support of all executives for the transition from a talent culture that has traditionally operated with a "buy" strategy to one that places more emphasis on "build" is widely shared.
Harvard Business Online June 20, 2008, 3:40PM EST text size: TT
Today's Top 10 Talent-Management Challenges
Tammy Erickson on the dilemmas and problems managers and companies must contend with
by Tammy Erickson
Related Items
Visit HarvardBusiness.org Subscribe to Harvard Business Review Visit Harvard Business Review Online Visit Leadership & Managing People Resource Center Visit Harvard Business Review Answers
Story Tools
post a comment e-mail this story print this story order a reprint digg this save to del.icio.us
Posted on Across the Ages: June 19, 2008 11:12 PM
I had the pleasure last week of moderating a panel of senior talent development officers representing three very different industries and diverse geographies: Deb Wheelock of Mercer (a high-end professional services firm, recruiting highly educated knowledge workers), Pamela Stroko of The Gap (a retailer faced with the classic industry challenges of creating a differentiating employee proposition and enhancing retention of its large workforce), and Sujaya Banerjee of the Essar Group (a diversified India-based enterprise participating in a variety of industrial sectors, including steel, energy, and communications).
Interestingly, even with this diversity of perspectives, we found our views on today's top talent challenges to be surprisingly aligned. I thought you might like to see our list—and would love to hear your thoughts on things you're wrestling with that we missed.
Here goes:
1. Attracting and retaining enough employees at all levels to meet the needs of organic and inorganic growth. All three companies are facing a talent crunch. Essar, for example, has grown from 20 thousand employees to a staggering 60 thousand in the past 3 years. Fifty-five percent of their employees have less than two years of tenure.
2. Creating a value proposition that appeals to multiple generations. With four generations in today's workplace, most companies are struggling to create an employee experience that appeals to individuals with diverse needs, preferences and assumptions. The Gap, for example, has 153,000 people in its workforce. The stores have a high percentage of Gen Y employees, while corporate roles and leadership ranks are primarily made up of Gen X'ers and Boomers. How does one create a compelling employee value proposition for the organization?
3. Developing a robust leadership pipeline. I believe one of the biggest potential threats to many corporations is a lack of a robust talent pool from which to select future leaders. This is in part a numbers issue—the Gen X cohort is small and therefore, as I like to say, precious. But it's also an interest issue—many members of Gen X are simply not particularly excited about being considered for these roles. There was wide agreement among the panelists that a lack of individuals ready to move into senior client manager and leadership roles is a critical challenge.
4. Rounding out the capabilities of hires who lack the breadth of necessary for global leadership. It's relatively straightforward to identify and assess experts in specific functional or technical arenas, but much more difficult to determine whether those individuals have the people skills, leadership capabilities, business breadth, and global diversity sensibilities required for the nature of leadership today. Increasingly, the challenge of developing these broader skill sets falls to the corporations. Essar has formed an academy specifically to develop and groom its own leaders.
5. Transferring key knowledge and relationships. The looming retirement of a significant portion of the workforce challenges all companies, but particularly those who are dependant on the strength of tacit knowledge, such as that embedded in customer relationships, a key to Mercer's business success.
6. Stemming the exodus of Gen X'ers from corporate life. A big threat in many firms today is the exodus of mid-career talent—people in whom the organization has invested heavily and in whom it has pinned it hopes for future leadership. For example, developing talent management practices and programs calibrated to leverage technology and create greater work/life balance has been a priority for Mercer over recent years.
7. Redesigning talent management practices to attract and retain Gen Y's. The challenge of calibrating talent management practices and programs to attract and engage our young entrants is critically important to all firms and particularly so for firms that depend on a strong flow of top talent, such professional service firms like Mercer. All three panelists agreed that making the business infrastructure more attractive to Gen Y is a high priority.
8. Creating a workplace that is open to Boomers in their "second careers." Age prejudice still exists, but smart companies are looking for ways to incorporate the talents of Boomers and even older workers in the workforce. In many cases, this requires rethinking roles and work relationships.
9. Overcoming a "norm" of short tenure and frequent movement. Some industries, such as specialty retail, are known for having a very disposable view of talent. Companies intent on changing that norm, such as The Gap, must address both external influences in the
marketplace and an internal mindset. The Gap believes retaining employees in roles for 3+ years will be a key to their future earnings growth.
10. Enlisting executives who don't appreciate the challenge. Many talent executives complain that business leaders still believe that people are lined up outside the door because of the power of the company's brand. The challenge of enlisting the support of all executives for the transition from a talent culture that has traditionally operated with a "buy" strategy to one that places more emphasis on "build" is widely shared.
Three Management ApproachesBased on these definitions, three different managerial approaches to implementation and management can be identified, each reflecting:
different types of technologies involved; degree of complexity in program delivery; objectives (specific / diffused); and process timeframes and the transition from project to passive
approaches to eDemocracy (see Section 2.3.4).
The approaches characterised in this guide are:
the active listening role as a passive form of management; the cultivating role focusing on capacity-building and the stimulation of
action by others; and the steering role, being a programmatic approach with high levels of
management and control.
Active ListeningThe desire by some governments to present themselves as technologically advanced and responsive to the community has tended to lead to situations where electronic democracy is interpreted as a ‘thing’ to be delivered to the waiting (passive and presumably grateful) public.
During the late 1990s this was reflected in a tendency for governments to formulate specific eDemocracy policy statements combined with a number of high profile activities. The best example of this approach can be seen in the United Kingdom under the early period of the Blair Labour government.
This can be beneficial in advancing the eDemocracy agenda. However, the approach can be seen to assume that ICTs are a ‘push’ (one-way) medium like television in which information is formulated centrally and then delivered to a passive audience.
The interactive nature of new digital technologies means that one of the important characteristics of the technology is the open participation by citizens and stakeholders in discussions of public interest. These discussions can include:
unstructured conversation on email lists, through chat facilities, or on bulletin board systems (for example Yahoo! Groups; http://groups.yahoo.com/);
expression of public opinion through alternative and non-profit online news publications (such as the OnLine Opinion magazine [http://www.onlineopinion.com.au/] or more specialist internet media); and
the increasing number of ‘citizen journalists’ publishing on personal websites, blogs, or syndicated multimedia (podcasting or video blogging).
Listening management approaches are common throughout the public sector to allow for quick reactions to emerging issues or problems. This is particularly so amongst policy officers who are routinely tasked with monitoring mainstream media on behalf of their agency and Minister.
While this 'listening' is often undertaken in a relatively ad hoc manner, the inclusion of ICT-based listening approaches can be useful in that:
information can often travel through electronic networks much faster than conventional media, thereby offering the potential for increased responsiveness;
there is a range of commercial and free services [3] that automatically identify key terms and phrases from established media and alternative media and provide instant, or periodic, updates; and
the introduction of RSS-type subscription services [4] allows for the customisation of news and information aggregation via desktop and mobile software.
While some might assume that a listening management approach is a euphemism for inactivity, an effective listening approach does require specific planning and management. Active listening requires:
an investment in time to undertake environmental scanning to identify important sources of information. These sources need to be refreshed and renewed on a regular basis;
a specific allocation of staff time to the collection of information (monitoring);
establishing a mechanism by which information can be stored, searched, indexed, retrieved and interpreted in a meaningful way; and
some means of establishing and assessing the value of the investment in active listening, either for the purposes of appropriately valuing and rewarding staff time, or as a mechanism for justifying this activity given its relative opportunity cost. One of the ongoing concerns associated with this form of eDemocracy activity can be the high ‘noise to signal’ ratio, being the poor return in terms of valuable information that can be gathered given the investment of time required to sift through irrelevant, uninformed, or misleading views and opinions.
Regardless of these concerns, listening approaches can be valuable precursors to the introduction of more structured eEngagement processes. They can provide the means
for understanding the existing tenor of conversation, collecting useful background information and identifying elements of a policy issue that may be particularly engaging to the public.
It is entirely possible that key decision-makers in government will increasingly be as attuned to blog and website discussions of policy as they have traditionally been to television, radio and newspaper reporting.
Listening approaches are often employed following the conclusion of more structured eEngagement processes, either as a means of establishing popular views about the outcomes and impacts of policy decisions, or where the formal process has stimulated an active group of engaged stakeholders to oversight policy implementation.
Exhibit 9: ‘Mass Listening’ as Passive eEngagement Management
Elizabeth Richard of the Public Works and Government Services agency of the Canadian federal government notes that the internet provides public sector managers effective and interesting ‘mass listening’ tools. The proliferation of non-government, public email discussion lists on policy issues can give public sector managers interested in alternative views on policy and program implementation, avenues to undertake informal and unstructured listening to public views without necessarily engaging in formal consultative processes in the first instance.
The benefit of this approach lies in:
the capacity to gather information informally, without the pressures of specific consultative timeframes;
the ability to identify potential participants in formal consultative processes; hearing relatively candid points of view which may not be the same as arguments
put in formal submissions – particularly where an issue is contested; the ability to absorb the level of debate (complexity, language used, degree of
public understanding of policy issues) to allow public documents to be pitched at the right level;
relative anonymity (‘lurking'); and the ability to manage information gathering, particularly where there is concern
that public consultation will lead to a large number of submissions (volume management).
CultivatingLike the listening approach, cultivating or ‘facilitative’ management approaches rely on utilising existing skills found in civil society as the basis for successful community participation. Whereas active listening approaches can be valuable where there is an identifiable community of interest around the issue of concern, ‘cultivating’ recognises the need for outside assistance in stimulating participation.
In many policy areas, it may not be possible to identify existing communities of interest with which to engage. The public sector manager may find that the target audience lacks the technical capacity to use ICTs to participate in policy debate (where interested stakeholders are diffused through the society), or there has not been a recognition of a shared issue or concern that has given rise to mobilisation of interests.
Cultivation requires a number of activities:
the identification of a specific and definable community of concern based on locale (such as a local community that has high levels of unemployment or crime) or non-geographic factors such as shared experience, or other identifiable characteristics (e.g. during 2005 the Victorian Office of Women's Policy undertook an online consultation associated with the experiences of working mothers across Victoria);
definition of the characteristics of particular problems, which may be specific (lack of access to public transport, for example) or generalised (such as issues associated with school retention rates);
determination of required inputs to address issue(s) of concern; development of participatory structures to deliver the required solutions; stimulation of collective activity; and development of the skills required to manage within the community
(including appropriate governance and reporting requirements).
Depending upon the nature of the specific area of concern, the level of community involvement in initial planning and preparation may be limited or specific. This will depend on the nature of the problem and the existing capacity of local individuals or organisations to participate in early planning processes.
There are distinctly different approaches to ‘cultivating’ community participation, depending on whether:
there is a clear recognition of a specific deficit which needs to be countered (the ‘provision’ model); or
the community (geographical, policy, or community-of-interest) is active in defining the need, for example, customising a specific response to a social concern (the ‘partnership’ model).
The exact character of the response by the administering agency or agencies (cultivating models often necessitate partnerships across government) can be highly programmatic in character, or may be more intangible. Some programmatic examples include:
the provision of ICTs (hardware); skills development; community training programs; and/or volunteering schemes.
It is also important to consider that less formalised activities can also fall under this approach. A good example is capacity-building in community groups that results from their inclusion in consultation and management processes. Inclusion enhances the position of organisations, thereby encouraging growth in membership and enhancing their representativeness. The result can be a stakeholder group of greater value to the public sector manager.
While these approaches can be used cynically,[5] they can be powerful in stimulating active organisations outside of government. Developing long term relations with formative groups can be important for the public sector manager with a medium term objective of creating a future partnership.
Given the nature of this type of management process, cultivation generally focuses on ‘before and after’ comparisons to determine measures of public value. For some projects this can be quite crude (e.g. percentage of free access terminals per capita) and others more complex and sophisticated (e.g. measures of social inclusiveness or similar ‘social capital’ metrics[6]).
Often, the key issues associated with cultivation management relate to the capacity to assess changes over time, particularly where programmatic activities have concluded, but there is an expectation of ongoing value creation.
SteeringIn contrast to the above approaches, the final type of management response – steering – reflects a far more instrumental project management approach to policy delivery. Steering management approaches are common in developing eEngagement projects because of the emphasis placed on delivering short-term, specific and instrumental (policy development, acceptance testing and decision-making) outcomes.
Exhibit 10: Cultivating Approaches to eEngagement Management
Cultivating management approaches can yield powerful outcomes in the areas of community development, capacity building and the stimulation of active communities of interest.
Examples of this type of approach include:
The Argyll and Bute Council of Scotland introduced a number of community telecentres in three remote island communities (Islay, Jura and Colonsay) offering personal computers with internet access and videoconferencing. The services have been highly popular, particularly during harsh winter months, with the services used to facilitate business operations, provide personal access to medical consultations (eService outcomes) and have been used extensively by the farming community to lobby the European Union over farm tenancy issues. While some of these applications were planned and expected by project managers, the use to which the videoconferencing service have been employed have been wider than expectations, leading to a multiplier effect of the technological investment.
The New South Wales government established the communitybuilders.nsw website as a centralised clearing house for information associated with social, economic and environmental renewal through community-based organisations, non-profit groups and volunteering projects. The website provides information about organisation and management, financial assistance and planning and includes an extensive online discussion forum where people involved in these areas can exchange information and advice. While the Department of Community Services hosts and manages the website, the real value gained is through the interaction between citizens and citizens groups to solve local problems. See: http://www.communitybuilders.nsw.gov.au
A variation of the communitybuilders model has been introduced by the British Broadcasting Corporation as its Action Network website (http://www.bbc.co.uk/dna/actionnetwork/). While community builders focuses on local renewal projects, Action Network has a more overtly political focus, allowing citizens to chat about political issues, start campaigns and network with like-minded individuals.
While steering approaches generally include participatory design elements appropriate to the anticipated stakeholder community, (either through the establishment of formal reference groups, or ad hoc consultation and negotiation), steering management approaches tend to be agency-driven.
This is due to the agency having:
the capacity to develop a comprehensive engagement strategy; the resources to develop or acquire the appropriate technologies; and the ability to provide a ‘hook’ (access point) into the formal process of
policy development in government.
Effective steering requires detailed preparation for the development of the eEngagement process, with clear process planning and well-defined timeframes. Flexibility in this approach is normally accommodated through reflective management and contingency planning. This is often important where the engagement process forms part of a specific policy initiative associated with the executive, or, where the consultation must meet the necessary timeframes for parliamentary reporting or legislative drafting.
The key aspects of appropriate steering management are:
the integration of project development within wider strategic planning processes;
the development of clearly articulated project deliverables, checkpoints and delivery timeframes;
the need for specific program evaluation and reporting; and the tendency for these processes to be assessed against very specific
outcome requirements (commonly expressed in terms of numerical metrics, such as numbers of participants, or output-based performance criteria).
Exhibit 11: The ‘Electronic Discussion List’ Model as eEngagement
The City of Darebin eForum pilot project in Melbourne reflects a conventional ‘steering’ approach to eEngagement management. The Council undertook to develop a structured online discussion forum which included Council staff and members of the community to discuss a range of local issues over a set period of time. Using basic email management technology, the council developed an engagement and promotional plan. A project officer recruited from local community groups moderated and summarised discussions and fed information collected back into the policy-making officers and Councillors at the end of each structured discussion. This approach was highly programmatic in character, with clear timeframes for action, close management of activities and control of interaction through the process of moderation.
Relationship Between the Three Approaches While eEngagement activities tend to focus on cultivating and steering, [7] it is highly likely that a single project may require a number of different management approaches at different points of the planning and implementation process. A clear recognition of the relationship between project initiation, development, implementation, evaluation and closeout stages of any eEngagement activity can be extremely valuable in allowing the
management group to recognise the appropriate management style for the particular phase of activity.
In addition, some reflection by project team members on their particular strengths and preferences can be useful in managing the transition between management approaches appropriate for different phases of project implementation.
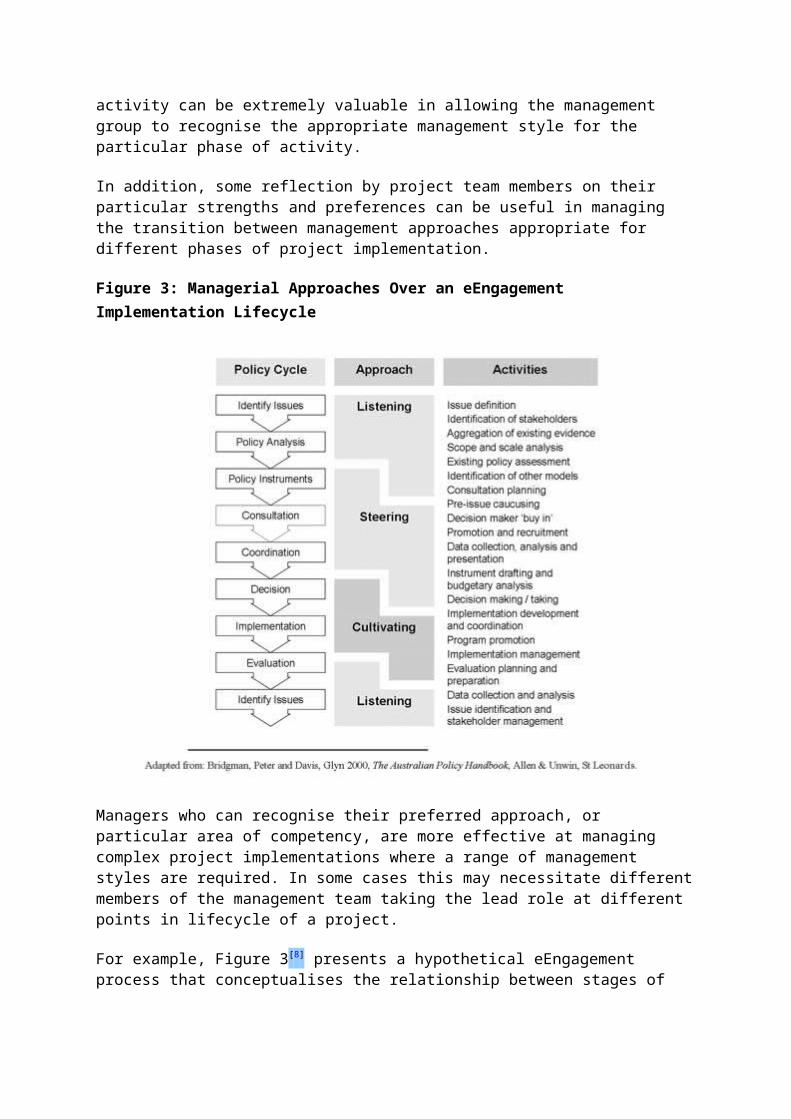
Figure 3: Managerial Approaches Over an eEngagement Implementation Lifecycle
Managers who can recognise their preferred approach, or particular area of competency, are more effective at managing complex project implementations where a range of management styles are required. In some cases this may necessitate different members of the management team taking the lead role at different points in lifecycle of a project.
For example, Figure 3[8] presents a hypothetical eEngagement process that conceptualises the relationship between stages of the policy cycle and the range of different management approaches.
Communication for Rural DevelopmentSummary2.2.2 Communication for rural development
Strategies that include communication for rural development as a significant aspect of agricultural and rural development are sorely needed. Efforts in this direction are being made, but
governments have yet to recognize fully the potential of this factor in promoting public awareness and information on agricultural innovations, as well as on the planning and development of small business, not to mention employment opportunities and basic news about health, education and other factors of concern to rural populations, particularly those seeking to improve their livelihoods and thereby enhance the quality of their lives.
Rural development is often discussed together with agricultural development and agricultural extension. In fact "agricultural extension" is often termed "rural extension" in the literature. In contrast, rural development includes but nonetheless expands beyond the confines of agriculture, and furthermore requires and also involves developments other than agriculture. Accordingly, government should consider the establishment of a communication policy that while supporting agricultural extension for rural development also assumes the role of a "rural extension" service aimed as well at diffusing non-agricultural information and advice to people in rural areas.
A communication policy would aim to systematically promote rural communication activities, especially interactive radio but also other successful media such as tape recorder and video instructional programmes. Computers and the Internet may not yet be accessible to rural communities but they serve the communication intermediaries and agricultural extension agents who provide information to rural populations. Other devices such as cell phones hold considerable promise for the transfer and exchange of practical information.
For reaching the final agricultural and basic needs information users in rural areas today, radio is the most powerful and cost-effective medium. However, other traditional and modern communication methods are equally valuable, depending on the situation and availability, like face-to-face exchanges (via demonstration and village meetings); one-way print media (such as, newspapers, newsletters, magazines, journals, posters); one-way telecommunication media (including non-interactive radio, television, satellite, computer, cassette, video and loud-speakers mounted on cars); and two-way media: (telephone, including teleconferencing, and interactive (Internet) computer).
Information and communication technologies (ICTs) have proved to be important for Internet users and for the intermediate users who work with the poor. Pilot experiences show that various media are valuable for assisting agricultural producers with information and advice as to agricultural innovations, market prices, pest infestations and weather alerts.
ICTs also serve non-farming rural people with information and advice regarding business opportunities relating to food processing, wholesale outlets and other income-generating opportunities. In the case of non-agricultural rural development interests, a communication for rural development policy would aim to promote diffusion of information about non-agricultural micro-enterprise development, small business planning, nutrition, health and generally serve to provide useful, other-than-agriculture information.
By its very nature as mass media, communication for rural development can provide information useful to all segments of rural populations. However, it would serve as a first effort toward advancement of "rural extension" services and activities aimed at rural development concerns beyond those of agriculture. Thus, extension and communication activities would be expected to work in tandem, allied in the common cause of supporting income-generating activities, both agricultural and non-agricultural.
Communication as related to extension services immediately suggests several avenues of mutual support. For example: these would include national services relating to extension and communication, specialized extension communication services, extension services promoted by producers, commercialized extension services, and mass media extension-related services. A similar orientation toward other aspects of rural development information and technical advice is evident considering the de Janvry-Sadoulet rural development pathways and other related rural development needs such as information and assistance with health problems, most notably Human Immunodeficiency Virus/Acquired Immunodeficiency Syndrome (HIV/AIDS) in case of sub-Saharan Africa.
Rural extension and radio need to be more purposely connected. Radio, according to contemporary specialists (FAO 2003c), is under utilized at present. While ICTs and their connection to radio hold
promise for the future, some consider radio to be "the one to watch" (FAO 2003c). In this connection, regional networks are being launched. Examples are The World Association for Community Radio Broadcasters (AMARC) and the Latin American Association for Radio Education (ALER). Global initiatives have begun: Developing Countries Farm Radio Network (DCFRN) and UNESCO Community Media Centres.
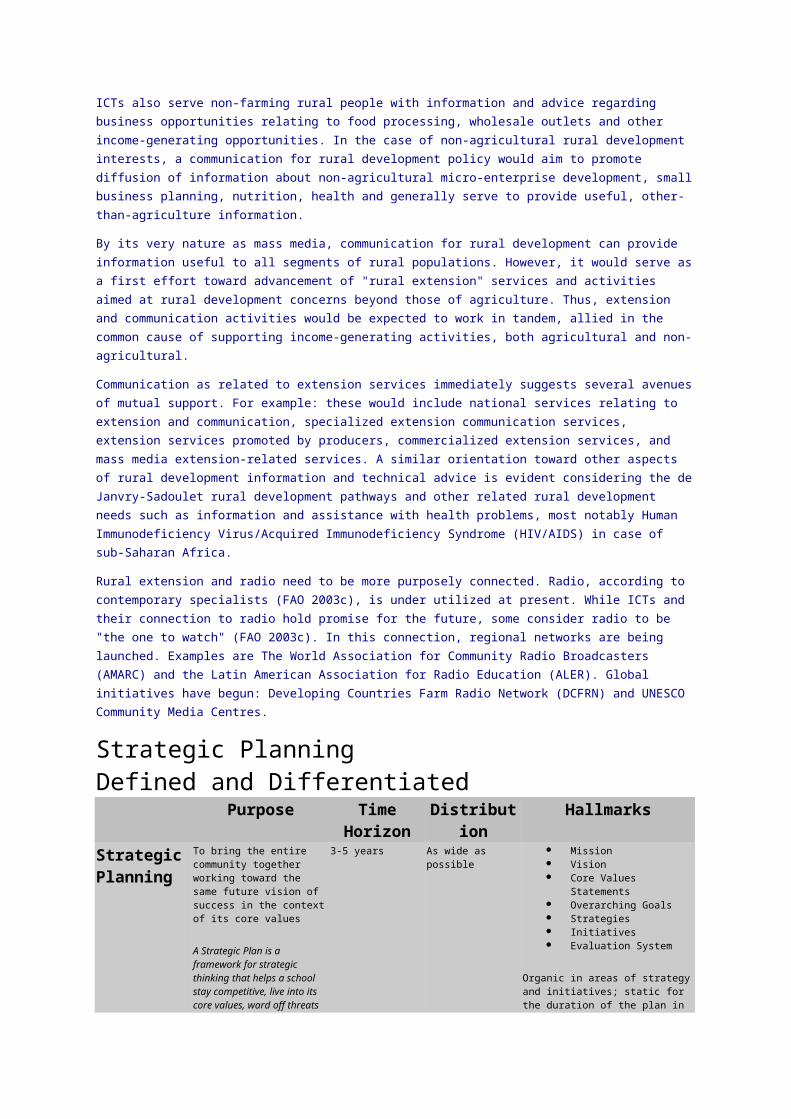
Strategic PlanningDefined and Differentiated
Purpose Time Horizon
Distribution Hallmarks
Strategic Planning
To bring the entire community together working toward the same future vision of success in the context of its core values
A Strategic Plan is a framework for strategic thinking that helps a school stay competitive, live into its core values, ward off threats and take advantage of opportunities.
3-5 years As wide as possible Mission Vision Core Values Statements Overarching Goals Strategies Initiatives Evaluation System
Organic in areas of strategy and initiatives; static for the duration of the plan in areas of mission, vision, values and goals.
Process hallmarks are:
inclusivity, accountability, shared responsibility, evaluation and institutionalization.
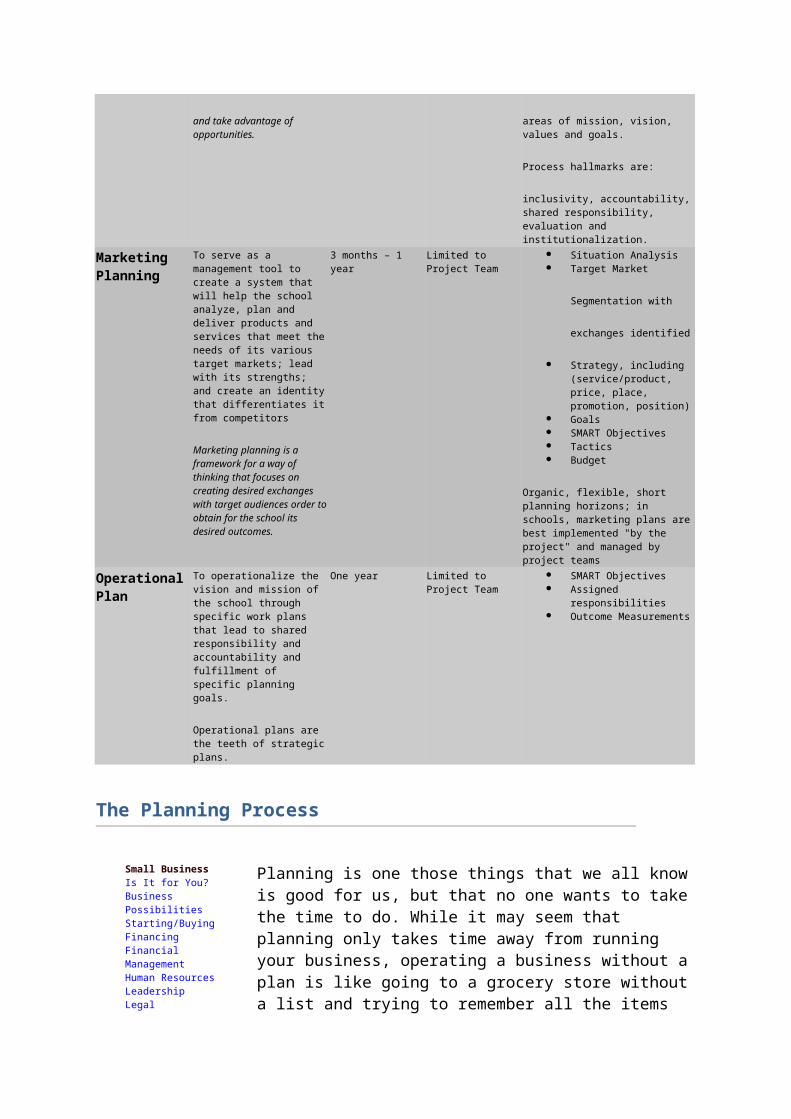
Marketing Planning
To serve as a management tool to create a system that will help the school analyze, plan and deliver products and services that meet the needs of its various target markets; lead with its strengths; and create an identity that differentiates it from competitors
Marketing planning is a framework for a way of thinking that focuses on creating desired exchanges with target audiences order to obtain for the school its desired outcomes.
3 months – 1 year Limited to Project Team
Situation Analysis Target Market
Segmentation with
exchanges identified
Strategy, including (service/product, price, place, promotion, position)
Goals SMART Objectives Tactics Budget
Organic, flexible, short planning horizons; in schools, marketing plans are best implemented "by the project" and managed by project teams
Operational Plan
To operationalize the vision and mission of the school through specific work plans that lead to shared responsibility and accountability and fulfillment of specific planning goals.
Operational plans are the teeth of strategic plans.
One year Limited to Project Team
SMART Objectives Assigned responsibilities Outcome Measurements
The Planning Process
Small Business Is It for You?Business PossibilitiesStarting/BuyingFinancingFinancial ManagementHuman ResourcesLeadershipLegalManagementMarketingOfficePlanningTaxes
Resources About Small BusinessBooksBusiness SchoolsEducationFederal GovernmentGlossaryHistory of BusinessInternationalQuotationsState Government
Interests African-AmericanAsian-AmericanDisabledFamily-OwnedGay/LesbianHispanicHome-basedNative AmericanRuralSecond CareerSocial EnterpriseVeteransWomenYoung
Planning is one those things that we all know is good for us, but that no one wants to take the time to do. While it may seem that planning only takes time away from running your business, operating a business without a plan is like going to a grocery store without a list and trying to remember all the items that are needed. One comes out of the store having forgotten something critical - and having purchased a number of items that are totally frivolous and may never be used. It is the same for a business operating without a plan. Critical issues do not get addressed - and some tasks get done that have no relationship to the direction the business needs to go. For a business, however, the consequences of these unaddressed issues can range from inconvenience to bankruptcy.
Part of this reluctance is due to how complicated the process is viewed. Yet a complicated plan is almost as useless as none. The real question is how to make something simple that fits your business' needs. Can a good grocery list system be devised that isn't unnecessarily burdensome for all involved? Of course. Let's take a look as what planning really entails.
The word "plan" originated from then Medieval Latin word planus which meant a level or flat surface. This evolved in French into being a map or a drawing of any object made by projection upon a flat surface. In English this has become a more general sense of a scheme of action, design or method. Planning in its current usage in business implies a consciousness of what is happening in the business. It does not preclude creativity or instinct, but it does add a layer of awareness that spells the difference between survival and extinction in a changing environment. Planning does involve:
an understanding of the business' history an examination of the business' environment an assessment of the business' mission goals a process for reaching those goals a process for gathering information a realization that planning is a continuing process that is
constantly evolving
Planning does not necessarily mean trying to project the future, but being aware of a range of likely futures and being prepared for them as occur.
Business PlanA business plan is used when one is starting a new business or a new process or product within a business. It includes not only a description of the new business, process or product, but also a discussion of how one plans on managing the marketing, development, production, and financing of this new venture.
Organizational Plan
Organizational planning, when it does occur, too often is spurred by crisis, focused on the short term, and not well thought out. To create healthy futures, organizations must construct processes for creating their futures that are not fueled by crisis and turmoil. It can be done.
One of the most confusing aspects for those who want to plan is the variety of terms that are used in conjunction with planning. How do you differentiate between a business plan, a financial plan, a marketing plan, a human resources plan, an operations plan, a strategic plan, a long-range plan and just plain general planning? The simple answer is that each area of your business needs planning so each area should have its own grocery list of what it wishes to accomplish in the future.
Strategic PlanA strategic plan usually refers to the overall direction you wish your business to take over the longer term. Consequently, a long-range plan and a strategic plan are often used synonymously. Within that overall strategy a business will have shorter term financial goals, marketing goals, production goals, and human resource goals that will each need some type of plan if they are to be achieved.
Just because a strategic plan is longer term does not mean it is never changed, however. One of the most serious mistakes businesses make is not revising their strategic plan regularly. The environment the business is operating in is changing constantly. The plan must be revisited at regular intervals to reflect the impact on the business of these external factors.
There are some universal principles that are true across all types of planning. Before tackling more specific planning models, it is wise to gain an understanding of the basic principles of general planning.
Planning Principles
Any plan should include who, what, when, where, how, and why.
Who is needed to accomplish this task? What needs to be done? When does it start and end? Where will it take place? How will it happen? Why must we do it?
Along with the answers to these questions there needs to be some operational scheme to organize the tasks needed to achieve the goal.
A helpful approach is to work backward from the goal to decide
what must be done to reach it. The backward approach is a way of looking at the big picture first, and then planning all tasks, conditions, and details in a logical sequence to make the big picture happen. From this a to-do list can easily be made. This list will become a checklist to ensure everything is progressing as planned. Adjustments can be made based on changing circumstances. The plan (list) should be referenced often as a set of signposts on the journey towards the goals.
For many of us who left corporate America in favor of a smaller work environment, the idea of drafting a plan may seem offensive. After all, isn't frustration with all that busywork one of the reasons we left in the first place? We all have an aversion to doing anything on our job that doesn't immediately help the situation we are now experiencing. However, isn't it also true that a little foresight and action before the fact can help eliminate many of the problems we face each day. Wouldn't it be nice to anticipate something like a price cut by your major competitor or a rise in the interest rate on your credit line? Of course it would. And with that anticipation comes an organized and effective response
m
A managerial economist helps the management by using his analytical skills and highly developed techniques in solving complex issues of successful decision-making and future advanced planning.
The role of managerial economist can be summarized as follows:
1. He studies the economic patterns at macro-level and analysis it’s significance to the specific firm he is working in.
2. He has to consistently examine the probabilities of transforming an ever-changing economic environment into profitable business avenues.
3. He assists the business planning process of a firm.4. He also carries cost-benefit analysis.5. He assists the management in the decisions pertaining to internal functioning of a firm such as
changes in price, investment plans, type of goods /services to be produced, inputs to be used, techniques of production to be employed, expansion/ contraction of firm, allocation of capital, location of new plants, quantity of output to be produced, replacement of plant equipment, sales forecasting, inventory forecasting, etc.
6. In addition, a managerial economist has to analyze changes in macro- economic indicators such as national income, population, business cycles, and their possible effect on the firm’s functioning.
7. He is also involved in advicing the management on public relations, foreign exchange, and trade. He guides the firm on the likely impact of changes in monetary and fiscal policy on the firm’s functioning.
8. He also makes an economic analysis of the firms in competition. He has to collect economic data and examine all crucial information about the environment in which the firm operates.
9. The most significant function of a managerial economist is to conduct a detailed research on industrial market.
10. In order to perform all these roles, a managerial economist has to conduct an elaborate statistical analysis.
11. He must be vigilant and must have ability to cope up with the pressures.12. He also provides management with economic information such as tax rates, competitor’s price and
product, etc. They give their valuable advice to government authorities as well.13. At times, a managerial economist has to prepare speeches for top management

Managerial Economics - Definition
3. Managerial economics is best defined as
a. the study of economics by managers.
b. the study of the aggregate economic activity.
c. the study of how managers make decisions about the use of scarce resources.
d. all of the above are good definitions.
1
The Nature and Scopeof ManagerialEconomicsDr. Mohammad Abdul Mukhyi, SE., MM4/18/2010 Managerial Economic 2
_ Economics is the social science that studies theproduction, distribution, and consumption of goodsand services._ Managerial economics (sometimes referred to asbusiness economics), is a branch of economics thatapplies microeconomic analysis to decisionmethods of businesses or other management units.As such, it bridges economic theory and economicsin practice. It draws heavily from quantitativetechniques such as regression analysis andcorrelation, Lagrangian calculus (linear). If there isa unifying theme that runs through most ofmanagerial economics it is the attempt to optimizebusiness decisions given the firm's objectives andgiven constraints imposed by scarcity, for examplethrough the use of operations research andprogramming.24/18/2010 Managerial Economic 3
Managerial Economics_ Manager_ A person who directsresources to achieve astated goal._ Economics
_ The science of makingdecisions in the presenceof scare resources._ Managerial Economics_ The study of how to directscarce resources in theway that most efficientlyachieves a managerialgoal.4/18/2010 Managerial Economic 4The Global Trade EconomyThe MetropolitanBioregional EconomyMarketSectorsCommodity Agriculture (wheat, rice, soybeans,beef, coffee, bananas, etc.)ElectronicsVehiclesHigh Tech Health Care, PharmaceuticalsHardwareMass Produced Clothing, Cloth GoodsHydrocarbon-Based EnergyFinancial ServicesShort term R&DOrganic & Specialty AgricultureLocal Commerce (locallyproduced goods and services)Construction (Housing, etc.)Education (basic, lifemanagement, citizenship)Basic & Holistic Health Care &EducationHand CraftsArtsSportsChild CareElder CareHome & Yard CarePublicGoods(The"Commons")Global EcologyFair Trade PoliciesNational DefenseLong Range R&DCatastrophic Reinsurance (health, disasters, etc.)Coordination of Health, Education, Welfare(Information and infrastructure investments)Major (Corporate, Foundations, etc.) PhilanthropySustainable Land UseEmployment SecurityEducation (basic, lifemanagement, citizenship)Urban Environment & SocialWelfare ServicesConservation & RecreationLocal PhilanthropyBernard Lietaer and Art Warmoth, © 1999
34/18/2010 Managerial Economic 54/18/2010 Managerial Economic 6
How Is Managerial EconomicsUseful?_ Evaluating Choice Alternatives_ Identify ways to efficiently achieve goals._ Specify pricing and production strategies._ Provide production and marketing rules to help
maximize net profits._ Making the Best Decision_ Managerial economics can be used to efficientlymeet management objectives._ Managerial economics can be used tounderstand logic of company, consumer, andgovernment decisions.44/18/2010 Managerial Economic 7
Definisi:Managerial economic refers to the application ofeconomic theory and the tools of analysis ofdecision science to examine how an organizationcan achieve its aims or objectives most efficiently.The scope of managerial economics:- Economic sciences- Decision sciences- Other science having an effect on to decisionmaking.4/18/2010 Managerial Economic 8
SCOPE & IMPORTANCE OFMANAGERIAL ECONOMICS:Out of two major managerial functions served by thesubject matter under managerial economics are decisionmaking and forward planning:Lets explore the scope for decision making:1. Decision relating to demand.2. Decision related to Cost and production.3. Decision relating to price and market.4. Decision relating to profit management.5. Macro economic factor.54/18/2010 Managerial Economic 9Relationship to economic theory1. Micro economic2. Macro economicPenekanan:1. Normative economic2. Positif economicRelationship to the decision sciencesIlmu ekonomi memberikan kerangka teoritis pengambilankepusuan manajerial untuk membentuk model-modelkeputusan, menganalisis pengaruh serangkaian tindakanalternatif dsan mengevaluasi hasil-hasil yang diperoleh.4/18/2010 Managerial Economic 10
Relatioinship to the functional areas ofbusiness Administration studies.Bidang Fungsional Akuntansi, keuangan, pemasaran,
personalia, produksiBidang alat Akuntansi, sistem informasimanajemen, ekonomi manajerial,perilaku organisasi, metode kuantitatiff,riset operasional, statistik, matematik.Bidang khusus Perbankan, asuransi, bisnisinternasional, regulasiMata kuliahterpaduKebijakan perusahaan, ekonomimanajerial64/18/2010 Managerial Economic 11
Theory of the Firm_ Expected Value Maximization_ Owner-managers maximize short-run profits._ Primary goal is long-term expected value maximization._ Constraints and the Theory of the Firm_ Resource constraints._ Social constraints_ Limitations of the Theory of the Firm_ Alternative theory adds perspective._ Competition forces efficiency._ Hostile takeovers threaten inefficient managers.4/18/2010 Managerial Economic 12
Economic vs. AccountingProfits_ Accounting Profits_ Total revenue (sales) minus dollar cost ofproducing goods or services_ Reported on the firm’s income statement_ Economic Profits_ Total revenue minus total opportunity cost74/18/2010 Managerial Economic 13
Opportunity Cost_ Accounting Costs_ The explicit costs of the resources needed toproduce produce goods or services_ Reported on the firm’s income statement_ Opportunity Cost_ The cost of the explicit and implicit resourcesthat are foregone when a decision is made_ Economic Profits_ Total revenue minus total opportunity cost4/18/2010 Managerial Economic 14
Why Do Profits Vary AmongFirms?_Disequilibrium Profit Theories_Rapid growth in revenues._Rapid decline in costs._ Compensatory Profit Theories_Better, faster, or cheaper thanthe competition is profitable.84/18/2010 Managerial Economic 15
Role of Business in Society_ Why Firms Exist_ Business is useful in satisfying consumerwants._ Business contributes to social welfare_ Social Responsibility of Business_ Serve customers._ Provide employment opportunities._ Obey laws and regulations.4/18/2010 Managerial Economic 16
94/18/2010 Managerial Economic 17
Market Interactions_ Consumer-Producer Rivalry_ Consumers attempt to locate low prices, whileproducers attempt to charge high prices_ Consumer-Consumer Rivalry_ Scarcity of goods reduces the negotiating power ofconsumers as they compete for the right to thosegoods_ Producer-Producer Rivalry_ Scarcity of consumers causes producers to competewith one another for the right to service customers_ The Role of Government_ Disciplines the market process4/18/2010 Managerial Economic 18
The Theory of The FirmModel dasar perusahaan bisnis _ teori perusahaanTujuan : mamaksimisasi kekayaan atau nilaiperusahaan (nilai sekarang = PV)._
_−nt 1tt tnt 1ttnn2211(1 i)TR TCNilai(1 i)PV(1 i)....(1 i) (1 i)PV104/18/2010 Managerial Economic 19
Constraint on the operationof the firmConstraint :1. Sumberdaya2. Kuantitas dan kualitas output3. Hukum4/18/2010 Managerial Economic 20
Firm Valuation_ The value of a firm equals the present value ofall its future profits_ PV = S pt / (1 + i)t
_ If profits grow at a constant rate, g < i, then:_ PV = po ( 1+i) / ( i - g), po = current profit level._ Maximizing Short-Term Profits_ If the growth rate in profits < interest rate and bothremain constant, maximizing the present value of all
future profits is the same as maximizing currentprofits.114/18/2010 Managerial Economic 21
_ Control Variables_ Output_ Price_ Product Quality_ Advertising_ R&D_ Basic Managerial Question: How much ofthe control variable should be used tomaximize net benefits?Marginal (Incremental)Analysis4/18/2010 Managerial Economic 22
Net Benefits_ Net Benefits = Total Benefits - Total Costs_ Profits = Revenue - Costs124/18/2010 Managerial Economic 23
Marginal Benefit (MB)_ Change in total benefits arising from achange in the control variable, Q:MB = DB / DQ_ Slope (calculus derivative) of the totalbenefit curve4/18/2010 Managerial Economic 24
Marginal Cost (MC)_ Change in total costs arising from a changein the control variable, Q:MC = DC / DQ_ Slope (calculus derivative) of the total costcurve134/18/2010 Managerial Economic 25
Marginal Principle_ To maximize net benefits, the managerialcontrol variable should be increased upto the point where MB = MC_ MB > MC means the last unit of thecontrol variable increased benefits more
than it increased costs_ MB < MC means the last unit of thecontrol variable increased costs morethan it increased benefits4/18/2010 Managerial Economic 26
The Geometry of OptimizationQBenefits & CostsBenefitsCostsQ*BCSlope = MCSlope =MB144/18/2010 Managerial Economic 27
Literatur_ Michael R. Baye, Managerial Economics andBusiness Strategy, 6e. ©The McGraw-HillCompanies, Inc., 2008_ Dominick Savatore, Managerial Economic,Oxford University Press, 2007_ Mark Hirschey, MANAGERIAL ECONOMICS11th EditionProblem1. Review the decision criteria that you took intoaccount in choosing your college or university; inwhat sense was the choice a managerial decision?...an entrepreneurial decision?2. Explain how the existence of multiple possiblegoals may be accommodated in a decisionanalysis.3. 3. Explain how the achievement of profit in thebusiness firm may be a by-product of otheractivities rather than an object of direct pursuit;what are the managerial implications?4/18/2010 Managerial Economic 28
Basic economic tools in managerial economics for decision makingYou are Here:
Home > Managerial Economics > Basic economic tools in managerial economics for decision making
Share
Business decision making is essentially a process of selecting the best out of alternative opportunities open to the firm. The steps below put managers analytical ability to test and determine the appropriateness and validity of decisions in the modern business world. Following are the various steps in decision making process:
1. Establish objectives2. Specify the decision problem3. Identify the alternatives
.
4. Select the best alternatives5. Implement the decision6. Monitor the performance
Modern business conditions are changing so fast and becoming so competitive and complex that personal business sense, intuition and experience alone are not sufficient to make appropriate business decisions. It is in this area of decision making that economic theories and tools of economic analysis contribute a great deal.
Basic economic tools in managerial economics for decision making:
Economic theory offers a variety of concepts and analytical tools which can be of considerable assistance to the managers in his decision making practice. These tools are helpful for managers in solving their business related problems. These tools are taken as guide in making decision.
Following are the basic economic tools for decision making:
1. Opportunity cost2. Incremental principle3. Principle of the time perspective4. Discounting principle5. Equi-marginal principle
1) Opportunity cost principle:
By the opportunity cost of a decision is meant the sacrifice of alternatives required by that decision.
For e.g.
a) The opportunity cost of the funds employed in one’s own business is the interest that could be earned on those funds if they have been employed in other ventures.
b) The opportunity cost of using a machine to produce one product is the earnings forgone which would have been possible from other products.
c) The opportunity cost of holding Rs. 1000as cash in hand for one year is the 10% rate of interest, which would have been earned had the money been kept as fixed deposit in bank.
Its clear now that opportunity cost requires ascertainment of sacrifices. If a decision involves no sacrifices, its opportunity cost is nil. For decision making opportunity costs are the only relevant costs.
2) Incremental principle:
It is related to the marginal cost and marginal revenues, for economic theory. Incremental concept involves estimating the impact of decision alternatives on costs and revenue, emphasizing the changes in total cost and total revenue resulting from changes in prices, products, procedures, investments or whatever may be at stake in the decisions.
The two basic components of incremental reasoning are
1. Incremental cost2. Incremental Revenue
The incremental principle may be stated as under:
“A decision is obviously a profitable one if –
it increases revenue more than costs it decreases some costs to a greater extent than it increases others it increases some revenues more than it decreases others and it reduces cost more than revenues”
3) Principle of Time Perspective
Managerial economists are also concerned with the short run and the long run effects of decisions on revenues as well as costs. The very important problem in decision making is to maintain the right balance between the long run and short run considerations.
For example;
Suppose there is a firm with a temporary idle capacity. An order for 5000 units comes to management’s attention. The customer is willing to pay Rs 4/- unit or Rs.20000/- for the whole lot but not more. The short run incremental cost(ignoring the fixed cost) is only Rs.3/-. There fore the contribution to overhead and profit is Rs.1/- per unit (Rs.5000/- for the lot)
Analysis:
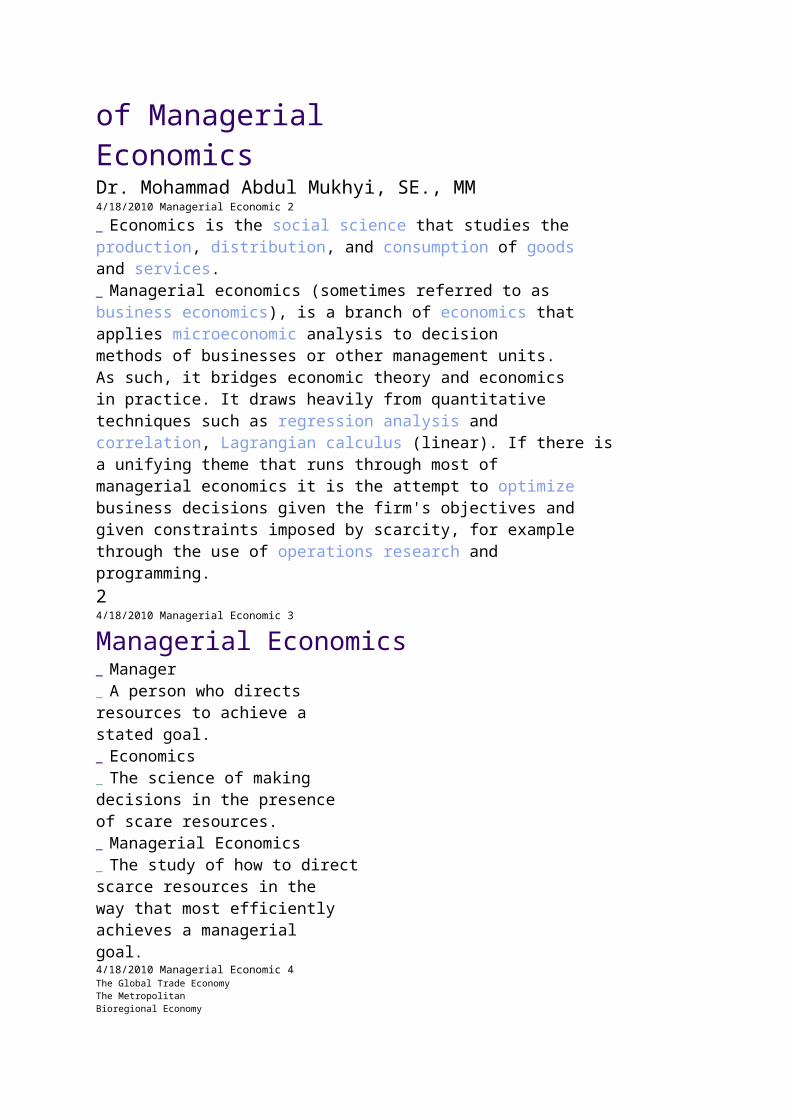
From the above example the following long run repercussion of the order is to be taken into account:
1) If the management commits itself with too much of business at lower price or with a small contribution it will not have sufficient capacity to take up business with higher contribution.
2) If the other customers come to know about this low price, they may demand a similar low price. Such customers may complain of being treated unfairly and feel discriminated against.
In the above example it is therefore important to give due consideration to the time perspectives. “a decision should take into account both the short run and long run effects on revenues and costs and maintain the right balance between long run and short run perspective”.
4) Discounting Principle:
One of the fundamental ideas in Economics is that a rupee tomorrow is worth less than a rupee today. Suppose a person is offered a choice to make between a gift of Rs.100/- today or Rs.100/- next year. Naturally he will chose Rs.100/- today. This is true for two reasons-
i) The future is uncertain and there may be uncertainty in getting Rs. 100/- if the present opportunity is not availed of
ii) Even if he is sure to receive the gift in future, today’s Rs.100/- can be invested so as to earn interest say as 8% so that one year after Rs.100/- will become 108
5) Equi – marginal Principle:
This principle deals with the allocation of an available resource among the alternative activities. According to this principle, an input should be so allocated that the value added by the last unit is the same in all cases. This generalization is called the equi-marginal principle.
Suppose, a firm has 100 units of labor at its disposal. The firm is engaged in four activities which need labors services, viz, A,B,C and D. it can enhance any one of these activities by adding more labor but only at the cost of other activities.
Related posts:
1. Introduction to Managerial Economics2. Demand Forecasting in Managerial Economics3. Concept of Demand in Managerial Economics4. Steps in rational decision making5. Decision-making: Meaning and it’s characteristics6. The Micro Economics and Macro Economics7. Economics of the Foreign Exchange Market8. Significance of Money in modern economic life9. Important Banking and Economic Indicators10. Implementation of New Economic Policy to Indian economy in 1991
Recommended Articles
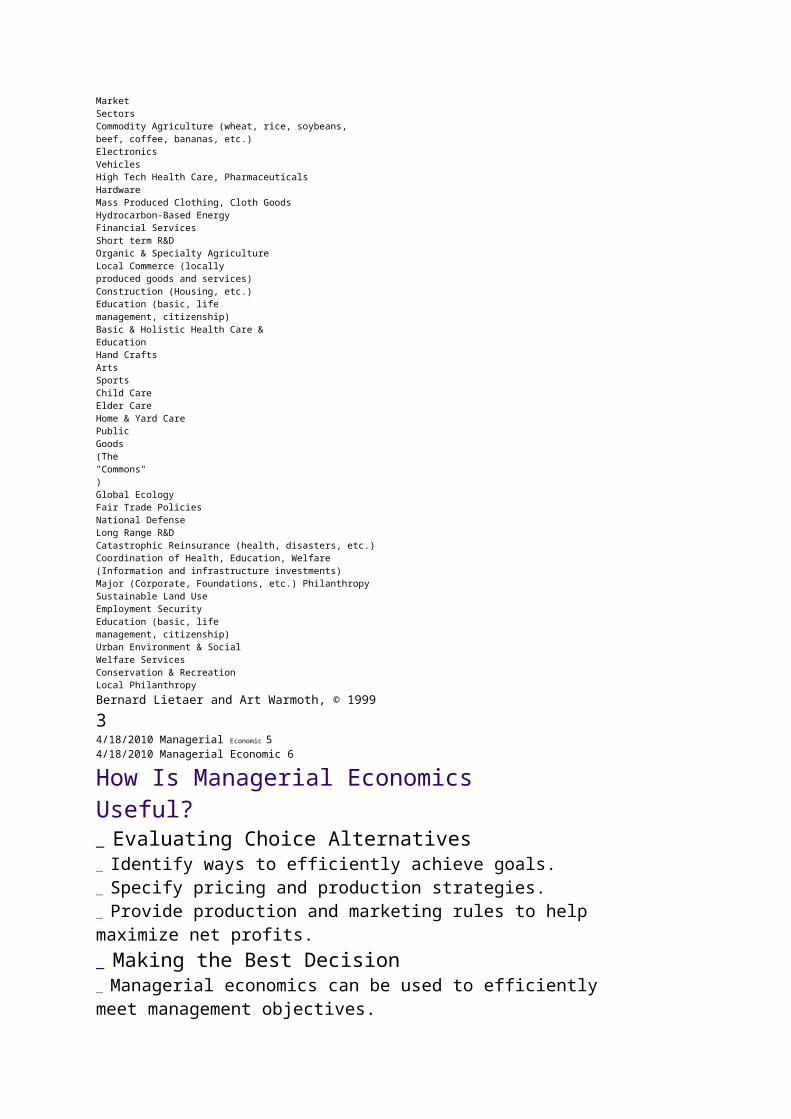
Techniques of Demand Forecasting Steps in Demand Forecasting Demand Forecasting in Managerial Economics The concept of Supply Law of demand Types of Demand Concept of Demand in Managerial Economics The Micro Economics and Macro Economics Introduction to Managerial Economics Interest Rate as an Effective Tool for Regulating the Economy
Uncertainty principles in risk finance
Document Information:
Title: Uncertainty principles in risk finance
Author(s): Michael R. Powers, (Temple University, Philadelphia, Pennsylvania, USA)
Citation: Michael R. Powers, (2010) "Uncertainty principles in risk finance", Journal of Risk Finance, The, Vol. 11 Iss: 3, pp.245 - 248
Keywords: Discounts, Insurance, Loss, Risk assessment, Uncertainty management
Article type: Viewpoint
DOI: 10.1108/15265941011043620 (Permanent URL)
Publisher: Emerald Group Publishing Limited
Abstract: Purpose – The purpose of this editorial is to consider the existence and implications of epistemological constraints in the field of risk finance arising from statistical inequalities similar
to the Cramér-Rao lower bound (CRLB) of statistical estimation theory and the Heisenberg uncertainty principle (HUP) of quantum physics.
Design/methodology/approach – The conceptual equivalence of the CRLB to the HUP suggests that certain statistical inequalities in the field of risk finance might imply practical
constraints on knowledge analogous to those encountered in the measurement of subatomic particles. To explore this possibility, the editorial first considers the tradeoff between the
variability of an estimator and the variability of the score of the associated joint probability distribution, and then interpret the latter quantity in a manner permitting the identification of
real-world counterparts.
Findings – Under certain simple assumptions, the editorial finds that the estimation of two fundamental actuarial quantities of property-liability insurance – the expected individual loss
amount and the expected discounted total claim payments – is subject to a type of uncertainty principle in that a high degree of accuracy in measuring one quantity implies a low degree of accuracy in measuring the other, and vice versa. Since the principle holds in the limit only as
one, but not both, of the two quantities is measured with certainty, the editorial characterizes it as a semi-uncertainty principle. This principle is likely to result in certain economic behaviors by
insurance companies that may be verified empirically.
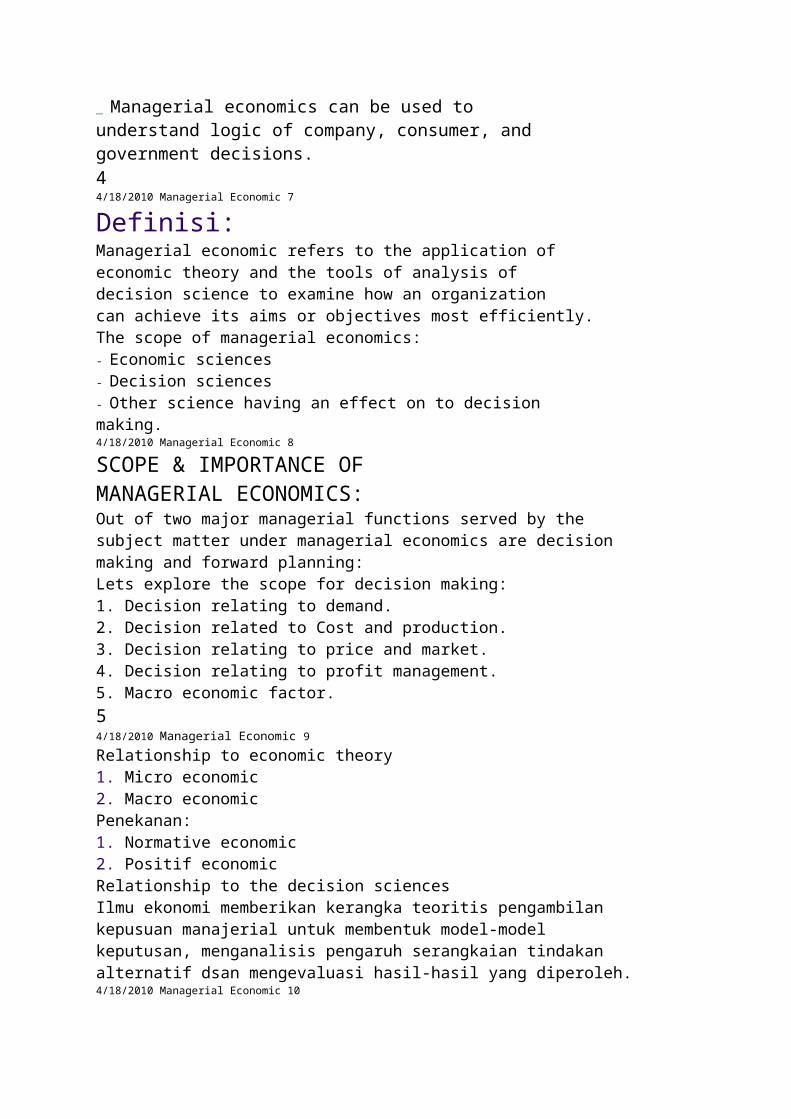
Originality/value – The editorial provides a concrete example of two-financial quantities whose estimation is governed by a type of uncertainty principle similar to Heisenbergs.
Scarcity Principle
Explanations > Theories > Scarcity PrincipleDescription | Research | Example | So What? | See also | References
DescriptionIn our need to control our world, being able to choose is an important freedom. If something becomes scarce, we anticipate possible regret that we did not acquire it, and so we desire it more. This desire is increased further if we think that someone else might get it and hence gain social position that we might have had.
ResearchStephen Worchel and colleagues offered subjects cookies in a jar. One jar had ten cookies in and the other jar had two. Subjects preferred the cookies from the jar with two in, even though they were the same cookies.
ExampleThe scarcity principle is used in sales, with ‘sale ends today’ (scarcity of time), ‘whilst stock last’ (scarcity of product) and so on.
So what?
Using itIntimate that what you want the other person to choose is only going to available for a limited time and that there may not be many left in any case. Hint of other people waiting in the wings to for the chance to get it.
In romance and in business, play hard to get. Make it seem like your time is precious.
DefendingWhen something is scarce, thing about whether you really want it. If you keep buying things you do not want, you money will be scarce instead, which is probably worse
See alsoSocial Comparison Theory, Reactance Theory
ReferencesWorchel
Brehm (1966), Worchel, Lee and Adewole (1975), Cialdini (1993)
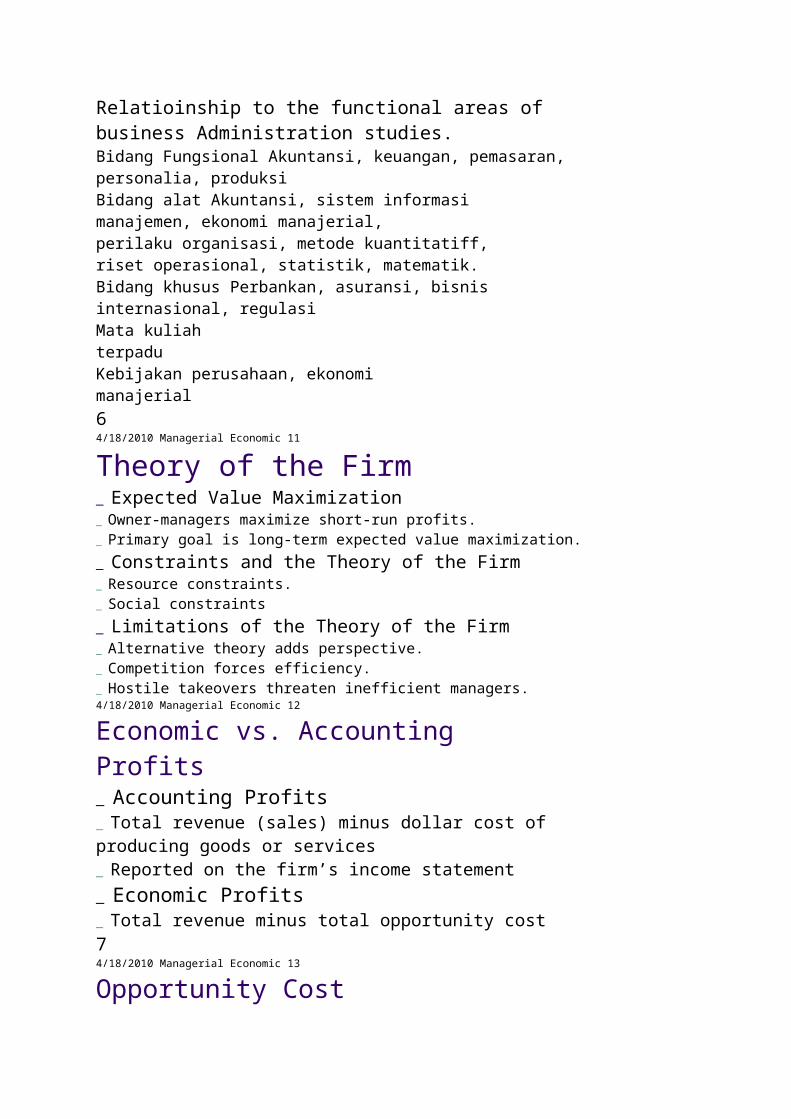
MarginalismFrom Wikipedia, the free encyclopedia
Jump to: navigation, search
Economics
Economies by region [show]
General categories
Microeconomics · Macroeconomics
History of economic thought
Methodology · Heterodox approaches
Methods
Econometrics · Experimental · Game
theory
Mathematical · Optimization · Statistics
Fields and subfields
Behavioral · Cultural · Evolutionary
Growth · Development · History
International · Economic systems
Monetary and Financial economics
Public and Welfare economics
Health · Education · Welfare
Population · Labour · Managerial
Business · Information
Industrial organization · Law
Agricultural · Natural resource
Environmental · Ecological
Urban · Rural · Regional · Geography
Lists
Journals · Publications
Categories · Topics · EconomistsEconomic ideologies [show]
The economy: concept and history
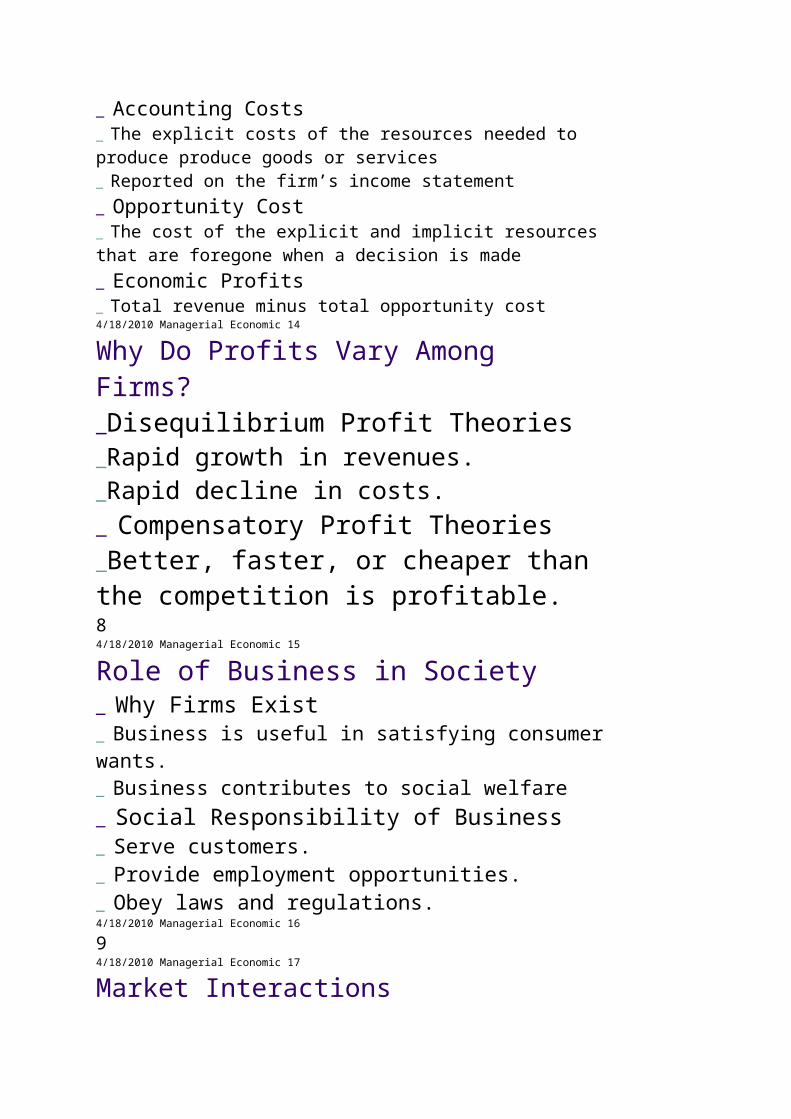
Business and Economics Portal
This box: view • talk • edit
Marginalism refers to the use of marginal concepts in economic theory. Marginalism is associated with arguments concerning changes in the quantity used of a good or of a service, as opposed to some notion of the over-all significance of that class of good or service, or of some total quantity thereof.
The central concept of marginalism proper is that of marginal utility, but marginalists following the lead of Alfred Marshall were further heavily dependent upon the concept of marginal physical productivity in their explanation of cost; and the neoclassical tradition that emerged from British marginalism generally abandoned the concept of utility and gave marginal rates of substitution a more fundamental role in analysis.
Marginalism is now an integral part of mainstream economic theory.
Contents[hide]
1 Important marginal conceptso 1.1 Marginalityo 1.2 Marginal useo 1.3 Marginal utility
1.3.1 Quantified marginal utility 1.3.2 The “law” of diminishing marginal utility
o 1.4 Marginal rate of substitutiono 1.5 Marginal cost
2 Application to price theoryo 2.1 Demando 2.2 Supplyo 2.3 Marketso 2.4 The paradox of water and diamonds
3 Historyo 3.1 Proto-marginalist approacheso 3.2 Marginalists before the Revolutiono 3.3 The Marginal Revolution
3.3.1 The second generation 3.3.2 The Marginal Revolution and Marxism
o 3.4 Eclipseo 3.5 Revival
4 Criticisms of marginalismo 4.1 Marxist attacks on marginalismo 4.2 Marxist adaptations to marginalism
5 References 6 External links
[edit] Important marginal concepts
[edit] MarginalityConstraints are conceptualized as a border or margin.[1] The location of the margin for any individual corresponds to his or her endowment, broadly conceived to include opportunities. This endowment is determined by many things including physical laws (which constrain how forms of energy and matter may be transformed), accidents of nature (which determine the presence of natural resources), and the outcomes of past decisions made both by others and by the individual himself or herself.
A value that holds true given particular constraints is a marginal value. A change that would be affected as or by a specific loosening or tightening of those constraints is a marginal change.
Neoclassical economics usually assumes that marginal changes are infinitesimals or limits. (Though this assumption makes the analysis less robust, it increases tractability.) One is therefore often told that “marginal” is synonymous with “very small”, though in more general analysis this may not be operationally true (and would not in any case be literally true). Frequently, economic analysis concerns the marginal values associated with a change of one
unit of a resources, because decisions are often made in terms of units; marginalism seeks to explain unit prices in terms of such marginal values.
[edit] Marginal useMain article: Marginal use
The marginal use of a good or service is the specific use to which an agent would put a given increase, or the specific use of the good or service that would be abandoned in response to a given decrease.[2]
Marginalism assumes, for any given agent, economic rationality and an ordering of possible states-of-the-world, such that, for any given set of constraints, there is an attainable state which is best in the eyes of that agent. Descriptive marginalism asserts that choice amongst the specific means by which various anticipated specific states-of-the-world (outcomes) might be affected is governed only by the distinctions amongst those specific outcomes; prescriptive marginalism asserts that such choice ought to be so governed.
On such assumptions, each increase would be put to the specific, feasible, previously unrealized use of greatest priority, and each decrease would result in abandonment of the use of lowest priority amongst the uses to which the good or service had been put.[2]
[edit] Marginal utilityMain article: Marginal utility
The marginal utility of a good or service is the utility of its marginal use. Under the assumption of economic rationality, it is the utility of its least urgent possible use from the best feasible combination of actions in which its use is included.
In 20th century mainstream economics, the term “utility” has come to be formally defined as a quantification capturing preferences by assigning greater quantities to states, goods, services, or applications that are of higher priority. But marginalism and the concept of marginal utility predate the establishment of this convention within economics. The more general conception of utility is that of use or usefulness, and this conception is at the heart of marginalism; the term “marginal utility” arose from translation of the German “Grenznutzen”,[2][3] which literally means border use, referring directly to the marginal use, and the more general formulations of marginal utility do not treat quantification as an essential feature.[4] On the other hand, none of the early marginalists insisted that utility were not quantified,[5][6] some indeed treated quantification as an essential feature, and those who did not still used an assumption of quantification for expository purposes. In this context, it is not surprising to find many presentations that fail to recognize a more general approach.
[edit] Quantified marginal utilityUnder the special case in which usefulness can be quantified, the change in utility of moving from state S1 to state S2 is
Moreover, if S1 and S2 are distinguishable by values of just one variable which is itself quantified, then it becomes possible to speak of the ratio of the marginal utility of the change in to the size of that change:
(where “c.p.” indicates that the only independent variable to change is ).
Mainstream neoclassical economics will typically assume that
is well defined, and use “marginal utility” to refer to a partial derivative
[edit] The “law” of diminishing marginal utilityThe “law” of diminishing marginal utility (also known as a “Gossen's First Law”) is that, ceteris paribus, as additional amounts of a good or service are added to available resources, their marginal utilities are decreasing. This “law” is sometimes treated as a tautology, sometimes as something proven by introspection, or sometimes as a mere instrumental assumption, adopted only for its perceived predictive efficacy. Actually, it is not quite any of these things, though it may have aspects of each. The “law” does not hold under all circumstances, so it is neither a tautology nor otherwise proveable; but it has a basis in prior observation.
An individual will typically be able to partially order the potential uses of a good or service. If there is scarcity, then a rational agent will satisfy wants of highest possible priority, so that no want is avoidably sacrificed to satisfy a want of lower priority. In the absence of complementarity across the uses, this will imply that the priority of use of any additional amount will be lower than the priority of the established uses, as in this famous example:
A pioneer farmer had five sacks of grain, with no way of selling them or buying more. He had five possible uses: as basic feed for himself, food to build strength, food for his chickens for dietary variation, an ingredient for making whisky and feed for his parrots to amuse him. Then the farmer lost one sack of grain. Instead of reducing every activity by a fifth, the farmer simply starved the parrots as they were of less utility than the other four uses; in other words they were on the margin. And it is on the margin, and not with a view to the big picture, that we make economic decisions.[7]
Diminishing marginal utility, given quantification
However, if there is a complementarity across uses, then an amount added can bring things past a desired tipping point, or an amount subtracted cause them to fall short. In such cases, the marginal utility of a good or service might actually be increasing.
Without the presumption that utility is quantified, the diminishing of utility should not be taken to be itself an arithmetic subtraction. It is the movement from use of higher to lower priority, and may be no more than a purely ordinal change.[4][8]
When quantification of utility is assumed, diminishing marginal utility corresponds to a utility function whose slope is continually or continuously decreasing. In the latter case, if the function is also smooth, then the “law” may be expressed
Neoclassical economics usually supplements or supplants discussion of marginal utility with indifference curves, which were originally derived as the level curves of utility functions,[9] or can be produced without presumption of quantification,[4] but are often simply treated as axiomatic. In the absence of complementarity of goods or services, diminishing marginal utility implies convexity of indifference curves[4][9] (though such convexity would also follow from quasiconcavity of the utility function).
[edit] Marginal rate of substitutionMain article: Marginal rate of substitution
The rate of substitution is the least favorable rate at which an agent is willing to exchange units of one good or service for units of another. The marginal rate of substitution (“MRS”) is the rate of substitution at the margin — in other words, given some constraint(s).
When goods and services are discrete, the least favorable rate at which an agent would trade A for B will usually be different from that at which she would trade B for A:
But, when the goods and services are continuously divisible, in the limiting case
and the marginal rate of substitution is the slope of the indifference curve (multiplied by − 1).
If, for example, Lisa will not trade a goat for anything less than two sheep, then her
And if she will not trade a sheep for anything less than two goats, then her
But if she would trade one gram of banana for one ounce of ice cream and vice versa, then
When indifference curves (which are essentially graphs of instantaneous rates of substitution) and the convexity of those curves are not taken as given, the “law” of diminishing marginal utility is invoked to explain diminishing marginal rates of substitution — a willingness to accept fewer units of good or service A in substitution for B as one's holdings of A grow relative to those of B. If an individual has a stock or flow of a good or service whose marginal utility is less than would be that of some other good or service for which he or she could trade, then it is in his or her interest to effect that trade. Of course, as one thing is traded-away and another is acquired, the respective marginal gains or losses from further trades are now changed. On the assumption that the marginal utility of one is diminishing, and the other is not increasing, all else being equal, an individual will demand an increasing ratio of that which is acquired to that which is sacrificed. (One important way in which all else might not be equal is when the use of the one good or service complements that of the other. In such cases, exchange ratios might be constant.[4]) If any trader can better his or her own marginal position by offering an exchange more favorable to other traders with desired goods or services, then he or she will do so.
[edit] Marginal costMain article: Marginal cost
At the highest level of generality, a marginal cost is a marginal opportunity cost. In most contexts, however, “marginal cost” will refer to marginal pecuniary cost — that is to say marginal cost measured by forgone money.
A thorough-going marginalism sees marginal cost as increasing under the “law” of diminishing marginal utility, because applying resources to one application reduces their
availability to other applications. Neoclassical economics tends to disregard this argument, but to see marginal costs as increasing in consequence of diminishing returns.
[edit] Application to price theoryMarginalism and neoclassical economics typically explain price formation broadly through the interaction of curves or schedules of supply and demand. In any case buyers are modelled as pursuing typically lower quantities, and sellers offering typically higher quantities, as price is increased, with each being willing to trade until the marginal value of what they would trade-away exceeds that of the thing for which they would trade.
[edit] DemandDemand curves are explained by marginalism in terms of marginal rates of substitution.
At any given price, a prospective buyer has some marginal rate of substitution of money for the good or service in question. Given the “law” of diminishing marginal utility, or otherwise given convex indifference curves, the rates are such that the willingness to forgo money for the good or service decreases as the buyer would have ever more of the good or service and ever less money. Hence, any given buyer has a demand schedule that generally decreases in response to price (at least until quantity demanded reaches zero). The aggregate quantity demanded by all buyers is, at any given price, just the sum of the quantities demanded by individual buyers, so it too decreases as price increases.
[edit] SupplyBoth neoclassical economics and thorough-going marginalism could be said to explain supply curves in terms of marginal cost; however, there are markèd differences in conceptions of that cost.
Marginalists in the tradition of Marshall and neoclassical economists tend to represent the supply curve for any producer as a curve of marginal pecuniary costs objectively determined by physical processes, with an upward slope determined by diminishing returns.
A more thorough-going marginalism represents the supply curve as a complementary demand curve — where the demand is for money and the purchase is made with a good or service.[10] The shape of that curve is then determined by marginal rates of substitution of money for that good or service.
[edit] MarketsBy confining themselves to limiting cases in which sellers or buyers are both “price takers” — so that demand functions ignore supply functions or vice versa — Marshallian marginalists and neoclassical economists produced tractable models of “pure” or “perfect” competition and of various forms of “imperfect” competition, which models are usually captured by relatively simple graphs. Other marginalists have sought to present more realistic explanations,[11][12] but this work has been relatively uninfluential on the mainstream of economic thought.
[edit] The paradox of water and diamondsMain article: Paradox of value
The “law” of diminishing marginal utility is said to explain the “paradox of water and diamonds”, most commonly associated with Adam Smith[13] (though recognized by earlier
thinkers).[14] Human beings cannot even survive without water, whereas diamonds were in Smith's day mere ornamentation or engraving bits. Yet water had a very small price, and diamonds a very large price, by any normal measure. Marginalists explained that it is the marginal usefulness of any given quantity that matters, rather than the usefulness of a class or of a totality. For most people, water was sufficiently abundant that the loss or gain of a gallon would withdraw or add only some very minor use if any; whereas diamonds were in much more restricted supply, so that the lost or gained use were much greater.
That is not to say that the price of any good or service is simply a function of the marginal utility that it has for any one individual nor for some ostensibly typical individual. Rather, individuals are willing to trade based upon the respective marginal utilities of the goods that they have or desire (with these marginal utilities being distinct for each potential trader), and prices thus develop constrained by these marginal utilities.
[edit] History
This section requires expansion.
[edit] Proto-marginalist approachesPerhaps the essence of a notion of diminishing marginal utility can be found in Aristotle's Politics, whereïn he writes
external goods have a limit, like any other instrument, and all things useful are of such a nature that where there is too much of them they must either do harm, or at any rate be of no use[15]
(There has been markèd disagreement about the development and role of marginal considerations in Aristotle's' value theory.[16][17][18][19][20])
A great variety of economists concluded that there was some sort of inter-relationship between utility and rarity that effected economic decisions, and in turn informed the determination of prices.[21]
Eighteenth-century Italian mercantilists, such as Antonio Genovesi, Giammaria Ortes, Pietro Verri, Marchese Cesare di Beccaria, and Count Giovanni Rinaldo Carli, held that value was explained in terms of the general utility and of scarcity, though they did not typically work-out a theory of how these interacted.[22] In Della moneta (1751), Abbé Ferdinando Galiani, a pupil of Genovesi, attempted to explain value as a ratio of two ratios, utility and scarcity, with the latter component ratio being the ratio of quantity to use.
Anne Robert Jacques Turgot, in Réflexions sur la formation et la distribution de richesse (1769), held that value derived from the general utility of the class to which a good belonged, from comparison of present and future wants, and from anticipated difficulties in procurement.
Like the Italian mercantists, Étienne Bonnot, Abbé de Condillac saw value as determined by utility associated with the class to which the good belong, and by estimated scarcity. In De commerce et le gouvernement (1776), Condillac emphasized that value is not based upon cost but that costs were paid because of value.
This last point was famously restated by the Nineteenth Century proto-marginalist, Richard Whately, who in Introductory Lectures on Political Economy (1832) wrote
It is not that pearls fetch a high price because men have dived for them; but on the contrary, men dive for them because they fetch a high price.[23]
(Whately's student Senior is noted below as an early marginalist.)
[edit] Marginalists before the RevolutionThe first unambiguous published statement of any sort of theory of marginal utility was by Daniel Bernoulli, in “Specimen theoriae novae de mensura sortis”.[24] This paper appeared in 1738, but a draft had been written in 1731 or in 1732.[25][26] In 1728, Gabriel Cramer produced fundamentally the same theory in a private letter.[27] Each had sought to resolve the St. Petersburg paradox, and had concluded that the marginal desirability of money decreased as it was accumulated, more specifically such that the desirability of a sum were the natural logarithm (Bernoulli) or square root (Cramer) thereof. However, the more general implications of this hypothesis were not explicated, and the work fell into obscurity.
In “A Lecture on the Notion of Value as Distinguished Not Only from Utility, but also from Value in Exchange”, delivered in 1833 and included in Lectures on Population, Value, Poor Laws and Rent (1837), William Forster Lloyd explicitly offered a general marginal utility theory, but did not offer its derivation nor elaborate its implications. The importance of his statement seems to have been lost on everyone (including Lloyd) until the early 20th century, by which time others had independently developed and popularized the same insight.[28]
In An Outline of the Science of Political Economy (1836), Nassau William Senior asserted that marginal utilities were the ultimate determinant of demand, yet apparently did not pursue implications, though some interpret his work as indeed doing just that.[29]
In “De la mesure de l’utilité des travaux publics” (1844), Jules Dupuit applied a conception of marginal utility to the problem of determining bridge tolls.[30]
In 1854, Hermann Heinrich Gossen published Die Entwicklung der Gesetze des menschlichen Verkehrs und der daraus fließenden Regeln für menschliches Handeln, which presented a marginal utility theory and to a very large extent worked-out its implications for the behavior of a market economy. However, Gossen's work was not well received in the Germany of his time, most copies were destroyed unsold, and he was virtually forgotten until rediscovered after the so-called Marginal Revolution.
[edit] The Marginal RevolutionMarginalism eventually found a foot-hold by way of the work of three economists, Jevons in England, Menger in Austria, and Walras in Switzerland.
William Stanley Jevons first proposed the theory in “A General Mathematical Theory of Political Economy” (PDF), a little-noticed paper delivered in 1862 and published in 1863. He later presented the theory in The Theory of Political Economy (1871), which was fairly widely read but not much appreciated. Jevons' conception of utility was that in the hedonic tradition of Jeremy Bentham and of John Stuart Mill, and Jevons explained demand but not supply by reference to marginal utility.
Carl Menger presented the theory in Grundsätze der Volkswirtschaftslehre (translated as Principles of Economics PDF ) in 1871. Menger's presentation is peculiarly notable on two points. First, he took special pains to explain why individuals should be expected to rank possible uses and then to use marginal utility to decide amongst trade-offs. (For this reason, Menger and his followers are sometimes called “the Psychological School”, though they are more frequently known as “the Austrian School” or as “the Vienna School”.) Second, while his illustrative examples present utility as quantified, his essential assumptions do not.[8] Menger's work found a significant and appreciative audience.
Marie-Esprit-Léon Walras introduced the theory in Éléments d'économie politique pure, the first part of which was published in 1874. Walras's work found relatively few readers.
(An American, John Bates Clark, is sometimes also mentioned in this context. But, while Clark independently arrived at a marginal utility theory, he did little to advance it until it was clear that the followers of Jevons, Menger, and Walras were revolutionizing economics. Nonetheless, his contributions thereafter were profound.)
[edit] The second generationAlthough the Marginal Revolution flowed from the work of Jevons, Menger, and Walras, their work might have failed to enter the mainstream were it not for a second generation of economists. In England, the second generation were exemplified by Philip Henry Wicksteed, by William Smart, and by Alfred Marshall; in Austria by Eugen von Böhm-Bawerk and by Friedrich von Wieser; in Switzerland by Vilfredo Pareto; and in America by Herbert Joseph Davenport and by Frank A. Fetter.
There were significant, distinguishing features amongst the approaches of Jevons, Menger, and Walras, but the second generation did not maintain distinctions along national or linguistic lines. The work of von Wieser was heavily influenced by that of Walras. Wicksteed was heavily influenced by Menger. Fetter referred to himself and Davenport as part of “the American Psychological School”, named in imitation of the Austrian “Psychological School”. (And Clark's work from this period onward similarly shows heavy influence by Menger.) William Smart began as a conveyor of Austrian School theory to English-language readers, though he fell increasingly under the influence of Marshall.[31]
Böhm-Bawerk was perhaps the most able expositor of Menger's conception.[31][32] He was further noted for producing a theory of interest and of profit in equilibrium based upon the interaction of diminishing marginal utility with diminishing marginal productivity of time and with time preference.[7] (This theory was adopted in full and then further developed by Knut Wicksell[33] and, with modifications including formal disregard for time-preference, by Wicksell's American rival Irving Fisher.[34])
Marshall was the second-generation marginalist whose work on marginal utility came most to inform the mainstream of neoclassical economics, especially by way of his Principles of Economics, the first volume of which was published in 1890. Marshall constructed the demand curve with the aid of assumptions that utility was quantified, and that the marginal utility of money was constant (or nearly so). Like Jevons, Marshall did not see an explanation for supply in the theory of marginal utility, so he synthesized an explanation of demand thus explained with supply explained in a more classical manner, determined by costs which were taken to be objectively determined. (Marshall later actively mischaracterized the criticism that these costs were themselves ultimately determined by marginal utilities.[10])
[edit] The Marginal Revolution and MarxismThe doctrines of marginalism and the Marginal Revolution are often interpreted as somehow a response to Marxist economics.[35] In fact, the first volume of Das Kapital was not published until July 1867, after the works of Jevons, Menger, and Walras were written or well under way; and Marx was still a relatively obscure figure when these works were completed. (On the other hand, Hayek or Bartley has suggested that Marx may have come across the works of one or more of these figures, and that his inability to formulate a viable critique may account for his failure to complete any further volumes of Kapital.[36])
Nonetheless, it is not unreasonable to suggest that part of what contributed to the success of the generation who followed the preceptors of the Revolution was their ability to formulate straight-forward responses to Marxist economic theory.[35] The most famous of these was that of Böhm-Bawerk, “Zum Abschluss des Marxschen Systems” (1896),[37] but the first was Wicksteed's “The Marxian Theory of Value. Das Kapital: a criticism” (1884,[38] followed by “The Jevonian criticism of Marx: a rejoinder” in 1885[39]). The most famous early Marxist responses were Rudolf Hilferding's Böhm-Bawerks Marx-Kritik (1904)[40] and Политической экономии рантье (The Economic Theory of the Leisure Class, 1914) by Никола́й Ива́нович Буха́рин (Nikolai Bukharin).[41]
(It might also be noted that some followers of Henry George similarly consider marginalism and neoclassical economics a reaction to Progress and Poverty, which was published in 1879.[42])
[edit] EclipseIn his 1881 work Mathematical Psychics, Francis Ysidro Edgeworth presented the indifference curve, deriving its properties from marginalist theory which assumed utility to be a differentiable function of quantified goods and services. But it came to be seen that indifference curves could be considered as somehow given, without bothering with notions of utility.
In 1915, Евгений Евгениевич Слуцкий (Eugen Slutsky) derived a theory of consumer choice solely from properties of indifference curves.[43] Because of the World War, the Bolshevik Revolution, and his own subsequent loss of interest, Slutsky's work drew almost no notice, but similar work in 1934 by John Richard Hicks and R. G. D. Allen[44] derived much the same results and found a significant audience. (Allen subsequently drew attention to Slutksy's earlier accomplishment.)
Although some of the third generation of Austrian School economists had by 1911 rejected the quantification of utility while continuing to think in terms of marginal utility,[45] most economists presumed that utility must be a sort of quantity. Indifference curve analysis seemed to represent a way of dispensing with presumptions of quantification, albeït that a seemingly arbitrary assumption (admitted by Hicks to be a “rabbit out of a hat”[46]) about decreasing marginal rates of substitution[47] would then have to be introduced to have convexity of indifference curves.
For those who accepted that superseded marginal utility analysis had been superseded by indifference curve analysis, the former became at best somewhat analogous to the Bohr model of the atom — perhaps pedagogically useful, but “old fashioned” and ultimately incorrect.[47][48]

[edit] RevivalWhen Cramer and Bernoulli introduced the notion of diminishing marginal utility, it had been to address a paradox of gambling, rather than the paradox of value. The marginalists of the revolution, however, had been formally concerned with problems in which there was neither risk nor uncertainty. So too with the indifference curve analysis of Slutsky, Hicks, and Allen.
The expected utility hypothesis of Bernoulli et alii was revived by various 20th century thinkers, perhaps most notably Ramsey (1926),[49] v. Neumann and Morgenstern (1944),[50] and Savage (1954).[51] Although this hypothesis remains controversial, it brings not merely utility but a quantified conception thereof back into the mainstream of economic thought, and would dispatch the Ockhamistic argument.[48] (It should perhaps be noted that, in expected utility analysis, the “law” of diminishing marginal utility corresponds to what is called “risk aversion”.)
Meanwhile, the Austrian School continues to develop its ordinalist notions of marginal utility analysis, formally demonstrating that from them proceed the decreasing marginal rates of substitution of indifference curves.[4]
[edit] Criticisms of marginalismMarginalism has been criticised for being extremely abstract, as “unobservable, unmeasurable and untestable”.[52] Marginal utility is subjective, as the value of an additional unit of consumption is based on the individual's circumstances. However, margins (constraints) are often observable, as are patterns of choice; hence the general form of marginalism is in theory observable and testable. The special case of quantification of utility is more problematic, but the expected utility hypothesis represents a testable version of the theory with quantification. (Nonetheless, though confirmation of the expected utility hypothesis might have confirm quantification, the specific measure would not thus be found, as data that were fit by any proposed measure would be equally well fit by any affine transformation of that proposed measure.)
However, observed patterns of choice in test situations often seem not to correspond to an ordering, and the expected utility hypothesis has been falsified as description. (See the article on behavioral economics, and perhaps especially that on the Ellsberg paradox or that on the Allais problem.) Many behavioral economists argue that people often follow simple rules of thumb instead of engaging in a mental process of maximizing some function. The reply from some marginalist and neoclassical economists is that these rules of thumb have been shaped by experience so that they give very nearly the same result as maximizing and that, moreover, use of rules of thumb is itself an act of optimization insofar as the decision-making process itself entails direct costs.
The theory is attacked for downplaying the role of cost of production in price determination in favor of a focus on individual's tastes and preferences. In its most extreme Austrian School version, marginalism denies that a purely objective, cost-based component exists at all. Rather, the Austrian School argues that costs of production pervasively involve individual preferences for labor vs. leisure and saving vs. consumption.
[edit] Marxist attacks on marginalismMain article: Marxism
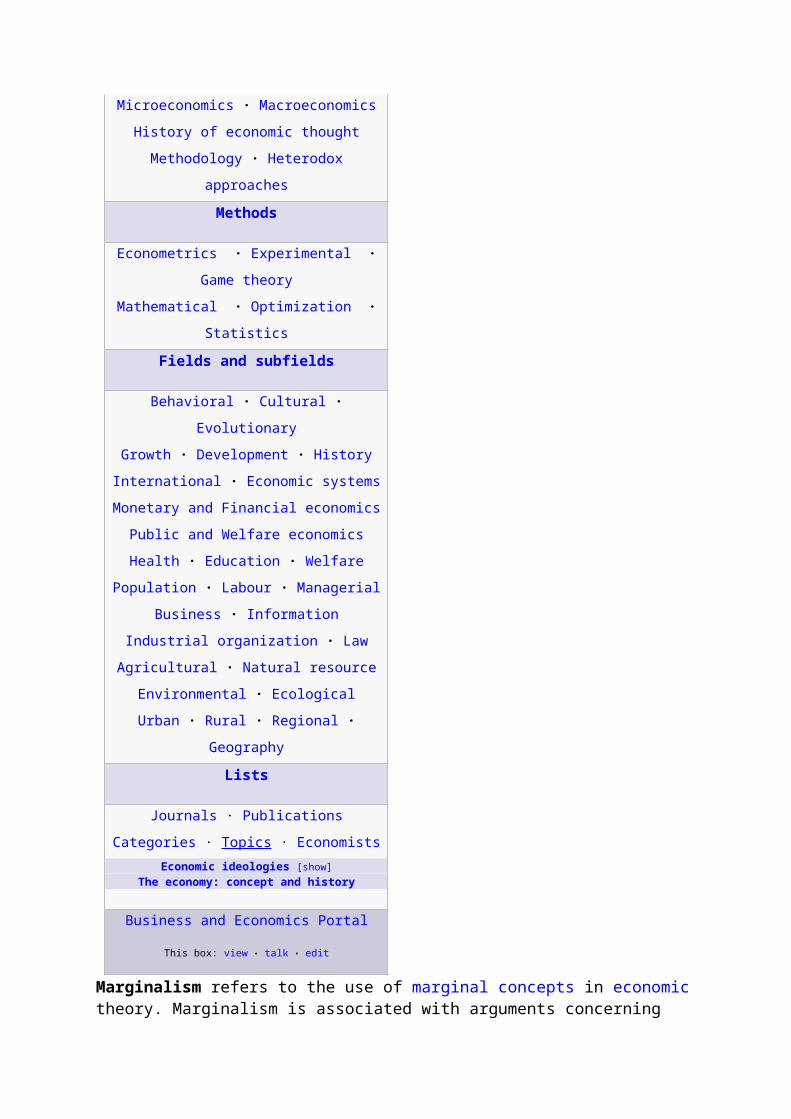
Karl Marx died before marginalism became the interpretation of economic value accepted by mainstream economics. His theory was based on the labor theory of value, which distinguishes between exchange value and use value. In his Capital he rejected the explanation of long-term market values by supply and demand:
Nothing is easier than to realize the inconsistencies of demand and supply, and the resulting deviation of market-prices from market-values. The real difficulty consists in determining what is meant by the equation of supply and demand.
[...]
If supply equals demand, they cease to act, and for this very reason commodities are sold at their market-values. Whenever two forces operate equally in opposite directions, they balance one another, exert no outside influence, and any phenomena taking place in these circumstances must be explained by causes other than the effect of these two forces. If supply and demand balance one another, they cease to explain anything, do not affect market-values, and therefore leave us so much more in the dark about the reasons why the market-value is expressed in just this sum of money and no other.[53]
In his early response to marginalism, Nikolai Bukharin argued that "the subjective evaluation from which price is to be derived really starts from this price",[54] concluding:
Whenever the Böhm-Bawerk theory, it appears, resorts to individual motives as a basis for the derivation of social phenomena, he is actually smuggling in the social content in a more or less disguised form in advance, so that the entire construction becomes a vicious circle, a continuous logical fallacy, a fallacy that can serve only specious ends, and demonstrating in reality nothing more than the complete barrenness of modern bourgeois theory. [55]
Similarly a later Marxist critic, Ernest Mandel, argued that marginalism was "divorced from reality", ignored the role of production, and that:
It is, moreover, unable to explain how, from the clash of millions of different individual "needs" there emerge not only uniform prices, but prices which remain stable over long periods, even under perfect conditions of free competition. Rather than an explanation of constants, and of the basic evolution of economic life, the "marginal" technique provides at best an explanation of ephemeral, short-term variations.[56]
Maurice Dobb argued that prices derived through marginalism depend on the distribution of income. The ability of consumers to express their preferences is dependent on their spending power. As the theory asserts that prices arise in the act of exchange, Dobb argues that it cannot explain how the distribution of income affects prices and consequently cannot explain prices.[57]
Dobb also criticized the motives behind marginal utility theory. Jevons wrote, for example, "so far as is consistent with the inequality of wealth in every community, all commodities are distributed by exchange so as to produce the maximum social benefit." (See Fundamental theorems of welfare economics.) Dobb contended that this statement indicated that marginalism is intended to insulate market economics from criticism by making prices the natural result of the given income distribution.[57]
[edit] Marxist adaptations to marginalismSome economists strongly influenced by the Marxian tradition such as Oskar Lange, Włodzimierz Brus, and Michal Kalecki have attempted to integrate the insights of classical political economy, marginalism, and neoclassical economics. They believed that Marx lacked a sophisticated theory of prices, and neoclassical economics lacked a theory of the social frameworks of economic activity. Some other Marxists have also argued that on one level there is no conflict between marginalism and Marxism: one could employ a marginalist theory of supply and demand within the context of a “big picture” understanding of the Marxist notion that capitalists exploit labor.[58]
[edit] References
1. ^ Wicksteed, Philip Henry; The Common Sense of Political Economy (1910), Bk I Ch 2 and elsewhere.
2. ^ a b c von Wieser, Friedrich; Über den Ursprung und die Hauptgesetze des wirtschaftlichen Wertes [The Nature and Essence of Theoretical Economics] (1884), p. 128.
3. ^ von Wieser, Friedrich; Der natürliche Werth [Natural Value] (1889) , Bk I Ch V “Marginal Utility” (HTML).
4. ^ a b c d e f Mc Culloch, James Huston; “The Austrian Theory of the Marginal Use and of Ordinal Marginal Utility”, Zeitschrift für Nationalökonomie 37 (1973) #3&4 (September).
5. ^ Stigler, George Joseph; “The Development of Utility Theory” Journal of Political Economy (1950).
6. ^ Stigler, George Joseph; “The Adoption of Marginal Utility Theory” History of Political Economy (1972).
7. ^ a b Böhm-Bawerk, Eugen Ritter von; Kapital Und Kapitalizns. Zweite Abteilung: Positive Theorie des Kapitales (1889). Translated as Capital and Interest. II: Positive Theory of Capital with appendices rendered as Further Essays on Capital and Interest.
8. ^ a b Georgescu-Roegen, Nicholas; “Utility”, International Encyclopedia of the Social Sciences (1968).
9. ^ a b Edgeworth, Francis Ysidro; Mathematical Psychics (1881).10. ^ a b Schumpeter, Joseph Alois; History of Economic Analysis (1954) Pt IV Ch 6 §4.11. ^ Mund, Vernon Arthur; Monopoly: A History and Theory (1933).12. ^ Mises, Ludwig Heinrich Edler von; Nationalökonomie: Theorie des Handelns und
Wirtschaftens (1940). (See also his Human Action . )13. ^ Smith, Adam; An Inquiry into the Nature and Causes of the Wealth of Nations (1776)
Chapter IV. “Of the Origin and Use of Money”.14. ^ Gordon, Scott (1991). "The Scottish Enlightenment of the eighteenth century". History and
Philosophy of Social Science: An Introduction. Routledge. ISBN 0-415-09670-7.15. ^ Aristotle, Politics, Bk 7 Chapter 1.16. ^ Soudek, Josef; “Aristotle's Theory of Exchange: An Inquiry into the Origin of Economic
Analysis”, Proceedings of the American Philosophical Society v 96 (1952) p 45-75.17. ^ Kauder, Emil; “Genesis of the Marginal Utility Theory from Aristotle to the End of the
Eighteenth Century”, Economic Journal v 63 (1953) p 638-50.18. ^ Gordon, Barry Lewis John; “Aristotle and the Development of Value Theory”, Quarterly
Journal of Economics v 78 (1964).19. ^ Schumpeter, Joseph Alois; History of Economic Analysis (1954) Part II Chapter 1 §3.20. ^ Meikle, Scott; Aristotle's Economic Thought (1995) Chapters 1, 2, & 6.21. ^ Přibram, Karl; A History of Economic Reasoning (1983).22. ^ Pribram, Karl; A History of Economic Reasoning (1983), Chapter 5 “Refined Mercantilism”,
“Italian Mercantilists”.
23. ^ Whately, Richard; Introductory Lectures on Political Economy, Being part of a course delivered in the Easter term (1832).
24. ^ Bernoulli, Daniel; “Specimen theoriae novae de mensura sortis” in Commentarii Academiae Scientiarum Imperialis Petropolitanae 5 (1738); reprinted in translation as “Exposition of a new theory on the measurement of risk” in Econometrica 22 (1954).
25. ^ Bernoulli, Daniel; letter of 4 July 1731 to Nicolas Bernoulli (excerpted in PDF).26. ^ Bernoulli, Nicolas; letter of 5 April 1732, acknowledging receipt of “Specimen theoriae
novae metiendi sortem pecuniariam” (excerpted in PDF).27. ^ Cramer, Garbriel; letter of 21 May 1728 to Nicolaus Bernoulli (excerpted in PDF).28. ^ Seligman, Edwin Robert Anderson; “On some neglected British economists”, Economic
Journal v. 13 (September 1903).29. ^ White, Michael V; “Diamonds Are Forever(?): Nassau Senior and Utility Theory” in The
Manchester School of Economic & Social Studies 60 (1992) #1 (March).30. ^ Dupuit, Jules; “De la mesure de l’utilité des travaux publics”, Annales des ponts et
chaussées, Second series, 8 (1844).31. ^ a b Salerno, Joseph T. 1999; “The Place of Mises’s Human Action in the Development of
Modern Economic Thought.” Quarterly Journal of Economic Thought v. 2 (1).32. ^ Böhm-Bawerk, Eugen Ritter von. “Grundzüge der Theorie des wirtschaftlichen
Güterwerthes”, Jahrbüche für Nationalökonomie und Statistik v 13 (1886). Translated as Basic Principles of Economic Value.
33. ^ Wicksell, Johan Gustaf Knut; Über Wert, Kapital unde Rente (1893). Translated as Value, Capital and Rent .
34. ^ Fisher, Irving; Theory of Interest (1930).35. ^ a b Screpanti, Ernesto, and Stefano Zamagni; An Outline of the History of Economic Thought
(1994).36. ^ Hayek, Friedrich August von, with William Warren Bartley III; The Fatal Conceit: The
Errors of Socialism (1988) p150.37. ^ Böhm-Bawerk, Eugen Ritter von; “Zum Abschluss des Marxschen Systems” [“On the
Closure of the Marxist System”], Staatswiss. Arbeiten. Festgabe für K. Knies (1896).38. ^ Wicksteed, Philip Henry; “Das Kapital: A Criticism”, To-day 2 (1884) p. 388-409.39. ^ Wicksteed, Philip Henry; “The Jevonian criticism of Marx: a rejoinder”, To-day 3 (1885) p.
177-9.40. ^ Hilferding, Rudolf; Böhm-Bawerks Marx-Kritik (1904). Translated as Böhm-Bawerk's
Criticism of Marx.41. ^ Буха́рин, Никола́й Ива́нович (Nikolai Ivanovich Bukharin); Политической
экономии рантье (1914). Translated as The Economic Theory of the Leisure Class.42. ^ Gaffney, Mason, and Fred Harrison; The Corruption of Economics (1994).43. ^ Слуцкий, Евгений Евгениевич (Slutsky, Eugen E.); “Sulla teoria del bilancio del
consumatore”, Giornale degli Economisti 51 (1915).44. ^ Hicks, John Richard, and Roy George Douglas Allen; “A Reconsideration of the Theory of
Value”, Economica 54 (1934).45. ^ von Mises, Ludwig Heinrich; Theorie des Geldes und der Umlaufsmittel (1912).46. ^ Hicks, Sir John Richard; Value and Capital, Chapter I. “Utility and Preference” §8, p23 in the
2nd edition.47. ^ a b Hicks, Sir John Richard; Value and Capital, Chapter I. “Utility and Preference” §7-8.48. ^ a b Samuelson, Paul Anthony; “Complementarity: An Essay on the 40th Anniversary of the
Hicks-Allen Revolution in Demand Theory”, Journal of Economic Literature vol 12 (1974).49. ^ Ramsey, Frank Plumpton; “Truth and Probability” (PDF), Chapter VII in The Foundations of
Mathematics and other Logical Essays (1931).50. ^ von Neumann, John and Oskar Morgenstern; Theory of Games and Economic
Behavior (1944).
51. ^ Savage, Leonard Jimmie; Foundations of Statistics (1954).52. ^ anonymous; “Phases of the Marginalist Revolution” at the New School.53. ^ Marx, Karl; Capital v. III pt. II ch. 10 .54. ^ Nikolai Bukharin (1914) The Economic Theory of the Leisure Class, Chapter 3, Section 2.[1].55. ^ Nicholai Bukharin (1914) The Economic Theory of the Leisure Class, Chapter 3, Section 6.
[2].56. ^ Mandel, Ernest; Marxist Economic Theory (1962), “The marginalist theory of value and
neo-classical political economy”.57. ^ a b Dobb, Maurice; Theories of value and Distribution (1973).58. ^ Steedman, Ian; Socialism & Marginalism in Economics, 1870-1930 (1995).
Marginal rate of technical substitutionFrom Wikipedia, the free encyclopedia
Jump to: navigation, search
In economics, the Marginal Rate of Technical Substitution (MRTS) - or Technical Rate of Substitution (TRS) - is the amount by which the quantity of one input has to be reduced ( − Δx2) when one extra unit of another input is used (Δx1 = 1), so that output remains constant ( ).
where MP1 and MP2 are the marginal products of input 1 and input 2, respectively, and MRTS(x1,x2) is Marginal Rate of Technical Substitution of the input x1 for x2.
Along an isoquant, the MRTS shows the rate at which one input (e.g. capital or labor) may be substituted for another, while maintaining the same level of output. The MRTS can also be seen as the slope of an isoquant at the point in question
Demand analysis Definition This is the glossary definition for Demand analysis from my E-marketing glossary which provides succinct definitions of the many terms related to managing and implementing Internet marketing today.
For each Internet marketing term I define, there is a link below to all other pages on this site that provide more detailed information, including the latest developments. So this Internet marketing glossary is not static, but continually updated.
The E-marketing terms are taken from my best-selling text book Internet Marketing: Strategy, Implementation and Practice and in-depth Best Practice guides on Search Engine Optimisation (SEO), Pay Per Click Search Marketing, Website design and Managing an E-commerce team I have written in association with E-consultancy.
What is Demand analysis ? Glossary Entry This is how I define Demand analysis :
Quantitative determination of the potential usage and business value achieved from online customers of an organization. Qualitative analysis of perceptions of online channels is also assessed.
Articles about Demand analysis Follow the link below to find other articles from my site which help define Demand analysis which are sorted by relevance.
Supply Analysis Law & Legal DefinitionIn a broad sense, supply analysis is a system of input and output equations used to determine supply responses to changing circumstances by producers (including households). Supply analysis takes into account changes in both output supply and input/factor demand. Supply analysis is central to policy decisions in that it helps us understand the impact that alternative policy packages may have on the producers themselves. Through the changes it induces in commodity supply and in factor demand, the analysis of production response is an essential component of models that seek to explain market prices, wages and employment, external trade and government fiscal revenues.
Supply analysis can be used to determine the impact of changes in product and factor prices, in technology, and in access on factor demands (including labor), production, marketed output, aggregate supply, and incomes. Generally, it can be used to analyze the impact on production of the removal of barriers to access or other changes in markets. Supply analysis, in the employment context, deals with key staffing questions related to current staffing levels in an organization
Full Focus
Best of the weekOur top pictures from the past week. Full Article
MORE REUTERS RESULTS FOR:""
READ
1. Saudi king to seek medical treatment in U.S. 21 Nov 2010
12. UPDATE 2-US has no plans to retreat from traveler patdowns
21 Nov 2010
23. Officials begin work on Irish bailout details |
21 Nov 2010
34. Airport security measures prompt new website
21 Nov 2010
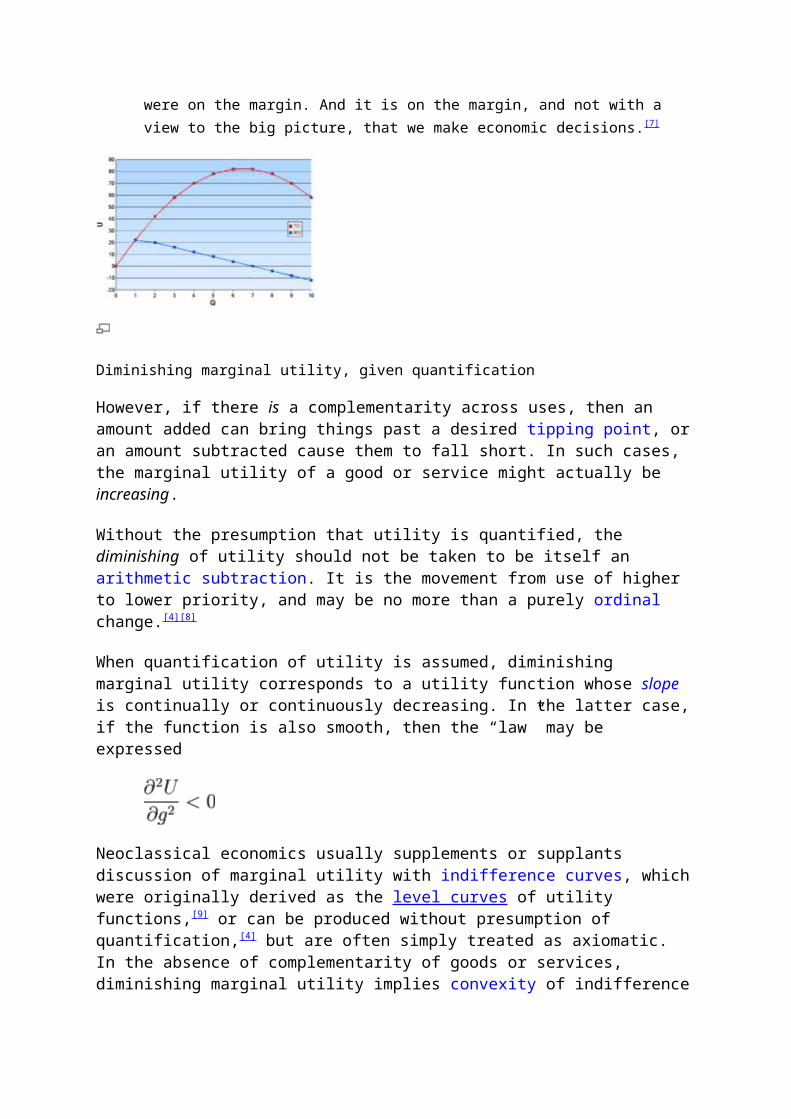
45. Economists worried about U.S. inflation: survey
12:05am EST
5DISCUSSED
174Obama’s Democrats in disarray over expiring tax cuts
115Analysis: Europe is next test for weakened Obama
96Sweet drinks, sales tax targeted to cut deficit
WATCHED
Bejeweled bra exposed in NY Thu, Oct 21 2010
Row over vote orgasm video Fri, Nov 19 2010
Japanese Tourism Bra Wed, Nov 10 2010
BROKER CENTER Special Advertising Feature
Trade Now at Fidelity
Click here to sign-up for trial access to IFR.
Analysis: "Jewish state" demand complicates intricate equation
Tweet This
Share on LinkedIn
Share on Facebook 1diggdigg
RELATED NEWS
PLO wants map from U.S. with future Israeli border Wed, Oct 13 2010
U.S. nudges Palestinians to answer Israeli proposal Tue, Oct 12 2010
Israel makes settlement offer, Palestinians say no Tue, Oct 12 2010
Q+A: Prospects for reviving Mideast peace talks Tue, Oct 12 2010
Analysis: Abbas has few options as Mideast talks founder Mon, Oct 11 2010
ANALYSIS & OPINION
Christians in Middle East much more than a numbers game RELATED TOPICS
World »By Dan WilliamsJERUSALEM | Wed Oct 13, 2010 7:52am EDT
Having lost Gaza to Islamist group Hamas in 2007, and governing in a West Bank crowded by Israeli settlements, Abbas is hard-put to stake out a viable Palestinian nation-state.
Already derided by Hamas and other rivals as a supplicant negotiator, Abbas would risk losing his remaining credibility amongst Palestinians if he bowed to Netanyahu's terms.
The Palestinian leadership argues that recognition of "a Jewish state" would compromise the status of Israel's 20-percent Arab minority -- even though Israel's 1948 Declaration of Independence guarantees full civil rights for all its citizens.
Such a move would also effectively forgo the right of return to Israel of Palestinian refugees who fled or were forced from their homes in Arab-Israeli wars, Palestinian officials say.
POPULATION ANXIETY
Netanyahu made his demand a day after his cabinet approved a controversial measure that would force non-Jewish candidates for naturalization to take a loyalty oath to Israel as a Jewish and democratic state before they could gain citizenship.
That move raised liberal hackles in a mostly secular Israel where there is seldom agreement on what Jewish statehood means.
The ferocious debate is being played out against genuine concern in Israel that demographics point to a steady decline in the Jewish majority within the country.
According to the Central Bureau of Statistics, Jews made up 75.5 percent of Israel's population in 2009 against 77.8 percent in 2000, 81.8 percent in 1990 and 83.7 percent in 1980.
Over that same period, Israel's Muslim population increased from 12.7 percent to 17.1 percent.
Such readings, and the concerns they engender among Israeli Jews, were bound to spill over into the peace talk arena sooner or later, adding yet another explosive issue into an already tense environment.
George Giacaman, a political scientist at Birzeit University in the West Bank, said the recognition stalemate could even be enough to push Abbas into considering dissolution of the limited self-rule Palestinians won under 1993 interim peace accords.
"If this is the last word, the political process will stall and the Palestinian leadership will be forced to look at alternatives," he said. "It's not encouraging."
Supply and demandFrom Wikipedia, the free encyclopedia
Jump to: navigation, search
For other uses, see Supply and demand (disambiguation).
The price P of a product is determined by a balance between production at each price (supply S) and the desires of those with purchasing power at each price (demand D). The diagram shows a positive shift in demand from D1 to D2, resulting in an increase in price (P) and quantity sold (Q) of the product.
Supply and demand is an economic model of price determination in a market. It concludes that in a competitive market, the unit price for a particular good will vary until it settles at a point where the quantity demanded by consumers (at current price) will equal the quantity supplied by producers (at current price), resulting in an economic equilibrium of price and quantity.
The four basic laws of supply and demand are [1]
1. If demand increases and supply remains unchanged then higher equilibrium price and quantity.
2. If demand decreases and supply remains the same then lower equilibrium price and quantity.
3. If supply increases and demand remains unchanged then lower equilibrium price and higher quantity.
4. If supply decreases and demand remains the same then higher price and lower quantity.
Contents[hide]
1 The graphical representation of supply and demando 1.1 Supply scheduleo 1.2 Demand schedule
2 Microeconomicso 2.1 Equilibrium
3 Changes in market equilibriumo 3.1 Demand curve shiftso 3.2 Supply curve shifts
4 Elasticityo 4.1 Vertical supply curve (perfectly inelastic supply)
5 Other markets 6 Empirical estimation 7 Macroeconomic uses of demand and supply 8 History 9 Criticism
o 9.1 Economies of scale: Mass production 10 See also 11 References 12 External links
[edit] The graphical representation of supply and demandThe supply-demand model is a partial equilibrium model representing the determination of the price of a particular good and the quantity of that good which is traded. Although it is normal to regard the quantity demanded and the quantity supplied as functions of the price of the good, the standard graphical representation, usually attributed to Alfred Marshall, has price on the vertical axis and quantity on the horizontal axis, the opposite of the standard convention for the representation of a mathematical function.
Determinants of supply and demand other than the price of the good in question, such as consumers' income, input prices and so on, are not explicitly represented in the supply-demand diagram. Changes in the values of these variables are represented by shifts in the supply and demand curves. By contrast, responses to changes in the price of the good are represented as movements along unchanged supply and demand curves.
[edit] Supply scheduleThe supply schedule, depicted graphically as the supply curve, represents the amount of some good that producers are willing and able to sell at various prices, assuming ceteris paribus, that is, assuming all determinants of supply other than the price of the good in question, such as technology and the prices of factors of production, remain the same.
Under the assumption of perfect competition, supply is determined by marginal cost. Firms will produce additional output as long as the cost of producing an extra unit of output is less than the price they will receive.
By its very nature, conceptualizing a supply curve requires that the firm be a perfect competitor—that is, that the firm has no influence over the market price. This is because each
point on the supply curve is the answer to the question "If this firm is faced with this potential price, how much output will it be able to sell?" If a firm has market power, so its decision of how much output to provide to the market influences the market price, then the firm is not "faced with" any price, and the question is meaningless.
Economists distinguish between the supply curve of an individual firm and the market supply curve. The market supply curve is obtained by summing the quantities supplied by all suppliers at each potential price. Thus in the graph of the supply curve, individual firms' supply curves are added horizontally to obtain the market supply curve.
Economists also distinguish the short-run market supply curve from the long-run market supply curve. In this context, two things are assumed constant by definition of the short run: the availability of one or more fixed inputs (typically physical capital), and the number of firms in the industry. In the long run, firms have a chance to adjust their holdings of physical capital, enabling them to better adjust their quantity supplied at any given price. Furthermore, in the long run potential competitors can enter or exit the industry in response to market conditions. For both of these reasons, long-run market supply curves are flatter than their short-run counterparts.
The determinants of supply follow:
1. Production costs
2. The technology of production
3. The price of related goods
4. Firm's expectations about future prices
5. Number of suppliers
[edit] Demand scheduleThe demand schedule, depicted graphically as the demand curve, represents the amount of some good that buyers are willing and able to purchase at various prices, assuming all determinants of demand other than the price of the good in question, such as income, tastes and preferences, the price of substitute goods, and the price of complementary goods, remain the same. Following the law of demand, the demand curve is almost always represented as downward-sloping, meaning that as price decreases, consumers will buy more of the good.[2]
Just as the supply curves reflect marginal cost curves, demand curves are determined by marginal utility curves.[3] Consumers will be willing to buy a given quantity of a good, at a given price, if the marginal utility of additional consumption is equal to the opportunity cost determined by the price, that is, the marginal utility of alternative consumption choices. The demand schedule is defined as the willingness and ability of a consumer to purchase a given product in a given frame of time.
As described above, the demand curve is generally downward-sloping. There may be rare examples of goods that have upward-sloping demand curves. Two different hypothetical
types of goods with upward-sloping demand curves are Giffen goods (an inferior but staple good) and Veblen goods (goods made more fashionable by a higher price).
By its very nature, conceptualizing a demand curve requires that the purchaser be a perfect competitor—that is, that the purchaser has no influence over the market price. This is because each point on the demand curve is the answer to the question "If this buyer is faced with this potential price, how much of the product will it purchase?" If a buyer has market power, so its decision of how much to buy influences the market price, then the buyer is not "faced with" any price, and the question is meaningless.
As with supply curves, economists distinguish between the demand curve of an individual and the market demand curve. The market demand curve is obtained by summing the quantities demanded by all consumers at each potential price. Thus in the graph of the demand curve, individuals' demand curves are added horizontally to obtain the market demand curve.
The determinants of demand follow:
1. Income
2. Tastes and preferences
3. Prices of related goods and services
4. Expectations
5. Number of Buyers
[edit] Microeconomics
[edit] EquilibriumEquilibrium is defined to the price-quantity pair where the quantity demanded is equal to the quantity supplied, represented by the intersection of the demand and supply curves.
Market Equillibrium:
A situation in a market when the price is such that the quantity that consumers wish to demand is correctly balanced by the quantity that firms wish to supply.
Comparitive static analysis:
Examines the likely effect on the equillibrium of a change in the external conditions affecting the market.
[edit] Changes in market equilibriumPractical uses of supply and demand analysis often center on the different variables that change equilibrium price and quantity, represented as shifts in the respective curves. Comparative statics of such a shift traces the effects from the initial equilibrium to the new equilibrium.
[edit] Demand curve shiftsMain article: Demand curve
An outward (rightward) shift in demand increases both equilibrium price and quantity
When consumers increase the quantity demanded at a given price, it is referred to as an increase in demand. Increased demand can be represented on the graph as the curve being shifted to the right. At each price point, a greater quantity is demanded, as from the initial curve D1 to the new curve D2. In the diagram, this raises the equilibrium price from P1 to the higher P2. This raises the equilibrium quantity from Q1 to the higher Q2. A movement along the curve is described as a "change in the quantity demanded" to distinguish it from a "change in demand," that is, a shift of the curve. In the example above, there has been an increase in demand which has caused an increase in (equilibrium) quantity. The increase in demand could also come from changing tastes and fashions, incomes, price changes in complementary and substitute goods, market expectations, and number of buyers. This would cause the entire demand curve to shift changing the equilibrium price and quantity. Note in the diagram that the shift of the demand curve, by causing a new equilibrium price to emerge, resulted in movement along the supply curve from the point (Q1, P1) to the point Q2, P2).
If the demand decreases, then the opposite happens: a shift of the curve to the left. If the demand starts at D2, and decreases to D1, the equilibrium price will decrease, and the equilibrium quantity will also decrease. The quantity supplied at each price is the same as before the demand shift, reflecting the fact that the supply curve has not shifted; but the equilibrium quantity and price are different as a result of the change (shift) in demand.
The movement of the demand curve in response to a change in a non-price determinant of demand is caused by a change in the x-intercept, the constant term of the demand equation.
[edit] Supply curve shiftsMain article: Supply (economics)
An outward (rightward) shift in supply reduces the equilibrium price but increases the equilibrium quantity
When the suppliers' unit input costs change, or when technological progress occurs, the supply curve shifts. For example, assume that someone invents a better way of growing wheat so that the cost of growing a given quantity of wheat decreases. Otherwise stated, producers will be willing to supply more wheat at every price and this shifts the supply curve S1 outward, to S2—an increase in supply. This increase in supply causes the equilibrium price to decrease from P1 to P2. The equilibrium quantity increases from Q1 to Q2 as consumers move along the demand curve to the new lower price. As a result of a supply curve shift, the price and the quantity move in opposite directions.
If the quantity supplied decreases, the opposite happens. If the supply curve starts at S2, and shifts leftward to S1, the equilibrium price will increase and the equilibrium quantity will decrease as consumers move along the demand curve to the new higher price and associated lower quantity demanded. The quantity demanded at each price is the same as before the supply shift, reflecting the fact that the demand curve has not shifted. But due to the change (shift) in supply, the equilibrium quantity and price have changed.
The movement of the supply curve in response to a change in a non-price determinant of supply is caused by a change in the y-intercept, the constant term of the supply equation. The supply curve shifts up and down the y axis as non-price determinants of demand change.
[edit] ElasticityMain article: Elasticity (economics)
Elasticity is a central concept in the theory of supply and demand. In this context, elasticity refers to how strongly the quantities supplied and demanded respond to various factors, including price and other determinants. One way to define elasticity is the percentage change in one variable (the quantity supplied or demanded) divided by the percentage change in the causative variable. For discrete changes this is known as arc elasticity, which calculates the elasticity over a range of values. In contrast, point elasticity uses differential calculus to determine the elasticity at a specific point. Elasticity is a measure of relative changes.
Often, it is useful to know how strongly the quantity demanded or supplied will change when the price changes. This is known as the price elasticity of demand or the price elasticity of
supply, respectively. If a monopolist decides to increase the price of its product, how will this affect the amount of their good that customers purchase? This knowledge helps the firm determine whether the increased unit price will offset the decrease in sales volume. Likewise, if a government imposes a tax on a good, thereby increasing the effective price, knowledge of the price elasticity will help us to predict the size of the resulting effect on the quantity demanded.
Elasticity is calculated as the percentage change in quantity divided by the associated percentage change in price. For example, if the price moves from $1.00 to $1.05, and as a result the quantity supplied goes from 100 pens to 102 pens, the quantity of pens increased by 2%, and the price increased by 5%, so the price elasticity of supply is 2%/5% or 0.4.
Since the changes are in percentages, changing the unit of measurement or the currency will not affect the elasticity. If the quantity demanded or supplied changes by a greater percentage than the price did, then demand or supply is said to be elastic. If the quantity changes by a lesser percentage than the price did, demand or supply is said to be inelastic. If supply is perfectly inelastic;that is, has zero elasticity, then there is a vertical supply curve.
Short-run supply curves are not as elastic as long-run supply curves, because in the long run firms can respond to market conditions by varying their holdings of physical capital, and because in the long run new firms can enter or old firms can exit the market.
Elasticity in relation to variables other than price can also be considered. One of the most common to consider is income. How strongly would the demand for a good change if income increased or decreased? The relative percentage change is known as the income elasticity of demand.
Another elasticity sometimes considered is the cross elasticity of demand, which measures the responsiveness of the quantity demanded of a good to a change in the price of another good. This is often considered when looking at the relative changes in demand when studying complements and substitute goods. Complements are goods that are typically utilized together, where if one is consumed, usually the other is also. Substitute goods are those where one can be substituted for the other, and if the price of one good rises, one may purchase less of it and instead purchase its substitute.
Cross elasticity of demand is measured as the percentage change in demand for the first good divided by the causative percentage change in the price of the other good. For an example with a complement good, if, in response to a 10% increase in the price of fuel, the quantity of new cars demanded decreased by 20%, the cross elasticity of demand would be -2.0.
In a frictionless economy, the price and quantity in any market would be able to move to a new equilibrium position instantly, without spending any time away from equilibrium. Any change in market conditions would cause a jump from one equilibrium position to another at once. In real economic systems, markets don't always behave in this way, and markets take some time before they reach a new equilibrium position. This is due to asymmetric, or at least imperfect, information, where no one economic agent could ever be expected to know every relevant condition in every market. Ultimately both producers and consumers must rely on trial and error as well as prediction and calculation to find the true equilibrium of a market.
[edit] Vertical supply curve (perfectly inelastic supply)
When demand D1 is in effect, the price will be P1. When D2 is occurring, the price will be P2. The equilibrium quantity is always Q, and any shifts in demand will only affect price.
If the quantity supplied is fixed in the very short run no matter what the price, the supply curve is a vertical line, and supply is called perfectly inelastic.
[edit] Other marketsThe model of supply and demand also applies to various specialty markets.
The model is commonly applied to wages, in the market for labor. The typical roles of supplier and demander are reversed. The suppliers are individuals, who try to sell their labor for the highest price. The demanders of labor are businesses, which try to buy the type of labor they need at the lowest price. The equilibrium price for a certain type of labor is the wage rate.[4]
A number of economists (for example Pierangelo Garegnani[5], Robert L. Vienneau[6], and Arrigo Opocher & Ian Steedman[7]), building on the work of Piero Sraffa, argue that that this model of the labor market, even given all its assumptions, is logically incoherent. Michael Anyadike-Danes and Wyne Godley [8] argue, based on simulation results, that little of the empirical work done with the textbook model constitutes a potentially falsifying test, and, consequently, empirical evidence hardly exists for that model. Graham White [9] argues, partially on the basis of Sraffianism, that the policy of increased labor market flexibility, including the reduction of minimum wages, does not have an "intellectually coherent" argument in economic theory.
This criticism of the application of the model of supply and demand generalizes, particularly to all markets for factors of production. It also has implications for monetary theory[10] not drawn out here.
In both classical and Keynesian economics, the money market is analyzed as a supply-and-demand system with interest rates being the price. The money supply may be a vertical supply curve, if the central bank of a country chooses to use monetary policy to fix its value regardless of the interest rate; in this case the money supply is totally inelastic. On
the other hand,[11] the money supply curve is a horizontal line if the central bank is targeting a fixed interest rate and ignoring the value of the money supply; in this case the money supply curve is perfectly elastic. The demand for money intersects with the money supply to determine the interest rate.[12]
[edit] Empirical estimationDemand and supply relations in a market can be statistically estimated from price, quantity, and other data with sufficient information in the model. This can be done with simultaneous-equation methods of estimation in econometrics. Such methods allow solving for the model-relevant "structural coefficients," the estimated algebraic counterparts of the theory. The Parameter identification problem is a common issue in "structural estimation." Typically, data on exogenous variables (that is, variables other than price and quantity, both of which are endogenous variables) are needed to perform such an estimation. An alternative to "structural estimation" is reduced-form estimation, which regresses each of the endogenous variables on the respective exogenous variables.
[edit] Macroeconomic uses of demand and supplyDemand and supply have also been generalized to explain macroeconomic variables in a market economy, including the quantity of total output and the general price level. The Aggregate Demand-Aggregate Supply model may be the most direct application of supply and demand to macroeconomics, but other macroeconomic models also use supply and demand. Compared to microeconomic uses of demand and supply, different (and more controversial) theoretical considerations apply to such macroeconomic counterparts as aggregate demand and aggregate supply. Demand and supply are also used in macroeconomic theory to relate money supply and money demand to interest rates, and to relate labor supply and labor demand to wage rates.
[edit] HistoryThe power of supply and demand was understood to some extent by several early Muslim economists, such as Ibn Taymiyyah who illustrates:[verification needed]
"If desire for goods increases while its availability decreases, its price rises. On the other hand, if availability of the good increases and the desire for it decreases, the price comes down." [13]
John Locke's 1691 work Some Considerations on the Consequences of the Lowering of Interest and the Raising of the Value of Money.[14] includes an early and clear descriptions of supply and demand and their relationship. In this description demand is rent: “The price of any commodity rises or falls by the proportion of the number of buyer and sellers” and “that which regulates the price... [of goods] is nothing else but their quantity in proportion to their rent.”
The phrase "supply and demand" was first used by James Denham-Steuart in his Inquiry into the Principles of Political Oeconomy, published in 1767. Adam Smith used the phrase in his 1776 book The Wealth of Nations, and David Ricardo titled one chapter of his 1817 work Principles of Political Economy and Taxation "On the Influence of Demand and Supply on Price".[15]
In The Wealth of Nations, Smith generally assumed that the supply price was fixed but that its "merit" (value) would decrease as its "scarcity" increased, in effect what was later called the
law of demand. Ricardo, in Principles of Political Economy and Taxation, more rigorously laid down the idea of the assumptions that were used to build his ideas of supply and demand. Antoine Augustin Cournot first developed a mathematical model of supply and demand in his 1838 Researches into the Mathematical Principles of Wealth, including diagrams.
During the late 19th century the marginalist school of thought emerged. This field mainly was started by Stanley Jevons, Carl Menger, and Léon Walras. The key idea was that the price was set by the most expensive price, that is, the price at the margin. This was a substantial change from Adam Smith's thoughts on determining the supply price.
In his 1870 essay "On the Graphical Representation of Supply and Demand", Fleeming Jenkin in the course of "introduc[ing] the diagrammatic method into the English economic literature" published the first drawing of supply and demand curves therein,[16] including comparative statics from a shift of supply or demand and application to the labor market.[17]
The model was further developed and popularized by Alfred Marshall in the 1890 textbook Principles of Economics.[15]
[edit] CriticismAt least two assumptions are necessary for the validity of the standard model: first, that supply and demand are independent; and second, that supply is "constrained by a fixed resource"; If these conditions do not hold, then the Marshallian model cannot be sustained. Sraffa's critique focused on the inconsistency (except in implausible circumstances) of partial equilibrium analysis and the rationale for the upward-slope of the supply curve in a market for a produced consumption good[18]. The notability of Sraffa's critique is also demonstrated by Paul A. Samuelson's comments and engagements with it over many years, for example:
"What a cleaned-up version of Sraffa (1926) establishes is how nearly empty are all of Marshall's partial equilibrium boxes. To a logical purist of Wittgenstein and Sraffa class, the Marshallian partial equilibrium box of constant cost is even more empty than the box of increasing cost."[19].
Aggregate excess demand in a market is the difference between the quantity demanded and the quantity supplied as a function of price. In the model with an upward-sloping supply curve and downward-sloping demand curve, the aggregate excess demand function only intersects the axis at one point, namely, at the point where the supply and demand curves intersect. The Sonnenschein-Mantel-Debreu theorem shows that the standard model cannot be rigorously derived in general from general equilibrium theory[20].
The model of prices being determined by supply and demand assumes perfect competition. But:
"economists have no adequate model of how individuals and firms adjust prices in a competitive model. If all participants are price-takers by definition, then the actor who adjusts prices to eliminate excess demand is not specified"[21].
The problem is summarized in the Ackerman text: "If we mistakenly confuse precision with accuracy, then we might be misled into thinking that an explanation expressed in precise mathematical or graphical terms is somehow more rigorous or useful than one that takes into account particulars of history, institutions or business strategy. This is not the case.
Therefore, it is important not to put too much confidence in the apparent precision of supply and demand graphs. Supply and demand analysis is a useful precisely formulated conceptual tool that clever people have devised to help us gain an abstract understanding of a complex world. It does not - nor should it be expected to - give us in addition an accurate and complete description of any particular real world market." [22]
[edit] Economies of scale: Mass productionThe intent of mass production is to produce in extremely large quantities at the lowest possible cost so as to drive down price and create demand. There is also a learning curve with the production of most new products that exhibits a similar phenomenon of lowering costs, which in turn drives demand.
In the case of mass production, both the assumptions of supply and demand being independent and constraints on supply are not applicable. The price response to the change in supply curve is valid, but the price response to the change in demand curve is not. The lowered price in response to increased demand is because the incremental cost of production is less than the average cost, assuming that there is excess capacity, which is the condition of most manufactured goods today. In typical business cycles, prices do increase as maximum capacity is approached; however, this usually results in an expansion of capacity using more efficient processes, leading to even lower prices in the next cycle.
[edit] See also Aggregate
demand Aggregate supply Alpha consumer Artificial demand Barriers to entry Cambridge capital
controversy Consumer theory Deadweight loss Demand chain Demand
Forecasting Demand shortfall Economic surplus
Effect of taxes and subsidies on price
Elasticity Externality Foundations of Economic
Analysis by Paul A. Samuelson
History of economic thought
Induced demand "invisible hand" Inverse demand function Labor shortage Microeconomics Neoclassical economics
Producer's surplus Protectionism Profit Rationing Real prices and ideal
prices Say's Law "Supply creates its own
demand" Supply shock An Inquiry into the Nature
and Causes of the Wealth of Nations by Adam Smith
[edit] References
1. ^ Besanko & Braeutigam (2005) p.33.2. ^ Note that unlike most graphs, supply & demand curves are plotted with the independent
variable (price) on the vertical axis and the dependent variable (quantity supplied or demanded) on the horizontal axis.
3. ^ "Marginal Utility and Demand". http://www.amosweb.com/cgi-bin/awb_nav.pl?s=wpd&c=dsp&k=marginal+utility+and+demand. Retrieved 2007-02-09.
4. ^ Kibbe, Matthew B.. "The Minimum Wage: Washington's Perennial Myth". Cato Institute. http://www.cato.org/pubs/pas/pa106.html. Retrieved 2007-02-09.
5. ^ P. Garegnani, "Heterogeneous Capital, the Production Function and the Theory of Distribution", Review of Economic Studies, V. 37, N. 3 (Jul. 1970): 407-436
6. ^ Robert L. Vienneau, "On Labour Demand and Equilibria of the Firm", Manchester School, V. 73, N. 5 (Sep. 2005): 612-619
7. ^ Arrigo Opocher and Ian Steedman, "Input Price-Input Quantity Relations and the Numeraire", Cambridge Journal of Economics, V. 3 (2009): 937-948
8. ^ Michael Anyadike-Danes and Wyne Godley, "Real Wages and Employment: A Sceptical View of Some Recent Empirical Work", Machester School, V. 62, N. 2 (Jun. 1989): 172-187
9. ^ Graham White, "The Poverty of Conventional Economic Wisdom and the Search for Alternative Economic and Social Policies", The Drawing Board: An Australian Review of Public Affairs, V. 2, N. 2 (Nov. 2001): 67-87
10. ^ Colin Rogers, Money, Interest and Capital: A Study in the Foundations of Monetary Theory, Cambridge University Press, 1989
11. ^ Basij J. Moore, Horizontalists and Verticalists: The Macroeconomics of Credit Money, Cambridge University Press, 1988
12. ^ Ritter, Lawrence S.authorlink1 = Lawrence S. Ritter; Silber, William L.; Udell, Gregory F. (2000). Principles of Money, Banking, and Financial Markets (10th ed.). Addison-Wesley, Menlo Park C. pp. 431–438,465–476. ISBN 0-321-37557-2.
13. ^ Hosseini, Hamid S. (2003). "Contributions of Medieval Muslim Scholars to the History of Economics and their Impact: A Refutation of the Schumpeterian Great Gap". In Biddle, Jeff E.; Davis, Jon B.; Samuels, Warren J.. A Companion to the History of Economic Thought. Malden, MA: Blackwell. pp. 28–45 [28 & 38]. doi:10.1002/9780470999059.ch3. ISBN 0631225730.
14. ^ John Locke (1691) Some Considerations on the consequences of the Lowering of Interest and the Raising of the Value of Money
15. ^ a b Thomas M. Humphrey, 1992. "Marshallian Cross Diagrams and Their Uses before Alfred Marshall," Economic Review, Mar/Apr, Federal Reserve Bank of Richmond, pp. 3-23.
16. ^ A.D. Brownlie and M. F. Lloyd Prichard, 1963. "Professor Fleeming Jenkin, 1833-1885 Pioneer in Engineering and Political Economy," Oxford Economic Papers, NS, 15(3), p. 211.
17. ^ Fleeming Jenkin, 1870. "The Graphical Representation of the Laws of Supply and Demand, and their Application to Labour," in Alexander Grant, ed., Recess Studies, Edinburgh. ch. VI, pp. 151-85. Edinburgh. Scroll to chapter link.
18. ^ Avi J. Cohen, "'The Laws of Returns Under Competitive Conditions': Progress in Microeconomics Since Sraffa (1926)?", Eastern Economic Journal, V. 9, N. 3 (Jul.-Sep.): 1983)
19. ^ Paul A. Samuelson, "Reply" in Critical Essays on Piero Sraffa's Legacy in Economics (edited by H. D. Kurz) Cambridge University Press, 2000
20. ^ Alan Kirman, "The Intrinsic Limits of Modern Economic Theory: The Emperor has No Clothes", The Economic Journal, V. 99, N. 395, Supplement: Conference Papers (1989): pp. 126-139
21. ^ Alan P. Kirman, "Whom or What Does the Representative Individual Represent?" Journal of Economic Perspectives, V. 6, N. 2 (Spring 1992): pp. 117-136
22. ^ Goodwin, N, Nelson, J; Ackerman, F & Weissskopf, T: Microeconomics in Context 2d ed. Sharpe 2009 ISBN 9780765623010
Dynamic Multi-Vehicle Routing with Multiple Classes of DemandsAuthors: Marco Pavone, Stephen L. Smith, Francesco Bullo, Emilio Frazzoli
(Submitted on 16 Mar 2009)
Abstract: In this paper we study a dynamic vehicle routing problem in which there are multiple vehicles and multiple classes of demands. Demands of each class arrive in the environment randomly over time and require a random amount of on-site service that is characteristic of the
class. To service a demand, one of the vehicles must travel to the demand location and remain there for the required on-site service time. The quality of service provided to each class is given by the expected delay between the arrival of a demand in the class, and that demand's service completion. The goal is to design a routing policy for the service vehicles which minimizes a convex combination of the delays for each class. First, we provide a lower bound on the achievable values of the convex combination of delays. Then, we propose a novel routing policy and analyze its performance under heavy load conditions (i.e., when the fraction of time the service vehicles spend performing on-site service approaches one). The policy performs within a constant factor of the lower bound (and thus the optimal), where the constant depends only on the number of classes, and is independent of the number of vehicles, the arrival rates of demands, the on-site service times, and the convex combination coefficients.
elasticity of demand
DefinitionResponsiveness of the demand for a good or service to the increase or decrease in its price. Normally, sales increase with drop in prices and decrease with rise in prices. As a general rule, appliances, cars, confectionary and other non-essentials show elasticity of demand whereas most necessities (food, medicine, basic clothing) show inelasticity of demand (do not sell significantly more or less with changes in price). See also cross price elasticity of demand
TYPES OF ELASTICITY OF DEMAND We may distinguish between the tree types of elasticity’s, viz., Price Elasticity, Income Elasticity and Cross Elasticity. • PRICE ELASTICITY Price elasticity measures responsiveness of potential buyers to changes in price. It is the ratio of percentage change in quantity demanded in response to a percentage change in price. Price Elasticity = Proportionate change in amount demanded ----------------------------------------------------------------------------------------------------- Proportionate change in price = Change in demand Change in price --------------------------------------------- + ------------------------------------------- Amount demanded Price Suppose the price of a particular brand of a radio set falls from Rs. 500 to Rs. 400 each, i.e., 20 per cent fall. As
a result of this fall in price, suppose further that the demand for the radio sets has gone up from Rs. 400 to 600,
i.e., 50 per cent. Elasticity of demand will be 50/20 or 2.5 percent.
The concept of price elasticity can be used in comparing the sensitivity of the different types of
goods (e.g., luxuries and necessaries) to change in their prices. For example, by this means we
may find that the price elasticity for food grains, in general, is 0.5, whereas for fruit it may be
1.5. This means that the demand for food grains is less sensitive to price changes than demand
for fruit. Food is a necessary of life and people must buy almost the same quantity, even if its
price has risen. The consumer can, however, economize in fruit or any other commodity
included in the family budget.
The elasticity of demand is always negative, although by convention it is taken to be positive. It
is negative because change in quantity demanded is in opposite direction to the change in price.
That is a fall in price is followed by rise in demand, and vice versa. Hence, elasticity is always
less than zero, unless of course the demand curve is abnormal, i.e., sloping upward from right to
left. Strictly speaking, in mathematical terms, there should be minus sign (-) before figure
indicating price elasticity. But by convention, for the sake of simplicity, the minus sign is
dropped in economics.• INCOME ELASTICITY Income Elasticity is a measure of responsiveness of potential buyers to change in income. It
shows how the quantity demanded will change when the income of the purchaser changes, the
price of the commodity remaining the same. It may be defined thus: The Income Elasticity of
demand for a good is the ratio of the percentage change in the amount spent on the commodity
to a percentage change in the consumer’s income, price of commodity remaining constant. Thus,Income Elasticity = Proportionate change in the quantity purchased ---------------------------------------------------------------------------------------------------------------------- Proportionate change in Income
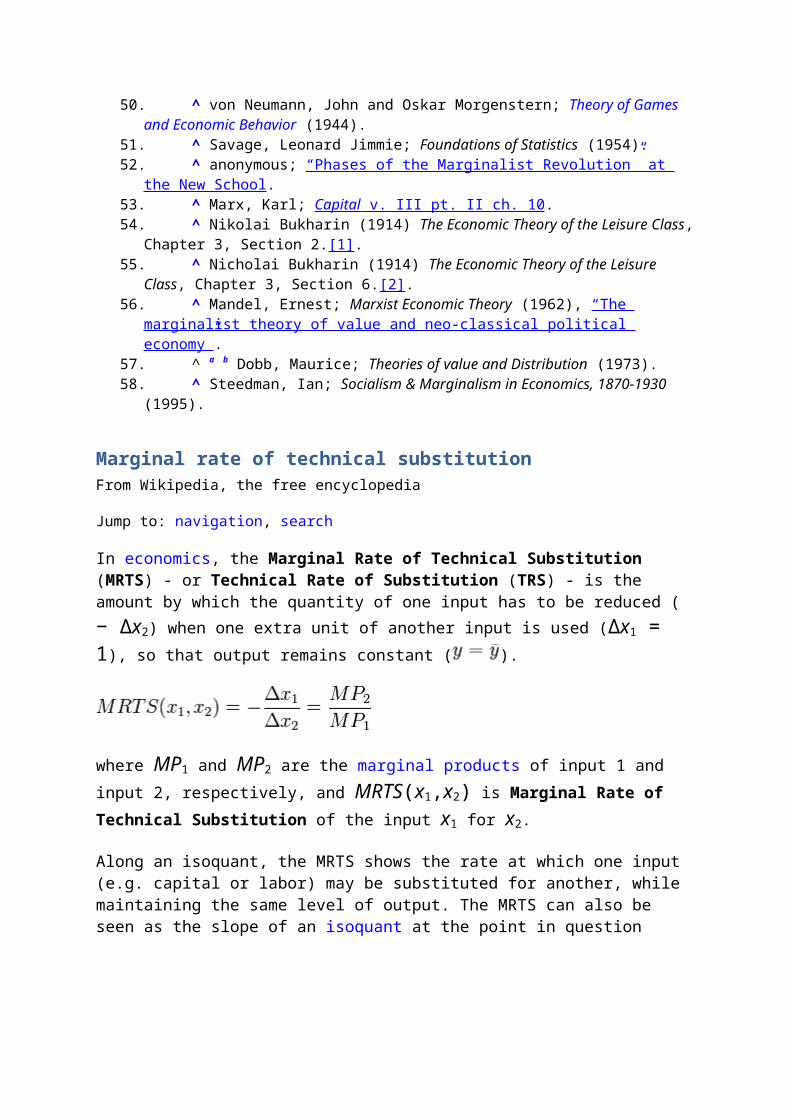
Change In Demand
What Does Change In Demand Mean?A term used in economics to describe that there has been a change, or shift in, a market's total demand. This is represented graphically in a price vs. quantity plane, and is a result of more/less entrants into the market, and the changing of consumer preferences. The shift can either be parallel or nonparallel.
A parallel shift in demand means that there is no change in the elasticity of demand for the given market, but a nonparallel shift means there has been a change in elasticity.
Investopedia explains Change In DemandFor example, if there is a perceived increase in the price of gasoline, then there will be a decrease in the demand for SUVs, ceteris paribus. This shift is likely to be parallel, as those who are still in the market for SUVs are still as sensitive to price increases in the prices of SUVs as before the perceived increase in gasoline prices took place.
1. A method of determination of a supply start in an injection pump, particularly Diesel injection pump, comprising the steps of blocking an outlet of a pump element; supplying a testing volume into the pump element; and determining a supply start upon a pressure increase in the pump element when an upper edge of a pump piston closes a fuel inlet opening of the pump element.
2. A method as defined in claim 1, wherein said blocking step includes blocking the outlet of the pump element by a valve.
3. A method as defined in claim 1, wherein said determining step includes determining the pressure increase by a pressure sensor arranged in the outlet.
4. A method as defined in claim 1, wherein said determining step includes converting the determined pressure by an evaluating electronic device into a trigger signal so as to determine thereby an angular position of a cam shaft for the pump piston.
5. A method as defined in claim 1, wherein said supplying step includes supplying a testing medium by a hydraulic aggregate.
6. A method as defined in claim 1, wherein said supplying step includes supplying a fuel replacement as the testing medium.
7. A method as defined in claim 1; and further comprising the step of retaining the rotary speed of a cam shaft for the pump piston at a lower level.
8. A method as defined in claim 7, wherein said retaining step includes
retaining the rotary speed of the cam shaft lower than 20 revolutions per minute. 2
Description:
BACKGROUND OF THE INVENTION
The present invention relates to a method of determination of beginning of supply process in injection pumps.
Recognition of the exact start of the supply in individual pump elements of injection pumps is very important for exact angular position of the cam shafts and thereby is decisive for mounting of the injection pumps on internal combustion engines so as to provide small amount of exhaust gases and low fuel consumption.
It is known to provide a divided sector on an injection pump, which is arranged on a part fixedly connected with the cam shaft of the pump and located inside the housing. There is a means for observing the divided sector with a bore for receiving a removable plug which is formed in the wall of the pump housing opposite to the path of the divided sector during the rotation of the pump. There is also a means for indicating the position of the divided sector which is particularly so arranged that its zone lies against the indicating means in the beginning of the injection for supply pipes of the pump. This construction is not only complicated but is also not very accurate inasmuch as the setting is performed visually which leads to frequent errors. This construction is disclosed, for example, in the German Offenlegungsschrift No. 2,700,878.
SUMMARY OF THE INVENTION
Accordingly, it is an object of the present invention to provide a method of determination of a supply start for injection pumps, which avoids the disadvantages of the prior art.
More particularly, it is an object of the present invention to provide a method which is simple, very accurate, and can be automated.
In keeping with these objects and with others which will become apparent hereinafter, one feature of the present invention resides, briefly stated, in a method of determination of a supply start for injection machines, in accordance with which an outlet of a pump element is blocked, a testing volume is supplied into the pump element, and a supply start is determined upon a pressure increase in the pump element when an upper edge of a pump piston closes a fuel inlet opening of the pump element.
In accordance with another feature of the present invention, the pressure increase may be determined by a pressure sensor arranged in the outlet of the pump element.
A further advantageous feature of the present invention is that an evaluating electronic device can convert the determined pressure into a trigger signal so as to determine thereby an angular position of a cam shaft for the pump piston.
Still a further feature of the present invention is that the testing medium, for example, a fuel replacement is supplied by a hydraulic aggregate.
Finally, the rotary speed of the cam shaft may be retained at lower level, for example, lower than 20 revolutions per minute.
The novel features which are considered as characteristic for the invention are set forth in particular in the appended claims. The invention itself, however, both as to its construction and its method of operation, together with additional objects and advantages thereof, will be best understood from the following description of specific embodiments when read in connection with the accompanying drawings.
BRIEF DESCRIPTION OF THE DRAWING
FIG. 1 is a view which schematically shows an injection pump with a measuring device;
FIG. 2 is a view which schematically shows an individual cylinder of an injection pump; and
FIG. 3 is a view showing an arrangement for performing the inventive method.
DESCRIPTION OF A PREFERRED EMBODIMENT
FIG. 1 shows an injection pump, particularly a diesel injection pump, which is identified by reference numeral 10. The injection pump 10 is driven by a suitable drive machine 11 with relatively low rotary speed, for example, smaller than 20 revolutions per minute. A hydraulic aggregate 12 supplies a liquid testing medium (substitute fuel) via conduit 13 to the injection pump. It has in the shown example four cylinders. An outlet conduit 14 is connected with each cylinder and provided with a switch valve 15. Each switch valve is preceded by a pressure sensor 16, for example a piezo-resistant pressure sensor.
FIG. 2 shows an individual cylinder of the injection pump. A pump piston 18 is actuated via a rod 19 from a cam shaft 20. The conduit 13 is connected with an inlet bore 21 provided in the cylinder bore. A return valve 22 is arranged in the cylinder. When the testing starts, the outlet conduit 14 is blocked by the switch valve 15. As soon as an upper edge 23 of the pump piston 18 directly closes the bore 21, the injection pump starts the supply and the pressure increases. This is indicated in the diagram by a line 24. Thereby, the start of the supply of the injection pump can be exactly determined by the pressure increase. The pressure increase is sensed by the pressure sensor 16 and supplied to an electronic evaluating device 25. Then the signal can be converted into a trigger signal corresponding to the supply start, and the associated angular position of the cam shaft of the injection pipe can be identified by this trigger signal. Reference numeral 26 in FIG. 3 identifies an angular transducer for the position of the cam shaft 20.
Since the crank shaft 20 operates with a low rotary speed, the process is quasi static which is advantageous for the measuring accuracy. After the attained pressure increase, the switch valve 15 opens so that the compressed testing medium can be discharged. Then it is again closed.

It will be understood that each of the elements described above, or two or more together, may also find a useful application in other types of constructions differing from the types described above.
While the invention has been illustrated and described as embodied in a method of determination of a supply start or injection pumps, it is not intended to be limited to the details shown, since various modifications and structural changes may be made without departing in any way from the spirit of the present invention.
Without further analysis, the foregoing will so fully reveal the gist of the present invention that others can, by applying current knowledge, readily adapt it for various applications without omitting features that, from the standpoint of prior art, fairly constitute essential characteristics of the generic or specific aspects of this invention
6) Shift in Supply - The supply curve is a simultaneous set of potential quantities offered at different prices, a positive relationship. A change in a factor other than price causes a supply shift, but the distinction between that and change in quantity supplied is not as
fundamental as it seems
As with demand, economists separate changes in the amount that sellers will sell into two categories. A change in supply refers to a change in behavior of sellers caused because a factor held constant has changed. As a result of a change in supply, there is a new relationship between price and quantity. At each price there will be a new quantity and at each quantity there will be a new price. A change in quantity supplied refers to a change in

behavior of sellers caused because price has changed. In this case, the relationship between price and quantity remains unchanged, but a new pair in the list of all possible pairs of price and quantity has been realized.
Supply curves as well as demand curves appear much more concrete on an economist's graph than they appear in real markets. A supply curve is mostly potential--what will happen if certain prices are charged, most of which will never be charged. From the buyer's perspective, the supply curve has more meaning as a boundary than as a relationship. The supply curve says that only certain price-quantity pairs will be available to buyers--those lying to the left of the supply curve.
If the price of widgets is originally $1.00 and people are buying 100, they may change to 90 for two reasons. One reason is that the price may rise to $2.00. The other reason is that one of the factors that is assumed to be constant may change, so that even though the price has not changed, quantity will. Economists distinguish these two cases. In the first case the demand relationship or schedule has not changed, but there has been movement within the relationship. Economists call a change of this sort a change in quantity demanded. The second sort of change is an alteration of the relationship. The original pairing of price and quantity is destroyed and replaced by a new pairing. Economists call this sort of change a change in demand.
It is important to realize that though the demand relationship looks concrete when it is illustrated with a table or graph, in everyday life demand curves are hidden. A demand curve refers to what people would do if various prices were charged, and very rarely are enough prices charged so a clear demand curve can be seen. This is not to say that the concept is of no importance to people who sell. They may not be interested in the demand curve as a relationship, but they do find it a boundary or constraint on their behavior. If there were an actual widget seller facing the demand curve in our demand table, he would find that he could not sell more than 90 widgets if he wanted to charge $2.00. He could of course sell fewer if he wanted to. He could sell only 70 at $2.00, but if he did this, he would earn far less than he could. If he wanted to sell more than 90, he would have to lower his price.
A Demand CurvePrice ofWidgets
Number of WidgetsPeople Want to Buy
$1.00 100$2.00 90$3.00 70$4.00 40
Thus, to an actual businessman the demand curve is important as a limitation on what he can do. A businessman may not know exactly where the demand curve is, and he may not think of it as fixed. Advertising--either informing or persuading people--can move the boundary. As we proceed further, we will see that there are still other ways to view the demand curve in addition to seeing it as a mathematical relationship and as a boundary that limits sellers.
Ads by GoogleFIND Packers and MoversIn Gujarat and Anywhere in india Packing,Transportation,Car Carriers undefinedwww.packersmoversmart.com
SWIFT processingSWIFT service bureau and Fedwire solutions for financial institution undefinedwww.bankservinternational.com
SuppliersGet Suppliers news & manufacturing info at IndustryWeek undefinedwww.IndustryWeek.com
shift in demand or supply curveIn economics, a shift in the demand or supply curve to the left or right on a price–quantity diagram. A shift in the demand curve can arise because of a change in the income of buyers, a change in the price of other goods, or a change in tastes for the product. A shift in the supply curve can arise because of change in the costs of production, a change in technology, or a change in price of other goods.An increase in demand caused by an increase in consumer incomes shifts the demand curve to the right; as a result, the equilibrium quantity bought increases, but the equilibrium price also rises. A rise in labour costs leading to a fall in supply shifts the supply curve to the left; as a result, the equilibrium quantity sold falls while the equilibrium price rises
Elasticity of SupplyIII. Elasticity of Supply
Supply elasticity is defined as the percentage change in quantity supplied divided by the percentage change in price. It is calculated as per the following formula:
Formula 3.3
The calculation of elasticity of supply is comparable to the calculation of elasticity of demand, except that the quantities used refer to quantities supplied instead of quantities demanded.
Factors that influence the elasticity of supply include the ability to switch to production of other goods, the ability to go out of business, the ability to use other resource inputs and the amount of time available to respond to a price change.
Over a short time period, firms may be able to increase output only slightly in response to an increase in prices. Over a longer period of time, the level of production can be adjusted greatly as production processes can be altered, additional workers can be hired, more plants can be built, etc. Therefore, elasticity of supply is expected to be greater with longer periods of time.
We would expect the supply elasticity of wheat to be very high as farmers can easily switch land that is used for wheat over to other crops such as corn or soybeans. On the other hand, an oil refinery cannot easily switch its production capacity over to another product, so low oil-refining margins do not reduce the quantity supplied by very much. Due to high capital costs, higher refining margins do not necessarily induce much greater supply. So the supply elasticity for oil refining is fairly low
Resolved QuestionShow me another »
What are the determinants of elasticity of supply?
5 years ago

Report Abuse
by eslick23
Member since:
Best Answer - Chosen by VotersThe determinants of the price elasticity of supply are:*the number of producers -- The more producers there are, the easier it should be for the industry to increase output in response to a price increase. Supply will thus be more elastic.*the existence of spare capacity -- The more capacity there is in the industry, the easier it should be to increase output if price goes up. This makes supply more elastic.*ease of storing stocks-- if it is easy to stock goods, then if the price rises the firm can sell these stocks and so supply is more elastic. In the case of goods such as fresh products, it may not be easy to store them and so the supply will not be very flexible.*the time period -- Over time the firm can invest in training and more equipment and more firms can join the industry, so supply should be more flexible, more elastic.*factor mobility -- i.e. the easier it is for resources to move into the industry, the more elastic supply will be.*length of the production period -- i.e. the quicker a good is to produce, the easier it will be to respond to a change in price; supply in manufacturing is usually more price elastic than agriculture.
Resolved QuestionShow me another »
What are the determinants of elasticity of supply?
Best Answer - Chosen by VotersThe determinants of the price elasticity of supply are:*the number of producers -- The more producers there are, the easier it should be for the industry to increase output in response to a price increase. Supply will thus be more elastic.*the existence of spare capacity -- The more capacity there is in the industry, the easier it should be to increase output if price goes up. This makes supply more elastic.*ease of storing stocks-- if it is easy to stock goods, then if the price rises the firm can sell these stocks and so supply is more elastic. In the case of goods such as fresh products, it may not be easy to store them and so the supply will not be very flexible.*the time period -- Over time the firm can invest in training and more equipment and more firms can join the industry, so supply should be more flexible, more elastic.*factor mobility -- i.e. the easier it is for resources to move into the industry, the more elastic supply will be.
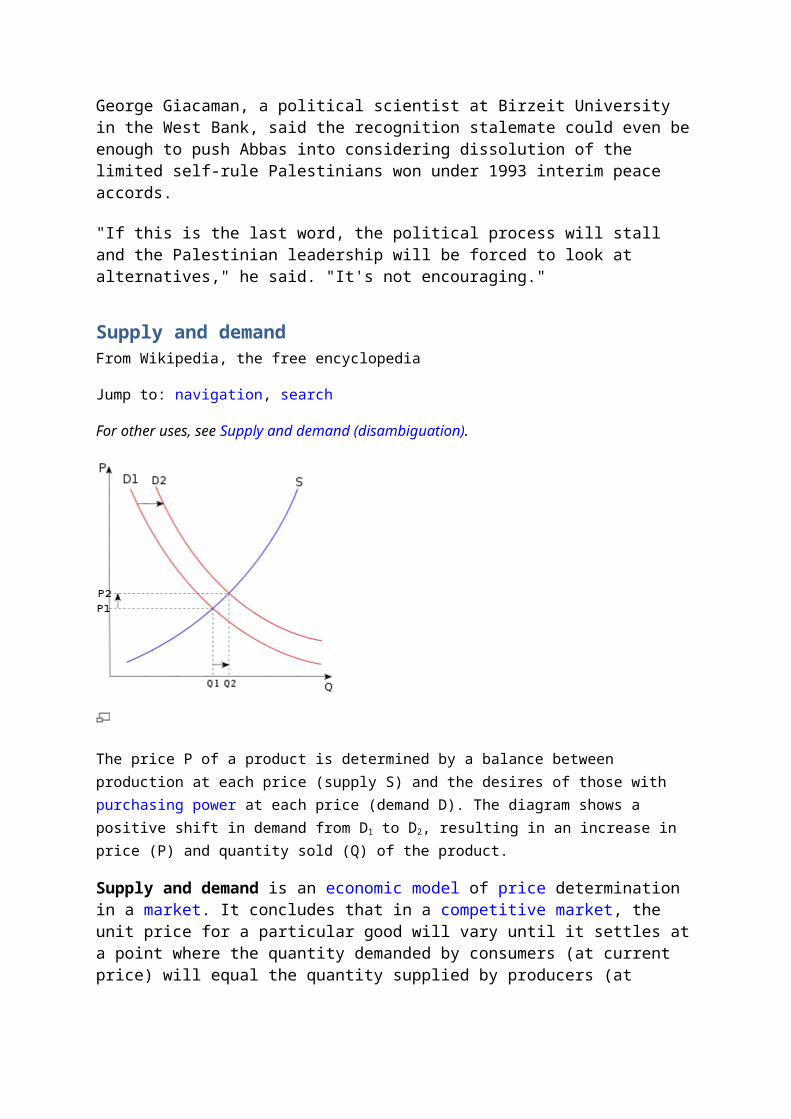
*length of the production period -- i.e. the quicker a good is to produce, the easier it will be to respond to a change in price; supply in manufacturing is usually more price elastic than agriculture.
Meaning of Business EnvironmentEnvironment of a business means the external forces influencing the business decisions.
They can be forces of economic, social, political and technological factors. These factors are outside the control of the business. The business can do little to change them.
Following features: 1. Totality of external forces: Business environment is the sum total of all things external
to business firms and, as such, is aggregative in nature. 2. (Specific and general forces: Business environment includes both specific and general
forces. Specific forces (such as investors, customers, competitors and suppliers) affect individual enterprises directly and immediately in their day-to-day working. General forces (such as social, political, legal and technological conditions) have impact on all business enterprises and thus may affect an individual firm only indirectly.
3. Dynamic nature: Business environment is dynamic in that it keeps on changing whether in terms of technological improvement, shifts in consumer preferences or entry of new competition in the market.
4. Uncertainty: Business environment is largely uncertain as it is very difficult to predict future happenings, especially when environment changes are taking place too frequently as in the case of information technology or fashion industries.
5. Relativity: Business environment is a relative concept since it differs from country to country and even region to region. Political conditions in the USA, for instance, differ from those in China or Pakistan. Similarly, demand for sarees may be fairly high in India whereas it may be almost non-existent in France.
Importance of Business Environment1. firm to identify opportunities and getting the first mover advantage: Early
identification of opportunities helps an enterprise to be the first to exploit them instead of losing them to competitors. For example, Maruti Udyog became the leader in the small car market because it was the first to recognize the need for small cars in India.
2. firm to identify threats and early warning signals: If an Indian firm finds that a foreign multinational is entering the Indian market it should gives a warning signal and Indian firms can meet the threat by adopting by improving the quality of the product, reducing cost of the production, engaging in aggressive advertising, and so on.
3. Coping with rapid changes: All sizes and all types of enterprises are facing increasingly dynamic environment. In order to effectively cope with these significant changes, managers must understand and examine the environment and develop suitable courses of action.
4. Improving performance: the enterprises that continuously monitor their environment and adopt suitable business practices are the ones which not only improve their present performance but also continue to succeed in the market for a longer period.
Dimensions of Business EnvironmentWhat constitutes the general environment of a business?
The following are the key components of general environment of a business.
1. Economic environment economic environment consists of economic factors that influence the business in a country. These factors include gross national product, corporate profits, inflation rate, employment, balance of payments, interest rates consumer income etc.
2. Social environment It describes the characteristics of the society in which the organization exists. Literacy rate, customs, values, beliefs, lifestyle, demographic features and mobility of population are part o the social environment. It is important for managers to notice the direction in which the society is moving and formulate progressive policies according to the changing social scenario.
3. Political environment It comprises political stability and the policies of the government. Ideological inclination of political parties, personal interest on politicians, influence of party forums etc. create political environment. For example, Bangalore established itself as the most important IT centre of India mainly because of political support.
4. Legal environment This consists of legislation that is passed by the parliament and state legislatures.Examples of such legislation specifically aimed at business operations include the Trade mark Act 1969, Essential Commodities Act 1955, Standards of Weights and Measures Act 1969 and Consumer Protection Act 196.
5. Technological environment It includes the level of technology available in a country. It also indicates the pace of research and development and progress made in introducing modern technology in production. Technology provides capital intensive but cost effective alternative to traditional labor intensive methods. In a competitive business environment technology is the key to development.
Economic Environment in IndiaIn order to solve economic problems of our country, the government took several steps
including control by the State of certain industries, central planning and reduced importance of the private sector. The main objectives of India’s development plans were:1. Initiate rapid economic growth to raise the standard of living, reduce unemployment and
poverty;2. Become self-reliant and set up a strong industrial base with emphasis on heavy and basic
industries;3. Reduce inequalities of income and wealth;4. Adopt a socialist pattern of development — based on equality and prevent exploitation of
man by man.
As a part of economic reforms, the Government of India announced a new industrial policy in July 1991.
The broad features of this policy were as follows:1. The Government reduced the number of industries under compulsory licensing to six.2. Disinvestment was carried out in case of many public sector industrial enterprises.3. Policy towards foreign capital was liberalized. The share of foreign equity participation
was increased and in many activities 100 per cent Foreign Direct Investment (FDI) was permitted.
4. Automatic permission was now granted for technology agreements with foreign companies.
5. Foreign Investment Promotion Board (FIPB) was set up to promote and channelise foreign investment in India.
Liberalization:
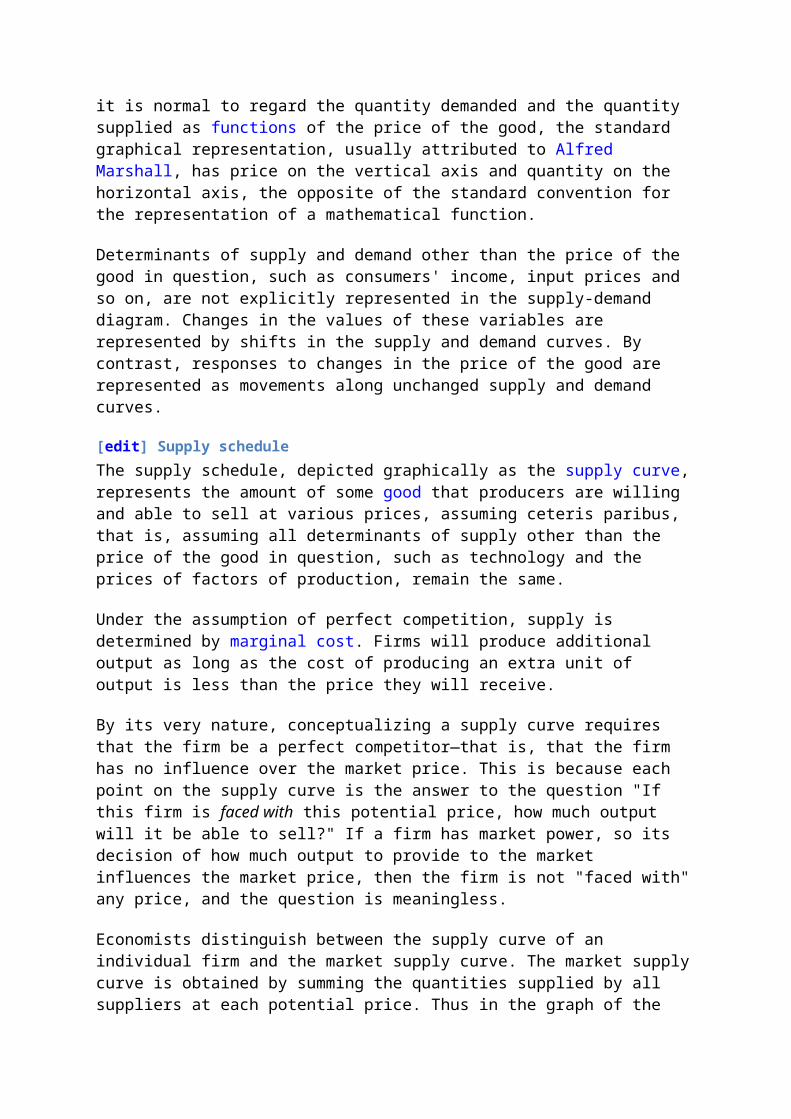
The economic reforms that were introduced were aimed at liberalizing the Indian business and industry from all unnecessary controls and restrictions.
They indicate the end of the licence-pemit-quota raj. Liberalization of the Indian industry has taken place with respect to:
1. Abolishing licensing requirement in most of the industries except a short list, 2. Freedom in deciding the scale of business activities i.e., no restrictions on expansion
or contraction of business activities, 3. Removal of restrictions on the movement of goods and services, 4. Freedom in fixing the prices of goods services, 5. Reduction in tax rates and lifting of unnecessary controls over the economy, 6. Simplifying procedures for imports and experts, and 7. Making it easier to attract foreign capital and technology to india.
Privatisation: The new set of economic reforms aimed at giving greater role to the private sector in the
nation building process and a reduced role to the public sector. To achieve this, the government redefined the role of the public sector in the New
Industrial Policy of 1991 The purpose of the sale, according to the government, was mainly to improve financial
discipline and facilitate modernization. It was also observe that private capital and managerial capabilities could be effectively
utilized to improve the performance of the PSUs. The government has also made attempts to improve the efficiency of PSUs by giving
them autonomy in taking managerial decisions.
Globalisation:
Globalizations are the outcome of the policies of liberalisation and privatisation. Globalisation is generally understood to mean integration of the economy of the country
with the world economy, it is a complex phenomenon. It is an outcome of the set of various policies that are aimed at transforming the world
towards greater interdependence and integration. It involves creation of networks and activities transcending economic, social and
geographical boundaries. Globalisation involves an increased level of interaction and interdependence among the
various nations of the global economy. Physical geographical gap or political boundaries no longer remain barriers for a business
enterprise to serve a customer in a distant geographical market.
Impact of Government Policy Changes on Business and Industry1. Increasing competition: As a result of changes in the rules of industrial licensing and
entry of foreign firms, competition for Indian firms has increased especially in service industries like telecommunications, airlines, banking, insurance, etc. which were earlier in the public sector.
2. More demanding customers: Customers today have become more demanding because they are well-informed. Increased competition in the market gives the customers wider choice in purchasing better quality of goods and services.
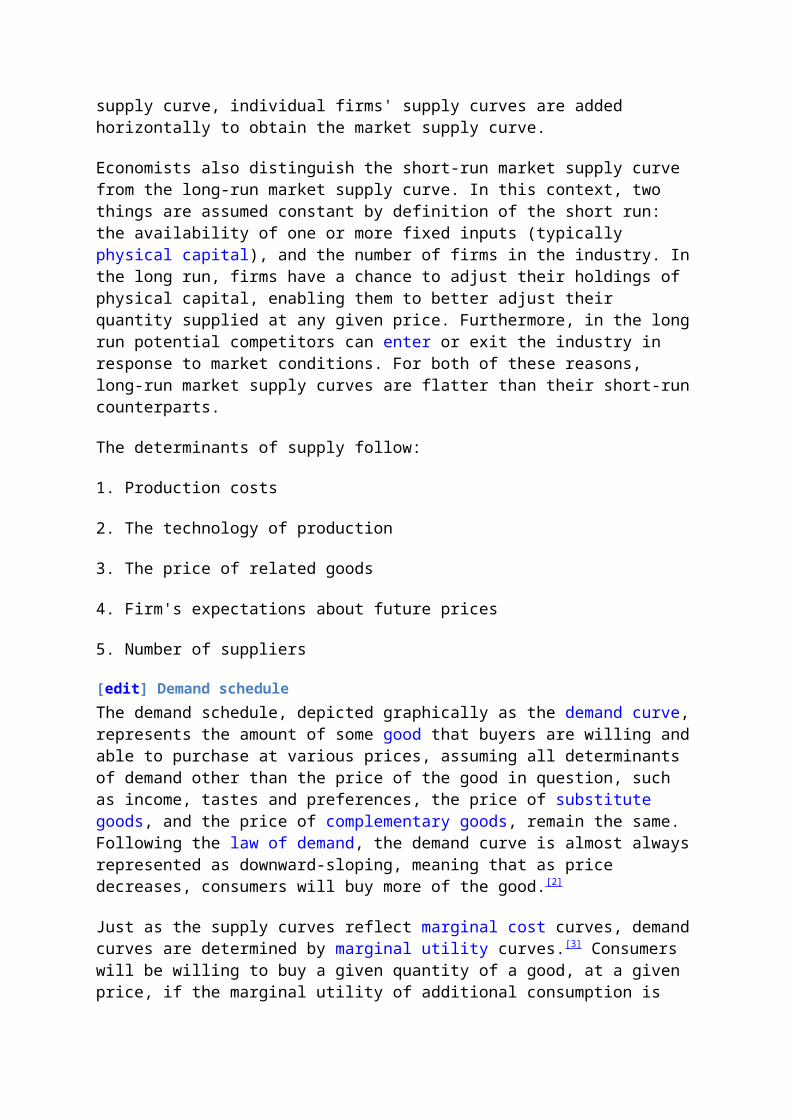
3. Rapidly changing technological environment: Increased competition forces the firms to develop new ways to survive and grow in the market. New technologies make it possible to improve machines, process, products and services. The rapidly changing technological environment creates tough challenges before smaller firms.
4. Necessity for change: In a regulated environment of pre-1991 era, the firms could have relatively stable policies and practices. After 1991, the market forces have become turbulent as a result of which the enterprises have to continuously modify their operations.
5. Threat from MNC Massive entry of multi nationals in Indian marker constitutes new challenge. The Indian subsidiaries of multi-nationals gained strategic advantage. Many of these companies could get limited support in technology from their foreign partners due to restrictions in ownerships. Once these restrictions have been limited to reasonable levels, there is increased technology transfer from the foreign partners
Get a Widget for this title
Importance of work teams in the international business environment
Top Article
1 of 1 Write now Article Tools
by Jesse Bryan
International business forces require firms to respond as quickly to the changes in the international business environment as possible. When teams are formed this can be incredibly useful for increasing the response times across international business boundaries, that often deterred decision-making in an organization. Workers are often assigned to the task of coordinating international efforts to arrive at international solutions and implement international actions albeit correctly. Many of today’s international firms are turning to developing work teams on a large scale to improve the interaction between different international operating units.
There are several different forms of teams, and these include self managed teams, global teams, and cross functional teams.
A self managed team is where the employees from one department take on those responsibilities of their past supervisor. When these types of teams are used in the production line, these teams will find themselves reorganized to address the methods and the ebb and flow of manufacturing process. Because their self managed, they will decrease the need for leaders to keep a watchful eye over there every activity. There are many benefits to having self managed teams, which are commonly cited as increased customer satisfaction, product quality, and above all else increased productivity. There’s an international trend towards downsizing internal operations as in a way to make them much more productive and flexible and thus increasing the need for direct leadership and supervision.
Cross functional teams: a cross functional team can be described as a team which consists of employees who work all at the same level within differing functioning departments. These employees will work to incite changes in overall operations, and as well are chosen on their ability to best coordinate across operational functions, as well decreasing the time it takes to get a product idea from the idea’s creation to the marketplace internationally. International firms will use cross functional teams when they want to increase quality of their products, by having these valued employees from manufacturing, and purchasing, for instance, working cohesively to address any potential quality product issues.
Global teams: there’s a growing trend towards large international organizations creating global teams that is teams that are made up of top managers from any locations headquarters and international operations communication link to develop organizational wide solutions to international organizational problems. One setback of global teams is that the performance of one team can be substantially impaired when there is an exorbitant large gap between team members, for instance, immense travel times between or to meetings.
Development under LPG Policies - V B Athreya
I. Globalization
The term "globalization" has gained wide and popular currency today. Yet, there is often a lack of clarity on the precise meaning and definition of the term, and of its implications. In the more euphoric versions, globalization is seen as the wonderful culmination of a century of glittering technological progress which has made the world a global village, and has made it possible for people everywhere to communicate with great ease across the globe. These versions cite the phenomenal progress in such fields as biotechnology and information and communication technology to highlight the fact that a whole new range of technological possibilities have emerged which could potentially enhance human life spans and the quality of life for all. But they do not pause to examine the track record of scientific and technological progress under hitherto existing socioeconomic regimes, which have more often than not led to both highly in equalizing and highly destructive uses of science and technology. The more explicitly ideological versions of this genre see globalization as the ultimate triumph of capitalism and as signifying "the end of history". The reality and the lived experience of globalization of the vast majority of people in the world call seriously into question the euphoric versions, the strenuous efforts of electronic and print mass media top portrary otherwise notwithstanding.
Globalization, as it is currently occurring, is best understood as a hegemonic process led by the economically and militarily powerful G7 countries-USA, UK, Canada, France, Italy, Germany and Japan - and the huge transnational corporation {TNCs or more popularly, multinational corporation (MNCs} based in these countries. In a sense, globalization has always been with us ever since the capitalist mode of production took firm root in UK some centuries ago, and the ceaseless quest of capital for profit across space and all sectors of productive and unproductive activity emerged. However, there are certain distinctive features of about contemporary globalization that need to be clearly understood.
Globalization rests on-the five important monopolies that Samir Amin locates with the G 7 countries.
Monopoly of technology, of finance, of markets, of media, and of weapons of mass destruction.
Contemporary globalization's distinctive feature is centralization and globalization of finance. Cross-border flows of finance via currency transactions amount to fifty times the value of international trade in goods. Global capital is largely metropolitan capital, which seeks quick gains in portfolio investment in the third world. Globally, foreign direct investment (FDD, while large compared to the decades of the 1970s and 80s, is much smaller than portfolio investment, and is concentrated in a few countries. In the third world, China and a handful of other countries account for nearly all FDI from the advanced capitalist countries.
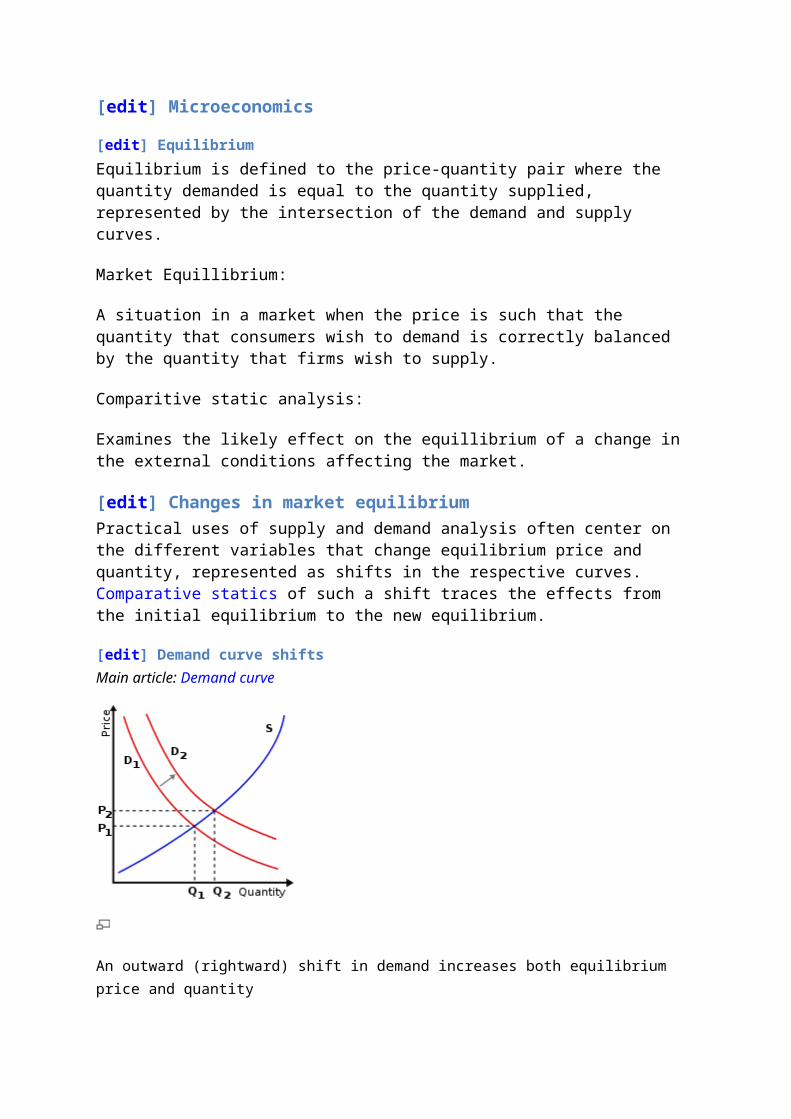
An important implication of the dominance of finance capital globally is that countries seeking to attract and retain capital must maintain high interest rates and provide other incentives to such capital. In turn, this means that governments cannot follow expansionary policies through increased government spending and lower rates of interest to stimulate growth in the economy. This is why the decades of rapid globalization -1980s and 90s- have seen a sharp decline in the growth rates of capitalist countries, after a long period of expansion since the end of the second world war. This is especially the case with third world countries, since they face hostile international markets dominated by the monopolistic MNCs, and end up with severe problems in their balance of payments and foreign exchange holdings. The ruling regimes in most of these countries are unwilling to tax the rich and unable to curb imports, while exports face uncertain and highly competitive markets, and expenditures cannot be curbed beyond a point for fear of tremendous popular unrest. The resulting crisis of both internal resources and balance of payments pushes these countries into the stranglehold of the so-called Bretton Woods Institutions (BWI), namely the World Bank (WB) and the International Monetary Fund (IMF), which then dictate policies of "structural adjustment" requiring the withdrawal of the state from economic activity and social protection, and the handing over of the economy to private capital, largely foreign, but with willing and p'iant domestic partners. The grip ofG7 countries and MNCs over the economies of third world countries lia? been greatly strengthened by the emergence of the world trade organization (WTO) in 1995 from the erstwhile Genera! Agreement on Tariffs and Trade (GATT). WTO, IMF and WB act in concert to keep the third world countries under the tutelage ofG7 and the MNCs, and ensure free movement of finance capital across the globe. They also aim at keeping the third world country markets freely accessible to G7 and MNCs, while allowing the latter to erect all sorts of tariff and nom-tariff barriers to exports from the third world into the advanced countries. This is the essence of globalization. In other words, far from being a benign process of breaking down unnecessary barriers that divide people and nations with the help of advanced technology, and helping them all to develop equitably, globalization as dominance of finance capital amounts essentially to recolonization of the third world.
Armed with the understanding of globalization sketched above, let us turn to a discussion of the impact of the economic policies followed in India throughout the 1990s, based on the trinity of liberalization, privatization and globalization (LPG).
H. THE ECONOMIC REFORMS
India was faced with a serious balance of payments (BOP) crisis in 1990-91, following a decade of expansionary | policies, accompanied by both indiscriminate commercial borrowing abroad and trade liberalization, and in the immediate context of adverse international developments especially with respect to the price of oil. Thanks to the same expansionary policies financed by large scale internal borrowing and large budgetary deficits arising from an unwillingness to tax the rich to finance increased government spending, India also ran into a fiscal crisis, with government's revenues falling far short of expenditures. The twin crisis of BOP and fiscal crunch was used by the minority government of Narasimha Rao to push through a programme of structural adjustment dictated by the world bank and the IMF. The essence of this programme, pursued especially vigorously by the NDA government during the last three years, has consisted of the following steps:
A sharp reduction in government spending, especially on capital formation development and social welfare.
A programme of privatization of public sector enterprises, ostensibly on efficiency grounds, but in reality for ideological reasons and to meet fiscal deficit targets set by the Bank and the Fund by raising revenue through sale of public sector assets at unconscionably low prices.
Accelerated liberalization of imports of both goods and capital Numerous tax and other concessions for both foreign and domestic capital, to attract inflows
of capital and stimulate investment. A severe cutback in government subsidies for food, fertilizers and power, accompanied by a
rise in the costs of borrowing for government resulting from financial deregulation leading to higher interest rates.
Active promotion of stock markets and speculation, accompanied by discouragement of household saving in other forms of small savings
Deregulation of industry and gradual removal of protective legislation for labour.
It has been repeatedly claimed by the proponents of reform policies that the crisis of the Indian economy in 1991 and its earlier slow growth were the result of too much state involvement in the economy, both as direct producer and as regulator. As a corollary, it was claimed that the policies of deregulation and opening up of the economy to foreign capital and commodity imports, accompanied by a process of privatization and withdrawal of the state to make way for the "efficient" private sector, would unleash the inherent dynamism of the economy and that rapid growth, greater employment and reduction of poverty will follow. What has been the track record?
III. TEN YEARS OF REFORM 1991-2001: THE RECORD
Table 1 shows average rates of annual growth of GDP over different quinquennia, starting from 1971., Table 2 shows the sectoral GDP growth rates in the 1990s. Table 3 presents data on the shares of gross domestic capital formation in GDP during each quinquennium between 1970 and 2000. Table 4 presents data on trends in tax top GDP ratio over the 1990s. Table 5 shows the rates of growth in employment for different periods as seen from national sample surveys. Table 6 shows the headcount ratios of poverty as seen from successive rounds of the national sample survey. The following conclusions emerge from a careful perusal of the data presented in Tables 1 to 6:
Growth
The GDP growth rate during the 1990s has been more or less the same as in 1980s i.e. THERE HAS BEEN NO BREAKTHROUGH AS A RESULT OF LPG (Table 1)
Second half of 1990's has seen a deceleration in the rate of GDP growth (Table 1) Agriculture has seen a sharp decline in growth and is in crisis. (Table 2) Food grains growth has been slower than the growth rate of population during 1990s, for the
first time since independence (1.6% vs. 1.8%) Industrial production has also decelerated sharply in the second half of 1990s (Table 2) Main growth sector in the 1990s has been "services" including especially real estate and
financial services. A part of the "growth" in services is merely on account of pay revisions for government and quasi government employees (Table 2)
Equity
Bonanza to the rich, manifested especially in a decline in the tax to GDP ratio (Table 4). If the tax-GDP ratio had remained constant at the level it was just prior to the start of the reforms, the additional revenue in 2000-01 would have been of the order of Rs. 26000 crores!
Sharp decline in pro-people subsidies, leading to increase in prices of food grain, electricity and mass transport fares.
o Sharp decline (as well as fluctuations) in non-food grain prices on account of import competition in conjunction with rising costs of production and stagnant productivity (arising from collapse of public investment in agriculture), amounting to a double squeeze on fanners. These developments have led to great misery among farmers, brought out most dramatically and tragically by the suicides of thousands of farmers in Andhra Pradesh, and a smaller number in Karnataka, two states with blindly pro-reform governments.
o Food security abandoned, with PDS prices sharply increased and misplaced attempts at targeting. Result: An anomalous situation of 65 million tonnes of food grains stocks with government (FCI), but increase in starvation deaths and mass hunger.
o Sharp deceleration in employment growth (Table -5) Only a small part of it is attributable to improved school enrolment. The decline, especially steep in rural
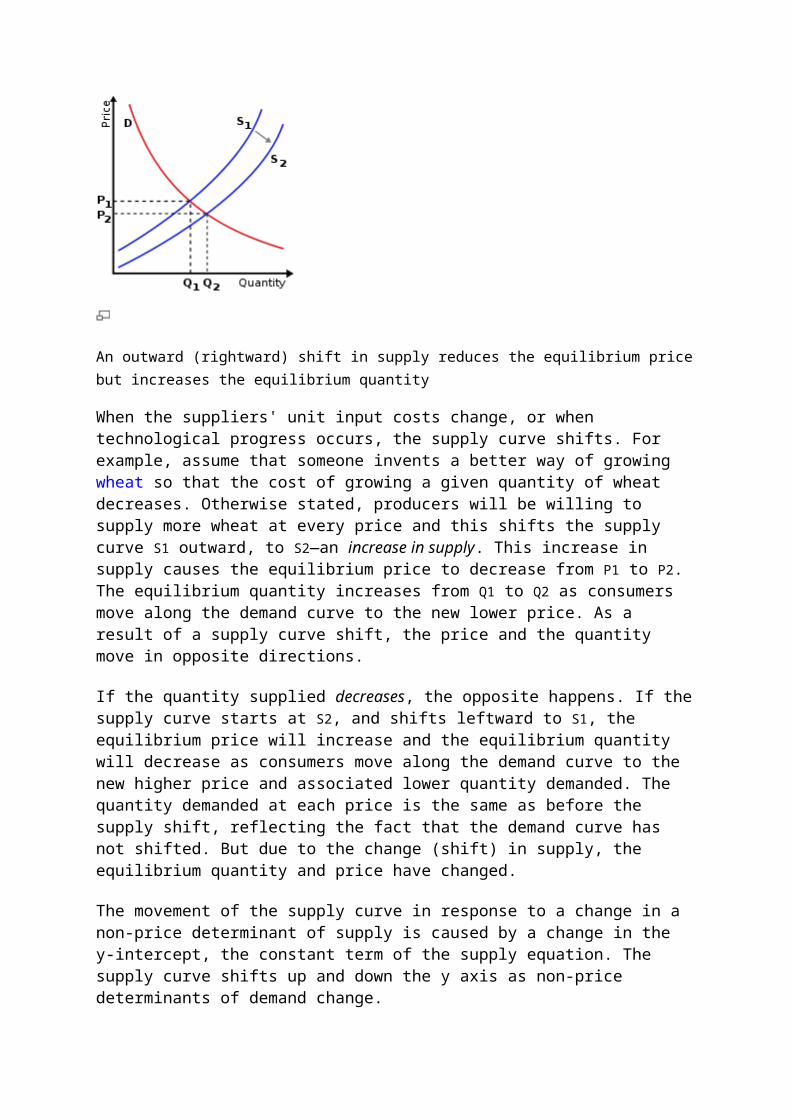
areas, is attributable, in particular, to the collapse of public investment, increase in imports, and the cutbacks in rural employment programes together with the reduction in input subsidies for agriculture.
o Virtually no decline in percentage of population below poverty line despite growth in GDP. (Table-6). Though the government claims that the proportion of households below the poverty level came down to 26% IN 1999-2000 based on NSS data, it is now accepted that the methodology followed for assessing was faulty. Independent evidence has led most scholars studying poverty in India to conclude that the proportion below poverty line in 1999-2000 is not below what was observed in the previous "full sample" NSS round in 1993-94, and may be marginally higher. The most important point here is that while poverty rates showed a tendency to decline since the mid 1970s, this decline has been halted after the re forms process began in 1991. '
IV. A Rational Alternative
It should be clear from the foregoing that:
o The present system is the very definition of irrationality, dictated by the logic of globalization of finance capital.
o Obsession with the fiscal deficit is preventing use of food grain stocks and foreign exchange reserves for stimulating the economy.
The path of neo-liberal reforms is also entirely inconsistent with the economic philosophy and policy advocated by Dr. Ambedkar. Its consequences, in terms of employment and distribution, confirm Ambedkar's apprehensions regarding the implications of the private enterprise economic system. An alternative to the policies currently being pursued is presented in the following line, keeping in mind Ambedkar's observations on land reforms and the role of the State in economic development. It is presented in two parts, the first pertaining to what is immediately possible, and the second referring to the long term.
Immediate Alternative Policy
o Use food stocks for a massive and productive food for work programme, thus creating rural public assets and improving infrastructure.
o Raise tax-GDP ratio by enhancing direct taxes on the rich closing loopholes and punishing tax evasion severely.
o Use thus enhanced revenue to build badly needed infrastructure in transport, communications, energy, health and education, and to revitalize public sector enterprises instead of pursuing mindless privatization at throw-away price.
The Long Term Alternative
o Basic and thorough going land reforms.o Consistent decentralization and democratisation, involving devolution of both finance
and functions to local bodies.o Reversal of indiscriminate import liberalizationo A significantly enlarged role for the state, with greater investment being made in
physical and social infrastructure from out of high tax revenues.o A sharp step-up in the ratio of investment to GDP, which has been stagnating at
around 24% in the 1990s, by discouraging luxury consumption and promoting savings and investment by households. I Emphasis on food security and sustainable development, reversing environmental degradation through community involvement.
TABLE 1
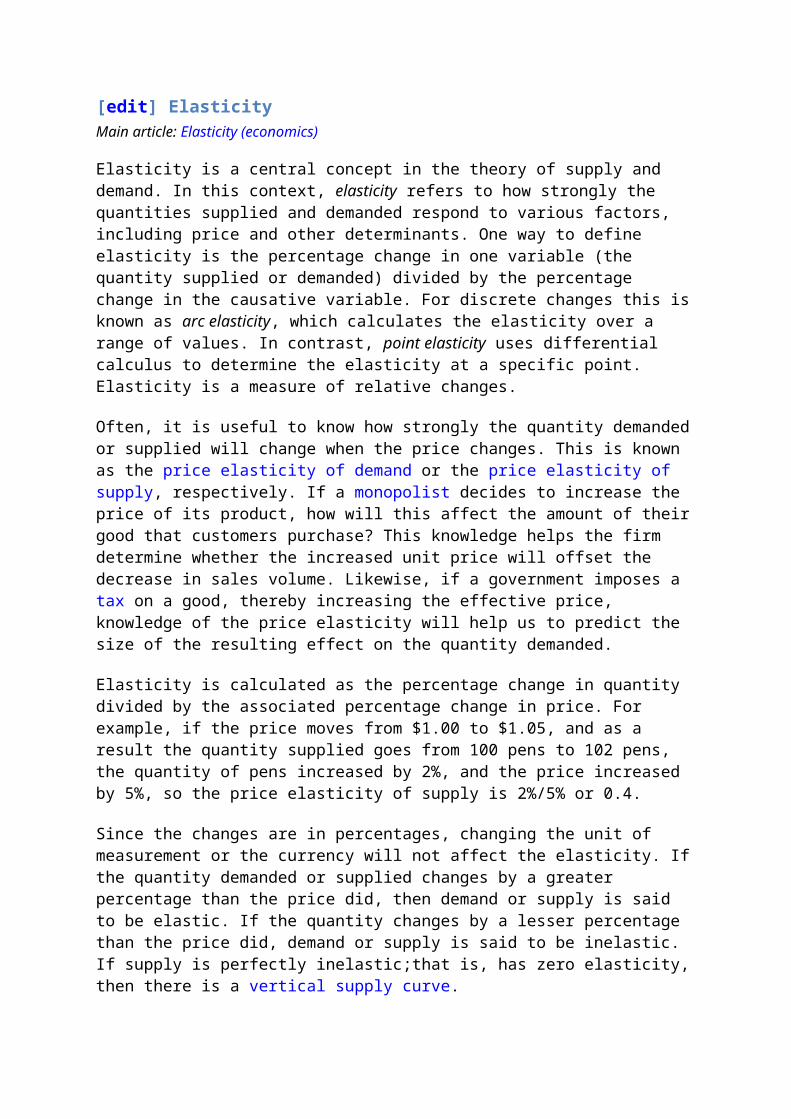
Annual GDP Growth Rates Over Quinquennia (1993-94 Base)
1971-75 3.40
1976-80 2.87
1981-85 5.05
1986-90 7.01
1991-95 6.43
1996-00 5.87
Source:- Macroscan , Business Line, Various Issues
TABLE 2
Annual Sectoral GDP Growth Rates, per cent
PERIOD Primary Secondary Tertiary
1986-90 5.72 8.66 8.83
1991-95 3.77 8.04 6.40
1996-00 1.95 4.99 7.20
Source:- Macroscan , Business Line, Various Issues
TABLE 3
Share of Gross Domestic Capital Formation (GDCF) as per cent of Gross Domestic Product (GDP) Quinquennial Average
Year GDCF as per cent GDP
1970-75 16.14
1975-80 19.12
1980-85 19.76
1985-90 22.70
1990-95 24.03
1995-00 24.05
Source:- 'Economic Survey, 2000-2001
TABLE 4
The Ratio of Central Tax Revenue to GDP (%)
TABLE 5
Annual Rate of Growth of Total Employment(%)
TABLE 6
Head Count Poverty Ratio (%)
Source:-
Up to 46th Round the figures are taken from a World Bank document. The 50"' round
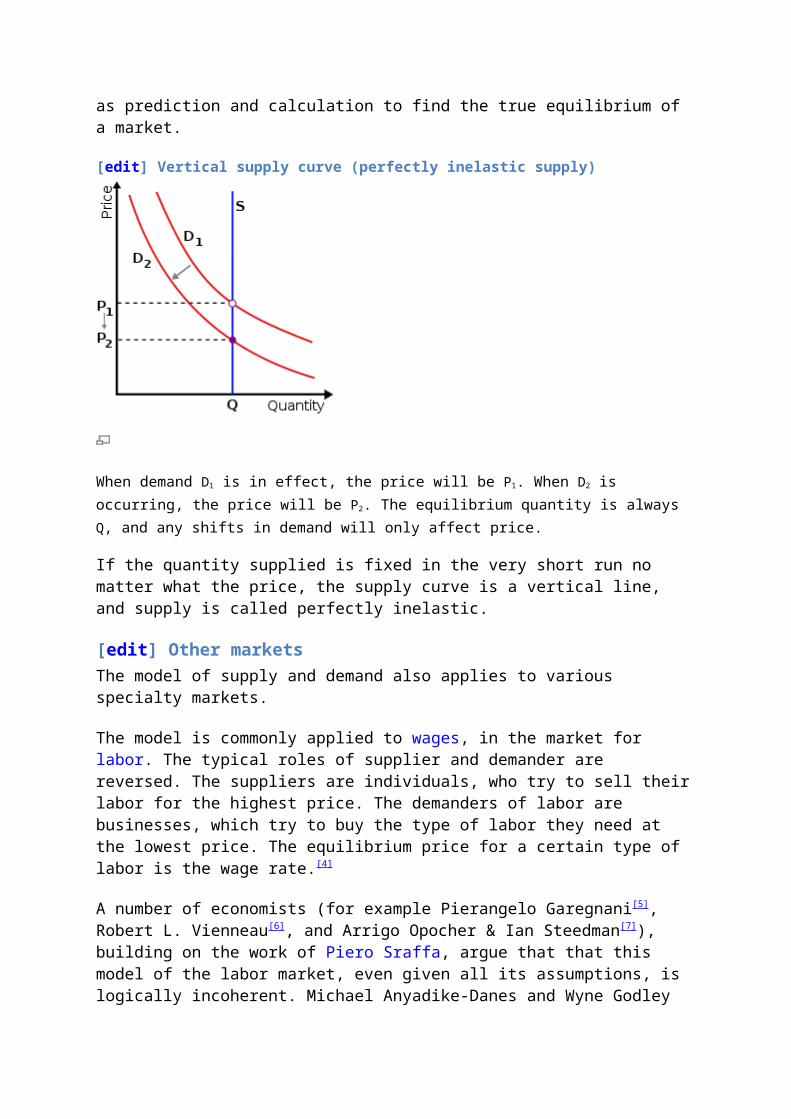
Five Year PlansWhen India gained independence, its economy was groveling in dust. The British had left the Indian economy crippled and the fathers of development formulated 5 years plan to develop the Indian economy. The five years plan in India is framed, executed and monitored by the Planning Commission of India. Currently, India is in its 11th five year plan. Let's see the journey of five year's plan in India and the objectives in each plan.
Objectives of all the Five Year's Plan:
1st Plan (1951-56)
The first five year plan was presented by Jawaharlal Nehru in 1951. The First Five Year Plan was initiated at
the end of the turmoil of partition of the country. It gave importance to agriculture, irrigation and power
projects to decrease the countries reliance on food grain imports, resolve the food crisis and ease the raw
material problem especially in jute and cotton. Nearly 45% of the resources were designated for agriculture,
while industry got a modest 4.9%.The focus was to maximize the output from agriculture, which would then
provide the impetus for industrial growth.
Though the first plan was formulated hurriedly, it succeeded in fulfilling the targets. Agriculture
production increased dramatically, national income went up by 18%, per capita income by 11% and per
capita consumption by 9%
2nd Plan (1956-61)
The second five year plan was initiated in a climate of economic prosperity, industry gained in
prominence. Agriculture programmes were formulated to meet the raw material needs of industry,
besides covering the food needs of the increasing population. The Industrial Policy of 1956 was
socialistic in nature. The plan aimed at 25% increase in national income.
In comparison to First Five Year plan, the Second Five Year Plan was a moderate success.
Unfavorable monsoon in 1957-58 and 1959-60 impacted agricultural production and also the Suez
crisis blocked International Trading increasing commodity prices.
3rd Plan (1961-66)
While formulating the third plan, it was realized that agriculture production was the destabilizing factor in
economic growth. Hence agriculture was given due importance. Also allotment for power sector was
increased to 14.6% of the total disbursement.
Emphasis was on becoming self reliant in agriculture and industry. The objective of import substitution
was seen as sacrosanct. In order to prevent monopolies and to promote economic developments in
backward areas, unfeasible manufacturing units were augmented with subsidies. The plan aimed to
increase national income by 30% and agriculture production by 30%.
The wars with China in 1962 and Pakistan 1965 and bad monsoon in almost all the years, meant the
actual performance was way of the target.
4th Plan (1969-74)
At the time of initiating the fourth plan it was realized that GDP growth and rapid growth of capital
accumulation alone would not help improve standard of living or to become economically self-reliant.
Importance was given to providing benefits to the marginalized section of the society through
employment and education.
Disbursement to agricultural sector was increased to 23.3% .Family planning programme was given a
big stimulus.
The achievements of the fourth plan were below targets. Agriculture growth was just at 2.8% and green
revolution did not perform as expected. Industry too grew at 3.9%.
5th Plan (1974-79)
As a result of inflationary pressure faced during the fourth plan, the fifth plan focused on checking
inflation. Several new economic and non-economic variables such as nutritional requirements, health,
family planning etc were incorporated in the planning process. Investment mix was also formulated
based on demand estimated for final domestic consumption.
Industry got the highest allocation of 24.3% and the plan forecasted a growth rate of 5.5% in national
income.
The fifth plan was discontinued by the new Janata government in the fourth year itself.
6th Plan (1980-85)
The Janata government moved away from GNP approach to development, instead sought to achieve
higher production targets with an aim to provide employment opportunities to the marginalized section
of the society. But the plan lacked the political will.
The Congress government on taking office in 1980 formulated a new plan with a strategy to lay equal
focus on infrastructure and agriculture.
The plan achieved a growth of 6% pa.
7th Plan (1985-89)The first three years of the seventh plan saw severe drought conditions, despite which the food grain production rose by 3.2%.Special programmes like Jawahar Rozgar Yojana were introduced. Sectors like welfare, education, health, family planning, employment etc got a larger disbursement.
8th Plan (1992-97)
The eighth plan was initiated just after a severe balance of payment crisis, which was intensified by the
Gulf war in 1990.several structural modification policies were brought in to put the country in a path of
high growth rate. They were devaluation of rupees, dismantling of license prerequisite and decrease
trade barriers.
The plan targeted an annual growth rate of 5.6% in GDP and at the same time keeping inflation under
control.
9th Plan (1997-2002)It was observed in the eighth plan that, even though the economy performed well, the gains did not percolate to the weaker sections of the society. The ninth plans therefore laid greater impetus on increasing agricultural and rural incomes and alleviate the conditions of the marginal farmer and landless laborers.
10th Plan (2002-2007)
The aim of the tenth plan was to make the Indian economy the fastest growing economy in the world,
with a growth target of 10%.It wanted to bring in investor friendly market reforms and create a friendly
environment for growth. It sought active participation by the private sector and increased FDI's in the
financial sector.
Emphasis was laid on corporate transparency and improving the infrastructure.
It sought to reduce poverty ratio by 5 percentage points by 2007and increase in literacy rates to 75 per
cent by the end of the plan.
Increase in forest and tree cover to 25 per cent by 2007 and all villages to have sustained access to
potable drinking water.
11th Plan (2007-2012)
The eleventh plan has the objective to increase GDP growth to 10%.
Increase agricultural GDP growth to 4% per year to ensure a wider spread of benefits. Create 70 million
new work opportunities. Augment minimum standards of education in primary school.
Reduce infant mortality rate to 28 and malnutrition among children of age group 0-3 to half of its present
level. Ensure electricity connection to all villages and increase forest and tree cover by five percentage
points