dla-arn short-term project report - defense technical · pdf filedla-arn short-term project...
TRANSCRIPT

1
DLA-ARN Short-Term Project Report
DLA ARN Short-Term Project Report
for
US Defense Logistics Agency AQPOT Room 3135
8725 John J. Kingman Road Ft. Belvoir, Virginia 22060-6221
on
Nomex® Supply Chain Total Asset Visibility
Contract Number SPO103-02-D-0017 Contractor Clemson University Delivery Order # 0006 Delivery Order Title Nomex® Supply Chain Total Asset Visibility CDRL # A002 CDRL Title Final Technical Report Reporting Period June 7, 2004 – August 31, 2005 Report Date January 10, 2006 Name of PI Joseph W. Kernodle E-mail [email protected] Phone 864-646-8404 Fax 864-646-8230 Address Clemson Apparel Research
500 Lebanon Road Pendleton, SC 29670
Clemson University Project #: 2004180

������������� ������ �� ������������� ��������������
�������������������������� ����������������
������������������� �������������������
������������
�������������������������������������������
�������������!����������������������������������
"����������������������������������������
�#���������!�������$�����������
�%��������������������
���������������!&�����������������
� ��������
�������'���������
�"���������������������������
� �����������������������������
������������ (�������� )����������
����������������������������
�*�+,�-,��.-/�� "����������������������� � ���������
������������������������������������������� ������ ����������� ����� !�� ������������������" ���������������������!��#���������������"�� �������$������� � �������"� ������� ��� ��� ��������� � ������" ������������ ����!��#������������������������ ����� �������������� �������������������� ���� ������ ����������������������� ������ ����" ��������� ����������� ��� �������� ��� ������" �� %�� ������ �� %������" & �������� '� �(� ����� ��!����" %������� �� ��� ������ ���� )��� ����� �� *������+,-,./,���0"�1�23��������% !��'���# " �����1,."���������"4�111,1/.�,1�*������������������ # ���� ����#����� ����� ���������!�������� #"���������� �������5����� ���� ������ ������������#��� ������������������ �������������������� ��������! ���)67��������������
���������������������������������������&���������
%���������&���������������
�(��������������
�)������������������������
�,������'����������
�0�����1�������
�2���3��1������������
�����������!�������$������������������������
����������������������������4
� (���������������������������������
10-01-2006 Final Technical Report CDRL # A002 June 7, 2004 - August 31, 2005
Nomex Supply Chain Total Asset Visibility SPO103-02-D-0017 DO 0006
Joseph W. Kernodle
Clemson University /Clemson Apparel Research500 Lebanon RoadPendleton, SC 29670
A002 Final Technical Report
Defense Logistics AgencyJ339, Room 31358725 John J. Kingman Road, #2533Ft. Belvoir, VA 22060-6221
Distribution Statement A.
Project to coordinate the collection of total asset visibility (TAV) across the extended military Nomex and one additional supply chain (SC).
Nomex, BDU, supply chain, inventory
U U U UU31
Joseph W. Kernodle
(864) 646-8454

2
Clemson Apparel Research DLA-ARN Short-Term Project
Nomex® Supply Chain Total Asset Visibility Final Technical Report
Table of Contents
1. Executive Summary .............................................................................................3 2. Introduction..........................................................................................................5
2.1 Definition of the Problem ................................................................................5 2.2 Project Scope ....................................................................................................5 2.3 Keyword Definitions ........................................................................................6
3. Technical Discussion............................................................................................7 3.1 Overview ...........................................................................................................7 3.2 Creating DuPont’s Constraints-based Pull Scheduling ...............................8 3.3 Creating the Supply Chain Forecast............................................................12 3.4 Defining Supply Chain Maturity Stages......................................................14 3.5 DuPont Objectives .........................................................................................16 3.6 Detailed Solution ............................................................................................16
4. Conclusions .........................................................................................................19 Accomplishments .................................................................................................19 Benefits ..................................................................................................................19 Lessons Learned...................................................................................................19 Recommendations ................................................................................................19 Appendix 1 – Nomex® Bill of Material (BOM) File.............................................................. 21 Appendix 2 – Master Cross Reference File........................................................................... 22 Appendix 3 – Average Monthly Demand File....................................................................... 23 Appendix 4 – PGC On-hand Quantity File........................................................................... 24 Appendix 5 – Fiber On-hand Pounds File............................................................................. 25 Appendix 6 – Fiber Average Monthly Demand File ............................................................ 26 Appendix 7 – Delivery Order Status File .............................................................................. 27 Appendix 8 – Contract Status File .......................................................................................... 28 Appendix 9 – Solicitation File.................................................................................................. 29 Appendix 10 – Scheduling File and Sorted Schedule File..................................................... 30 Appendix 11 – Acronyms......................................................................................................... 31

3
Clemson Apparel Research
DLA-ARN Short-Term Project Nomex® Supply Chain Total Asset Visibility
Final Technical Report
1. Executive Summary Problem Statement. Within the clothing and textiles (C & T) supply network (SN), the most upstream manufacturers of military unique products often are the single source and have the most constrained capacity of all the manufacturing members on the SN. Examples are Nomex®, Kevlar®, NYCO, ECWCS, and poly/wool products. It is imperative that these manufacturers use their constrained capacity to make the mix of products that is most needed by the SN for the SN to meet readiness requirements at the lowest possible cost. Today these upstream manufacturers are able to respond only to the demands of their customers who rightfully attempt to do everything they can to optimize their own individual business performance. In addition, raw materials and components of military unique end-items must be launched early or “at risk” before military deliver orders are generated to maintain a flow of products down the SN at a reasonable replenishment lead-time for meeting readiness needs. Often this risk is too high for the SN to support and gaps appear in the flow of product resulting later in extreme problems for the military and all SN players. This results in large excesses of some products and stock outs of others because the upstream manufacturers do not know what is really needed down the entire SN nor are the upstream partners able to distribute available products downstream in an effective manner. Scope. This project uses the DuPont Nomex® scheduling process to demonstrate that an initial upstream manufacturer can actually establish appropriate capacity and launch into production a mix of products that maintains SN-wide inventory balance without participation from any SN manufacturers between the most upstream partner and C & T. Technical Discussion. The best method of reducing the risk of manufacturing early and also of optimizing SN performance is using pull scheduling to replace forecast scheduling. Forecasting is then only used to create total capacity ahead of and manufacturing. Pull scheduling requires SN partners to collaborate with each other for their mutual benefit. Specifically, pull scheduling requires the downstream partners to provide the “pull” of product shortages to the upstream partners. The goal of this project was to demonstrate that pull scheduling can be accomplished efficiently within the Nomex® SN. This was done successfully by taking advantage of the fact that the real “pull” in military SNs is the generation of military delivery orders and other procurement actions rather than by the normal pull of product shortages. Data available from military systems was extracted and presented to DuPont in spreadsheets representing web-based screens in a manner that enabled DuPont to make appropriate risk assessments of the expected demand and then generate optimum production schedules for minimum risk production well ahead of customer orders. At

4
the same time, DuPont was able to see during the scheduling process the total need for each fiber downstream in the SN and launch manufacturing in a manner to maintain a SN balanced in days of supply. Conclusions. This project determined the information that should be shared in a collaborative environment with upstream SN partners and demonstrated that it exists in, and can be extracted from, current systems and presented to upstream SN partners in an efficient manner. This not only minimizes the risk of early production, but also can be executed in a manner to schedule constrained manufacturing capacity according to SN-wide priority requirements. The success of this demonstration can be used to automate scheduling for upstream SN partners of all C & T SNs. Embedded in this scheduling approach are the techniques necessary to significantly improve the flow of products down the SNs, reduce line shutdowns, reduce end-item stock outs, and minimize replenishment and manufacturing costs. KEVLAR® and NOMEX® are registered trademarks of E. I. du Pont de Nemours and Company and its affiliates.

5
2. Introduction 2.1 Definition of the Problem The portion of the C & T supply networks upstream of C & T function best when there is a constant flow of product. This flow is normally maintained by upstream SN partners or converters forecasting future military purchases and launching their own replenishment and manufacturing orders “at risk” before C & T releases firm delivery orders. However there are times when the upstream partners are not willing to assume this risk so the SN is broken or “gapped.” This means the military products are taken out of production and replaced with other work or equipment is left standing. When demand picks up again there are delays because of higher priority backorders and because of start-up challenges. It is in the military’s interest to minimize this risk and enable the flow of products down the entire SN. Furthermore, the product flow should consist of the right items at the right time in the right quantities and at the right places. This frequently does not happen today because upstream SN partners are very conservative in forecasting and making military unique products because there is no secondary market for these items. Even if the most upstream manufacturer of a military unique raw material is willing to make sufficient quantities, there is no way today to know what sufficient quantities are nor is there a way to know how to distribute what is made to the right places in the right quantities. Full collaboration is being used more and more in commercial SNs to improve the operational performance of all SN partners with good success. This project uses modified, advanced manufacturing concepts to demonstrate that formal and automated collaboration between DuPont, the single manufacturer of Nomex® fibers, and C & T can minimize DuPont’s risk of manufacturing early. In addition C & T can provide all the information DuPont needs to optimize the performance of the upstream SN. The purpose of this project is to demonstrate that (1) all the inventory and procurement status available to C & T managers can be provided to the most upstream SN partner on an automated basis and that (2) the partner can use this information to reduce the risk of producing early to optimize the availability of military unique raw materials and components downstream to end-item manufacturers. 2.2 Project Scope The original statement of work directed CAR to serve as the focal point and coordinator to identify and attain SC-wide total asset visibility (TAV) data for two families of combat clothing items, develop the technical details for adding the new data to AAVS, and participate in the process as a full participant until data access was finalized. This included enlisting support from the targeted SC partner firms in accordance with the established criteria and ARN guidance. The specific objectives were to obtain willing participation by each key SC partner, to train each partner in the use of modified VIM-ASAP, and to finalize TAV data utilization.

6
The project evolved through the year to demonstrating successfully through a series of spreadsheets simulating web-based VIM screens that full collaboration between C & T and DuPont could enable DuPont to schedule Nomex® fiber production to minimize stock outs and excessive inventories in the upstream portions of the SN. 2.3 Keyword Definitions Military Nomex® Enterprise. All retail military units that use Nomex® items plus DLA wholesale operations and all upstream supporting supply network companies. Military Nomex® Supply Network (SN). All Nomex® end-item contractors and their upstream suppliers through initial raw material manufacturers. Military Nomex® Supply Chain (SC). An individual section of the military Nomex® SN consisting of an end-item contractor and all of their upstream suppliers for one or more defined Nomex® items. 2.4 Background Past ARN research determined that standard business processes in three major areas of the C & T enterprise must be changed to achieve total optimized performance. They are:
• Retail to wholesale collaboration and synchronization. Much work has been accomplished by the ARN in this area primarily by taking over ownership of retail inventories and replenishing through traditional business processes. Prior ARN research projects have created advanced solutions to eliminate stock outs, reduce inventories, and lower operating costs, but they have not been implemented primarily because of a lack of collaboration between C & T and the Services.
• Awarding of delivery orders. C & T’s delivery orders drive the upstream portion of the
SN. C & T conducts capacity planning ahead of production so the projected capacity requirements will be in place when needed. This planning consists of forecasts, solicitations, bids, contracts, and option years. For example, awarding a contract with option years consisting of minimum and maximum quantities establishes flexible capacity. The awarding of delivery orders should also be a planning event, but is an execution event because the military system is not capable of awarding delivery orders at the PGC level. In addition, C & T elects to award delivery orders very infrequently (every 90 days while plants schedule every 7 days). These two business practices together result in extremely high levels of costly expediting in an unsuccessful attempt to eliminate stock outs. The solution to this problem was presented in prior ARN research, but has not been implemented primarily because of the implementation of BSM.
• Upstream SN collaboration and synchronization. The focus of this ARN project is on the
remaining uppermost portion of the SC above the level of garment manufacturing. It focuses on the natural constraint within the Nomex® SN which is DuPont’s fiber manufacturing. If DuPont can schedule fiber production at a rate equal to downstream
7
demand and do this in a manner that constantly re-balances the inventories of Nomex® fibers from DuPont’s WIP to C & T’s wholesale inventories, this then only leaves one secondary challenge of distributing the Nomex® fibers, yarns, threads, and fabrics in an optimum manner to end-item manufacturers.
3. Technical Discussion 3.1 Overview Our ultimate objective is to enable DuPont to generate a forecast that minimizes the risk of manufacturing prior to the receipt of firm fiber orders. We used the drum-buffer-rope (DBR) advanced model of pull scheduling for manufacturing as the basis for our solution and modified it for our unique military situations and application to the extended SN. The DBR model eliminates forecast risk by eliminating forecasting from scheduling and only uses it for planning capacity ahead of execution. Demand pull based on inventory shortages is used to drive scheduling rather than forecasting push. However, in military SNs, contracting actions have to be substituted for inventory shortages in order to create the “pull” in the upstream portions of the SN. DBR requires the identification of the constraint operation within the SN and the designation or creation of strategic buffers on either side of the constraint. DuPont’s fiber manufacturing is the known constraint and there is no shortage of raw materials for fiber manufacturing. Therefore, the only major strategy question was what buffer between DuPont’s WIP and retail demand would be the strategic buffer for our demonstration. We soon determined we could actually designate all of the inventory beginning with DuPont’s finished goods downstream through C & T’s wholesale inventory as a single “virtual buffer” and thereby implement DBR by “black boxing” all of the SN partners’ inventories between C & T and DuPont for this first critical step. The reason that we do not need to know actual inventory levels in this part of the SN is that we can assume that open military delivery orders equate to the minimum amount of inventory that must be in the SN upstream of C & T wholesale inventories. Most of the research effort was in developing and validating through simulated web-based VIM screens (spreadsheets) how the necessary data could be extracted from existing military data bases and presented to DuPont in the modified DBR model to generate a risk-free manufacturing schedule that can optimize upstream SN performance based on DuPont’s manufacturing decisions. In conjunction with developing the special DBR strategy, we had to determine how far into the future to forecast retail demand in order to know the level at which DuPont’s constrained capacity should be set. We determined that this is simply equal to the replenishment lead-time for filling C & T’s delivery orders. The challenge is that this time can vary greatly unless the SN is flowing at a steady level. We defined SN evolution or maturity stages as a method of readily communicating the steps in attaining ultimate SN performance. We defined these SN maturity stages beginning with a new product for which no capacity or components exist (Stage 1) and progressed through the ultimate SN which includes full synchronization and fast-turn manufacturing (Stage 6).

8
By defining SN evolution in this manner, we can clearly portray how this and previous ARN solutions fit together to optimize total SN performance. The solution developed in this project will take the C & T SN from the common Stage 3 level in use today up to Stage 4. The application of two other major ARN solutions reviewed above can take the SN up to Stage 5 and Stage 6 can be achieved only if/when C & T recognizes the value of and rewards fast throughput. 3.2 Creating DuPont’s Constraints-based Pull Scheduling Forecasting. All SNs are driven primarily by each SN partner upstream of retail forecasting future downstream customer orders and launching their own component purchases and manufacturing orders prior to the receipt of firm orders. These early launches are “at risk” because there is no guarantee that purchases will follow. Thus, generating low risk forecasts is vital for meeting consumer requirements and optimizing SN-wide in-stock performance and profitability. The generation of low risk forecasts is even more important in military SNs like our Nomex® SN because there are virtually no secondary markets for disposing of excess raw materials, components, or end-items made to military requirements. Collaboration for Risk Reduction. Risk assessment is a vital part of the forecasting process because the severe negative consequences of over ordering and producing must be weighed against the consequences of missing sales. The lower the business risk associated with the forecast, the more aggressive will be the actions taken based on the forecast. Research has shown that SN partners who generate collaborative forecasts and execute against them do a much better job of meeting consumer demand than do those who forecast independently because collaborative forecasts are much less conservative based on interactions, current knowledge, and shared risks and rewards. Demand Pull. Lean Manufacturing has clearly demonstrated that fast-turn manufacturing increases forecast accuracy by reducing forecast periods and that replacing forecasts with demand pull virtually eliminates the need for forecasts and associated risks for SN execution. Prior Clemson ARN projects demonstrated that collaboration, fast-turn manufacturing, and demand pull all work extremely well to enhance military supply chain performance. Since the primary objective is to reduce the risk of upstream SN partners producing early in the absence of military delivery orders, creating demand pull is clearly the optimum strategy. Constraints-Based Demand Pull. The best method of implementing demand pull in manufacturing is the drum-buffer-rope (DBR) model. In this model the capacity of the most constrained process in the plant is set to match market demand. A strategic buffer of finished goods (FGs) is placed between market demand and manufacturing to absorb minor demand variations so constrained manufacturing capacity does not have to react immediately to changes in demand, but can be increased and decreased slowly. As market demand pulls inventory from the FGs buffer, the pace of the constraint process becomes the drumbeat that is tied, in turn, to the gating operation of the production line through a schedule (the rope). The schedule then introduces new work at a rate that neither starves nor overloads the constraint process. As demonstrated in prior ARN research, the DBR model works extremely well when applied to entire supply networks as well as within individual manufacturing plants.
9
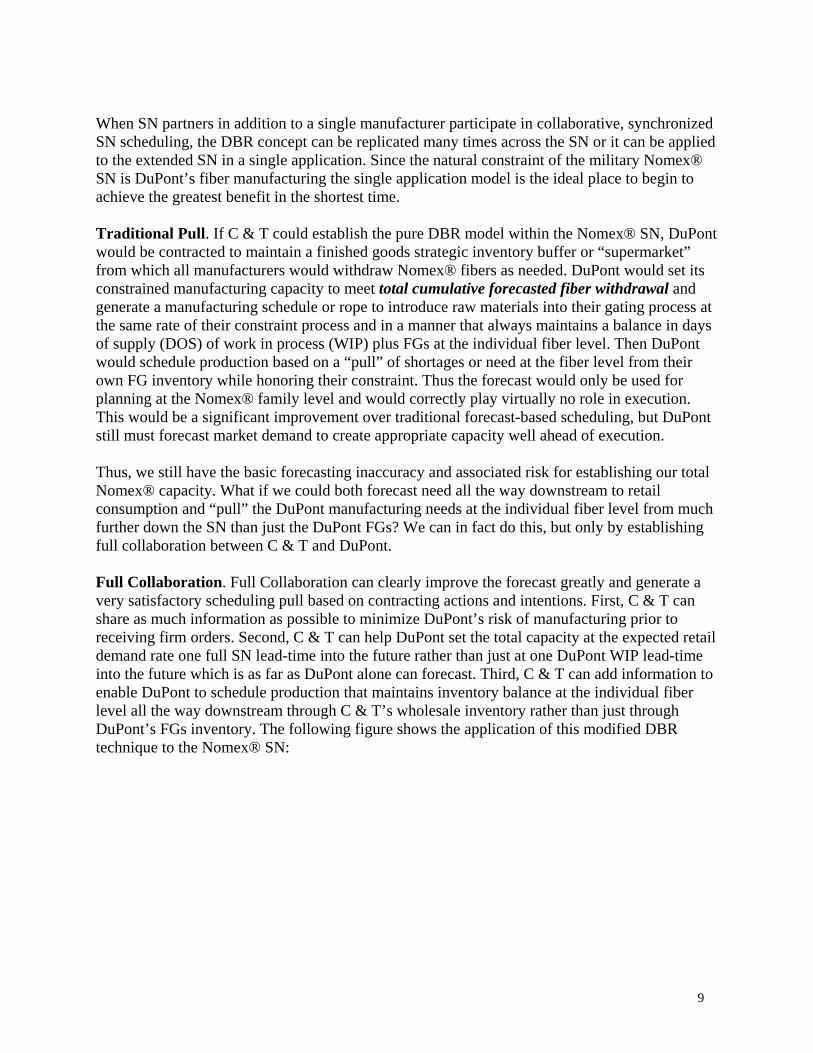
When SN partners in addition to a single manufacturer participate in collaborative, synchronized SN scheduling, the DBR concept can be replicated many times across the SN or it can be applied to the extended SN in a single application. Since the natural constraint of the military Nomex® SN is DuPont’s fiber manufacturing the single application model is the ideal place to begin to achieve the greatest benefit in the shortest time. Traditional Pull. If C & T could establish the pure DBR model within the Nomex® SN, DuPont would be contracted to maintain a finished goods strategic inventory buffer or “supermarket” from which all manufacturers would withdraw Nomex® fibers as needed. DuPont would set its constrained manufacturing capacity to meet total cumulative forecasted fiber withdrawal and generate a manufacturing schedule or rope to introduce raw materials into their gating process at the same rate of their constraint process and in a manner that always maintains a balance in days of supply (DOS) of work in process (WIP) plus FGs at the individual fiber level. Then DuPont would schedule production based on a “pull” of shortages or need at the fiber level from their own FG inventory while honoring their constraint. Thus the forecast would only be used for planning at the Nomex® family level and would correctly play virtually no role in execution. This would be a significant improvement over traditional forecast-based scheduling, but DuPont still must forecast market demand to create appropriate capacity well ahead of execution. Thus, we still have the basic forecasting inaccuracy and associated risk for establishing our total Nomex® capacity. What if we could both forecast need all the way downstream to retail consumption and “pull” the DuPont manufacturing needs at the individual fiber level from much further down the SN than just the DuPont FGs? We can in fact do this, but only by establishing full collaboration between C & T and DuPont. Full Collaboration. Full Collaboration can clearly improve the forecast greatly and generate a very satisfactory scheduling pull based on contracting actions and intentions. First, C & T can share as much information as possible to minimize DuPont’s risk of manufacturing prior to receiving firm orders. Second, C & T can help DuPont set the total capacity at the expected retail demand rate one full SN lead-time into the future rather than just at one DuPont WIP lead-time into the future which is as far as DuPont alone can forecast. Third, C & T can add information to enable DuPont to schedule production that maintains inventory balance at the individual fiber level all the way downstream through C & T’s wholesale inventory rather than just through DuPont’s FGs inventory. The following figure shows the application of this modified DBR technique to the Nomex® SN:

10
Figure 1 – DBR Constraints-based Nomex® Fiber Pull Scheduling The optimum DBR scheduling approach re-stated for our Nomex® SN is that DuPont must first collaborate with C & T to set its constrained production capacity of fiber manufacturing to forecasted demand one SN lead-time into the future. The solution for doing this is presented in Section 3.3. Next DuPont must use the additional information provided by C & T to generate a pull-based schedule that insures raw materials are introduced into the DuPont gating process at the same rate as the constraint (fiber extrusion) is producing and in a manner that maintains balanced days of supply of all fibers in WIP plus downstream through the virtual buffer. All of the processes and inventory buffers between retail demand and DuPont’s WIP become one virtual buffer as shown above. For this to work C & T must provide as much information as possible in support of the scheduling process to eliminate risk, optimize balance, and help set DuPont’s constrained capacity to match the appropriate forecast period. We also have to convert end-items and fabric shortages in the virtual buffer into pounds of Nomex® fiber so we can drive DuPont’s manufacturing appropriately. This conversion is based on a special bill of material (BOM) that already exists at DuPont. DuPont uses it now to compute fiber requirements based on C & T end-item procurement actions. Finally, the vast majority of the time all work within the virtual buffer is supported by military delivery orders which, in turn, covers our virtual buffer shortages plus forecasted needs one SN replenishment lead-time into the future. However, some work in the virtual buffer may be “at risk” beyond the quantities supported by delivery orders or

11
more work may be necessary than is supported by current delivery orders. Therefore, sometimes we will have to reach further into the future than the time periods that the delivery orders cover by including open contracts and solicitations in our information sharing. Military delivery orders are the key to our solution because they almost always cover the necessary forecast period, inventory normally exists in the SN only to cover delivery orders, and DuPont uses them already as their basis for tracking completed and “open to make” production requirements. DuPont knows for every C & T delivery order how much of the fiber requirement they have and have not launched into production. Thus, now we have a strategy for substituting the pull of C & T’s procurement status and intentions for the pull of inventory shortages from the virtual buffer while eliminating virtually all risks that would preclude DuPont from manufacturing early. With this model in place, nothing more can be done to optimize DuPont’s contribution to the performance of the Nomex® SN from a manufacturing standpoint and this is extremely important because of the fact that fiber production is the constraint of the entire Nomex® SN. However, lower priority work still must be done to ensure the fiber released from DuPont’s finished goods is distributed in an optimum manner downstream through the SN partners to the end-item manufacturers. The research challenge now becomes how to effectively and efficiently use information existing in the C & T wholesale system to create the DBR pull schedule for DuPont. C & T managers actually practice a combination of demand pull and forecasting each time that they generate new contract actions. They first determine current shortages and then add forecasted demand for the period of time that their contract actions will cover. By assuming these contracting actions reasonably reflect accurate future demand, they can be used as our pull signals for the upstream SN partners. These SN partners, except for end-item manufacturers, sometimes launch their own component replenishment and manufacturing orders to their conservative demand forecasts. The reason that they do not launch early “at risk” is that the risk levels are normally too high. Major risk factors are that competitors will win the business, products made to current technical requirements will become obsolete because of technical changes, or C & T will significantly reduce expected procurement quantities. Risk Elimination. In the case of Nomex® end-items, DuPont is the only fiber producer so there is no risk that another company will win the business. Since DuPont makes a huge effort to know about and participate in all possible technical changes, there is little risk that they would get caught with obsolete inventory and this risk will be reduced significantly because our project will shorten lead-times and reduce inventories significantly. The final risk of significantly reduced procurements will also be mitigated greatly as our project enables C & T to automatically share inventory and procurement status as well as procurement and technical change intentions on a systematic and timely basis.

12
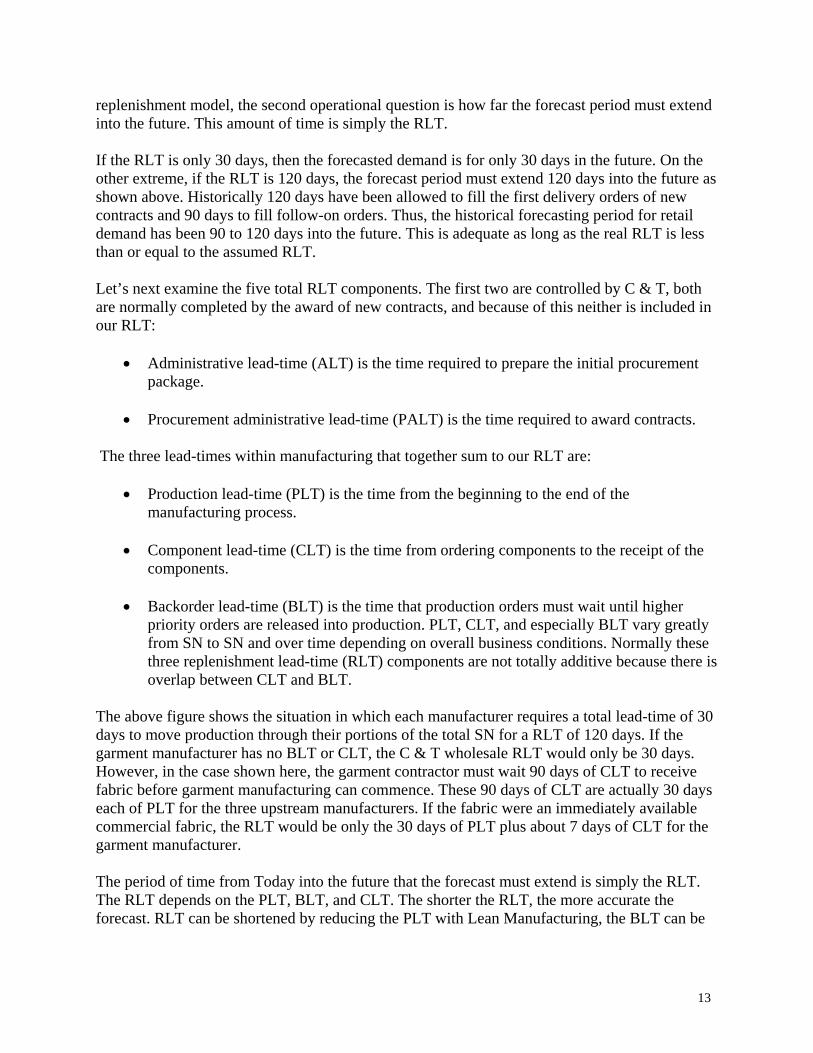
The key to minimizing these two risk factors and, at the same time optimizing upstream SN performance, is to balance and then minimize inventories from DuPont’s WIP through receipt of end-items into C & T’s wholesale inventory. 3.3 Creating the Supply Chain Forecast Let’s first review traditional forecasting requirements that C & T uses currently and then modify them to determine DuPont’s capacity requirements only at the total Nomex® fiber level. The following figure shows the basic components of the typical apparel SN and typical textile production lead-times when orders, raw materials, components, and end-items are flowing at a rate approximately equal to retail demand:
Figure 2 – Stage 2 or 3 SN Supply Chain Forecasting The first key operational question is how much inventory must be in the C & T Buffer to avoid stock outs. The inventory target in days of supply (DOS) is determined by the average days required to fill replenishment delivery orders at the average retail demand rate per day or the operational replenishment lead-time (RLT) plus the safety levels necessary to cover up-side variations in customer demand and RLT. Since the C & T system uses the standard forecasting
13
replenishment model, the second operational question is how far the forecast period must extend into the future. This amount of time is simply the RLT. If the RLT is only 30 days, then the forecasted demand is for only 30 days in the future. On the other extreme, if the RLT is 120 days, the forecast period must extend 120 days into the future as shown above. Historically 120 days have been allowed to fill the first delivery orders of new contracts and 90 days to fill follow-on orders. Thus, the historical forecasting period for retail demand has been 90 to 120 days into the future. This is adequate as long as the real RLT is less than or equal to the assumed RLT. Let’s next examine the five total RLT components. The first two are controlled by C & T, both are normally completed by the award of new contracts, and because of this neither is included in our RLT:
• Administrative lead-time (ALT) is the time required to prepare the initial procurement package.
• Procurement administrative lead-time (PALT) is the time required to award contracts.
The three lead-times within manufacturing that together sum to our RLT are:
• Production lead-time (PLT) is the time from the beginning to the end of the manufacturing process.
• Component lead-time (CLT) is the time from ordering components to the receipt of the
components.
• Backorder lead-time (BLT) is the time that production orders must wait until higher priority orders are released into production. PLT, CLT, and especially BLT vary greatly from SN to SN and over time depending on overall business conditions. Normally these three replenishment lead-time (RLT) components are not totally additive because there is overlap between CLT and BLT.
The above figure shows the situation in which each manufacturer requires a total lead-time of 30 days to move production through their portions of the total SN for a RLT of 120 days. If the garment manufacturer has no BLT or CLT, the C & T wholesale RLT would only be 30 days. However, in the case shown here, the garment contractor must wait 90 days of CLT to receive fabric before garment manufacturing can commence. These 90 days of CLT are actually 30 days each of PLT for the three upstream manufacturers. If the fabric were an immediately available commercial fabric, the RLT would be only the 30 days of PLT plus about 7 days of CLT for the garment manufacturer. The period of time from Today into the future that the forecast must extend is simply the RLT. The RLT depends on the PLT, BLT, and CLT. The shorter the RLT, the more accurate the forecast. RLT can be shortened by reducing the PLT with Lean Manufacturing, the BLT can be

14
reduced by not permitting a “gap” to occur in the SN, and the CLT can be reduced by synchronizing the SN and implementing Lean Manufacturing at each upstream SN partner. Thus, the first key to avoiding stock outs with minimum inventory in the current replenishment system is to replenish from a forecast of retail demand that goes as far into the future as the upstream SN requires to provide raw materials, components, and end-items. Stated differently, for optimum performance military delivery orders must drive every upstream SN partner to flow product in an unbroken stream at the same rate that the retail customers are consuming product. Otherwise, the SN is broken or “gapped” and military work is taken out of production causing the RLT to become extremely variable because of other higher priority backorders. For setting DuPont’s capacity requirements in our demand-pull model this means the collaborative C & T-DuPont forecast must be for one SN lead-time into the future. The above figure becomes our DBR model if we simply combine the last 3 “Make” entities with the C & T Buffer and depict our “pull” as net fiber shortages within our virtual buffer. Thus, our capacity forecasting lead-time requirement is 120 days and our DBR pull is the net “open to deliver” pounds of Nomex® fiber computed from procurement actions minus the pounds DuPont has already launched into production. The following Section addresses the SN maturity stage evolution and shows how the work accomplished in this project can be used to attain Stage 4. 3.4 Defining Supply Chain Maturity Stages With this background established, let’s now review how SNs evolve and position this project to move the typical C & T SN to the next level. There are six stages of supply chain evolution, each representing a step up in maturity and operating performance. Stage 1 – Minimum Throughput. This stage occurs when there are no raw materials or components flowing down the SN because the components of a new end-item are not commercially available or no one in the SN is willing to order components or produce at their own risk without firm military delivery orders. Replenishment orders must be passed sequentially upstream and unique components and raw materials such as Nomex® fiber are placed into production without forecasting or risk only in response to firm purchase orders. Delivery orders for Stage 1 SNs must be placed much earlier than the 120 days shown in the above figure because each SN partner normally has a highly variable “backlog” lead-time (BLT) of waiting work that must be placed into production before new orders can be launched. Thus the actual total component and end-item lead-times for Stage 1 SNs are highly variable and significantly longer than when a flow of raw materials and components is established in later Stages. Typical lead-times are 16 months at best for Stage 1 textile and apparel SNs that begin with fiber production. Thus, the C & T forecast upon which the initial Stage 1 delivery orders are based must reach 16 months or longer into the future so the fiber manufacturer can launch production of the quantity of fiber that will be required one full upstream lead-time before the need occurs. In this situation, the C & T portion of our Virtual Buffer must support retail needs for 16 months or longer if there is nothing else on order.
15
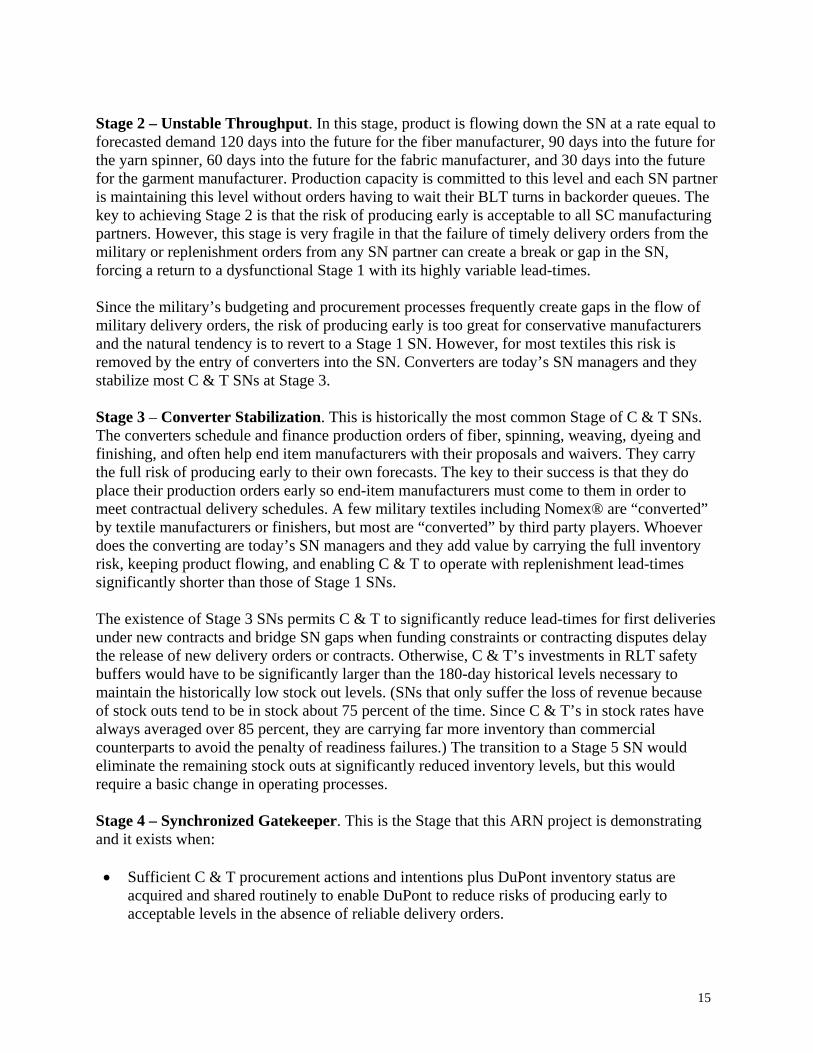
Stage 2 – Unstable Throughput. In this stage, product is flowing down the SN at a rate equal to forecasted demand 120 days into the future for the fiber manufacturer, 90 days into the future for the yarn spinner, 60 days into the future for the fabric manufacturer, and 30 days into the future for the garment manufacturer. Production capacity is committed to this level and each SN partner is maintaining this level without orders having to wait their BLT turns in backorder queues. The key to achieving Stage 2 is that the risk of producing early is acceptable to all SC manufacturing partners. However, this stage is very fragile in that the failure of timely delivery orders from the military or replenishment orders from any SN partner can create a break or gap in the SN, forcing a return to a dysfunctional Stage 1 with its highly variable lead-times. Since the military’s budgeting and procurement processes frequently create gaps in the flow of military delivery orders, the risk of producing early is too great for conservative manufacturers and the natural tendency is to revert to a Stage 1 SN. However, for most textiles this risk is removed by the entry of converters into the SN. Converters are today’s SN managers and they stabilize most C & T SNs at Stage 3. Stage 3 – Converter Stabilization. This is historically the most common Stage of C & T SNs. The converters schedule and finance production orders of fiber, spinning, weaving, dyeing and finishing, and often help end item manufacturers with their proposals and waivers. They carry the full risk of producing early to their own forecasts. The key to their success is that they do place their production orders early so end-item manufacturers must come to them in order to meet contractual delivery schedules. A few military textiles including Nomex® are “converted” by textile manufacturers or finishers, but most are “converted” by third party players. Whoever does the converting are today’s SN managers and they add value by carrying the full inventory risk, keeping product flowing, and enabling C & T to operate with replenishment lead-times significantly shorter than those of Stage 1 SNs. The existence of Stage 3 SNs permits C & T to significantly reduce lead-times for first deliveries under new contracts and bridge SN gaps when funding constraints or contracting disputes delay the release of new delivery orders or contracts. Otherwise, C & T’s investments in RLT safety buffers would have to be significantly larger than the 180-day historical levels necessary to maintain the historically low stock out levels. (SNs that only suffer the loss of revenue because of stock outs tend to be in stock about 75 percent of the time. Since C & T’s in stock rates have always averaged over 85 percent, they are carrying far more inventory than commercial counterparts to avoid the penalty of readiness failures.) The transition to a Stage 5 SN would eliminate the remaining stock outs at significantly reduced inventory levels, but this would require a basic change in operating processes. Stage 4 – Synchronized Gatekeeper. This is the Stage that this ARN project is demonstrating and it exists when: • Sufficient C & T procurement actions and intentions plus DuPont inventory status are
acquired and shared routinely to enable DuPont to reduce risks of producing early to acceptable levels in the absence of reliable delivery orders.

16
• The scope of shared information also includes all possible risk-reducing information including C & T’s on-hand inventories, inventory targets, delivery orders, contract quantities beyond existing delivery orders, solicitations, planned solicitations, and contemplated technical changes.
• DuPont uses this data and information to maintain capacity that reasonably matches
expected demand a SN lead-time into the future and launches manufacturing in a manner that maintains SN-wide total Nomex® fiber balance in days of supply.
Stage 5 – Fully Synchronized SN. This Stage extends collaboration and TAV from retail consumption to the upper-most unique raw materials manufacturing and synchronizes all corresponding ordering, shipping, and manufacturing launches on a frequent and automated basis. Synchronization includes planning at the family or PGC level and executing or scheduling at the NSN level as frequently (normally weekly) as each manufacturer conducts scheduling. Stage 6 – Maximum Throughput SN. This final Stage recognizes the value of flexible, fast-turn manufacturing and ensures a sufficient portion of each manufacturing level of unique products operates in this manner. The recognition is primarily in the forms of valuing fast throughput and the bundling of all possible end-items that are made interchangeably on the same production lines into single contracts for maximum surge flexibility. 3.5 DuPont Objectives Since DuPont is the only producer of Nomex® fiber and the melt spinning capacity is limited, a collaborative forecasting effort directly between C & T and DuPont can significantly reduce DuPont’s risk of producing fiber prior to receiving firm orders from downstream weavers. In addition, past ARN lessons learned can be applied to enable DuPont to schedule the fibers in shortest supply and thereby maintain an optimum, balanced Nomex® supply network. From DuPont’s standpoint, the primary objectives are to minimize DuPont’s risk of producing fiber before firm customer orders are in hand and, at the same time, to enable DuPont to schedule production to minimize their trade-off between changeover costs and inventory ownership costs. DuPont’s secondary objective is to generate a production schedule to meet the primary objectives with a minimum amount of work by DuPont’s scheduling department. 3.6 Detailed Solution The general approach was to use data available from C & T systems to generate three web-based forecast files or screens consisting of all information available to Item Managers and provide this information to DuPont. However, we first had had to create two cross reference files to convert NSN-level data to PGC-level data and Nomex® fiber number level of data: 1. The Bill of Material (BOM) File at Appendix 1 cross references PGCs and end-item names
to DuPont Nomex® fiber numbers, names, and a special BUSINESS CONFIDENTIAL fiber bill of materials (BOM). These BOM values are used to convert quantities of items to

17
pounds of Nomex® fibers by PGCs and fiber numbers. PGC specification numbers were added for convenience in looking up PGCs. BOM values are all set at 1 pound per end-item in this report to avoid classifying it BUSINESS CONFIDENTIAL.
2. The Master Cross Reference (X-Ref) File at Appendix 2 cross references NSNs, NSN sizes,
PGCs, PGC names, Nomex® fiber numbers, and BOM values. The primary reason for creating this file was that PGCs were not available in the contract files. Nomex® fiber numbers and BOM values were added for convenience and a roll-up cross reference capability was created at the PGC and fiber number levels.
Next, we had to create four files to compute expected demand and on-hand quantities of items and convert this demand and on-hand status into pounds of Nomex® fibers: 3. The Average Monthly Demand (AMD) File at Appendix 3 computes the AMD of each
NSN and rolls the demand up to the PGC level. 4. The PGC On-hand (PGC OH) File at Appendix 4 computes the months of supply (MOS)
on-hand at the PGC level from the quantities on hand at the NSN levels. Backorders were originally included in this file so we could generate net shortages. The original intent was to use this file as the basis for computing the wholesale inventory shortages required for classical DBR pull scheduling, but procurement actions and intentions were used instead. The PGC OH File is used for information only. The reason it is not used is that the Item Managers almost always have both shortages and replenishment quantities included in open delivery orders and delivery orders rather than shortages are the real pull recognized by the upstream SN players. If this assumption is not valid at any time in the future, this file should be used to compute the shortages that are not on existing delivery orders or there will be a potential shortfall of Nomex® fibers.
5. The C & T Fiber On-hand (Fiber OH) File at Appendix 5 computes the pounds of Nomex®
fibers on-hand at wholesale based on wholesale inventories and the Nomex® BOM. It rolls the PGC sub-totals up to the Nomex® fiber number level for use in the Scheduling File.
NOTE: Spreadsheets 2 through 5 can be combined in the relational data base to generate all values computed separately in this Excel workbook provided the confidentiality of the BOM conversion factor is adequately protected within the database and upon display. Individual screens can then be designed based on these spreadsheets for access and display to meet different needs. 6. The Fiber Average Monthly Demand (Fiber AMD) File at Appendix 6 computes the AMD
of Nomex® fibers from the PGC AMD quantity demand and the BOM. It rolls the PGC sub-totals up to the Nomex® fiber number level for use in the Scheduling File.
Then we created the three web-based demand status files or screens for DuPont to use to accept various amounts of demand at various levels of risk:

18
7. Delivery Order (DO) Status File at Appendix 7 shows the open delivery orders at the CLIN level and rolls them up to the Nomex® Fiber level. It adds the 2 percent allowance that everyone takes and displays the DO open quantity that has not yet been received into wholesale inventory. The last part of the file computes the DO open pounds of Nomex® fiber, permits DuPont to record the pounds of fiber already scheduled or made against the contract delivery order number level, and computes the net fiber pounds open to schedule and launch into manufacturing. Open delivery order requirements are considered to be essentially risk free production requirements for DuPont.
8. Contract Status File (Contracts) at Appendix 8 shows the same information and conducts
the same calculations as the DO File above. The purpose of this file is to capture the open to make contractual quantities that exist beyond the delivery orders addressed above. This means that a subjective estimate must be made as to how far into the future to record open to make requirements. DuPont has an additional field in which to record the open to make quantities that they would be willing to make should they have sufficient capacity. Close-in open to make requirements carry little risk, but further out requirements on multiple year contracts can be extremely risky.
The original plan was to have Item Managers or Procurement Specialists validate the accuracy and completeness of the delivery order and contract data on each screen. However, during testing, we determined that sufficiently accurate information could be extracted automatically for delivery orders and contracts without the need for validation.
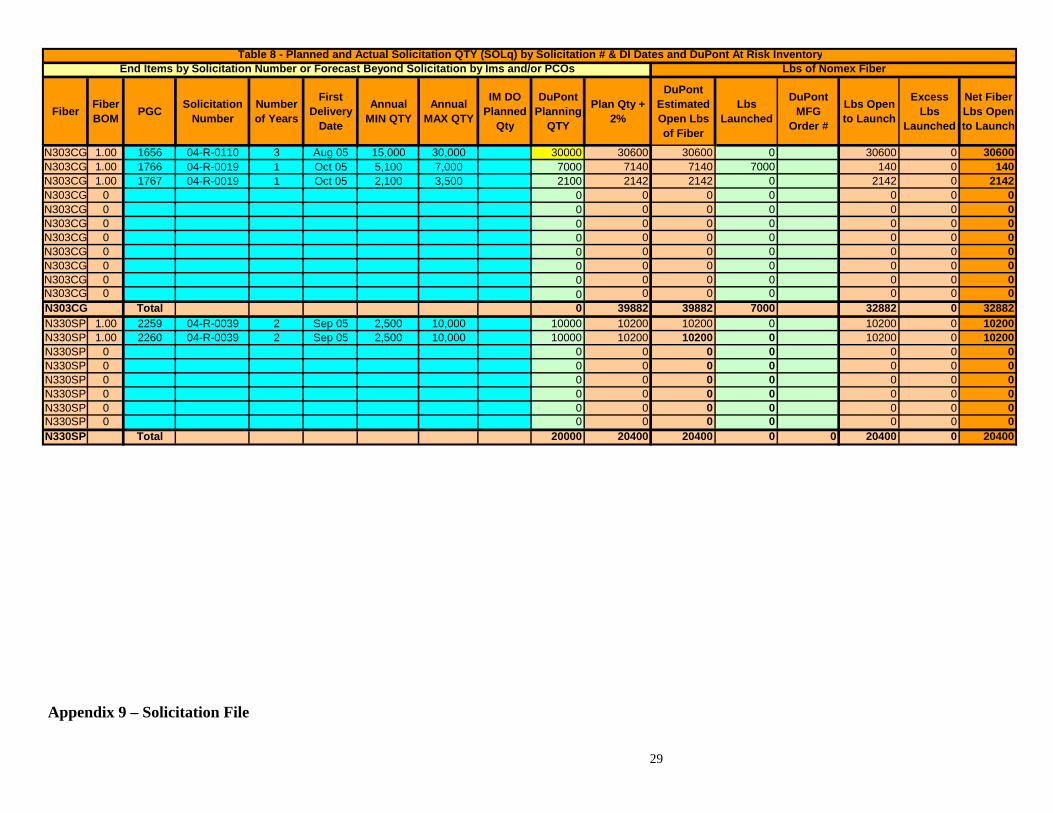
9. Solicitation and Other (Solicitation) File at Appendix 9 shows all available information for solicitations and planned solicitations in the same general format as the Contract Status File. This file had to be completed manually by Procurement Officers since this data was not available from military sources in any standardized format. Modulant was tasked to build a standard VIM screen for Procurement Specialists to use for creating solicitations. The objectives were to standardize the creation of solicitations, capture this data in the ARN database, and use it to populate automatically all of the required solicitation processes.
Finally, we created a scheduling screen for DuPont:
10. Scheduling (Schedule) File at Appendix 10 compiles at the fiber level pounds of fiber covered and open to make from the DO, Contract, and Solicitation Files; sums months of supply (MOS) open to make; permits DuPont to enter candidate pounds of fiber to schedule by fiber type and risk level while honoring constrained capacity and balancing the downstream SN in MOS; computes the total pounds of each fiber to schedule; and shows the balance level of the SN in MOS.
The DuPont scheduler must consider all current knowledge including contractual requirements and rated orders as he enters candidate scheduling pounds of fiber. This permits the creation of an optimum, balanced SN while honoring business and legal commitments as well as the fiber extrusion constraint.

19
11. The final Schedule File is also at Appendix 10. This contains the key fields of the Scheduling File sorted by beginning days of supply so DuPont can see by priority the type and quantity of each fiber that must be made during the next scheduling cycle.
In the example in the Appendix DuPont should launch into production its assumed capacity of 300,000 pounds of the 9 military Nomex® fibers the quantities and priorities shown in Table 10 from top to bottom. This will result in a balance of just over 4 months of supply in the virtual buffer plus DuPont’s WIP. This is the most important single step that can be taken to improve the Nomex® SN. 4. Conclusions Accomplishments This project determined the information that should be shared in a collaborative environment with upstream SN partners and demonstrated that it exists in, and can be extracted from, current systems and presented to upstream SN partners in an efficient manner. This not only minimizes the risk of early production, but also can be executed in a manner to schedule constrained manufacturing capacity according to SN-wide priority requirements. Benefits The stage is set to drastically reduce readiness issues and lower the costs of inventories, manufacturing, and managing shortages across entire supply networks of most of C & T’s key products. Lessons Learned Synchronized pull scheduling which is known to be far superior to forecast-based scheduling can be readily implemented for entire SNs that originate with a sole producer of the defining end-item component such as Nomex®. This is extremely important because the advanced functionality of most military apparel items resides in unique fibers produced by single sources. This can be done in a modified DBR model. The first step is recognizing that Item Managers already attempt to match the drumbeat of retail demand with new contracts and delivery orders and actively improving this as part of our optimization strategy. The second step is converting this drumbeat of new contracts and delivery orders into required pounds of individual fibers in a manner that the fiber manufacturer can use to maintain SN-wide fiber balance through the scheduling process. Full collaboration between C & T and the gatekeeper of the particular SN is the mandatory foundation for this to work. Recommendations Implement the pull scheduling concepts developed in this project as a standard way of synchronizing the introduction of military unique raw materials, fabrics, and other key products into their respective supply networks. This will make a huge difference in the cost and readiness of high technology items that originate from single sources. Examples other than Nomex® are

20
the BDU SN of combat uniforms, the ECWCS SN, the Kevlar® SN, and the poly wool dress uniform SN. Extend the synchronized SN concept downstream into the virtual buffer of players to ensure the first products produced are distributed through the yarn, fabric, and finishing manufacturers to the end-item manufacturers in a balanced manner.

21
Computed
PGC END ITEMS End-Item Spec Fiber Name Fiber# BOMFabric Name Fabric# BOM
Yarn Name Yarn# BOM
470 Coveralls, Flyers 27/P Green (Men's) PD-96-17 N303 Staple Sage Green N303SG 1.00 (for future use) (for future use)491 Drawers, Flyers, Aramid, Natural, CWU-43/P MIL-D-85040 T450 Natural NOMEX® T450N 1.00526 Gloves, Flyers, Summer, Green MIL 81188 N303 Staple Sage Green N303SG 1.00621 Jacket, Flyers, Winter, 45/P, Green MIL-J-83388 N101 Filament Sage Green N101SG 1.00622 Jacket, Flyers, Summer, 36/P, Green MIL-J-83388 N101 Filament Sage Green N101SG 1.00683 Trousers, Cold Weather, 18/P MIL-T-83385 N101 Filament Sage Green N101SG 1.00781 Undershirt, Flyers, Aramid, Natural, MIL-D-85040 T450 Natural NOMEX® T450N 1.00
1656 Gloves, CVC MIL-G-44108 N303 Staple Camo Green N303CG 1.001755 Body Armor, CVC, Outer Shell MIL-B-44194 N303 Staple Camo Green N303CG 1.001766 Liner, Coat, CVC, Green MIL-L-44299 N303 Staple Camo Green N303CG 1.001767 Liner, Trousers, CVC, Green MIL-L-44299 N303 Staple Camo Green N303CG 1.001931 Coveralls, Flyers, Cold Weather, CWU-64/P MIL-C-87230 N101 Filament Sage Green N101SG 1.002176 Coveralls, CVC Tan 380 MIL-C-44077 N303 Staple Desert Tan N303DT 1.002179 Jacket, CVC Tan MIL-J-43924 N303 Staple Desert Tan N303DT 1.002259 Jacket, Flyers, ACWCS, Woodland, Shell MIL-DTL-31010 N330 Staple Printable N330SP 1.002260 Jacket, Flyers, ACWCS, Jacket Lining MIL-DTL-31010 N330 Staple Printable N330SP 1.002281 Coveralls, Flyers, 27/P Tan (Women's AF) PD-99-04 N303 Staple Desert Tan N303DT 1.002284 Coveralls, CVC Green MIL-C-44077 N303 Staple Camo Green N303CG 1.002285 Jacket, CVC Green MIL-J-43924 N303 Staple Sage Green N303SG 1.002370 Gloves, Cold Weather, HAU 15/P NAWC PD N303 Staple Sage Green N303SG 1.002376 Coat, Combat, Woodland (ABDU) PD-02-12 N330 Staple Printable N330SP 1.002377 Trousers, Combat, Woodland (ABDU) PD-02-13 N330 Staple Printable N330SP 1.002378 Coat, Combat, Tan (ABDU) PD-02-12 N303 Staple Desert Tan N303DT 1.002379 Trousers, Combat, Tan (ABDU) PD-02-13 N303 Staple Desert Tan N303DT 1.002442 Coveralls, Flyers 27/P Tan (Men's) PD-96-17 N303 Staple Desert Tan N303DT 1.002456 Suit, Anti-G, Green MIL-W-81116 N303 Staple Sage Green N303SG 1.002578 Gloves, Flyers, Summer, Tan MIL 81188 N303 Staple Desert Tan N303DT 1.002579 Gloves, Flyers, Summer, Black MIL-81188 N303 Staple Black N303SB 1.002753 Jacket, Flyers, Summer, 36/P, Tan MIL-J-83388 N101 Filament Desert Tan N101DT 1.002754 Jacket, Flyers, Winter, 45/P, Tan MIL-J-83388 N101 Filament Desert Tan N101DT 1.002773 Jacket, Cold Weather, Navy PD-4-99Rev B Type 462 NOMEX® N462 1.002826 Coveralls, Flyers, 27/P Green (Women's AF) PD-99-04 N303 Staple Sage Green N303SG 1.00
Table 1 - Master Nomex Bill of Materials (BOM) - BOM includes all Working Losses from Fiber Forward (Updated 18 Jul 05)Fiber Bill of Materials (BOM) Lbs/Item Fabric BOM Yds/Item Yarn BOM Lbs/Item
Master Nomex Bill of Materials (BOM)SAMMS InputLabels IM Input or Change DuPont Input
Appendix 1 – Nomex® Bill of Material (BOM) File

22
Fiber BOM PGC NSN Item Name Item Size Count00470 8415010438376 coveralls,flyers' 32 short 100470 8415010438377 coveralls,flyers' 32 regular 100470 8415010438378 coveralls,flyers' 34 short 100470 8415010438379 coveralls,flyers' 34 regular 100470 8415010438380 coveralls,flyers' 36 short 100470 8415010438381 coveralls,flyers' 36 regular 100470 8415010438382 coveralls,flyers' 36 long 100470 8415010438383 coveralls,flyers' 38 short 100470 8415010438384 coveralls,flyers' 38 regular 100470 8415010438385 coveralls,flyers' 38 long 100470 8415010438386 coveralls,flyers' 40 short 100470 8415010438387 coveralls,flyers' 40 regular 100470 8415010438388 coveralls,flyers' 40 long 100470 8415010438389 coveralls,flyers' 42 short 100470 8415010438390 coveralls,flyers' 42 long 100470 8415010438391 coveralls,flyers' 44 short 100470 8415010438392 coveralls,flyers' 44 regular 100470 8415010438393 coveralls,flyers' 44 long 100470 8415010438394 coveralls,flyers' 46 short 100470 8415010438395 coveralls,flyers' 46 regular 100470 8415010438396 coveralls,flyers' 46 long 100470 8415010438397 coveralls,flyers' 48 regular 100470 8415010438398 coveralls,flyers' 48 long 100470 8415010439529 coveralls,flyers' 42 regular 100470 8415014370741 coveralls,flyers' 52 regular 100470 8415014370743 coveralls,flyers' 50 long 100470 8415014370744 coveralls,flyers' 50 regular 100470 8415014373941 coveralls,flyers' 52 long 1
N303SG 1.00 00470 PGC 8415014373941 coveralls,flyers' 2800491 8415004674075 drawers,flyers' small00491 8415004674076 drawers,flyers' medium00491 8415004674078 drawers,flyers' large00491 8415004674100 drawers,flyers' x-large00491 8415010434036 drawers,flyers' x-small
T450N 1.00 00491 PGC 8415010434036 drawers,flyers' 0
Table 2 - Master X-Reference of Fiber #, BOM value, PGC, NSN, & Item Name
Appendix 2 – Master Cross Reference File

23
PGC NSN Customer ADq AMD470 Total 136948 11412
491 8415004674075 NonRTC 3477 290491 8415004674076 NonRTC 16417 1368491 8415004674078 NonRTC 19075 1590491 8415004674100 NonRTC 9046 754491 8415010434036 NonRTC 368 31
491 Total 48383 4032526 8415010290109 NonRTC 26382 2199526 8415010290111 NonRTC 50108 4176526 8415010290112 NonRTC 113384 9449526 8415010290113 NonRTC 130555 10880526 8415010290116 NonRTC 95904 7992526 8415010401453 NonRTC 6287 524526 8415010402012 NonRTC 5721 477526 8415014828417 NonRTC 973 81526 8415014828420 NonRTC 14060 1172
526 Total 443374 36948621 8415003101111 NonRTC 981 82621 8415003101126 NonRTC 3576 298621 8415003101133 NonRTC 7306 609621 8415003101140 NonRTC 6262 522621 8415014221505 NonRTC 1241 103
621 Total 19366 1614622 8415010101910 NonRTC 8340 695622 8415010101911 NonRTC 2360 197622 8415010101912 NonRTC 996 83622 8415010101913 NonRTC 5704 475622 8415014790017 NonRTC 501 42
622 Total 17901 1492
Table 3 C&TNSN & PGC Annual Demand & AMD QTY
Appendix 3 – Average Monthly Demand File

24
PGC NSN OHq MOS470 Total 86672 7.59491 Total 47010 11.66526 Total 49364 1.34621 Total 30659 19.00
622 8415010101910 4125622 8415010101910 19622 8415010101910 11622 8415010101910 280622 8415010101912 94622 8415010101913 3420622 8415010101913 1622 8415010101913 2622 8415010101913 13622 8415010101913 100622 8415010101913 14
622 Total 8079 5.42683 8415010654956 45683 8415010654957 74683 8415010654959 26683 8415010654959 32683 8415010654963 31683 8415010654963 3
683 Total 211 70.33781 8415004856548 2009781 8415004856680 2163781 8415004856680 29781 8415004856681 219781 8415004856681 122781 8415010438375 317781 8415010438375 26781 8415010438375 26781 8415010438375 12
781 Total 4923 1.001656 8415010749428 211656 8415010749429 1151656 8415010749430 411656 8415010749430 71656 8415010749430 111656 8415010749432 28521656 8415010749432 10
1656 Total 3057 12.19
Table 3a C&T PGC OH QTY & MOS
Appendix 4 – PGC On-hand Quantity File

25
PGC NSN OHq PGC Fiber # BOM Fiber Lbs2753 8415014916184 56 2753 N101DT 1.00 562753 8415014916188 243 2753 N101DT 1.00 2432753 8415014916188 224 2753 N101DT 1.00 2242753 8415014916190 742 2753 N101DT 1.00 7422753 8415014916190 521 2753 N101DT 1.00 5212753 8415014916192 548 2753 N101DT 1.00 5482753 8415014916192 553 2753 N101DT 1.00 5532754 8415014916122 12 2754 N101DT 1.00 122754 8415014916122 77 2754 N101DT 1.00 772754 8415014916124 278 2754 N101DT 1.00 2782754 8415014916124 157 2754 N101DT 1.00 1572754 8415014916125 408 2754 N101DT 1.00 4082754 8415014916125 561 2754 N101DT 1.00 5612754 8415014916127 320 2754 N101DT 1.00 3202754 8415014916127 423 2754 N101DT 1.00 423
5123 N101DT Total 5123621 8415003101111 2208 621 N101SG 1.00 2208621 8415003101111 1846 621 N101SG 1.00 1846
Table 4 C&T OH PGC QTY & MOS OH PGC & Fiber
Appendix 5 – Fiber On-hand Pounds File

26
PGC BOM Demand AMD Fiber # Lbs AMD2753 1.00 1026 86 N101DT 862754 1.00 1033 86 N101DT 86
2059 172 N101DT Total 172621 1.00 19366 1614 N101SG 1614622 1.00 17901 1492 N101SG 1492683 1.00 36 3 N101SG 3
1931 1.00 1834 153 N101SG 15339137 3261 N101SG Total 3261
1656 1.00 3010 251 N303CG 2511755 1.00 3290 274 N303CG 2741766 1.00 234 20 N303CG 201767 1.00 504 42 N303CG 422284 1.00 36769 3064 N303CG 3064
43807 3651 N303CG Total 36512176 1.00 27812 2318 N303DT 23182179 1.00 10381 865 N303DT 8652281 1.00 6000 500 N303DT 5002378 1.00 37947 3162 N303DT 31622379 1.00 44635 3720 N303DT 37202442 1.00 92430 7703 N303DT 77032578 1.00 66078 5507 N303DT 5507
285283 23774 N303DT Total 237742579 1.00 9288 774 N303SB 774
9288 774 N303SB Total 774
Table 5 - AMD by PGC & Fiber Nomex Fiber
Appendix 6 – Fiber Average Monthly Demand File

27
Fiber # Fiber BOM PGC PIIN/ Contract
NumberCAGE
#D.O.
# CLIN NSN Award QTY
Award Date
Ship QTY
Ship Date
AWD QTY +
2%
DO Open QTY
Awd Lbs Fiber
Open Lbs
Fiber @ DSCP
LBS Launched
MFG Order #
Lbs Open to Launch
Excess Lbs
Launched
Net Fiber Lbs Open to Launch
N101DT Total 12820 5564 13076 7512 13076 7512 0 13076 0 13076N101SG 1.00 622 SP010005D4158 1SSG5 1 0001AA 8415010101910 848 03/25/05 0 865 865 865 865 865 0 865N101SG 1.00 622 SP010005D4158 1SSG5 1 0001BA 8415010101910 852 03/25/05 96 05/27/05 869 773 869 773 869 0 869N101SG 1.00 622 SP010005D4158 1SSG5 1 0002AA 8415010101911 3008 03/25/05 640 07/29/05 3068 2428 3068 2428 3068 0 3068N101SG 1.00 622 SP010005D4158 1SSG5 1 0002BA 8415010101911 2992 03/25/05 944 06/24/05 3052 2108 3052 2108 3052 0 3052N101SG 1.00 622 SP010005D4158 1SSG5 1 0003AA 8415010101912 2000 03/25/05 672 07/29/05 2040 1368 2040 1368 7000 0 4960 -4960N101SG Total 9700 2352 9894 7542 9894 7542 7000 7854 4960 2894N303CG 1.00 1755 SP010003D4024 62283 1 0002AA 8470011106107 700 01/30/03 644 04/18/05 714 70 714 70 428 286 0 286N303CG 1.00 1755 SP010003D4024 62283 2 0004AA 8470011106107 1500 04/16/03 1290 07/14/05 1530 240 1530 240 918 612 0 612N303CG 1.00 1755 SP010003D4024 62283 2 0006AA 8470011106111 900 04/16/03 820 07/29/05 918 98 918 98 551 367 0 367N303CG 1.00 1755 SP010003D4024 62283 2 0007AA 8470011106109 530 09/21/04 400 07/29/05 541 141 541 141 324 216 0 216N303CG 1.00 1755 SP010003D4101 70343 5 0001AA 8475013123144 718 07/18/05 0 732 732 732 732 439 293 0 293N303CG 1.00 1755 SP010003D4101 70343 5 0001BA 8475013123144 722 07/18/05 0 736 736 736 736 442 295 0 295N303CG 1.00 1755 SP010003D4101 70343 5 0002AA 8475013123145 389 07/18/05 0 397 397 397 397 238 159 0 159
Delivery Order End-Items Lbs of Nomex FiberTable 6 - SORTED and Sub-Totaled Delivery Order Launched and Open Fiber Status FOR August 15 COMPUTATIONS
Appendix 7 – Delivery Order Status File

28
Fiber Fiber BOM PGC PIIN/ Contract
Number CAGE Option Year
Open Annual
MIN QTY
Open Annual
MAX QTY
IM DO Planned
Qty
First End-Item
Delivery Date
DuPont Planning
QTY
Plan Qty + 2%
Open Lbs
Fiber on Options
Lbs Launched
MFG Order #
Lbs Open to Launch
Excess Lbs
Launched
Net Fiber Lbs Open to Launch
N101SG 1.00 621 03-D-4128 1SSG5 1 100 40000 100 102 102 0 102 0 102N101SG 1.00 621 03-D-4128 1SSG5 2 100 40000 0 0 0 0 0 0 0N101SG 1.00 622 05-D-4158 1SSG5 1 11500 40000 11500 11730 11730 13000 0 1270 -1270N101SG 1.00 622 05-D-4158 1SSG5 2 11500 40000 0 0 0 0 0 0 0N101SG Total 0 11832 11832 13000 102 1270 -1168N303CG 1.00 1656 05D4100 1V524 1 15000 30000 15000 15300 15300 1500 13800 0 13800N303CG 1.00 1656 05D4100 1V524 2 15000 30000 0 0 0 0 0 0 0N303CG 1.00 1656 05D4100 1V524 3 15000 30000 0 0 0 0 0 0 0N303CG Total 0 15300 15300 1500 13800 0 13800N303DT 1.00 2442 05D4114 06GQ8 1 79000 190000 79000 80580 80580 0 80580 0 80580N303DT 1.00 2442 05D4114 06GQ8 2 79000 190000 0 0 0 0 0 0 0N303DT 1.00 2578 03D4154 1CB38 2 18000 43200 0 0 0 0 0 0 0N303DT 1.00 2578 03D4154 1CB38 3 18000 43200 0 0 0 0 0 0 0N303DT 1.00 2578 03D4155 1V524 2 12000 28800 0 0 0 0 0 0 0N303DT 1.00 2578 03D4155 1V524 3 12000 28800 0 0 0 0 0 0 0N303DT Total 0 80580 80580 0 80580 0 80580N303SB 1.00 2579 03D4154 1CB38 2 4200 7800 0 0 0 0 0 0 0N303SB 1.00 2579 03D4154 1CB38 3 4200 7800 0 0 0 0 0 0 0N303SB 1.00 2579 03D4155 1V524 2 2800 5200 0 0 0 0 0 0 0N303SB 1.00 2579 03D4155 1V524 3 2800 5200 0 0 0 0 0 0 0N303SB Total 0 0 0 0 0 0 0N303SG 1.00 526 03D4154 1CB38 2 108000 169320 0 0 0 0 0 0 0N303SG 1.00 526 03D4154 1CB38 3 108000 169320 0 0 0 0 0 0 0N303SG 1.00 526 03D4155 1V524 2 72000 112880 0 0 0 0 0 0 0N303SG 1.00 526 03D4155 1V524 3 72000 112880 0 0 0 0 0 0 0N303SG 1.00 2370 05D4205 1CB38 1 36000 210000 36000 36720 36720 0 36720 0 36720N303SG 1.00 2370 05D4205 1CB38 2 36000 210000 0 0 0 0 0 0 0N303SG 1.00 2370 05D4205 1CB38 3 36000 210000 0 0 0 0 0 0 0N303SG 1.00 2370 05D4206 6K235 1 24000 140000 24000 24480 24480 0 24480 0 24480N303SG 1.00 2370 05D4206 6K235 2 24000 140000 0 0 0 0 0 0 0N303SG 1.00 2370 05D4206 6K235 3 24000 140000 0 0 0 0 0 0 0N303SG Total 0 61200 61200 0 61200 0 61200
Table 7 - Contract QTY by Contract # and Due In Dates Beyond Existing Delivery OrdersContract End-Items - IMs manually post contractual status beyond Delivery Orders covered in Table 7 Lbs of Nomex Fiber
Appendix 8 – Contract Status File
29
Fiber Fiber BOM PGC Solicitation
NumberNumber of Years
First Delivery
Date
Annual MIN QTY
Annual MAX QTY
IM DO Planned
Qty
DuPont Planning
QTY
Plan Qty + 2%
DuPont Estimated Open Lbs of Fiber
Lbs Launched
DuPont MFG
Order #
Lbs Open to Launch
Excess Lbs
Launched
Net Fiber Lbs Open to Launch
N303CG 1.00 1656 04-R-0110 3 Aug 05 15,000 30,000 30000 30600 30600 0 30600 0 30600N303CG 1.00 1766 04-R-0019 1 Oct 05 5,100 7,000 7000 7140 7140 7000 140 0 140N303CG 1.00 1767 04-R-0019 1 Oct 05 2,100 3,500 2100 2142 2142 0 2142 0 2142N303CG 0 0 0 0 0 0 0 0N303CG 0 0 0 0 0 0 0 0N303CG 0 0 0 0 0 0 0 0N303CG 0 0 0 0 0 0 0 0N303CG 0 0 0 0 0 0 0 0N303CG 0 0 0 0 0 0 0 0N303CG 0 0 0 0 0 0 0 0N303CG 0 0 0 0 0 0 0 0N303CG Total 0 39882 39882 7000 32882 0 32882N330SP 1.00 2259 04-R-0039 2 Sep 05 2,500 10,000 10000 10200 10200 0 10200 0 10200N330SP 1.00 2260 04-R-0039 2 Sep 05 2,500 10,000 10000 10200 10200 0 10200 0 10200N330SP 0 0 0 0 0 0 0 0N330SP 0 0 0 0 0 0 0 0N330SP 0 0 0 0 0 0 0 0N330SP 0 0 0 0 0 0 0 0N330SP 0 0 0 0 0 0 0 0N330SP 0 0 0 0 0 0 0 0N330SP Total 20000 20400 20400 0 0 20400 0 20400
Lbs of Nomex FiberEnd Items by Solicitation Number or Forecast Beyond Solicitation by Ims and/or PCOsTable 8 - Planned and Actual Solicitation QTY (SOLq) by Solicitation # & DI Dates and DuPont At Risk Inventory
Appendix 9 – Solicitation File

30
300000
Fiber PGCTotal
Fiber Lbs AMD
C&T MOS OH by Fiber #
On Open Delivery Orders
On Open Contracts
On Open Solicitations & Forecasts
Total Lbs Covered
Begin MOS
CoveredDO Lbs Open
DO MOS Open
Contract Lbs Open
Contract MOS Open
SOL Lbs
Open
Sol MOS Open
Total Lbs
Open
Total MOS Open
Launch DO Lbs
Launch Contract
LbsLaunch Sol Lbs
Total Launch
Lbs
End MOS OH
N101DT All 172 30 0 0 0 0 0.00 13076 76.21 0 0.00 0 0.00 13076 76.21 750 0 0 750 4.37N101SG All 3261 13 7000 13000 0 20000 6.13 2894 0.89 -1168 -0.36 0 0.00 1726 0.53 0 0 0 0 6.13N303CG All 3651 14 10792 1500 7000 19292 5.28 43737 11.98 13800 3.78 32882 9.01 90419 24.77 0 0 0 0 5.28N303DT All 23774 1 75000 0 0 75000 3.15 406690 17.11 80580 3.39 0 0.00 487270 20.50 38700 0 0 38700 4.78N303SB All 774 1 0 0 0 0 0.00 19968 25.80 0 0.00 0 0.00 19968 25.80 3400 0 0 3400 4.39N303SG All 87994 2 150000 0 0 150000 1.70 887006 10.08 61200 0.70 0 0.00 948206 10.78 208000 0 0 208000 4.07N330SP All 2579 2 5000 0 0 5000 1.94 263770 102.26 0 0.00 20400 7.91 284170 110.17 5500 0 0 5500 4.07
N462 All 2233 11 2000 0 0 2000 0.90 5140 2.30 510 0.23 0 0.00 5650 2.53 5650 0 0 5650 3.43T450N All 8953 6 0 0 0 0 0.00 181376 20.26 0 0.00 0 0.00 181376 20.26 38000 38000 4.24Total: All 133390 3 249792 14500 7000 271292 2.03 1642282 12.31 154922 1.16 53282 0.40 1850486 13.87 300000 0 0 300000 4.28
Lbs to Launch & Capacity: Fiber Lbs & MOS Covered (Launched) by DuPont Open Fiber Lbs & MOS DuPont can Launch by Risk LevelFibers & AMDTable 9 Nomex FiberStatus and Scheduling Needs
Fiber
BeginMOS OH
Launch Lbs
End MOS OH
N101DT 0.00 750 4.37N330SP 0.00 3400 4.39N101SG 0.00 38000 4.24N303SG 0.90 5650 3.43N303CG 1.70 208000 4.07N303DT 1.94 5500 4.07
N462 3.15 38700 4.78T450N 5.28 0 5.28
N303SB 6.13 0 6.13Totals: 2.03 300000 4.28
Table 10 Schedule (Needs Sorted by Begin MOS OH)
Appendix 10 – Scheduling File and Sorted Schedule File

31
Appendix 11 - Acronyms
ALT Administrative Lead-time. Time required to prepare a procurement action for initial release.
AMD Average Monthly Demand computed by dividing the total demand for a year by 12.
ARN The Apparel Research Network.
BLT Backorder Lead-time. The time an order has to wait to go into manufacturing because other orders arrived first or have a higher priority for production.
BOM Bill of Material. Conversion factor for each Nomex® end-item (averaged for all sizes at the PGC-level) used to compute pounds of the Nomex® fiber DuPont must enter into production for each contract or delivery order.
BSM Business System Modernization. C & T Clothing and Textiles. CAR Clemson Apparel Research. CLIN Contract Line Item Number. CWT Customer Wait Time.
CLT Component Lead-time. The time required from order placement to item receipt.
DBR Drum Buffer Rope. Constraints based pull scheduling technique. DO Delivery Order. DOS Days of supply. FG Finished Goods. MOS Months of Supply. NSN National Stock Number. OH On Hand. Inventory quantity or days of supply on hand. OST Order Ship Time.
PALT Procurement Administrative Lead-time. Time from contract award until first lot is entered into production.
PCO Procurement Contracting Officer. PGC Procurement Group Code. RLT Replenishment Lead-Time. SC Supply Chain. SN Supply Network. TAV Total Asset Visibility. VIM Virtual Item Manager.
VIM-ASAP Virtual Item Manager Web-based tool for providing delivery order status and collecting manufacturing and shipping status.
WIP Work In Process.
Appendix 11 – Acronyms