dlese data services workshop - … · dlese data services workshop may 24-27, ... 7,8,9,12,13 ......
TRANSCRIPT

DLESE Data Services Workshop May 24-27, 2004
Evaluation Report
October 8, 2004
Prepared by
Susan Buhr and Susan Lynds DLESE Evaluation Services
Cooperative Institute for Research in Environmental Sciences (CIRES)
University of Colorado
October 4, 2004

2
Table of Contents
Table of Contents ................................................................................................2
Executive Summary ............................................................................................4
1 Introduction ..................................................................................................5
2 Evaluation Procedures: Data Gathered and Analytical Methods ............6
3 Previous Data Use........................................................................................7 3.1 Respondents ......................................................................................................7 3.2 The E/CD group has had successful attempts at using data for educational purposes, while the D/T group has had mixed success................................................8 3.3 Both groups encounter similar barriers to educational use of data. .................10 3.4 Both E/CD and D/T groups encountered similar barriers to obtaining specific types of data. ..............................................................................................................12 3.5 Learning goals associated with data use center upon data skills, specific content areas and inquiry............................................................................................13 3.6 Manipulation of data generally needed before being suitable for student use. 14 3.7 Data analysis performed by users consists primarily of display and image processing, followed by quantitative statistical analysis. ............................................15 3.8 Data use instruction commonly employs on-line, non-human mediated strategies for both researchers and educational users. ..............................................16 3.9 Data providers describe use of their data primarily at the university level. ......18
4 Daily and Final Evaluation Questionnaires: What was most effective, what was most enjoyable, what should be changed? ............................................20
4.1 Mix of professional roles changed over the course of the workshop ...............20 4.2 Aspects of the workshop participants valued most were talks and presentations, breakout time, interaction with other community .................................20 4.3 Aspects of the workshop participants wished to change were lack of variety and downtime, more time to interact and work on chapters, education/technical mix. 21 4.4 Both groups cite over-emphasis on technology at the beginning, near perfect mix days three and four. .............................................................................................22 4.5 Lack of team coherence on final day was problematic. ...................................24
5 Poster Session ...........................................................................................26

3
5.1 Participants became newly aware of data tool and educational projects as a result of the poster session. ........................................................................................26 5.2 Several posters were more visited and of more interest to participants...........27 5.3 Participants had suggestions about the poster session ...................................28
6 Final Day Questionnaire ............................................................................29 6.1 Participants were relatively satisfied with the team process. Questions 7,8,9,12,13. .................................................................................................................30 6.2 Where completed, participants felt their voices were represented in the discussion questions, Swikis and team direction/plan. ...............................................32 6.3 Participants anticipate using data/tools in instruction or modifying tools or data in response to educator/curriculum developer feedback. ...........................................33 6.4 Participants rated the meeting logistics and facilities as excellent...................34
7 Conclusions and Summary.................. .....................................................36
8 References..................................................................................................37
Appendix 1.........................................................................................................38
Appendix 2.........................................................................................................50
4
Executive Summary
This is a report intended to inform members of the DLESE Data Services Team. The main points presented here include:
• Participants particularly value the meeting as an opportunity for networking
and making connections with members of the other groups. In keeping with this, they wished for more “breakout time” and more “down time” in the evenings. Likewise, the aspects they valued most were interacting with the other groups, learning from one another, and spending time in breakout sessions.
• Participants valued the talks, especially those that were primarily educational or that outlined lessons learned. Once breakout sessions started, participants valued the breakout sessions most.
• Participants wished for greater education emphasis in the first two days especially. Both educator and technological groups indicated this preference. Several respondents suggested that educational needs and not data/tool availability be the starting point of both the workshop and chapter development. This is in keeping with findings that while some in the education group are aware of data sources as “brands,” the educational group also identified data types as distributed through an educational project or as a means to meet learning goals.
• The groups encountered similar technological barriers in their use of data, though problems encountered by educators and curriculum developers were exacerbated by lack of high bandwidth access.
• Instruction offered by data providers tends to emphasize on-line non-human-mediated strategies for both researchers and educators.
• Participants described the need to manipulate data before the data may be used for education. Sometimes this need is a barrier that precludes educational use. Data providers were most aware of educational use of their data or tools at the university level.
• Participants wished for greater attendance on the last day. Team work was stymied for most groups because only the educators remained.
• Participants wished to change the discussion questions in the first two days but this comment disappeared by the last two days.
• Participants felt their group was successful and well facilitated. • Participants’ knowledge of data projects increased through the poster
session. • The location, facilities, and organization of the meeting were considered
excellent.

5
DLESE Data Services Workshop 2004
Evaluation Report
1 Introduction This report provides information to DLESE Data Services Workshop organizers
to help them understand the degree to which the meeting (as perceived and experienced by participants) met goals and to inform planning for future events. Presented below are a description of the conference; the methods by which the evaluation data were elicited, compiled, and analyzed; a profile of the participants who responded to the surveys; presentation of responses to survey items; and conclusions and recommendations for future action. Appendices include selections of tabular and coded open-ended data.
The goals of the DLESE Data Services Workshop were: a. To bridge the communication gap between technologists and educators about
the resources, obstacles, needs and terms used by the other group. b. To establish working relationships between data providers/tool builders and
curriculum developers/educators. c. To provide clear, relatively low-barrier pathways to developing educational
resources using data (using data portals, EET chapters) d. To produce guidelines and information for the DLESE community about data use
in the classroom (from the technical perspective and from the educational perspective). A number of related goals were articulated for the educator/curriculum developer group (E/CD) and the data provider/tool builder group (D/T).
To reach these goals, the workshop was organized to include participants representing a range of DLESE community members who are concerned with data use: data providers, data tool builders, curriculum developers, educators, and research scientists. The workshop participants were staggered so as to make the first day of the meeting primarily technical, the last day primarily education-oriented, and the intervening second and third days focused on interaction between the two groups. Participants were chosen for their contributions of data, tools or scientific and educational expertise needed for the development of a series of Earth Exploration Toolbook chapters.

6
2 Evaluation Procedures: Data Gathered and Analytical Methods
Data informing this report were collected through a series of seven questionnaires, which are uploaded on the Data Services Workshop Swiki:
• Data Use Questionnaire. Administered on the first day. Eight questions (one multiple choice, five mixed Y/N/explanation, and two open-ended)
• Daily Questionnaire. Administered four times, at the end of each day. Five questions (one multiple choice, one Likert, three open-ended)
• Poster Session Questionnaire. Three questions (one multiple choice for each of the 20 posters, one regular multiple choice, and one open-ended).
• Final Day Questionnaire. Twenty questions (one multiple choice, seven open-ended, twelve mixed Likert/explanation).
The results of Likert, multiple choice, and Y/N questions were processed in Excel and are presented in figures. Open-ended questions were categorized and coded for dominant themes in NVivo and summarized individually. Two professional role groups were identified to use in disaggregated data--Educators/Curriculum Developers (E/CD) and Data Providers/Tool Developers (D/T). Disaggregation based on the respondents’ professional role group was done on selected open-ended questions and on all Excel data. Those who identified their primary professional role as “researcher” are included in the aggregated data but not in the disaggregated analysis, as no assumptions could be made regarding the researchers’ past data experience.

7
3 Previous Data Use
3.1 Respondents There were 49 respondents to the Data Use Questionnaire, 21 in the E/CD group and 20 in the D/T group. The seven respondents who were scientists were not included in the disaggregated analysis, but were included in the aggregated data.
Figure 3.1 Professional roles of respondents to data use questionnaire. Data use questions were analyzed both as an aggregated group and as disaggregated groups made up of educator/curriculum developers and data/tool providers. Researchers were removed from the disaggregated data set as no assumptions could be made about their relative experience with data. The disaggregated responses to questions about successful and unsuccessful attempts to use data, success at using a particular type of data, educator requests received by data providers, and data providers’ knowledge of educational use of their data are below in Graph 3.2.

8
Figure 3.2 Data use responses grouped by professional role.
3.2 The E/CD group has had successful attempts at using data for educational purposes, while the D/T group has had mixed success.
Evidence: Respondents in the E/CD group note proportionally more success than the D/T group at using data for an educational purpose. Both groups had made unsuccessful attempts to use data for an educational purpose. Question 2b asked what data sources respondents had used successfully. The results are displayed in Figure 3.3. Some respondents, primarily the E/CD group, mentioned only general data types such as climate/meteorology, ocean science, and space science data without specifying the data source from which they tried to obtain the data. These results are shown in Figure 3.4.

9
Figure 3.3 Specific data sources which had been used successfully by the E/CD and D/T groups.
Figure 3.4 Unspecified types of data that have been used successfully by the E/CD and D/T groups. Evidence: Both E/CD and D/T respondents were able to successfully use data from agency sources, such as NOAA, USGS, NASA, and the U.S. Census Bureau. Educator/curriculum developers also successfully used sources that had not been used by data/tool providers such as EPA and NIH. Sources that have extensive educational profiles, such as the National Optical Astronomy Observatory and GLOBE, were also mentioned. The E/CD group expressed successful use of data types from unattributed sources more than did the D/T group. Recommendation:

10
Since the E/CD group does not appear to be as aware of the data “brand” as the D/T group and uses data through educational projects as well as through agencies, the Data Services Workshop organizers should continue to encourage data providers to raise the educational profile of select datasets as useful for teaching particular learning objectives. This could be done through facilitating strategic partnerships, through providing clear examples and models of educational data use, and through outreach to data providers as is being done through this workshop. The development of Earth Exploration Toolbook chapters could serve as one model of this change in emphasis. The message of the data should focus upon educational use; emphasis of the agency and mission source of the data should be secondary to this. This change was suggested in a quote from an educator/curriculum developer on the final day:
“Why start with tools and data and try to find a use for them? Instead why not start with curriculum standards, concepts that teachers have identified as a challenge for students and other pedagogical/educational goals and then find data and tools to address them.”
3.3 Both groups encounter similar barriers to educational use of data. Evidence: Question 3 asked what barriers had been encountered in unsuccessful attempts to use data for an educational purpose. Hardware and connection barriers were mentioned most often, and several people cited aspects of the data being inappropriate for educational purposes. Interestingly, both the E/CD and D/T groups encountered technical problems in using data.

11
Figure 3.5 Barriers to data use encountered by the E/CD and D/T groups. Of the 12 education respondents, five cited inadequate computers and connectivity problems, along with limitations due to large data files. Three mentioned problems with the data format and two cited difficulty customizing data so that it is appropriate. One mentioned difficulty using the software and unfamiliarity with file extensions as barriers. Another cited a similar barrier—not understanding the acronyms used for the dataset. Of the six data/tool respondents, two cited problems with a mismatch between education needs and the way the tools/data are set up. One person mentioned the data format as being a problem due to their lack of understanding of the students’ prior knowledge. Another cited unspecified incompatibility problems as a barrier. One person said they couldn’t locate the data they needed and another cited lack of upper level administrative support as a barrier. Discussion and Recommendation: The Data Services group should recognize that all users are inhibited by technical formatting, compatibility, subsetting, and discovery issues, but that these problems are exacerbated when trying to use data for educational purposes. It is possible that an appeal to broadening use of data by all (peer scientists, stakeholders, decision-makers, educational audiences) will be more motivating to data providers and data administrators than an appeal that focuses on educators.

12
3.4 Both E/CD and D/T groups encountered similar barriers to obtaining specific types of data.
Question 4 also asked about unsuccessful attempts to obtain a specific type of data. It asks what data they were looking for and what made them give up the attempt to obtain it.
Figure 3.6 Characteristics of unsuccessful attempts to obtain data. Evidence: Unsuccessful attempts to use a specific type of data foundered upon technical problems rather than educational needs. It appears that E/CD respondents had more issues with technological access, while both E/CD and D/T respondents were stymied by data discovery and cost. Of seven education group respondents, three mentioned lack of accessibility (i.e., not user friendly, lack of information, not understanding format) as the problem. Three also mentioned problems locating the data they wanted. One mentioned connectivity problems, while one specified the dataset was too big to download. One mentioned cost as being the reason they gave up on the data. Another said the data they wanted was “very difficult to acquire” without specifying the exact reasons for this difficulty. Of the four data/tool respondents, one mentioned cost as a factor. Two mentioned difficulty isolating the exact data they needed. Another cited proprietary restrictions on the data. One person said their experience was with Goddard DAAf before OpenDap.

13
Figure 3.7 Main issues for which E/CD users request help. These observations are corroborated by the answers to Question 7, in which data providers describe requests for technical help rather than help with educational issues, such as which datasets are suitable for which learning objectives. Recommendation: Again, an appeal to enable data use by all groups will benefit educators as well as other stakeholders and scientists. The Data Services Team should consider ways to lessen the technological access barriers between the E/CD group and data providers, such as encouraging data providers to make less bandwidth-intensive subsets of educationally useful data available in familiar formats.
3.5 Learning goals associated with data use center upon data skills, specific content areas and inquiry. The learning goals that respondents have addressed through the use of data were addressed by Question 2a.

14
Figure 3.8 Learning goals addressed through use of data. Recommendation: The Data Services Team should communicate the breadth of important learning outcomes that are valued by the E/CD group to the D/T group. Data skills and content-specific learning are both significant, along with scientific process skills. This should be taken into account as the D/T group seeks to raise the educational profile of the data.
3.6 Manipulation of data generally needed before being suitable for student use. Evidence: Question 2c was written in a way that made some answers difficult to interpret. The question asked whether respondents used data “as is” or if they needed to customize it before use. Nine respondents answered this question with “yes,” “no,” “both,” or “sometimes.” One answered “yes,” commenting that the format must be clean for students; it is not clear if they used the data as-is or not. Two of the “no” answers included comments that they used only a web tool, which probably means they used the data as-is. One answered, “EET” which doesn’t carry much meaning in this context, nor does the comment “data incorporated.” One answered “both.”

15
Figure 3.9 Data customization required before use. Seven respondents clearly stated they used the data as-is; one of these noted that it would have been useful to have training to customize the data. Three mentioned cleaning up the data (e.g., confirming units or metadata) as their processing and one isolated the concepts/skills required. Recommendation: More work is needed to know what specifically will help the E/CD group use data without having to do inordinate amounts of work ahead of time. Some E/CD group members may want to have students do this customization as a learning exercise; from informal conversations with educators it is clear many would like to be spared this barrier. It is recommended that the Data Services Team learn more about what the E/CD group prefers under what circumstances and encourage data providers to provide a suite of options to meet educational user needs.
3.7 Data analysis performed by users consists primarily of display and image processing, followed by quantitative statistical analysis. Question 2d asked what data analysis procedures users performed on the data.

16
Figure 3.10 Data analysis end-users performed on data. The majority of respondents mentioned some sort of process related to visualization of data, such as visualizations, display analysis, plotting/graphing/mapping, or image processing. Twelve respondents cited quantitative statistical analysis procedures. Five people specifically mentioned using Excel and one mentioned ArcView. Several generally referenced finding patterns and relationships in the data sets and one described it as a data documentation process instead of analysis. Recommendation: Since end-users do data manipulation and quantitative analysis as well as work with image-level products, the Data Workshop Team should encourage data providers to provide data in a variety of modes. The trend among data providers to preferentially archive images rather than data which is less processed may run counter to the desires of the end users.
3.8 Data use instruction commonly employs on-line, non-human mediated strategies for both researchers and educational users. Evidence: Question 5 asked, “What type of instruction, if any, does your project offer for teachers/students who want to access or analyze some specific data?” Question 6 inquired, “What type of instruction does your project offer for researchers who wish to access or analyze some specific data?”

17
Figure 3.11 Instruction offered to teachers/students for data use.
Figure 3.12 Instruction offered to researchers for data use. These questions may not have been well understood, as some of the answers to Question 5 seemed more appropriate for Question 6 and vice versa. However, many of the instruction strategies were the same for both educators and researchers. The most commonly mentioned instruction was online non-human mediated strategies such as online documentation and tutorials. Email and phone support are offered, while several providers offer more face-to-face or education-oriented help. Several do not mention any instruction at all.

18
Discussion and Recommendations: It is well-known that in-depth professional development with robust support and follow-up is needed if any education innovation is to be adopted by teachers (Loucks-Horsley, 1998). This reality should be communicated to data providers and tool builders who wish to build a user base among educators. The Data Services Team can provide examples and models of professional development that work for educators, while recognizing the data provider need for low-cost solutions. Provision of concept models and curriculum information helps educators place the data in an educational context and should be encouraged. Again, the argument should be made to data providers that any strategy that makes data easier to use will broaden all user-base segments, not just the educational segment.
3.9 Data providers describe use of their data primarily at the university level. Question 8 asks how the respondent’s data or tool has ever been used in an educational context.
Figure 3.13 Data use in an educational context.

19
Figure 3.14 Data/tool distributors mentioned. Most people replied by explaining who the users of the data/tool have been. Where an educational level was described, use at the university level was by far the most common. One tool was used at all levels and six give general usage information without describing what levels the usage encompasses. Where respondents described distribution of data/tools as “educational use,” VGEE was mentioned by two respondents; GLOBE, EOSWEBSTER, Lawrence Hall of Science, LDEO, and NSDL were each mentioned once as distributors. Discussion and Recommendations: Given the barriers to data access and discovery, and the earlier description of the need for the instructor or student to manipulate data before use, it is not surprising that educational use has been primarily university level. University faculty members do not have the same technological barriers of bandwidth, and often use data familiar to them as researchers in their courses. It is interesting that respondents give the distributor name as a proxy for the context in which the data has been used. We recommend that the Data Services Team determine more specifics about the ways in which the data or tool is being used in education. This can be used to identify any disciplines or groups which offer fertile ground for outreach. Given the relative lack of barriers to use at the university level, the Data Services Team should seek ways to increase use at this level, while at the same time trying to lower barriers for middle and high school use. If, as has been suggested, a segment of the DLESE Ambassadors program is directed at university faculty, examples and models of data use should be part of the resources available to Ambassadors. Development of “teaching boxes” for use of data at the university level may also be useful.

20
4 Daily and Final Evaluation Questionnaires: What was most effective, what was most enjoyable, what should be changed?
The same daily questionnaire was administered at the end of each day. Detailed summaries of the responses to each daily questionnaire are included as an appendix. The overall responses expressed in the daily evaluations and the final evaluation questionnaire are discussed within this section.
4.1 Mix of professional roles changed over the course of the workshop
The number of respondents in each of five professional roles generally decreased on the last day, particularly the Data Providers (0) and Tool Developers (1). Overall response was the greatest on Wednesday.
Figure 4.1 Professional roles of questionnaire respondents. Generally, this mix was satisfactory, but dissatisfaction with the lack of D/T group members on the final day was evident on the final day questionnaire. This will be discussed in more depth later in this report.
4.2 Aspects of the workshop participants valued most were talks and presentations, breakout time, interaction with others in the community In the beginning days of the workshop, the talks were mentioned most often as the most effective aspect of the day; similarly, exposure to new information (unspecified whether this was during talks or not) was mentioned by a number of others and interaction with/learning from the other groups. As the workshop progressed, respondents

21
identified breakout sessions as most effective and enjoyable, along with educational talks such as Rajul Pandya’s VGEE talk and John Pickle’s “museum talk.” David Herring’s talk was frequently cited as most enjoyable or most effective. Most of the comments were very short answers like “presentations” or “breakout sessions”...here are two examples that were a bit more explanatory:
One participant mentioned “interacting directly with the educators attending to hear first hand their needs, wants, and expectations.” One data provider/tool developer said the most valuable things were, “talking one on one with schoolteachers, the breakout groups, jargon free demos of software tools.”
Discussion and Recommendations: The common thread through all aspects of the meeting that was considered most valuable is the ability to learn from and about the other groups. These groups share a common interest and goal, and the opportunity to have a meeting of the minds was both the driving force behind this workshop and the most enjoyable and effective experience had by participants. The Data Services Team should seek to include more such opportunities in the second workshop. A greater emphasis at the beginning of the meeting on shared experiences or shared tasks would get this process started sooner. Meeting strategies which describe lessons learned as a result of shared work, or strategies such as small group work should occur throughout the meeting in order to encourage community-building.
4.3 Aspects of the workshop participants wished to change were lack of variety and downtime, more time to interact and work on chapters, education/technical mix. The most frequently mentioned change was a request for fewer talks and more time in breakouts. Many also requested more education presence for a better balance with the technology issues. On the final day questionnaire, especially with the E/CD group, there was a request to change the mix/balance of education and technology to include more education. A number also requested more time for breakouts. Out of ten education respondents, five would like to see changes in the mix of technology and education. Two commented on the Swiki, one requesting additional space and the other apparently suggesting a daily summary (difficult to tell). One requested more time for breakouts and one requested more information on mining data. Of the 11 data/tool respondents, one commented on the jargon in day two, and one wanted teacher presentations; other than these remarks, there were not comments on

22
the ed/tech mix. Three wanted more time or a different structure for the breakouts. One requested less overlap of presentations. Two wanted more contact with DLESE and one wanted more opportunity to suggest changes (not sure to what). One person requested more large-group discussion. One person didn’t like people typing on laptops during sessions. Discussion and Recommendations: Respondents made recommendations for changes in their comments, such as putting the emphasis on education at the beginning of the workshop and having more “best practices” technology talks instead of individual project description level talks. Both of these suggestions would meet requests of the participants; putting educational emphasis first would model the change in emphasis needed from data providers in order to serve educational audiences better. Having fewer technology talks would free up time for in-depth interaction, authentic shared work, and breakout time.
4.4 Both groups cite over-emphasis on technology at the beginning, near perfect mix on days three and four. Respondents’ assessment of the mix of technology to education in the daily schedules showed a slight over-emphasis on technology for the first two days, but nearly a perfect balance the last two days.
Figure 4.2 Daily technology/education mix. Disaggregating the professional roles into two respondent groups, Educators/Curriculum Developers and Data Providers/Tool Developers resulted in the following figures:

23
Figure 4.3 Daily respondents’ professional roles. As with the all-role figure above, the daily mix appears to have been slightly too technical the first two days, but nearly perfect the last two days.
Figure 4.4 Daily technology/education mix. Open-ended responses corroborated the Likert-scale results. In response to the question “what should be changed?”, respondents made the following example comments:
An educator/curriculum developer wrote, “eliminate purely technical sessions.” Another suggested, “Have a teacher and tech person to work together to create learning activity, then present activity and discuss process that it took to group’ Another suggested a ”balanced program of educators and data providers”
24
One of the data providers/tool developers said they, “wanted talks from educators who have been through the process of collaboration on data services for educators” Another in this group suggested, “lowering level of presentations to be more accessible to teachers” From Thursday’s what to change question, an educator requested “more educational focus with developers”
Discussion and Recommendations: Since both E/CD and D/T respondents suggested the mix was too technical, this should be changed in the next workshop. This finding is corroborated by other comments described later in this report, in which the educational talks were most appreciated, and the technical talks were thought to be too similar to one another.
4.5 Lack of team coherence on final day was problematic. As noted in the mix of professional roles represented from day to day, the lack of data providers and tool builders in attendance on the final day was problematic for those remaining, as the comments below demonstrate:
From Thursday’s what to change question, one educator/curriculum developer suggested “having people stay the whole day.” Another commented, “I was only member of chapter team who was here today.”
This is also demonstrated in answers to “what would you have changed” on Thursday’s daily questionnaire.

25
Figure 4.5 What respondents would have changed. Discussion and Recommendations: The lack of D/T group members on Thursday brought an abrupt end to the interactions that had been the most enjoyable part of the meeting. It also left the remaining team members to work on chapters without the support of the expertise of the rest of their group, and without the shared vision that was still being formed. While a significant number of educators and curriculum developers were present on the first day, enabling the beginnings of shared communities, only one tool builder, the chair of the committee to meet the next day, was still in attendance on the final day. It is recommended that the groups not be split up either on the first day or the last day, and that opportunities for authentic group interaction be built in throughout the workshop.

26
5 Poster Session
5.1 Participants became newly aware of data tool and educational projects as a result of the poster session. The poster session questionnaire asked which the twenty posters were visited and which ones were new to the respondents. The two figures below indicate the results.
Figure 5.1 Poster visitation and topic awareness. Discussion: EET and the Landsat posters were familiar to many people before the session. MyWorld and the Web Image Slide Tray were new to the most people. Since the E/CD participants had had a teleconference before the meeting about the EET it is not surprising that they were already aware of the project. This question was designed to see if the workshop goal to increase awareness of different data and educational

27
projects was met, and to give some baseline data regarding the level of awareness in this community.
5.2 Several posters were more visited and of more interest to participants. The three posters with visitation significantly higher than the others were THREDDS, MyWorld, and the Integrated Data Viewer. Those with significantly fewer visits were one of the EET posters, Students Exploring Data, Middleware, and the Maps of Postglacial Vegetation Change.
Figure 5.2 Poster visitation. Open-ended Question 3 asked, “Of the projects you have become aware of here, which are most interesting or useful to you? Why?” Of the 12 responses, five mentioned MyWorld, three mentioned IDV, and two mentioned Ocean Science Study. Also mentioned were Landsat, GEON, Maps of Postglacial, Web Image Slide Tray, and remote sensing applications. Discussion and Recommendations:

28
It is difficult to tell from this data why certain posters were visited or not visited. It is possible that placement of entrances or food/beverage stations or traffic patterns influenced this. Tool, data, and education posters are all considered interesting. In response to this, the Data Services Team should keep a mix of all project types.
5.3 Participants had suggestions about the poster session. The final day questionnaire asked for comments about the poster session, some of which are pasted below. Participants who were staffing posters noted they were unable to visit other posters. Many participants were tired at the end of a long day and found the event overwhelming. Those who enjoyed the poster session noted the opportunity to “drill deeper,” talk with providers, and use the tools they learned about. Respondent comments included the following:
“The relationships between data providers, tool developers, curriculum developers and educators crystallized for me then.” “the poster session was [a] helpful way to drill deeper into participants work.” “[It was] good to see several of the posters and discuss them with the providers.” “I had a poster, so I didn’t get to see the others..” “Handouts should be provided for later review”. “Lots to see, so not able to be too thorough.” “I was very tired.”
Discussion and Recommendations: Participants are tired at the end of the day. Recommend saving time with fewer talks and having a shorter session earlier in the day. Participants desire more down time in general, so this would be a partial response. Suggesting that poster presenters give handouts such as poster miniatures or brochures will also help participants process their new knowledge later.
29
6 Final Day Questionnaire
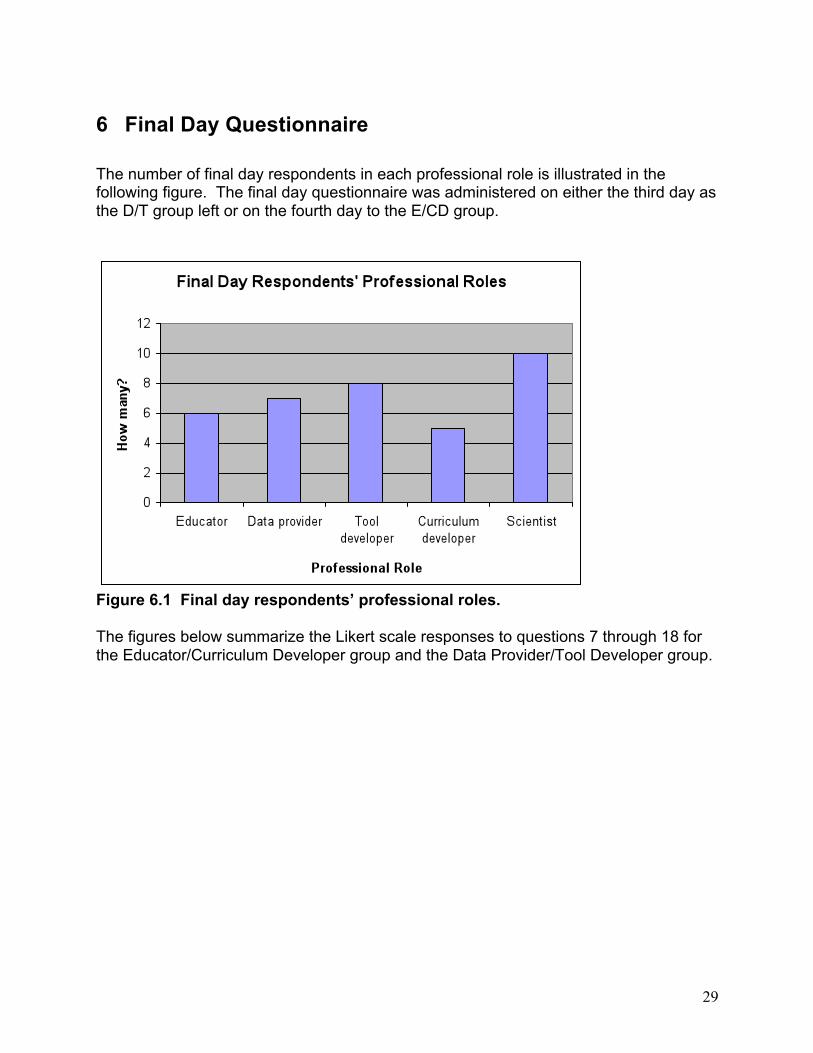
The number of final day respondents in each professional role is illustrated in the following figure. The final day questionnaire was administered on either the third day as the D/T group left or on the fourth day to the E/CD group.
Figure 6.1 Final day respondents’ professional roles. The figures below summarize the Likert scale responses to questions 7 through 18 for the Educator/Curriculum Developer group and the Data Provider/Tool Developer group.
30
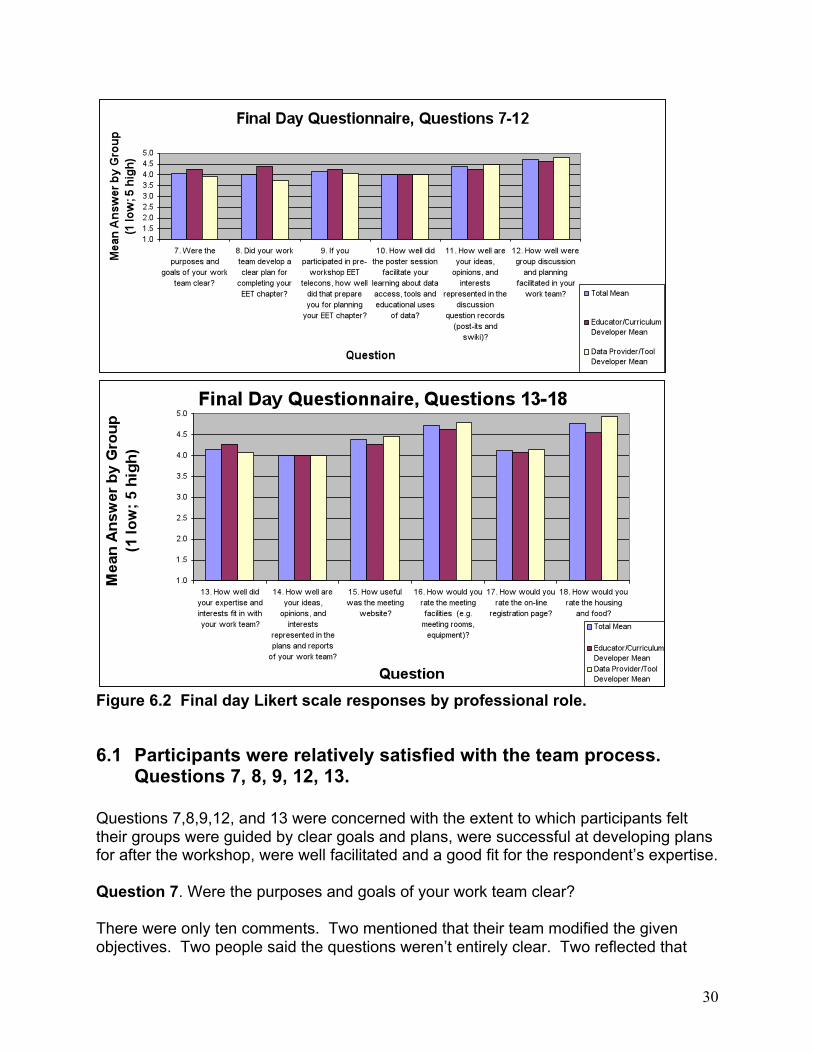
Figure 6.2 Final day Likert scale responses by professional role.
6.1 Participants were relatively satisfied with the team process. Questions 7, 8, 9, 12, 13.
Questions 7,8,9,12, and 13 were concerned with the extent to which participants felt their groups were guided by clear goals and plans, were successful at developing plans for after the workshop, were well facilitated and a good fit for the respondent’s expertise. Question 7. Were the purposes and goals of your work team clear? There were only ten comments. Two mentioned that their team modified the given objectives. Two people said the questions weren’t entirely clear. Two reflected that

31
they were not aware of the purpose of the breakout teams. One person mentioned that determining the scope for the chapter was the most difficult part. Two others said the goals were clear and briefly mentioned how their team implemented their task. This comment was fairly typical who said the work team purposes were effective:
“The written directions were fairly clear. Our group jumped ahead and worked on the EET directly.”
The following two comments demonstrated some of the uncertainty felt by other respondents:
“I did not realize this was going to be one of the dominant goals - to complete vs. explain process of developing collaborating projects” “I was not clear how simple or complex EET needed to be. Do the concepts related to the activity that utilize our tool have to relate to earth systems concepts directly or be a stepping stone to getting there?”
Question 8. Did your work team develop a clear plan for completing your EET chapter? Ten participants answered this. Two mentioned that EET was probably not an appropriate location for the resource they were working on. Five indicated they were in the process of working towards the goal of completing the chapter. One reported no direct discussion on writing the chapter, though one of the team would be contacting the others. One respondent said they were rushed at the end, and one expressed thanks for an excellent team. One respondent gave this analysis of the team’s work:
“We need a production schedule--which we will generate. We do have designated tasks and known responsibilities. We are committed to completing the chapter.”
Question 9. If you participated in pre-workshop EET telecons, how well did that prepare you for planning your EET chapter? Only four participants commented on this question. They all felt it had been a productive experience.
“I would have been quite lost without having the teleconference experience ” “knowing chapter segments to organize our work helped”
Question 13. How well did your expertise and interests fit in with your work team?

32
Education vs Data/Tool Disaggregation: Out of four education respondents, two felt they had contributions to make. One said “not at all in science or tool background.” One merely commented that the team leaned towards the tech side rather than education. Of the two data/tool respondents, one commented they had a great group and the other said the group used their data. Team Disaggregation: Three respondents were from the Museum group; two said their contributions were welcome but one said the trend was away from their expertise (tech not ed). Two respondents were in the Ridge team; one felt they had contributions to make; the other was an educator who didn’t feel they had any contributions to make in science or tool background--it’s unclear whether they felt they made contributions in the education area. EO, NGDC, and PMEL groups had a single respondent; both expressed satisfaction with their group. One representative comment was:
“I felt I was able to offer opinions from my technology and educational backgrounds”
Question 12. How well were group discussion and planning facilitated in your work team? Out of four responses, one was the facilitator and said no more. One reported that their facilitator was excellent. The other two reported a need for more focus at times. Discussion and Recommendations: Lack of response to some of these questions requires caution in analysis. However, steps to increase the clarity of the purpose of the workshop, ensuring that facilitators are well-chosen and prepared, and early intervention in groups that are going off-course are recommended. Much of this may be accomplished by pre-workshop training of facilitators, and perhaps by the examples derived from this workshop. One respondent particularly appreciated guidance for their team:
“Glad that DLESE/TERC people popped in the last day of discussions to provide focus ideas”
6.2 Where completed, participants felt their voices were represented in the discussion questions, Swikis, and team direction/plan. Questions 11 and 14 were concerned with the extent to which participants felt their voices and opinions were represented in the group documents such as Swikis and plans.

33
Question 11. How well are your ideas, opinions, and interests represented in the discussion question records (post-its and Swiki)? Two respondents were from education group; they both liked the Swiki and found it useful. Two of the data/tool group responded; one said they needed supportive software and another didn’t have wireless. Question 14. How well are your ideas, opinions, and interests represented in the plans and reports of your work team? Both respondents from the education group were on the Museum team; one reported they used a team member’s dataset (perhaps instead of the respondents’ data?—unknown); the other respondent repeated their answer to question 13 (that the team leaned towards tech—perhaps instead of their expertise of education). One respondent was from the data/tool group and commented that their team “could have done a better job, took us a while to begin fleshing out a chapter.” This respondent was from the Landsat group. Another member of the Landsat team (not in education or data/tool role) commented they weren’t done with the reports. A member of Ridge (not in education or data/tool role) said they were uncertain whether the Swiki was completed.
6.3 Participants anticipate using data/tools in instruction or modifying tools or data in response to educator/curriculum developer feedback.
Question 6. What are one or two specific things that you plan to do in your work as a result of this workshop? Of 38 respondents, 14 mentioned integrating tools or data they discovered at the workshop in their classroom or other work. Eleven discussed modifying their tools or data to be more appropriate for education. Eight mentioned continued work with EET. Five said they would pursue collaboration and networking with others to enhance their work. See Figure 6.3.

34
Figure 6.3 How participants plan to integrate workshop into their work.
6.4 Participants rated the meeting logistics and facilities as excellent. Questions 15, 16, 18, and 19 were concerned with the meeting logistics and facilities. In general, responses were positive. Where a change was suggested, it often had to do with connectivity issues such as firewalls and wireless access. Some respondents also wished the facility was more convenient to town. Food, lodging, and the meeting website were all considered good. Question 15 How useful was the meeting website? Of 12 respondents, five commented on the Swiki; three of them thought it was great; one said they needed a Swiki recorder; and one explained that they used easels then transferred the text to the Swiki. Four people commented that they planned to continue using the website; one of these mentioned it would be a model for future workshops. Two people commented on the fact that the website was kept updated. One person mentioned that the site was tremendously well organized.
“will be better for review. In our groups, we used easels. Comments were later transferred to swiki. “the fact that it was constantly updated was comforting” “It is useful, but I didn't use it a lot. After hearing more about it now, I will know better how to use it.”
Question 16. How would you rate the meeting facilities? The eight comments were varied:
• I like having everything together • too cool first day, but great after that • Firewall policies were troublesome...
35
• great food • wireless networking a plus--better if high speed access in rooms though. Power
strips in meeting rooms would be helpful • more internet, ethernet ports • needed white boards • beautiful setting, plenty of room. Good food and beverage service, good internet
connection Question 18. How would you rate the housing and food? All five who answered said they were quite good. Question 19. Was there any logistics information you wish you had? The eight responses were quite varied:
• better weather forecast • confusing who would make hotel reservations and who was going to pay for the
meals • more tourist type information @ online registration time • distance from local stores • location could have been more convenient • agenda prepared beforehand so I know more in advance what to expect • I wasn't clear on sign in / registration when I got here • yes. Better instructions about how to make my data available. I brought a CD
but a url was all that I could enter in the website.

36
7 Conclusions and Summary The goals of the DLESE Data Services Workshop were: a. To bridge the communication gap between technologists and educators about
the resources, obstacles, needs, and terms used by the other group. b. To establish working relationships between data providers/tool builders and
curriculum developers/educators. c. To provide clear, relatively low-barrier pathways to developing educational
resources using data (using data portals, EET chapters) d. To produce guidelines and information for the DLESE community about data use
in the classroom (from the technical perspective and from the educational perspective).
From this evaluation, it appears the Data Services Team was most successful at bridging the communication gap between technologists and educators about the needs and practices of the other group. This was clearly the most enjoyable and effective aspect of the workshop, and should be enhanced wherever possible. Working relationships between data providers/tool builders and curriculum developers/educators were given a good beginning as a result of this workshop. Participants identify changes in their daily work to be implemented as a result of their new working relationships. Complete success at meeting this goal will be indicated by completed EET chapters or other evidence of sustained relationships beyond the longitudinal scope of this investigation. Clearly, participants became more aware of data which is available and the aspects of data interfaces which enable data use. This was accomplished through the poster sessions, through review of data sources, and through interaction during breakout sessions. Completed EET chapters will provide more models and examples, thus further lowering barriers. The extent to which this is done will indicate success at meeting all of the intended outcomes of this goal. A great deal of valuable information was gathered on the Swikis, notes, and discussion questions. The Data Services Team has been successful at gathering feedback that greatly expands what we know about each group. However, teams varied in the extent to which they captured the details of their discussion on the Swiki, and respondents varied in the extent to which they participated in the discussion questions. Complete success at providing authentic communication in the workshop reports will depend upon the extent to which the Data Services Team is able to garner community input and review of the draft reports.

37
8 References Susan Loucks-Horsley, Peter W. Hewson, Nancy Love, Katherine E. Stiles (1998) Designing Professional Development for Teachers of Science and Mathematics, The National Institute for Science Education, publisher Corwin Press, Inc. p. 264-66.

38
Appendix 1. Data Review
Daily Evaluation Questionnaire
The same daily questionnaire was administered at the end of each day. The number of respondents in each of five professional roles generally decreased on the last day, particularly the Data Providers (0) and Tool Developers (1). Overall response was the greatest on Wednesday.
Figure A1. Respondents’ professional roles each day. Respondents’ assessment of the mix of technology to education in the daily schedules showed a slight over-emphasis on technology for the first two days, but nearly a perfect balance the last two days.

39
Figure A2. Mix of technology to education each day. Disaggregating the professional roles into two respondent groups, Educators/Curriculum Developers and Data Providers/Tool Developers resulted in the following graphs:
Figure A3. Professional role group respondents each day. As with the all-role graph above, the daily mix appears to have been slightly too technical the first two days, but nearly perfect the last two days.
Figure A4. Mix of technology to education each day.

40
Disaggregated Results (Grouped by Professional Role) Questions 3 and 5 were of particular interest for group analysis. Monday Question 3. “What was most effective for your learning?” Overall, the talks were mentioned most often as the most effective aspect of the day; similarly, exposure to new information (unspecified whether this was during talks or not) was mentioned by a number of others. Four of the ten education respondents cited presentations/talks as the most effective items. Three said that learning about certain information was the most effective aspect of the day for them. Two mentioned direct interaction with tools during sessions. One mentioned networking and another commented on the value of the comments on poster boards. Of the eleven data/tool respondents to Question 3, seven said the talks were the most effective aspect of the day; two specifically mentioned Raj’s talk as a highlight. One of these people specified that the talks were better than the demos; however, two respondents said the live demos were among the most effective parts of the day. Five respondents identified learning various things as the most valuable part of the day, including methods, tools, and other perspectives on the issues at hand. One person mentioned hearing about case studies as the most important thing, while another simply said “museum.’
Figure A5. Most effective items for learning. Monday Question 5 “What would you have changed?”

41
Several people thought there were too many presentations and demos this day and that the small group discussion should have been longer. Several also commented on the room temperature being a problem. Out of ten education respondents, three mentioned the poster questions in the discussion sessions; two thought the discussion wasn’t effective but one said it was an interesting technique. Three respondents requested more discussion time. Two respondents said the afternoon session should be broken up, that three presentations in a row was too much. One person said the demos were not effective. Two people reported problems seeing, one mentioned the room temperature, and one mentioned the food needing to be changed. There were 14 data/tool respondents to Question 5. One said there were too many presentations. One person said the discussion sessions should have been unstructured; similarly, another complained about the discussion questions. Five people suggested shortening, changing, or removing the demos; two of these people said that hands-on demos would be better. Three people complained about the room temperature and one about the projection quality. Three people suggested topic changes—one wanted more details on Thredds; one wanted more on metadata; one requested more content management information in the digital library model.
Figure A6. What should be changed. Summary Results--Monday Question 4 What was most enjoyable? Out of 33 respondents, 18 mentioned presentations as being the most enjoyable. Nine specifically mentioned John Pickle’s talk and three mentioned Raj’s talk. Thirteen respondents said that discussions were the best part of the day. One person mentioned individual topics in the day. Another only said “museum.” One selected the demos and another selected a video as the most enjoyable.

42
Figure A7. Most enjoyable aspect of the day. Disaggregated Results Tuesday Question 3 “What was most effective for your learning?” Out of ten education responses, four mentioned learning about data/tools and listening as the most effective aspects of the day. Two people mentioned the poster session and two mentioned the breakout sessions. One person specified the presentations, while another emphasized interacting with colleagues. Of the twelve data/tool respondents, five said talks were the most effective part of the day, two mentioning Edelson’s talk particularly. Three mentioned the breakout sessions. One person mentioned exposure to technology, one mentioned discussion, and another mentioned the demos.

43
Figure A8. Most effective items for learning. Tuesday Question 5 “What would you have changed?” The most frequently mentioned change was a request for fewer talks and more time in breakouts. Several also requested more education presence for a better balance with the technology issues. Of the nine education respondents, three suggested fewer talks; one specified dropping the 4pm sessions and one dropping the technical sessions. Three people requested more breakout time. Another three suggested variations in the education/technical balance; one mentioned having the education before the technical time; two others asked for more balance and cooperative work between educators and technical people. Of the ten data/tool respondents, three also wanted fewer presentations, additionally, one requested talks from educators and another suggested “lowering” the level of the talks to be more accessible to teachers. Two people requested more small-group time, and two asked for more discussion time. One suggested designating people for poster questions.
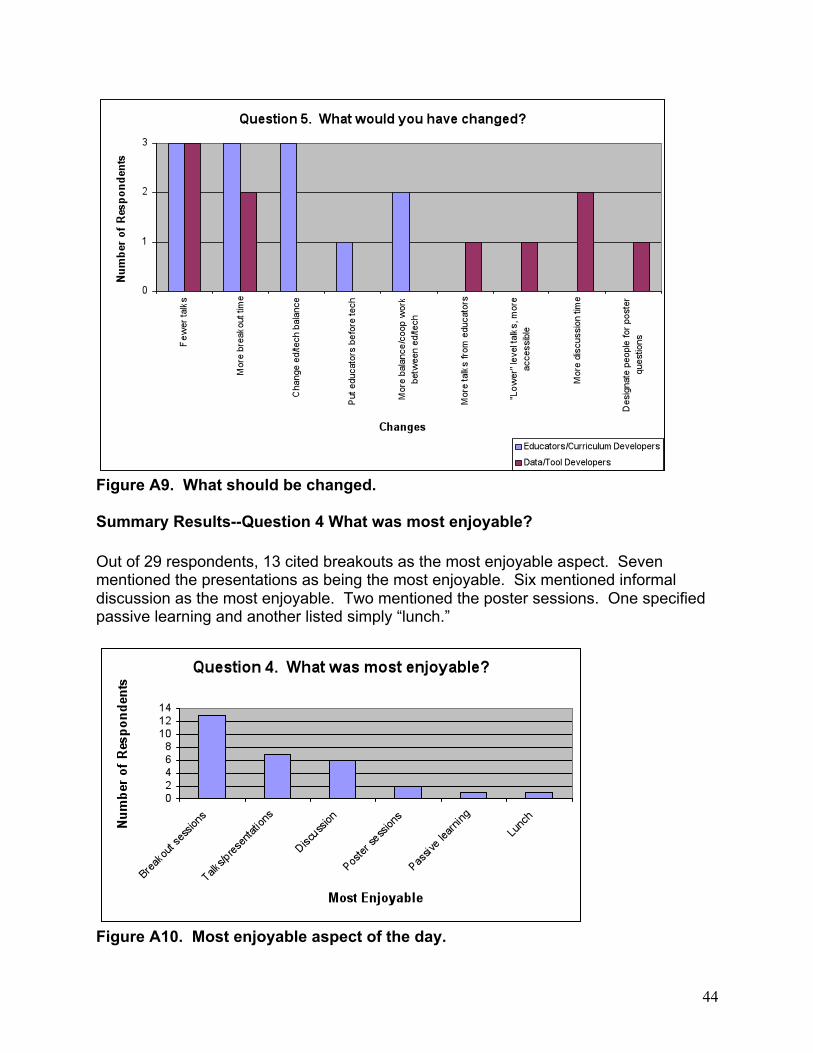
44
Figure A9. What should be changed. Summary Results--Question 4 What was most enjoyable? Out of 29 respondents, 13 cited breakouts as the most enjoyable aspect. Seven mentioned the presentations as being the most enjoyable. Six mentioned informal discussion as the most enjoyable. Two mentioned the poster sessions. One specified passive learning and another listed simply “lunch.”
Figure A10. Most enjoyable aspect of the day.
45
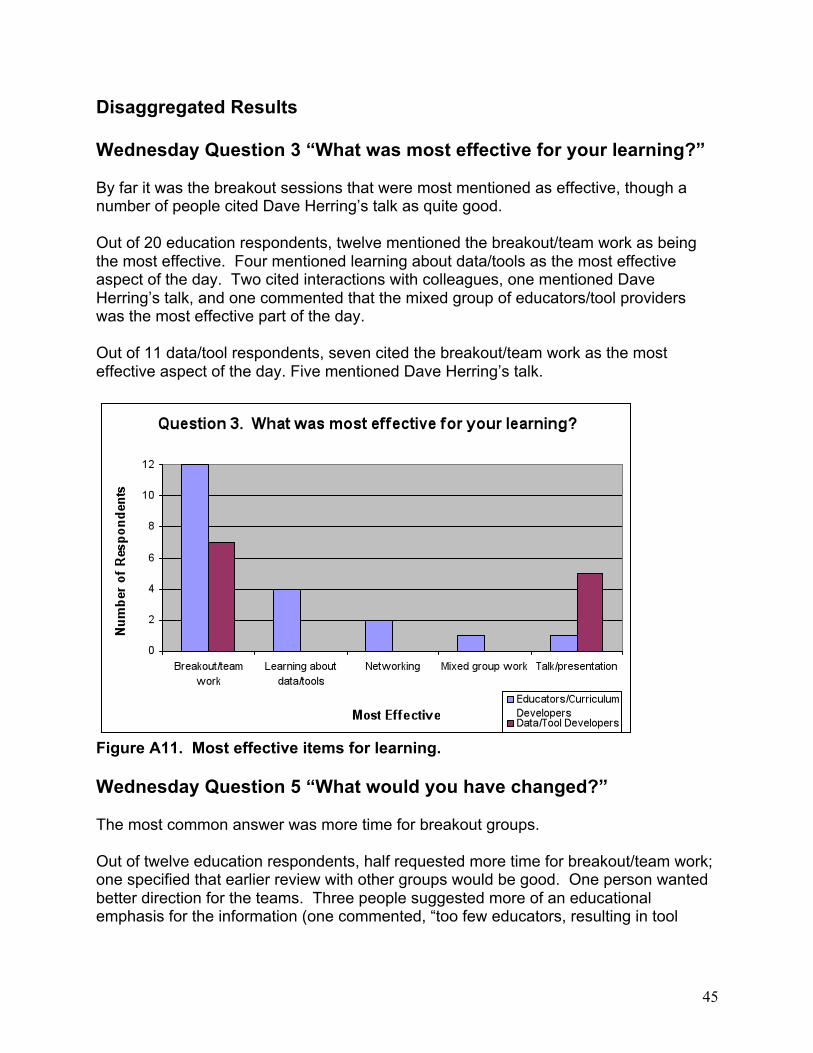
Disaggregated Results Wednesday Question 3 “What was most effective for your learning?” By far it was the breakout sessions that were most mentioned as effective, though a number of people cited Dave Herring’s talk as quite good. Out of 20 education respondents, twelve mentioned the breakout/team work as being the most effective. Four mentioned learning about data/tools as the most effective aspect of the day. Two cited interactions with colleagues, one mentioned Dave Herring’s talk, and one commented that the mixed group of educators/tool providers was the most effective part of the day. Out of 11 data/tool respondents, seven cited the breakout/team work as the most effective aspect of the day. Five mentioned Dave Herring’s talk.
Figure A11. Most effective items for learning. Wednesday Question 5 “What would you have changed?” The most common answer was more time for breakout groups. Out of twelve education respondents, half requested more time for breakout/team work; one specified that earlier review with other groups would be good. One person wanted better direction for the teams. Three people suggested more of an educational emphasis for the information (one commented, “too few educators, resulting in tool

46
developers over-ruling”). One said they wanted to have learned more about available data. Only one response was given from the data/tool respondents; this person wanted more emphasis on review of DLESE and how it is ensured it works for teachers.
Figure A12. What should be changed. Summary Results--Question 4 What was most enjoyable? Out of 37 respondents, 19 said the breakout groups were the most enjoyable. Fifteen cited presentations as the most enjoyable; 12 of these specifically identified David Herring’s talk. Three people said informal discussions were the most enjoyable and one mentioned the poster session on Tuesday.

47
Figure A13. Most enjoyable aspect of the day. Disaggregated Results Thursday Question 3 “What was most effective for your learning?” Most respondents said the most effective aspects were the breakout group work or tasks. Discussions were also mentioned by several people. Out of nine education respondents, all but three said the most effective aspect was group discussion and group review tasks. Two other similar comments said general discussion/sharing was the best. One person said review of the swiki was the most effective. There was only one data/tool respondent, who said the interaction with educators while exploring tools/data was the most effective. .

48
Figure A14. Most effective items for learning. Thursday Question 5 “What would you have changed?” Very few respondents in this group. Two did comment that the low turnout for Thursday was an issue to be addressed. Six education people responded. Two commented that having people leave early was an issue. One person suggested outdoor activities instead of sedentary. One person requested more information from an educational developer. One expressed a desire to hear about other’s website reviews, while another requested more specific discussion questions like teaching strategies using data in secondary education. No data/tool people gave responses.
49
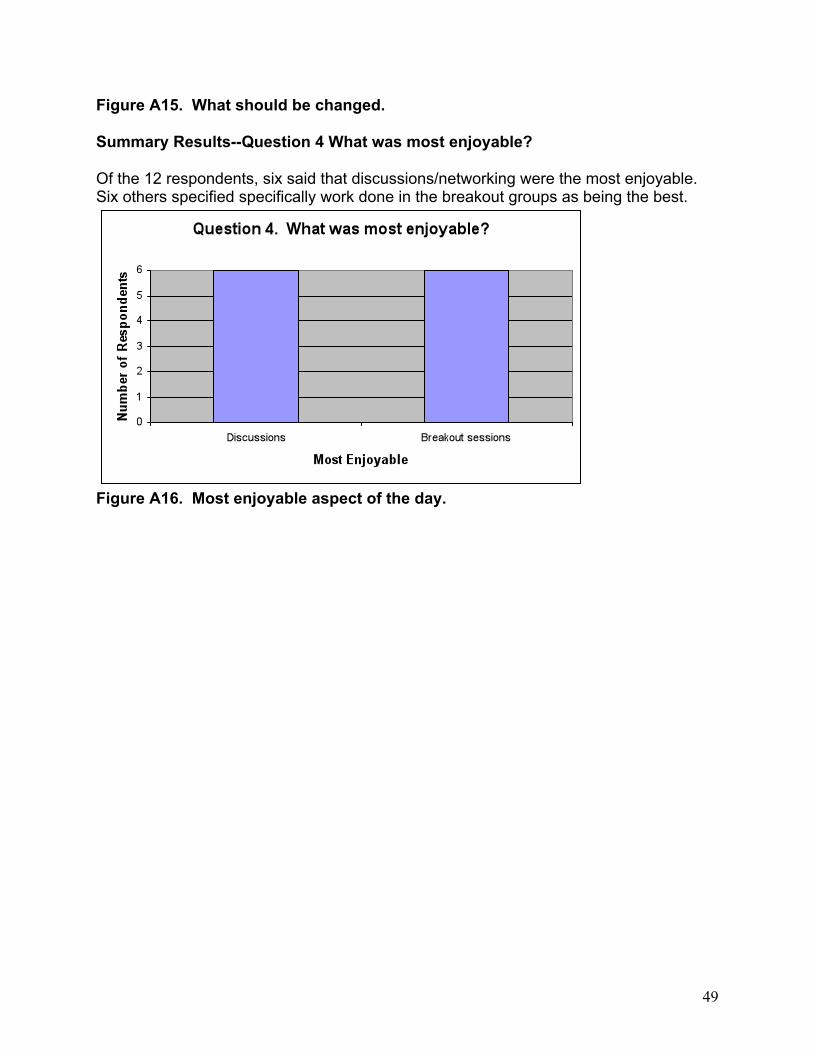
Figure A15. What should be changed. Summary Results--Question 4 What was most enjoyable? Of the 12 respondents, six said that discussions/networking were the most enjoyable. Six others specified specifically work done in the breakout groups as being the best.
Figure A16. Most enjoyable aspect of the day.

50
Appendix 2. Instruments
Instrument 1. Monday Questionnaire.
DLESE Data Workshop: Monday 1. My primary role at this
workshop is as a(n) (circle one):
Data provider Tool developer Scientist Curriculum developer Educator 2. How was the mix of
technical to educational sessions today? Too technical Just right Too educational 1 2 3 4 5
3. What was most effective for your learning?
4. What was most
enjoyable? 5. What would you have
changed?

51
Instrument 2. Tuesday Questionnaire.
DLESE Data Workshop: Tuesday 6. My primary role at this
workshop is as a(n) (circle one):
Data provider Tool developer Scientist Curriculum developer Educator 7. How was the mix of
technical to educational sessions today? Too technical Just right Too educational 1 2 3 4 5
8. What was most effective for your learning?
9. What was most
enjoyable? 10. What would you have
changed?

52

53
Instrument 3. Wednesday Questionnaire.
DLESE Data Workshop: Wednesday 1. My primary role at this workshop is as a(n) (circle one): Data provider Tool developer Scientist Curriculum developer Educator 2. How was the mix of technical to educational sessions today?
Too technical Just right Too educational 1 2 3 4 5
3. What was most effective for your learning? 4. What was most enjoyable? 5. What would you have changed?

54
Instrument 4. Thursday Questionnaire
DLESE Data Workshop: Thursday 1. My primary role at this workshop is as a(n) (circle one): Data provider Tool developer Scientist Curriculum developer Educator 2. How was the mix of technical to educational sessions today?
Too technical Just right Too educational 1 2 3 4 5
3. What was most effective for your learning? 4. What was most enjoyable? 5. What would you have changed?

55
Instrument 5. Data Use Questionnaire DLESE Data Workshop Day 1 Data Use Questionnaire
In order to better our understanding of the ways in which data is being used and the ways in which data use may be made easier, please answer the following questions. Thank you very much for your help.
1. What is your primary role at the DDS workshop (check one)?
_____Data provider _____Tool builder _____Scientist _____Curriculum developer _____Educator
2. Have you had a successful experience using data for an educational purpose (to prepare or teach an educational activity)?
____Yes _____No
If yes, 2a. What learning goals have you addressed through the use of data?
2b. What data sources have you used successfully?
2c. Did you find it necessary to customize the data (pre-select or process) before it was used by the end-user/learner or was the data used “as-is”? Please describe.
2d. What data analysis procedures did end-users/learners perform on the data?
3. Have you made any unsuccessful attempts to use data for an educational purpose?
_____Yes _____No
If yes, what barriers did you encounter?
4. Have you made an unsuccessful attempt at obtaining a specific type of data? ____ Yes _____No
If so, briefly describe what you were looking for and what made you give up the quest to obtain the data.

56
If you are involved with an effort to provide data or develop analysis tools, answer questions 5 through 8:
5. What type of instruction, if any, does your project offer for teachers/students who want to access or analyze some specific data?
6. What type of instruction does your project offer for researchers who wish to access or analyze some specific data?
7. Do you receive special requests from educators/curriculum developers for help with your data? ______ Yes ______No
If so, what are some of the main issues for which they are seeking help?
8. To your knowledge has "your" data or tool ever been used in an educational context? ____ Yes _____No ____Don’t know
If yes, describe in what way the data was used.

57
Instrument 6. Final Day Questionnaire DLESE Data Workshop: Final Day Questionnaire Please answer the following questions for us so that we can determine what we did well, what we can improve, and how. All data will only be reported in aggregate and any identifying information will be kept confidential. Your work team: My primary role at this workshop is as a(n): Educator Data provider Tool developer Curriculum developer Scientist What was most effective for your learning overall?
What was most enjoyable overall?
What would you have changed overall?
What are one or two specific things that you plan to do in your work as a result of this workshop?
Were the purposes and goals of your work team clear?
Not clear Somewhat clear Very clear 1 2 3 4 5 Comments?

58
Did your work team develop a clear plan for completing your EET chapter? Yes Somewhat No 1 2 3 4 5 Comments?
If you participated in pre-workshop EET telecons, how well did that prepare you for planning your EET chapter? Not well Somewhat Very well 1 2 3 4 5 Comments? How well did the poster session facilitate your learning about data access, tools and educational uses of data? Not well Somewhat Very well 1 2 3 4 5 Comments?
How well are your ideas, opinions, and interests represented in the discussion question records (post-its and swiki)? Not well Somewhat Very well 1 2 3 4 5 Comments? How well were group discussion and planning facilitated in your work team?. Not well Somewhat Very well 1 2 3 4 5 Comments? How well did your expertise and interests fit in with your work team? Not well Somewhat Very well 1 2 3 4 5 Comments?

59
How well are your ideas, opinions, and interests represented in the plans and reports of your work team? Not well Somewhat Very well 1 2 3 4 5 Comments?
How useful was the meeting website? Not useful Somewhat useful Very useful 1 2 3 4 5 Comments? How would you rate the meeting facilities (e.g. meeting rooms, equipment)? Excellent Average Below average 1 2 3 4 5 Comments? How would you rate the on-line registration page? Easy /intuitive Ok Hard /had problems 1 2 3 4 5 Comments? How would you rate the housing and food? Excellent Average Below average 1 2 3 4 5 Comments? Was there any logistics information that you wish you had? Please describe.
May we contact you further about your experience and interests? If so, please provide your contact information here:
Please complete and turn in this form during your final day. Your feedback and comments will help to shape future DLESE Data workshops. Thank you! –DLESE Data Services Team
60
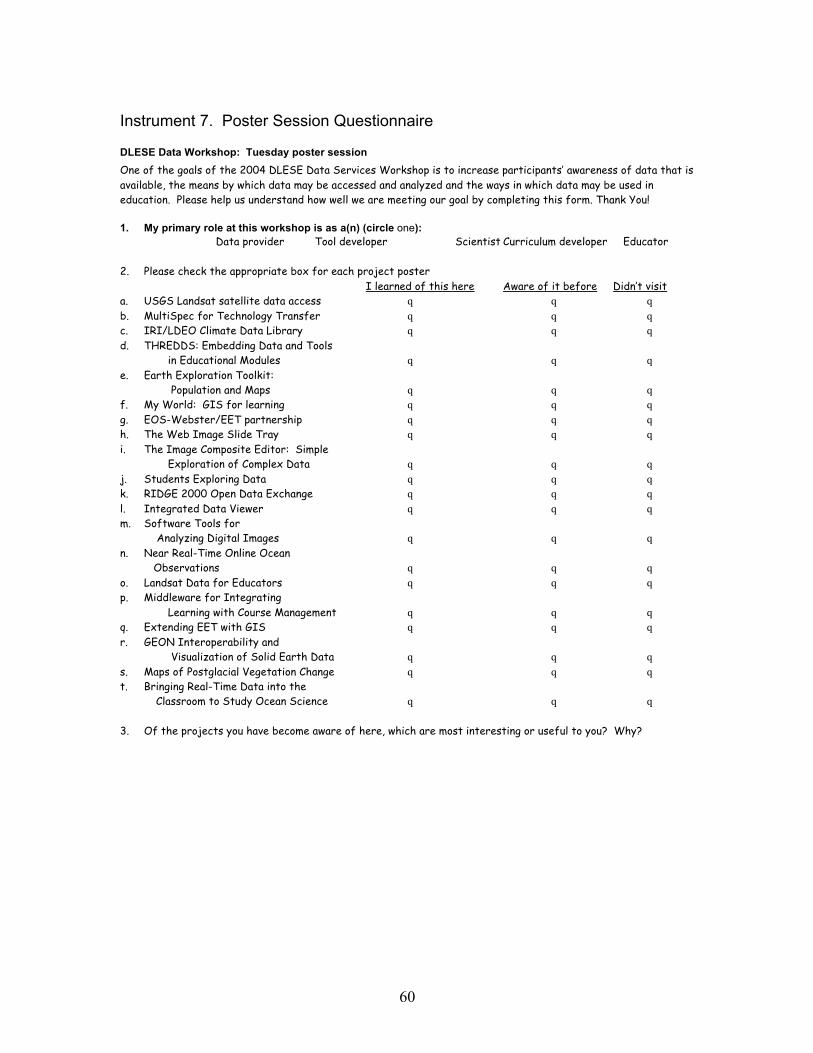
Instrument 7. Poster Session Questionnaire
DLESE Data Workshop: Tuesday poster session One of the goals of the 2004 DLESE Data Services Workshop is to increase participants’ awareness of data that is available, the means by which data may be accessed and analyzed and the ways in which data may be used in education. Please help us understand how well we are meeting our goal by completing this form. Thank You! 1. My primary role at this workshop is as a(n) (circle one):
Data provider Tool developer Scientist Curriculum developer Educator 2. Please check the appropriate box for each project poster I learned of this here Aware of it before Didn’t visit a. USGS Landsat satellite data access q q q b. MultiSpec for Technology Transfer q q q c. IRI/LDEO Climate Data Library q q q d. THREDDS: Embedding Data and Tools
in Educational Modules q q q e. Earth Exploration Toolkit:
Population and Maps q q q f. My World: GIS for learning q q q g. EOS-Webster/EET partnership q q q h. The Web Image Slide Tray q q q i. The Image Composite Editor: Simple Exploration of Complex Data q q q j. Students Exploring Data q q q k. RIDGE 2000 Open Data Exchange q q q l. Integrated Data Viewer q q q m. Software Tools for
Analyzing Digital Images q q q n. Near Real-Time Online Ocean
Observations q q q o. Landsat Data for Educators q q q p. Middleware for Integrating
Learning with Course Management q q q q. Extending EET with GIS q q q r. GEON Interoperability and
Visualization of Solid Earth Data q q q s. Maps of Postglacial Vegetation Change q q q t. Bringing Real-Time Data into the
Classroom to Study Ocean Science q q q 3. Of the projects you have become aware of here, which are most interesting or useful to you? Why?