dlrl cluster final report...hive tutorial since hive is a framework running on top of hadoop that...
TRANSCRIPT

1
DLRL Cluster
CS 4624 Semester Project
Virginia Tech
Blacksburg, VA
May 8, 2014
Client: Sunshin Lee
Matthew Bollinger
Adam Lech
Joseph Pontani
2
Table of Contents Executive Summary ................................................................................................................... 4
Background ................................................................................................................................ 5
Mahout ................................................................................................................................... 5
HBase .................................................................................................................................... 5
Hive ........................................................................................................................................ 6
Impala .................................................................................................................................... 6
User’s Manual ............................................................................................................................ 7
Mahout ................................................................................................................................... 7
Mahout Tutorial ................................................................................................................... 7
Mahout Demo Video ........................................................................................................... 7
Mahout Results ................................................................................................................... 8
HBase .................................................................................................................................... 8
HBase Tutorial .................................................................................................................... 8
Hive ........................................................................................................................................ 8
Hive Tutorial ........................................................................................................................ 9
Hive Demo Video ................................................................................................................ 9
Hive Results ........................................................................................................................ 9
Impala ...................................................................................................................................12
Impala Tutorial ...................................................................................................................12
Impala Demo Video ...........................................................................................................12
Impala Results ...................................................................................................................12
Developer’s Manual ..................................................................................................................16
Mahout_Tutorial.pdf ...............................................................................................................16
Mahout_Demo.mp4 ...............................................................................................................16
Impala_Introduction.pdf .........................................................................................................16
Impala_Demo.mp4 ................................................................................................................16
Twitter_Data_Editor.py ..........................................................................................................16
Lessons Learned ......................................................................................................................18
Timeline/Schedule .................................................................................................................18
Problems ...............................................................................................................................18
Dates .................................................................................................................................18
Tweet Source .....................................................................................................................18

3
Tweet Text .........................................................................................................................19
Extra Commas ...................................................................................................................19
Java Heap Space ...............................................................................................................19
Solutions ...............................................................................................................................20
Dates .................................................................................................................................20
Tweet Source .....................................................................................................................20
Tweet Text .........................................................................................................................20
Extra Commas ...................................................................................................................20
Java Heap Space ...............................................................................................................20
Acknowledgements ...................................................................................................................22
References ...............................................................................................................................23

4
Executive Summary
The Digital Library Research Laboratory is a group focused on researching and implementing a
full stack Hadoop cluster for data storage and analysis. The DLRL Cluster project is focused on
learning and teaching the technologies behind the cluster itself. To accomplish this, we were
given three primary goals.
First, we were to create tutorials to teach new users how to use Mahout, HBase, Hive, and
Impala. The idea was to have basic tutorials that would provide users with an introductory
glance to these modern technologies, including what they are, what they’re used for, and a
fundamental level of how they’re used. The first goal was met by creating an in-depth tutorial for
each technology. Each tutorial contains step-by-step instructions on how to get started with
each technology, along with pictures that allow users to follow along and compare their progress
to assure that they are successful.
Second, we would use these tools to demonstrate their capabilities on real data from the IDEAL
project. Rather than have to show a demo to each new user of the system firsthand, we created
a short (5 to 10 minute) demo video for each technology. This way users could see for
themselves how to go about utilizing the software to accomplish tasks. With a video, users are
able to pause and go back at their leisure to better familiarize themselves with the commands
and interfaces involved.
Finally, we would utilize the knowledge gained from researching these technologies and apply it
to the actual cluster. We took a real, large, dataset from the DLRL cluster and ran it through
each respective technology. Some reports were generated, focusing on efficiency and
performance, while an actual result dataset was generated for some data analysis.

5
Background
Mahout
Mahout is a machine-learning framework that allows for data mining and analysis. It can
leverage the distributed computing capabilities of Hadoop, or run stand-alone. Clustering,
filtering, and classification are the primary three groupings of algorithms that Mahout offers out
of the box, but it can also be extended to Frequent Pattern Mining.
The example used as a starting point for our research was called the “diapers and beer”
approach. The story behind the name was that it was shown that on Thursdays and Saturdays,
males shopping for groceries often bought both diapers and beer together (2), so there was a
relation between the two products. The relation was that should a male be shopping, if he were
to view either product, the other corresponding product would show up as a recommended item.
This was a way that companies were able to have, in a sense, targeted advertising that would
boost sales. It was this sense of correlation that was then suggested as an approach for data-
mining the pothole and shooting datasets from the DLRL cluster. Instead of actual product
relationships, however, we were to look at word relationships. This was going to be done using
Frequent Pattern mining.
HBase
Hbase is a distributed, column-oriented database built on top of HDFS. It is primarily used when
random, real-time read/write access to a very large data set is required. HBase is not relational
and does not support SQL.
Applications store data into labeled tables, which are made of rows and columns. Table cells
are versioned - their version is a timestamp auto-assigned by HBase at the time of cell insertion.
Byte arrays are used to store both the cell’s contents as well as the row keys. Row columns are
grouped into column families and all column family members have a common prefix. Column
families must be specified up front as part of the table schema definition, but new family column
members can be added on demand. Physically, all column family members are stored up front
as part of the table schema definition.
6
Hive
Hive is a framework designed for data warehousing that runs on top of Hadoop. It enables users
to run queries on huge volumes of data. Its basic function is to convert SQL queries into
MapReduce jobs. It supports analysis of large datasets stored in Hadoop’s HDFS file system. It
allows traditional MapReduce programmers to plug in their custom mappers and reducers when
it is inconvenient or inefficient to express this logic in HiveQL.
Impala
Impala is a massively parallel processing SQL query engine running in Hadoop. It enables users
to directly query data stored in HDFS without requiring data movement or transformation. SQL
queries are executing in real-time, directly on the data, leading to faster data analysis.
Impala accomplishes this by directly accessing the data stored in HDFS through a specialized
distributed query engine. When a user issues a query to Impala, it is distributed to all processing
nodes in the Hadoop cluster. Each node will execute the query and return its result to the
master node. The master node aggregates all of the primary results and then returns the full
result to the user. Depending on the type of query, Impala can be 10-100x faster than Hive (4).

7
User’s Manual
All work done for this project can be recreated and explained by reading and following the
tutorials.
Mahout
For this project, both the standalone and the Hadoop based variants of Mahout were utilized in
some fashion. For the tutorial, the stand-alone variant was used to process a dataset using the
FPGrowth algorithm (an algorithm that does Frequent Pattern mining). For the demo video, a
single node Hadoop cluster was underneath Mahout while it processed the dataset. Lastly, for
further testing and more in-depth analysis, a multi-node cluster (the DLRL cluster) was used to
run Mahout on a very large dataset.
Mahout Tutorial
The tutorial for Mahout covers the basic usage of Mahout. The goal of the tutorial was to give
readers a baseline level of comfort with how to use a few of the Mahout commands to start
processing data. It can be used as a starting point to run algorithms on some sample datasets
that Mahout typically ships with by default (for custom installs of Mahout), or as a starting point
for running algorithms on custom datasets.
The driving factor behind the tutorial was to eventually be able to run Mahout data-mining
operations on the actual DLRL cluster. To that regard, the focus was to cover the commands
that would be most necessary to successfully data-mine any dataset that the cluster stored. The
tutorial focused on three main aspects of running Mahout: sequence file creation, data analysis,
and result viewing.
Mahout Demo Video
As previously stated, the second aspect for each area was a video demonstrating the
capabilities of the technology. This video serves as a basic walkthrough on how to run Mahout’s
data mining algorithms on a given dataset. It allows the user to see the actual process of
running Mahout with FPG on the command line, and the output of such a process. It is narrated
to allow the user to hear someone actually explain what commands to run, what each item
means, and provided details as to what to look for while the job is running.
8
The demo video for Mahout is also available for viewing on Youtube (3) and included with this
document.
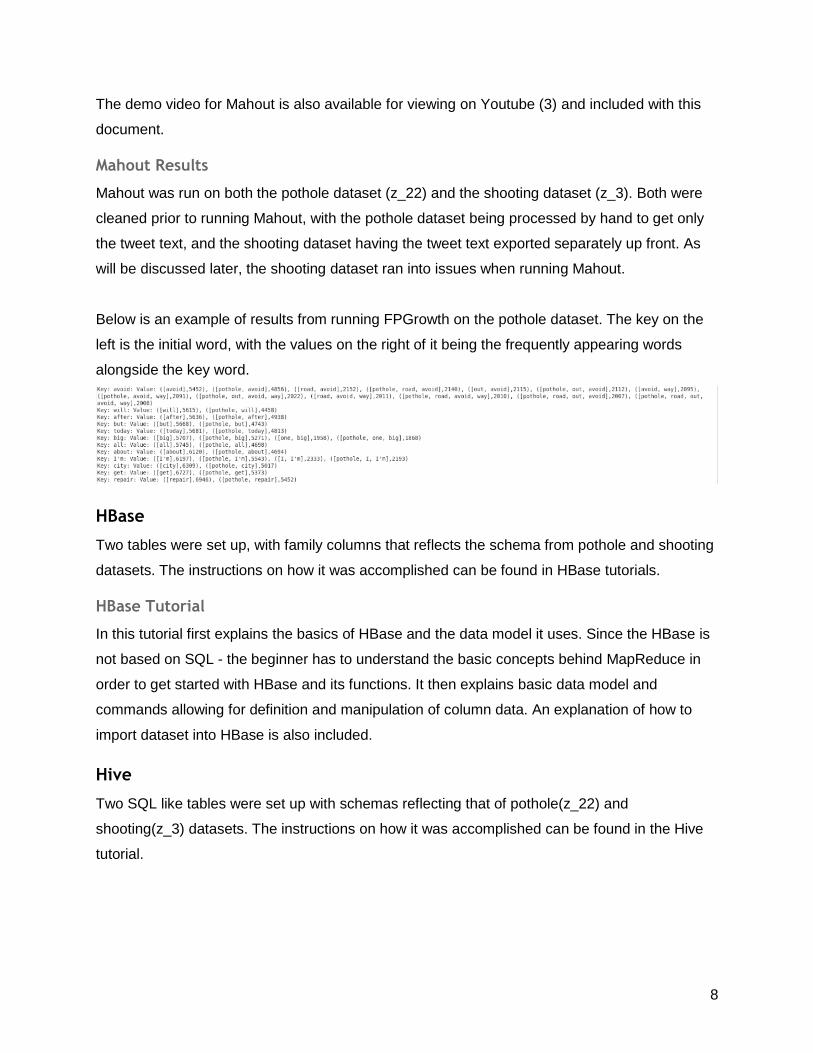
Mahout Results
Mahout was run on both the pothole dataset (z_22) and the shooting dataset (z_3). Both were
cleaned prior to running Mahout, with the pothole dataset being processed by hand to get only
the tweet text, and the shooting dataset having the tweet text exported separately up front. As
will be discussed later, the shooting dataset ran into issues when running Mahout.
Below is an example of results from running FPGrowth on the pothole dataset. The key on the
left is the initial word, with the values on the right of it being the frequently appearing words
alongside the key word.
HBase
Two tables were set up, with family columns that reflects the schema from pothole and shooting
datasets. The instructions on how it was accomplished can be found in HBase tutorials.
HBase Tutorial
In this tutorial first explains the basics of HBase and the data model it uses. Since the HBase is
not based on SQL - the beginner has to understand the basic concepts behind MapReduce in
order to get started with HBase and its functions. It then explains basic data model and
commands allowing for definition and manipulation of column data. An explanation of how to
import dataset into HBase is also included.
Hive
Two SQL like tables were set up with schemas reflecting that of pothole(z_22) and
shooting(z_3) datasets. The instructions on how it was accomplished can be found in the Hive
tutorial.
9
Hive Tutorial
Since Hive is a framework running on top of Hadoop that uses SQL dialect, in this tutorial we
concentrated on SQL like features. It describes basic set up of Hive and how to define and
manipulate data. An explanation of how to import dataset into Hive is included.
Hive Demo Video
This video concentrates on the basic feature of Hive - translating SQL queries into MapReduce
jobs.
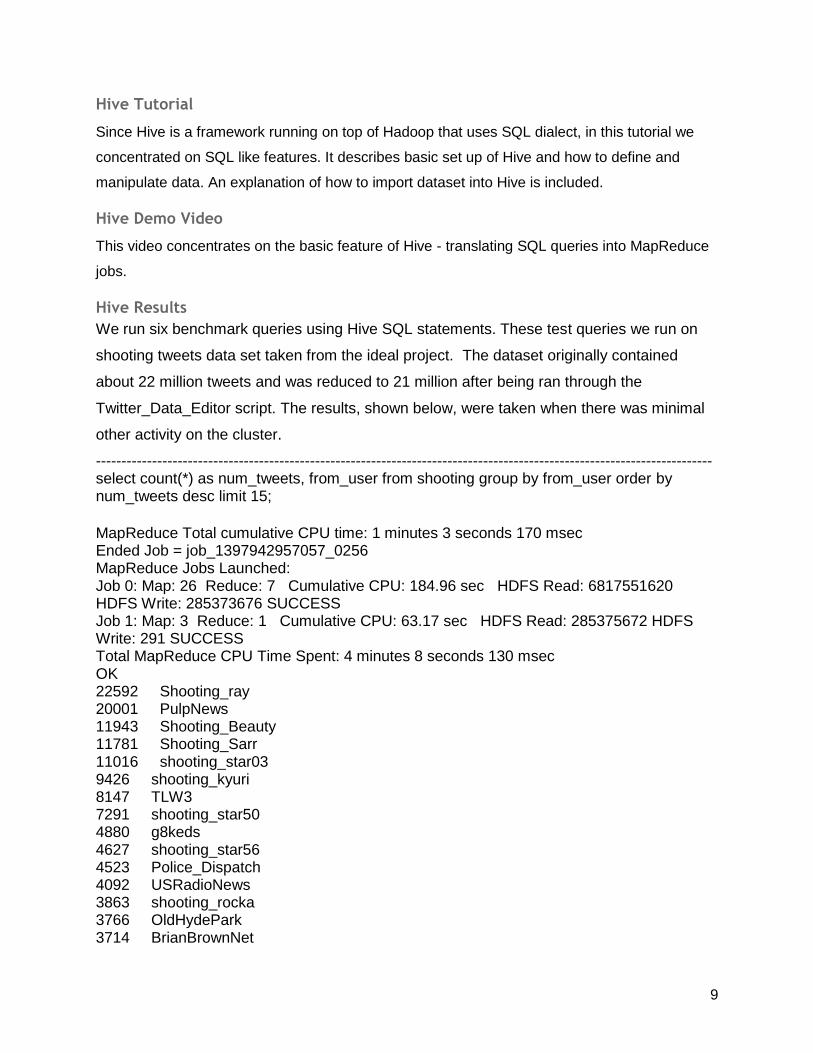
Hive Results
We run six benchmark queries using Hive SQL statements. These test queries we run on
shooting tweets data set taken from the ideal project. The dataset originally contained
about 22 million tweets and was reduced to 21 million after being ran through the
Twitter_Data_Editor script. The results, shown below, were taken when there was minimal
other activity on the cluster.
------------------------------------------------------------------------------------------------------------------------- select count(*) as num_tweets, from_user from shooting group by from_user order by num_tweets desc limit 15;
MapReduce Total cumulative CPU time: 1 minutes 3 seconds 170 msec Ended Job = job_1397942957057_0256 MapReduce Jobs Launched: Job 0: Map: 26 Reduce: 7 Cumulative CPU: 184.96 sec HDFS Read: 6817551620 HDFS Write: 285373676 SUCCESS Job 1: Map: 3 Reduce: 1 Cumulative CPU: 63.17 sec HDFS Read: 285375672 HDFS Write: 291 SUCCESS Total MapReduce CPU Time Spent: 4 minutes 8 seconds 130 msec OK 22592 Shooting_ray 20001 PulpNews 11943 Shooting_Beauty 11781 Shooting_Sarr 11016 shooting_star03 9426 shooting_kyuri 8147 TLW3 7291 shooting_star50 4880 g8keds 4627 shooting_star56 4523 Police_Dispatch 4092 USRadioNews 3863 shooting_rocka 3766 OldHydePark 3714 BrianBrownNet

10
Time taken: 5204.581 seconds, Fetched: 15 row(s) ------------------------------------------------------------------------------------------------------------------------- select count(*) as num_tweets, source from shooting group by source order by num_tweets desc limit 15;
MapReduce Jobs Launched: Job 0: Map: 26 Reduce: 7 Cumulative CPU: 101.46 sec HDFS Read: 6817551620 HDFS Write: 529129 SUCCESS Job 1: Map: 4 Reduce: 1 Cumulative CPU: 5.56 sec HDFS Read: 531270 HDFS Write: 345 SUCCESS Total MapReduce CPU Time Spent: 1 minutes 47 seconds 20 msec OK 10805547 twitter.com 3439406 web 886741 twitterfeed.com 885813 blackberry.com 449664 instagram.com 418707 www.facebook.com 413397 mobile.twitter.com 338992 dlvr.it 312117 www.tweetdeck.com 247272 www.echofon.com 222873 www.tweetcaster.com 207485 www.hootsuite.com 184123 ubersocial.com 159245 tapbots.com 147060 about.twitter.com Time taken: 91.652 seconds, Fetched: 15 row(s) ------------------------------------------------------------------------------------------------------------------------- select count(*) as num_tweets, month from shooting group by month order by num_tweets desc limit 15;
MapReduce Jobs Launched: Job 0: Map: 26 Reduce: 7 Cumulative CPU: 82.12 sec HDFS Read: 6817551620 HDFS Write: 936 SUCCESS Job 1: Map: 2 Reduce: 1 Cumulative CPU: 1.85 sec HDFS Read: 2787 HDFS Write: 123 SUCCESS Total MapReduce CPU Time Spent: 1 minutes 23 seconds 970 msec OK 2744268 4 2735448 3 2429363 2 1976646 9 1828213 8 1717971 12 1620966 11 1394857 10 1359162 5
11
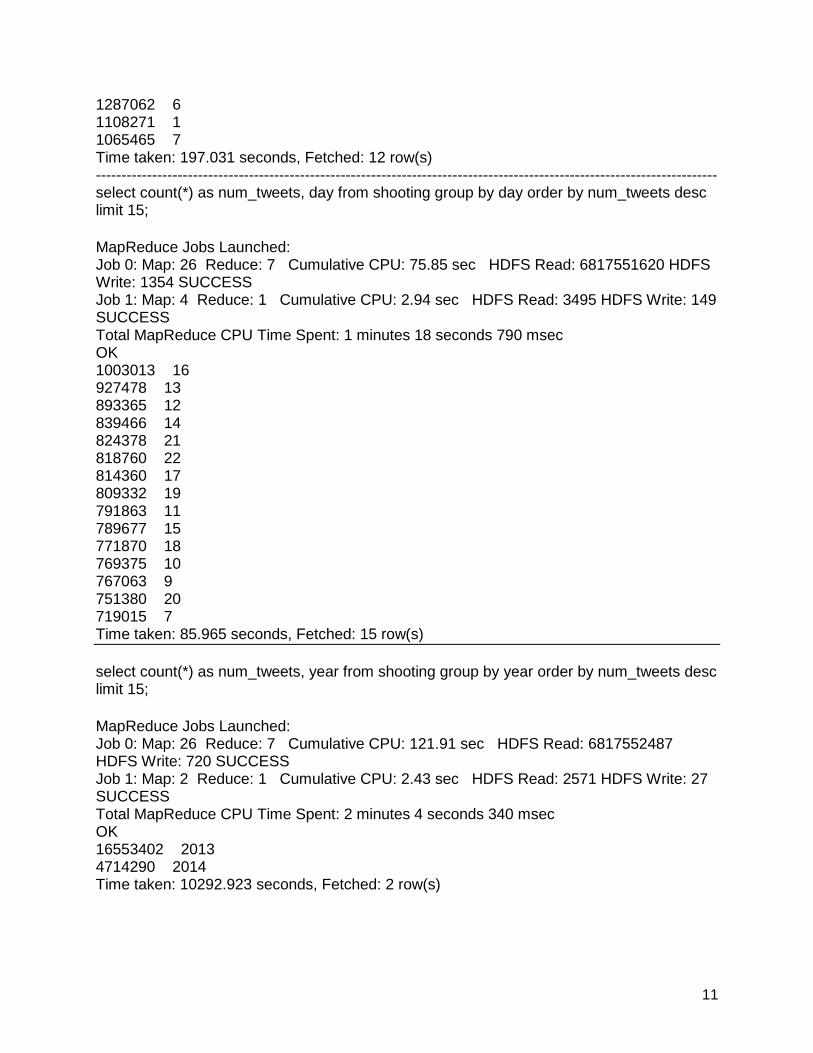
1287062 6 1108271 1 1065465 7 Time taken: 197.031 seconds, Fetched: 12 row(s) -------------------------------------------------------------------------------------------------------------------------- select count(*) as num_tweets, day from shooting group by day order by num_tweets desc limit 15;
MapReduce Jobs Launched: Job 0: Map: 26 Reduce: 7 Cumulative CPU: 75.85 sec HDFS Read: 6817551620 HDFS Write: 1354 SUCCESS Job 1: Map: 4 Reduce: 1 Cumulative CPU: 2.94 sec HDFS Read: 3495 HDFS Write: 149 SUCCESS Total MapReduce CPU Time Spent: 1 minutes 18 seconds 790 msec OK 1003013 16 927478 13 893365 12 839466 14 824378 21 818760 22 814360 17 809332 19 791863 11 789677 15 771870 18 769375 10 767063 9 751380 20 719015 7 Time taken: 85.965 seconds, Fetched: 15 row(s)
select count(*) as num_tweets, year from shooting group by year order by num_tweets desc limit 15;
MapReduce Jobs Launched: Job 0: Map: 26 Reduce: 7 Cumulative CPU: 121.91 sec HDFS Read: 6817552487 HDFS Write: 720 SUCCESS Job 1: Map: 2 Reduce: 1 Cumulative CPU: 2.43 sec HDFS Read: 2571 HDFS Write: 27 SUCCESS Total MapReduce CPU Time Spent: 2 minutes 4 seconds 340 msec OK 16553402 2013 4714290 2014 Time taken: 10292.923 seconds, Fetched: 2 row(s)

12
Impala
Impala Tutorial
This tutorial begins with the basics of how to setup Impala tables. Once some tables have been
created, the tutorial instructs the reader on how to query tables and gives some sample queries
for practice. The tutorial then gives an example walkthrough of using the small IDEAL pothole
dataset. The example contains a complete walkthrough of how to edit the dataset, import it to
HDFS, create tables in Impala, and query the database. The second example uses the much
larger shooting IDEAL dataset. The tutorial explains the challenges faced when dealing with
large datasets and how to overcome them. The tutorial ends with an explanation of how the
twitter data editing script works.
Impala Demo Video
The Impala demo video walks the user through process of setting up an Impala table and
executing queries on that table. The video does not go into detail on data preprocessing as it is
not necessary for learning how to use Impala. It is designed to explain why certain commands
and options are chosen for the benefit of the user.
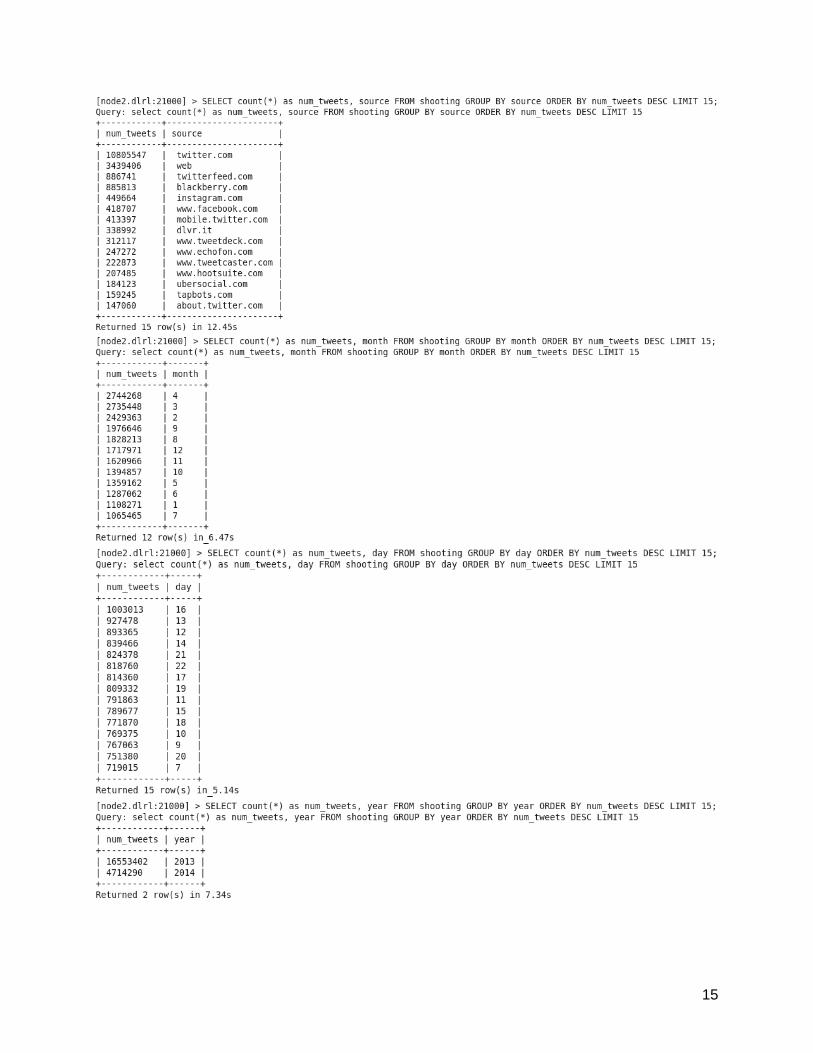
Impala Results
Impala was tested by running five benchmark queries. The five tests were run on the shooting
tweets dataset taken from the IDEAL project. The dataset originally contained about 22 million
tweets and was reduced to 21 million after being ran through the Twitter_Data_Editor script. The
file size after editing is 6.3GB which translates to roughly 0.5GB stored on each node of the
DLRL cluster (there are 11 nodes). The tests were run at two different times. Once during
normal usage of the cluster and once when there was no other activity on the cluster. Both
results are shown below.

13
Isolated run results

14
Normal usage run results
15

16
Developer’s Manual
Mahout_Tutorial.pdf
The Mahout tutorial.
Mahout_Demo.mp4
The Mahout demo video.
HBase_tutorial.pdf
The HBase tutorial.
Hive_tutorial.pdf
The Hive tutorial.
Hive_Tutorial.mp4
The Hive demo video.
Impala_Introduction.pdf
The Impala tutorial.
Impala_Demo.mp4
The Impala demo video.
Twitter_Data_Editor.py
This Python script was used during the project to edit the tweets contained in the pothole and
shooting datasets. The script was necessary to extracting relevant information from the tweets
and putting it into a form easily searchable by Impala and Hive. An explanation of how it works
is below.
The script uses the Python CSV module to parse the traverse the file, row by row, and pick out
the rows that require editing. It writes the new rows to a temporary file during execution and at
the end replaces the source file with the temporary file.
The first thing the script will do to each row of the CSV is check how many columns it has. The
standard tweet should have 14 rows. Many of the tweets in the shooting dataset had more than
14 rows and, originally, this threw the parser off. These extra rows were caused by commas in
the text or source fields. To avoid this issue, we ignore any row with more than 14 columns. This
results in some data loss but the amount lost is small; roughly 6% for the shooting dataset.
17
If a tweet has the appropriate number of columns, the script then strips extraneous information
from the source column. This is done via regular expressions. There are different character
encodings depending on where the tweet originated from so both cases are handled. The
source column is then overwritten with the changes.
Next, the script will parse the day, month, and year from the created_at column. This is done
via the Python dateutil and datetime modules. After parsing the values, day, month, and year
columns are appended to the row.
Finally, the script will strip the whitespace from the geo coordinate and time fields so that they
can be properly imported into impala as doubles and integers respectfully.
This script can be improved upon by instead of dropping malformated tweets, finding the cause
of the improper formatting, repairing the situation, and correctly parsing the tweet.

18
Lessons Learned
Timeline/Schedule
Feb 6 - Met with client to discuss project goals, assign project roles, setup project milestones
Feb 13 - Began research into respective technologies
Feb 20 - Began creating tutorials using simple datasets
March 4 - Midterm presentation. Focus on how to work with our technologies. Begin work on
data editing script
March 13 - Edited tutorials to include pothole dataset
March 20 - Finished creating tutorials
March 27 - Began work on video demos
April 17 - Finished video demos.
April 24 - Gained access to DLRL cluster to begin work on large dataset
May 1 - Final presentation. Focus on work with datasets.
May 8 - End of project. Completed report generation with large dataset and edited tutorials to
demonstrate a complete workflow on the DLRL cluster
Problems
During the semester, there were a few issues that we ran into along the way. They arose from
either researching the usage and functionality of the technologies, or from trial and error of
actually putting the technologies through the rigor of testing and running against our datasets.
Dates
After our tutorials had been fleshed out and we moved into the demonstration stage of the
project, one of the issues we noticed fairly quickly was that in order to provide some more
detailed reporting of our dataset was that we needed to be able to filter and group results by
dates. Beyond just dates, however, was the ability to group by days, months, and years. The
provided dataset, however, only had a single column for a datetime. We needed to be able to
split this datetime column into separate columns for each of the day, month and year.
Tweet Source
The tweet source field contains the site or application from where a tweet was created. This is
very useful for identifying application usage trends. This field however does not simply put the
name or URL of the source. It is in the form,

19
<a href="http://grcity.us/index.pl?page_id=11831" rel="nofollow">Grand
Rapids 311</a>.
As you can see, there is extraneous HTML tags that need to be removed in order to get the true
source of the tweet. This proved to be a challenge of the variety of tweets in the different
datasets. Variable character encodings and source formats made it a challenge to create a set
number of regular expressions that could be used to correctly parse all of the tweets.
Tweet Text
Another issue we faced, especially for utilizing Mahout, was that the dataset was in a CSV with
many columns of data. Mahout required only the tweet text itself for processing with FPGrowth.
We needed to be able to strip out every other column besides the tweet text in order to
successfully run the frequent pattern mining on the text.
Also relating to the tweet text is the extraneous information residing in the tweet. There are
many words, phrases, symbols and the like in tweets that provide no meaningful information to
our data, and in fact, can degrade the accuracy of the results provided by Mahout. Some
examples of extra text in the tweet are: stop words (the, and, is, etc.), tweeted-at usernames
(@User), and retweet text (RT). All of this extra fluff hinders the legitimacy of any results of
frequent patterns.
Extra Commas
One of the biggest problems in our attempts to parse the tweets was the occurrence of extra
commas, other than those for separating the fields, in the text or source fields. The parser would
interpret these commas as field delimiters and cause it to parse the wrong field.
Java Heap Space
When attempting to run Mahout on the cluster with the large shooting dataset, we ran into an
error where Java and Mahout ran out of heap space. This was due to the fact that the dataset
(2GB) was being run with settings that kept a large amount of result data in memory. Initially,
Mahout was told to keep the top 50 matches for each keyword, with a minimum match
requirement of at least 2. This range allowed for a large portion of the result to attempt to be
stored in Java memory, which was exhausted a few minutes into the job.

20
Solutions
Dates
We used the Python dateutil and datetime modules to parse the created_at field and then we
append day, month, and year fields to the tweet.
Tweet Source
We used the Python re module and seven regular expressions to strip the source of the HTML
tags. The source field is overwritten with the stripped URL.
Tweet Text
To remedy the issue of only requiring tweet text, our initial solution was a secondary script to
just strip out all other columns beyond the tweet itself. As happened with the other parsing
script, this script would take a long time to run on large datasets. The revised solution was to
just export a secondary dataset comprising only of the tweet text, which could then be run
through the next phase.
The second phase of the tweet text was another preprocessing script to remove as many stop
words and extra filler from the tweet text as possible. As described earlier, the necessity of this
was to improve the efficiency of the results gained by running Frequent Pattern mining on the
tweet text. Words like ‘the’, ‘and’, and others, only serve as extraneous fillers that simply form a
proper sentence, but are not necessary when trying to look at frequent patterns among the main
context words from the tweet itself.
Extra Commas
At first, we attempted to handle the extra commas dynamically. The parser would count how
many columns were present and then try to find what field the extra comma(s) were originally
from. However, this method proved to be too costly and did not always work correctly. So
instead we decided to drop any tweet with extra commas. This results in a data loss but tests
have shown that we only lose about 5% of the tweets with this method.
Java Heap Space
A couple of solutions were attempted, but to no avail. First, reducing the requested results to the
top 10 instead of the top 50, and then setting a minimum match requirement to 10 as well. This
allowed Mahout to get further in the process, but still eventually failed due to exhausted Java
heap.

21
Other possible solutions that were not able to be attempted were to split the dataset into
multiple files rather than a single 2GB CSV file. This would allow us to run the job on each
separate file rather than the entire dataset all at once. We could then merge in the results to a
single file that spanned the entire dataset.
22
Acknowledgements
We would like to acknowledge the following individuals for their support of this project.
Dr. Edward Fox
Professor: CS 4624
Dept. of Computer Science, Virginia Tech
Email: [email protected]
Sunshin Lee
Client
Ph.D. Student, Digital Library Research Lab (DLRL), Dept. of Computer Science, Virginia Tech
Email: [email protected]

23
References
[1] Digital Library Research Laboratory. <http://www.dlib.vt.edu>
[2] Palace, Bill. “Data Mining: What is Data Mining?” Spring 1996. Accessed May 7, 2014.
<http://www.anderson.ucla.edu/faculty/jason.frand/teacher/technologies/palace/datamini
ng.htm>
[3] Frequent Pattern Mining with Mahout. April 17, 2014.
<https://www.youtube.com/watch?v=uxRsqxIYNUk>
[4] Cloudera Impala: Real-Time Queries in Apache Hadoop, For Real. February 15, 2014.
<http://blog.cloudera.com/blog/2012/10/cloudera-impala-real-time-queries-in-apache-
hadoop-for-real/>
[5] Milligan, Ian. “Fun with Mahout Clustering (No, Really).” August 9, 2013.
<http://ianmilligan.ca/2013/08/09/fun-with-mahout-clustering/>