dls contract
TRANSCRIPT


The following handbook of information relating to the construction industry has been compiled by:
Davis Langdon & Seah Hong Kong Limited38/F Two Landmark East 100 How Ming Street Kwun Tong, Kowloon Hong Kong Telephone : (852) 2830 3500Fax : (852) 2576 0416Email : [email protected] : www.dlsqs.com
© Davis Langdon & Seah Hong Kong Limited 2012
All rights reserved. No part of this publication may be re-produced or copied in any form without prior written permission from Davis Langdon & Seah Hong Kong Limited.
The information contained herein should be regarded as indicative and for general guidance only. Whilst every effort has been made to ensure accuracy, no responsibility can be accepted for errors and omissions, however caused.
If advice concerning individual projects is required, we would be happy to assist.
Unless otherwise stated, costs reflected in this handbook are Hong Kong costs at 4th Quarter 2011.
Davis Langdon & Seah Hong Kong Limited would like to acknowledge the assistance of Knight Frank and Baker & McKenzie in providing additional data and information for this publication.
ISO 9001 : 2008Certificate No. : CC271
Published by Davis Langdon & Seah Hong Kong LimitedPrinted : January 2012 by R&R Publishing Limited
Electronic Cost Handbook
We have a number of options for accessing an electronic version of our Cost Handbook: 1. Download the PDF version from our website to your
Smart Phone. Install an appropriate file management application
(e.g. USB Disk etc) from the App Store or Android Market
Using your phone’s web browser, go to www.dlsqs.com Click “Research” at the top menu Click “Cost Handbook” at menu on the left Click “Construction Cost Handbook China &
Hong Kong 2012” Click “Download” Click "Open in USB Disk" (if you have used the
USB Disk application) from your Smart Phone You can then go to USB Disk to read the
downloaded 2012 Construction Cost Handbook, even when your Smart Phone is in Airplane mode
2. Alternatively, scan the QR code below to directly access the PDF file. From there follow the same instructions as above.
3. Or download our App to your iPhone or iPad by searching for DLS Cost Handbook in the App Store (Note: Android version coming soon).

TABLE OF CONTENTS
1 2
Table of Contents 1About Us 3Quality Management System 4Calendars 5
1. CONSTRUCTION COST DATA
Construction Costs for Hong Kong 9M&E Costs for Hong Kong 11ACMV Costs for Various Designs and Developments in Hong Kong 13Construction Cost Specification for Hong Kong 15Fit-out Costs for Hong Kong 17Unit Costs for Ancillary Facilities for Hong Kong 19Construction Costs for Selected Asian Cities 21M&E Costs for Selected Asian Cities 27Major Rates for Selected Asian Cities 33Construction Costs for Selected International Cities 39
2. GENERAL CONSTRUCTION DATA
2012 Outlook 43Building Cost Trends in Hong Kong 47Labour Index in Hong Kong 50Material Prices in Hong Kong 51Progress Payments 54Estimating Rules of Thumb and Design Norms for Hong Kong 55Construction Activity in Hong Kong 59Construction Value in Hong Kong 60FIREE Recordals Tracker: November 2011 Update 61Hong Kong General Construction Insurance 65Specified Forms for Buildings Ordinance or Regulations for Hong Kong 67Summary of Building Regulations for Hong Kong 69Percentage Site Coverage and Plot Ratios for Hong Kong 70
3. PROPERTY
Property Commentary 75Property Indicators 79Gross Floor Area (GFA) Calculations in Hong Kong 81Gross Floor Area (GFA) Calculations in PRC 83Construction Floor Area (CFA) Definition 85
4. FINANCIAL
Financial Definitions 87 Financial Formulae 88Mortgage Repayment Table 89Composite CPI 90Exchange Rates 91Currency Charts 93Prime Rates 95Hang Seng Index 97
5. OTHER INFORMATION
Utility Costs for Selected Asian Cities 99Conversion Factors 103IDD Codes and Time Differences 105Public Holidays 107Davis Langdon & Seah Professional Services 117DLS Infrastructure Team 119DLS Interior Fitting Out Team 121DLS Project Monitoring Team 123DLS Sustainability Services Team 126Directory of Offices 129Telephone Directory 149

DAVIS LANGDON & SEAH
ABOUT US
First established in 1934 in Singapore under the name "Waters and Watson" we survived the Second World War to become the pre-eminent Quantity Surveying and Construction Cost Management firm in Asia - operating for many years as Langdon Every and Seah. One of our early partners, Mr. Seah Mong Hee, was the first Asian Chartered Surveyor (RICS) in the world.
Our Hong Kong office opened in 1949 and we quickly established ourselves as the leading firm in the profession.
Following a series of global mergers, Davis Langdon & Seah International was founded in 1990. As we begin 2012, Davis Langdon & Seah has grown to almost 3,000 staff in 40 offices across Asia, and continues to cooperate with Davis Langdon in Europe & Middle East, USA, Australia & New Zealand and Africa - forming a network of over 100 offices across more than 30 countries.
We entered the China market in 1984, introducing modern cost management techniques to its newly evolving construction market. Our initial commissions were from Hong Kong and foreign developers investing in China, although we have since then further developed our client base to include state owned enterprises and local private developers. We now have 16 offices across China located in Hong Kong, Shanghai, Beijing, Guangzhou, Shenzhen, Macau, Chongqing, Wuhan, Tianjin, Shenyang, Chengdu, Foshan, Hangzhou, Dalian, Sanya and Suzhou with a total staff count of around 1,400.
For over 60 years, DLS Hong Kong/China has been proactively providing world-class construction consulting services for all types of building and infrastructure projects. We are committed to further extending our professional expertise to related fields and further expanding our activities in China to support the needs of our clients as they explore one of the world's largest and fastest growing markets.
3 4
QUALITY MANAGEMENT SYSTEM
Nowadays an effective Quality Management System is one of the core elements in any kind of business. Davis Langdon and Seah Hong Kong Limited aims to provide not merely quant i ty surveying services but also the highest quality services to meet clients' requirements.
We launched our Quality Management System in 1993 and have continually upgraded our quality standards since then.
Davis Langdon & Seah Hong Kong Limited achieved certification to ISO 9001:1987 by the Hong Kong Quality Assurance Agency in October 1994 to cover quantity surveying services. We were certified to ISO 9001:1994 in October 1995.
The following further displays our commitment to the continual improvement of our Quality Management System:
(i) June 2009 saw Davis Langdon & Seah Hong Kong Limited being certified to the ISO 9001:2008 standard.
(ii) In December 2009, the Hong Kong office of Davis Langdon & Seah China Limited was certified to the ISO 9001:2008 standard.
(iii) In September 2010, Davis Langdon & Seah Macau Limited was certified to the ISO 9001:2008 standard.
Plans are currently well advanced to further extend our HKQAA ISO certification to all our offices in China.

2 0 1 4
2 0 1 3
2 0 1 2
2 0 1 1 2011 JANUARY FEBRUARY MARCH S M T W T F S S M T W T F S S M T W T F S 1 1 2 3 4 5 1 2 3 4 5 2 3 4 5 6 7 8 6 7 8 9 10 11 12 6 7 8 9 10 11 12 9 10 11 12 13 14 15 13 14 15 16 17 18 19 13 14 15 16 17 18 19 16 17 18 19 20 21 22 20 21 22 23 24 25 26 20 21 22 23 24 25 26 23/30 24/31 25 26 27 28 29 27 28 27 28 29 30 31
APRIL MAY JUNE S M T W T F S S M T W T F S S M T W T F S 1 2 1 2 3 4 5 6 7 1 2 3 4 3 4 5 6 7 8 9 8 9 10 11 12 13 14 5 6 7 8 9 10 11 10 11 12 13 14 15 16 15 16 17 18 19 20 21 12 13 14 15 16 17 18 17 18 19 20 21 22 23 22 23 24 25 26 27 28 19 20 21 22 23 24 25 24 25 26 27 28 29 30 29 30 31 26 27 28 29 30
JULY AUGUST SEPTEMBER S M T W T F S S M T W T F S S M T W T F S 1 2 1 2 3 4 5 6 1 2 3 3 4 5 6 7 8 9 7 8 9 10 11 12 13 4 5 6 7 8 9 10 10 11 12 13 14 15 16 14 15 16 17 18 19 20 11 12 13 14 15 16 17 17 18 19 20 21 22 23 21 22 23 24 25 26 27 18 19 20 21 22 23 24 24/31 25 26 27 28 29 30 28 29 30 31 25 26 27 28 29 30
OCTOBER NOVEMBER DECEMBER S M T W T F S S M T W T F S S M T W T F S 1 1 2 3 4 5 1 2 3 2 3 4 5 6 7 8 6 7 8 9 10 11 12 4 5 6 7 8 9 10 9 10 11 12 13 14 15 13 14 15 16 17 18 19 11 12 13 14 15 16 17 16 17 18 19 20 21 22 20 21 22 23 24 25 26 18 19 20 21 22 23 24 23/30 24/31 25 26 27 28 29 27 28 29 30 25 26 27 28 29 30 31
2012 JANUARY FEBRUARY MARCH S M T W T F S S M T W T F S S M T W T F S 1 2 3 4 5 6 7 1 2 3 4 1 2 3 8 9 10 11 12 13 14 5 6 7 8 9 10 11 4 5 6 7 8 9 10 15 16 17 18 19 20 21 12 13 14 15 16 17 18 11 12 13 14 15 16 17 22 23 24 25 26 27 28 19 20 21 22 23 24 25 18 19 20 21 22 23 24 29 30 31 26 27 28 29 25 26 27 28 29 30 31
APRIL MAY JUNE S M T W T F S S M T W T F S S M T W T F S 1 2 3 4 5 6 7 1 2 3 4 5 1 2 8 9 10 11 12 13 14 6 7 8 9 10 11 12 3 4 5 6 7 8 9 15 16 17 18 19 20 21 13 14 15 16 17 18 19 10 11 12 13 14 15 16 22 23 24 25 26 27 28 20 21 22 23 24 25 26 17 18 19 20 21 22 23 29 30 27 28 29 30 31 24 25 26 27 28 29 30
JULY AUGUST SEPTEMBER S M T W T F S S M T W T F S S M T W T F S 1 2 3 4 5 6 7 1 2 3 4 1 8 9 10 11 12 13 14 5 6 7 8 9 10 11 2 3 4 5 6 7 8 15 16 17 18 19 20 21 12 13 14 15 16 17 18 9 10 11 12 13 14 15 22 23 24 25 26 27 28 19 20 21 22 23 24 25 16 17 18 19 20 21 22 29 30 31 26 27 28 29 30 31 24/30 24 25 26 27 28 29
OCTOBER NOVEMBER DECEMBER S M T W T F S S M T W T F S S M T W T F S 1 2 3 4 5 6 1 2 3 1 7 8 9 10 11 12 13 4 5 6 7 8 9 10 2 3 4 5 6 7 8 14 15 16 17 18 19 20 11 12 13 14 15 16 17 9 10 11 12 13 14 15 21 22 23 24 25 26 27 18 19 20 21 22 23 24 16 17 18 19 20 21 22 28 29 30 31 25 26 27 28 29 30 23/30 24/31 25 26 27 28 29
2013 JANUARY FEBRUARY MARCH S M T W T F S S M T W T F S S M T W T F S 1 2 3 4 5 1 2 1 2 6 7 8 9 10 11 12 3 4 5 6 7 8 9 3 4 5 6 7 8 9 13 14 15 16 17 18 19 10 11 12 13 14 15 16 10 11 12 13 14 15 16 20 21 22 23 24 25 26 17 18 19 20 21 22 23 17 18 19 20 21 22 23 27 28 29 30 31 24 25 26 27 28 24/31 25 26 27 28 29 30
APRIL MAY JUNE S M T W T F S S M T W T F S S M T W T F S 1 2 3 4 5 6 1 2 3 4 1 7 8 9 10 11 12 13 5 6 7 8 9 10 11 2 3 4 5 6 7 8 14 15 16 17 18 19 20 12 13 14 15 16 17 18 9 10 11 12 13 14 15 21 22 23 24 25 26 27 19 20 21 22 23 24 25 16 17 18 19 20 21 22 28 29 30 26 27 28 29 30 31 23/30 24 25 26 27 28 29
JULY AUGUST SEPTEMBER S M T W T F S S M T W T F S S M T W T F S 1 2 3 4 5 6 1 2 3 1 2 3 4 5 6 7 7 8 9 10 11 12 13 4 5 6 7 8 9 10 8 9 10 11 12 13 14 14 15 16 17 18 19 20 11 12 13 14 15 16 17 15 16 17 18 19 20 21 21 22 23 24 25 26 27 18 19 20 21 22 23 24 22 23 24 25 26 27 28 28 29 30 31 25 26 27 28 29 30 31 29 30
OCTOBER NOVEMBER DECEMBER S M T W T F S S M T W T F S S M T W T F S 1 2 3 4 5 1 2 1 2 3 4 5 6 7 6 7 8 9 10 11 12 3 4 5 6 7 8 9 8 9 10 11 12 13 14 13 14 15 16 17 18 19 10 11 12 13 14 15 16 15 16 17 18 19 20 21 20 21 22 23 24 25 26 17 18 19 20 21 22 23 22 23 24 25 26 27 28 27 28 29 30 31 24 25 26 27 28 29 30 29 30 31
2014 JANUARY FEBRUARY MARCH S M T W T F S S M T W T F S S M T W T F S 1 2 3 4 1 1 5 6 7 8 9 10 11 2 3 4 5 6 7 8 2 3 4 5 6 7 8 12 13 14 15 16 17 18 9 10 11 12 13 14 15 9 10 11 12 13 14 15 19 20 21 22 23 24 25 16 17 18 19 20 21 22 16 17 18 19 20 21 22 26 27 28 29 30 31 23 24 25 26 27 28 23/30 24/31 25 26 27 28 29
APRIL MAY JUNE S M T W T F S S M T W T F S S M T W T F S 1 2 3 4 5 1 2 3 1 2 3 4 5 6 7 6 7 8 9 10 11 12 4 5 6 7 8 9 10 8 9 10 11 12 13 14 13 14 15 16 17 18 19 11 12 13 14 15 16 17 15 16 17 18 19 20 21 20 21 22 23 24 25 26 18 19 20 21 22 23 24 22 23 24 25 26 27 28 27 28 29 30 25 26 27 28 29 30 31 29 30
JULY AUGUST SEPTEMBER S M T W T F S S M T W T F S S M T W T F S 1 2 3 4 5 1 2 1 2 3 4 5 6 6 7 8 9 10 11 12 3 4 5 6 7 8 9 7 8 9 10 11 12 13 13 14 15 16 17 18 19 10 11 12 13 14 15 16 14 15 16 17 18 19 20 20 21 22 23 24 25 26 17 18 19 20 21 22 23 21 22 23 24 25 26 27 27 28 29 30 31 24/31 25 26 27 28 29 30 28 29 30
OCTOBER NOVEMBER DECEMBER S M T W T F S S M T W T F S S M T W T F S 1 2 3 4 1 1 2 3 4 5 6 5 6 7 8 9 10 11 2 3 4 5 6 7 8 7 8 9 10 11 12 13 12 13 14 15 16 17 18 9 10 11 12 13 14 15 14 15 16 17 18 19 20 19 20 21 22 23 24 25 16 17 18 19 20 21 22 21 22 23 24 25 26 27 26 27 28 29 30 31 24/30 24 25 26 27 28 29 28 29 30 31
CALENDARS
5 6
CONSTRUCTION COST DATAConstruction Costs for Hong Kong
M&E Costs for Hong Kong ACMV Costs for Various Designs and
Developments in Hong Kong
Construction Cost Specification for Hong Kong Fit-out Costs for Hong Kong
Unit Costs for Ancillary Facilities for Hong Kong Construction Costs for Selected Asian Cities
M&E Costs for Selected Asian Cities Major Rates for Selected Asian Cities
Construction Costs for Selected International Cities

1. CONSTRUCTION COST DATA
CONSTRUCTION COSTS FOR HONG KONG
The a
bove
costs
are a
t 4th
Qua
rter 2
011 l
evels
.
CO
NST
RU
CTI
ON
CO
STS
FOR
HO
NG
KO
NG
9 10
BU
ILD
ING
TYP
EH
K$/
m2
BU
ILD
ING
SER
VIC
ESTO
TAL
DO
MES
TIC
Publi
c ren
tal ho
using
, high
rise
6,0
55
- 6,8
10
1,045
-
1,350
7,1
00
- 8,1
60Pr
ivate
hous
ing es
tates
, high
rise
14
,035
- 14
,780
2,4
55
- 3,3
20
16,49
0 -
18,10
0Pr
ivate
luxur
y apa
rtmen
ts, hi
gh ris
e
15,80
5 -
up
3,325
-
4,220
19
,130
up
Terra
ced h
ouse
s
19,06
5 -
20,49
0
2,255
-
2,860
21
,320
- 23
,350
Indivi
dual
pres
tige h
ouse
s
27,48
5
up
2,455
-
3,610
29
,940
up
OFF
ICE/
CO
MM
ERC
IAL
Aver
age s
tanda
rd of
fices
, high
rise
12
,340
- 13
,350
4,1
50
- 5,2
80
16,49
0 -
18,63
0Pr
estig
e offic
es, h
igh ris
e
16,47
0
up
4,850
-
6,130
21
,320
up
Aver
age s
tanda
rd sh
oppin
g cen
tres
11
,840
- 14
,770
4,7
00
- 5,4
30
16,54
0 -
20,20
0Pr
estig
e sho
pping
centr
es
16,42
0
up
4,900
-
6,130
21
,320
up
HO
TELS
3-sta
r bud
get h
otels,
inclu
sive o
f F.F.
& E
.
15,07
0 -
16,63
0
4,930
-
5,700
20
,000
- 22
,330
5-sta
rt lux
ury h
otels,
inclu
sive o
f F.F.
& E
.
21,47
0
up
5,330
-
6,550
26
,800
up
IND
UST
RIA
L
Light
duty
flatte
d fac
tories
, 7.5
kpa (
150 l
b.) lo
ading
6,9
80
- 7,4
10
1,750
-
2,330
8,7
30
- 9,7
40He
avy d
uty fla
tted f
actor
ies an
d war
ehou
ses,
15
kpa (
300 l
b.) lo
ading
7,6
40
- 8,5
90
2,000
-
2,580
9,6
40
- 11
,170
OTH
ERS
Carp
arks
, abo
ve gr
ound
6,2
10
- 6,4
80
1,300
-
2,050
7,5
10
- 8,5
30Pr
imar
y and
seco
ndar
y sch
ools
9,1
20
- 9,3
30
2,050
-
2,850
11
,170
- 12
,180
Inter
natio
nal s
choo
ls
10,96
0 -
11,68
0
3,000
-
3,950
13
,960
- 15
,630
Stud
ent h
ostel
s
8,790
-
10,06
0
3,150
-
3,950
11
,940
- 14
,010
Spor
ts clu
bs in
clusiv
e of F
.F. &
E.
15
,270
- 16
,970
5,3
50
- 6,9
00
20,62
0 -
23,87
0

1. CONSTRUCTION COST DATA
M&E COSTS FOR HONG KONG
M&
E C
OST
S FO
R H
ON
G K
ON
G
11 12
BU
ILD
ING
TYP
EH
K$/
m2
MEC
HANI
CAL
SERV
ICES
ELEC
TRIC
AL
SERV
ICES
FIR
E
SERV
ICES
LIFT
S/
ES
CALA
TORS
HYD
RA
ULI
C
SERV
ICES
TOTA
L
SE
RVIC
ES
DO
MES
TIC
Publi
c ren
tal ho
using
, high
rise
- -
450 -
55
0
75 -
120
20
0 -
250
32
0 -
430
1,04
5 - 1,
350
Priva
te ho
using
estat
es, h
igh ris
e
650 -
85
0
850 -
1,05
0
75 -
120
33
0 -
550
55
0 -
750
2,45
5 - 3,
320
Priva
te lux
ury a
partm
ents,
high
rise
1,10
0 - 1,
300
1,05
0 - 1,
300
75
- 1
20
450
- 65
0
650
- 85
0 3
,325 -
4,22
0Te
rrace
d hou
ses
85
0 - 1,
100
85
0 - 1,
050
55
- 1
10
- -
50
0 -
600
2,25
5 - 2,
860
Indivi
dual
pres
tige h
ouse
s
850 -
1,40
0 1
,050 -
1,50
0
55 -
110
- -
50
0 -
600
2,45
5 - 3,
610
OFF
ICE/
CO
MM
ERC
IAL
Aver
age s
tanda
rd of
fices
, high
rise
1,60
0 - 1,
950
1,30
0 - 1,
650
43
0 -
550
55
0 -
750
27
0 -
380
4,15
0 - 5,
280
Pres
tige o
ffices
, high
rise
1,90
0 - 2,
350
1,60
0 - 1,
950
43
0 -
550
65
0 -
900
27
0 -
380
4,85
0 - 6,
130
Aver
age s
tanda
rd sh
oppin
g cen
tres
1,95
0 - 2,
150
1,40
0 - 1,
600
43
0 -
550
65
0 -
750
27
0 -
380
4,70
0 - 5,
430
Pres
tige s
hopp
ing ce
ntres
1,95
0 - 2,
400
1,60
0 - 1,
950
43
0 -
550
65
0 -
850
27
0 -
380
4,90
0 - 6,
130
HO
TELS
3-star
budg
et ho
tels,
inclus
ive of
F.F.
& E.
1,75
0 - 1,
950
1,50
0 - 1,
750
43
0 -
550
45
0 -
550
80
0 -
900
4,93
0 - 5,
700
5-star
t luxu
ry ho
tels,
inclus
ive of
F.F.
& E.
1,85
0 - 2,
150
1,75
0 - 2,
150
43
0 -
550
45
0 -
650
85
0 - 1
,050
5,33
0 - 6,
550
IND
UST
RIA
LLig
ht du
ty fla
tted f
actor
ies, 7
.5 kp
a
(1
50 lb
.) loa
ding
38
0 -
500
45
0 -
650
25
0 -
300
45
0 -
550
22
0 -
330
1,75
0 - 2,
330
Heav
y duty
flatte
d fac
tories
and
wa
rehou
ses,
15 kp
a (30
0 lb.)
load
ing
380 -
50
0
650 -
85
0
250
- 30
0
500
- 60
0
220
- 33
0 2
,000 -
2,58
0
OTH
ERS
Carp
arks
, abo
ve gr
ound
20
0 -
550
45
0 -
650
25
0 -
300
25
0 -
350
15
0 -
200
1,30
0 - 2,
050
Prim
ary a
nd se
cond
ary s
choo
ls
550 -
85
0
850 -
1,05
0
250
- 35
0
150
- 25
0
250
- 35
0 2
,050 -
2,85
0Int
erna
tiona
l sch
ools
1,30
0 - 1,
600
1,05
0 - 1,
400
25
0 -
350
15
0 -
250
25
0 -
350
3,00
0 - 3,
950
Stud
ent h
ostel
s
650 -
85
0 1
,400 -
1,60
0
350
- 45
0
150
- 25
0
600
- 80
0 3
,150 -
3,95
0Sp
orts
clubs
inclu
sive o
f F.F.
& E
. 2
,500 -
3,00
0 1
,800 -
2,50
0
450
- 60
0
250
- 35
0
350
- 45
0 5
,350 -
6,90
0
The a
bove
costs
are a
t 4th
Qua
rter 2
011 l
evels
.
1. CONSTRUCTION COST DATA
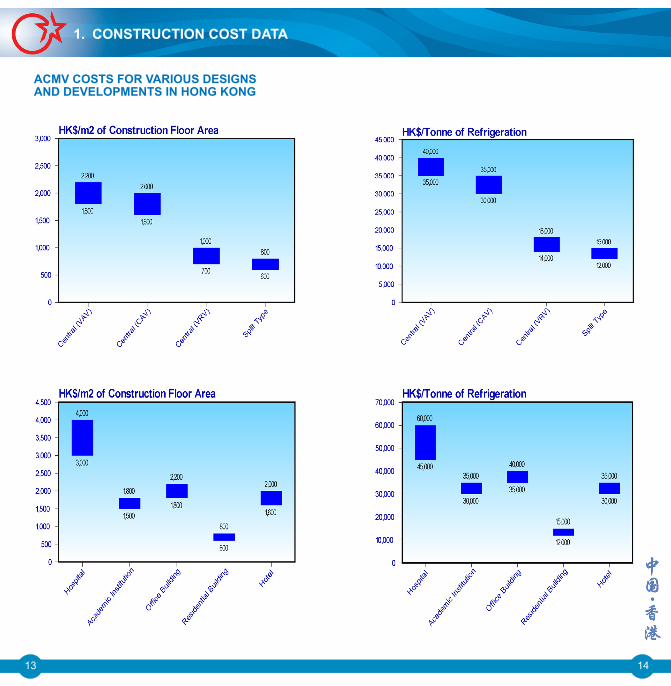
ACMV COSTS FOR VARIOUS DESIGNSAND DEVELOPMENTS IN HONG KONG
13 14

1. CONSTRUCTION COST DATA
CONSTRUCTION COST SPECIFICATION FOR HONG KONG
The costs for the respective categories given on the previous pages are averages based on fixed price competitive tenders. It must be understood that the actual cost of a building will depend upon the design and many other factors and may vary from the figures shown.
The costs per square metre are based on construction floor areas measured to the outside face of the external walls/external perimeter including lift shafts, stairwells, balconies, plant rooms, water tanks and the like.
All buildings are assumed to have no basement (unless otherwise stated) and to be built on flat ground, with normal soil conditions. The costs exclude external works, land costs, professional fees, finance and legal expenses.
The standards for each category of buildings vary from country to country. Standards representing by the construction costs of other regions published hereinafter do not necessarily follow those of Hong Kong.
DOMESTIC
Public rental housing is based on Hong Kong Housing Authority Non-standard Cruciform Block design.
Private housing estates are based on blocks containing 30-50 storeys, with average unit size not greater than 100 m2. Single glazed windows. Tiled or plastered finishes in general.
Air conditioning, kitchen cabinets and home appliances are included for private housing estates, private luxury apartments, terraced houses and prestige houses.
All types of domestic construction include provision of functional light fittings only and no feature light fittings have been allowed. Fitting out works and loose furniture are also not included.
OFFICE/COMMERCIAL
Office based on buildings 20-30 storeys high with floor plans minimum 1,000 m2 per level.
Average standard offices and shopping centres exclude finishes, A/C ducting and light fittings to tenants areas.
Prestige offices have curtain wall elevations and granite finished lobbies, with raised floor, suspended ceiling, A/C ducting and light fittings to tenants areas.
INDUSTRIAL
Flatted factories exclude manufacturing equipment, air-conditioning, electrical distribution systems and special services provisions to tenants areas.
HOTELS
F.F. & E. includes interior decoration and loose furniture etc. but excludes pre-opening expenses and hotel operation system and equipment costs (e.g. cutlery, crockery, linen, uniform, etc.).
Includes 1 level of basement.
OTHERS
Carparks to be multi-storey.
Primary and secondary schools with standard government provisions.
International Schools with upgraded facilities.
Student hostels to university standard.
Sports club to the standard of the Government's indoor recreational centre.
15 16

1. CONSTRUCTION COST DATA
FIT-OUT COSTS FOR HONG KONG
BUILDING TYPE HK$/m2
HOTELS
Public Areas (Front of House) : 3-start Hotel 7,600 - 11,500
4-start Hotel 12,000 - 16,000
5-start Hotel 17,000 up
Guest Rooms : 3-start Hotel 6,000 - 7,400
4-start Hotel 7,500 - 10,000
5-start Hotel 10,000 up
Notes : 1. Includesfurniture,floor,wallandceiling
finishes, drapery, sanitary fittings andlightfittings.
2. Excludespartitioning,M&Eworks,buildingshell,chandeliers,operationalitemsandequipment (e.g. cutlery, crockery, linen,television, refrigerator etc.), openingexpenses,stageequipmentandcomputersystems.
OFFICES
General office 4,800 - 7,400
Executive office 7,500 - 10,500
Prestige office 10,500 up
Notes :1. Local/Taiwanese/PRCfurnitureallowed
forgeneraloffices.2. Includesfurniture,partitioning,electrical
work,minoralterationtoair-conditioning,fire servicesand suspended ceiling tosuitlayout.
3. Excludestelephones,datacabling,officeequipment(e.g.computers,photocopiers,faxmachines,UPS,etc).
BUILDING TYPE HK$/m2
DEPARTMENT STORES
General department store 6,000 - 9,300Prestige department store 10,000 up
Notes : 1. Includeselectricalwork,additionalFCU
andminoralterationof fireservices tosuitlayout.
2. Excludes facademodification, datacabling,operationalitemsandequipment(e.g.computers,P.O.S.,officeequipment)andopeningexpenses.
RESTAURANTS
General dining restaurant 7,600 - 15,000
Fine dining restaurant 16,000 up
Notes :1. Includesfurniture,floor,wallandceiling
finishes,electricalwork,minoralterationto air-conditioning and fire servicesinstallation to suit layout, exhaust forkitchen.
2. Excludesexhaustflue,operationalitems(e.g.cutlery,crockery,linen,utensils,etc.).
17 18

1. CONSTRUCTION COST DATA
19 20
DESCRIPTION UNIT HK$
SQUASH COURTS
Single court with glass backwall including associated mechanical and electrical services but excluding any public facilities (enclosing structure not included).
per court 420,000
TENNIS COURTS
Single court on grade with acrylic surfacing and complete with chain link fence.
per court 870,000
Single court on grade with artificial turf surfacing and complete with chain link fence.
per court 980,000
Extra for lighting. per court 300,000
SWIMMING POOLS
Half Olympic (25m x 10.50m) outdoor swimming pool built into ground, fully tiled; complete with 5m wide deck and associated pool equipment and ozonesystem.
per pool 5,500,000
PLAYGROUND EQUIPMENT
Outdoor playground equipment comprising various activities. per set
250,000 to
650,000
UNIT COSTS FOR ANCILLARY FACILITIESFOR HONG KONG
DESCRIPTION UNIT HK$
SAUNAS
Sauna room for 4-6 people complete with all accessories (enclosing structure not included).
per room 130,000
STEAM BATHS
Steam bath for 4-6 people complete with all accessories (enclosing structure not included).
per room 130,000
GOLF COURSES
(Based on average cost of an 18-hole golf course)
Excluding associated buildings and equipment.
per hole
7,000,000 to
13,000,000
GOLF SIMULATOR
Golf simulation system complete with projector, high impact projection screen, artificial turf, recording system and control computer with software (enclosing structure not included). per set 550,000
1. CONSTRUCTION COST DATA
BU
ILD
ING
TYP
EU
S$/m
2
HONG
KO
NG +
SHA
NGHA
I + B
EIJI
NG +
GUA
NGZH
OU/
SH
ENZH
EN +
CHO
NGQ
ING
+CH
ENG
DU +
DO
MES
TIC
Detac
hed h
ouse
s and
bung
alows
3,8
38
1,096
77
6
622
76
0
780
Terra
ced h
ouse
s
2,863
82
2
528
43
9
480
50
0Av
erag
e stan
dard
apar
tmen
ts, hi
gh ris
e
2,217
65
8
560
52
5
440
47
0Lu
xury
apar
tmen
ts, hi
gh ris
e
2,453
98
7
993
60
5
800
1,0
00
OFF
ICE/
CO
MM
ERC
IAL
Aver
age s
tanda
rd of
fices
, high
rise
2,2
51
987
94
7
760
86
0
940
Pres
tige o
ffices
, high
rise
2,7
33
1,316
1,2
69
1,044
1,1
00
1,250
Shop
ping c
entre
s
2,545
1,2
06
1,090
98
3
900
95
0
HO
TELS
Reso
rt ho
tels
N/
A
1,370
N/
A
N/A
N/
A
N/A
3-sta
r bud
get h
otels,
inclu
sive o
f F.F.
& E
.
2,713
1,0
96
1,116
N/
A
1,050
1,1
005-
star lu
xury
hotel
s, inc
lusive
of F.
F. &
E.
3,436
2,1
93
1,919
1,5
17
1,880
2,1
50
IND
UST
RIA
LLig
ht du
ty fla
tted f
actor
ies
1,184
N/A
N/
A
N/A
N/
A
N/A
Heav
y duty
flatte
d fac
tories
and
wa
reho
uses
1,3
34
N/A
N/
A
N/A
N/
A
N/A
Sing
le sto
rey c
onve
ntion
al fac
tory o
f
struc
tural
steelw
ork
N/
A
548
58
6
520
55
0
550
Owne
r ope
rated
factp
ries,
low ris
e
1,805
73
5
765
64
8
N/A
N/
A
OTH
ERS
Base
ment
carp
arks
(< 3
levels
)
1,900
83
0
780
75
9
700
70
0El
evate
d car
parks
(< 4
levels
)
1,028
39
8
456
35
3
390
39
0Pr
imar
y and
seco
ndar
y sch
ools
1,4
97
598
63
2
415
48
0
500
Stud
ent h
ostel
s
1,663
34
3
335
26
6
330
33
0Sp
orts
clubs
inclu
sive o
f F.F.
& E
.
2,852
1,0
51
970
79
8
900
99
0
Exch
ange
Rate
Use
d : U
S$1 =
HK$7
.8RM
B6.35
RMB6
.35RM
B6.35
RMB6
.35RM
B6.35
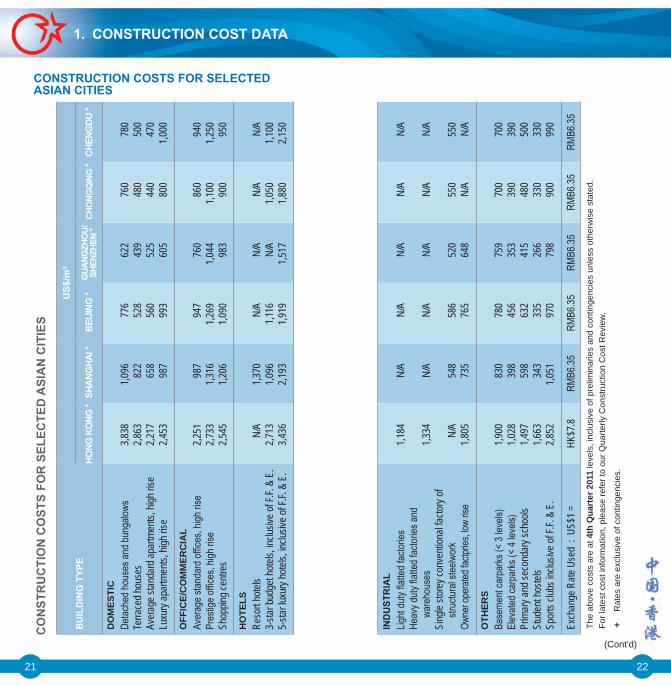
CONSTRUCTION COSTS FOR SELECTEDASIAN CITIES
CO
NST
RU
CTI
ON
CO
STS
FOR
SEL
ECTE
D A
SIA
N C
ITIE
S
The
abov
e co
sts
are
at 4
th Q
uart
er 2
011
leve
ls, i
nclu
sive
of p
relim
inar
ies
and
cont
inge
ncie
s un
less
oth
erw
ise
stat
ed.
For l
ates
t cos
t inf
orm
atio
n, p
leas
e re
fer t
o ou
r Qua
rterly
Con
stru
ctio
n C
ost R
evie
w.
+ R
ates
are
exc
lusi
ve o
f con
tinge
ncie
s.
(Cont'd)
21 22

1. CONSTRUCTION COST DATA
BU
ILD
ING
TYP
EU
S$/m
2
MAC
AU Ђ
SING
APO
RE Φ
KUAL
ALU
MPU
R B
RUNE
I IN
DIA
₲ M
ANIL
A Ω
DO
MES
TIC
Detac
hed h
ouse
s and
bung
alows
3,4
55
2,400
96
2
751
40
9
1,210
Terra
ced h
ouse
s
3,015
2,0
40
317
52
5
300
62
0Av
erag
e stan
dard
apar
tmen
ts, hi
gh ris
e
1,545
1,6
80
463
87
1
347
84
5Lu
xury
apar
tmen
ts, hi
gh ris
e
2,230
2,7
60
1,070
1,0
71
439
1,0
70
OFF
ICE/
CO
MM
ERC
IAL
Aver
age s
tanda
rd of
fices
, high
rise
2,2
00
2,080
75
2
871
40
6
820
Pres
tige o
ffices
, high
rise
2,5
20
2,320
1,1
05
1,192
51
4
1,080
Shop
ping c
entre
s
2,710
2,2
40
917
1,0
97
470
96
0
HO
TELS
Reso
rt ho
tels
N/
A
2,480
1,3
33
1,438
72
3
1,290
3-sta
r bud
get h
otels,
inclu
sive o
f F.F.
& E
.
2,560
2,5
60
1,537
1,5
59
817
1,2
305-
star lu
xury
hotel
s, inc
lusive
of F.
F. &
E.
3,480
3,4
40
2,241
2,1
63
1,588
1,6
00
IND
UST
RIA
LLig
ht du
ty fla
tted f
actor
ies
1,245
1,120
43
8
483
26
3
430
Heav
y duty
flatte
d fac
tories
and
ware
hous
es
N/A
1,3
60
521
N/
A
313
47
5Si
ngle
store
y con
venti
onal
factor
y of
str
uctur
al ste
elwor
k
N/A
96
0
435
44
1
252
41
0Ow
ner o
perat
ed fa
ctprie
s, low
rise
N/
A
N/A
53
0
N/A
31
7
440
OTH
ERS
Base
ment
carp
arks
(< 3
levels
)
1,230
1,3
10
505
N/
A
254
48
0El
evate
d car
parks
(< 4
levels
)
910
76
0
286
49
4
222
46
5 Pr
imar
y and
seco
ndar
y sch
ools
N/
A
1,055
32
7
693
17
8
590
Stud
ent h
ostel
s
N/A
1,1
60
413
79
3
228
69
5Sp
orts
clubs
inclu
sive o
f F.F.
& E
.
N/A
1,7
70
854
N/
A
605
1,2
60
Exch
ange
Rate
Use
d : U
S$1 =
MOP7
.97S$
1.25
RM3.1
5B$
1.26
INR5
0PH
P43
CONSTRUCTION COSTS FOR SELECTEDASIAN CITIES
CO
NST
RU
CTI
ON
CO
STS
FOR
SEL
ECTE
D A
SIA
N C
ITIE
S (C
ont'd
)
₲
Rat
es b
ased
on
proj
ects
in B
anga
lore
and
are
net
t of
VAT
and
Ser
vice
Tax
. Mum
bai c
osts
are
gen
eral
ly 8
% h
ighe
r.Ω
R
ates
are
exc
lusi
ve o
f con
tinge
ncie
s an
d in
clud
e 12
% V
AT.
(Cont'd)
23 24
The
abov
e co
sts
are
at 4
th Q
uart
er 2
011
leve
ls, i
nclu
sive
of p
relim
inar
ies
and
cont
inge
ncie
s un
less
oth
erw
ise
stat
ed.
For l
ates
t cos
t inf
orm
atio
n, p
leas
e re
fer t
o ou
r Qua
rterly
Con
stru
ctio
n C
ost R
evie
w.
Ђ
Rat
es a
re e
xclu
sive
of c
ontin
genc
ies
and
any
man
agem
ent
co
ntra
ct fe
e.
Φ R
ates
are
net
t of G
ST
and
excl
usiv
e of
con
tinge
ncie
s.

1. CONSTRUCTION COST DATA
BU
ILD
ING
TYP
EU
S$/m
2
KAR
ACHI
BAN
GKO
K #
JAK
ARTA
^ H
O C
HI M
INH
# S
EOUL
$TO
KYO
♣
DO
MES
TIC
Detac
hed h
ouse
s and
bung
alows
985
- 1,1
50
967
47
5
500 -
600
1,9
30
2,760
Terra
ced h
ouse
s
250 -
350
58
3
N/A
42
5 - 48
5
1,605
N/
AAv
erag
e stan
dard
apar
tmen
ts, hi
gh ris
e
580 -
775
82
8
595
63
5 - 76
0
1,310
2,2
30Lu
xury
apar
tmen
ts, hi
gh ris
e 8
70 -
1,150
1,1
62
800
81
5 - 94
5
1,630
3,1
00
OFF
ICE/
CO
MM
ERC
IAL
Aver
age s
tanda
rd of
fices
, high
rise
57
5 - 72
5
750
57
5
760 -
880
1,1
70
2,680
Pres
tige o
ffices
, high
rise
950
- 1,1
50
983
86
0
890 -
1,13
0
1,330
3,2
00Sh
oppin
g cen
tres
69
5 - 90
0
800
49
5
695 -
815
1,4
80
2,190
HO
TELS
Reso
rt ho
tels
1,96
5 - 2,
305
2,2
67
1,200
1,19
5 - 1,
500
1,5
35
3,510
3-sta
r bud
get h
otels,
inclu
sive o
f F.F.
& E
. 1
,125 -
1,45
0
1,367
98
0 1
,495 -
1,75
0
1,730
3,4
80
5-sta
r luxu
ry ho
tels,
inclus
ive of
F.F.
& E.
1,80
0 - 2,
100
1,9
33
1,395
1,82
5 - 2,
060
2,3
00
5,100
IND
UST
RIA
LLig
ht du
ty fla
tted f
actor
ies
300 -
375
60
0
N/A
23
8 - 39
0
N/A
1,5
40He
avy d
uty fla
tted f
actor
ies an
d
wa
reho
uses
35
0 - 45
0
N/A
N/
A
395 -
510
N/
A
2,040
Sing
le sto
rey c
onve
ntion
al fac
tory o
f
struc
tural
steelw
ork
43
5 - 45
0
600
26
0
385 -
510
69
0
1,760
Owne
r ope
rated
factp
ries,
low ris
e
325 -
425
N/
A
N/A
39
5 - 49
5
N/A
N/
A
OTH
ERS
Base
ment
carp
arks
(< 3
levels
)
275 -
325
68
3
390
64
0 - 73
0
965
N/
AEl
evate
d car
parks
(< 4
levels
)
200 -
250
35
0
260
34
0 - 45
5
565
1,6
90Pr
imar
y and
seco
ndar
y sch
ools
55
0 - 67
5
N/A
N/
A
475 -
500
1,8
20
2,070
Stud
ent h
ostel
s
410 -
540
N/
A
N/A
50
0 - 63
0
1,080
1,8
90Sp
orts
clubs
inclu
sive o
f F.F.
& E
.
810 -
900
N/
A
N/A
75
5 - 84
0
1,460
2,2
80
Exch
ange
Rate
Use
d : U
S$1 =
PKR8
9.42
BAHT
30ID
R8,91
0VN
D21,0
11KR
W1,1
44JP
Y78.1
4
CONSTRUCTION COSTS FOR SELECTEDASIAN CITIES
CO
NST
RU
CTI
ON
CO
STS
FOR
SEL
ECTE
D A
SIA
N C
ITIE
S (C
ont'd
)
$ R
ates
are
net
t of V
AT a
nd e
xclu
sive
of c
ontin
genc
ies.
♣ R
ates
exc
lude
con
tinge
ncie
s, c
onsu
ltant
fees
and
con
sum
ptio
n ta
x.
25 26
The
abov
e co
sts
are
at 4
th Q
uart
er 2
011
leve
ls, i
nclu
sive
of p
relim
inar
ies
and
cont
inge
ncie
s un
less
oth
erw
ise
stat
ed.
For l
ates
t cos
t inf
orm
atio
n, p
leas
e re
fer t
o ou
r Qua
rterly
Con
stru
ctio
n C
ost R
evie
w.
# R
ates
are
net
t of V
AT a
nd c
ontin
genc
ies.
^ R
ates
are
net
t of V
AT.

1. CONSTRUCTION COST DATA
BU
ILD
ING
TYP
EH
ON
G K
ON
GSH
AN
GH
AI
BEI
JIN
GG
UA
NG
ZHO
U/
SHEN
ZHEN
CH
ON
GQ
ING
CH
ENG
DU
HK
$/m
2R
MB
/m2
RM
B/m
2R
MB
/m2
RM
B/m
2R
MB
/m2
MEC
HA
NIA
L SE
RVI
CES
Offic
es
1,600
- 2,3
50
761 -
96
6
750 -
99
0
650 -
88
0
700 -
90
0
700 -
1,00
0Ind
ustria
l *
380 -
50
0
173 -
28
9
160 -
27
0
135 -
24
0
150 -
25
0
150 -
25
0Ho
tels
1,7
50 -
2,150
97
1 - 1
,265
91
0 - 1
,110
89
0 - 1
,115
75
0 - 1
,000
75
0 - 1
,200
Shop
ping C
entre
s
1,950
- 2,4
00
1,050
- 1,1
03
790 -
95
0
660 -
89
0
600 -
85
0
600 -
1,00
0Ap
artm
ent
65
0 - 1
,300
31
0 -
410
13
0 -
370
10
5 -
325
10
0 -
300
10
0 -
300
ELEC
TRIC
AL
SER
VIC
ESOf
fices
1,3
00 -
1,950
59
3 -
651
46
0 -
670
45
0 -
650
45
0 -
650
45
0 -
700
Indus
trial *
*
450 -
85
0
305 -
43
1
320 -
45
0
260 -
40
0
300 -
40
0
300 -
40
0Ho
tels
1,5
00 -
2,150
65
1 -
830
70
5 -
898
56
5 -
765
55
0 -
700
55
0 -
800
Shop
ping C
entre
s
1,400
- 1,9
50
520 -
65
1
481 -
66
3
450 -
61
0
450 -
60
0
450 -
70
0Ap
artm
ent
85
0 - 1
,300
25
2 -
368
25
3 -
386
24
0 -
380
25
0 -
350
25
0 -
350
HYD
RA
ULI
C S
ERVI
CES
Offic
es
270 -
38
0
110 -
16
3
95 -
140
10
5 -
140
70
- 13
0
70 -
130
Indus
trial
22
0 -
330
89
- 13
1
95 -
140
75
- 10
2
70 -
120
70
- 12
0
Hot
els
80
0 - 1
,050
36
8 -
488
36
0 -
470
32
5 -
410
30
0 -
400
30
0 -
400
Shop
ping C
entre
s
270 -
38
0
137 -
18
4
140 -
20
0
105 -
14
0
70 -
130
70
- 13
0Ap
artm
ent
55
0 -
850
16
8 -
226
16
5 -
225
12
5 -
220
12
0 -
200
12
0 -
200
FIR
E SE
RVI
CES
Offic
es
430 -
55
0
226 -
32
0
180 -
26
5
190 -
29
5
180 -
25
0
180 -
25
0Ind
ustria
l
250 -
30
0
168 -
27
8
140 -
21
5
125 -
24
0
150 -
25
0
150 -
25
0Ho
tels
43
0 -
550
28
9 -
399
21
5 -
370
23
0 -
345
20
0 -
330
20
0 -
330
Shop
ping C
entre
s
430 -
55
0
268 -
38
3
215 -
37
0
230 -
34
5
220 -
33
0
220 -
33
0Ap
artme
nt
75 -
120
47
- 11
6
60 -
125
55
- 10
5
50 -
100
50
- 10
0LI
FTS
/ ESC
ALA
TOR
SOf
fices
55
0 -
900
27
5 -
540
29
4 -
577
25
0 -
410
35
0 -
550
35
0 -
600
Indus
trial
45
0 -
600
13
0 -
380
14
5 -
400
13
5 -
390
15
0 -
350
15
0 -
350
Hotel
s
450 -
65
0
215 -
48
5
232 -
52
0
200 -
39
0
300 -
45
0
300 -
50
0Sh
oppin
g Cen
tres
65
0 -
850
32
0 -
485
32
7 -
520
30
5 -
430
30
0 -
400
30
0 -
450
Apar
tmen
t
330 -
65
0
160 -
32
0
175 -
28
9
105 -
23
0
140 -
25
0
140 -
25
0
M&
E C
OST
S FO
R S
ELEC
TED
ASI
AN
CIT
IES
M&E COSTS FOR SELECTED ASIAN CITIES
The
abov
e co
sts
are
at 4
th Q
uart
er 2
011
leve
ls, e
xclu
sive
of c
ontin
genc
ies
unle
ss o
ther
wis
e st
ated
.
* G
ener
ally
with
out A
/C.
**
Exc
lude
s sp
ecia
l pow
er s
uppl
y.
(Cont'd)
27 28

1. CONSTRUCTION COST DATA
BU
ILD
ING
TYP
EM
AC
AU
SIN
GA
POR
E Φ
KU
ALA
LUM
PUR
BR
UN
EI IN
DIA
₲ M
AN
ILA
Ω
MO
P/m
2S$
/m2
RM
/m2
B$/
m2
INR
/m2
PHP/
m2
MEC
HA
NIA
L SE
RVI
CES
Offic
es
N/A
15
3 - 2
28
350
- 455
13
3 - 1
66
3,600
- 4,7
00
3,000
- 4,3
00Ind
ustria
l *
N/A
29
- 13
6
60 -
90
17 -
29
1,600
- 2,8
00
650 -
1,30
0Ho
tels
1,8
50 -
2,150
15
0 - 2
89
280
- 450
21
4 - 2
47
4,500
- 4,8
50
3,000
- 6,0
00Sh
oppin
g Cen
tres
1,6
00 -
2,150
15
8 - 2
14
280
- 410
15
2 - 1
81
3,500
- 4,5
00
2,500
- 3,7
00Ap
artm
ent
55
0 -
650
95
- 19
2
200
- 283
15
7 - 1
81
2,000
- 2,5
00
1,900
- 3,0
00EL
ECTR
ICA
L SE
RVI
CES
Offic
es
N/A
20
3 - 3
06
220
- 465
17
1 - 2
14
2,800
- 4,0
00
3,300
- 6,0
00Ind
ustria
l **
N/
A
58 -
148
14
0 - 1
57
143
- 171
1,8
00 -
3,100
2,0
00 -
3,500
Hotel
s
1,900
- 2,3
00
202
- 340
24
0 - 5
90
214
- 280
3,2
00 -
4,900
4,4
00 -
8,400
Shop
ping C
entre
s
1,900
- 2,1
00
170
- 275
20
0 - 2
60
162
- 233
3,0
00 -
4,000
3,6
00 -
5,400
Apar
tmen
t
650 -
85
0
109
- 252
85
- 21
0
185
- 233
1,2
00 -
1,600
3,2
00 -
4,800
HYD
RA
ULI
C S
ERVI
CES
Offic
es
N/A
31
- 71
23
- 52
12
- 29
57
5 -
850
90
0 - 2
,000
Indus
trial
N/
A
19 -
39
36 -
45
8 -
14
375 -
65
0
700 -
1,20
0
Hot
els
85
0 - 1
,050
97
- 13
6
173
- 235
45
- 62
3,0
00 -
4,500
1,7
50 -
3,800
Shop
ping C
entre
s
300 -
40
0
49 -
75
23 -
30
9 -
30
825 -
1,50
0
650 -
1,10
0Ap
artm
ent
55
0 -
750
75
- 15
9
18 -
45
28 -
44
1,300
- 1,8
00
1,300
- 2,6
00FI
RE
SER
VIC
ESOf
fices
N/
A
32 -
64
57 -
80
24 -
29
900 -
1,20
0
600 -
1,20
0Ind
ustria
l
N/A
24
- 54
45
- 60
9
- 14
40
0 -
550
60
0 -
900
Hotel
s
500 -
60
0
49 -
78
65 -
90
19 -
36
1,000
- 1,3
00
600 -
1,10
0Sh
oppin
g Cen
tres
40
0 -
500
38
- 63
60
- 80
24
- 48
85
0 -
950
60
0 -
900
Apart
ment
10
0 -
150
19
- 53
20
- 25
19
- 38
45
0 -
550
60
0 - 1
,300
LIFT
S / E
SCA
LATO
RS
Offic
es
N/A
62
- 17
7
88 -
400
7
- 24
65
0 -
900
1,6
00 -
2,900
Indus
trial
N/
A
46 -
114
54
- 19
0
3 -
14
400 -
55
0
N/A
Hotel
s
500 -
70
0
76 -
138
85
- 37
0
9 -
33
800 -
1,00
0
1,500
- 3,0
00Sh
oppin
g Cen
tres
40
0 -
600
83
- 20
0
85 -
110
9
- 27
80
0 - 1
,100
70
0 - 1
,700
Apar
tmen
t
400 -
50
0
27 -
123
63
- 10
5
8 -
19
500 -
70
0
800 -
1,50
0
M&
E C
OST
S FO
R S
ELEC
TED
ASI
AN
CIT
IES
(Con
t'd)
M&E COSTS FOR SELECTED ASIAN CITIES
₲
Rat
es a
re b
ased
on
proj
ects
in B
anga
lore
and
are
net
t of V
AT a
nd S
ervi
ce
Tax.
Mum
bai c
osts
are
gen
eral
ly 8
% h
ighe
r.Ω
Tr
ansf
orm
er, i
nclu
ded
in E
lect
rical
Ser
vice
s.
* G
ener
ally
with
out A
/C.
**
Exc
lude
s sp
ecia
l pow
er s
uppl
y.Φ
Rat
es a
re n
ett o
f GS
T.
(Cont'd)
29 30
The
abov
e co
sts
are
at 4
th Q
uart
er 2
011
leve
ls, e
xclu
sive
of c
ontin
genc
ies
unle
ss o
ther
wis
e st
ated
.

1. CONSTRUCTION COST DATA
BU
ILD
ING
TYP
EK
AR
AC
HI
BA
NG
KO
K ⱷ
JA
KA
RTA
#H
O C
HI M
INH
SEO
UL
$ T
OK
YO ♣
PKR
/m2
BH
T/m
2ID
R'0
00/m
2VN
D'0
00/m
2K
RW
'000
/m2
JPY/
m2
MEC
HA
NIA
L SE
RVI
CES
Offic
es
3,750
- 8,5
00
3,900
- 4,8
00
625
- 735
1,5
90 -
2,267
20
0 - 2
80
21,00
0Ind
ustria
l *
1,085
- 1,8
90
1,250
- 1,4
00
195
- 455
N/
A
87 -
150
11
,200
Hotel
s
7,600
- 9,9
50
4,500
- 5,1
00
625
- 840
N/
A
205
- 330
14
,800
Shop
ping C
entre
s
7,600
- 9,9
50
4,400
- 4,8
00
570
- 680
N/
A
144
- 240
7,1
00Ap
artm
ent
2,6
00 -
3,500
4,4
00 -
4,500
57
0 - 7
30
1,198
- 1,7
29
92 -
169
3,0
00EL
ECTR
ICA
L SE
RVI
CES
Offic
es
4,425
- 5,4
13
2,250
- 2,5
00
510
- 680
1,9
62 -
2,337
25
0 - 3
65
19,60
0Ind
ustria
l **
2,4
31 -
3,392
1,6
50 -
1,700
28
0 - 4
50
N/A
11
5 - 1
50
10,40
0Ho
tels
5,8
50 -
9,925
2,7
50 -
3,200
51
0 - 7
30
N/A
35
0 - 4
60
18,80
0Sh
oppin
g Cen
tres
4,7
15 -
7,825
2,1
50 -
2,400
45
0 - 5
70
N/A
20
0 - 2
30
7,600
Apar
tmen
t
2,000
- 3,2
70
2,390
- 2,9
50
510
- 680
1,7
40 -
2,197
13
0 - 1
65
12,20
0H
YDR
AU
LIC
SER
VIC
ESOf
fices
76
5 - 1
,205
75
0 -
890
12
0 - 1
90
263 -
502
32
- 55
12
,600
Indus
trial
63
0 -
835
70
0 -
780
71
- 13
0
N/A
20
- 30
5,7
00
Hot
els
3,2
00 -
4,845
1,3
50 -
1,490
51
0 - 7
40
N/A
57
- 89
16
,600
Shop
ping C
entre
s
465 -
1,24
0
780 -
95
0
120
- 190
N/
A
27 -
56
5,400
Apar
tmen
t
1,360
- 1,9
70
1,150
- 1,3
50
510
- 730
51
4 - 1,
171
49
- 65
18
,300
FIR
E SE
RVI
CES
Inc
luded
in
abov
e
Offic
es
1,285
- 1,6
75
760 -
85
0
160
- 250
61
4 - 1,
019
40
- 65
Indus
trial
1,1
25 -
2,025
72
0 -
750
70
- 13
0
N/A
27
- 30
Hotel
s
1,285
- 2,6
50
750 -
85
0
150
- 250
N/
A
56 -
87Sh
oppin
g Cen
tres
1,1
25 -
2,025
76
0 -
790
16
0 - 2
10
N/A
42
- 69
Apart
ment
85
0 - 1
,350
76
0 -
850
16
0 - 2
10
420 -
528
32
- 65
LIFT
S / E
SCA
LATO
RS
Offic
es
1,745
- 3,1
00
1,000
- 1,0
50
270
- 740
56
3 - 1,
079
45
- 60
5,6
00Ind
ustria
l
1,745
- 3,1
00
N/A
N/
A
N/A
16
- 25
2,5
00Ho
tels
3,5
00 -
8,100
1,0
00 -
1,100
27
0 - 6
80
N/A
11
0 - 1
55
5,100
Shop
ping C
entre
s
1,745
- 3,1
00
210 -
49
0
205
- 540
1,1
61 -
1,642
55
- 78
3,6
00Ap
artm
ent
1,7
45 -
3,100
45
0 -
500
26
0 - 5
40
633 -
920
27
- 38
2,7
00
M&
E C
OST
S FO
R S
ELEC
TED
ASI
AN
CIT
IES
(Con
t'd)
(Cont'd)
M&E COSTS FOR SELECTED ASIAN CITIES
# Al
l rat
es a
re n
ett o
f VAT
. R
ates
for E
lect
rical
Ser
vice
s ar
e ex
clud
ing
gens
et.
Rat
es
for H
ydra
ulic
Ser
vice
s ar
e ex
clud
ing
STP.
Rat
es fo
r Mec
hani
cal S
ervi
ces
refe
r to
ACM
V R
ates
onl
y.♣
All c
osts
are
ave
rage
. Spr
inkl
er s
yste
m, fi
re h
ose
reel
are
incl
uded
in H
ydra
ulic
Se
rvic
es. S
mok
e sp
ill ex
haus
t sys
tem
is in
clud
ed in
Mec
hani
cal S
ervi
ces.
Fire
al
arm
sys
tem
, em
erge
ncy
PA s
yste
m a
re in
clud
ed in
Ele
ctric
al S
ervi
ces.
* G
ener
ally
with
out A
/C.
**
Exc
lude
s sp
ecia
l pow
er s
uppl
y.ⱷ
Ba
sed
upon
net
t enc
lose
d ar
ea a
nd n
ett o
f VAT
.$
Rat
es a
re n
ett o
f VAT
.
The
abov
e co
sts
are
at 4
th Q
uart
er 2
011
leve
ls,
excl
usiv
e of
con
tinge
ncie
s un
less
oth
erw
ise
stat
ed.
31 32

1. CONSTRUCTION COST DATA
DES
CR
IPTI
ON
UNIT
HONG
KO
NGSH
ANG
HAI
BEIJ
ING
GUA
NGZH
OU/
SH
ENZH
ENCH
ONG
QIN
GCH
ENG
DU
HK
$R
MB
RM
BR
MB
RM
BR
MB
1. Ex
cava
ting b
asem
ents
≤ 2.0
0m de
epm3
11
5
30
15
25
16
202.
Exca
vatin
g for
footin
gs ≤
1.50
m de
epm3
11
0
25
18
30
18
253.
Remo
ve ex
cava
ted m
ateria
ls off
site
m3
190 *
10
5
25
68
43
354.
Hardc
ore be
d blin
ded w
ith fin
e mate
rials
m3
650
16
8
120
15
5
120
13
05.
Mass
conc
rete g
rade 1
5m3
90
0
400
50
0
380
38
0
380
6. Re
inforc
ed co
ncret
e grad
e 30
m3
1,130
47
0
560
46
5
420
42
07.
Mild
steel
rod re
inforc
emen
tkg
9.8
6
6.3
6.2
6.3
6.3
8. Hi
gh te
nsile
rod r
einfor
ceme
ntkg
9.8
6
6.3
6.2
6.3
6.3
9. Sa
wn fo
rmwo
rk to
soffit
s of s
uspe
nded
slabs
m2
180
55
65
45
55
55
10. S
awn f
ormwo
rk to
colum
ns an
d wall
sm2
18
0
55
55
45
55
5511
. 112
.5mm
thick
brick
wall
sm2
19
0
60 @
90
58
47
50
12. "
Kliplo
k Colo
rbond
" 0.64
mm pr
ofiled
ste
el sh
eetin
gm2
60
0
N/A
N/
A
N/A
N/
A
N/A
13. A
lumini
um ca
seme
nt wi
ndow
s, sin
gle
glaze
dm2
1,7
00
600
78
0 **
55
0
750 *
*
750 *
*14
. Stru
ctural
stee
lwork
- bea
ms, s
tanch
ions
and t
he lik
ekg
25
12
11
14
12
12
15. S
teelw
ork - a
ngles
, cha
nnels
, flats
and
the
like
kg
27
10
11
11
10
1016
. 25m
m ce
ment
and s
and (
1:3) p
aving
m2
80
35
20
21
22
2517
. 20m
m ce
ment
and s
and (
1:4) p
laster
to
walls
m2
95
28
22
18
17
2018
. Cera
mic t
iles b
edde
d to fl
oor s
creed
(m
/s)m2
27
0
160
12
0
115
12
0
120
19. 1
2mm
fibrou
s plas
terbo
ard ce
iling l
ining
m2
430
17
0
140
15
7
130
13
020
. Two
coats
of em
ulsion
paint
to pl
aster
ed
surfa
ces
m2
44
32
30
26
30
30Av
erage
expe
cted p
relim
inarie
s%
10
- 15
3 -
8
5 - 10
5 -
10
5 - 10
5 -
10
MA
JOR
RAT
ES F
OR
SEL
ECTE
D A
SIA
N C
ITIE
S
MAJOR RATES FOR SELECTED ASIAN CITIES
(Cont'd)
The
abov
e co
sts
are
at 4
th Q
uart
er 2
011
leve
ls a
nd a
re b
ased
on
lum
p su
m fi
xed
pric
e co
ntra
ct r
ates
exc
lusi
ve o
f pr
elim
inar
ies
and
cont
inge
ncie
s un
less
oth
erw
ise
stat
ed.
**
Rat
es fo
r dou
ble
glaz
ed w
indo
w.
* R
ate
incl
udin
g w
aste
cha
rges
impl
emen
ted
on 1
Dec
. 200
5.@
R
ates
for 1
20m
m th
ick
conc
rete
blo
ck w
alls
.
33 34

1. CONSTRUCTION COST DATA
DES
CR
IPTI
ON
UNIT
MAC
AUSI
NGAP
ORE
ΦKU
ALA
LUM
PUR
BRUN
EIIN
DIA
₲M
ANIL
A
MO
PS$
RM
B$
INR
PHP
1. Ex
cava
ting b
asem
ents
≤ 2.0
0m de
epm3
11
0
16.5
15
- 20
3.5
13
0
350
2. Ex
cava
ting f
or foo
tings
≤ 1.
50m
deep
m3
105
16
.5
15 -
20
3
145
25
03.
Remo
ve ex
cava
ted m
ateria
ls off
site
m3
60
15
20 -
25
3
100
20
04.
Hardc
ore be
d blin
ded w
ith fin
e mate
rials
m3
580
50
60
- 70
37
3,0
60
2,500
5. Ma
ss co
ncret
e grad
e 15
m3
680
20
2 Φ Φ
23
0 - 25
0
117
4,2
00
3,500
6. Re
inforc
ed co
ncret
e grad
e 30
m3
730
15
5 - 17
0
250 -
280
13
2
5,125
4,8
007.
Mild
steel
rod re
inforc
emen
tkg
9.5
1.6
- 1.7
5
3.5 -
3.8
0.98
40
47
8. Hi
gh te
nsile
rod r
einfor
ceme
ntkg
9.5
1.6
- 1.7
5
3.5 -
3.8
0.98
42
48
9. Sa
wn fo
rmwo
rk to
soffit
s of s
uspe
nded
slabs
m2
160
30
- 33
30
- 38
14
.5
425
85
010
. Saw
n form
work
to co
lumns
and w
alls
m2
160
30
- 33
30
- 38
14
45
0
800
11. 1
12.5m
m thi
ck br
ick w
alls
m2
250
30
- 35
32
- 45
18
.5
700
N/
A12
. "Kli
plok C
olorbo
nd" 0
.64mm
profi
led
steel
shee
ting
m2
N/A
43
55
- 60
56
96
0
900
13. A
lumini
um ca
seme
nt wi
ndow
s, sin
gle
glaze
dm2
2,0
00
290
35
0 - 50
0
166 -
216
3,7
00
9,000
Ω
14. S
tructu
ral st
eelw
ork - b
eams
, stan
chion
s
an
d the
like
kg
35
4.8- 5
.8
6 - 7.
5
3
75
100
15. S
teelw
ork - a
ngles
, cha
nnels
, flats
and
the
like
kg
32
4.8 -
5.8
6 - 7.
5
2.7
75
9516
. 25m
m ce
ment
and s
and (
1:3) p
aving
m2
80
11
15 -
22
7.5
300
35
017
. 20m
m ce
ment
and s
and (
1:4) p
laster
to
walls
m2
95
15.5
15
- 22
8
23
0
350
18. C
erami
c tile
s bed
ded t
o floo
r scre
ed
(m/s)
m2
400
65
.5
50 -
70
23
1,100
1,2
0019
. 12m
m fib
rous p
laster
board
ceilin
g lini
ngm2
46
0
30
30 -
45
28
850
1,3
0020
. Two
coats
of em
ulsion
paint
to pl
aster
ed
surfa
ces
m2
80
3.5 -
4
3.5 -
4
5
130
35
0Av
erage
expe
cted p
relim
inarie
s%
8 -
15
12 -
15
6 - 12
5 -
8
5 - 10
8 -
15
MA
JOR
RAT
ES F
OR
SEL
ECTE
D A
SIA
N C
ITIE
S (C
ont'd
)
MAJOR RATES FOR SELECTED ASIAN CITIES
(Cont'd)
The
abov
e co
sts
are
at 4
th Q
uart
er 2
011
leve
ls a
nd a
re b
ased
on
lum
p su
m fi
xed
pric
e co
ntra
ct r
ates
exc
lusi
ve o
f pr
elim
inar
ies
and
cont
inge
ncie
s un
less
oth
erw
ise
stat
ed.
₲
Rat
es a
re b
ased
on
proj
ects
in B
anga
lore
and
are
net
t of
VAT
and
Serv
ice
tax.
Mum
bai c
osts
are
gen
eral
ly 8
% h
ighe
r.Ω
R
ate
for a
lum
iniu
m w
ith a
nodi
zed
finis
h; 6
mm
thic
k.
Φ R
ates
are
net
t of G
ST.
Φ Φ
Rat
e fo
r lea
n co
ncre
te b
lindi
ng.
35 36

1. CONSTRUCTION COST DATA
DES
CR
IPTI
ON
UNIT
KARA
CHI
BA
NG
KO
K #
JAK
AR
TA #
HO
CH
I
MIN
H #
SEO
UL
$TO
KYO
PKR
BH
TID
R'0
00VN
D'0
00K
RW
JPY
1. Ex
cava
ting b
asem
ents
≤ 2.0
0m de
epm3
38
5 - 63
5
100
23
69
2,1
00
890
2. Ex
cava
ting f
or foo
tings
≤ 1.
50m
deep
m3
320 -
495
10
0
30
64
2,100
94
03.
Remo
ve ex
cava
ted m
ateria
ls off
site
m3
180 -
280
10
0
25
66
12,00
0
3,140
4. Ha
rdcore
bed b
linde
d with
fine m
ateria
lsm3
1,17
0 - 1,
413
60
0
270
30
6
26,50
0
8,100
5. Ma
ss co
ncret
e grad
e 15
m3 5,
000 -
5,50
0
2,000
71
0
1,352
57
,000
11
,200
6. Re
inforc
ed co
ncret
e grad
e 30
m3 7,
500 -
8,50
0
2,400
85
0
1,730
72
,000
13
,200
7. Mi
ld ste
el rod
reinf
orcem
ent
kg
80 -
110
31
10
23
.3
1,070
68
8. Hi
gh te
nsile
rod r
einfor
ceme
ntkg
77
- 11
5
30
10
22.2
1,0
80
839.
Sawn
form
work
to so
ffits o
f sus
pend
ed
sla
bsm2
48
5 - 62
5
350
12
0
181
23
,000
3,4
0010
. Saw
n form
work
to co
lumns
and w
alls
m2
550 -
790
35
0
120
22
3
23,00
0
3,400
11. 1
12.5m
m thi
ck br
ick w
alls
m2 9
90 -
1,060
70
0
120
16
5
40,00
0
13,10
012
. "Kli
plok C
olorbo
nd" 0
.64mm
profi
led
steel
shee
ting
m2 3,
765 -
4,84
5
1,200
17
5
516
35
,000
2,2
00
13. A
lumini
um ca
seme
nt wi
ndow
s, sin
gle
glaze
dm2
5,00
0 - 7,
500
6,0
00
880
2,5
45
249,9
00
23,00
014
. Stru
ctural
stee
lwork
- bea
ms, s
tanch
ions
and t
he lik
ekg
13
5 - 16
0
55
18
33.5
2,4
00
210
15. S
teelw
ork - a
ngles
, cha
nnels
, flats
and
the
like
kg
135 -
160
55
18
38
.5
1,900
32
016
. 25m
m ce
ment
and s
and (
1:3) p
aving
m2
425 -
590
20
0
44
46
2,500
2,6
0017
. 20m
m ce
ment
and s
and (
1:4) p
laster
to
walls
m2
375 -
580
20
0
50
66.35
8,3
00
3,000
18. C
erami
c tile
s bed
ded t
o floo
r scre
ed
(m/s)
m2 1,
300 -
1,50
0
1,200
11
0
245
55
,000
6,1
0019
. 12m
m fib
rous p
laster
board
ceilin
g lini
ngm2
850
- 1,2
50
800
10
0 æ
300
24
,000
N/
A20
. Two
coats
of em
ulsion
paint
to pl
aster
ed
surfa
ces
m2
270 -
375
10
0
18
62.3
7,1
00
900
Avera
ge ex
pecte
d prel
imina
ries
%
8 - 10
10
- 15
5 -
10
8 - 12
6 -
11
10 -
15
MA
JOR
RAT
ES F
OR
SEL
ECTE
D A
SIA
N C
ITIE
S (C
ont'd
)
MAJOR RATES FOR SELECTED ASIAN CITIES
The
abov
e co
sts
are
at 4
th Q
uart
er 2
011
leve
ls a
nd a
re b
ased
on
lum
p su
m fi
xed
pric
e co
ntra
ct r
ates
exc
lusi
ve o
f pr
elim
inar
ies
and
cont
inge
ncie
s un
less
oth
erw
ise
stat
ed.
$ R
ates
incl
ude
labo
ur c
osts
and
are
net
t of V
AT.
&
Incl
udin
g un
derc
oat a
nd p
rimer
.#
R
ates
are
net
t of V
AT.
æ
Rat
e fo
r 9m
m g
ypsu
m b
oard
.
37 38

1. CONSTRUCTION COST DATA
BU
ILD
ING
TYP
EU
S$/m
2
SYDN
EY A
UCKL
AND
JO
'BUR
GLO
SAN
GEL
ESSA
NFR
ANCI
SCO
NEW
YORK
LOND
ON
RES
IDEN
TIA
L
Aver
age m
ulti u
nit, h
igh ris
e
2,845
1,7
70
940
3,5
00
3,600
3,7
00 2
,420 -
3,06
0Lu
xury
unit,
high r
ise
3,265
2,6
70
1,640
4,2
00
4,300
4,5
00 3
,220 -
4,42
0Ind
ividu
al pr
estig
e hou
ses
3,4
40
2,815
1,6
50
3,400
3,5
00
3,800
3,60
0 - 5,
430
CO
MM
ERC
IAL/
RET
AIL
Aver
age s
tanda
rd of
fices
, high
rise
3,1
60
1,605
1,2
50
3,700
3,9
00
4,000
2,80
0 - 3,
520
Pres
tige o
ffices
, high
rise
3,5
85
1,850
1,6
00
4,200
4,4
00
4,500
4,00
0 - 5,
120
Major
shop
ping c
entre
(CBD
)
2,530
1,1
10
1,180
2,8
00
3,100
3,2
00 1
,830 -
2,39
0
HO
TEL
3 star
budg
et
3,265
2,2
20
1,900
2,1
00
2,200
2,2
50 1
,940 -
2,34
0
5 star
luxu
ry
4,530
2,8
80
2,500
4,5
00
4,600
4,7
00 3
,570 -
4,37
0Re
sort
style
4,1
10
2,220
3,0
00
4,500
4,6
00
N/
A
N/A
IND
UST
RIA
L
Light
duty
factor
y
685
45
0
430
1,2
00
1,4
00
1,200
850
- 1,07
0He
avy d
uty fa
ctory
86
5
575
60
0
1,600
1,8
00
1,900
1,41
0 - 1,
760
OTH
ERS
Multi
store
y car
park
89
5
535
46
0
850
88
0
900
51
0 - 86
0Di
strict
hosp
ital
4,0
55
3,130
1,2
50
7,300
7,5
00
6,300
2,95
0 - 3,
680
Prim
ary a
nd se
cond
ary s
choo
ls
1,720
1,7
60
850
3,0
0
3,200
3,6
00 2
,230 -
3,30
0
Exch
ange
Rate
Use
d(a
s at J
uly 20
11)
US$1
=A$
0.93
NZ$1
.25ZA
R7.00
US$1
.00US
$1.00
US
$1.00
GBP0
.63
CO
NST
RU
CTI
ON
CO
STS
FOR
SEL
ECTE
D IN
TER
NAT
ION
AL
CIT
IES
CONSTRUCTION COSTS FOR SELECTED INTERNATIONAL CITIES
The
abov
e co
sts
are
at 2
nd Q
uart
er 2
011
leve
ls.
Pric
es e
xclu
de la
nd,
site
wor
ks,
prof
essi
onal
fee
s, t
enan
t fit
out,
equi
pmen
t an
d G
ST/
VAT.
Hot
el ra
te in
clud
es F
F&E
.
Larg
e flu
ctua
tion
in e
xcha
nge
rate
s ca
n cr
eate
sho
rt te
rm a
nom
alie
s.
39 40
GENERAL CONSTRUCTION DATA2012 Outlook
Building Cost Trends in Hong Kong Labour Index in Hong Kong
Material Prices in Hong Kong Progress Payments
Estimating Rules of Thumb and Design Norms for Hong Kong
Construction Activity in Hong Kong Construction Value in Hong Kong
FIREE Recordals Tracker: November 2011 Update Hong Kong General Construction Insurance
Specified Forms for Buildings Ordinance or Regulations for Hong Kong
Summary of Building Regulations for Hong Kong Percentage Site Coverage and Plot Ratios
for Hong Kong

2. GENERAL CONSTRUCTION DATA
2012 OUTLOOK
However, the distribution of these 10 million units to various regions may not be in direct proportion to the scale of construction capacity in each region. For example, Chongqing’s construction output in 2010 was only 2.6% of the whole country, but their allocation of affordable public housing units for 2011 represents 5% of the country’s annual target (i.e. 500,000). On the other hand, Beijing and Shanghai performed 5.5% and 4.5% of the national total output in 2010, but are assigned only 200,000 and 260,000 units respectively. This apparent divergence may be partly explained by the fact that Beijing and Shanghai have relatively more commercial and infrastructure construction. However, it remains to be seen if this policy results in more localised variances in construction costs across the country.
Within the industry, both material prices and labour wages continue to be influenced by inflation in living and production costs. Both the Consumer Price Index and Producer Price Index had at one stage surged to 3-year highs, before dipping to 1-year and 2-year lows respectively in November, albeit still in positive territory. Workers’ pay rises are also bound by the nationwide increment in the Statutory Minimum Wage, which is about 20% on average. However, this has been offset to some extent by material costs having dipped in the 4th quarter. As a whole, construction costs have risen about 5% in 2011.
On the back of the Government’s proactive housing policy, the outlook for the industry remains fairly positive. Driven by increases in labour costs and general inflation, overall construction costs are forecast to rise by 5% p.a. in both 2012 and 2013.
Hong Kong: Construction activity picked up in 2011, driven by implementation of the public infrastructure projects and a gradual recovery in the private residential sector following the 2008 crisis.
43 44
China: Riding on the wave of recovery from 2010 and despite continued volatility in the global economy, the PRC construction industry remained robust in first three quarters of 2011, but was clouded by growing uncertainty in the property market towards the end of the year.
The volume of construction works performed in 2011 grew at about 25% per annum, close to the rate in each of the preceding two years. However, the rate of growth for new-start floor areas in the real estate sector has slowed down slightly. This is likely because, on the one hand, the build-up of demand prior to the 2010 economic rebound has been released, whilst at the same time, the central government has taken decisive action to curb soaring residential property prices.
The Government has adopted a series of measures to reduce speculative activities by property developers and end-users alike – including purchase limits, credit restrictions, a premium on the benchmark mortgage rate and higher down payments. Given the fact the Government has stated its long term goal is to keep property prices stable, these measures will likely be in place for some time. The credit crisis in the US coupled with the sovereign debt problems in the Eurozone has weakened the global economy, resulting in a slow-down of fixed asset investment activities across China. Given these conditions, private sector activity is likely to stablilise and we are unlikely to see another 2010-style boom anytime soon.
A positive note is that the Government does not intend to cut the supply of residential property. In fact, it has committed to provide 36 million affordable public housing units in the coming five years. Of this, 10 million are to start each year in 2011 and 2012. When compared to the number of residential units started by the public and private sectors in 2010 (circa 5.8 million and 13 million respectively), this new initiative accounts for about half of the total floor area of all building works. On the face of it, this potential volume of new public works should be able to outweigh the possible slowdown in the private sector.
(Cont'd)

2. GENERAL CONSTRUCTION DATA
2012 OUTLOOK
system, which is scheduled to last for about four years. In addition, the Macau government has been busy commissioning new public housing and other infrastructure works in response to growing economic activity and demand from the public.
In the entertainment and gaming sector, a number of Cotai projects, such as Venetian Parcel 3, Macau Studio City, Wynn and the next phase of Galaxy Macau are scheduled to start in the latter part of 2012. Given the relatively modest levels of casino construction in the last two years, such increased demand is likely to put significant pressure on construction labour and material prices for 2012 and beyond.
Across the boundary with Guangdong, the progress of projects on the neighbouring Hengqin Island ( ) is expected to pick up in the next few years, especially from private sector investment. Given its proximity to Macau, it is likely that the work there will have an effect on Macau's construction prices.
According to the Statistics and Census Service of the Macau Government, as at third quarter 2011, the average daily wages of construction workers was MOP569, representing a 4.6% year-on-year increase. Similarly, the price index of construction materials rose by 20.4% year-on-year.
Given the above situation, we predict tender prices are set to increase by about 8% during 2012.
45 46
With this improved sentiment, private residential developers have pressed ahead with new projects. Despite the HKSAR Government’s tightening measures (eg. extra stamp duty for properties sold within 2 years’ of purchase, increased down payments for units over HK$8M) and the banks’ increased mortgage rates, residential construction starts during the first nine months of 2011 still managed to reach 7,700 units. This surpassed the average 6,600 units which started each year from 2008 to 2010. These figures are likely to grow further over the next few years as a result of the Chief Executive’s commitment in the 2010/11 Policy Address to supply land for 20,000 private residential units a year, for the next decade.
Plots of land released by the government for residential use in 2011 could potentially provide up to 12,000 private units. Of which, 6,700 will be built on top of, or adjacent to, existing MTR station boxes, where most of the foundation works have already been completed – thus allowing an early start on the superstructure construction. Given that the new-build private residential sector contributes about 20% of the annual gross output of the construction industry, it will not be long before this supply translates into increased construction volume. The likely follow-on effect will be pressure on tender prices.
Basic construction costs have risen by around 8% in 2011, largely as a result of escalation in material prices and labour wages driven by the SAR’s 15-year-high inflation rate, the weakening of the US dollar against the Renminbi, and growing demand for labour.
Overall, the outlook for the industry in 2012 is fairly upbeat, although continued uncertainty in the US and EU economies will need to be kept in view. We forecast construction costs will rise by 8% a year in both 2012 and 2013.
Macau: Construction activity is expected to gather pace in 2012. One of the bigger projects is the long-awaited construction of the Macau Light Rail Transit (LRT)
(1) Building Works (2) Civil Engineering Works
CONSTRUCTION COST TREND PREDICTION
REGION 2011 2012 2013
China (1) +5% +5% +5%
Hong Kong (1) +8% +8% +8%
Hong Kong (2 +8% +8% +6%
Macau (1) +7% +8% +8%

2. GENERAL CONSTRUCTION DATA
47 48
BUILDING COST TRENDS IN HONG KONG
Historical TPI values from 1970 onwards available at www.dlsqs.com.(Cont'd)
* ProvisionalSource : Architectural Services Department, Hong Kong, SAR Refer to www.archsd.gov.hk for further information.
* Up to Q2 only
YEARINDEX
(Base = 100, at Year 1970)
Q1 Q2 Q3 Q4
2000 1,079 1,057 1,040 1,020 2001 990 960 945 935 2002 915 890 875 840 2003 855 878 895 895 2004 940 952 933 930 2005 945 955 963 970 2006 970 980 985 990 2007 1,020 1,074 1,175 1,150 2008 1,239 1,360 1,355 1,281 2009 1,245 1,242 1,253 1,273 2010 1,297 1,315 1,342 1,367 2011 1,385 1,425 1,452 1,476*
YEARINDEX
(Base = 100, at Year 1970)
Q1 Q2 Q3 Q4
2000 959 873 858 844 2001 862 842 807 721 2002 687 742 692 733 2003 720 723 722 681 2004 685 712 704 701 2005 711 716 718 697 2006 714 730 751 789 2007 821 859 906 998 2008 1,118 1,305 1,401 1,262 2009 1,074 983 1,111 1,107 2010 1,134 1,161 1,249 1,266 2011* 1,273 1,320

2. GENERAL CONSTRUCTION DATA
49 50
BUILDING COST TRENDS IN HONG KONG
* 1/11 to 8/11 onlySource : Civil Engineering and Development Department, Hong Kong, SAR Refer to www.cedd.gov.hk/eng/index.htm for further information.
LABOUR INDEX IN HONG KONG
Figures above are the quarterly average of the monthly indices
Source: Census and Statistics Department, Hong Kong, SAR Refer to www.censtatd.gov.hk for further information.
* Up to Q2 only
YEARINDEX
(Base = 100, at June 1995)
Q1 Q2 Q3 Q4
2000 152 153 154 154 2001 152 152 152 151 2002 150 150 149 148 2003 147 146 146 143 2004 143 140 140 138 2005 137 136 133 132 2006 131 133 134 136 2007 137 135 131 130 2008 129 128 128 129 2009 129 128 129 130 2010 131 131 131 132 2011* 133 134
YEARHYD CONST. COST
INDEX(Nov. 1975 Value = 100)
CEDD CIVIL ENGINEERING WORKS INDEX(1980 Value = 100)
2000 844 419 2001 838 416 2002 839 416 2003 848 419 2004 871 428 2005 869 429 2006 886 436 2007 917 450 2008 1,031 500 2009 950 461 2010 989 481 2011* 1,061 518

2. GENERAL CONSTRUCTION DATA
51 52
MATERIAL PRICES IN HONG KONG
GALVANIZED MILD STEEL ANGLE
(Cont'd)
Source: Census and Statistics Department, Hong Kong, SAR Refer to www.censtatd.gov.hk for further information.
Source: Census and Statistics Department, Hong Kong, SAR Refer to www.censtatd.gov.hk for further information.
REBAR
SAND
ORDINARY PORTLAND CEMENT
Source: Census and Statistics Department, Hong Kong, SAR Refer to www.censtatd.gov.hk for further information.
Source: Census and Statistics Department, Hong Kong, SAR Refer to www.censtatd.gov.hk for further information.

2. GENERAL CONSTRUCTION DATA
53 54
Source: Organization of the Petroleum Exporting Countries (OPEC) Refer to www.opec.org for further information.
Source: International Monetary Fund Refer to www.imf.org for further information.
CRUDE OIL
COPPER GRADE A
MATERIAL PRICES IN HONG KONG PROGRESS PAYMENTS
The following graph and table are an indication of the rate of expenditure for construction projects.The rate of expenditure is an average rate and will vary from project to project when specific project circumstances are taken into account.No account has been made for retention.
CONTRACTPERIOD
CUMULATIVE PROGRESS
CLAIMESCONTRACT
PERIODCUMULATIVE PROGRESS
CLAIMES 5% 1% 55% 59% 10% 3% 60% 68% 15% 5% 65% 77% 20% 7% 70% 83% 25% 10% 75% 88% 30% 14% 80% 92% 35% 21% 85% 94% 40% 29% 90% 96% 45% 38% 95% 98% 50% 48% 100% 100%

2. GENERAL CONSTRUCTION DATA
ESTIMATING RULES OF THUMB AND DESIGN NORMS FOR HONG KONG
CFA TO GFA RATIO Building Type CFA : GFAResidential 1.15 to 1.25 : 1 Office / Commercial 1.15 to 1.25 : 1Hotel 1.30 to 1.45 : 1
FUNCTIONAL AREA DISTRIBUTION IN 5-STAR HOTELS
Functional Area % of Total Hotel CFAFront of House 15 - 20%Guestroom Floors 50 - 60%Back of House 25 - 30%
DIMENSIONS OF TYPICAL GRADE A OFFICE SPACE
Component DimensionDistance from curtain wall to core wall 9 - 13 mPopulation 9 m2 usable floor area/personAverage waiting interval for lifts 30 - 40 seconds
DENSITY OF BASIC MATERIALS FOR STRUCTURE
Material DensityConcrete 2,400 kg/m3
Cement 1,450 kg/m3
Sand 1,600 kg/m3
Aggregate 1,600 kg/m3
Steel 7,843 kg/m3
AVERAGE LOADS VOLUME
Lorry (24 ton) 10.0 m3
Concrete truck (24 ton) 5.5 m3
Barge 200 - 1,450 m3
55 56
AVERAGE PILING RATIO - BORED PILES Building Type m2 CFA / m2 cross section area of pilesResidential 200 - 300 Office / Commercial 200 - 250Hotel 200 - 300
AVERAGE PILING RATIO - DRIVEN H-PILES
Building Type m2 CFA / No. of pilesResidential 50 - 90 Office / Commercial 50 - 80Hotel 50 - 90
AVERAGE PILING RATIO - PRE-BORED H-PILES
Building Type m2 CFA / No. of pilesResidential 70 - 120 Office / Commercial 70 - 110Hotel 70 - 120
All pile ratios are for high-rise buildings with normal soil conditions.
BUILDING STRUCTURE - CONCRETE RATIO
Concrete/floor area 0.4 m3/m2 to 0.5 m3/m2
Formwork/floor area 2.2 m2/m2 to 3.0 m2/m2
Reinforcement 160 kg/m3 to 250 kg/m3
AVERAGE EXTERNAL WALL/FLOOR RATIO
Residential Apartments 1.0 m2/m2
Office, Hotel 0.4 m2/m2
Industrial 0.4 m2/m2
(Cont'd)

2. GENERAL CONSTRUCTION DATA
ESTIMATING RULES OF THUMB AND DESIGN NORMS FOR HONG KONG
AVERAGE INTERNAL WALL/FLOOR RATIO
Residential Apartments 1.0 m2/m2 Office 0.5 m2/m2
Hotel 1.5 m2/m2
The above ratios are indicative and for reference purposes only. They do not account for buildings with special shapes, configurations or particularly small foot prints.
AVERAGE LIGHTING LEVEL Building Type LuxResidential 300 Office 500Retail 400Hotel 300School 300 - 500
AVERAGE POWER DENSITY
Building Type VA/m2 CFAResidential 80 - 100 Office 70Retail 300 - 400Hotel - Accommodation 30Hotel - F&B Area 550School 50
AVERAGE COOLING LOAD
Building Type m2 Cooling Area/RTResidential 18 - 23 Office 14 - 18Retail 12-14Hotel 23School 23
57 58
DIMENSIONS OF PARKING SPACES
MinimumType of Vehicle Length Width Headroom Private Cars and Taxis 5 m 2.5 m 2.4 m
Light Goods Vehicles 7 m 3.5 m 3.6 m
Medium/Heavy Goods Vehicle 11 m 3.5 m 4.7 m
Container Vehicles 16 m 3.5 m 4.7 m
Coaches and Buses 12 m 3.5 m 3.8 m
Light buses 8 m 3 m 3.3 m
Minimum headroom means the clearance between the floor and the lower most projection from the ceiling including any lighting units, ventilation ducts, conduits or similar.
INDICATIVE DIMENSIONS FOR SPORTS GROUNDS
Length Width
Tennis Court 40 m 20 m
Squash Court 10 m 6.4 m
Basketball Court 34 m 20 m
Volleyball Court 36 m 20 m
Badminton Court 20 m 10 m
Ice Rink 61 m 26 m
Soccer Pitch 120 m 90 m
The above dimensions are for a single court with appropriate clearance. No spectator seating or support area has been allowed.

2. GENERAL CONSTRUCTION DATA
CONSTRUCTION VALUE IN HONG KONGCONSTRUCTION ACTIVITY IN HONG KONG
* 1/11 to 9/11 only# As from January 2003 onwards, statistics by Buildings Department
on "Consent to Commence" are published with 2 sub-divisions, viz. "First Submission" and "Major Revision". Details can be found in the Buildings Department's "Monthly Digest".
* 1/11 to 9/11 only
Source: Census and Statistics Department, Hong Kong, SAR Refer to www.censtatd.gov.hk for further information.
59 60
YEAR COMPLETEDm2
CONSENT TO COMMENCE
m2
2000 1,515,000 1,850,000 2001 1,354,000 1,388,000 2002 1,908,000 1,372,000
2003# 1,587,000 1,683,000
2004# 1,720,000 1,115,000
2005# 1,227,000 1,476,000
2006# 1,389,000 1,398,000
2007# 1,030,000 1,539,000
2008# 1,097,000 997,000
2009# 815,000 1,075,000
2010# 1,139,000 1,210,000 2011#* 750,000 791,000
YEARVALUE IN NOMINAL
TERMSHK$ MILLIONS
VALUE IN CONSTANT (2000) MARKET PRICE
HK$ MILLIONS
2000 122,071 114,691 2001 113,986 111,385 2002 106,000 108,677 2003 99,032 106,274 2004 93,171 100,615 2005 90,851 98,275 2006 90,230 96,269 2007 92,866 96,844 2008 99,599 97,024 2009 100,944 93,683 2010 111,274 100,278 2011* 91,332 78,106
Source: Census and Statistics Department, Hong Kong, SAR Buildings Department, Hong Kong , SAR Refer to www.censtatd.gov.hk and www.bd.gov.hk for further information.

2. GENERAL CONSTRUCTION DATA
Provided by :
FIREE RECORDALS TRACKER: NOVEMBER 2011 UPDATE
61 62
Since May 2007, any injection of foreign capital in foreign-invested real estate enterprises (FIREEs) must be recorded with the PRC Ministry of Commerce (MOFCOM). These “FIREE recordals” provide a useful perspective on the trend and pace of new foreign capital inflow into the China real estate sector. However, the FIREE recordal statistics do not disclose the actual amount of foreign capital involved in each transaction.
Baker & McKenzie has been tracking FIREE recordals announced by MOFCOM since May 2007. Set out below are some FIREE recordal statistics and data current up to the end of November 2011. In summary:
The total number of FIREE recordals for November 2011 was 95, up from 60 in October 2011.
The total number of FIREE recordals in 2008, 2009
and 2010 were 1,051, 991 and 1,094 respectively.
Since May 2007, cumulatively, there have been 5,614 FIREE recordals up to the end of November 2011. This includes 2,486 cases of new project operating entities being established, 2,562 cases of capital increase or M&A transactions (involving capital increase) related to existing project operating entities, and 238 cases of M&A transactions which do not involve any capital increase.
Mr. Rico Chan Ms. Barbara LiPartner PartnerBaker & McKenzie Hong Kong Office Baker & McKenzie Beijing Office+852 2846 1971 +86 10 6535 [email protected] [email protected]
1. FIREE recordals: monthly from 1 Jan 2009 to 30 Nov 2011:
2. Cities with the highest number of FIREE recordals from May 2007 to Nov 2011:
Provided by :
Mr. Rico Chan Ms. Barbara LiPartner PartnerBaker & McKenzie Hong Kong Office Baker & McKenzie Beijing Office+852 2846 1971 +86 10 6535 [email protected] [email protected]
(Cont'd)

2. GENERAL CONSTRUCTION DATA
Provided by :
FIREE RECORDALS TRACKER: NOVEMBER 2011 UPDATE
63 64
3. Types of FIREE recordals from May 2007 to Nov 2011:
About the FIREE Recordal Regime
The regulatory regime for recording foreign-invested real estate enterprises was first established in May 2007 by MOFCOM and the State Administration of Foreign Exchange (SAFE). This “FIREE recordal” regime was part of a scheme of regulatory measures introduced between 2006 to 2007 to monitor and control foreign investment in the real estate sector at a time when the central government considered the real estate sector to be overheated. This regime controls all types of foreign capital inflow being injected into the real estate sector for purposes such as the setting up of new entities, capital increases and mergers & acquisitions. Foreign capital
Mr. Rico Chan Ms. Barbara LiPartner PartnerBaker & McKenzie Hong Kong Office Baker & McKenzie Beijing Office+852 2846 1971 +86 10 6535 [email protected] [email protected]
flowing into China cannot be converted into Renminbi (China’s legal currency) unless and until the “FIREE recordal” process has been completed with MOFCOM and SAFE.
Since July 2008, the provincial-level commerce authorities have been charged with the primary responsibility of vetting the legal compliance of FIREE-related transactions. MOFCOM reserves the right to conduct random checks on the recordals filed by the provincial-level commerce authorities. Generally, within one to two weeks of receiving an electronic submission from a provincial-level commerce authority, MOFCOM will release the new FIREE recordal on its public website. Only then can the local bureau of SAFE and the local commercial bank credit the foreign currency funds into the accounts of the transaction parties concerned. In December 2008, MOFCOM further simplified the local recordal procedures such that the general office of the provincial government is no longer required to jointly endorse the recordal form with the provincial-level commerce authority.
In December 2010, MOFCOM announced Notice 1542, which requires local bureaus of MOFCOM to use the FIREE recordal regime to slow down new foreign investment into the PRC real estate sector.
Provided by :
Mr. Rico Chan Ms. Barbara LiPartner PartnerBaker & McKenzie Hong Kong Office Baker & McKenzie Beijing Office+852 2846 1971 +86 10 6535 [email protected] [email protected]

2. GENERAL CONSTRUCTION DATA
HONG KONG GENERAL CONSTRUCTION INSURANCE
This section provides general information regarding construction insurance arrangements in Hong Kong.
It is common place for Hong Kong construction contracts to contain provisions as to insurances such as Employees Compensation Insurance, Third Party Liability Insurance, Works Insurance and, on occasion, Professional Liability Indemnity Insurance. For employers, the insurance placement ensures that the contractual indemnities are backed by a financial institution that can afford to pay. For contractors, it provides a certain degree of protection to ensure that he has the means to pay in the event of mishaps.
The insurances may be effected by the contractor (Contractor Controlled Insurance Programme or CCIP) or be taken out by the employer (Employer Controlled Insurance Programme or ECIP). CCIP tends to be the most common insurance arrangement in Hong Kong, since the contractor is in control of all site operations and in a better position to manage its own site safety / risk. As a poor safety record will count against the contractor in premiums negotiation in the procurement of insurance, CCIP provides an incentive for better safety / risk management. On the other hand, ECIP placement leaves the control of the insurance programme in the hands of the employer, thereby offering the advantage of providing comprehensive insurance coverage on a project-wide basis and hence minimizing overlaps and gaps in insurance coverage.
Employees Compensation
Section 40(1) of the Employees Compensation Ordinance states that no employer shall employ any employee unless there is a policy of Employees Compensation Insurance in place. The maximum penalty for failing to comply with this provision is two years in jail and a maximum fine of HK$100,000.
Under the Ordinance, the principal contractor shall take out insurance for his employees and all of the employees of subcontractors with a limit of indemnity of HK$200 million per event (or HK$100 million if the number of employees is less than 200).
Since an injured worker could attempt to sue the employer, the employer will want to ensure the contractor has taken out insurance in joint names with the employer.
Contractors' All Risks Insurance
A Contractors' All Risks policy generally comprises (i) Third Party Insurance which covers injury to persons (except the Contractor’s own workmen) or damage to property (other than the Works), due to the carrying out of the Works which may or may not be caused by a default of the contractor. The policy is normally subject to a maximum reimbursement per incident but unlimited in the number of incidents, (ii) Contract Works Insurance which covers damage caused to the Works itself by risks not excluded from the policy and (iii) Plant & Equipment Insurance which covers the contractor’s plant and equipment used in the Works. Plant & Equipment Insurance is not normally required under the contract conditions and is voluntarily purchased by the contractor.
Professional Indemnity Insurance
For construction contracts involving contractor’s design, it is not uncommon for the employer to require the contractor and his design consultants and independent checking engineers to obtain insurance to cover their liability for design. For Government Contracts, the Professional Indemnity Insurance shall cover the contractor's liability for design generally for the construction period and a further 6 years.
65 66

2. GENERAL CONSTRUCTION DATA
FORM
NO
.PU
RPO
SER
ELEV
AN
T SE
CTI
ON
OF
REG
ULA
TIO
N
BA
1Ap
plica
tion
for i
nclu
sion
in th
e au
thor
ized
pers
ons'
regi
ster
/ st
ruct
ural
eng
inee
rs' r
egist
er /
geot
echn
ical e
ngin
eers
' reg
ister
.BO
s 3(
6)
BA
1AAp
plic
atio
n fo
r re
tent
ion
of n
ame
in t
he a
utho
rized
per
sons
' reg
iste
r /
stru
ctur
al e
ngin
eers
' reg
iste
r /
geot
echn
ical
en
gine
ers'
regi
ster
.BO
s 3(
9B)
BA
1BAp
plic
atio
n fo
r re
stor
atio
n of
nam
e to
the
auth
oriz
ed p
erso
ns' r
egis
ter
/ stru
ctur
al e
ngin
eers
' reg
iste
r / g
eote
chni
cal
engi
neer
s' re
gist
er.
BOs
3(12
)
BA
2Ap
plic
atio
n fo
r reg
istra
tion
as a
gen
eral
bui
ldin
g co
ntra
ctor
/ sp
ecia
list c
ontra
ctor
.BO
s 8B
BA
2AAp
plic
atio
n fo
r ren
ewal
of r
egis
tratio
n as
a re
gist
ered
gen
eral
bui
ldin
g co
ntra
ctor
/ re
gist
ered
spe
cial
ist c
ontra
ctor
.BO
s 8C
(2)
BA
2BAp
plic
atio
n fo
r res
tora
tion
of n
ame
to th
e re
gist
er o
f gen
eral
bui
ldin
g co
ntra
ctor
s / s
peci
alis
t con
tract
ors.
BOs
8D(2
)
BA
2CAp
plic
atio
n fo
r app
rova
l of t
echn
ical
dire
ctor
/ ot
her o
ffice
r / p
erso
n ap
poin
ted
to a
ct fo
r the
pur
pose
s of
the
Build
ing
Ord
inan
ce fo
r a re
gist
ered
gen
eral
bui
ldin
g co
ntra
ctor
/ re
gist
ered
spe
cial
ist c
ontra
ctor
.BO
s 8B
BA
4N
otic
e of
app
oint
men
t of a
utho
rized
per
son
and/
or re
gist
ered
stru
ctur
al e
ngin
eer a
nd/o
r reg
iste
red
geot
echn
ical
eng
inee
r. B(
A)R
23(
1A)
BA
5Ap
plic
atio
n fo
r app
rova
l of p
lans
of b
uild
ing
wor
ks a
nd/o
r stre
et w
orks
, and
cer
tifica
te o
f pre
para
tion
of p
lans
.B(
A)R
29(
1) &
18A
BA
6St
abilit
y ce
rtific
ate
of a
utho
rized
per
son
and/
or re
gist
ered
stru
ctur
al e
ngin
eer.
B(A)
R 1
8
BA
7N
otic
e of
urg
ent w
orks
requ
ired
as a
resu
lt of
acc
iden
t or e
mer
genc
y.BO
s 19(
3), B
(A)R
28
BA
8Ap
plic
atio
n fo
r con
sent
to th
e co
mm
ence
men
t and
car
ryin
g ou
t of b
uild
ing
wor
ks o
r stre
et w
orks
.B(
A)R
31
BA
9Ap
plic
atio
n fo
r ren
ewal
of c
onse
nt to
the
carry
ing
out o
f bui
ldin
g w
orks
or s
treet
wor
ks.
BOs
20(2
)
BA
10N
otic
e of
app
oint
men
t of r
egis
tere
d co
ntra
ctor
, not
ice
of co
mm
ence
men
t of b
uild
ing
wor
ks o
r stre
et w
orks
and
und
erta
king
by
regi
ster
ed c
ontra
ctor
.B(
A)R
20
BA
11N
otic
e fro
m a
regi
ster
ed c
ontra
ctor
on
ceas
ing
to b
e ap
poin
ted
in re
spec
t of b
uild
ing
wor
ks o
r stre
et w
orks
and
cer
tifica
te
in re
spec
t of t
hat p
art o
f the
bui
ldin
g w
orks
or s
treet
wor
ks c
arrie
d ou
t by
the
regi
ster
ed c
ontra
ctor
.B(
A)R
24
BA
12C
ertifi
cate
on
com
plet
ion
of b
uild
ing
wor
ks re
sultin
g in
a n
ew te
mpo
rary
bui
ldin
g, a
new
bui
ldin
g or
par
t of a
new
bui
ldin
g an
d ap
plic
atio
n fo
r tem
pora
ry o
ccup
atio
n pe
rmit
in re
spec
t of s
uch
build
ing
or p
art.
B(A)
R 25
, BO
s 21(
2)
BA
13C
ertifi
cate
on
com
plet
ion
of b
uild
ing
wor
ks re
sultin
g in
a n
ew b
uild
ing
and
appp
licat
ion
for p
erm
it to
occu
py s
uch
build
ing.
B(A)
R 25
, BO
s 21(
2)
BA
14C
ertifi
cate
on
com
plet
ion
of b
uild
ing
wor
ks n
ot re
sultin
g in
a n
ew b
uild
ing
or o
f stre
et w
orks
.B(
A)R
25
& 26
BA
14A
Cer
tifica
te o
n co
mpl
etio
n of
dem
olitio
n w
orks
.B(
A)R
25
BA
15N
otic
e of
inte
nded
mat
eria
l cha
nge
in th
e us
e of
a b
uild
ing.
BOs
25(1
)
BA
16Ap
plic
atio
n fo
r m
odifi
catio
n of
and
/or
exem
ptio
n fro
m th
e pr
ovis
ions
of t
he B
uild
ings
Ord
inan
ce a
nd/o
r R
egul
atio
ns
mad
e th
ereu
nder
.BO
s 42
(2)
BA
17Ap
plic
atio
n fo
r per
mit
to e
rect
a te
mpo
rary
bui
ldin
g.B(
P)R
51
BA
18Ap
plic
atio
n fo
r per
mit
to e
rect
a c
ontra
ctor
's sh
ed.
B(P)
R 5
3(1)
BA
19Ap
plic
atio
n fo
r per
mit
to e
rect
hoa
rdin
gs, c
over
ed w
alkw
ays
or g
antri
es.
B(P)
R 6
4
BA
20N
otic
e of
tech
nica
lly c
ompe
tent
per
son
or p
erso
ns a
ppoi
nted
to s
uper
vise
dem
olitio
n w
orks
.B(
DW
)R 8
(3)
BA
21N
otic
e of
nom
inat
ion
by a
utho
rized
per
son
or r
egis
tere
d st
ruct
ural
eng
inee
r or
reg
iste
red
geot
echn
ical
eng
inee
r of
an
othe
r aut
horiz
ed p
erso
n or
regi
ster
ed s
truct
ural
eng
inee
r or r
egis
tere
d ge
otec
hnic
al e
ngin
eer t
o ac
t in
his
stea
d du
ring
tem
pora
ry in
abilit
y to
act
.B(
P)R
23(
2)
BA
22Ap
plic
atio
n fo
r aut
horiz
atio
n to
car
ry o
ut a
nd/o
r mai
ntai
n gr
ound
wat
er d
rain
age
wor
ks.
BOs
28B(
1)
BA
23Ap
plic
atio
n fo
r gra
nt/re
new
al o
f lic
ence
for a
n oi
l sto
rage
inst
alla
tion.
B(
OSI
)R 6
(1) &
7(3
)
BA
24N
otifi
catio
n to
the
Build
ing
Auth
ority
of c
hang
e of
bus
ines
s ad
dres
s of
aut
horiz
ed p
erso
n / r
egis
tere
d st
ruct
ural
eng
inee
r / r
egis
tere
d ge
nera
l bui
ldin
g co
ntra
ctor
/ re
gist
ered
spe
cial
ist c
ontra
ctor
. B(
A)R
45
SPEC
IFIE
D F
OR
MS
FOR
BU
ILD
ING
S O
RD
INA
NC
E O
R R
EGU
LATI
ON
S
SPECIFIED FORMS FOR BUILDINGS ORDINANCE OR REGULATIONS FOR HONG KONG
Sou
rce :
Bui
ldin
gs D
epar
tmen
t, H
ong
Kon
g, S
AR
. R
efer
to w
ww
.bd.
gov.
hk fo
r fur
ther
info
rmat
ion.
67 68

2. GENERAL CONSTRUCTION DATA
(Cont'd)
Source: Buildings Ordinance, Hong Kong, SAR Refer to www.legislation.gov.hk for further information.
Source: Buildings Ordinance, Hong Kong, SAR Refer to www.legislation.gov.hk for further information.
PERCENTAGE SITE COVERAGE AND PLOT RATIOS FOR HONG KONG
SUMMARY OF BUILDING REGULATIONS FOR HONG KONG
69 70
DESCRIPTION NUMBER OFREGULATIONS
Administration 48
Appeal 14
Construction 93
Demolition Works 13
Energy Efficiency 6
Oil Storage Installations 12
Planning 72
Private Street and AccessRoads 28
Refuse Storage Chambers andChutes 25
Standards of Sanitary Fitments, Plumbing, Drainage Works and Latrines
91
Ventilating Systems 7
OPEN SPACE ABOUT DOMESTIC BUILDINGS
Item Class of site Open space required
1. Class A site Not less than one-half of the roofed-over area of the building
2. Class B siteNot less than one-third of the roofed-over area of the building
3. Class C siteNot less than one-quarter of the roofed-over area of the building
DEFINITION
Class A Site : Not being a class B or class C site, that abuts on one street not less than 4.5 m wide or on more than one such street.
Class B Site : A corner site that abuts on 2 streets neither of which is less than 4.5 m wide.
Class C Site : A corner site that abuts on 3 streets none of which is less than 4.5 m wide.

2. GENERAL CONSTRUCTION DATA
Height ofBuildingin metres
DOMESTIC BUILDINGS
Percentage site coverage Plot Ratio
ClassA
site
ClassB
site
ClassC
site
ClassA
site
ClassB
site
ClassC
site
Not over 15 m 66.6 75 80 3.3 3.75 4.0
15 m to 18 m 60 67 72 3.6 4.0 4.3
18 m to 21 m 56 62 67 3.9 4.3 4.7
21 m to 24 m 52 58 63 4.2 4.6 5.0
24 m to 27 m 49 55 59 4.4 4.9 5.3
27 m to 30 m 46 52 55 4.6 5.2 5.5
30 m to 36 m 42 47.5 50 5.0 5.7 6.0
36 m to 43 m 39 44 47 5.4 6.1 6.5
43 m to 49 m 37 41 44 5.9 6.5 7.0
49 m to 55 m 35 39 42 6.3 7.0 7.5
55 m to 61 m 34 38 41 6.8 7.6 8.0
Over 61 m 33.33 37.5 40 8.0 9.0 10.0
PERCENTAGE SITE COVERAGE AND PLOT RATIOS FOR HONG KONG
Source: Buildings Ordinance, Hong Kong, SAR Refer to www.legislation.gov.hk for further information.
NON-DOMESTIC BUILDINGS
Percentage sitecoverage Plot Ratio
ClassA
site
ClassB
site
ClassC
site
ClassA
site
ClassB
site
ClassC
site
100 100 100 5 5 5
97.5 97.5 97.5 5.8 5.8 5.8
95 95 95 6.7 6.7 6.7
92 92 92 7.2 7.4 7.4
89 90 90 8.0 8.1 8.1
85 87 88 8.5 8.7 8.8
80 82.5 85 9.5 9.9 10.2
75 77.5 80 10.5 10.8 11.2
69 72.5 75 11.0 11.6 12.0
64 67.5 70 11.5 12.1 12.6
60 62.5 65 12.2 12.5 13.0
60 62.5 65 15 15 15
71 72

PROPERTYProperty Commentary
Property Indicators Gross Floor Area (GFA) Calculations in Hong Kong
Gross Floor Area (GFA) Calculations in PRC Construction Floor Area (CFA) Definition

3. PROPERTY
75 76
PROPERTY COMMENTARY
HONG KONG'S PROPERTY MARKET IN 2011
Economic overviewHong Kong’s economic growth remained stable in 2011 although the global economy outlook remained unclear amid the outbreak of the European sovereign debt crisis. Hong Kong’s GDP growth in real terms surged 4.3% in the third quarter, following a gain of 5.1% in the first half of 2011.
Visitor arrivals recorded a notable year on year growth of 16.2% in the first nine months of 2011, mainly driven by the growth in visitors from Mainland China. The value of retail sales also exhibited strong year-on-year growth of 25.4 % in the period. Meanwhile, the unemployment rate dropped to 3.3% in the three months to October, compared with 4.2% in the same period of 2010.
Looking forward, the global economy is expected to become more recessionary in the coming year and the effect will inevitably spill over to Hong Kong. As employers may become cautious about hiring because of the unclear economic outlook, the unemployment rate in Hong Kong may rise slightly in 2012. The Hong Kong government has lowered the city’s GDP growth forecast for 2012 from 5–6% to 5%.
ResidentialHong Kong's residential market slowed in 2011 by a series of regulatory government policies, such as the implementation of Special Stamp Duty, and credit tightening measures adopted by local and Mainland banks. The number of residential sales transactions totaled about 75,300 in the first ten months of the year - down 33.5% from the same period in 2010. The luxury residential market was more resilient, with transactions worth HK$10 million or above dropping a less drastic 14.3% during the same period.
Provided by : Provided by :(Cont'd)
Residential prices experienced minor downward adjustments in the third quarter, following an upward trend in the first half of the year. However, the average price of luxury homes by the end of September 2011 was still 62.4% higher than the level in November 2008, according to Rating and Valuation Department, when the market was dragged down to its trough by the global financial crisis. Mass residential prices performed even better and soared 75.7% in September 2011 compared with their trough in December 2008. In the leasing market, the average rent of luxury residential properties, by the end of September, had risen 42.2% from its trough in April 2009.
Looking forward, uncertainties in the global economy are expected to keep the volume of residential sales transactions low in 2012. Mass home prices are likely to drop about 10-15% in 2012. Luxury residential properties should be more resilient due to their limited supply, with their prices set to adjust marginally by less than 10% in 2012.
OfficeThe Grade-A office sales market continued to grow over the year, despite the introduction of lower loan-to-value ratios by the government. The average capital value of Grade-A offices rose 20.8% during the first ten months, compared with only 16.9% over 2010. The number of office sales transactions totaled 2,675 in the first nine months of 2011, up 4.3% from the same period of 2010, according to the Rating and Valuation Department.
In the leasing market, financial institutions and professional services firms scrambled for limited office space in core areas. The average Grade-A vacancy rate edged down from 3.2% in December 2010 to 2.5% in October 2011.

3. PROPERTY
77 78
PROPERTY COMMENTARY
Provided by : Provided by :
Office (Cont'd)
Aggressive corporate expansions and decreasing vacancies prompted landlords to raise their asking rents markedly, leading to a boost in office rents. By the end of November, the average rent of Grade-A offices witnessed a 21.3% year-to-date growth.
Looking forward, office demand from financial institutions - that usually favour space in core districts - is likely to slow amid the Eurozone debt crisis. Meanwhile, local firms are also expected to slow their expansion plans. Grade-A office rents in core areas will see mild corrections, while rents in non-core districts will remain stable with the support of companies moving out from core areas to these locations to save operation costs.
RetailHong Kong’s retail property market experienced strong growth in 2011 on the back of robust retail sales and increased tourist arrivals, especially those from Mainland China. Amid relatively weak economies in US and Europe, international brands expanded aggressively in Hong Kong in order to grab a share of strong spending from Mainland tourists. Competition for leasing shops in prime locations was fierce, especially among international luxury fashion brands and jewellery shops, pushing up rents of prime street shops by 20.7% year on year in the first three quarter of 2011. In the sales sector, although retail property sales transactions dropped 8.5% year on year to 5,169 in the first nine months of 2011, their total value grew by 1.1%. In view of the cooling measures implemented on the residential sector, some investors turned to acquire quality retail properties for long term growth, pushing up prime street shop prices by 18.9% in the first three quarters of the year.
In the coming year, with sustainable retail sales growth
and the continued influx of Mainland tourists, we expect international retailers will continue to expand in Hong Kong, which would push up retail rents by another 10% over 2012.
IndustrialHong Kong’s industrial property market continued to recover over 2011, in the aftermath of the global financial tsunami. The government’s new policies to encourage the change of use of industrial buildings implemented in April 2010, plus the rezoning of industrial areas proposed in October 2010, helped revitalise the industrial sales market.
There were 6,617 flatted-factory sales transactions during the first nine months of 2011, up 15.4% from the same period in 2010, with total consideration rising 45.1% to over HK$24.0 billion. The value of en-bloc industrial property sales reached about HK$4.6 billion up to mid-November 2011, up 7.2% from the same period of 2010, according to our research.
During the first nine months of 2011, prices of flatted factories grew 23.1%, while their rents increased 11.4%, according to the Rating and Valuation Department. With prices rising faster than rents, yields slid to 3.9% in September 2011, compared with 4.6% a year ago.
By the end of September, the Lands Department had approved 35 applications of change of usage under the revitalisation scheme, involving the demolition and redevelopment of nine industrial buildings as well as the wholesale conversion of 26 others, providing a total gross floor area of 380,000 sq m for non-industrial uses. We expect the acquisition of industrial buildings for redevelopment and conversion to continue in the coming year, which would further push up industrial property prices, while their rents would remain stable.

3. PROPERTY
HONG KONG GRADE-A OFFICE PRICE
HONG KONG GRADE-A OFFICE VACANCY RATES
79 80
HONG KONG GRADE-A OFFICE RENTAL VALUES
HONG KONG GRADE-A OFFICE SUPPLY
Source: Knight Frank
Source: Knight Frank Source: Rating and Valuation Department / Knight Frank
PROPERTY INDICATORS
* Oct figure * Oct figure
* Oct figure
Source: Knight Frank

3. PROPERTY
FEAT
UR
EB
UIL
DIN
G(P
LAN
NIN
G)
REG
ULA
TIO
NR
EMA
RK
S
Gen
eral
floo
r are
aA
ccou
ntab
leA
rea
with
in o
uter
sur
face
of e
xter
nal w
alls
.
Bas
emen
tA
ccou
ntab
le
Bal
cony
/ ut
ility
pla
tform
*A
ccou
ntab
leN
on-a
ccou
ntab
le if
for
res
iden
tial b
uild
ings
and
be
open
on
at le
ast
2 si
des,
max
. 50%
are
a gr
anta
ble.
Cur
tain
wal
l / c
ladd
ing
Non
-acc
ount
able
Non
- acc
ount
able
if: 1
. Th
e cu
rtain
wal
l sys
tem
itse
lf do
es n
ot fo
rm p
art o
f th
e st
ruct
ural
sys
tem
of t
he p
aren
t bui
ldin
g; 2
. Th
e sy
stem
doe
s no
t res
ult
in a
ny a
dditi
onal
floo
r are
a at
a fl
oor l
evel
; 3.
The
pro
ject
ion
of th
e sy
stem
fro
m th
e ou
ter f
ace
of th
e st
ruct
ural
ele
men
ts d
oes
not e
xcee
d 30
0 m
m.
Ext
erna
l wal
l fini
shes
(inc
ludi
ng b
ay
win
dow
s) *
Non
-acc
ount
able
Pre
cast
fac
ades
may
sub
ject
to
cond
ition
s be
exc
lude
d fr
om G
FA
calc
ulat
ion.
Pla
nt r
oom
sN
on-a
ccou
ntab
leS
ubje
ct to
just
ifica
tion
with
reas
onab
le p
lant
layo
uts.
Sta
ircas
es a
nd li
ft sh
afts
Acc
ount
able
Exc
ept s
tairc
ases
and
lift
shaf
ts s
olel
y se
rvin
g no
n-ac
coun
tabl
e ar
eas.
Cov
ered
pub
lic c
arpa
rkin
g sp
ace
Acc
ount
able
Cov
ered
priv
ate
carp
arki
ng s
pace
Non
-acc
ount
able
App
licab
le o
nly
for
spac
es s
ervi
ng u
sers
of t
he b
uild
ing
requ
ired
unde
r lo
cal s
tand
ard
and
built
bel
ow g
roun
d.
Lobb
y *
Acc
ount
able
Con
cess
ion
may
be
gran
ted
for l
ift lo
bbie
s su
bjec
t to
cond
ition
s.
Can
opy
Acc
ount
able
Non
-acc
ount
able
whe
n th
e ca
nopy
sol
ey s
erve
s as
pro
tect
ion
agai
nst
wea
ther
and
falli
ng o
bjec
t.
Ref
uge
floor
Non
-acc
ount
able
Spa
ce b
elow
ele
vate
d gr
ound
floo
rA
ccou
ntab
leN
on-a
ccou
ntab
le if
the
cove
red
area
s ar
e cl
early
inte
nded
for a
nd d
esig
ned
as p
layg
roun
d or
ded
icat
ed a
s pu
blic
pas
sage
.
Cov
ered
wal
kway
s *
Acc
ount
able
Ope
n-si
ded
cove
red
wal
kway
s fo
r co
mm
on a
reas
in
resi
dent
ial
deve
lopm
ents
may
be
exem
pted
, sub
ject
to th
e pr
opos
ed w
alkw
ays
bein
g no
t for
com
mer
cial
use
.Lo
adin
g an
d un
load
ing
bay
Non
-acc
ount
able
App
licab
le if
requ
ired
unde
r loc
al s
tand
ard/
leas
e an
d bu
ilt b
elow
gro
und.
Ref
use
stor
age
cham
bers
, ref
use
stor
age,
refu
se c
hute
s, re
fuse
ho
pper
room
sN
on-a
ccou
ntab
le
Floo
r spa
ce in
side
slo
ping
roof
Acc
ount
able
Cov
ered
are
a on
roof
-tops
Non
-acc
ount
able
Non
-acc
ount
able
for p
lant
room
s an
d st
airc
ases
onl
y.
Rec
reat
iona
l fac
ilitie
s *
Acc
ount
able
Non
-acc
ount
able
sub
ject
to c
ondi
tions
.
Spa
ces
for w
atch
men
and
m
anag
emen
t sta
ff *
Acc
ount
able
Non
-acc
ount
able
sub
ject
to c
ondi
tions
.
Ext
erna
l sta
ircas
esA
ccou
ntab
leN
on-a
ccou
ntab
le if
situ
ated
in n
on-a
ccou
ntab
le a
reas
.
GROSS FLOOR AREA (GFA) CALCULATIONS IN HONG KONG
GR
OSS
FLO
OR
AR
EA (G
FA) C
ALC
ULA
TIO
NS
IN H
ON
G K
ON
G
Dis
clai
mer
: G
FA c
alcu
latio
ns a
re s
ubje
ct to
var
ious
legi
slat
ion
and
prac
tice
note
s. A
ll ca
ses
of a
ccou
ntab
le o
r non
-acc
ount
able
GFA
ar
e su
bjec
t to
indi
vidu
al c
ondi
tions
. Th
e ab
ove
pres
ents
a b
rief s
umm
ary
only
and
use
rs a
re a
dvis
ed to
see
k pr
ofes
sion
al
advi
ce fr
om a
utho
rized
per
sons
. D
avis
Lan
gdon
& S
eah
here
with
dis
clai
ms
any
liabi
lity
that
may
aris
e fro
m u
nsol
icite
d us
e of
the
info
rmat
ion
give
n ab
ove.
* To
tal c
once
ssio
ns o
f the
se a
reas
are
sub
ject
to a
cap
of 1
0% o
f the
tota
l GFA
and
pre
requ
isite
s w
ith s
usta
inab
ility
des
igns
.
81 82

3. PROPERTY
FEAT
UR
E
NATI
ONA
L ST
ANDA
RD
- STA
NDAR
D
MEA
SURE
MEN
T FO
R
CONS
TRUC
TIO
N AR
EA O
F BU
ILDI
NG(G
B/T
5035
3-20
05)
REM
AR
KS
FOR
BEI
JIN
G, S
HA
NG
HA
I AN
D G
UA
NG
ZHO
U
Gen
eral
floo
r are
aA
ccou
ntab
leA
rea
with
in o
uter
sur
face
of e
xter
nal i
nsul
atio
n.Sh
angh
ai :
Ext
erna
l insu
latio
n is
exe
mpt
ed fr
om c
alcu
latio
n of
plo
t rat
io.
Bas
emen
tA
ccou
ntab
le1.
Bei
jing:
Non
-acc
ount
able
2. S
hang
hai :
Non
-acc
ount
able
.3.
Gua
ngzh
ou :
Acc
ount
able
for G
FA e
xcep
t whe
re th
e flo
or s
pace
is
sole
ly fo
r pla
nt ro
oms
or c
arpa
rk.
Bal
cony
/ ut
ility
pla
tform
Acc
ount
able
Cur
tain
wal
l / c
ladd
ing
Acc
ount
able
Exc
ept d
ecor
ativ
e ty
pe o
f cur
tain
wal
l.
Ext
erna
l wal
l fini
shes
(inc
ludi
ng b
ay
win
dow
s)N
on-a
ccou
ntab
le
Pla
nt r
oom
sA
ccou
ntab
le
Sta
ircas
es a
nd li
ft sh
afts
Acc
ount
able
Cov
ered
pub
lic c
arpa
rkin
g sp
ace
Acc
ount
able
Cov
ered
priv
ate
carp
arki
ng s
pace
Acc
ount
able
Lobb
yA
ccou
ntab
le
Can
opy
Acc
ount
able
Non
-acc
ount
able
sub
ject
to w
idth
of t
he c
anop
y no
t exc
eedi
ng 2
.1m
.
Ref
uge
floor
Acc
ount
able
1. S
hang
hai :
Non
-acc
ount
able
. 2.
Gua
ngzh
ou :
Onl
y re
fuge
are
as o
n re
fuge
floo
r are
non
-acc
ount
able
.
Spa
ce b
elow
ele
vate
d gr
ound
floo
rA
ccou
ntab
leN
on-a
ccou
ntab
le f
or G
FA if
for
the
usa
ge o
f w
alkw
ay,
gree
n, p
ublic
am
eniti
es o
r sim
ilar p
ublic
func
tion.
Cov
ered
wal
kway
sA
ccou
ntab
le
Load
ing
and
unlo
adin
g ba
yA
ccou
ntab
leN
on-a
ccou
ntab
le if
not
roof
ed o
ver.
Ref
use
stor
age
cham
bers
, ref
use
stor
age,
refu
se c
hute
s, re
fuse
ho
pper
room
sA
ccou
ntab
leN
on-a
ccou
ntab
le if
not
roof
ed o
ver.
Floo
r spa
ce in
side
slo
ping
roof
Acc
ount
able
Non
-acc
ount
able
if c
lear
hei
ght d
oes
not e
xcee
d 1.
2m.
Cov
ered
are
a on
roof
-tops
Acc
ount
able
1. S
hang
hai :
Non
-acc
ount
able
if th
e ar
ea o
f the
con
stru
ctio
n on
roof
-to
p do
es n
ot e
xcee
d 1/
8 of
the
area
of t
he ty
pica
l floo
r.2.
Gua
ngzh
ou:
Sta
ircas
e, li
ft lo
bby
and
wat
er ta
nk ro
om o
n ro
of-to
ps
are
exem
pted
from
GFA
Rec
reat
iona
l fac
ilitie
sA
ccou
ntab
le
Spa
ces
for w
atch
men
and
m
anag
emen
t sta
ffA
ccou
ntab
le
Ext
erna
l sta
ircas
esA
ccou
ntab
leN
on-a
ccou
ntab
le if
not
roof
ed o
ver.
GROSS FLOOR AREA (GFA) CALCULATIONS IN PRC
GR
OSS
FLO
OR
AR
EA (G
FA) C
ALC
ULA
TIO
NS
IN P
RC
83 84
Dis
clai
mer
: G
FA c
alcu
latio
ns a
re s
ubje
ct to
var
ious
legi
slat
ion
and
prac
tice
note
s. A
ll ca
ses
of a
ccou
ntab
le o
r no
n-ac
coun
tabl
e G
FA
are
subj
ect t
o in
divi
dual
con
ditio
ns.
The
abov
e pr
esen
ts a
brie
f sum
mar
y on
ly a
nd u
sers
are
adv
ised
to s
eek
prof
essi
onal
ad
vice
from
aut
horiz
ed p
erso
ns.
Dav
is L
angd
on &
Sea
h he
rew
ith d
iscl
aim
s an
y lia
bilit
y th
at m
ay a
rise
from
uns
olic
ited
use
of th
e in
form
atio
n gi
ven
abov
e.

3. PROPERTY
Financial Definitions Financial Formulae
Mortgage Repayment Table Composite CPI
Exchange Rates Currency Charts
Prime Rates Hang Seng Index
FINANCIAL
85 2
CONSTRUCTION FLOOR AREA (CFA) DEFINITION
The construction floor area measured from drawings is defined as covered floor areas fulfilling the functional requirements of the building measured to the outside face of the external walls or external perimeter.
It includes floor areas occupied by:
partitions
columns
stairwells
lift shafts
plant rooms
water tanks
balconies
utilities platforms
vertical ducts service floors higher than 2.2m and the like
But excludes floor areas occupied by:
bay windows
planters projecting from the building, and
the areas covered by canopies, roof eaves and awnings
Sloping surfaces such as staircases, escalators and carpark ramps are to be measured flat on plan.
The measurement of construction floor area is as defined byDavis Langdon & Seah.

4. FINANCIAL
FINANCIAL FORMULAEFINANCIAL DEFINITIONS
DISCOUNT RATEThe rate of return a developer expects when investing in a project.
i.e. opportunity cost.
INTERNAL RATE OF RETURN (IRR)The IRR may be defined as the interest rate that equates the present value of expected future cash flows to the cost of the investment.
The IRR can be compared to the Discount Rate.
NET PRESENT VALUE (NPV)The NPV is the present value of all future cash flows, discounted back to today's values at the Discount Rate.
The NPV indicates in today's dollars the profit or loss a developer makes above or below his required profit (based on a nominated Discount Rate).
72 RULEThe approximate number of years required to double your capital can be calculated by dividing the interest rate into 72.
e.g. If interest rate = 10% p.a.
Then 72 ÷ 10 = 7.2 years It will take approximately 7.2 years to double your capital if it is invested at 10% p.a.
PV = present value
FV = future value
PMT = payment amount
n = period (e.g. 10 years with monthly payments, n = 10 x 12 = 120)
i = interest rate per period (e.g. 12% p.a. compounded monthly; i = 12% ÷ 12 months = 1% per period)
87 88
Refer to www.hkifa.org.hk for further information.
Future value of $1 FV = PV (1 + i)n
Future value of $1 per period FV = PMT [((1+i)n - 1) ÷ i]
Sinking fund (the amount required to be put away periodically to realise some future sum)
PMT = FV [ i ÷ ((1 + i)n - 1)]
Present value of $1 PV = FV [1÷ (1+i)n]
Present value of $1 per period PV = PMT[((1+i)n -1)÷( i(1+i)n)]
Annuity with a PV of $1 (mortgage bond formula)
PMT = PV[(i (1+i)n) ÷((1+i)n -1)]

4. FINANCIAL
COMPOSITE CPIMORTGAGE REPAYMENT TABLE
Based on :
1,000 units of currency
Interest compounded monthly
Equal monthly repayments
Example:Borrow $1,000,000 to be repaid monthly at 5% p.a. over 20 years.
Repayments = 1,000,000 ÷ 1,000 x $6.60 = $6,600 per month
Note:The base index (100) applies to the period from October 2009 to September 2010.
Source : Census and Statistics Department, Hong Kong, SAR Refer to www.censtatd.gov.hk for further information.
89 90
* 01/11 to 10/11 only
Refer to www.hkmc.com.hk for an online mortgage calculator.
INTERESTp.a.
REPAYMENT (years)
10 15 20 25
1% 8.76 5.98 4.60 3.77
2% 9.20 6.44 5.06 4.24
3% 9.66 6.91 5.55 4.74
4% 10.12 7.40 6.06 5.28
5% 10.61 7.91 6.60 5.85
6% 11.10 8.44 7.16 6.44
7% 11.61 8.99 7.75 7.07
8% 12.13 9.56 8.36 7.72
9% 12.67 10.14 9.00 8.40
10% 13.22 10.75 9.65 9.09
11% 13.78 11.37 10.32 9.80
12% 14.35 12.00 11.01 10.53
13% 14.93 12.65 11.72 11.28
14% 15.53 13.32 12.44 12.04
15% 16.13 14.00 13.17 12.81
YEAR INDEX % CHANGE
1995 90.2 9.2%1996 95.9 6.3%1997 101.5 5.8%1998 104.3 2.9%1999 100.2 -3.9%2000 96.5 -3.7%2001 94.9 -1.6%2002 92.0 -3.1%2003 89.7 -2.6%2004 89.3 -0.4%2005 90.1 1.0%2006 92.0 2.0%2007 93.8 2.0%2008 97.8 4.3%2009 98.4 0.5%2010 100.7 2.4%2011* 105.5 5.2%

4. FINANCIAL
EXCHANGE RATES
Approximate rates prevailing on 30 November 2011.
91 92
Source : www.exchange-rates.orgRefer also : www.xe.com
COUNTRY CURRENCY HK$1 US$1
Australia Dollar 0.13 1.00
Brunei Dollar 0.17 1.30
Canada Dollar 0.13 1.03
China Renminbi 0.82 6.39
EU (Euro Zone) Euro 0.10 0.75
Hong Kong Dollar 1.00 7.79
India Rupee 6.70 52.18
Indonesia Rupiah 1,177.26 9,170.00
Japan Yen 10.01 77.93
Kazakhstan Tenge 19.05 148.39
Macau Pataca 1.03 7.99
Malaysia Ringgit 0.41 3.19
COUNTRY CURRENCY HK$1 US$1
New Zealand Dollar 0.17 1.31
Pakistan Rupee 11.23 87.47
Philippines Peso 5.61 43.74
Qatar Rial 0.47 3.64
Singapore Dollar 0.17 1.30
South Korea Won 146.63 1,142.14
Taiwan NT Dollar 3.89 30.27
Thailand Baht 4.02 31.32
United Kingdom Pound 0.08 0.64
United States of America Dollar 0.13 1.00
Vietnam Dong 2,709.29 21,103.31
Source : www.exchange-rates.orgRefer also : www.xe.com

4. FINANCIAL
CURRENCY CHARTS
STERLING POUND
JAPANESE YEN
AUSTRALIAN DOLLAR
RENMINBI
93 94
Source : Hong Kong Monetary Authority Refer to www.info.gov.hk/hkma for further informationRefer also : www.xe.com ; www.exchange-rates.org
Source : Hong Kong Monetary Authority Refer to www.info.gov.hk/hkma for further informationRefer also : www.xe.com ; www.exchange-rates.org

4. FINANCIAL
PRIME RATES
CHANGES IN HONG KONG PRIME RATES
PRIME RATES AND BASE LENDING RATES AS AT4TH QUARTER 2011
95 96
1 - O/N Cash Rate2 - 3-Year Benchmark Lending Rate3 - Overnight Lending Rate4 - Long-term prime rate % per annum (implementation date is 10 Dec. 2010)5 - SME Overdraft Rate (Previously Business Base Lending Rate)
Source : Hong Kong Monetary Authority Refer to www.info.gov.hk/hkma for further information.
6 - Weighted Average Lending Rate 7 - Base Rate of The Bank of Korea 8 - Minimum Loan Rate % per annum (average based on local bank) 9 - Min. and in VND per year
COUNTRY % CHANGE
Australia1 4.50
Brunei 5.50
China2 6.90
Egypt3 10.25
Hong Kong 5.00
India 14.75
Indonesia 6.00
Japan4 1.60
Macau 5.25
Malaysia 6.60
New Zealand5 10.01
Pakistan6 13.97
Philippines 5.74
Singapore 5.38
South Africa 9.00
South Korea7 3.25
Thailand8 7.71
United Kingdom 0.50
United States of America 3.25
Vietnam9 9.00
DATE % DATE %
14 Feb 2000 8.75 23 May 2005 5.7527 Mar 2000 9.00 05 Jul 2005 6.2522 May 2000 9.50 22 Jul 2005 6.5008 Jan 2001 9.00 11 Aug 2005 6.7505 Feb 2001 8.50 23 Sep 2005 7.0026 Mar 2001 8.00 03 Nov 2005 7.5023 Apr 2001 7.50 15 Dec 2005 7.7521 May 2001 7.00 30 Mar 2006 8.0003 Jul 2001 6.75 07 Nov 2006 7.7524 Aug 2001 6.50 20 Sep 2007 7.5019 Sep 2001 6.00 02 Nov 2007 7.2504 Oct 2001 5.50 12 Nov 2007 7.0008 Nov 2001 5.25 13 Dec 2007 6.7513 Dec 2001 5.125 24 Jan 2008 6.0008 Nov 2002 5.00 01 Feb 2008 5.7523 Sep 2004 5.125 20 Mar 2008 5.2512 Nov 2004 5.00 10 Nov 2008 5.0021 Mar 2005 5.25

4. FINANCIAL
cUtility Costs for Selected Asian Cities Conversion Factors
IDD Codes and Time Differences Public Holidays
Davis Langdon & Seah Professional Services DLS Infrastructure Team
DLS Interior Fitting Out Team DLS Project Monitoring Team
DLS Sustainability Services Team Directory of Offices
Telephone Directory
OTHER INFORMATION
HANG SENG INDEX
H
AN
G S
ENG
IND
EX
97 42
Ref
er to
ww
w.a
asto
cks.
com
for
furth
er in
form
atio
n.

5. OTHER INFORMATION
UTILITY COSTS FOR SELECTED ASIAN CITIES
Basis of Charges in Shenzhen, China Water
Domestic : Within 22m3 = US$ 0.361/m3; 23 - 30m3 = US$ 0.541/m3; 31m3 and above = US$ 0.721/m3
Commercial : US$ 0.525/m3 Industrial : US$ 0.525/m3 Electricity Commercial : US$ 0.158/kWh Industrial : Peak = US$ 0.183/kWh; Normal = US$ 0.138/kWh; Off-peak = US$ 0.048/kWh Unleaded Fuel 90# = US$1.089/litre; 93# = US$1.174/litre; 97# = US$1.271/litre
The above costs are at 4th Quarter 2011 levels.
99 100
Basis of Charges in Hong Kong, China Water Domestic : 0 - 12m3 = Free of charge; 12 - 43m3 = US$ 0.53/m3; 43 - 62m3 = US$ 0.83/m3; Above 62m3 = US$ 1.16/m3
Electricity (Based on tariff scheme of CLP Holding Limited) Domestic (bi-monthly consumption) 0 - 400kWh = US$ 0.10/kWh; 400 - 1,000kWh = US$ 0.11/kWh; 1,000 - 1,800kWh = US$ 0.12/kWh; Above 1,800kWh = US$ 0.13/kWh
Basis of Charges in Macau, China Water
Domestic : Consumption charge (flat rate) = US$ 0.54/m3
Other charges (Depending on meter size 15mm - 200mm) : Meter rental = US$0.33 - 58.07/month; Minimum consumption fee = US$2.22 - 383/month Commercial/ Industrial :
Charges for ordinary users (e.g. Business, government buildings, schools, associations, hospitals and others) only. Special users (e.g. gaming industries, hotels, saunas, golf cources, construction, public infrastructures and other temporary consumption) are excluded.
Electricity Electricity tariff are composition of demand charges, consumption
charges, fuel clause adjustment and government tax.
Basis of Charges in Beijing and Guangzhou, China Unleaded fuel rate is for Unleaded gasoline 97.
Basis of Charges in Shanghai, China Unleaded Fuel 93# = US$1.19/litre; 97# = US$1.26/litre
Basis of Charges in Kuala Lumpur, Malaysia Unleaded fuel rate is for Unleaded petrol Ron 95.Basis of Charges in Singapore (All rates are nett of GST) Domestic water rate includes conservation tax and water-borne fee and is an average for the 1st 40m3, exclude sanitary appliance fee. Non-domestic water rate includes conservation tax and water-borne fee, exclude sanitary appliance fee. Electricity tariff is based on low tension power supply. Unleaded fuel rate is for 98 Unleaded petrol as at 15 November 2011. Diesel fuel rate as at 15 November 2011. (Cont'd)
CITYEXCHANGE
RATE
ELECTRICITY
DOMESTIC COMMERCIAL/INDUSTRIAL
US$1= US$/kWh US$/kWh
Hong Kong HK$7.80 0.10 0.11
Shanghai RMB6.35 0.097(peak) /0.048(normal)
0.16(peak) /0.077(normal)
Beijing RMB6.35 0.07 0.13
Guangzhou RMB6.35 0.09 0.17 / 0.14
Shenzhen RMB6.35 0.1066 0.048 - 0.183
Macau MOP7.97 0.11 0.12
Kuala Lumpur RM3.15 0.069 - 0.144 0.110 - 0.137
Singapore S$1.25 0.22 0.22
Jakarta IDR8,910 0.089 0.102
WATER FUEL
DOMESTIC COMMERCIAL/INDUSTRIAL DIESEL LEADED UNLEADED
US$/m3 US$/m3 US$/litre US$/litre US$/litre
0.83 0.59 1.52 N/A 2.05
0.46 0.60 1.17 N/A 1.19 - 1.26
0.63 0.98 1.08 N/A 1.13
0.20 0.43 / 0.29 0.84 N/A 1.04
0.361 - 0.721 0.525 1.177 N/A 1.089 - 1.271
0.54 0.66 1.48 N/A 1.99
0.181 - 0.635 0.657 - 0.724 0.57 N/A 0.60
1.44 1.67 1.27 N/A 1.75
0.250 0.475 0.475 N/A 0.505

5. OTHER INFORMATION
UTILITY COSTS FOR SELECTED ASIAN CITIES
The above costs are at 4th Quarter 2011 levels.
101 102
Basis of Charges in Manila, Philippines Water Domestic : 32m3 - 52m3/month Commercial/Industrial : 3,204m3/month Electricity Domestic : 100kWh - 533kWh Commercial/Industrial : 222,600kWh
Water and Electricity actual billing includes miscellaneous charges such as Environmental Charge, Currency Exchange Rate Adjustment (CERA), VAT, etc.
Basis of Charges in Seoul, Korea Water Domestic = US$0.939/month (basic rate) + US$0.311/m3
(Within 30m3 usage) Commercial = US$77.39/month (basic rate) + US$1.475/m3
(Within 100m3 usage) Electricity Domestic = US$4.757/month (basic rate) + US$0.155/kWh (500kWh below in use) Commercial = US$5.243/month (basic rate) + US$0.0879/kWh (within 1,000kWh, 3,300V - 66,000V)
Basis of Charges in Tokyo, Japan (All rates are VAT inclusive) Water Domestic : Rates for 30mm diameter of water piping + Basic rate of US$41.64. Commercial / Industrial : Rates for 100mm diameter of water piping + Basic rate of US$1,146.28. Electricity 0kWh - 120kWh = US$0.217/kWh; 120kWh - 300kWh = US$0.277/kWh; Over 300kWh = US$0.292/kWh Basic rate = US$3.309 - 10A (ampere); US$9.927 - 30A (ampere); US$19.855 - 60A (ampere) is added.
Basis of Charges in Ho Chi Minh, Vietnam (All rates are VAT inclusive) Water Domestic : Used in norm = US$ 0.21; Used over norm = US$ 0.50 Industrial = US$0.35 Commercial = US$0.65 Electricity Domestic electricity rates are applied to the 301 KW above wards Fuel : Diesel fuel D.O - 0.05% : 92 and 95 Unleaded petrol as at October 2011.
Basis of Charges in Bangkok, Thailand Unleaded fuel rate is for Gasohol 95.
Basis of Charges in Karachi, Pakistan Fuel : The diesel fuel rate is for High Speed Diesel. : The unleaded fuel rate is for Premier Petrol.
CITYEXCHANGE
RATE
ELECTRICITY
DOMESTIC COMMERCIAL/INDUSTRIAL
US$1= US$/kWh US$/kWh
Bangkok BHT30.00 0.044 - 0.096 0.054 - 0.056
Manila PHP43.00 0.20 - 0.27 0.21
Brunei B$1.26 0.008 - 0.12 0.057 - 0.159
Ho Chi Minh VND21,000 0.091 0.082 - 0.141 / 0.051 - 0.092
Bangalore INR50.00 0.078 - 0.196 0.112 - 0.352
New Delhi INR50.00 0.098 - 0.167 0.123 - 0.229
Karachi PKR89.42 0.078 - 0.16 0.16 - 0.23
Seoul KRW1,146 0.155 0.0879
Tokyo JPY78.14 0.277 0.277
WATER FUEL
DOMESTIC COMMERCIAL/INDUSTRIAL DIESEL LEADED UNLEADED
US$/m3 US$/m3 US$/litre US$/litre US$/litre
0.274 - 0.466 0.306- 0.510 0.951 N/A 1.074
0.56 - 0.65 1.32 1.095 N/A 1.243
0.087 - 0.349 0.484 - 0.524 0.302 0.404 0.421
0.21 - 0.50 0.65 / 0.35 0.995 N/A 0.99 - 1.014
3.083 - 5.507 4.142 - 6.829 0.921 N/A 1.457
3.304 - 5.288 4.865 - 7.932 0.82 N/A 1.328
0.175 - 0.319 0.292 - 0.529 1.105 N/A 0.983
0.311 1.475 1.61 N/A 1.73
2.726 5.170 1.459 N/A 1.639
Basis of Charges in Brunei Electricity (Domestic) : Tariff effective from 1st Jan 2012. 1-10 kWh 10c, 11-60 kWh 8c, 61-100kWh 12c, above 100kWh 15c

5. OTHER INFORMATION
CONVERSION FACTORS
103 104
Refer to www.online-unit-converter.com , www.dimensionconverter.com for further information.
UNIT
LENGTH
10 mm = 1 cm 12 in = 1 ft 100 cm = 1 m 3 ft = 1 yd 1,000 m = 1 km 1,760 yd = 1 mile
AREA
10,000 m2 = 1 ha 9 ft2 = 1 yd2
100 ha = 1 km2 4,840 yd2 = 1 acre 640 acre = 1 mile2
VOLUME
1,000 ml = 1 l (UK) 8 pt = (UK) 1 gal (US) 8 pt = (US) 1 gal 1,000 l = 1 m3
MASS
1,000 g = 1 kg 16 oz = 1 lb 1,000 kg = 1 tonne 2,240 lb = 1 ton 16 tael = 1 catty
POWER
TEMPERATURE
(APPROX) (APPROX)
1 in = 25.400 mm 1 cm = 0.394 in 1 ft = 30.480 cm 1 m = 3.281 ft 1 yd = 0.914 m 1 m = 1.094 yd 1 mile = 1.609 km 1 km = 0.621 mile
1 ft2 = 0.093 m2 1 m2 = 10.764 ft2
1 yd2 = 0.836 m2 1 m2 = 1.196 yd2
1 acre = 0.405 ha 1 ha = 2.471 acres 1 mile2 = 2.590 km2 1 km2 = 0.386 mile2
(UK) 1 pt = 0.568 l (UK) 1 l = 1.760 pt (US) 1 pt = 0.473 l (US) 1 l = 2.113 pt (UK) 1 gal = 4.546 l (UK) 1 l = 0.220 gal (US) 1 gal = 3.785 l (US) 1 l = 0.264 gal
1 oz = 28.350 g 1 gram = 0.035 oz 1 lb = 0.454 kg 1 kg = 2.205 lb 1 ton = 1.016 tonne 1 tonne = 0.984 ton 1 catty = 0.605 kg
1 hp = 0.746 kw 1 kw = 1.341 hp
(0F - 32) x 5/9 (0C x 9/5) + 32

5. OTHER INFORMATION
IDD CODES AND TIME DIFFERENCES
* As compared to Hong Kong. Allowance should be made for seasonal time variations. Time differences above as at 1 January.
Source : www.worldtimeserver.com ; www.worldtimezone.com www.timeanddate.com
105 106
LOCATIONIDD
COUNTRYCODE
AREACODE
TIMEDIFFERENCE
(Hours)*
Australia: Melbourne 61 3 +3 Perth 61 8 +1 Sydney 61 2 +3Bahrain 973 - -5Bangladesh (Dhaka) 880 2 -2Bhutan (Thimphu) 975 2 -2Brunei: Bandar Seri Begawan 673 2 0 Kuala Belait 673 3 0Cambodia (Phnom Penh) 855 23 -1Canada: Toronto (Metropolitan) 1 416 -13 Vancouver 1 604/250/ 778 -16China: Beijing 86 10 0 Guangzhou 86 20 0 Hong Kong 852 - 0 Macau 853 - 0 Shanghai 86 21 0 Shenzhen 86 755 0France (Paris) 33 1 -7India: Bangalore 91 80 -2.5 Chennai 91 44 -2.5 New Delhi 91 11 -2.5 Mumbai 91 22 -2.5Indonesia: Bali 62 361 0 Jakarta 62 21 -1Ireland: Cork 353 21 -8 Dublin 353 1 -8Japan: Tokyo 81 3 +1 Osaka 81 6 +1Kazakhstan (Almaty) 7 727 -2Korea (Seoul) 82 2 +1Korea (Pyongyang) 850 2 +1Laos (Vientiane) 856 21 -1
LOCATIONIDD
COUNTRYCODE
AREACODE
TIMEDIFFERENCE
(Hours)*
Malaysia: Johor Bahru 60 7 0 Kota Kinabalu 60 88 0 Kuala Lumpur 60 3 0 Kuching 60 82 0 Penang 60 4 0Mongolia (Ulaanbaatar) 976 11 0Myanmar (Rangoon) 95 1 -1.5Nepal (Kathmandu) 977 1 -2.25New Zealand: Auckland 64 9 +5 Wellington 64 4 +5Pakistan (Karachi) 92 21 -3Philippines (Manila) 63 2 0Qatar 974 - -5Singapore 65 - 0Spain: Barcelona 34 93 -7 Girona 34 972 -7South Africa: Johannesburg 27 11 -6 Cape Town 27 21 -6Sri Lanka (Colombo) 94 1 -2.5Russia (Moscow) 7 495 -5Taiwan (Taipei) 886 2 0Thailand: Bangkok 66 2 -1 Phuket 66 76 -1United Arab Emirates: Abu Dhabi 971 2 -4 Dubai 971 4 -4United Kingdom: London 44 20 -8 Edinburgh 44 131 -8USA: Los Angeles 1 213 -16 New York 1 212 -13Vietnam: Ho Chi Minh City 84 8 -1 Hanoi 84 4 -1

5. OTHER INFORMATION
PUBLIC HOLIDAYS
(Cont'd)
2011 2012
HONG KONGThe first day of January 01 Jan 01 Jan *The day following the first day of January - 02 JanLunar New Year's Day 03 Feb 23 JanThe 2nd day of Lunar New Year 04 Feb 24 JanThe 3rd day of Lunar New Year 05 Feb 25 JanChing Ming Festival 05 Apr 04 AprGood Friday 22 Apr 06 AprThe day following Good Friday 23 Apr 07 AprEaster Monday 25 Apr 09 AprBuddha's Birthday 10 May 28 AprLabour Day 01 May 01 MayThe day following Labour Day 02 May -Tuen Ng Festival 06 Jun 23 JunHKSAR Establishment Day 01 Jul 01 Jul @
The day following HKSAR Establishment Day - 02 JulThe day following the Chinese Mid-Autumn Festival 13 Sep 01 Oct #National Day 01 Oct 01 Oct #The day following National Day - 02 OctChung Yeung Festival 05 Oct 23 OctChristmas Day 25 Dec 25 DecThe 1st week-day after Christmas Day 26 Dec 26 DecThe 2nd week-day after Christmas Day 27 Dec -
* As the first day of January in 2011 falls on a Sunday, the day following will be designated as an additional general holiday.
@ As the HKSAR Establishment Day in 2012 falls on a Sunday, the day following will be designated as an additional holiday.
# As the day following Mid-Autumn Festival and National Day in 2012 fall on the same day, one additional holiday will be granted following the National Day.
2011 2012
CHINA
New Year's Day @ 01 Jan 01 JanChinese New Year's Eve 02 Feb 22 JanChinese New Year ₲ 03 Feb 23 Jan
04 Feb 24 JanTomb-Sweeping Day Ω 05 Apr 04 AprLabour Day δ 01 May 01 MayDragon-Boat Festival φ 06 Jun 23 JunMid-Autumn Festival 12 Sep 30 SepNational Day ᵬ 01 Oct 01 Oct
02 Oct 02 Oct 03 Oct 03 Oct
@ 2 & 3 January are holidays, 31 December 2011 is working day.₲ 25-28 January are holidays, 21 and 29 January are working
days.Ω 2 & 3 April are holidays, 31 March and 1 April are working
days.δ 29 & 30 April are holidays, 28 April is working day.φ 22 & 24 June are holidays.ᵬ 4 - 7 October are holidays, 29 September is working day.
107 108

5. OTHER INFORMATION
PUBLIC HOLIDAYS
(Cont'd)
109 110
2011 2012
MACAUNew Year's Day 01 Jan 01 Jan @ The first working day after New Year's Day - 02 Jan #Lunar New Year's Eve (Afternoon) 02 Feb -Lunar New Year's Day 03 Feb 23 JanThe 2nd day of Lunar New Year 04 Feb 24 JanThe 3rd day of Lunar New Year 05 Feb 25 JanChing Ming Festival 05 Apr 04 AprGood Friday 22 Apr 06 AprThe day following Good Friday 23 Apr 07 Apr @
Easter Monday 25 Apr 09 Apr #Labour Day 01 May 01 MayThe day following Labour Day 02 May -The Buddha's Birthday 10 May 28 Apr @
The first working day after the Buddha'a Birthday - 30 Apr #Tuen Ng Festival (Dragon Boat Festival) 06 Jun 23 JunThe first working day after Tuen Ng Festival - 25 Jun #Bank's Holiday 01 Jul 02 JulNational Day 01 Oct 01 OctThe day following National Day 02 Oct 02 OctThe first weekday following National Day 03 Oct -The day following Mid-Autumn Festival 13 Sep -Chung Yeung Festival 05 Oct 23 OctAll Soul's Day 02 Nov 02 NovFeast of the Immaculate Conception 08 Dec 08 Dec @
The first working day after Feast of Immaculate Conception - 10 Dec #Macau SAR Establishment Day 20 Dec 20 DecWinter Solstice 22 Dec 21 Dec @
Christmas Eve 24 Dec 24 DecChristmas Day 25 Dec 25 DecThe day following Christmas Day 26 Dec -Bank's Holiday 27 Dec 26 DecNew Year's Eve (Afternoon) - 31 Dec #
@ Not applicable to Banks# Special holiday granted by the Chief Executive
2011 2012
BRUNEINew Year's Day ** 01 Jan 02 JanChinese New Year 03 Feb 23 JanProphet Muhammad's Birthday ** 15 Feb 06 FebNational Day 23 Feb 23 FebRoyal Brunei Armed Forces Anniversary 31 May 31 MayIsrak Mikraj ** 29 Jun 18 JunHis Majesty's Birthday ** 16 Jul 16 JulFirst Day of Ramadhan * 01 Aug 21 JulAnniversary of the Revelation of the Holy Koran * 17 Aug 06 AugHari Raya Aidifitri * 30 Aug 20 AugHari Raya Aidifitri (2nd Day) * 31 Aug 21 AugHari Raya Aidil Adha * & ** 07 Nov 26 OctFirst Day of Hijrah * & ** 28 Nov 15 NovChristmas Day * 26 Dec 25 Dec
Notes : Fridays and Sundays are government off days * Subject to change ** Replacement for Fridays / Sundays
INDIANew Year's Day 01 Jan 01 JanSankranthi 14 Jan 14 JanRepublic Day 26 Jan 26 JanGood Friday 22 Apr 06 AprMay Day 01 May 01 MayIndependence Day 15 Aug 15 AugGandhi Jayanthi 02 Oct 02 OctKarnataka Formation Day 01 Nov 01 NovDeepavali 26 Oct 13 NovChristmas Day 25 Dec 25 Dec

5. OTHER INFORMATION
PUBLIC HOLIDAYS
(Cont'd)
111 112
2011 2012
INDONESIANew Year's Day 01 Jan 01 JanChinese New Year (Imlek) 03 Feb 23 JanProphet Muhammad's Birthday 15 Feb 05 FebHindu Day of Quiet (Nyepi) 05 Mar 23 MarGood Friday 22 Apr 06 AprWaicak Day 17 May 06 MayAscension Day of Jesus Christ 02 Jun 17 MayAscension of Prophet Mohammad * 29 Jun 17 JunNational Independence Day 17 Aug 17 AugIdul Fitri * 30 Aug 19 Aug
31 Aug 20 AugIdul Adha Day 06 Nov 26 OctHijriyah New Year 27 Nov 15 NovChristmas Day 25 Dec 25 Dec
* Subject to change
JAPANNew Year's Day * 01 Jan 02 JanComing of Age Day 10 Jan 09 JanNational Foundation Day * 11 Feb 11 FebSpring Equinox Day * 21 Mar 20 MarDay of Showa * 29 Apr 30 AprConstitution Memorial Day * 03 May 03 MayGreenery Day * 04 May 04 MayChildren's Day * 05 May 05 MayMarine Day 18 Jul 16 JulRespect for Senior Citizens Day 19 Sep 17 SepAutumnal Equinox Day * 23 Sep 22 SepPhysical Fitness Day 10 Oct 08 OctCulture Day * 03 Nov 03 NovLabour Thanksgiving Day * 23 Nov 23 NovThe Emperor's Day * 23 Dec 23 Dec
* When Public Holiday falls on a Sunday, the day following Monday
is an alternative holiday.
2011 2012
MALAYSIANew Year's Day ^ 01 Jan 01 Jan#
Chinese New Year @ 03 Feb 23 Jan 04 Feb 24 Jan
Prophet Muhammad's Birthday 15 Feb 05 Feb#
Labour Day 01 May 01 MayWesak Day 17 May 05 MayKing/Agong's Birthday 04 Jun 02 JunHari Raya Aidilfitri * 30 Aug 19 Aug 31 Aug 20 Aug#
National Day 31 Aug 31 AugMalaysia Day 16 Sep 16 Sep#
Hari Raya Qurban * 06 Nov 26 OctDeepavali * 26 Oct 13 NovAwal Muharam (Maal Hijrah) 27 Nov 15 NovChristmas Day 25 Dec 25 Dec
* Subject to change^ Except Johor, Kelantan, Kedah, Perlis and Terengganu@ 2nd Day except Kelantan and Terengganu# The following day will be an additional holiday
PAKISTANKashmir Day 05 Feb 05 FebEid-e-Milad-un-Nabi * 16 Feb 05 FebPakistan Day 23 Mar 23 MarLabour Day 01 May 01 MayIndependence Day 14 Aug 14 AugEid al-Fitr (End of Ramadan) * 31 Aug 19 Aug
01 Sep 20 Aug- 21 Aug
Eid ul-Azha (Feast of the Sacrifice) * 07 Nov 26 Oct 08 Nov 27 Oct
09 Nov -Allama Muhammad lqbal Day 09 Nov 09 NovAshoura * 05 Dec 24 Nov
06 Dec 25 NovQuaid-e-Azam's Birthday 25 Dec 25 Dec
* Subject to change

5. OTHER INFORMATION
PUBLIC HOLIDAYS
113 114
(Cont'd)
2011 2012
PHILIPPINESA. Regular Holidays New Year's Day 01 Jan 01 JanMaundy Thursday 21 Apr 05 AprGood Friday 22 Apr 06 AprAraw ng Kagitingan 09 Apr 09 AprLabour Day 01 May 01 MayIndependence Day 12 Jun 12 JunEnd of Eid-ul-Fitre 31 Aug 19 AugNational Heroes' Day 30 Aug 30 AugEid-ul Adha 07 Nov 26 OctBonifacio Day 30 Nov 30 NovChristmas Day 25 Dec 25 DecRizal Day 30 Dec 30 DecB. Special Holidays (Non-Working Holidays) Ninoy Aquino Day 21 Aug 21 AugAll Saint's Day 01 Nov 01 NovLast Day of the Year 31 Dec 31 Dec
SOUTH KOREANew Year's Day 01 Jan 01 JanLunar New Year (Seol) 02 Jan 23 Jan
03 Feb 24 Jan 04 Feb -
Independent Movement Day 01 Mar 01 MarBuddha's Birthday 10 May 28 MayChildren's Day 05 May 05 MayMemorial Day 06 Jun 06 JunLiberation Day 15 Aug 15 AugNational Foundation Day 03 Oct 03 OctFull Moon Day (Chuseok) 11 Sep 29 Sep
12 Sep 30 Sep 13 Sep 01 Oct
Christmas Day 25 Dec 25 Dec
2011 2012
SINGAPORENew Year's Day 01 Jan 01 Jan@
Chinese New Year 03 Feb 23 Jan 04 Feb 24 Jan
Good Friday 22 Apr 06 AprLabour Day 01 May 01 MayVesak Day 17 May 05 MayNational Day 09 Aug 09 AugHari Raya Puasa 30 Aug 19 Aug@
Deepavali * 26 Oct 13 NovHari Raya Haji 06 Nov 26 OctChristmas Day 25 Dec 25 Dec
* Subject to change.@ The following Monday will be a public holiday.
TAIWANFounding Day 01 Jan 01 JanLunar New Year's Eve 02 Feb 22 JanLunar New Year's Day 03 Feb 23 JanThe 2nd day of Lunar New Year 04 Feb 24 JanThe 3rd day of Lunar New Year 05 Feb 25 JanThe 4th day of Lunar New Year 06 Feb 26 JanThe first weekday after Lunar New Year 07 Feb -Public Holiday - 27 Jan *Public Holiday - 27 Feb @
Peace Memory Day 28 Feb 28 FebWomen Day and Children's Day 04 Apr 04 AprChing Ming Festival 05 Apr 04 AprLabour Day 01 May 01 MayDragon Boat Festival 06 Jun 23 JunMid-Autumn Festival 12 Sep 30 SepDouble Ten Day 10 Oct 10 OctPublic Holiday - 31 Dec #
* As 4-Feb. is adjusted to work, this day is adjusted to holiday@ As 3-Mar. is adjusted to work, this day is adjusted to holiday# As 22-Dec. is adjusted to work, this day is adjusted to holiday

5. OTHER INFORMATION
PUBLIC HOLIDAYS
115 116
2011 2012
THAILAND
New Year's Day 03 Jan 02 Jan1
Chinese New Year * 03 Feb 23 JanMakha Bucha Day 18 Feb 07 MarChakri Memorial Day 06 Apr 06 AprSongkran Festival 13 Apr 13 Apr
14 Apr 14 Apr 15 Apr 15 Apr
- 16 Apr2
National Labour Day 02 May 01 MayCoronation Day 05 May 07 May3
Visakha Bucha Day 17 May 04 JunRoyal Ploughing Ceremony Day + 13 May 09 MayMid Year Bank Holiday @ 01 Jul 01 JulAsarnha Bucha Day 15 Jul 02 AugKhao Phansa Day (Buddhist Lent Day) + 18 Jul 03 AugH.M. The Queen's Birthday 12 Aug 13 Aug4
Chulalongkorn Day 24 Oct 23 OctH.M. The King's Birthday 05 Dec 05 DecConstitution Day 12 Dec 10 DecNew Year's Eve 31 Dec 31 Dec
* Unofficial Chinese Community only@ Banks only+ Government only1 - Substitute for 31 December 2011 (Saturday) and 01 January 2012 (Sunday)2 - Substitute for 14 April 2012 (Suturday) and 15 April 2012 (Sunday)3 - Substitute for 05 May 2012 (Saturday)4 - Substitute for 12 August 2012 (Sunday)
2011 2012
VIETNAM
Normal Scheduled Holidays Solar New Year 03 Jan 02 Jan*Lunar New Year 03 Feb 23 Jan
04 Feb 24 Jan 07 Feb 25 Jan
- 26 Jan#
Hung Vuong King Celebration 12 Apr 02 Apr@
Liberation Day of Saigon 02 May 30 AprInternational Labour Day 03 May 01 MayNational Day 02 Sep 03 SepΩ
Christmas Day 25 Dec 25 Dec
* Substitute for 1 January 2012 (Sunday)# Substitute for 22 January 2012 (Sunday)@ Substitute for 31 March 2012 (Saturday)Ω Substitute for 02 September 2012 (Sunday)

5. OTHER INFORMATION
DAVIS LANGDON & SEAH PROFESSIONAL SERVICES
Project Types :
New-build
Maintenance and alteration
Infrastructure and civil engineering
M&E building services
Fitting-out
Normal Services :
Feasibility studies
Preliminary cost advice and planning
Analysis of cost/design options
Advice on best-fit procurement and contractual arrangements
Cash flow projections
Contractor pre-qualification
Preparation of tender documents
Negotiation with contractors
Contract documents
Visiting site and valuation of works in progress
Assessing the cost of proposed variations
Attending site and other meetings
Preparation of regular financial reports
Settlement of final cost with contractors and sub-contractors
Advice on contractors' claims
Special Services :
Value engineering
Lender's agent
Reinstatement assessments for fire insurance
Asset registers and depreciation calculations
Project Monitoring
Due diligence studies
Legal support
Expert witness
Project management
Life cycle costing
117 118

5. OTHER INFORMATION
DLS Infrastructure Team is a distinct unit within Davis Langdon and Seah, which specializes in providing cost and procurement management services to the transport and infrastructure sectors of the construction industry.
The core service sectors served by this unit are rail, road and airports.
The team typically works as part of multi-disciplinary design teams in dedicated project offices.
The core services provided by the Infrastructure Team include: -
Initial Feasibility Studies Providing initial project cost advice to major infrastructure projects, quantified estimates of civil, structural, architectural and building services.
Detailed Design Pre and Post Contract ServicesPreparing Schematic Design Estimates and Detailed Design Estimates, estimates on alternatives, tender documentation, pre-tender estimates and post contract financial control and reporting.
Specialist Construction Technique AdviceThe team is experienced in working closely with civil and structural engineers to advise on costs for specialist construction techniques such as: -
Tunneling in rock and soft ground conditions
Underground / Above-ground stations
Rail viaduct construction
Bridge construction
Noise mitigation
Diaphragm walling and other specialist foundation and ground treatment works
Marine land reclamation
Specialist rail M&E and systems services, including tunnel ventilation, power and control
Airport systems and ground field services
Ports
Value Engineering StudiesProject-related and product-related research studies into cost, value and time benefits of various design options. The infrastructure team has developed its own discrete historical database which is available to supplement real-time cost analysis.
Contractual SolutionsIndependent advice and contractual solutions relating to all aspects of the infrastructure market.
119 120
DLS INFRASTRUCTURE TEAM

5. OTHER INFORMATION
The DLS Interior Fitting-Out Team is a dedicated un i t w i th in Dav is Langdon and Seah wh ich specializes in providing both Quantity Surveying and Project Management Services for interior fitting-out projects.
The team has developed a particular expertise in financial sector fit-outs, but also works extensively on office, retail, hospitality and telecommunication projects.
Quantity Surveying Services
As a supplement to our traditional Quantity Surveying Services, the team has the expertise to provide up-to-date knowledge and information on fitting-out projects and can advise tenants, occupiers, building owners, project managers and interior designers on:
Elemental cost of fitting-out works
Cost analysis of functional areas
Comparative cost advice on alternative materials, systems and methods
Key fitting-out cost drivers and design issues
Programme/build-out rates
Procurement methods
Contractor/trade contractor database
Project Management Services
The team has the experience and expertise to provide all aspects of project management services to fitting-out projects including due diligence, feasibility studies, value engineering, budget development, end-user co-ordination, design co-ordination, programming, procurement management, construction and site management, move management etc.
Providing a cost effective and independent service, the team manages client input, integrates and co-ordinates the different disciplines and handles external expertise and resources to achieve the project objectives.
The team has in place proven systems and management procedures including detailed project programming skills, construction documentation, cost planning, critical path analysis to ensure:
Project objectives are achieved by completing on time, within the approved cost and to the required quality standards.
Communications with end-users, client representatives, stakeholders, other consultants and contractors are maintained throughout the duration of the project.
121 122
DLS INTERIOR FITTING OUT TEAM

5. OTHER INFORMATION
Project Monitoring is a distinct extension from our core business in cost management services. Our specialized Project Monitoring Team is a selection of proactive and versatile quantity surveying and project management professionals who are fully acquainted with the intricacies of the development, design and construction process and understand the underlying key value drivers. The very purpose of this dedicated unit is to “protect the Client’s interest by identifying and advising on the risks associated with acquiring an interest in a development that is not under the Client’s direct control”.
The team has the experience and expertise to act as an investigator and advisor to Clients such as:- funding institutions, which will acquire the scheme as
an investment upon completion; or tenants or purchasers which enter into a commitment
to lease or purchase a property upon completion; or banks or other financiers where a loan matures at the
end of the development period; grant funders; or private finance initiative funders and end users
With the Project Monitor as their “eyes and ears” during the development process, the Clients would have: enhanced risk control; enhanced cost control; enhanced programme control; and enhanced quality control.
Project Monitoring services can broadly be broken down into two stages:-Stage 1: Initial Due DiligenceStage 2: Monitoring
Initial Due DiligenceThis comprises a comprehensive audit and examination of the scheme, generally carried out prior to the commencement of the construction on site.
The following aspects of the scheme to be monitored will be checked and appraised as appropriate:-
Development appraisal Development cash flow Construction cash flow Design information - drawings, specifications,
performance information Construction information quality - scope and breadth
of information Proposed project team - competency, track record,
reputation, suitability Project team appointments - scope of service, fee
levels, etc Construction cost appraisal Programme - development and construction
programme Procurement route - both development level and site
level Technical reports and investigations Insurance provisions - construction, design, site
insurances, etc Statutory approvals and requirements Statutory authority services issues Legal issues - warranties, step in provision into
contracts Construction contract provision - suitability, scope,
status Health and safety strategy and administrative
compliance
The report to be produced at this initial due diligence stage will provide a complete picture of the development on its cost, time, quality and project team. The Project Monitor will advise the Client on the risks associated with the development and provide recommendations on how to address said risks.
DLS PROJECT MONITORING TEAM
(Cont'd)
123 124

5. OTHER INFORMATION
Monitoring
As this second stage of the project monitoring remit, a more cyclical approach is taken to the now active scheme.
Generally monthly or at other agreed intervals, the Project Monitor will visit the site and meet relevant project team members to gather and analyse pertinent information including, inter alia, contractor's reports, developer/project manager's reports, architect's and other consultants' reports and to produce a Periodic Monitoring Report which addresses:- Progress against programme Financial positions against budgeted allowance Any variations or additional items instructed/anticipated General quality standards Progression of any issues outstanding in the initial due
diligence report, or the previous monitoring report
The monitoring report should further consider other related concern if necesarry, such as:-
Insurances - in place and up to date Warranty status Planning condition Building regulation status Health and safety issues General labour levels and productivity to gauge
progress against cash flow and programme Prevailing condition and organization of the site
Generally, the purpose of the monitoring report (or interim report) is to give the Client a view as to the progress and status of the scheme each period, along with an assessment of the construction cash flow, expenditure and cost to complete for the project.
No two Clients will require exactly the same Project Monitoring services coverage. DLS will fully discuss and explore with each Client in the light of the Client’s purpose and the particulars of the development to understand the key concerns and requirement and agree upon a bespoke scope of services “best fit for the purpose”.
The DLS Sustainability Services Team is a dedicated unit within Davis Langdon and Seah specializing in providing services for sustainability issues.
The achievement of ‘green’ buildings can be recognized and certified by joining the voluntary assessment schemes administered by independent organizations.
Two of the more familiar assessment schemes and green building labelling systems currently adopted in Hong Kong are:-
1. Hong Kong Building Environmental Assessment Method (BEAM Plus) developed by the BEAM Society which is a locally based organization.
2. Leadership in Energy and Environmental Design (LEED) developed by the U.S. Green Building Council which is perhaps a more popular rating system globally.
Hong Kong Building Environmental Assessment Method (BEAM Plus)
The assessment method covers development of both new and existing buildings and BEAM Plus Version 1.1 is the latest version launched in April 2010. The various performance aspects covered are grouped within the following categories and credits are assigned for individual items under each category:-1. Site Aspects (SA)2. Materials Aspects (MA)3. Energy Use (EU)4. Water Use (WU)5. Indoor Environmental Quality (IEQ)6. Innovations and Additions (IA)
There are four levels of award classifications:-1. Platinum (Excellent)2. Gold (Very Good)3. Silver (Good)4. Bronze (Above Average)
DLS PROJECT MONITORING TEAM
125 126
DLS SUSTAINABILITY SERVICES TEAM
(Cont'd)

5. OTHER INFORMATION
The overall assessment grade is based on the percentage of applicable credits obtained. As BEAM Plus stresses the importance of Site Aspects (SA), Energy Use (EU) and Indoor Environmental Quality (IEQ), there is a minimum percentage of credits for SA, EU and IEQ needed to be achieved to qualify for the overall grade.
Further details on BEAM Plus can be found at their web site http://www.hk-beam.org.hk.
Leadership in Energy and Environmental Design (LEED)
LEED rating systems include New Construction (NC), Commercial Interiors (CI), Core and Shell (CS), Existing Buildings (EB), Homes and Neighbourhood Development. There are also market sector rating systems for Schools, Multi-building/Campuses, Retail, Healthcare and Laboratories.
Again, the certification is divided into four levels:-
1. Platinum2. Gold3. Silver4. Certified
The following credit categories are applicable to all LEED rating systems:-
1. Sustainable Sites (SS)2. Water Efficiency (WE)3. Energy and Atmosphere (EA)4. Materials and Resources (MR)5. Indoor Environmental Quality (IEQ)6. Innovation in Design (ID)7. Innovation in Operations (IO)8. Regional Priority (RP)
The certification level depends on the points achieved. However, there are specific prerequisites in the Sustainable Sites (SS), Water Efficiency (WE), Energy and Atmosphere (EA), Materials and Resources (MR) and Indoor Environmental Quality (IEQ) sections which must be obtained.
Further information on LEED can be found at the US Green Building Council’s web site http://www.usgbc.org.
DLS's Involvement in Sustainability Services
DLS’s sustainability services are summarized as follows:-
1. Preparing capital cost estimates for the design as prepared by the Architect/Engineer, with separately identifiable line items for each specific green provision.
2. Life cycle costing - calculating maintenance and energy consumption costs over the life span of a building.
3. Cost benefit analysis - comparing initial capital costs of green provisions against the associated benefits achieved during the building’s life.
4. Procurement of green provisions - recommending contract packaging and tendering strategy for green provisions. Drafting tender documents for procurement.
5. Project cost reporting - regular financial reporting during the design and construction phases to ensure pre-agreed budgets for green initiatives are met.
DLS SUSTAINABILITY SERVICES TEAM
127 128

5. OTHER INFORMATION
DIRECTORY OF OFFICES
(Cont'd)
CHINAHONG KONGDAVIS LANGDON & SEAH HONG KONG LIMITEDDAVIS LANGDON & SEAH CHINA LIMITEDDLS MANAGEMENT LIMITED38/F Two Landmark East100 How Ming StreetKwun Tong, KowloonHong KongTel : (852) 2830 3500Fax : (852) 2576 0416Email : [email protected] : www.dlsqs.com Contact : Lee Ying Kee, Joseph
BEIJINGDAVIS LANGDON & SEAH (BEIJING) CONSTRUCTION CONSULTANTS CO. LTD.Suite 1225 - 1238Junefield Plaza, Central Tower South10 Xuan Wu Men Wai StreetBeijing 100052ChinaTel : (86 10) 6310 1136Fax : (86 10) 6310 1143Email : [email protected] : Chan Chi Keung, Andrew
CHENGDUDAVIS LANGDON & SEAH CONSULTANCY (CHENGDU) CO. LTD.Room 807, Block ATimes Plaza2 Zong Fu RoadChengdu, Sichuan Province 610016ChinaTel : (86 28) 8671 8373Fax : (86 28) 8671 8535Email : [email protected] : Chan Hoi Or, Joe
CHONGQINGDAVIS LANGDON & SEAH CHINA LIMITED CHONGQING REPRESENTATIVE OFFICERoom 3408, International Trade Centre38 Qing Nian RoadCentral DistrictChongqing City 400010ChinaTel : (86 23) 8655 1333Fax : (86 23) 8655 1616Email : [email protected] : Chan Hoi Or, Joe / Lin Wai Yip, Gary
DALIANDAVIS LANGDON & SEAH (BEIJING) CONSTRUCTION CONSULTANTS CO. LTD. DALIAN BRANCHUnit 07, 32F, Xiwang Tower136 Zhongshan RoadZhongshan DistrictDalian, Liaoning Province 116001ChinaTel : (86 411) 8800 8018Fax : (86 411) 8800 8823Email : [email protected] : Ng Kin Kan, Kenn
FOSHANDAVIS LANGDON & SEAH CONSULTANCY (SHENZHEN) CO. LTD. FOSHAN BRANCHUnit 1803 Room 218/F Hua Hui Mansion46 Zu Miao RoadFoshan, Guangdong Province 528000ChinaTel : (86 757) 8203 0028Fax : (86 757) 8203 0029Email : [email protected] : Wong Wing Cheng, Jack
129 130
ASIA PACIFIC

5. OTHER INFORMATION
GUANGZHOUDAVIS LANGDON & SEAH CONSULTANCY (SHENZHEN) CO. LTD. GUANGZHOU BRANCHUnit 2711 - 2713 & 2718Bank of America Plaza555 Ren Min Zhong RoadGuangzhou, Guandong Province 510145ChinaTel : (86 20) 8130 3813Fax : (86 20) 8130 3812Email : [email protected] : Wong Wing Cheng, Jack
HANGZHOUDAVIS LANGDON & SEAH CONSULTANCY (SHANGHAI) CO. LTD. HANGZHOU BRANCHRoom 2305, WinNing International100 Min Xin RoadHangzhou, Zhejiang Province 310016ChinaTel : (86 571) 2829 7766Fax : (86 571) 2829 7622Email : [email protected] : Lai Pak Hung
MACAUDAVIS LANGDON & SEAH MACAU LIMITED14 Andar BEdifacio Commercial Rodrigues599 Avenida da Praia Grande MacauTel : (853) 2833 1710Fax : (853) 2833 1532Email : [email protected] : Chan Yuk Sim, Katherine
SANYADAVIS LANGDON & SEAH CONSULTANCY (SHENZHEN) CO. LTD. SANYA BRANCH1206 Skyline Tower119 Yingbin RoadSanya, Hainan Province 572000ChinaTel : (86 898) 3828 0878Fax : (86 898) 3828 0678Email : [email protected] : Lee Kwok Wing, Dickey
SHANGHAIDAVIS LANGDON & SEAH CONSULTANCY (SHANGHAI) CO. LTD.Room 1582, Tower BCity Centre of Shanghai100 Zun Yi RoadShanghai 200051ChinaTel : (86 21) 6091 2800Fax : (86 21) 6091 2999Email : [email protected] : Lai Pak Hung
SHENYANGDAVIS LANGDON & SEAH (BEIJING) CONSTRUCTION CONSULTANTS CO. LTD. SHENYANG BRANCHRoom 8-9, 11/FE Tower of Fortune Plaza59 Beizhan RoadShenhe DistrictShenyang City, Liaoning Province 110013ChinaTel : (86 24) 3128 6678Fax : (86 24) 3128 6983Email : [email protected] : Kwok Hiu Larm, Frank / Chow Hau Ming, Simon
(Cont'd)
131 132
DIRECTORY OF OFFICES
ASIA PACIFIC (Cont'd)

5. OTHER INFORMATION
SHENZHENDAVIS LANGDON & SEAH CONSULTANCY (SHENZHEN) CO. LTD.Room E & F, 42/FWorld Finance Centre, Block A4003 East Shennan RoadShenzhen, Guangdong Province 518001ChinaTel : (86 755) 8269 0642Fax : (86 755) 8269 0641Email : [email protected] : Lo Kwok Chu, Kenneth
SUZHOUDAVIS LANGDON & SEAH CONSULTANCY (SHANGHAI) CO. LTD. SUZHOU BRANCHRoom 1606, Century Financial Tower1 Suhua Road, Industrial ParkSuzhou, Jiangsu Province 215021ChinaTel : (86 512) 8777 5599Fax : (86 512) 8777 5600Email : [email protected] : Lai Pak Hung / Zhang Rui
TIANJINDAVIS LANGDON & SEAH CONSULTANCY CO. LTD. TIANJIN BRANCH4002, 40/FTianjin World Financial Centre Office Tower2 Dagubei RoadHeping DistrictTianjin 300020 ChinaTel : (86 22) 2329 9611Fax : (86 22) 2319 3186Email : [email protected] : Wong Chin Ying
(Cont'd)
133 134
DIRECTORY OF OFFICES
WUHANDAVIS LANGDON & SEAH CONSULTANCY (SHANGHAI) CO. LTD. WUHAN BRANCHRoom B, 5th Floor2-1 Building, Wuhan Tiandi68 Lu Gou Qiao RoadWuhan City, Hubei Province 430010ChinaTel : (86 27) 5920 9299Fax : (86 27) 5920 9298Email : [email protected] : Lee Kwok Wing, Dickey
BRUNEIBANDAR SERI BEGAWANDAVIS LANGDON & SEAHJURUUKUR BAHAN UTAMA - DLSUnit 25, BT Complex, Kg. Jaya SetiaMukim Berakas 'A' BB2713Bandar Seri Begawan BS8670Negara Brunei DarussalamGPS : 4.9394, 114.9377Tel : (673) 233 2833Fax : (673) 233 2933Email : [email protected] : Shafie Yusof / Justin Teoh
KUALA BELAITPETROKON UTAMA SDN BHD3rd Floor, Hong Kong Bank ChambersJalan McKerronP.O. Box 811Kuala Belait KA1131Negara Brunei DarussalamTel : (673) 333 5718Fax : (673) 333 5717Email : [email protected] : Shafie Yusof
ASIA PACIFIC (Cont'd)

5. OTHER INFORMATION
HYDERABADDAVIS LANGDON & SEAH CONSULTING INDIA PVT. LTD.2nd Floor, Trade Fair OfficeHitex Exhibition CenterIzzat NagarHyderabad 500084IndiaTel : (91 40) 2311 4942Fax : (91 40) 2311 2942Email : [email protected] : Jim Pollock / Lorimer Doig / Ramamurthi Karthikeyan
MUMBAIDAVIS LANGDON & SEAH CONSULTING INDIA PVT. LTD.1204/5/6, Maithili's SignetPlot No. 39/4, Sector No. 30AVashiNavi Mumbai 400703IndiaTel : (91 22) 4156 8686Fax : (91 22) 4156 8615Email : [email protected] : Jim Pollock / Lorimer Doig / Darshan Joshi
PUNEDAVIS LANGDON & SEAH CONSULTING INDIA PVT. LTD.Office No. 02/A, 'Arvind Apartment'First Floor, CTS 1130/31, Survey No. 93Fergusson College RoadNear Dyaneshwar Paduka ChowkShviagnagarPune 411005IndiaTel : (91 20) 2551 4980Contact : Lorimer Doig
(Cont'd)
135 136
DIRECTORY OF OFFICES
INDIABANGALOREDAVIS LANGDON & SEAH CONSULTING INDIA PVT. LTD.3rd Floor, Raheja ChanceryNo. 133 Brigade RoadBangalore 560025IndiaTel : (91 80) 4123 9141Fax : (91 80) 4123 8922Email : [email protected] : Jim Pollock / Lorimer Doig / Velan Murali / Biju AK
CHENNAIDAVIS LANGDON & SEAH CONSULTING INDIA PVT. LTD.New No. 125 (Old No. 63)Jammi Building, 1st FloorRoyapettah High RoadMylaporeChennai 600004IndiaTel : (91 44) 2498 8141Fax : (91 44) 2498 8137Email : [email protected] : Jim Pollock / Lorimer Doig / Sankar Ramakrishnan
DELHIDAVIS LANGDON & SEAH CONSULTING INDIA PVT. LTD.The Elements2nd Floor, Unit No. 465Udyog Vihar, Phase-VGurgaon, Haryana 122016IndiaTel : (91 124) 4430 8790Fax : (91 124) 4430 8793Email : [email protected] : Jim Pollock / Lorimer Doig / Arun Basu
ASIA PACIFIC (Cont'd)

5. OTHER INFORMATION
JOHORDAVIS LANGDON & SEAH (MALAYSIA) SDN BHDJURU UKUR BAHAN MALAYSIAJUBM SDN BHDDLS PROJEKS SDN BHD47 Jalan Setia Tropika 1/30Taman Setia Tropika81200 Johor BahruJohor Darul TakzimMalaysiaTel : (60 7) 232 8300Fax : (60 7) 232 8232Email : [email protected] : Syed Mahadzir Syed Ahmad
PENANGDAVIS LANGDON & SEAH (MALAYSIA) SDN BHDJURU UKUR BAHAN MALAYSIAJUBM SDN BHDDLS PROJEKS SDN BHDSuite 3A-3, Level 3AWisma Great EasternNo. 25, Lebuh Light10200 PenangMalaysiaTel : (60 4) 264 2071 / 264 2072 / 264 2073Fax : (60 4) 264 2068Email : [email protected] : Mohd Faiz Awang
SABAHDAVIS LANGDON & SEAH (MALAYSIA) SDN BHDJURU UKUR BAHAN MALAYSIAJUBM SDN BHDDLS PROJEKS SDN BHDSuite 8A, 8th Floor, Wisma PendidikanJalan PadangP.O. Box 11598, 88817 Kota KinabaluSabahMalaysiaTel : (60 88) 223 369Fax : (60 88) 216 537Email : [email protected] : Ang Kun Eng (Cont'd)
137 138
ASIA PACIFIC (Cont'd)
DIRECTORY OF OFFICES
INDONESIAJAKARTAP.T. DAVIS LANGDON & SEAH INDONESIALevel 18Ratu Plaza Office TowerJalan Jenderal Sudirman 9Jakarta 10270IndonesiaTel : (62 21) 739 7550Fax : (62 21) 739 7846Email : [email protected] : Peter Robinson / Stephen Osborne
BALIP.T. DAVIS LANGDON & SEAH INDONESIAJalan Sunset Road No. 8CLingkungan Abian BaseBali 80361IndonesiaTel : (62 361) 894 7517Fax : (62 361) 894 7392Email : [email protected] : Ir. Putu Arya Canti
MALAYSIASELANGORDAVIS LANGDON & SEAH (MALAYSIA) SDN BHDJURU UKUR BAHAN MALAYSIAJUBM SDN BHDDLS PROJEKS SDN BHD2, Jalan PJU 5/15Kota Damansara47810 Petaling JayaSelangor Darul EhsanMalaysiaTel : (60 3) 6156 9000Fax : (60 3) 6157 8660Email : [email protected] : Loo Ming Chee / Mohd Ali Abd Karim / Justin Teoh / Mohd Faiz Awang / Nur Aziz Abu Bakar

5. OTHER INFORMATION
SINGAPOREDAVIS LANGDON & SEAH SINGAPORE PTE LTDDAVIS LANGDON & SEAH PROJECT MANAGEMENT PTE LTDDLS CONTRACT ADVISORY & DISPUTE MANAGEMENT SERVICES1 Magazine Road#05-01 Central MallSingapore 059567Tel : (65) 6222 3888Fax : (65) 6224 7089Email : [email protected] : Jim Pollock / Goh Chok Sin / Eugene Seah
SOUTH KOREASEOULDAVIS LANGDON & SEAH KOREA CO LTD#429 G-Five Central Plaza1685-8 Seocho 4-DongSeocho-GuSeoul 137-882KoreaTel : (82 2) 543 3888Fax : (82 2) 543 3898Email : [email protected] / [email protected] : Goh Chok Sin / Victor Stanger
THAILANDBANGKOKDAVIS LANGDON & SEAH (THAILAND) LTDLECE (THAILAND) CO LTD10th Floor, Kian Gwan Building II140/1 Wireless RoadLumpinee, PratumwanBangkok 10330, ThailandTel : (66 2) 253 1438, 651 4120-2Fax : (66 2) 253 4977Email : [email protected] : Leong Choong Peng / Ang Yen Kooi / Wong Soon Bin
SARAWAKJUBM SDN BHDNo. 2 (3rd Floor), Jalan Song Thian Cheok93100 KuchingSarawakMalaysiaTel : (60 82) 232 212Fax : (60 82) 232 198Email : [email protected] : Nor Azman Bin Baharum
PAKISTANKARACHIDAVIS LANGDON & SEAH PAKISTAN (PRIVATE) LIMITED18C, Nishat Commercial Lane 4Khayaban-e-Bukhari, Phase 6, DHAKarachi 75500PakistanTel : (92 21) 3524 0191-94Fax : (92 21) 3524 0195Email : [email protected] Contact : Nur Aziz Abu Bakar / Zaharudin Yusof
PHILIPPINESMANILADAVIS LANGDON & SEAH PHILIPPINES INC4th & 7th Floor, Kings Court 12129 Pasong TamoMakati City 1231PhilippinesTel : (63 2) 811 2971Fax : (63 2) 811 2071Email : [email protected] Contact : Alan Philip Hearn
(Cont'd)
139 140
ASIA PACIFIC (Cont'd)
DIRECTORY OF OFFICES

5. OTHER INFORMATION
(Cont'd)
141 142
ASIA PACIFIC (Cont'd)
DIRECTORY OF OFFICES
VIETNAMHANOIDAVIS LANGDON & SEAH VIETNAM CO LTD4th Level Thanh Dong Building132-138 Kim Ma StreetBa Dinh DistrictHanoiVietnamTel : (844) 3942 7525Fax : (844) 3942 7526Email : [email protected] : Mark Olive
HO CHI MINH CITYDAVIS LANGDON & SEAH VIETNAM CO LTD9th Level, Unit E-VTP Building08 Nguyen Hue, District 1Ho Chi Minh CityVietnamTel : (848) 3823 8297Fax : (848) 3823 8197Email : [email protected] : Mark Olive
SOUTH AFRICAJOHANNESBURG (PARKTOWN)DAVIS LANGDONDAVIS LANGDON SCHUMANN SMITHDAVIS LANGDON BUILDING SERVICESDAVIS LANGDON PROJECT MANAGEMENT2nd Floor, Citibank Plaza Building145 West StreetSandton 2196JohannesburgSouth AfricaTel : (27 11) 666 2000Fax : (27 11) 650 0711Email : [email protected] : Indresen Pillay
Also at : Bloemfontein, Cape Town, Durban, Gaborone (Botswana), George, Klerksdorp, Maputo (Mozambique), Nelspruit, Nigeria, Pietermaritzburg, Port Elizabeth, Pretoria and Stellenbosch
EGYPTCAIRODAVIS LANGDON EGYPT LLCGround Floor, Corner Road23 El Sharifa Dina StreetBuilding 13, MaadiHelwanEgyptTel : (20 2) 2750 8145 Fax : (20 2) 2750 8146Email : [email protected] : Kevin Sims / Chris du Toit
AFRICA
(Davis Langdon & Seah collaborates with Davis Langdon in Europe, Middle East, Africa, USA, Australia and New Zealand)

5. OTHER INFORMATION
(Cont'd)
143 144
DIRECTORY OF OFFICES
AUSTRALASIA
AUSTRALIAMELBOURNEDAVIS LANGDONLevel 4580 Collins StreetMelbourne Victoria 3000AustraliaTel : (61 3) 9933 8800Fax : (61 3) 9933 8801Email : [email protected] : Bob Hunt
Also at : Adelaide, Brisbane, Cairns, Canberra, Darwin, Hobart, Perth, Sydney and Townsville
NEW ZEALANDAUCKLANDDAVIS LANGDON NEW ZEALAND LTDLevel 10Citigroup Centre23 Customs Street EastP.O. Box 935Auckland 1140New ZealandTel : (64 9) 379 9903Fax : (64 9) 309 9814Email : [email protected] : Chris Sutherland
Also at : Christchurch and Wellington
EUROPE
GERMANYMUNICHDEGW (PART OF DAVIS LANGDON)Heimeranstrasse 3780339 MunichGermanyTel : (49 89) 452 3383-0Fax : (49 89) 452 3383-99Email : [email protected] : Axel Praus
IRELANDDUBLINDAVIS LANGDON24 Lower Hatch StreetDublin 2IrelandTel : (353 1) 676 3671Fax : (353 1) 676 3672Email : [email protected] : www.dlpks.ieContact : Norman Craig
Also at : Cork, Galway and Limerick
ITALYMILANDEGW (PART OF DAVIS LANGDON)Via Lombardini, 2220143 MilanoItaliaTel : (39 02) 5410 1343Fax : (39 02) 5990 2213Email : [email protected] : Franco Guidi

5. OTHER INFORMATION
(Cont'd)
145 146
DIRECTORY OF OFFICES
NETHERLANDSAMSTERDAMDEGW (PART OF DAVIS LANGDON)Herengracht 124 - 1281015 BT AmsterdamNetherlandsTel : (31 6) 5364 8131Email : [email protected] : Salla Lardot
UNITED KINGDOMLONDONDAVIS LANGDONDAVIS LANGDON BANKING TAX & FINANCEDAVIS LANGDON ENGINEERING SERVICESDAVIS LANGDON SCHUMANN SMITH SPECIFICATION
CONSULTINGDEGW (PART OF DAVIS LANGDON)MidCity Place71 High HolbornLondon WC1V6QSUnited KingdomTel : (44 20) 7061 7000Fax : (44 20) 7061 7061Email : [email protected] : www.davislangdon.comContact : Jeremy Horner
Also at : Birmingham, Bristol, Cambridge, Cardiff, Edinburgh, Glasgow, Heathrow, Leeds, Liverpool, Maidstone, Manchester, Norwich, Oxford, Peterborough, Plymouth and Southampton
EUROPE (Cont'd)
SPAINMADRIDDAVIS LANGDONCalle Serrano98-2nd Floor28006 MadridSpainTel : (34 91) 431 0290Fax : (34 91) 576 9221Email : [email protected] : Jon Blasby
MIDDLE EAST
BAHRAINMANAMADAVIS LANGDONAl Saffar HouseUnit 22B, Building No. 1042Block 436, Road 3621Seef DistrictP.O. Box 640Manama, Kingdom of BahrainTel : (973 17) 588 796Fax : (973 17) 581 288Email : [email protected] : Donn O'Shaughnessy
LEBANONBEIRUTDAVIS LANGDON LEBANON1st Floor, Chatilla BuildingAustralia StreetRawche, ShouranP.O. Box 13-5422 - ShouranBeirut, LebanonTel : (961 1) 780 111Fax : (961 1) 809 045Email : [email protected] : Muhyiddin Itani

5. OTHER INFORMATION
(Cont'd)
147 148
DIRECTORY OF OFFICES
MIDDLE EAST (Cont'd)
QATARDOHADAVIS LANGDONSalwa Commercial Complex Building1st Floor, Behind Al Seal BuildingSalwa RoadP.O. Box 3206DohaState of QatarTel : (974) 4458 0150Fax : (974) 4469 7905Email : [email protected] : Steven Humphrey
UNITED ARAB EMIRATES (UAE)ABU DHABIDAVIS LANGDONAl Jazira Sports and Cultural ClubMurooj Road, 4th StreetP.O. Box 43266Abu DhabiUnited Arab EmiratesTel : (971 2) 414 6000Fax : (971 2) 414 6001Email : [email protected] : Steven Coates
NORTH AMERICA
UNITED STATES OF AMERICALOS ANGELESDAVIS LANGDON 301 Arizona AvenueSuite 301Santa MonicaCA 90401, USATel : (1 310) 393 9411Fax : (1 310) 393 7493Email : [email protected] : Nicholas Butcher
Also at : Boston, Denver, Honolulu, Houston, New York, Philadelphia, Sacramento, San Francisco, Seattle and Washington DC

5. OTHER INFORMATION
149 146
TELEPHONE DIRECTORY
Refer to http://tel.directory.gov.hk for further information.
HONG KONG GOVERNMENT
Architectural Services Department Headquarters Administration Division 2867 3628 Architectural Branch Advisory & Statutory Compliance Division 2867 3759 Architectural Drawing Records Unit 2867 3691 Division 1 2867 3935 Division 2 2867 3814 Site Staff (New Works) 2867 3992 Technical Officer (Architectural) Grade Management Unit 2867 3691 Building Services Branch Division 1 2867 3538 Division 2 2867 3493 Division 3 2867 3629 Division 4 2867 4156 Property Services Branch 2773 2217 Quantity Surveying Branch 2867 3298/2867 4597 Structural Engineering Branch 2867 3791Buildings Department 2626 1616Census and Statistics Department 2582 4807Civil Engineering and Development Department 2762 5111Customs and Excise Department 2815 7711Drainage Services Department 2877 0660Electrical and Mechanical Services Department 1823Environmental Protection Department 2594 6308Fire Services Department 2311 0066Government Laboratory 2762 3700Government Property Agency 2594 7604Highways Department 2926 4111Housing Department 2712 2712Labour Department 2717 1771Lands Department 2231 3294Planning Department 2231 5000Rating and Valuation Department 2152 0111Water Supplies Department 2824 5000

38/F Two Landmark East100 How Ming Street, Kwun Tong, Kowloon, Hong Kong
Tel: (852) 2830 3500 Fax: (852) 2576 0416Email: [email protected] Website: www.dlsqs.com