dmas’ role in the public mental ... -...
TRANSCRIPT
JOINT SUBCOMMITTEE TO STUDY MENTAL HEALTH
SERVICES IN THECOMMONWEALTH IN THE
21ST CENTURY
SYSTEM STRUCTURE & FINANCING WORK GROUP #1
ANN F. BEVAN, DIRECTORDIVISION OF DEVELOPMENTAL DISABILITIES AND
BEHAVIORAL HEALTHDEPARTMENT OF MEDICAL ASSISTANCE SERVICES
DMAS’ Role in the Public Mental Health System
The DMAS Mission
2
Continuous ImprovementSuperior Care Cost Effective
Ensure Virginia’s Medicaid Enrollees
Receive Quality Health Care
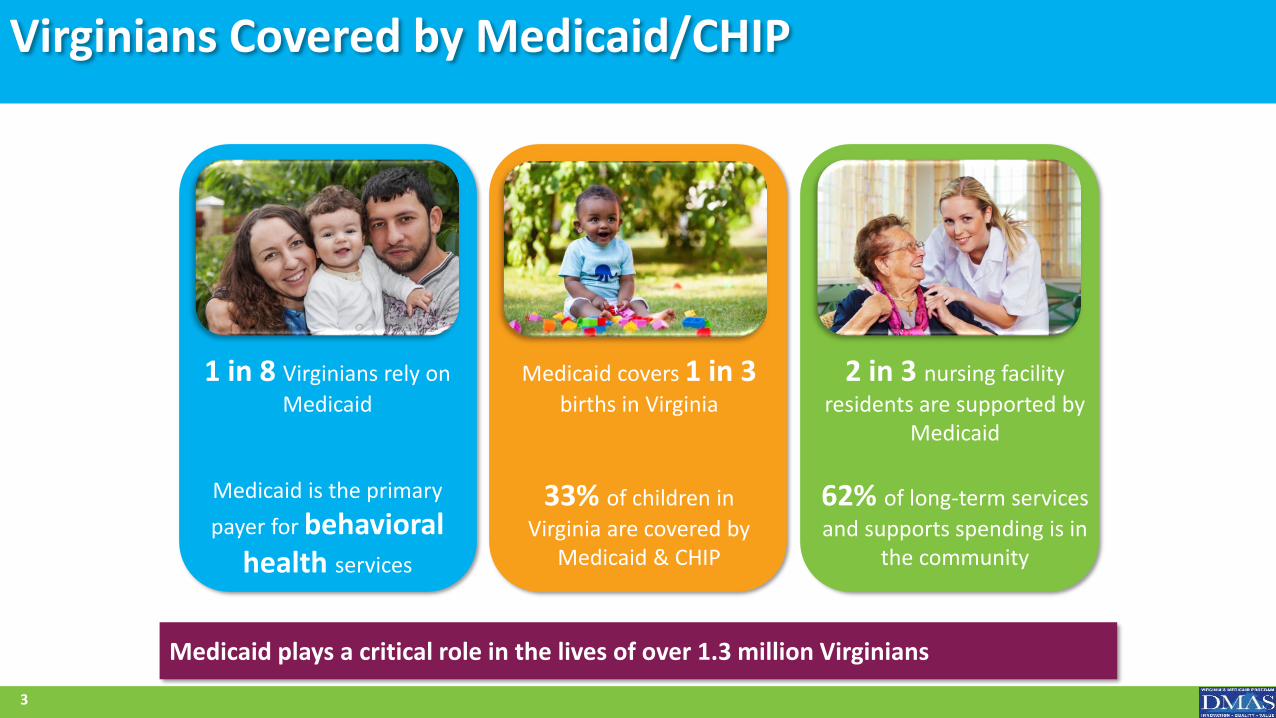
Virginians Covered by Medicaid/CHIP
3
Medicaid plays a critical role in the lives of over 1.3 million Virginians
1 in 8 Virginians rely on
Medicaid
Medicaid is the primary
payer for behavioral health services
Medicaid covers 1 in 3 births in Virginia
33% of children in
Virginia are covered by Medicaid & CHIP
2 in 3 nursing facility
residents are supported by Medicaid
62% of long-term services
and supports spending is in the community
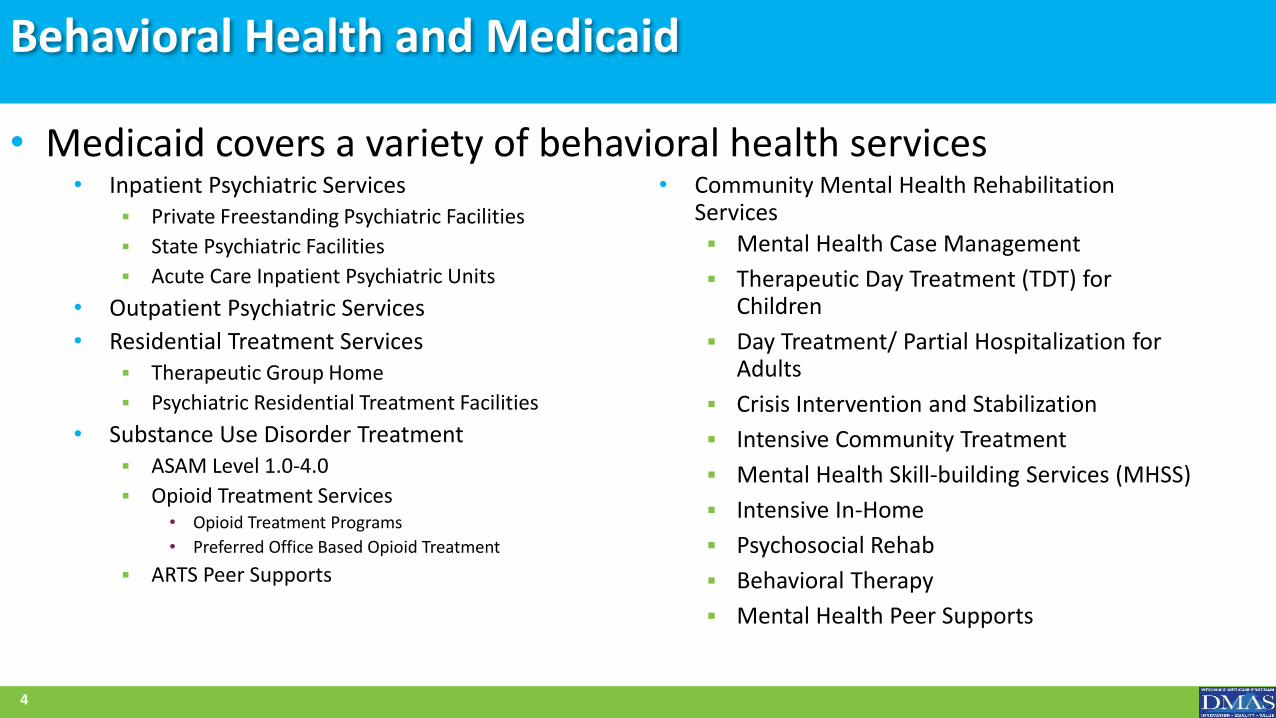
Behavioral Health and Medicaid
• Inpatient Psychiatric Services Private Freestanding Psychiatric Facilities
State Psychiatric Facilities
Acute Care Inpatient Psychiatric Units
• Outpatient Psychiatric Services
• Residential Treatment Services Therapeutic Group Home
Psychiatric Residential Treatment Facilities
• Substance Use Disorder Treatment ASAM Level 1.0-4.0
Opioid Treatment Services• Opioid Treatment Programs
• Preferred Office Based Opioid Treatment
ARTS Peer Supports
• Community Mental Health Rehabilitation Services Mental Health Case Management
Therapeutic Day Treatment (TDT) for Children
Day Treatment/ Partial Hospitalization for Adults
Crisis Intervention and Stabilization
Intensive Community Treatment
Mental Health Skill-building Services (MHSS)
Intensive In-Home
Psychosocial Rehab
Behavioral Therapy
Mental Health Peer Supports
4
• Medicaid covers a variety of behavioral health services
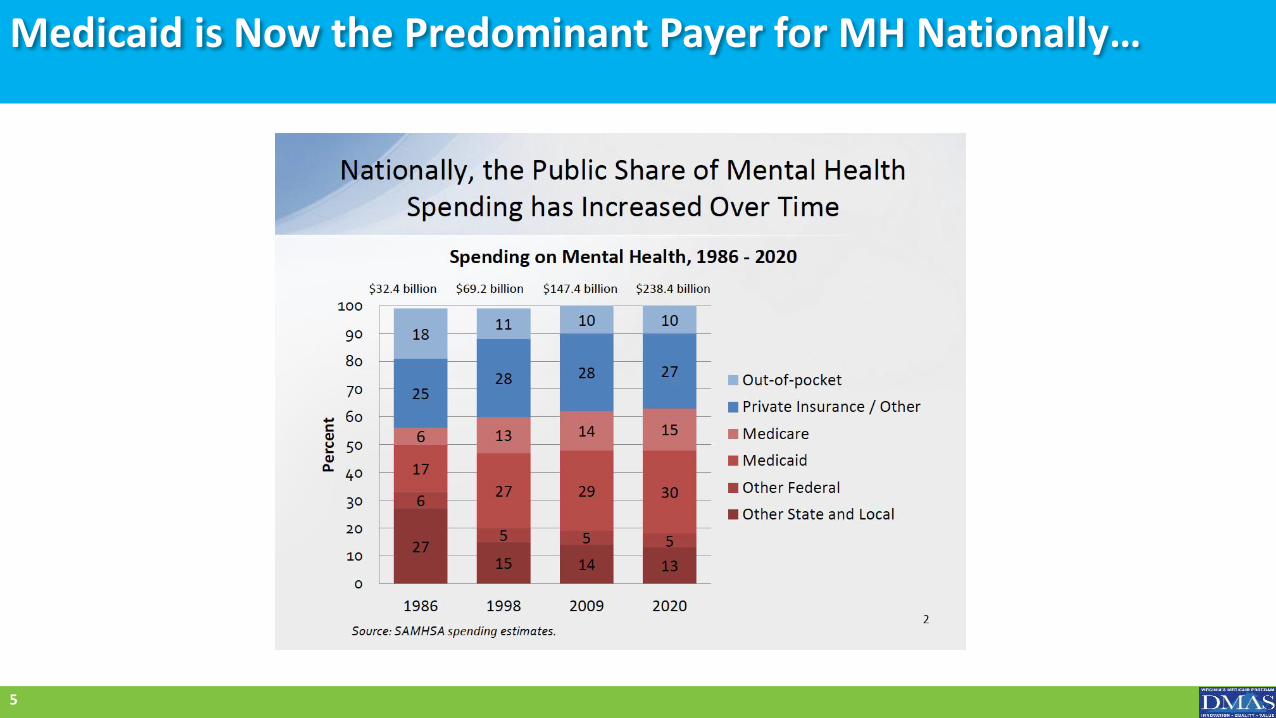
Medicaid is Now the Predominant Payer for MH Nationally…
5
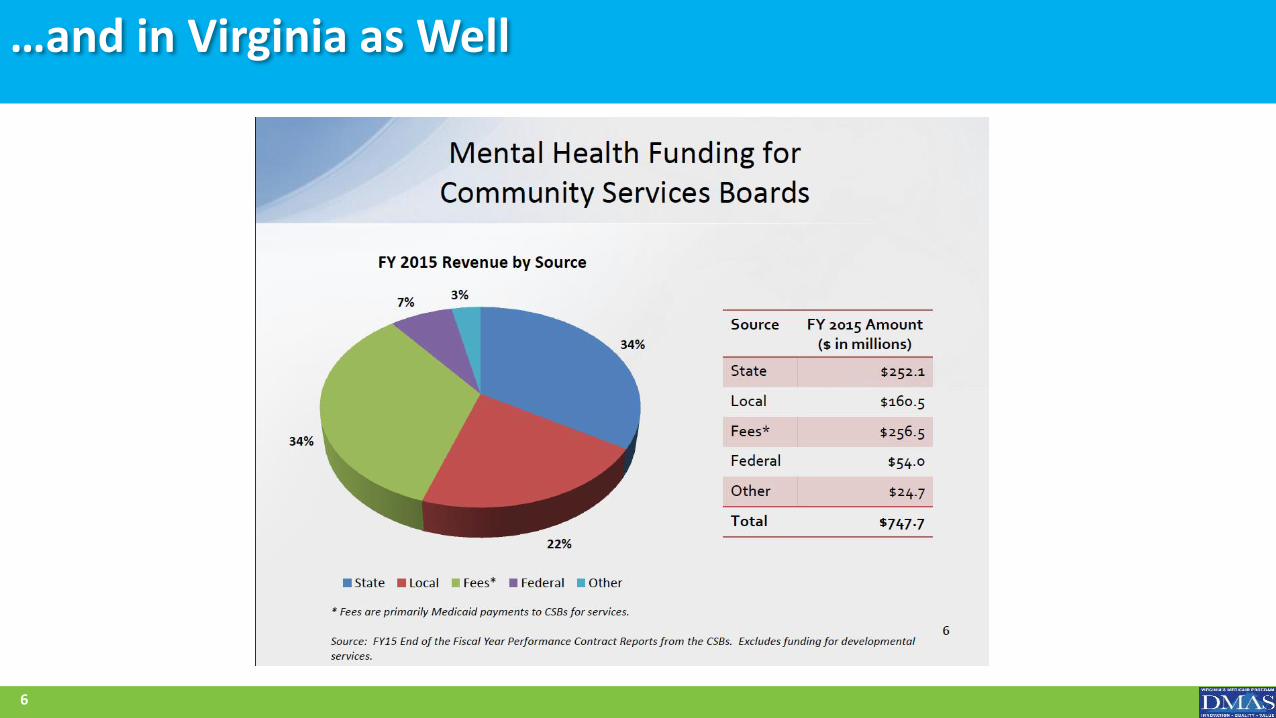
…and in Virginia as Well
6
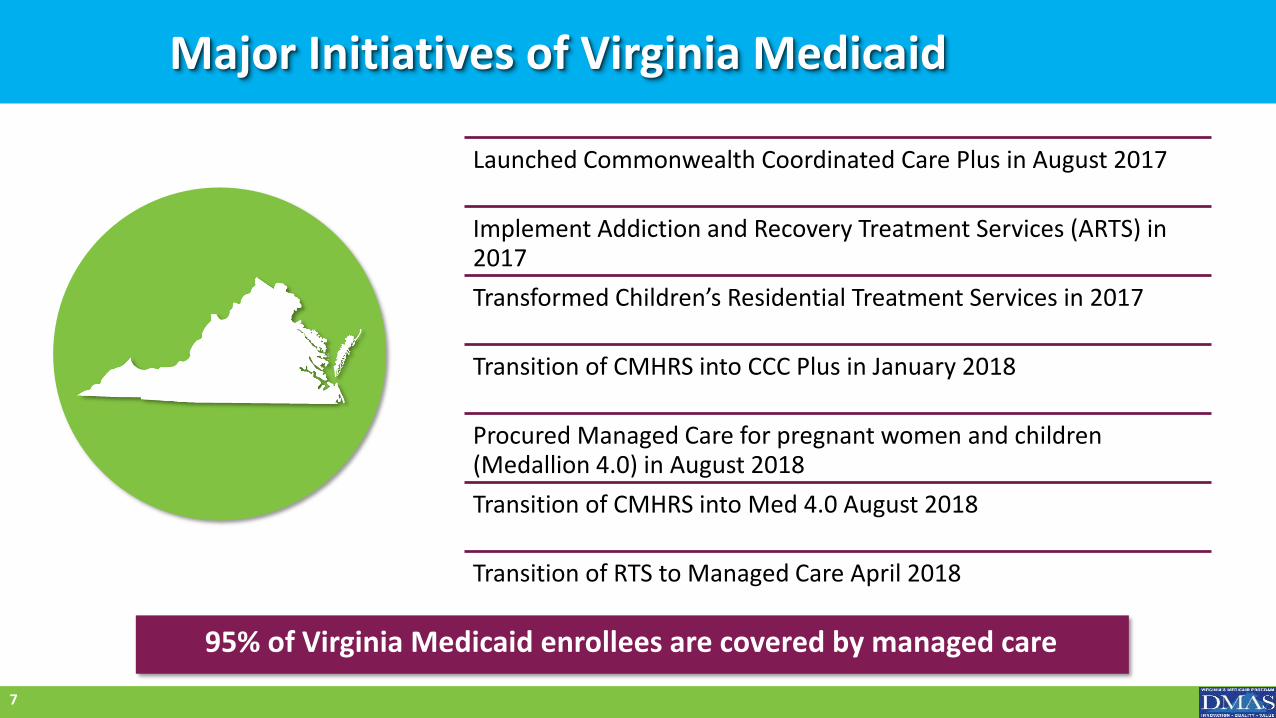
Major Initiatives of Virginia Medicaid
7
95% of Virginia Medicaid enrollees are covered by managed care
Launched Commonwealth Coordinated Care Plus in August 2017
Implement Addiction and Recovery Treatment Services (ARTS) in 2017
Transformed Children’s Residential Treatment Services in 2017
Transition of CMHRS into CCC Plus in January 2018
Procured Managed Care for pregnant women and children (Medallion 4.0) in August 2018
Transition of CMHRS into Med 4.0 August 2018
Transition of RTS to Managed Care April 2018
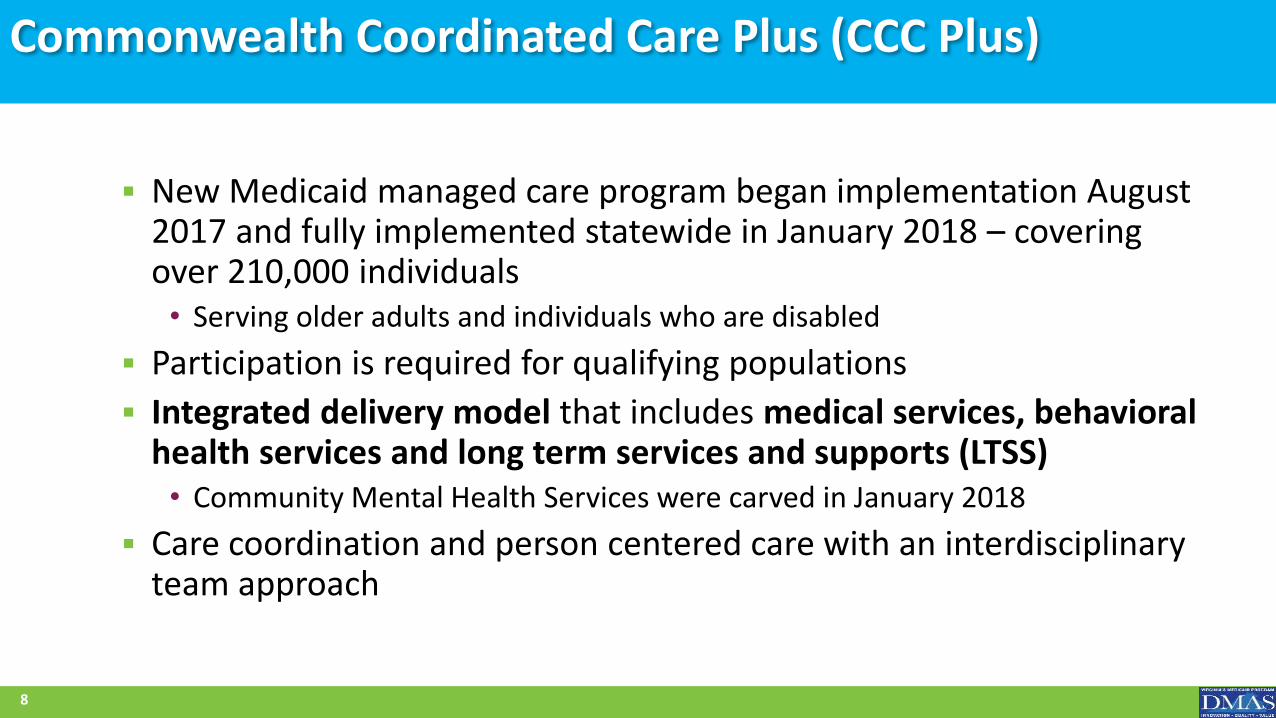
Commonwealth Coordinated Care Plus (CCC Plus)
New Medicaid managed care program began implementation August 2017 and fully implemented statewide in January 2018 – covering over 210,000 individuals
• Serving older adults and individuals who are disabled
Participation is required for qualifying populations
Integrated delivery model that includes medical services, behavioral health services and long term services and supports (LTSS)
• Community Mental Health Services were carved in January 2018
Care coordination and person centered care with an interdisciplinary team approach
8
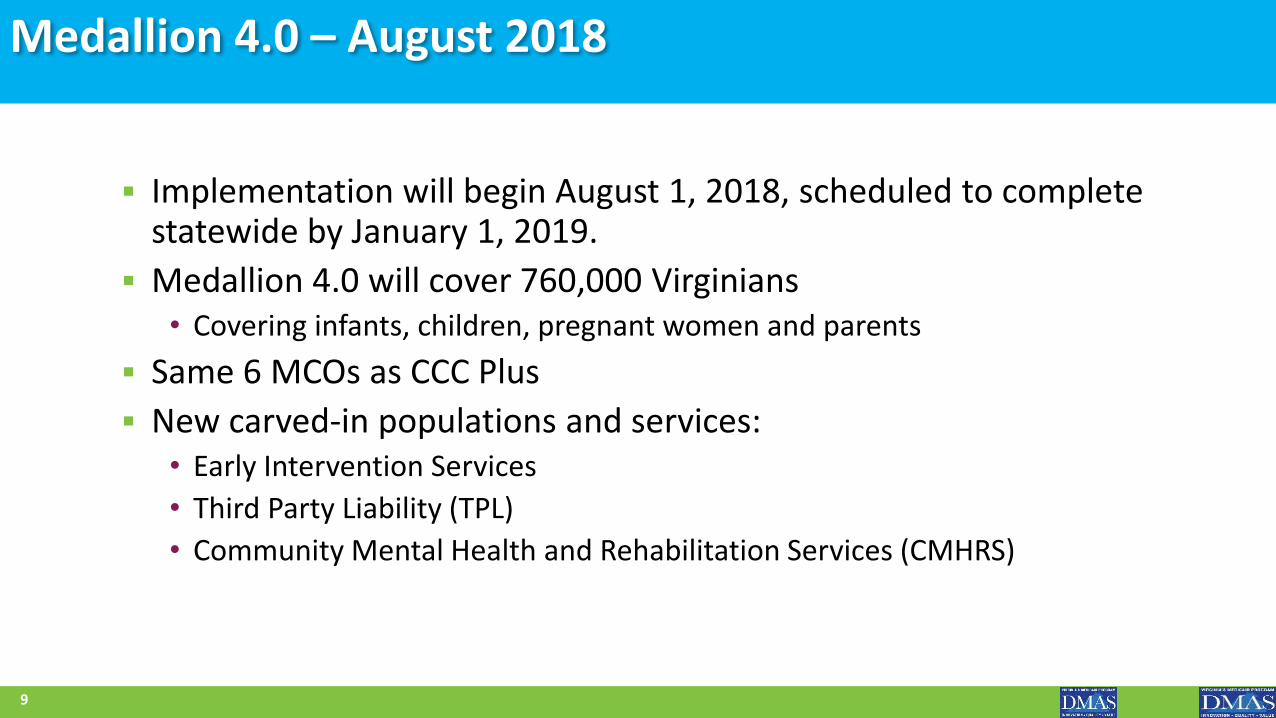
Medallion 4.0 – August 2018
Implementation will begin August 1, 2018, scheduled to complete statewide by January 1, 2019.
Medallion 4.0 will cover 760,000 Virginians• Covering infants, children, pregnant women and parents
Same 6 MCOs as CCC Plus
New carved-in populations and services:• Early Intervention Services
• Third Party Liability (TPL)
• Community Mental Health and Rehabilitation Services (CMHRS)
9
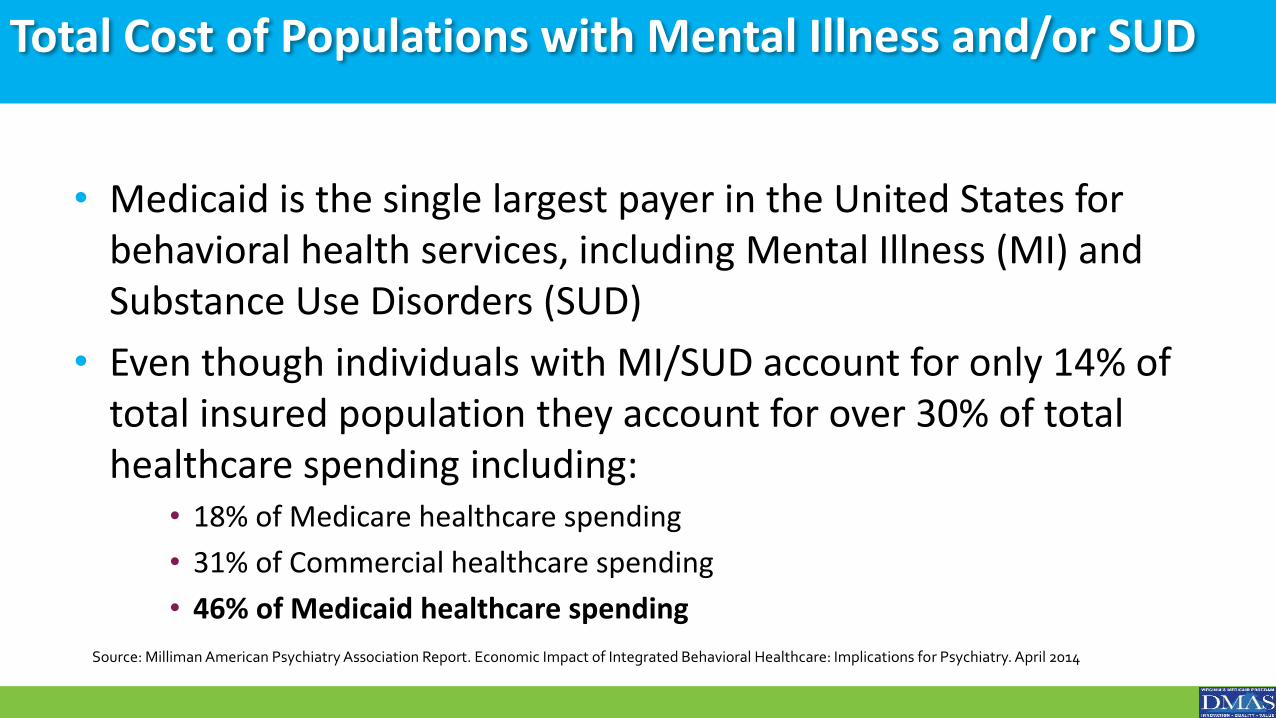
Total Cost of Populations with Mental Illness and/or SUD
• Medicaid is the single largest payer in the United States for behavioral health services, including Mental Illness (MI) and Substance Use Disorders (SUD)
• Even though individuals with MI/SUD account for only 14% of total insured population they account for over 30% of total healthcare spending including:
• 18% of Medicare healthcare spending
• 31% of Commercial healthcare spending
• 46% of Medicaid healthcare spending
Source: Milliman American Psychiatry Association Report. Economic Impact of Integrated Behavioral Healthcare: Implications for Psychiatry. April 2014
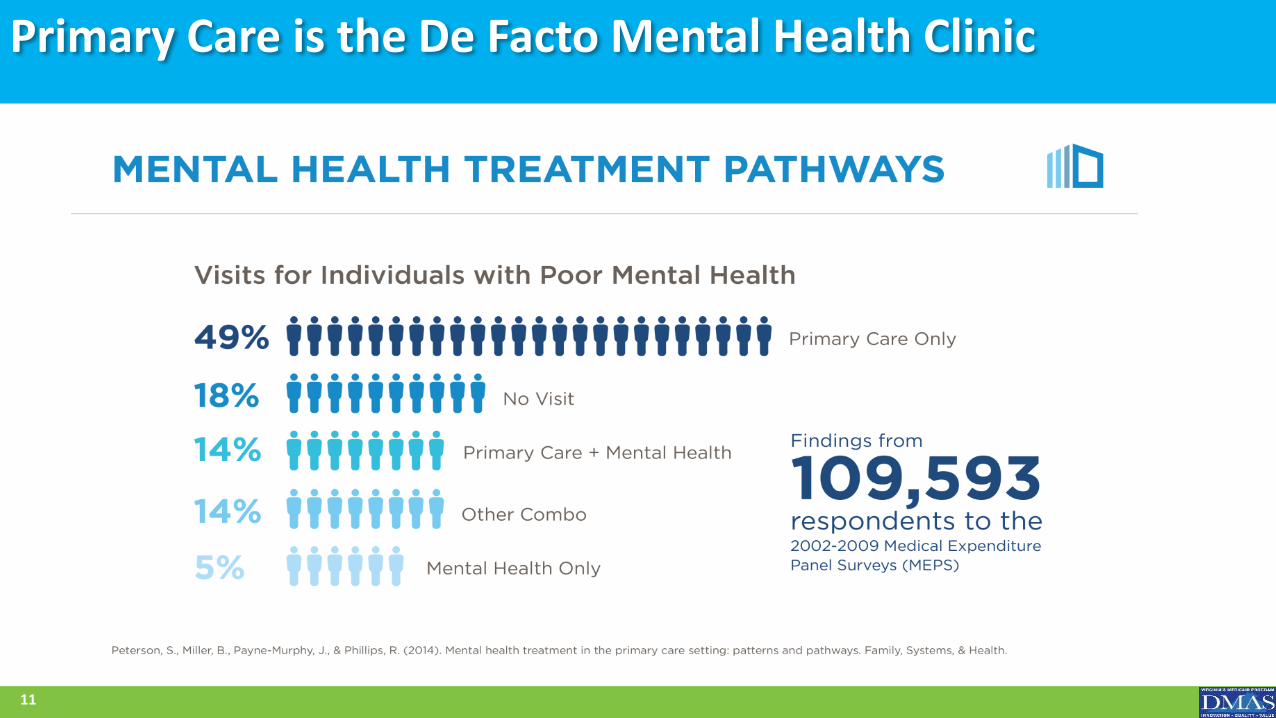
Primary Care is the De Facto Mental Health Clinic
11
Transformation of Medicaid Community-Based Mental Health Delivery System
• Through a RWJF funded grant, the state partnered with the Farley Center, a nationally recognized expert on health care integration, to analyze Medicaid behavioral health spending at provider level and city/county level
• The Farley Center is working with stakeholders to create a plan for DMAS and other state agency partners to transform Virginia’s existing delivery system into a comprehensive, evidence-based continuum of community-based mental health services with uniform standards and quality measures (continued work pending 2018 Appropriations)
12
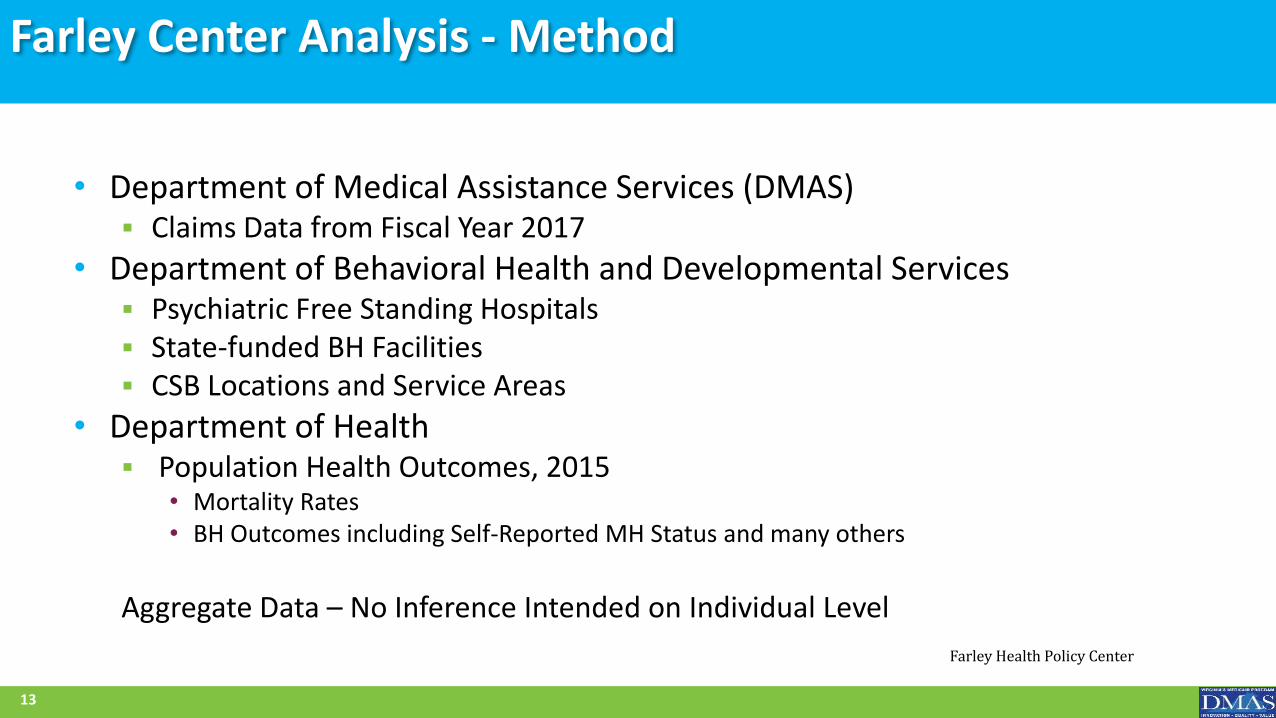
Farley Center Analysis - Method
• Department of Medical Assistance Services (DMAS) Claims Data from Fiscal Year 2017
• Department of Behavioral Health and Developmental Services Psychiatric Free Standing Hospitals State-funded BH Facilities CSB Locations and Service Areas
• Department of Health Population Health Outcomes, 2015
• Mortality Rates• BH Outcomes including Self-Reported MH Status and many others
Aggregate Data – No Inference Intended on Individual Level
13
Farley Health Policy Center
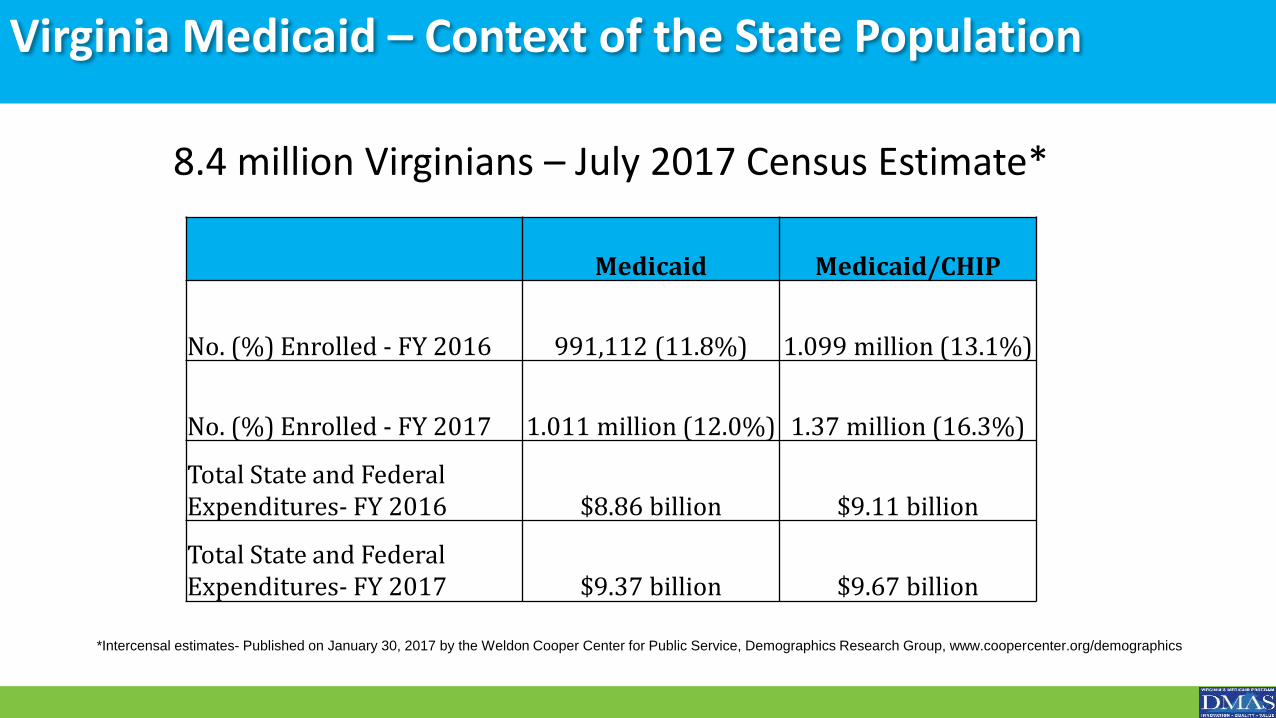
Virginia Medicaid – Context of the State Population
8.4 million Virginians – July 2017 Census Estimate*
*Intercensal estimates- Published on January 30, 2017 by the Weldon Cooper Center for Public Service, Demographics Research Group, www.coopercenter.org/demographics
Medicaid Medicaid/CHIP
No. (%) Enrolled - FY 2016 991,112 (11.8%) 1.099 million (13.1%)
No. (%) Enrolled - FY 2017 1.011 million (12.0%) 1.37 million (16.3%)
Total State and Federal Expenditures- FY 2016 $8.86 billion $9.11 billion
Total State and Federal Expenditures- FY 2017 $9.37 billion $9.67 billion

Behavioral Health Population: Medicaid
• Total BH Recipients in FY17-386,305; 28.1% of total Medicaid Recipients – 1.37 million
• Data reflects # and % individuals for whom a claim was paid for medical services for those with BH condition
• Recipients can be diagnosed with more than one BH condition
301,93478.1%
164,74242.6%
71,65118.5%
53,63913.9%
0.0% 20.0% 40.0% 60.0% 80.0% 100.0%
Mental Illness
Serious Mental Illness
Intellectual/DevelopmentDisorders
Substance Use Disorders
Farley Health Policy Center
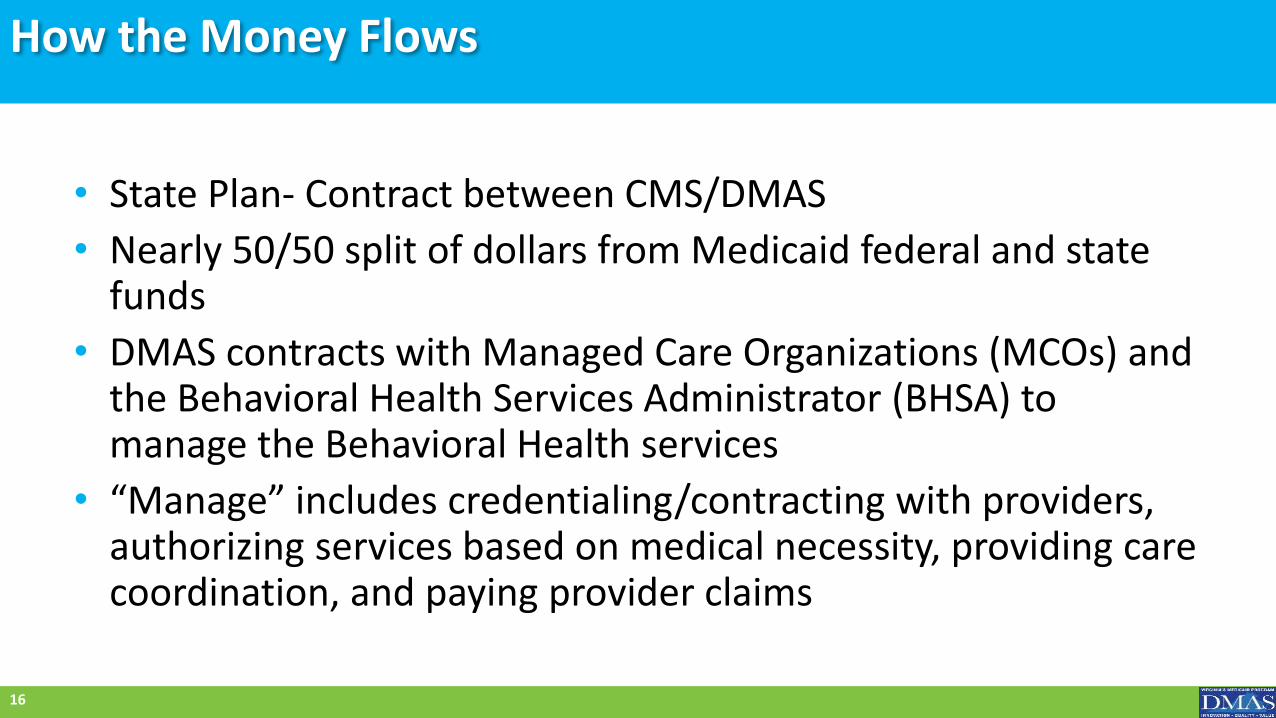
How the Money Flows
• State Plan- Contract between CMS/DMAS
• Nearly 50/50 split of dollars from Medicaid federal and state funds
• DMAS contracts with Managed Care Organizations (MCOs) and the Behavioral Health Services Administrator (BHSA) to manage the Behavioral Health services
• “Manage” includes credentialing/contracting with providers, authorizing services based on medical necessity, providing care coordination, and paying provider claims
16
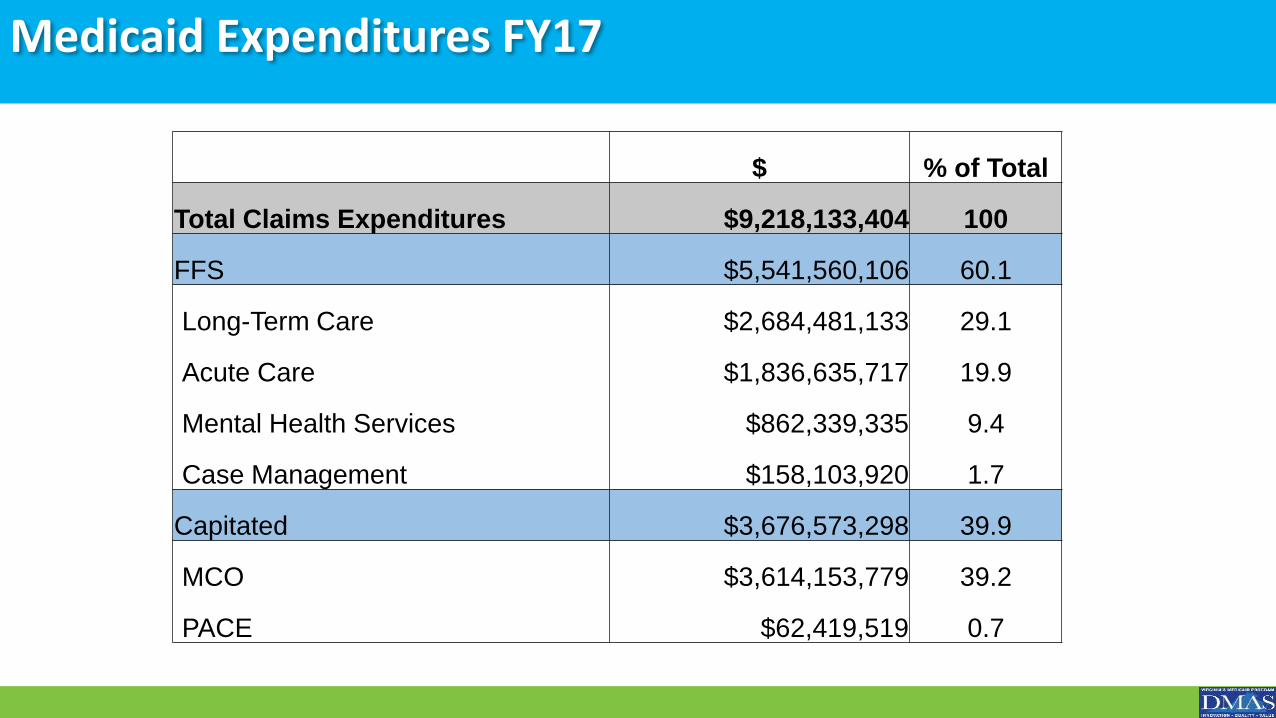
Medicaid Expenditures FY17
$ % of Total
Total Claims Expenditures $9,218,133,404 100
FFS $5,541,560,106 60.1
Long-Term Care $2,684,481,133 29.1
Acute Care $1,836,635,717 19.9
Mental Health Services $862,339,335 9.4
Case Management $158,103,920 1.7
Capitated $3,676,573,298 39.9
MCO $3,614,153,779 39.2
PACE $62,419,519 0.7
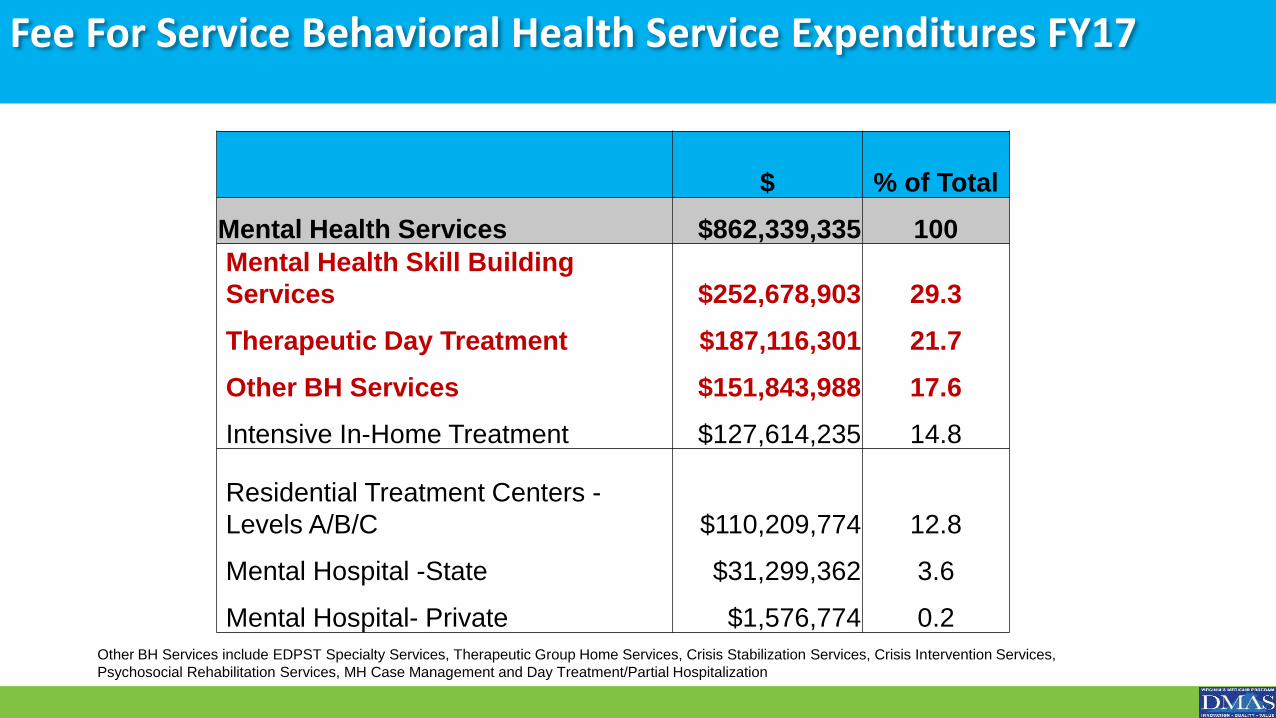
Fee For Service Behavioral Health Service Expenditures FY17
$ % of Total
Mental Health Services $862,339,335 100
Mental Health Skill Building
Services $252,678,903 29.3
Therapeutic Day Treatment $187,116,301 21.7
Other BH Services $151,843,988 17.6
Intensive In-Home Treatment $127,614,235 14.8
Residential Treatment Centers -
Levels A/B/C $110,209,774 12.8
Mental Hospital -State $31,299,362 3.6
Mental Hospital- Private $1,576,774 0.2
Other BH Services include EDPST Specialty Services, Therapeutic Group Home Services, Crisis Stabilization Services, Crisis Intervention Services,
Psychosocial Rehabilitation Services, MH Case Management and Day Treatment/Partial Hospitalization
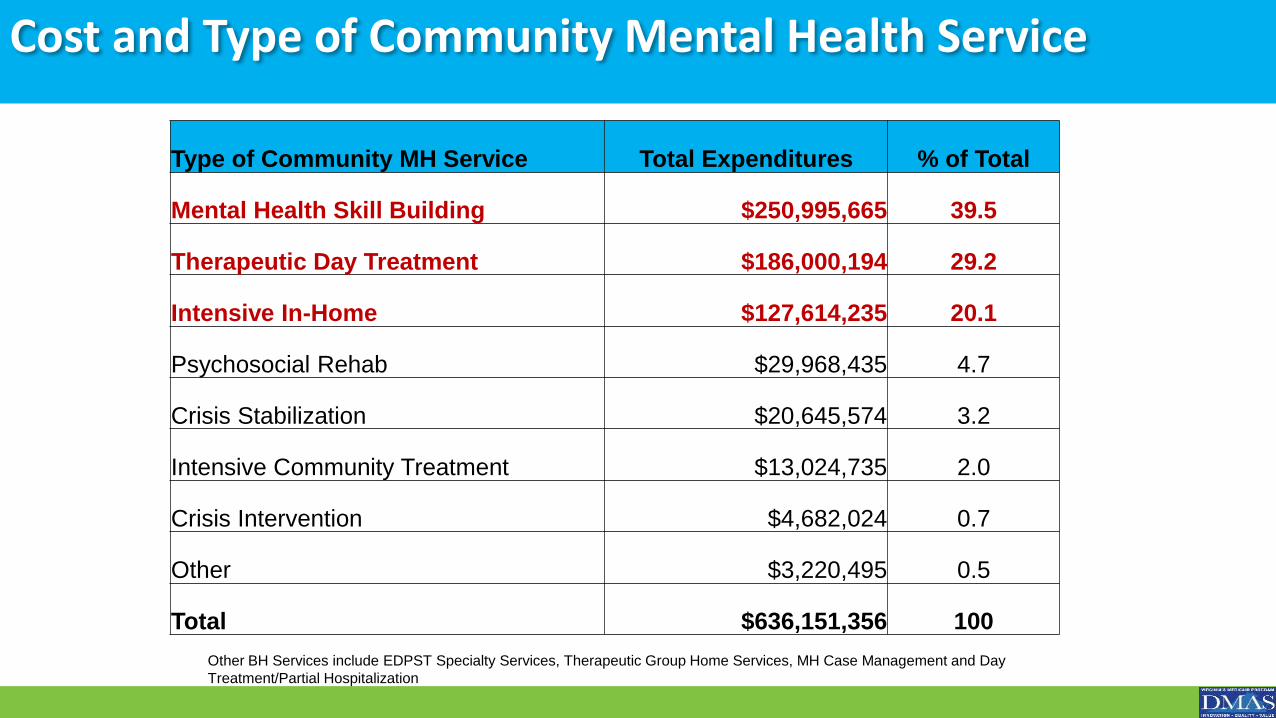
Cost and Type of Community Mental Health Service
Type of Community MH Service Total Expenditures % of Total
Mental Health Skill Building $250,995,665 39.5
Therapeutic Day Treatment $186,000,194 29.2
Intensive In-Home $127,614,235 20.1
Psychosocial Rehab $29,968,435 4.7
Crisis Stabilization $20,645,574 3.2
Intensive Community Treatment $13,024,735 2.0
Crisis Intervention $4,682,024 0.7
Other $3,220,495 0.5
Total $636,151,356 100
Other BH Services include EDPST Specialty Services, Therapeutic Group Home Services, MH Case Management and Day
Treatment/Partial Hospitalization
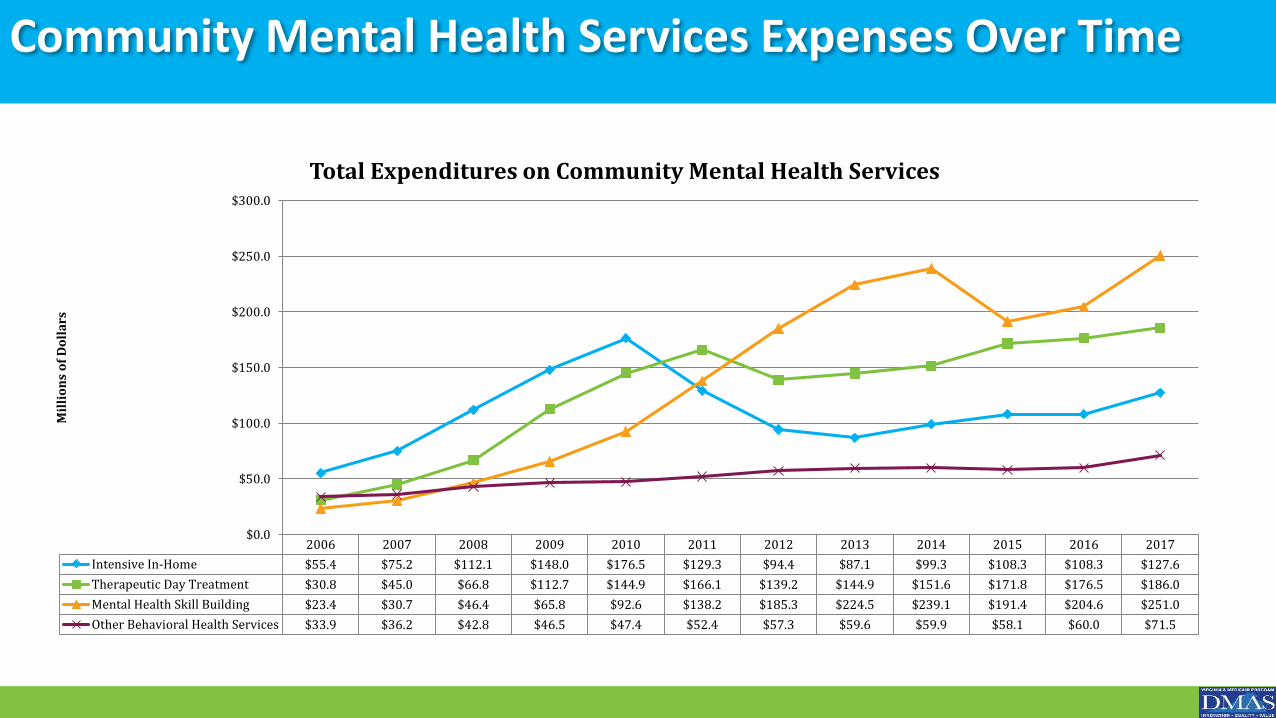
Community Mental Health Services Expenses Over Time
2006 2007 2008 2009 2010 2011 2012 2013 2014 2015 2016 2017
Intensive In-Home $55.4 $75.2 $112.1 $148.0 $176.5 $129.3 $94.4 $87.1 $99.3 $108.3 $108.3 $127.6
Therapeutic Day Treatment $30.8 $45.0 $66.8 $112.7 $144.9 $166.1 $139.2 $144.9 $151.6 $171.8 $176.5 $186.0
Mental Health Skill Building $23.4 $30.7 $46.4 $65.8 $92.6 $138.2 $185.3 $224.5 $239.1 $191.4 $204.6 $251.0
Other Behavioral Health Services $33.9 $36.2 $42.8 $46.5 $47.4 $52.4 $57.3 $59.6 $59.9 $58.1 $60.0 $71.5
$0.0
$50.0
$100.0
$150.0
$200.0
$250.0
$300.0
Mil
lio
ns
of
Do
lla
rs
Total Expenditures on Community Mental Health Services
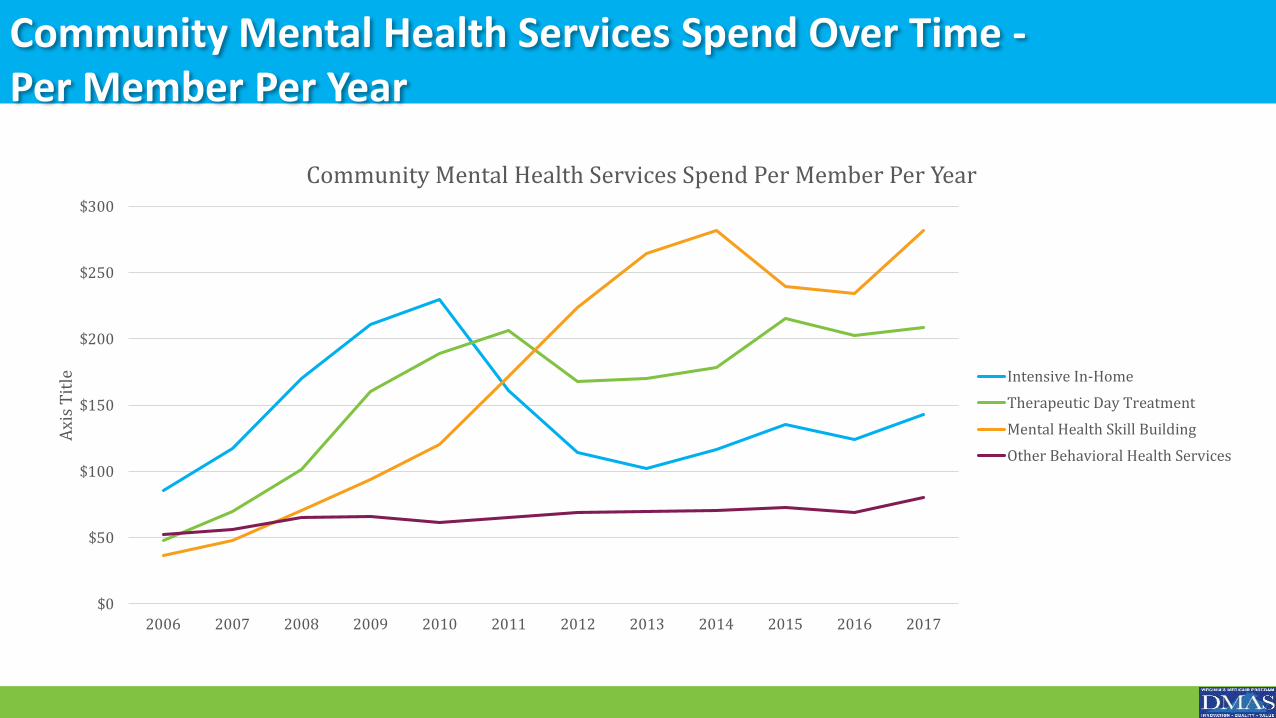
Community Mental Health Services Spend Over Time -Per Member Per Year
$0
$50
$100
$150
$200
$250
$300
2006 2007 2008 2009 2010 2011 2012 2013 2014 2015 2016 2017
Axi
s T
itle
Community Mental Health Services Spend Per Member Per Year
Intensive In-Home
Therapeutic Day Treatment
Mental Health Skill Building
Other Behavioral Health Services
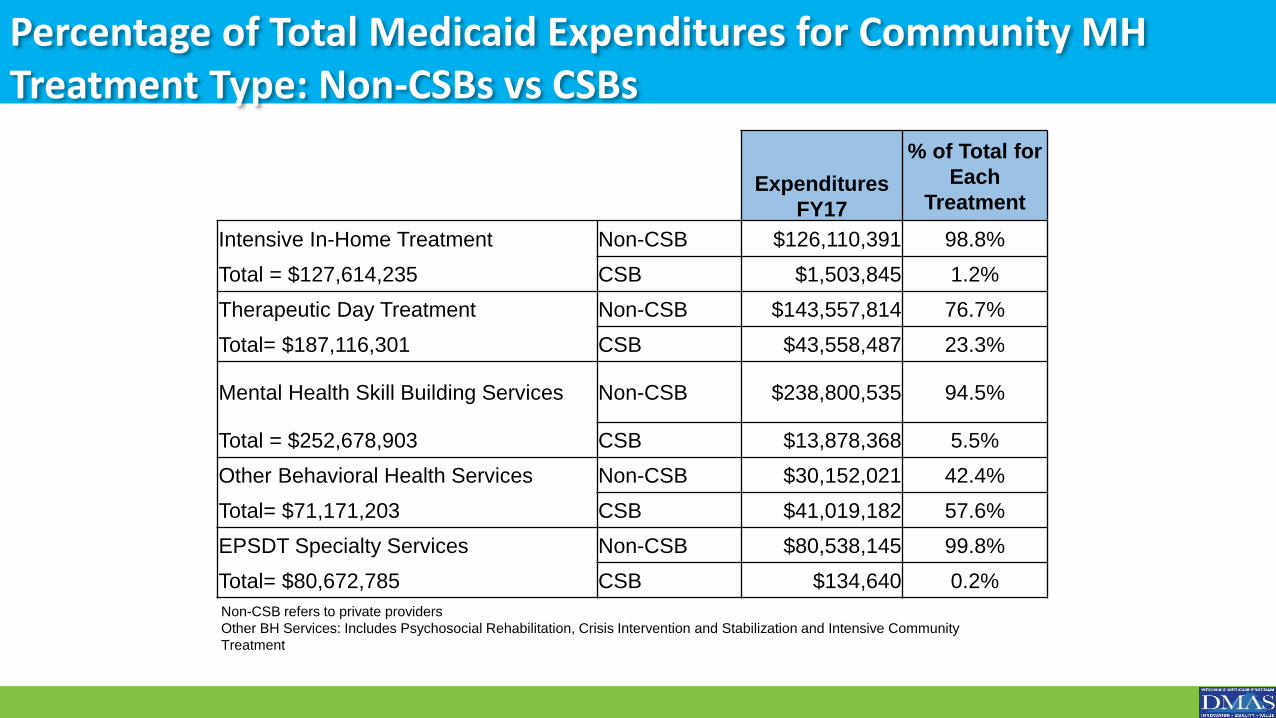
Percentage of Total Medicaid Expenditures for Community MH Treatment Type: Non-CSBs vs CSBs
Non-CSB refers to private providers
Other BH Services: Includes Psychosocial Rehabilitation, Crisis Intervention and Stabilization and Intensive Community
Treatment
Expenditures
FY17
% of Total for
Each
Treatment
Intensive In-Home Treatment Non-CSB $126,110,391 98.8%
Total = $127,614,235 CSB $1,503,845 1.2%
Therapeutic Day Treatment Non-CSB $143,557,814 76.7%
Total= $187,116,301 CSB $43,558,487 23.3%
Mental Health Skill Building Services Non-CSB $238,800,535 94.5%
Total = $252,678,903 CSB $13,878,368 5.5%
Other Behavioral Health Services Non-CSB $30,152,021 42.4%
Total= $71,171,203 CSB $41,019,182 57.6%
EPSDT Specialty Services Non-CSB $80,538,145 99.8%
Total= $80,672,785 CSB $134,640 0.2%
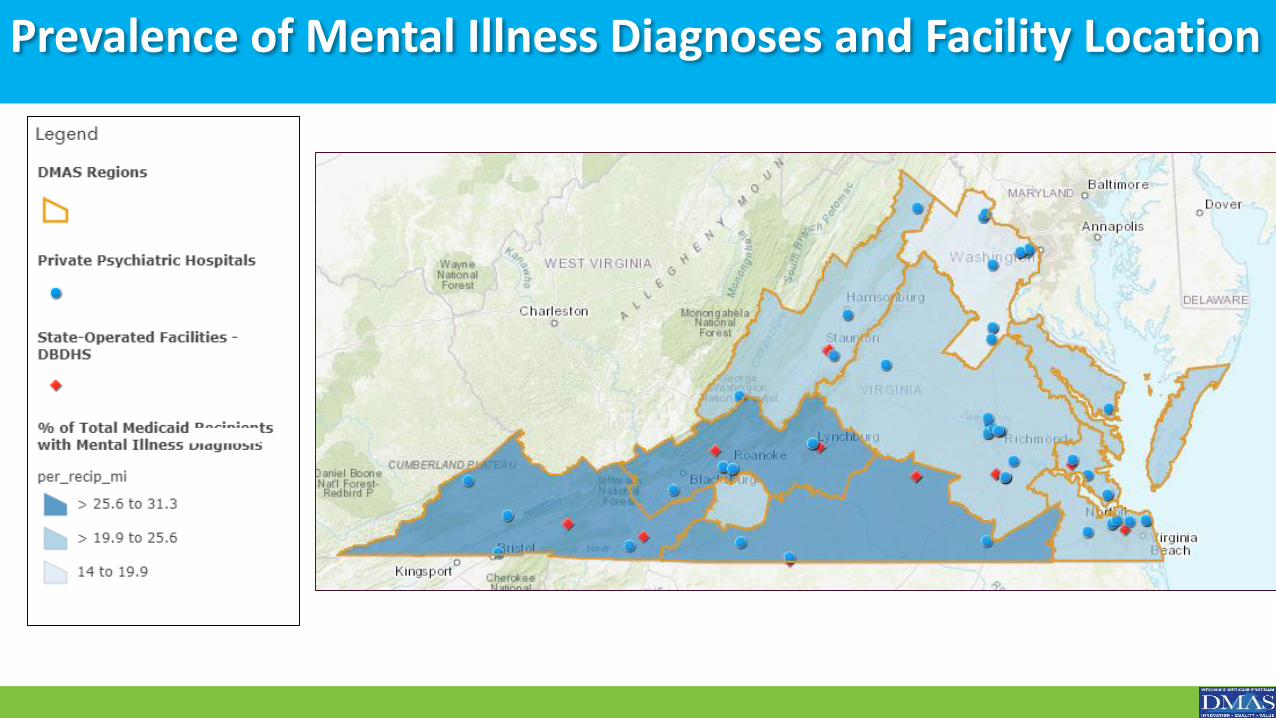
Prevalence of Mental Illness Diagnoses and Facility Location
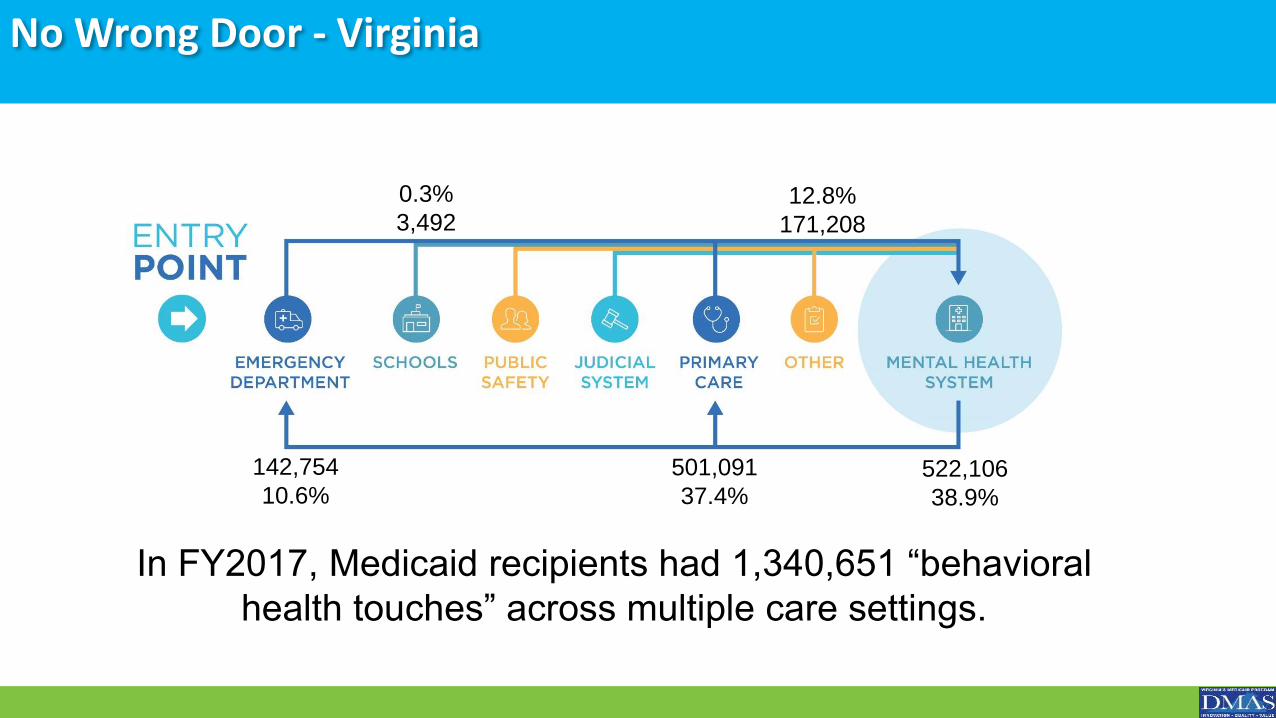
No Wrong Door - Virginia
522,106
38.9%
501,091
37.4%
142,754
10.6%
0.3%
3,49212.8%
171,208
In FY2017, Medicaid recipients had 1,340,651 “behavioral
health touches” across multiple care settings.
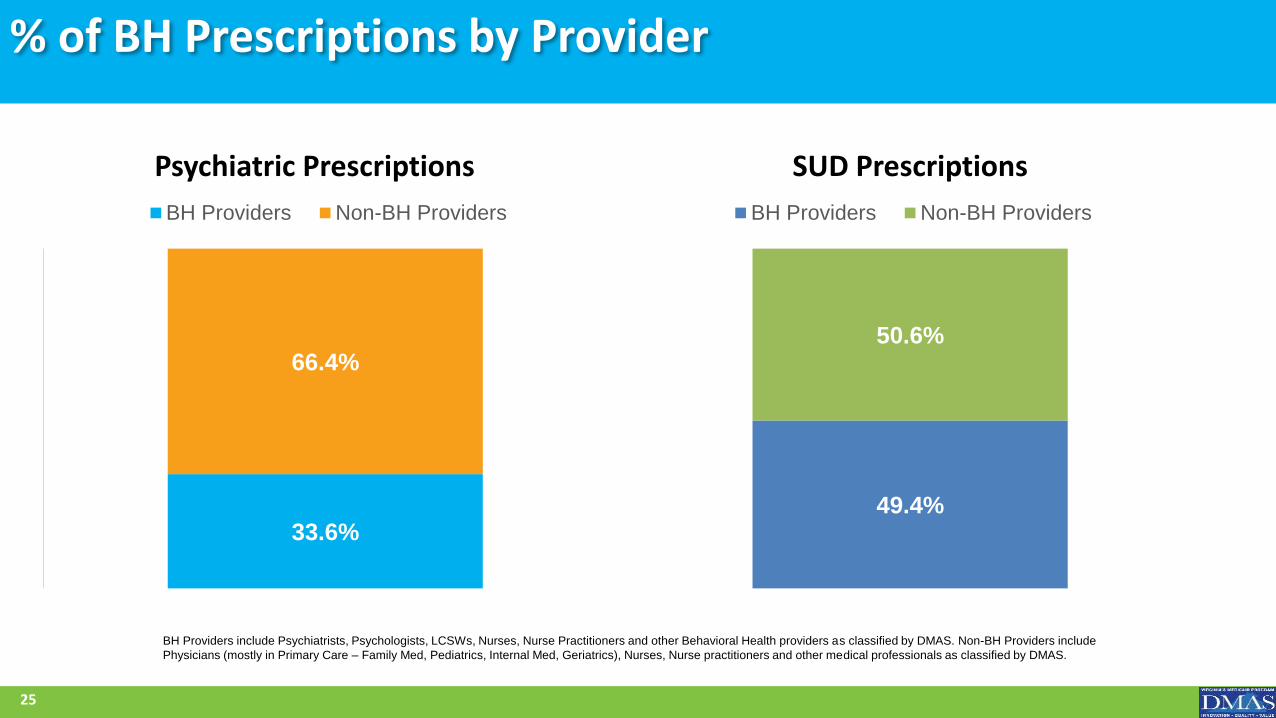
% of BH Prescriptions by Provider
Psychiatric Prescriptions
33.6%
66.4%
BH Providers Non-BH Providers
SUD Prescriptions
49.4%
50.6%
BH Providers Non-BH Providers
25
BH Providers include Psychiatrists, Psychologists, LCSWs, Nurses, Nurse Practitioners and other Behavioral Health providers as classified by DMAS. Non-BH Providers include
Physicians (mostly in Primary Care – Family Med, Pediatrics, Internal Med, Geriatrics), Nurses, Nurse practitioners and other medical professionals as classified by DMAS.
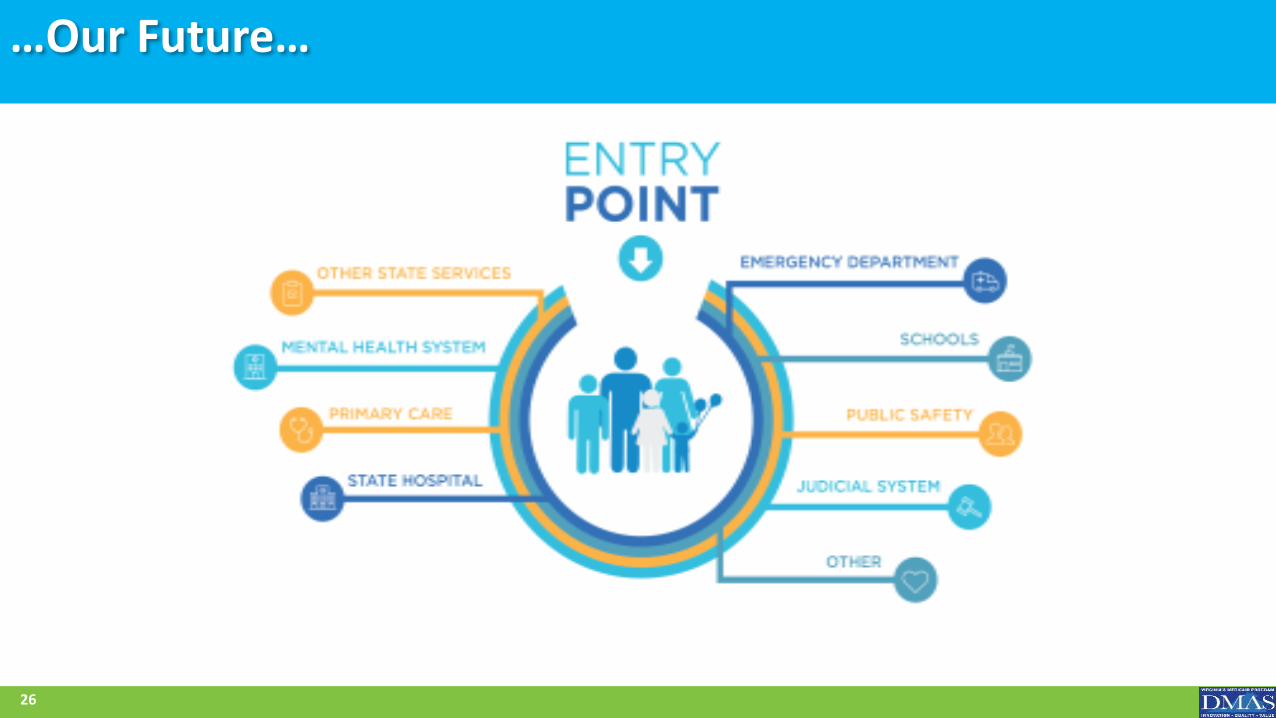
…Our Future…
26
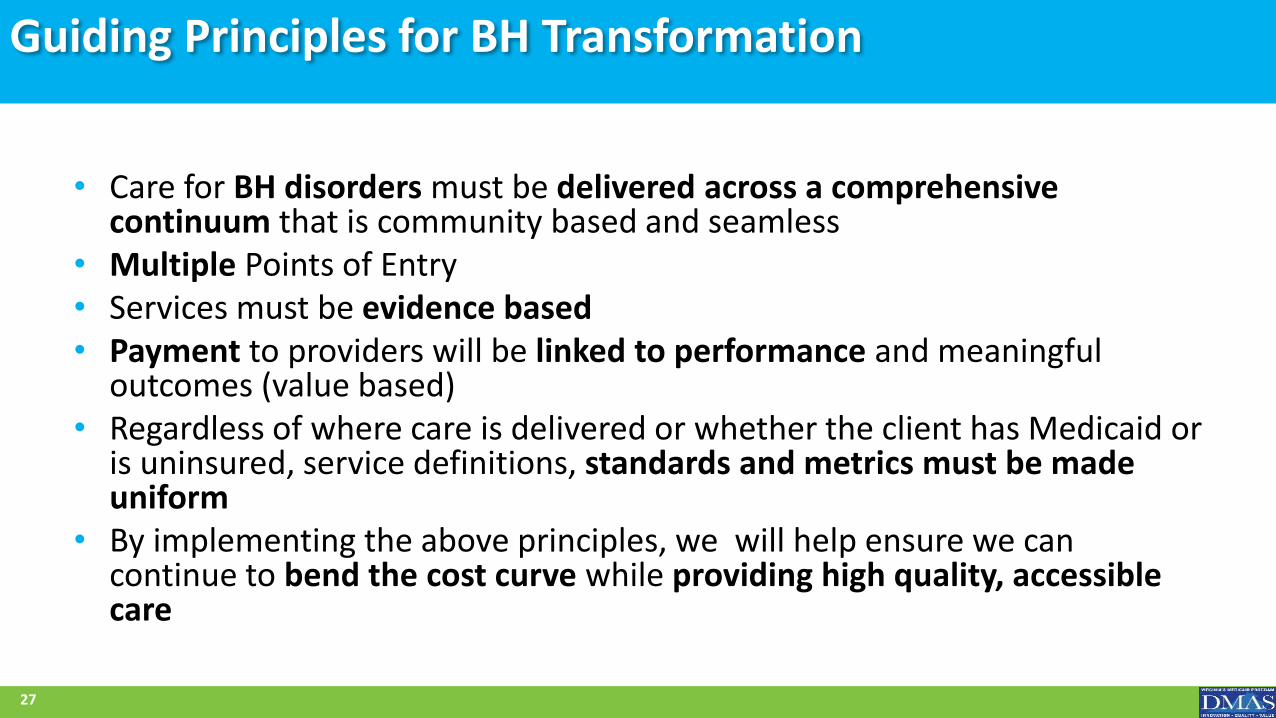
Guiding Principles for BH Transformation
• Care for BH disorders must be delivered across a comprehensive continuum that is community based and seamless
• Multiple Points of Entry• Services must be evidence based• Payment to providers will be linked to performance and meaningful
outcomes (value based) • Regardless of where care is delivered or whether the client has Medicaid or
is uninsured, service definitions, standards and metrics must be made uniform
• By implementing the above principles, we will help ensure we can continue to bend the cost curve while providing high quality, accessible care
27
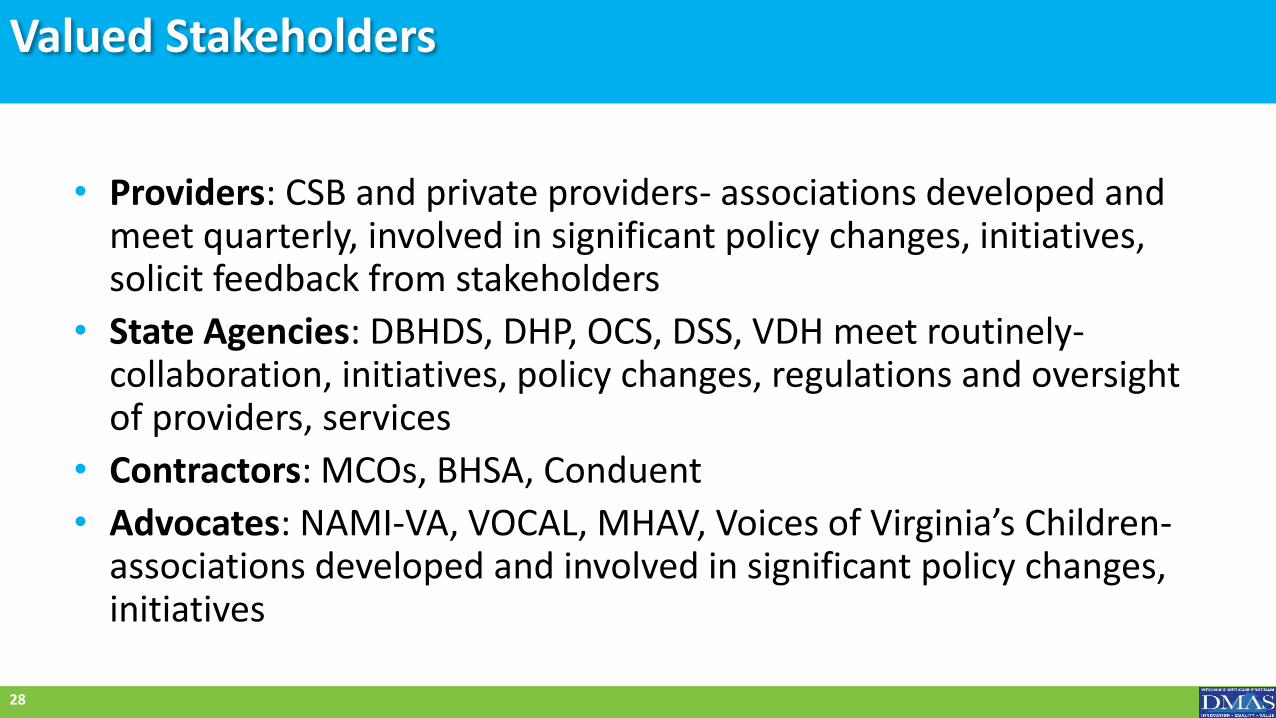
Valued Stakeholders
• Providers: CSB and private providers- associations developed and meet quarterly, involved in significant policy changes, initiatives, solicit feedback from stakeholders
• State Agencies: DBHDS, DHP, OCS, DSS, VDH meet routinely-collaboration, initiatives, policy changes, regulations and oversight of providers, services
• Contractors: MCOs, BHSA, Conduent
• Advocates: NAMI-VA, VOCAL, MHAV, Voices of Virginia’s Children-associations developed and involved in significant policy changes, initiatives
28
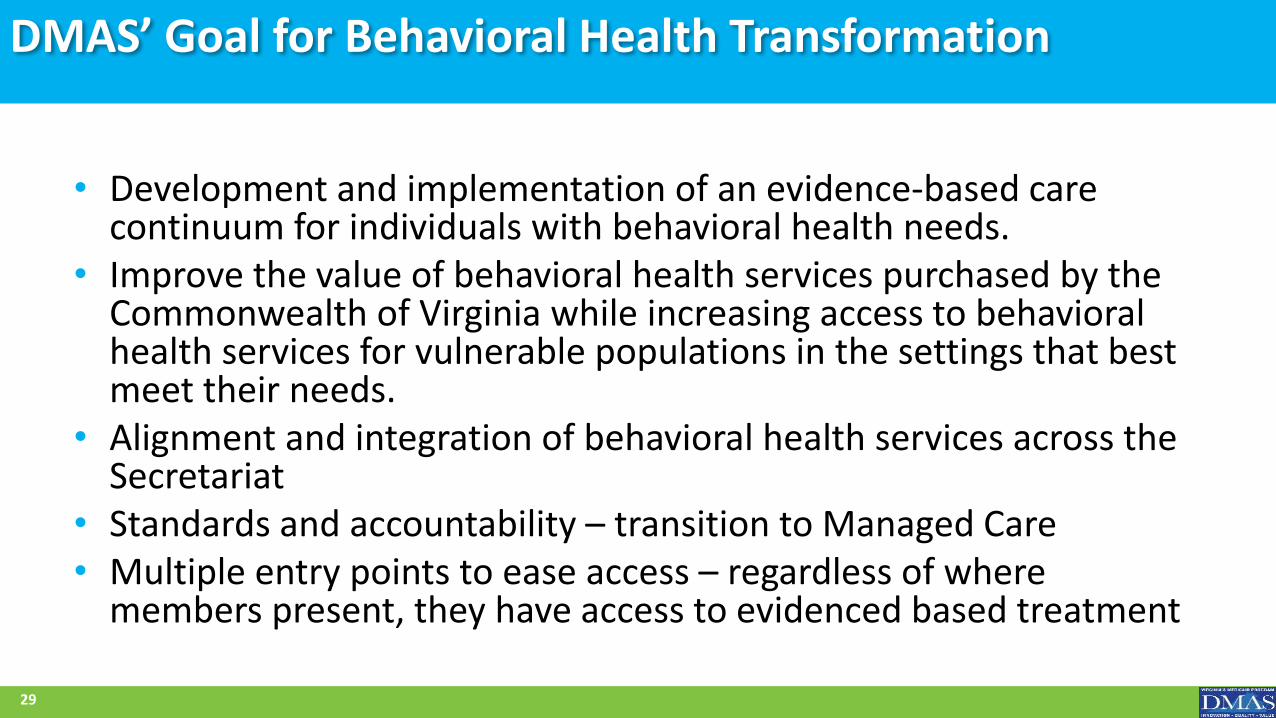
DMAS’ Goal for Behavioral Health Transformation
• Development and implementation of an evidence-based care continuum for individuals with behavioral health needs.
• Improve the value of behavioral health services purchased by the Commonwealth of Virginia while increasing access to behavioral health services for vulnerable populations in the settings that best meet their needs.
• Alignment and integration of behavioral health services across the Secretariat
• Standards and accountability – transition to Managed Care• Multiple entry points to ease access – regardless of where
members present, they have access to evidenced based treatment
29