dmicdc logistics data services - jnptjnport.gov.in/writereaddata/data/downloads/jnpt- dlds...
TRANSCRIPT

``
DMICDC Logistics Data Services
Logistics Databank Operations
Project Report: June 1st – June 30th 2017
https://www.ldb.co.in

``
Table of Contents 1. Executive Summary ................................................................................................................ 4 1.1 LDB Key Findings at Glance ............................................................................................ 6 2. Container Traffic Movement Trends in JNPT Port Terminals ......................................... 7 2.1 Container Tagging & De-tagging at JNPT (June 1st – June 30th 2017) ....................... 7 2.2 Overall Container Tagging & De-tagging at JNPT from 1st July 2016 to 30th June 2017: 2.3 Site Deployment Status (FY 16-17) & AMJ 2017 Quarter:.................................................. 9
3 LDB Analytics ........................................................................................................................ 10
3.1 Containers Ports ................................................................................................................ . 10
3.2 Port Dwell Time – JNPT Port Terminals .......................................................................... 11
3.2.1 Port Dwell Time for Truck bound Import containers (JNPT) for AMJ’17.................. 11
3.2.2 Port Dwell Time for Train bound Import containers (JNPT) for AMJ’17 .................. 12
3.2.3 Port Dwell Time for Truck bound Export containers (JNPT) for AMJ’17 .................. 14
3.2.4 Port Dwell Time for Train bound Export containers (JNPT) for AMJ’17 ................... 15
3.3 Container Freight Station Dwell Time for Mumbai Region (AMJ’17) ........................... 17
3.3.1 Container Freight Station Dwell Time for Mumbai Region (June’17) ....................... 18
3.3.2 Container Freight Station- Average Delivery Time (AMJ’17) ..................................... 19
3.3.2.1 CFS Average Delivery Time- all CFS in Mumbai to JNPT Port (AMJ’17).................. 21
3.4 Inland Container Depot Average Dwell time (AMJ’17) .................................................. 22
3.4.1 Inland Container Depot Average Dwell time (June’17) .............................................. 23
3.4.2 Inland Container Depot Average Delivery Time (Train) (AMJ’17) ............................ 24
3.4.3 Inland Container Depot Average Lead time (AMJ’17) ................................................ 25
3.5 Average Travel Time between Toll Plazas in June’17 ..................................................... 26
3.5.1 Container Freight Station: Clusters (June’17) ............................................................... 27
3.5.1.1 CFS Cluster: JNPCT Terminal....................................................................................... 27
3.5.1.2 CFS Cluster: APM Terminal .......................................................................................... 28
3.5.1.3 CFS Cluster: NSICT Terminal....................................................................................... 29
3.5.1.4 CFS Cluster: NSIGT Terminal ...................................................................................... 30
3.6 Container Movement Heat Map ....................................................................................... 32
3.6.1 – Container Movement Heat map- JNPCT Terminal ................................................... 32
3.6.2 Container Movement Heat Map- APM Terminal ........................................................ 33
3.6.3 Container Movement Heat Map- NSICT Terminals.................................................... 34

``
3.6.4 Container Movement Heat Map- Overall JNPT Port Terminals ................................. 35
4 Operations Overview ............................................................................................................ 37
4.1 Port Operations ................................................................................................................. . 37
4.1.1 Port update (JNPT, Mumbai):........................................................................................ 37
4.2 Toll Operations ................................................................................................................. . 37
4.3 Container Freight Stations/ Inland Container Depot Operations................................... 39
5 LDB Portal / Other Updates .................................................................................................. 40

``
1. Executive Summary
DLDS’s Logistics Databank Project is currently providing Container visibility services
for more than 70% of India’s Container Volume and as on date has provided services for more than 3.4 million EXIM Containers of India in the western corridor starting from the port till the ICD’s through a single window.
Apart from the Container visibility services Logistics Data Bank Project is providing the services like Performance Benchmarking, Congestion and Bottleneck Analysis, and
Value Added Services which is enabling the Users/ Trade in identifying the inefficiencies/ bottlenecks across the supply chain and bringing in the desired efficiencies.
The current report highlights the performances of the stakeholders for the Apr –May-Jun 2017 quarter. Starting this month we have also incorporated the analytics for the APSEZ Port terminals at Mundra & Hazira in Gujarat.
Some of the highlights of the report are provided below:
Container traffic at JNPT terminals has shown upward trend starting Mar 2017.
For the AMJ quarter, Gateway Terminal of India (GTI) at JNPT has been the top
performing port terminal while the performance of Nhava Sheva International Gateway Terminal (NSIGT) is on the lower side.
Based on the analysis of Port export cycle via train, it is observed that more than 45% of containers are taking more than 5 days to be boarded on to the vessel for Export bound journey whereas export cycle for truck bound containers is still comparatively better.
The traffic congestion have continued around JNPT area wherein Bhendkhal area- Khopate raod, Sonari area-JNPT road and Chirle area, JNPT road have high congestions.
In terms of Dwell Time, “CWC Dronagiri- Navi Mumbai” & “All Cargo CFS Mumbai” are the top performing Container Freight Stations throughout the Apr-May- Jun Quarter with Dwell time of 61 hrs & 62 hrs respectively..
For the AMJ Quarter, “Ashte Logistics- Panvel” & “Navkar Corporation -Yard 1” are the low performing Container Freight Stations in terms of Dwell time with an Dwell time of 95 hours & 88 hours while the performance of “Maersk Annex”

``
& “Vaishno Logistics” is lower in the month of June 17 with Dwell time of 98 hours & 96 hours.
Amongst the Inland Container Depots, “CMA CGM Agencies- ICD Dadri” has been consistently performing well across the AMJ quarter with an average Dwell time of 92 hours while “AllCargo Logistics Park Dadri” performance has been low across the quarter with an average Dwell time of 150 hours.
DLDS has released its 1st Magazine Advertisement in the June’2017 issue of Cargo Connect. It’s a monthly magazine and the No.1 publication for Cargo, Multi-Modal Logistics & Supply Chain Industry
LDB has embedded the DLDS corporate video in LDB Portal to provide our current and prospective clients an in depth view of the company and its services. The video is available at https://youtu.be/ofLaJY-ExPo .

``
1.1 LDB Key Findings at Glance
Stakeholder Performance for April- May-June 17 Quarter

``
2. Container Traffic Movement Trends in JNPT Port Terminals
2.1 Container Tagging & De-tagging at JNPT (June 1st – June 30th 2017)
Total - Terminal Wise
Tagged & De-tagged
Port Terminals Tagging De-Tagging Containers
JNPCT 54233 55559 109792
NSICT 14856 22542 37398
NSIGT 10498 14561 25059
APM 56375 47886 104261
Total Containers 135962 140548 276510

``
JNPT’s container volume including Tran-shipment & Coastal containers for June 2017 is 2,87,631.
There is no LDB service currently being provided to the trans-shipment & Coastal containers at JNPT.
There were total of 2826 Trans-shipment & 8295 Coastal containers at JNPT for month of June 2017.
Based upon the above data for the month of May’17, DLDS has tagged/detagged 96.1% of the EXIM container’s at Jawaharlal Nehru Port Terminal.
2.2 Overall Container Tagging & De-tagging at JNPT from 1st July 2016
to 30th June 2017: Total Import Containers Handled 1459246
Total Export Containers Handled 1577732
Total Containers Handled 3036978

``
2.3 Site Deployment Status (FY 16-17) & AMJ 2017 Quarter:

``
3 LDB Analytics
3.1 Containers Ports
The importance of container ports to the economic growth of APEC members is rooted in the economic development and natural endowments within the region. In last 25 years till 2014, the Intra-EU merchandise trade has grown by 4.45 fold while merchandise trade of intra-APEC had increased over by 5.77 fold.
China, Singapore and South Korea took advantage of this opportunity to strengthen their investment in the construction of logistics infrastructure as well as the improvement of efficiency, thereby becoming the central hubs for transshipment traffic.
Combined container traffic from JNPT and Adani Port SEZ i.e. 8.4 million TEUs are monitored and tracked by DMIC Logistic Data Services (DLDS).

``
3.2 Port Dwell Time – JNPT Port Terminals
3.2.1 Port Dwell Time for Truck bound Import containers (JNPT) for AMJ’17
The Port Dwell time of GTI, JNPCT, NSICT and NSIGT terminals for import cycle via truck movement is depicted in the following table for AMJ 17. The overall performance in Import cycle via truck is better than the import cycle via train. GTI and JNPCT terminals have performed well in the AMJ -17 quarter.
The below table depicts the average JNPT Port Terminals Dwell time for the month of April, May and June for import cycle via truck movement and dotted line represents the JNPT Port dwell time for AMJ quarter i.e. 26 hrs.

``
3.2.2 Port Dwell Time for Train bound Import containers (JNPT) for AMJ’17
The Port Dwell time of GTI, JNPCT, NSICT and NSIGT terminals for train movement in import cycle is depicted in the following graph for quarter AMJ 17. The GTI and NSICT have performed consistently well throughout the quarter with Dwell time of 42 hrs. and 41 hrs. respectively
The below graph depicts the average JNPT port dwell time for month of April, May and June and the dotted line represents JNPT port dwell time for the quarter AMJ 17 i.e. 51 hrs.
In June GTI terminal was hit by virus “Ransomware” which seems to have impacted the operations across the JNPT port thus resulting in increased Dwell Time.

``
The below graphs depicts the container volume handled day wise at respective port terminals during Import via train for the quarter AMJ 17. Most of the containers get cleared from the respective Port terminals within 5 days in import cycle. Amongst all JNPT Terminals, GTI Port Terminal has efficient performance having maximum clearances within 5 days across the AMJ quarter.
** While calculating the Port Dwell time for the rail bound containers, once the loading of the containers on the Rakes are done, at that point of time the Dwell time of the Port cycle closes and post that the waiting time at the port terminals is included in the delivery time from Ports to ICD’s which is actually the time taken by the CTO’s (railways). This helps in proper segregation of the time taken by the Port terminals for clearance vis-à-vis the Railway Operators.
``
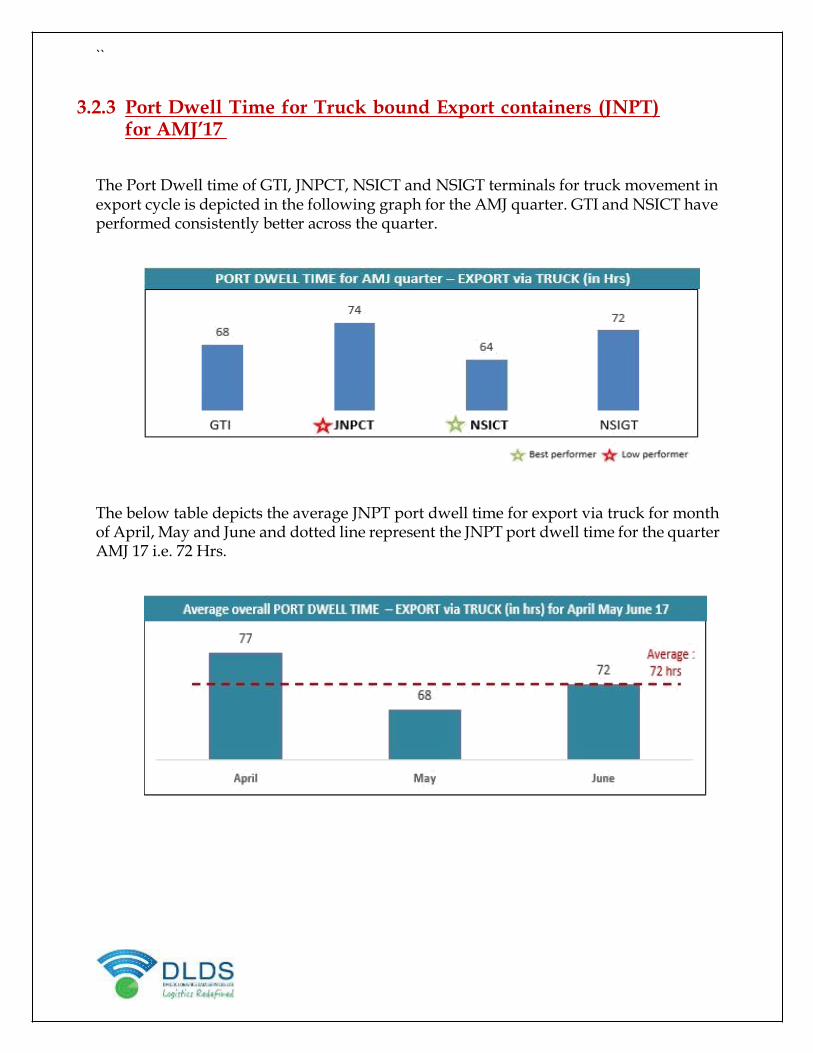
3.2.3 Port Dwell Time for Truck bound Export containers (JNPT) for AMJ’17
The Port Dwell time of GTI, JNPCT, NSICT and NSIGT terminals for truck movement in export cycle is depicted in the following graph for the AMJ quarter. GTI and NSICT have performed consistently better across the quarter.
The below table depicts the average JNPT port dwell time for export via truck for month of April, May and June and dotted line represent the JNPT port dwell time for the quarter AMJ 17 i.e. 72 Hrs.

``
3.2.4 Port Dwell Time for Train bound Export containers (JNPT) for AMJ’17
The Port Dwell time of GTI, JNPCT, NSICT and NSIGT terminals for export cycle via train movement is depicted in the following table for the quarter AMJ 17.
The below table depicts the average JNPT port dwell time for month of April, May and June for export movement via train and dotted line represents the JNPT port dwell time for the quarter AMJ 17.

``
The below graphs depicts the container volume handled day wise at respective port terminals during Export via trains for the quarter AMJ 17
The export cycle via train around 45% of containers are taking more than 5 days to be on-boarded onto the vessel while export cycle via truck is much faster.
Around 52% of the container volume at the JNPT port terminals get cleared within 5 days.
GTI and NSICT clear 57% of their container volume within 5 days in the quarter AMJ 17 which is highest amongst all the port terminals.
As has been the observations over consecutive months, we find that Port Dwell time is higher for Train bound Export/ Import containers. One of the reasons identified for the increase in Export Dwell Time for Port terminals is that the Trains bring in the certain quantity of the containers into the port terminals much in advance wherein some of these containers would be scheduled to depart by vessel post a week or two which leads to increase in the dwell time. Most of the clearances are > 5 days which is getting added to Port Dwell Time.

``
3.3 Container Freight Station Dwell Time for Mumbai Region (AMJ’17)
Below table shows the dwell time of all the CFS’s for the quarter AMJ 17.
Allcargo CFS, Speedy Multimode CFS, CWC Dronagiri CFS are among the top performer for this quarter. The overall average Dwell time of JNPT Region CFS in quarter AMJ 17 is 76 hrs
The below graph depicts the average dwell time in collation with individual dwell time of respective CFSs for the month of June.
Industry Average : 76 Hours(AMJ’17)
Industry Best : 61 Hours(AMJ’17) Industry Worst : 95 Hours(AMJ’17)

``
3.3.1 Container Freight Station Dwell Time for Mumbai Region (June’17)
The below graph depicts the dwell time of CFS for month of June and the dotted line showcase average dwell time in collation with individual dwell time of respective CFSs for the month of June 17.
Industry Average : 78 Hours(June 17)
Industry Best : 57 Hours(June 17)
Industry Worst : 98 Hours(June 17)
CFS’s with dwell time below the average dwell time has been listed below:
Gateway Distriparks CFS, Navi Mumbai
Punjab Conware CFS, Navi Mumbai Continental Warehousing Ltd.
CWC Impex Park CFS, Navi Mumbai
Balmer & Lawrie CFS, Navi Mumbai
JWC Logistics Park CFS
Transindia Logistics Park, Navi Mumbai
AllCargo Logistics CFs, Navi Mumbai
CWC Impex Park CFS, Navi Mumbai
Speedy Multimode CFS, JNPT Navkar Corporation Yard 2 CFS, Panvel
CWC Dronagiri CFS, Navi Mumbai Maharashtra State Corp CFS

``
3.3.2 Container Freight Station- Average Delivery Time (AMJ’17)
Below table shows the average delivery time in import cycle from JNPT to all the CFS's for AMJ quarter FY17-18
Below table shows the average delivery time in import cycle from APM/GTI to all the CFS's for AMJ quarter FY17-18

``
Below table shows the average delivery time in import cycle from NSICT to all the CFS’s for AMJ quarter FY17-18
Below table shows the average delivery time in import cycle from NSIGT to all the CFS's for AMJ quarter FY17-18

``
3.3.2.1 CFS Average Delivery Time- all CFS in Mumbai to JNPT Port (AMJ’17)
Below table shows the delivery time in export cycle from the CFSs to PORT for AMJ quarter FY17-18.
Below table shows the average delivery time in export cycle from all the CFS to JNPT

``
3.4 Inland Container Depot Average Dwell time (AMJ’17)
The below graph depicts the dwell time of all ICDs for AMJ 17 while the dotted line depicts the average ICD dwell time for AMJ 17. It can be seen that 4 ICDs have their dwell time greater than the average dwell time. These ICDs are Allcargo Logistics Park ICD, Dadri, APM Terminals ICD Dadri, CWC Patparganj ICD, and CONCOR ICD
Industry Average : 133 Hours(AMJ’17)
Industry Best : 92 Hours(AMJ’17) Industry Worst : 150 Hours(AMJ’17)

``
3.4.1 Inland Container Depot Average Dwell time (June’17)
The dwell of all ICDs for month of April, May and June 2017. CMA CGM Agencies ICD, Dadri has continued preforming among the top performers.
The average dwell time in collation with individual dwell time of respective ICD for month of June 17
Industry Average : 119 Hours(June 17) Industry Best : 88 Hours(June 17)
Industry Worst : 155 Hours(June 17)

``
3.4.2 Inland Container Depot Average Delivery Time (Train) (AMJ’17)
Below graph shows the average delivery time of import cycle i.e. Port Out to ICD IN via rail of JNPT region transportation for month of April, May and June 17. Aurangabad
despite having shorter distance than NCR region is taking longer delivery time
Below graph shows the average delivery time of ICD in export cycle i.e. ICD out to port in via rail Transportation for month of April, May and June 17

``
3.4.3 Inland Container Depot Average Lead time (AMJ’17)
Below graph shows the average lead time for ICDs in import cycle i.e. Port in to ICD out via train for AMJ 17 .The ICDs in NCR region have low dwell time as compared to Aurangabad region, thus making the lead time for the Aurangabad region higher as compared to NCR region
Average Lead time is calculated by adding the Port Dwell Time, Port to ICD Delivery time and the Dwell Time of all the ICDs present in the region
** To calculate the ICD average lead time for the container to reach port to ICD through Train:
(Port Dwell Time + Port to ICD Delivery Time + ICD Dwell Time = Avg. Lead Time from Port to ICD)

``
3.5 Average Travel Time between Toll Plazas in June’17
The below table shows all the toll plazas covered under DLDS , the average speed from JNPT to Khaniwade and JNPT to Khalapur has decreased from the previous month
showing the signs of traffic congestion in the area. The same is analysed for the area between the Toll Plazas of Bharthan to Vasad and Khaniwade to Charoti

``
3.5.1 Container Freight Station: Clusters (June’17)
3.5.1.1 CFS Cluster: JNPCT Terminal
Based on container movement from port to CFS in Mumbai region, 26 CFS's have been grouped into 7 Clusters on the basis of their vicinity.
Below table shows all the clusters and the relevant data for JNPCT terminal
Note: Please find the respective CFS in each cluster in annexure
• In export cycle the JNPCT terminal is having traffic congestion from cluster 2, cluster 3, cluster 4 cluster 5, cluster 6
• Export container usually aren’t allowed in the port before the arrival of their
respective vessel so this unplanned transportation of the export containers from the CFS's to Port can cause bottlenecks

``
3.5.1.2 CFS Cluster: APM Terminal
Base on container movement from port to CFS in Mumbai region, 26 CFS's have been grouped into 7 Clusters on the basis of their vicinity.
Below table shows all the clusters and the relevant data for GTI terminal
Note: Please find the respective CFS in each cluster in annexure
• In export cycle the APM terminal is having congestion for traffic from cluster 2,
cluster 3, cluster 4, cluster 6
• In import cycle the movement of traffic towards cluster 7 is finding congestion
• Export container usually aren’t allowed in the port before the arrival of their respective vessel so this unplanned transportation of the export containers from the CFS's to Port can cause bottlenecks

``
3.5.1.3 CFS Cluster: NSICT Terminal
Base on container movement from port to CFS in Mumbai region, 26 CFS's have been grouped into 7 Clusters on the basis of their vicinity.
Below table shows all the clusters and the relevant data for NSICT terminal
• Cluster 3 has shown sign of congestion for both Import and Export Cycle
• In export cycle the NSICT terminal is having traffic congestion from cluster 4, cluster 5, cluster 6
• Export container usually aren’t allowed in the port before the arrival of their
respective vessel so this unplanned transportation of the export containers from the CFS's to Port can cause bottlenecks

``
3.5.1.4 CFS Cluster: NSIGT Terminal
Base on container movement from port to CFS in Mumbai region, 26 CFS's have been grouped into 7 Clusters on the basis of their vicinity.
Below table shows all the clusters and the relevant data for NSIGT terminal
Note: Please find the respective CFS in each cluster in annexure
• Cluster 3 has shown sign of congestion for both Import cycle
• Cluster 2 and Cluster 4 have shown traffic congestion for export cycle for reaching NSIGT terminal
• Export container usually aren’t allowed in the port before the arrival of their
respective vessel so this unplanned transportation of the export containers from the CFS's to Port can cause bottlenecks

``
``
3.6 Container Movement Heat Map
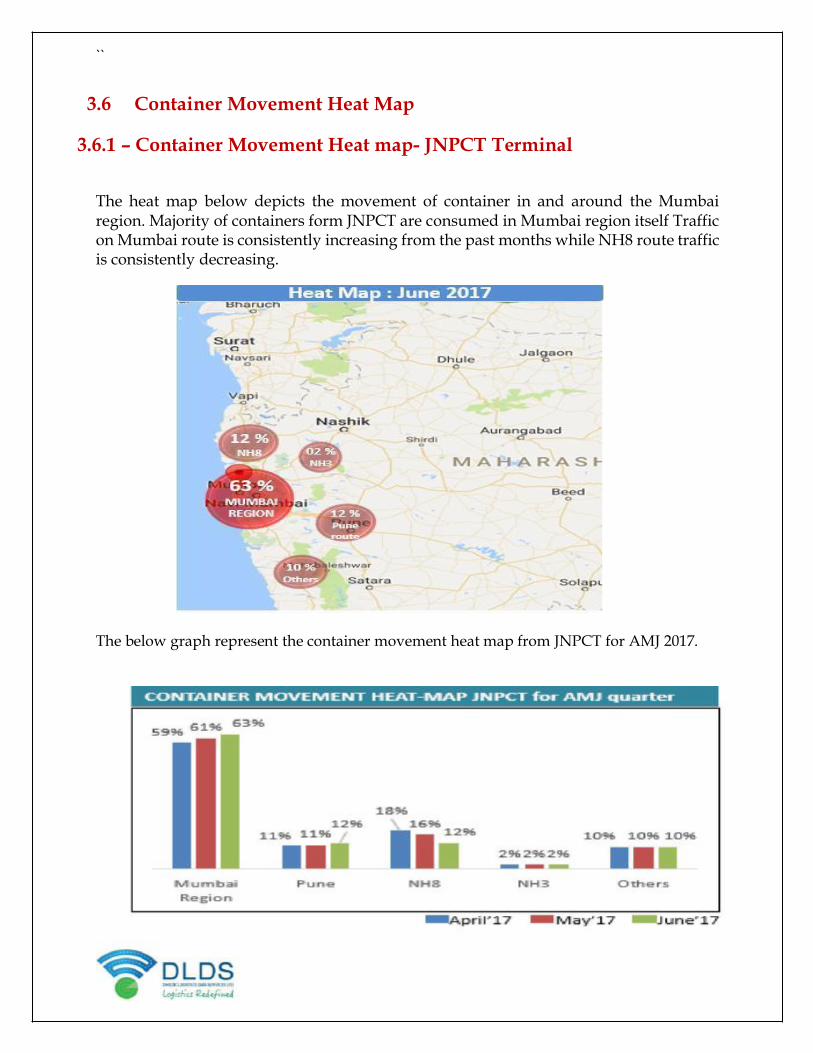
3.6.1 – Container Movement Heat map- JNPCT Terminal
The heat map below depicts the movement of container in and around the Mumbai region. Majority of containers form JNPCT are consumed in Mumbai region itself Traffic on Mumbai route is consistently increasing from the past months while NH8 route traffic is consistently decreasing.
The below graph represent the container movement heat map from JNPCT for AMJ 2017.

``
3.6.2 Container Movement Heat Map- APM Terminal
The heat map below depicts the movement of container in and around the Mumbai region. Majority of containers form JNPCT are consumed in Mumbai region itself and the traffic has increased in Mumbai as well as Pune region from the past month while the traffic is consistently decreasing on NH8 route throughout these months
The below graph represent the container movement heat map from JNPTCT for AMJ 2017.

``
3.6.3 Container Movement Heat Map- NSICT Terminals
The heat map below depicts the movement of container in and around the Mumbai region. Majority of containers form JNPCT are consumed in Mumbai region itself. Traffic has increased in Pune and NH3 region from the past month.
The below graph represent the container movement heat map from JNPTCT for AMJ 2017.

``
3.6.4 Container Movement Heat Map- Overall JNPT Port Terminals
The heat map shows the movement of container in and around the Mumbai region from JNPT port. Majority of containers form JNPT port are consumed in Mumbai region itself for month of June 17.
The below graph represent the container movement heat map from JNPT PORT for month of June 2017.
Note: JNPT port Heat-map contains terminals GTI, NSICT and JNPCT

``
Operations Overview

``
4 Operations Overview
4.1 Port Operations
4.1.1 Port update (JNPT, Mumbai):
4 Port Terminals, 11 toll plazas, 29 CFS and 8 ICDs are currently operational in Mumbai region.
For AMJ’17 Quarter, RFID Implementation for 3 CFSs has been completed.
Installation of Readers at NSICT and NSIGT completed, however the permission for movement of manpower to wharf area is pending from port authorities.
Total 30, 36,978 (from 1st July till Date) numbers of containers have been handled at all four terminals of JNPT.
4.2 Toll Operations
Total of 11 Toll Plazas are now operational in the western corridor covering NH3, NH8, Mumbai-Pune expressway route. One toll plaza at kharegaon is currently non-functional. So, the RFID devices are being dismantled from the said site.
The below MAP depicts the number of Toll Plazas operational till date:
``
Kharegaon Toll Plaza (NH 3) operation has been shut down from 13th May 2017 as per NHAI notification. To replace this Toll Plaza it is decided to implement the Kharghar Toll Plaza at Navi Mumbai which is very near to JNPT Port.

``
4.3 Container Freight Stations/ Inland Container Depot Operations
29 CFS at JNPT, and 8 ICDs are operational in western corridor and data are being received by LDB Data Center.
The below Map depicts all CFS/ICDs Operational in Delhi/NCR and Mumbai region.
For AMJ’17 Quarter, RFID implementation for 3 CFSs at JNPT has been successfully completed and are operational.
JNPT:
SL.No. CFS / Location Name
1 Arshiya Logistics CFS, Navi Mumbai
2 SBW Logistics CFS , Navi Mumbai
3 International Cargo Terminal CFS

``
For JAS Quarter, 8 CFS has been selected for RFID implementation and site survey for selected CFS is planned in the month of July 2017.
5 LDB Portal / Other Updates
Below are few new features which have been added in the LDB Portal website.
LDB has embedded the DLDS corporate video in LDB Portal to provide our current and prospective clients an in depth view of the company and its services. The video is available at https://youtu.be/ofLaJY-ExPo .
LDB user tutorial has been added as a new feature for first time visitor to guide the working of LDB portal.
Google Map View of Live and upcoming LCO’s is now available in Quick Links tab as a new features to know the status of the sites.
Map View for tracking points of containers is available through Google Map. Group & Multiple container search option is available to track all containers together.
Number of Visitors till 8th July 2017: 131,144

``
ANNEXURE

``
High turn-around time in supply chain: Indian logistic competence although has improved by 19 notches and now ranked 38 as per World Bank Report 2016 on LPI, the delays due to roadblock, tolls, inter-state checkpoints and other stoppages are leading to increase in the logistic costs in India to 2 to 3 times global benchmarks India logistics sector still have lower average speeds which results in higher transit times,
this is due to many factors such as waiting times at toll stations, slow movement of the trucks
during the peak hours especially in prime cities and towns, port turnaround times, low
priority accorded to freight trains and poor track infrastructure like about five to seven hours
of transit time of trucks are wasted at the interstate check points. National Highways constitute just 2% of the Indian road network but carry 40% of the total traffic, resulting in severe congestion. Different aspects of the logistics industry falling under different ministries also create inefficiencies in the system. Logistics Performance Index (LPI) India’s outgo on logistic cost to GDP is about 13-14% of value of goods, in-comparison Developed/developing economies the average cost stands at 10-11% value of goods as shown in the table on right. The key reasons are stated below
Higher transit time due to infrastructural bottlenecks across different modes Administrative delays,
Extra indirect taxes Levied for inter-state transport and inefficiencies in the system