dna barcode based phylogenetic analysis of the members of
TRANSCRIPT

DNA barcode based phylogenetic analysis of the members of Zingiberaceae
Final report
Submitted to
University Grants Commission
Research Team
Dr.A.Yusuf- Principal Investigator
Prof.K.V.Mohanan - Co-PI
Santoshkumar R., Research Fellow
Anju V.V. Junior Research Fellow
University of Calicut
Kerala
2021

Introduction
The pantropical family Zingiberaceae (gingers) belongs to a monophyletic order Zingiberales
distributed in the Indo-Malayan region consists of approximately 53 genus and more than
1377 species (Kress et al., 2002; Kong et al., 2010), having economic and ornamental
potential (Uma and Muthukumar, 2014) (Fig.1). Species level identification is complicated in
this family because of similarities in the morphological characters between the species,
phenotype plasticity and seasonal flowering cycles of short duration. Correct identification
and characterization of the taxa are important for their classification, conservation, cultivar
development and phylogenetic studies (Silva et al., 2018). The family Zingiberaceae has been
a taxonomically neglected group mainly due to the inaccessible nature of the wet evergreen
forests in which they grow and their short flowering period coinciding with the monsoon
season. The delicate nature of flowers, loss of color and formation of a gummy mass soon
after collection makes the floral morphology based taxonomical studies difficult.
The currently accepted classification of the family Zingiberaceae is based on the vegetative
and floral characters (Petersen, 1889; Schumann, 1904; Holttum, 1950; Burtt and
Smith 1972; Smith, 1981; Larsen et al., 1998) and the family is divided into four tribes
(Hedychieae , Alpinieae, Zingibereae and Globbeae). Major genera belong to this family are
Alpinia, Amomum, Curcuma, and Zingiber and to a lesser extent Boesenbergia, Kaempferia,
Elettaria, Elettariopsis, Etlingera and Hedychium (Jatoi et al., 2007). The genera of the
family Zingiberaceae is divided into four subfamilies, the Siphonochiloideae (the genus
Siphonochilus only), the Tamijioideae (the single genus Tamijia), the Alpinioideae (most of
the former Alpinieae), and the Zingiberoideae (including the former tribes Hedychieae,
Zingibereae, and Globbeae) (Kress et al., 2002). Curcuma is one of the important genera
from this family which is difficult to preserve for plant hunters, herbarium technicians as well
as taxonomists. The correct identification is necessary for proper utilization and conservation
of Zingiberaceous crops, hence molecular markers are used to solve the problem of
delimitation of these taxa. However, strong molecular support is lacking in the diversity
studies of Zingiberaceous members in India.

Fig-1. The Family tree- rhizogram of Ginger order
Curcuma L.
Curcuma L. is one of the third-largest genera in the family Zingiberaceae comprising 120
species; widely distributed throughout the tropical and sub-tropical Asia and few species
extending to Australia and Pacific region (Skornickova et al., 2004). Twenty one species
including one variety have been reported from South India (Sabu, 2006). These plants are
used as spices, in medicines, culinary, and ornamental plants (Chen and Xia, 2011). The
genus has confused species discrimination; hence the proper taxonomic identification of the
specimen is very important for meaningful bio prospecting as well as for effective
conservation. Kress et al. (2000) proposed a new classification for Zingiberaceae and placed
Curcuma under the tribe Zingibereae and this genus is taxonomically quite confusing.
Morphology based classification of the genus has its own drawback as some of the key
taxonomic traits remain controversial (Santapau, 1945). Molecular characterization is used as
an addition to the traditional methods of germplasm characterization in many crop plants
(Semagn et al., 2006). C. longa syn. C. domestica is one of the most commonly utilized
species, other species such as C. aromatica, C. amada, C. kwangsiensis, C. zedoaria, C.
caesia, C. malabarica, C. angustifolia, C. montana, C. decipiens, C. alismatifolia, C.

zanthorrhiza, C. aeruginosa and C. pseudomontana are some of the economically
important species of Curcuma.
Zingiber Sp.
Another important member of Zingiberaceae family is Zingiber (Ginger) contain about 141
species of which 7 species are reported from western Ghats of Southern India. Rhizomes of
ginger are subterranean and has commercial importance. Three species of Zingiber, viz.
Z.officinale, Z.nimmonii and Z. zerumbet were collected from different regions for
phylogeny studies.
Other related species used for the study were, Alpinia galanga, Amomum masticatorium,
Globba ophioglossa, Globba schomburgkii, Kaempferia rotunda and Hedychium
coronarium.
DNA Barcode in angiosperms
DNA-barcoding is a method used to study the taxonomic characterization and phylogenetic
analysis of different organisms using specific DNA sequences. The defined region within the
DNA of an organism undergoes evolutionary divergences which are conserved between and
within the species. This technique utilizes short DNA segments of nuclear and/ or
cytoplasmic genome for rapid identification of biological specimens at the species level.
Hebert et al. (2003a) proposed the term “Taxon Barcodes” for species level identification. In
conservation biology, plant DNA barcoding plays an important role in the assessment of
biodiversity hotspots and international trade of rare species.
The DNA barcoding did not attain much attention during earlier years due to the inability to
use cytochrome oxidase (COX1) as a universal barcode (Cho et al., 2004). The plant
mitochondrial genome evolves much more slowly than animal mitochondrial genome. The
mitochondrial COXI (cytochrome oxidase I) gene is not suitable for the distinction of plant
species (Rubinoff, 2006). Many candidate genes have been recommended as potential
barcodes for plants, however, no accepted universal barcodes were agreed for plants, though;
nine intergenic spacers were used as plant DNA barcodes. Based on this a barcode criteria
was proposed for most of the variable regions (trnK-rps16, trnH-psbA, rp136-rps8, atpB-
rbcL, ycf6-psbM, trnV-atpE, trnC-ycf6, psbM-trnD and trnL-F), that meets these criteria.
However, Kress et al., (2005) recommended the nuclear ITS (internal transcribed spacer) and
trnH-psbA spacer from the chloroplast genome as DNA barcodes for flowering plants. DNA
barcodes are used for plant identification and also as genetic resource tags helping the

conservation of genetic diversity (Eaton et al., 2010; Jeanson et al., 2011) and also for
biodiversity inventorization and analysis (Costion et al., 2011), by using the smaller
fragments of DNA, called as minibarcodes (Meusnier et al., 2008). It is used in a wide variety
of applications like forest biosecurity and biosurveillance of habitats by identifying invasive
species from the native species (Armstrong and Ball 2005; Humble and deWaard, 2010).
The plant DNA barcodes are multi-locus, with one “anchor” (i.e. universal across the plant
kingdom) and “identifiers” to distinguish closely related species concluded by CBOL plant-
working group (PWG). Still, there is no consensus on the best candidate marker for plant
DNA barcoding. In future, the combination of barcoding genes will certainly contain
noncoding intergenic spacers like trnH-psbA (Kress et al., 2005; Kress and Erickson, 2007)
and plastid/ chloroplast coding sequences like matK (Chase et al., 2007). The ability and use
of barcoding in plants permit the use of highly degraded samples (permafrost samples) and
other samples such as processed food and medicinal plants (Taberlet, 2007). Since, they
recommended the chloroplast trnL (UAA) intron or a shorter fragment of this intron (the P6
loop, 10-143 bp), though, they have relatively low resolution could be improved with highly
conserved primers.
Combinations of three locus barcode like matK+rpoB+rpoC1 and matK+rpoC1+trnH-psbA
are proposed by Chase et al. (2007). Hollingsworth et al. (2009) developed some
combinations of rbcL, matK, rpoC1 and trnH-psbA that act as a universal plant DNA barcode
for land plants. The plant’s core barcode combination of matK and rbcL are recommended by
CBOL Plant Working Group (2009). Two gene core barcodes for ferns were used and
proposed Li et al. (2011a).
Phylogenetic analysis
Phylogenetic analysis is a method used to study the evolutionary relationship or history
among the group of taxa such as species from their ancestors with the order of branching and
divergence over a time span. The term also can apply for the genealogy of genes derived
from a common ancestral gene. Nowadays, DNA or proteins based molecular phylogenetic
analysis become more prominent due to the advantages, such as; (1) popularity of DNA
sequencing method, (2) establishment of methods for phylogenetic tree construction using
gene or protein sequences, (3) The results of a phylogenetic analysis being treated in a

quantitative pattern, (4) Availability of many programs for constructing a phylogenetic tree.
The basic information carried out from the phylogenetic analysis contributes to basic
biology (e.g. evolutionary history of the species, the evolution of genes, and identification of
sampled species) applied biology (e.g. examination of the method of the infection of
pathogenic microorganisms). Phylogenetic trees are usually constructed based on the
evolutionary relationship among species (Nei and Kumar, 2000). In recent years, molecular
phylogeny is improved with techniques and analyses of nucleic acid and protein sequencing.
The rRNA typing used to direct reverse transcriptase mediated sequencing of the portion of
both the small and large subunits of ribosome (Zuckerkandl et al., 1965; Sarich et al., 1967).
In the total cellular RNAs the rRNA is the major RNA and it is relatively easy to obtain
enough RNA for sequencing.
In the past 20 years one major achievement in the field of phylogenetic studies (in particular
TOL), is related to molecular data (especially, gene sequence data). For example, 159
released data from GenBank [a member of the International Nucleotide Sequence Database
Collaboration (INSDC)] contains 75 billion nucleotides in 72 million sequences plus another
93 billion nucleotides just in the WGS (whole genome shotgun) sequence division stemming
from 787 registered genome projects (Benson et al., 1999; Benson et al., 2011; Rindone,
1983). Numerous tools and algorithms have been used in phylogenetics to further improve
the capabilities of large data processing. However, there are still many technical problems to
be solved, including data collection and screening of DNA sequences, automatic construction
of large trees (Supertree) (Ciccarelli et al., 2006; Meng et al., 2013; Meng et al., 2011).
Reconstruction of Phylogenetic Trees
The evolutionary history cannot be directly observed, it must be inferred by comparative
morphological, physiological or molecular analyses. Reconstructing a tree of life by resolving
the evolutionary and genealogical relationships among organisms has been an important
focus of evolutionary biology (Futuyma, 2005). In addition to deciphering the evolutionary
relationships among taxa, phylogenetic trees are useful for understanding the adaptive
evolution and the evolution of multigene families. Several statistical methods are available
for reconstructing the phylogenetic trees based on the molecular data mainly classified into
three main groups: distance methods, parsimony methods and maximum likelihood methods
(Nei and Kumar, 2000). Different algorithms are available for processing nucleotide or amino

acid sequences to generate phylogenetic trees that reflect the estimated evolutionary
relationships among taxonomic units. In a phylogenetic tree, the inferred evolutionary
relationships are displayed by tree topology and branch lengths. Therefore, an approximation
of these two parameters should be as accurate as possible. While branch length calculations
are based on relatively simple statistical models, determination of the true topology is
challenging due to a large number of possible alternative topologies
Objectives:
1. Collection, identification and establishment of field germplasm repositories for the
collected samples of Zingiberaceous members.
2. Standardisation of protocols for DNA extraction from all the species
3. Standardisation of PCR conditions for the plastid barcode sequences psbA- trnH, rbcL,
trnL-trnF, matK, psbK-psbI, atpF-atpH and two mitochondrial barcodes COX1 and atp1
4. Sequencing and editing of sequences with Bioedit program, analysis of sequence data by
using MEGA 6.0

2. Materials and Methods
1. Collection of Plant materials:
Rhizomes and whole plants of 21 species of Curcuma, 3 species of Zingiber, 1 species of
Alpinia, 1 species of Amomum , 2 species of Globba , 1 species Kaempferia and 1 species of
Hedychium were collected from different localities of South India and maintained in the
Calicut University Botanical garden (Fig. 2-8 ). The plant samples were identified using flora
and experts were consulted for the correct identification of the material. After identification
the entire plants or its rhizomes were planted in the pots and labeled.
Table-1. List of Zingiberaceae species collected from different geographical locations of
Southern India
S.No Plant species Place of collection
1 Curcuma bhatii Udupi, Karnataka
2 Curcuma oliganthavar.oligantha Karimbam,Kannur, Kerala
3 Curcuma oliganthavar.lutea Karimbam,Kannur, Kerala
4 Curcuma coriacea Painavu,Idukki, Kerala
5 Curcuma neilgherrensis Gudalur, Karnataka
6 Curcuma montana Andhra Pradesh
7 Curcuma inodora Karwar, Karnataka
8 Curcuma pseudomontana Attapadi, Palakkad, Kerala
9 Curcuma decipiens Alathur, Palakkad, Kerala
10 Curcuma mutabilis Nilambur, Kerala
11 Curcuma karnatakensis Udupi,Karnataka
12 Curcuma raktakanta Aluva, Kerala
13 Curcuma aromatica Nilambur & Idukki, Kerala
14 Curcuma kudagensis Talakaveri & Kudagu Ka’taka
15 Curcuma haritha Kolathara,Calicut, Kerala
16 Curcuma longa Malappuram, Kerala
17 Curcuma aeruginosa Nilambur, Kerala
18 Curcuma ecalcarata Nilambur, Kerala

19 Curcuma vamana Thrissur, Kerala
20 Curcuma amada Calicut, Kerala
21 Curcuma zanthorrhiza Thrissur, Kerala
22 Zingiber nimonii C. U. campus, Kerala
23 Zingiber officinale “
24 Zingiber zerumbet “
25 Alpinia galanga Malappuram, Kerala
26 Amomum masticatorium Idukki, Kerala
27 Globba ophioglossa Calicut, Kerala
28 Globba schomburgkii Calicut, Kerala
29 Kaempferia rotunda Palakkad, Kerala
30 Hedychium coronarium Calicut, Kerala

Fig.2 C.coreacea A- Habit; B- Inflorescence; C-C. decipiense- Habit

Fig.-3 C. haritha A-Habit, B-Inflorescense; C- C.inodora- Habit, D-Inflorescense, E-
Flowers

Fig.4- A- C.aeruginosa- habit, B- Flower, C-leaf ; D- C.amada- inflorescence, E-
flower, F- T.S. of root

Fig.5-A-C.aromatica- Habit, B- Inflorescence C- C.aurantiaca- Habit, D- Inflorescence; F-
C.bhatti, G- inflorescence

Fig.6. C.karnatakensis- A- Inflorescence, B- Habit, C- C.longa- Habit, D- Inflorescence, E-
C.montana- Habit, F- Inflorescence

Fig.7- C.mutabilis- Habit; B,C,D- Flower colour variations E- C.neilgherensis-
inflorescence, F- Habit

Fig.8. A-C.oligantha var. oligantha- Habit, B- C.oligantha var.lutea- Habit, C- Inflorescence
D- C.montana- Inflorescence, E- Habit

Fig.9. C.raktakanta- Habit, B- Inflorescence C- C.vamana- Habit, D- Inflorescence,
E- C. zanthorrhiza- Habit, F- Inflorescence
2. Standardisation of methods for the isolation of DNA, quantification and quality
assessment
Genomic DNA was isolated from the fresh leaves of Curcuma, Zingiber, Alpinia, Globba,
Amomum, Kaempferia and Hedychium using modified CTAB method (Doyle and Doyle, 1987).
Extraction buffer contained 2 % (w/v) CTAB, 1M Tris–HCl (pH 8), 0.5M EDTA (pH 8) and 5
M NaCl. The samples were powdered in liquid N2 and the powder was transferred to pre-heated
(65o C) CTAB buffer. 2% (w/v) of PVP was added at the time of homogenization. Proteinase K

(10 mg/ml) and 2 % (w/v) β-mercaptoethanol were added to the extract and mixed well.
Samples were incubated at 60oC for 60 min with frequent mixing. The extract was centrifuged
at 4oC for 12 min at 12,000 rpm and the supernatant was collected in a new Eppendorf tube.
Added equal volume of chloroform: isoamyl alcohol (24:1) to the supernatant and centrifuged at
4oC for 12 min at 12,000 rpm. The supernatant was extracted twice with equal volume of
phenol: chloroform: isoamyl alcohol (25:24:1), followed by extraction with chloroform:
isoamyl alcohol (24:1), and centrifuged at 12,000 rpm in 4oC for 12 min. The supernatant was
transferred to a fresh Eppendorf tube and one by third volume of chilled isopropyl alcohol was
added, and incubated for 1hour at -80oC. The sample was centrifuged at 4
oC for 12 min at
12,000 rpm and the pellet was dissolved in TE. 10µl of RNase was added to dissolve the DNA.
Incubated at 40oC for 30 min and added equal volume of chloroform: isoamyl alcohol (24:1)
mixed well and centrifuged at 4oC for 12,000 rpm. The upper layer was transferred to a fresh
Eppendorf tube and added chilled isopropyl alcohol and mixed well. The samples were
incubated at -80oC for one and half hrs and centrifuged at 4
o C for 12 min at 12,000 rpm to
pellet the DNA. DNA pellet was washed with 70 % (v/v) chilled ethanol and air dried at room
temperature and re-dissolved in 20 µl TE buffer. This purified DNA was stored at -80oC.
Quality and quantity of DNA samples were assessed using a nanodrop spectrophotometer
(Thermo, USA). The samples were run on 1 % (w/v) agarose gel and visualized to assess the
DNA quality using a gel documentation system.
3. Standardisation of PCR conditions for different barcode primers
Barcode primers, matK, psbA- trnH, rbcL,atpF-H, psbK-psbI, Cox1 and Atp1 were used for
barcode analysis using PCR. The PCR product produced by the primers of the barcode was size
fractionated and sequenced. Polymerase chain reactions were conducted in 25 μl final volume
containing 2.5μl 10x buffer, 1U Taq DNA Polymerase, 10mM dNTP mix, 1.5mM MgCl2,
88.4nM forward primer, 72.4 nM reverse primer, 20ng template DNA and the final volume was
adjusted using ddH2O. The amplification condition consist of an initial denaturation at 94°C for
2 min, 30 cycles comprising denaturation at 94°C for 15 sec, annealing temperatures in a
gradient of 53 to 61°C for 30 sec, extension at 72°C for 1 min and final extension at 72°C for 10
min. After amplification the PCR product was checked using electrophoresis in a 1% (w/v)
agarose gel and the band was eluted and purified using Minigel purification kit (Takara, Japan).
Sequencing was done from Scigenom Lab Pvt, Ltd (Cochin, Kerala), on a charge basis.

The barcode primers used for Curcuma, Zingiber, Alpinia, Amomum, Globba, Hedychium and
Kaempferia are given in Table-2 and the annealing temperature for each primer was
standardised.
Table-2. Primer sequences and the annealing temperatures standardised for
different species used for the study
Primer
Primer Sequences 5’→3’ Ann.
temp.
Ann. temp.
Zingiber
Alpinia,
Globba,
Amomum,
Hedychium &
Kaempferia
Curcuma
psbA-
trnH
F-CTTGGTATGGAAGTAATGCA
R- ATCCACTTGGCTACATCCG
59oC 60.7
oC
rbcL F-TCTGTTACTAACATGTTTACTTC
R- TCCCTCATTACGAGCTTGTACACA
55oC 57.7
oC
trnL-
trnF
F-CGAAATCGGTAGACGCTACG
R-ATTTGAACTGGTGACACGAG
59.8 59.8
matK F-GAAGATAGATCTCGGCAAC
R-TTACATAAAAATGTATTC GCTC
55.6 58.8
psbK-
psbI
F-TTAGCATTTGTTTGGCAAG
R-AAAGTTTGAGAGTAAGCAT
53 55.6
atpF-
atpH
F-ACTCGCACACACTCCCTTTCC
R- GCTTTTATGGAAGCTTTAACAAT
58 60.5
The annealing temperature was standardized to generate a high intensity molecular size band
for all the primers. PCR and sequencing success rate was very high for all the twenty one
Curcuma species, Zingiber spp and other Zingiberaceous members (99.0% of individuals, 100%
species) with a PCR product size corresponding to the primer.
The DNA sequences obtained for each primer were aligned, assembled and edited with
SeqMan (DNASTAR package). The sequences were aligned using ClustalW and final

adjustment was done manually and the phylogenetic tree was constructed. Inter and
intraspecific genetic divergence was calculated using each barcode following Meyer and
Paulay (2005) by using Kimura2-parameter (K2P) distance in MEGA 6.0 following
instructions of CBOL for distance calculations. Three distance matrices were used to
characterise intraspecific divergence. (1) Average pairwise distances between all the
individuals sampled within those species that had atleast two representatives (2)Mean theta
with theta being the average pairwise distance calculated for each species that had more than
one representative (3) average coalescent depth, also was analysed. For each barcode the
pairwise distance was calculated with simplest K2P model according to Lahaye et al. (2008).
Phylogenetic analysis was conducted by preparing trees using PAUP by maximum parsimony
and UPGMA. MP analysis was performed using tree bisection reconnection branch swapping
and 1000 random addition sequence replication keeping 100 trees at each step.
4. Sequencing of PCR products, editing and annotation of the sequences,
submission of the sequences to NCBI, construction of phylogenetic trees.
DNA sequences of all the Curcuma species were minimally edited and manually aligned using
BioEdit software. The coding regions of matK, rbcL ,CoxI, trnlC-trnlF and ATP1obtained from
the 21 Curcuma species was sequenced. The sequences were submitted to the Genbank of NCBI
and the accession numbers were provided by NCBI. The analysis of the DNA sequence was
conducted by Neighbour-joining to assess topology with MEGA 6.0. All the regions containing
gaps and missing data were eliminated. The species identification and homology between the
sequences was identified using BLAST method. The phylogenetic tree was developed using
Neighbour-joining (NJ) method which was tested with Kimura 2-parameter for evolutionary
distances in MEGA6.0 and node support was assessed on 1000 bootstrap replicates.

Results
Phylogenetic analysis based on the matk sequences
The Thirty DNA barcode sequences of 800bp (Fig.10) from all the samples were minimally
edited and manually aligned using BioEdit software. All the regions containing gaps and missing
data were eliminated. The species identification and homology between the sequences was
identified using BLAST program. The estimated transition/transversion bias (R) is 1.19.
Substitution pattern and rates were estimated using the Kimura (1980) 2-parameter model. The
evolutionary history was inferred using the Maximum Parsimony method. The bootstrap
consensus tree inferred from 1000 replicates is taken to represent the evolutionary history of the
taxa analyzed. Branches corresponding to partitions reproduced in less than 50% bootstrap
replicates are collapsed. The percentage of replicate trees in which the associated taxa clustered
together in the bootstrap test (1000 replicates) is shown next to the branches. The MP tree was
obtained using the Subtree-Pruning-Regrafting (SPR) algorithm with search level 1 in which the
initial trees were obtained by the random addition of sequences (10 replicates). This analysis
involved 30 nucleotide sequences. Codon positions included were 1st+2nd+3rd+noncoding.
There were a total of 736 positions in the final dataset. Evolutionary analyses were conducted in
MEGA 6. The consistency index is ( 0.941176), the retention index is ( 0.976744) and the
composite index is 0.958315 ( 0.919289) for all sites and parsimony-informative sites (in
parentheses). Evolutionary analyses were conducted in MEGA 6. The phylogenetic analysis of
30 species based on the matK sequences shows that there are three groups, Group I contains
Alpinia galanga, Amomum masticatorium and Hedychium coronarium clustered with a clade of
Zingiber zerumbet, Z. officinale, Z.nimmoni and with a single clade of Globba ophioglossa, G.
Schomburgkii with 44% bootstap value. The genetic similarity between the species is evident as
they constitute one phylogenetic group. Kaemferia rotunda exists as a monoclade. GroupII
contain a cluster of Curcuma mutabilis, C. neilgherrensis, C. kudagensis, C.oligantha var lutea.
C. oligantha var oligantha, C. bhatti, C. karnatakensis, C. coriacea with 41% bootstrap value.
Group III comprises a cluster of C. vamana, C. ecalcarata, C. inodora, C. xanthorrhiza, C.
longa, C. pseudomontana, C.aromatica, C. decipiens, C. amada, C. haritha, C. aeruginosa, C.
raktakanta, C.montana with 55% bootstap value. The phylogenetic analysis based on the matK
sequences highly recommend the monophyletic nature of Curcuma species.(Fig. 11)

Fig 10: Electrophoretic profile showing 800bp band of matK PCR product of 30 species

Fig. 11: Phylogenetic analysis of Alpinia galanga, Amomum masticatorium, Hedychium
coronarium, Zingiber zerumbet, Z. officinale, Z.nimmoni , Globba ophioglossa, G.
Schomburgkii, Kaemferia rotunda and 21 Curcuma species maximum parsimony analysis on
the matk sequences
Phylogenetic analysis based on the rbcL sequences
The rbcL barcode primers generated a DNA band of 1000bp in all the species studied (Fig.12)
The DNA barcode sequences cloned from the plant species by the rbcL primer were minimally
edited and manually aligned using BioEdit software. All the regions containing gaps and missing
data were eliminated. The species identification and homology between the sequences was
identified using BLAST method. The evolutionary history was inferred using the Maximum
Parsimony method. The bootstrap consensus tree inferred from 1000 replicates is taken to
represent the evolutionary history of the taxa analyzed. Branches corresponding to partitions
reproduced in less than 50% bootstrap replicates are collapsed. The MP tree was obtained using
the Subtree-Pruning-Regrafting (SPR) algorithm with search level 1 in which the initial trees
were obtained by the random addition of sequences (10 replicates). Codon positions included
were 1st+2nd+3rd+Noncoding. There were a total of 991 positions in the final dataset.
Evolutionary analyses were conducted in MEGA 6. The consistency index was 0.975701, the
retention index was 0.987292 and the composite index was 0.965575 ( 0.963302) for all sites and
parsimony-informative sites (in parentheses). The phylogenetic analysis of 30 species formed
three groups: Group I comprises Kaempferia rotunda clustered with the single clade of Globba
ophioglossa and Globba schomburgkii with 99% bootstrap value. The Zingiber nimmonii , Z.
zerumbet clustered with Z. officinale with 88% bootsrap value. Hedychium coronarium and C.
oligantha var oligantha form a single clade and clustered with another single clade of Alpinia
galanga and Amomum masticatorium with 32% bootstap value with a common ancestor. The
Group II contains C. mutabilis, C. neligherrensis, C. pseudomontana, C. kudangensis, C.
oligantha var lutea, C coriacea clustered with a single clade of C. vamana and C. bhatti and also
with C. karnatakensis, C. inodora and C.decipiens with very low bootstrap value. The Group III
comprises the cluster of C.montana, C. ecalcarata, C. xanthorrhiza, C.longa, C. amada, C.
haritha, C. aeruginosa, C.raktakanta, C. aromatica with low bootstrap value.(Fig. 13)

Fig 12: Agarose gel showing 1000bp band of rbcL PCR product of 30 species

Fig.13 : Phylogenetic analysis using Maximum Parsimony method using rbcL sequences
cloned from Alpinia galanga, Amomum masticatorium, Hedychium coronarium, Zingiber
zerumbet, Z. officinale, Z.nimmoni , Globba ophioglossa, G. Schomburgkii, Kaemferia
rotunda and 21 Curcuma species

Phylogenetic analysis based on the trnlC-trnlF sequences
The trnlC-trnlF barcode primers generated a DNA band of 1600 bp (Fig. 14). These sequences
were minimally edited and manually aligned using BioEdit software. All the regions containing
gaps and missing data were eliminated. The species identification and homology between the
sequences was identified using BLAST method. The evolutionary history was inferred using the
maximum parsimony method. The bootstrap consensus tree inferred from 1000 replicates is
taken to represent the evolutionary history of the taxa analyzed. Branches corresponding to the
partitions reproduced in less than 50% bootstrap replicates are collapsed. The MP tree was
obtained using the Subtree-Pruning-Regrafting (SPR) algorithm with search level 1 in which the
initial trees were obtained by the random addition of sequences (10 replicates). This analysis
involved 30 nucleotide sequences. Codon positions included were 1st+2nd+3rd+Noncoding.
There were a total of 1500 positions in the final dataset. Evolutionary analyses were conducted in
MEGA 6. The consistency index ( 0.852601), the retention index ( 0.959053), and the composite
index 0.864720 ( 0.817689) for all sites and parsimony-informative sites (in parentheses).
Phylogenetic analysis based on the barcode sequences of trnlC-trnlF shows there are four groups
and Group I it contains two single clade of Curcuma coriacea, C. karnatakensis and Alpinia
galanga, Amomum masticatorium clustered with a clade of Zingiber nimmonii, Z. zerumbet, Z.
officinale, Globba schomburgkii and C. amada with 99% bootstrap value. C. decipiens exist as a
monoclade. Group II contain a clade of C. raktakanta, C. ecalcarata, C. xanthorrhiza, C. longa,
C. psuedomontana, C.vamana, C. aeruginosa, C. oligantha var. oligantha with 66% bootstrap
value. Group III contain a cluster of C. bhatti, C. aromatica, C. kudagenesis, Globba
ophioglossa with low bootstrap value. Group IV comprised of a cluster containing C. haritha,
C.montana, C. neilgherrensis, C.inodora, C.mutabilis with 50% bootstrap value.(Fig. 15)

Fig 14: Agarose gel showing 1600bp band of trnlC-trnlF PCR product of 28 species

Fig. 15: Phylogenetic analysis using Maximum Parsimony method using sequences cloned
from Alpinia galanga, Amomum masticatorium, Hedychium coronarium, Zingiber zerumbet,
Z. officinale, Z.nimmoni , Globba ophioglossa, G. Schomburgkii, Kaemferia rotunda and 21
Curcuma species based on trnlC-trnlF sequences

Phlogenetic analysis based on the atpF-atpH sequences
The atpF-atpH primers generated a DNA band of 750bp (Fig.16) The DNA sequences of the all
samples were minimally edited and manually aligned using BioEdit software. All the regions
containing gaps and missing data were eliminated. The species identification and homology
between the sequences was identified using BLAST method. The evolutionary tree was
constructed using the Maximum Parsimony method. The bootstrap consensus tree inferred from
1000 replicates is taken to represent the evolutionary pathway of all the species under study.
Branches corresponding to partitions reproduced in less than 50% bootstrap replicates are
collapsed. The percentage of replicate trees in which the associated taxa clustered together in the
bootstrap test (1000 replicates) is shown next to the branches. The MP tree was obtained using
the Subtree-Pruning-Regrafting (SPR) algorithm with search level 1 in which the initial trees
were obtained by the random addition of sequences (10 replicates). This analysis involved 27
nucleotide sequences. Codon positions included were 1st+2nd+3rd+Noncoding. There were a
total of 991 positions in the final dataset. Evolutionary analyses were conducted using MEGA 6.
The consistency index is ( 0.930693), the retention index is ( 0.967442), and the composite index
is 0.919208 ( 0.900391) for all sites and parsimony-informative sites (in parentheses). The
phylogenetic analysis based on the atpF-atpH shows there are three groups, Group I contain a
cluster of Amomum masticatorium, Globba schomburgkii, C. coriacea, C. aromatica, C.
oligantha var. lutea, Globba ophioglossa, C. psuedomontana, Zingiber officinale, C. amada,
C.montana clustered with single clade of C. kudangensis, C. mutabilis and Zingiber nimmonii,
Zingiber zerumbet. C. bhatti exists as a monoclade. C. raktakanta, C. xanthorrhiza,
C.aeruginosa forms a cluster and joined with this group. Group II it contain C. karnatakensis, C.
ecalcarata, C. inodora, C. longa, C.neilgherrensis with 44% boot strap value. Group III it
contain a cluster of C. oligantha var. oligantha, C. decipiens, C. vamana and C. haritha with
45% boot strap value.(Fig .17)

Fig 16: Agarose gel showing 750 bp band of atpF-atpH PCR product of 27 species

Fig.17: Phylogenetic analysis using Maximum Parsimony method using sequences cloned
from Alpinia galanga, Amomum masticatorium, Hedychium coronarium, Zingiber zerumbet,
Z. officinale, Z.nimmoni , Globba ophioglossa, G. Schomburgkii, Kaemferia rotunda and 21
Curcuma species based on atpF-atpH sequences

Phlogenetic analysis based on the psbK-trnH sequences
The psbK-trnH barcode primers generated a DNA band of 800 bp in all the species (Fig.18) The
DNA sequences of the all samples were minimally edited and manually aligned using BioEdit
software. All the regions containing gaps and missing data were eliminated. The species
identification and homology between the sequences was identified using BLAST method. The
evolutionary history was inferred using the maximum parsimony method. The bootstrap
consensus tree inferred from 1000 replicates is taken to represent the evolutionary history of the
taxa analyzed. Branches corresponding to partitions reproduced in less than 50% bootstrap
replicates are collapsed. The percentage of replicate trees in which the associated taxa clustered
together in the bootstrap test (1000 replicates) is shown next to the branches. The MP tree was
obtained using the Subtree-Pruning-Regrafting (SPR) algorithm with search level 1 in which the
initial trees were obtained by the random addition of sequences (10 replicates). This analysis
involved 24 nucleotide sequences. Codon positions included were 1st+2nd+3rd+Noncoding.
There were a total of 800 positions in the final dataset. Evolutionary analyses were conducted in
MEGA 6. The consistency index is ( 0.957265), the retention index is ( 0.958333), and the
composite index is 0.950617 ( 0.917379) for all sites and parsimony-informative sites (in
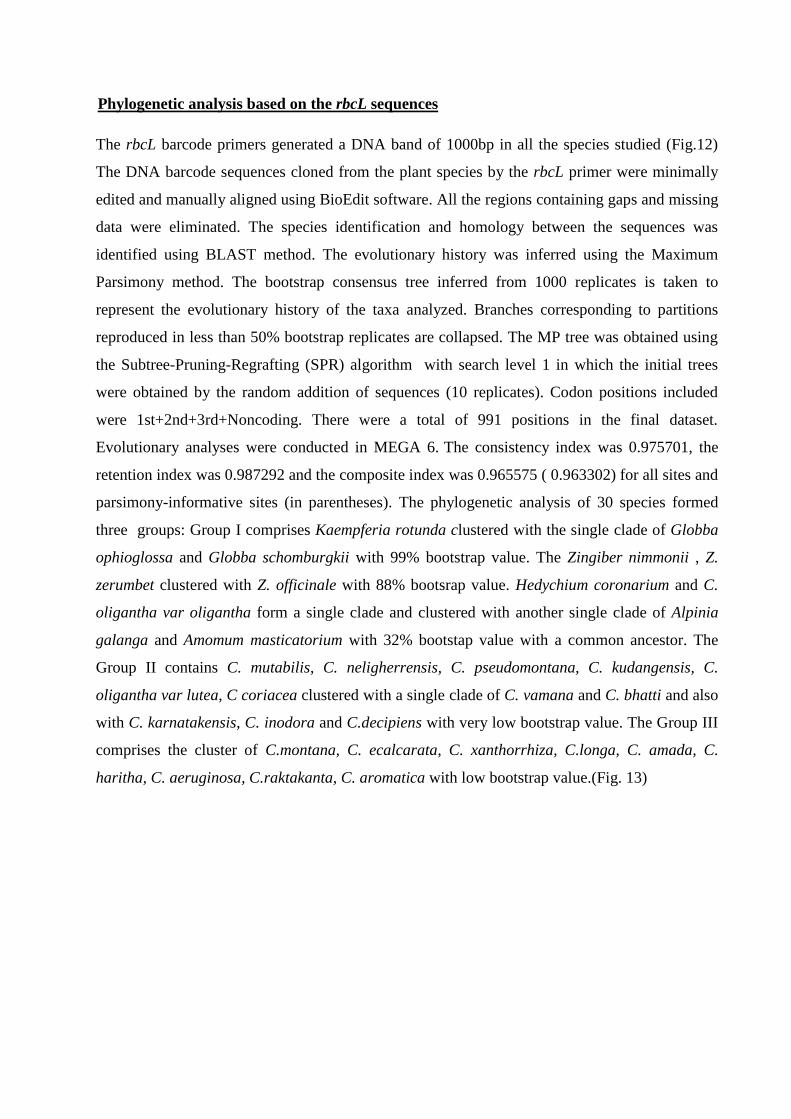
parentheses). The phylogenetic analysis shows that there are two groups, Group I contain
Zingiber nimmonii, Zingiber zeerumbet, Zingiber officinale, clustered with a single clade of
Curcuma vamana, Curcuma pseudomontana and Curcuma karnatakensis, Curcuma
kudengensis, Curcuma oligantha var. lutea, , Curcuma bhatti with 37% bootstrap value. Group
II contain a single clade of Curcuma coriacea, Curcuma aeruginosa clustered with Curcuma
ecalcarata, Curcuma inodora, Curcuma neilgherrensis, Curcuma xanthorrhiza, Curcuma
montana, Curcuma longa, Curcuma mutabilis, Curcuma aromatica, Curcuma decipiens,
Curcuma amada, Curcuma haritha, Curcuma oligantha var. oligantha with 37% bootstrap
value. Curcuma raktakanta it exist as a monoclade.(Fig. 19)

Fig 18: Agarose gel showing 800 bp band of psbA-trnH PCR product of 24 species
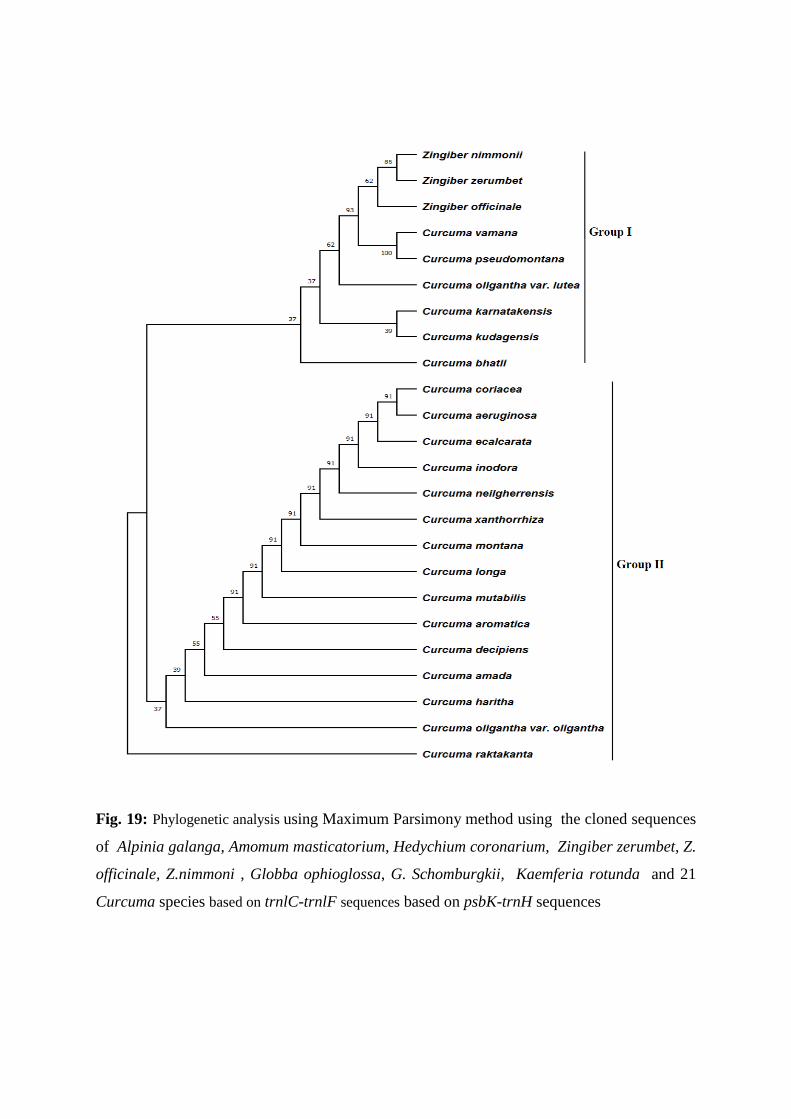
Fig. 19: Phylogenetic analysis using Maximum Parsimony method using the cloned sequences
of Alpinia galanga, Amomum masticatorium, Hedychium coronarium, Zingiber zerumbet, Z.
officinale, Z.nimmoni , Globba ophioglossa, G. Schomburgkii, Kaemferia rotunda and 21
Curcuma species based on trnlC-trnlF sequences based on psbK-trnH sequences

Phylogenetic analysis based on the psbK-psbI sequences
The psbK-psbI barcode primers generated a DNA band of 580 bp in all the species (Fig. 20).
The DNA sequences cloned from all species were minimally edited and manually aligned using
BioEdit software. All the regions containing gaps and missing data were eliminated. The species
identification and homology between the sequences was identified using BLAST method. The
bootstrap consensus tree inferred from 1000 replicates is taken to represent the evolutionary
history of the taxa analyzed. Branches corresponding to partitions reproduced in less than 50%
bootstrap replicates are collapsed. The percentage of replicate trees in which the associated taxa
clustered together in the bootstrap test (1000 replicates) is shown next to the branches. The MP
tree was obtained using the Subtree-Pruning-Regrafting (SPR) algorithm with search level 1 in
which the initial trees were obtained by the random addition of sequences (10 replicates). This
analysis involved 24 nucleotide sequences. Codon positions included were
1st+2nd+3rd+Noncoding. There were a total of 576 positions in the final dataset. Evolutionary
analyses were conducted in MEGA 6. The consistency index is ( 0.863636), the retention index
is ( 0.930233), and the composite index is 0.852713 ( 0.803383) for all sites and parsimony-
informative sites (in parentheses).The phylogenetic analysis using Maximum Parsimony shows
there are three groups, Group I contain a cluster of C. amada, C. montana, C. longa, C.aromatic,
C.ratakanta, C. ecalcarata, C. haritha, C. aeruginosa, C. bhatti, C. vamana, C. karnatakensis, C.
neilgherrensis. Group II contain C. psuedomontana, a single clade of C. oligantha var.
oligantha, C. oligantha var. lutea, clustered with C. coriacea, C. decipiens, C. mutabilis with
54% bootstrap value. C. xanthorrhiza and C. inodora it exist as a single clade with 62%
bootstrap value. Group III contain a cluster of Zingiber nimmonii. Zingiber zerumbet, Zingiber
officinale with 99% bootstrap value.(Fig 21)
Fig 20:Agarose gel showing 580 bp band of psbK-psbI PCR product of 21 Curcuma species
and three Zingiber species

Fig. 21: Phylogenetic analysis using Maximum Parsimony method using the cloned
sequences of Alpinia galanga, Amomum masticatorium, Hedychium coronarium, Zingiber

zerumbet, Z. officinale, Z.nimmoni , Globba ophioglossa, G. Schomburgkii, Kaemferia
rotunda and 21 Curcuma species based on psbK-psbI sequences
Nucleotide- substitution model selection
Bayesian Information Criterion (BIC) and Akaike Information Criterion (AIC) are the best-fit
nucleotide-substitution models determined using MEGA 6.0; it was found that T92 (Tamura 3-
parameter model), with the lowest BIC score (17172.057), and lowest AIC score (16760.754).
Models with the lowest BIC scores (Bayesian Information Criterion) depicts the best substitution
pattern. Non-uniformity of evolutionary rates among sites was also modeled by using a discrete
gamma distribution (+G) with 5 rate categories and by assuming that a certain fraction of sites are
evolutionarily invariable (+I). Estimates of gamma shape parameter and or the estimated fraction
of invariant sites were shown. Estimated values of transition/transversion bias (R) are shown for
each model. They were followed by nucleotide frequencies (f) and rates of base substitutions (r)
for each nucleotide pair. Relative values of instantaneous r were considered and for simplicity,
sum of the r values is made equal to 1 for each model.
Maximum likelihood phylogenetic analysis within the genus Curcuma on the basis of
chloroplast sequences
Agarose gel electrophoresis of the PCR products of the all species using chloroplast sequences
showed distinct bands of rbcL ~1000 bp, matK ~800 bp, , trnlC-trnlF~ 1600 bp, atpF-atpH
~750 b, psbA-trnH~800 bp and psbK-psbI ~580 bp respectively with a reliable amplicon.
Amplified PCR products were sequenced by automated DNA sequencing. The obtained
chromatograms of the sequences were analyzed by using Bio-Edit.v.7.1.3 software (Ibis
Biosciences, Carlsbad, CA 92008). The obtained forward and reverse strand sequences were
aligned and edited. Sequence homology was detected using BLAST homology search tools. All
the cloned sequences were deposited in the NCBI GenBank database
(http://www.ncbi.nim.nih.gov) and accession numbers were provided
The phylogenetic tree obtained from the maximum likelihood (ML) analysis based on six
chloroplast sequences of 24 species (21 Curcuma and three Zingiber species) comprising 3
related outgroup taxa (APG III 2009) provided four groups. The bootstrap support for each
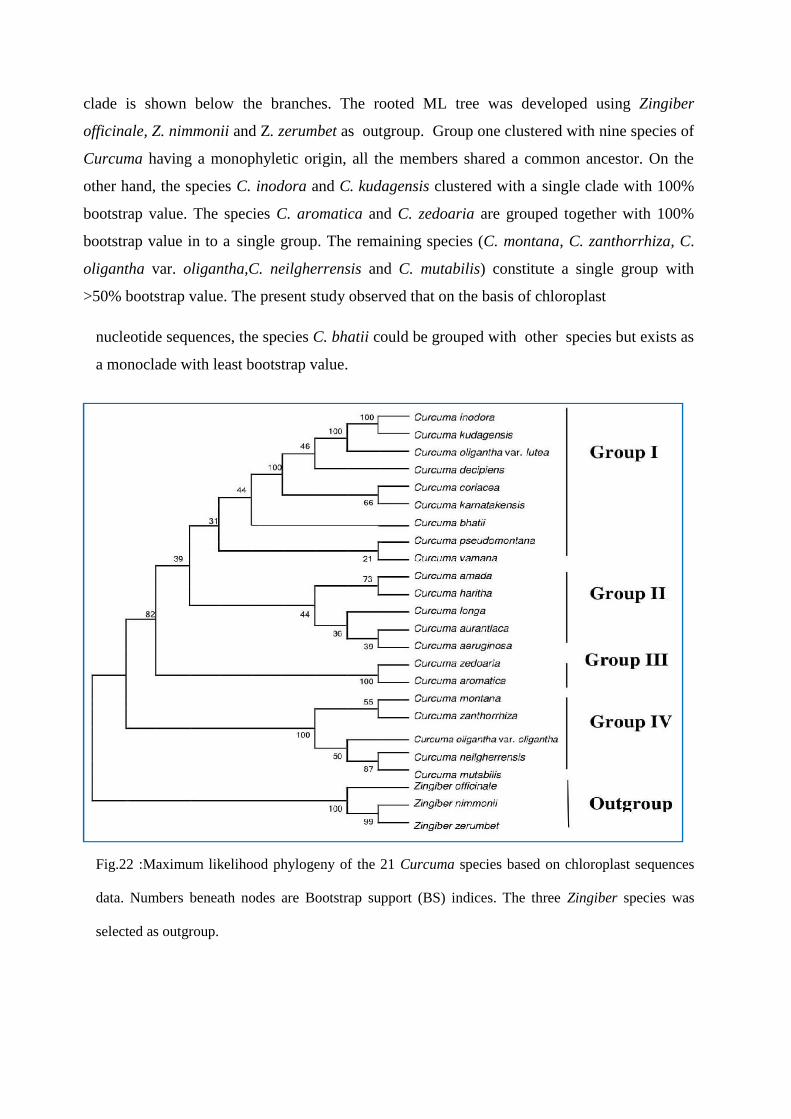
clade is shown below the branches. The rooted ML tree was developed using Zingiber
officinale, Z. nimmonii and Z. zerumbet as outgroup. Group one clustered with nine species of
Curcuma having a monophyletic origin, all the members shared a common ancestor. On the
other hand, the species C. inodora and C. kudagensis clustered with a single clade with 100%
bootstrap value. The species C. aromatica and C. zedoaria are grouped together with 100%
bootstrap value in to a single group. The remaining species (C. montana, C. zanthorrhiza, C.
oligantha var. oligantha,C. neilgherrensis and C. mutabilis) constitute a single group with
>50% bootstrap value. The present study observed that on the basis of chloroplast
nucleotide sequences, the species C. bhatii could be grouped with other species but exists as
a monoclade with least bootstrap value.
Fig.22 :Maximum likelihood phylogeny of the 21 Curcuma species based on chloroplast sequences
data. Numbers beneath nodes are Bootstrap support (BS) indices. The three Zingiber species was
selected as outgroup.

Maximum parsimony (MP) phylogenetic analysis within the genus Curcuma on the
basis of chloroplast sequences
The maximum parsimony (MP) phylogenetic tree was constructed using the chloroplast
sequences of 24 samples including 3 outgroup taxa (Fig. 23). Topology for phylogenetic analysis
used was the same as that of ML phylogenetic tree. The analysis grouped the plants into three
groups with respective bootstrap support for each clade shown below the branches. Similar to
the ML tree, the MP tree was rooted using the related outgroup species such as Z. officinale, Z.
nimmonii and Z. zerumbet. This MP phylogenetic tree also revealed the monophyletic status of
the Curcuma species.
From the MP phylogenetic tree it was also observed that, the Curcuma species were clustered
into three groups based on the chloroplast barcode genes. Group one has >50% bootstrap value
comprised of nine Curcuma species. In the MP tree, the species C. inodora and C. kudagensis
are clustered into a single clade with 100% bootstrap value. At the same time another species, C.
oligantha var. lutea grouped together with C. inodora clade with 100% bootstrap values. In MP
analysis, the species C. bhatii grouped with other species but exists as a monoclade with least
bootstrap value. The second group consists of seven species, the species C. aromatica and C.
zedoaria clustered into a single clade with 100% bootstrap value. C. oligantha var. oligantha
showed the relationship with other members of this group like C. mutabilis and C. montana
clade with above 60% of bootstrap value(Fig. 23).

Fig. 23: Strict consensus of three equally most parsimonious trees of 21 Curcuma species generated
from sequences of six chloroplast barcode sequences. Numbers beneath nodes are Bootstrap support
(BS) indices

Fig. 24: Nucleotide-substitution model selection for the chloroplast barcode sequences of the Curcuma
species [GTR: General Time Reversible; HKY: Hasegawa-Kishino-Yano; TN93; Tamura-Nei; T92:
Tamura 3-parameter; K2: Kimura 2-parameter; JC: Jukes-Cantor]. [(+G): Gamma distribution; (+I):
Evolutionarily invariable site; (R): Transition/ transversion bias; (f): Nucleotide frequencies; (r): Rates
of base substitutions]
Maximum likelihood and Maximum parsimony phylogenetic analysis within the Curcuma
species on the basis of mitochondrial sequences
Both ML and MP phylogenetic analysis were conducted within the species of Curcuma using
two mitochondrial sequences. The ML and MP phylogenetic tree obtained from this analysis
produced two groups (Fig.25&26). The species C. montana, C. zanthorrhiza, C. pseudomontana
and C. aurantiaca grouped together and formed a single group, the remaining species were

grouped together and shared a common ancestor. The mitochondrial sequences of Maranta
leuconeura (AY299801.1, AJ223432.1) were used as outgroup to construct both ML and MP
trees. The two groups were resolved from this ML and MP phylogenetic tree based on the
mitochondrial sequences with respective bootstrap support for each clade shown below the
branches. The mitochondrial sequence based phylogenetic analysis, was slightly different
compared to chloroplast sequence based phylogenies, the members of the genus Curcuma
bhatii exist as a monoclade in the ML analysis with >50% bootstrap value.
Fig. 25: Maximum likelihood phylogeny of the studied members of the genus Curcuma
based on mitochondrial sequences data. Numbers beneath nodes are Bootstrap support (BS)
indices.

Fig. 26: Strict consensus tree of three equally most parsimonious trees of 21 Curcuma species
generated from sequences of two barcode genes of mitochondrial DNA. Numbers beneath
nodes are Bootstrap support (BS) indices.
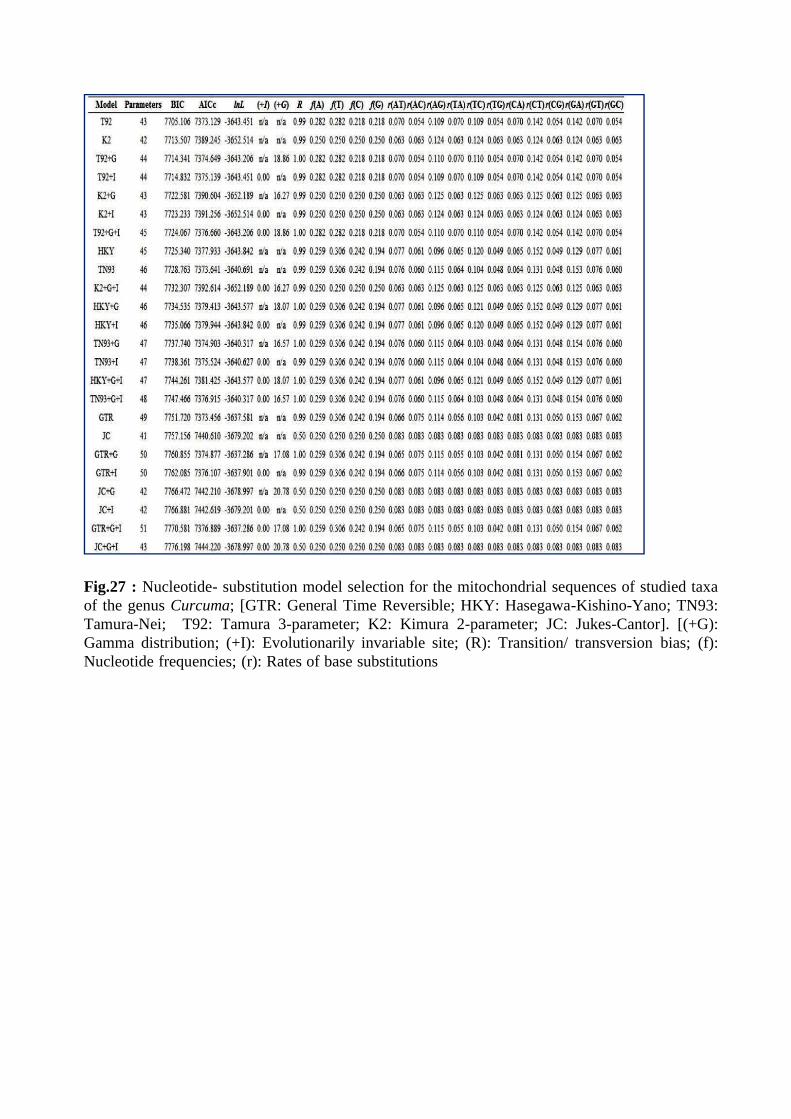
Fig.27 : Nucleotide- substitution model selection for the mitochondrial sequences of studied taxa
of the genus Curcuma; [GTR: General Time Reversible; HKY: Hasegawa-Kishino-Yano; TN93:
Tamura-Nei; T92: Tamura 3-parameter; K2: Kimura 2-parameter; JC: Jukes-Cantor]. [(+G):
Gamma distribution; (+I): Evolutionarily invariable site; (R): Transition/ transversion bias; (f):
Nucleotide frequencies; (r): Rates of base substitutions
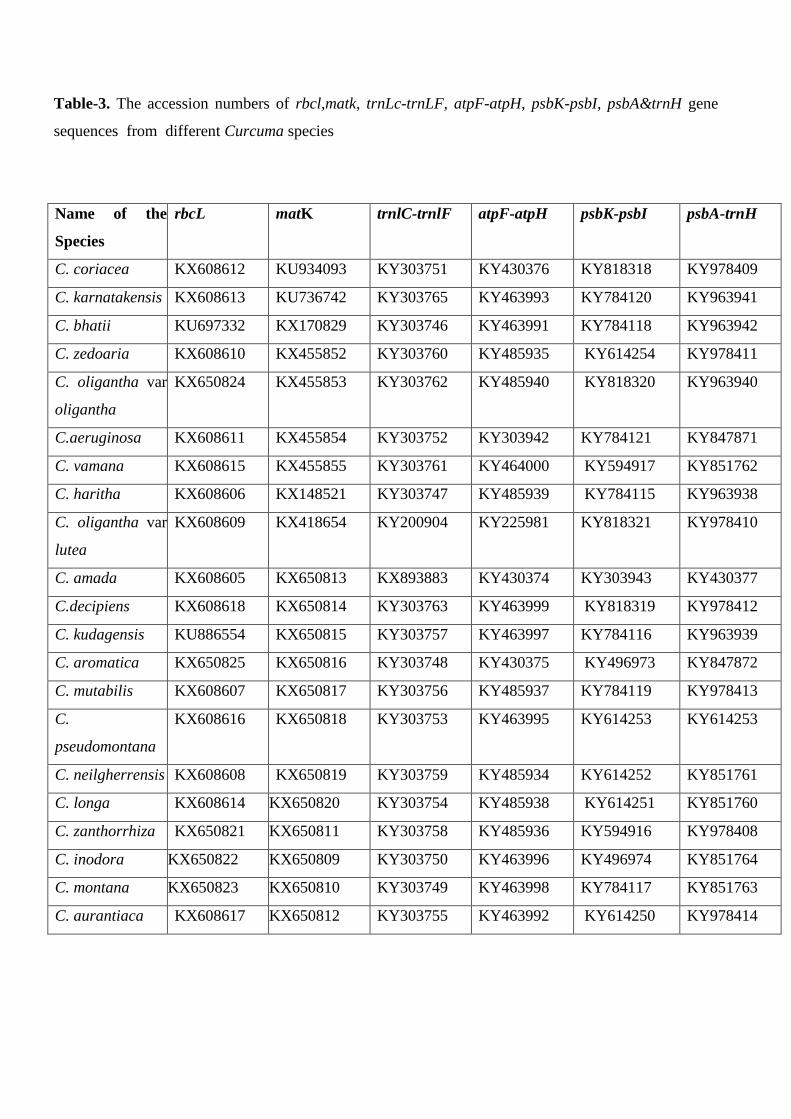
Table-3. The accession numbers of rbcl,matk, trnLc-trnLF, atpF-atpH, psbK-psbI, psbA&trnH gene
sequences from different Curcuma species
Name of the
Species
rbcL matK trnlC-trnlF atpF-atpH psbK-psbI psbA-trnH
C. coriacea KX608612 KU934093 KY303751 KY430376 KY818318 KY978409
C. karnatakensis KX608613 KU736742 KY303765 KY463993 KY784120 KY963941
C. bhatii KU697332 KX170829 KY303746 KY463991 KY784118 KY963942
C. zedoaria KX608610 KX455852 KY303760 KY485935 KY614254 KY978411
C. oligantha var
oligantha
KX650824 KX455853 KY303762 KY485940 KY818320 KY963940
C.aeruginosa KX608611 KX455854 KY303752 KY303942 KY784121 KY847871
C. vamana KX608615 KX455855 KY303761 KY464000 KY594917 KY851762
C. haritha KX608606 KX148521 KY303747 KY485939 KY784115 KY963938
C. oligantha var
lutea
KX608609 KX418654 KY200904 KY225981 KY818321 KY978410
C. amada KX608605 KX650813 KX893883 KY430374 KY303943 KY430377
C.decipiens KX608618 KX650814 KY303763 KY463999 KY818319 KY978412
C. kudagensis KU886554 KX650815 KY303757 KY463997 KY784116 KY963939
C. aromatica KX650825 KX650816 KY303748 KY430375 KY496973 KY847872
C. mutabilis KX608607 KX650817 KY303756 KY485937 KY784119 KY978413
C.
pseudomontana
KX608616 KX650818 KY303753 KY463995 KY614253 KY614253
C. neilgherrensis KX608608 KX650819 KY303759 KY485934 KY614252 KY851761
C. longa KX608614 KX650820 KY303754 KY485938 KY614251 KY851760
C. zanthorrhiza KX650821 KX650811 KY303758 KY485936 KY594916 KY978408
C. inodora KX650822 KX650809 KY303750 KY463996 KY496974 KY851764
C. montana KX650823 KX650810 KY303749 KY463998 KY784117 KY851763
C. aurantiaca KX608617 KX650812 KY303755 KY463992 KY614250 KY978414

Table-4 Genebank accession numbers of rbcL, matK, trnlC-trnlF, atpF-atpH, psbA-trnH and psbk-psbI
in different Zingiberaceae species
Table-5.The accession numbers of mitochondrial COX1 and ATP1 gene cloned from
different Curcuma species
Sl no.
Name of the species rbcL matK trnlC-trnlF atpF-atpH psbA-trnH psbk-psbI
1 Alpinia galanga KY189086 KY448307 KY412470 - - -
2 Amomum masticatorium KY225998 MG252850 KY412471 KY494913 - -
3 Globba ophioglossa KY412472 MG252851 KY412472 KY448304 - -
4 Globba schomburgkii KY412473 KY463435 KY412473 MF125271 - -
5 Zingiber nimmonii KX938352 KY448303 KY328715 MF093687 MF083686 KY584085
6 Zingiber officinale KY226001 KY448305 KY313777 KY584084 MF040880 KY643650
7 Zingiber zerumbet KY226002 KY448306 KY412469 MF093686 MF066711 KY643649
8 Kaempferia rotunda MG787406 MG252852 - - - -
9 Hedychium coranarium MG787407 MG456863 - - - -
S.NO NAME OF THE
SPECIES
Cox1 Atp1
1 C.coriacea KY225972 KY200896
2 C.karnatakensis KY225987 KY200910
3 C.bhatii KY225971 KY200897
4 C.raktakanta KY225982 KY200908
5 C.oliganthavaroligantha KY225983 KY200907
6 C.aeruginosa KY225968 KY200906
7 C.vamana KY225985 KY200905
8 C.haritha KY225975 KY200899
9 C.oliganthavarleuta KY225981 KY200904
10 C.amada KY225969 KYI70860
11 C.decipiens KY225973 KY200898
12 C.kudagensis KY225977 KY200902
13 C.aromatica KY225970 KY170861

Conclusions
1. Nuclear, chloroplast and mitochondrial barcode sequences were cloned from 21
Curcuma spp., three Zingiber spp., Alpinia galanga, Amomum masticatorium, Globba
ophioglossa, G.schomburgkii, Kaempferia rotunda and Hedychium coronarium.
2. The sequences were minimally edited and phylogenetic analysis was conducted using
Maximum parsimony and maximum likelihood analysis.
3. The matk and rbcL barcode sequence analysis grouped the thirty species into three
groups with supportive bootstrap value. The trnlC-trnlF barcode primers grouped the
species into 4 groups. The phylogenetic analysis based on the atpF-atpH grouped the
total species into three groups. psbK-trnH barcode primers generated two groups for
all the species used for the study. The psbK-psbI barcode primer grouped the plants
into three groups. The phylogenetic analysis clearly shows the monophyletic origin of
most of the Curcuma species and the Zingiber species grouped into a single group. the
analysis of K2P parameters and BIC shows the stability of the gene suggesting that
the samples selected for the study are stable.
14 C.mutabilis KY225980 KY200903
15 C.pseudomontana KY225984 -
16 C.neilgherrensis KY225988 KY200901
17 C.longa KY225978 KY030908
18 C.zanthorrhiza KY225986 KY030909
19 C.inodora KY225976 KY200900
20 C.montana KY225979 KY030910
21 C.ecalcarata KY225974 KY200909