dna binding and reactivity assays based on in … supporting information for dna binding and...
TRANSCRIPT

S1
Supporting Information for
DNA Binding and Reactivity Assays
Based on In-Frame Protein Expression
Jingjing Sun, Yishu Yan, Sha Sun, Xin Shu, Congzhi Zhu, and Jin Zhu*
Department of Polymer Science and Engineering, School of Chemistry and Chemical Engineering, State
Key Laboratory of Coordination Chemistry, Nanjing National Laboratory of Microstructures, Nanjing
University, Nanjing 210093, China
*Corresponding author. Phone: +86-25-83686291; Fax: +86-25-83317761; E-mail: [email protected].
Electronic Supplementary Material (ESI) for Chemical ScienceThis journal is © The Royal Society of Chemistry 2012

S2
Experimental Section
Materials.
PrimeSTAR HS DNA polymerase, T4 DNA ligase, T4 polynucleotide kinase, restriction
endonucleases (for PstI, HindIII, XhoI, NdeI, NcoI, SacI, EcoRI, and AluI), and Bactrerial Genomic DNA
Extraction Kit were purchased from Takara. AxyPrep Plasmid Miniprep Kit and AxyPrep DNA Gel
Extraction Kit were purchased Axygen. Extreme thermostable single-strand DNA binding protein (ET
SSB) was purchased from New England Biolabs. Agarose G-10, kanamycin sulfate, isopropyl
β-D-1-thiogalactopyranoside (IPTG), ampicillin sodium, and adenosine triphosphate sodium (ATP Na2)
were purchased from MDBio. Inc. Tryptone, yeast extract, and agar were from Oxoid Co. Ltd. Sodium
chloride (NaCl) and calcium chloride anhydrous (CaCl2) were purchased from Alfa Aesar.
Tris(hydroxymethyl)aminomethane (Tris) was from Amresco Co. Coralyne chloride hydrate (CORA),
ammonium iron(II) sulfate hexahydrate, and (+)-sodium L-ascorbate were purchased from Sigma-Aldrich.
9-Aminoacridine hydrochloride monohydrate (9AA) was purchased from J&K Scientific Ltd.
Ethylenediaminetetraacetic acid disodium salt dihydrate (EDTA) and hydrogen peroxide (27% w/w aq.
soln. stab.) were purchased Acros Organics. Ultrapure water generated through a UNIQUE-S15 facility
was used throughout the experiments.
All the oligonucleotides, except the in situ generated, expected target of genomic DNA after cleavage
at AluI restriction site, were obtained from Sangon, Inc. (Shanghai, China), and their sequences are listed
in Tables S1 and 1.
Fabrication of the Plasmids.
1. Construction of the plasmid for EGFP (with kanamycin-resistant marker gene)
The EGFP gene region was amplified through PCR on a pET-28a-EGFP plasmid with EGFP1,
EGFP2, and EGFP3 (Table S1) as the primers. Two restriction sites (PstI and HindIII) were installed
immediately downstream the EGFP ATG start codon during the PCR process. To the two ends of EGFP
gene were added NdeI and XhoI sites. The plasmid pET-28a-EGFP and amplified EGFP gene were
cleaved with the restriction endonucleases for NdeI and XhoI and the fragments were ligated with a T4
DNA ligase, thus affording a plasmid pET-EGFP. The sacB gene region was amplified through PCR on a
pEX18Tc plasmid with GsacB1 and GsacB2 (Table S1) as the primers. Two restriction sites (PstI and
HindIII) were installed in an analogous fashion during the PCR process. pET-EGFP and amplified sacB
gene were cleaved at the PstI and HindIII sites and ligated to form a plasmid pET-EGFPS.
2. Construction of the plasmid for cpV (with ampicillin-resistant marker gene)
The cpV gene region was amplified through PCR on a pET-28b-cpV plasmid with cpV1, cpV2, and
cpV3 (Table S1) as the primers. Two restriction sites (SacI and EcoRI) were installed immediately
downstream the cpV ATG start codon during the PCR process. To the two ends of cpV gene were added
NcoI and HindIII sites. The plasmid pET-Duet and amplified cpV gene were cleaved with the restriction
endonucleases for NcoI and HindIII and the fragments were ligated with a T4 DNA ligase, thus affording
a plasmid pET-cpV. The sacB gene region was amplified through PCR on a pEX18Tc plasmid with
CsacB1 and CsacB2 (Table S1) as the primers. Two restriction sites (SacI and EcoRI) were installed in an
analogous fashion during the PCR process. pET-cpV and amplified sacB gene were cleaved at the SacI
and EcoRI sites and ligated to form a plasmid pET-cpVS.
Fabrication of the Diagnostic Vectors.
1. Construction of the diagnostic vector containing cleaved EGFP
Electronic Supplementary Material (ESI) for Chemical ScienceThis journal is © The Royal Society of Chemistry 2012

S3
The plasmid pET-EGFPS was transformed into DH10B and the resulting E. coli was cultured
overnight at 37 oC in LB containing 30 μg/mL kanamycin. The extracted plasmid was subjected to an
initial cleavage at the HindIII site and purified through agarose gel electrophoresis. This was followed by
a second cleavage at the PstI site and a purification step. The resulting assay-ready diagnostic vector is
named pET-EGFP-DV.
2. Construction of the diagnostic vector containing cleaved cpV
The plasmid pET-cpVS was transformed into DH10B and the resulting E. coli was cultured overnight
at 37 oC in LB containing 50 μg/mL ampicillin. The extracted plasmid was subjected to an initial
cleavage at the EcoRI site and purified through agarose gel electrophoresis. This was followed by a
second cleavage at the SacI site and a purification step. The resulting assay-ready diagnostic vector is
named pET-cpV-DV.
Electronic Supplementary Material (ESI) for Chemical ScienceThis journal is © The Royal Society of Chemistry 2012

S4
Comparison of Costs for Various DNA Diagnostic Systems
We have calculated the costs of several DNA diagnostic systems based on the reagent prices listed by
the commercial vendors in China (molecular beacon-, or MB-based protocol, RMB20.2; rolling circle
amplification-, or RCA-based protocol, RMB6.3; polymerase chain reaction-, or PCR-based protocol,
RMB3.3; our in-frame protein expression, or IFPE protocol: RMB2.6) and therefore our assay protocol is
relatively cost-effective. MBs are a class of stem-loop DNA structures with an internally quenched
fluorophore whose fluorescence is restored upon target hybridization. The sensitivity of a pure MB-based
method is low (in fact, the original publication in Nature BiotechnologyS1
only reports a diagnostic result
on 250 μM) and therefore this technique is often utilized as a reporter tool in conjunction with other
amplification platforms (e.g., PCR). With the amplification-free, low-sensitivity format, the time required
for the restoration of fluorescence is short. The synthesis of a MB structure costs RMB1000 for 2 OD and
every base costs RMB2. This amount of material could be used for 52 times of diagnostic experiments
assuming the same quantity as that in the Nature Biotechnology paper is used. This translates to RMB20.2
(RMB1050/52) for a single assay with a 25-base MB structure. RCAS2
is an isothermal DNA replication
technique that amplifies circular DNA with a single DNA primer. Although the RCA method is highly
sensitive, in practice, target-independent probe artifacts could be a serious issue. The assay time reported
in the literature varies greatly, spanning from a couple of hours to 24 or even longer hours. To ensure the
consistency, an amplification time for as long as 18 hours has been recommended in some of the literature
protocols. In terms of cost, the components required for a conventional gel electrophoresis-based assay
are listed as follows: phi DNA polymerase (RMB1.3 for 0.5 U), dNTP mix (RMB0.8 for 1 μL), agarose
(RMB0.8 for 0.5 g), DNA marker (RMB1.8 for one gel electrophoresis loading), T4 DNA ligase
(RMB1.6 for 350 U). This translates to RMB6.3 for a single RCA assay. PCRS3
relies on the utility of a
pair of DNA primers to exponentially amplify a target DNA sequence. Such an extraordinary
amplification process has allowed for the achievement of an extremely high sensitivity. However, PCR
has its own disadvantages, such as the requirement of sophisticated instrumentation, sensitivity to
contamination, lack of portability. The PCR-based assay, in either real-time quantitative diagnostic format
or gel electrophoresis analysis format, could be completed within a couple of hours. For a PCR detection
of target DNA, the cost comes primarily from three reagents: Taq DNA polymerase (RMB0.7 for 1.25 U),
agarose (RMB0.8 for 0.5 g), DNA marker (RMB1.8 for one gel electrophoresis loading). This translates
to RMB3.3 for a single PCR assay. The sensitivity of our IFPE protocol has reached femtomolar
concentration range under nonoptimized conditions. And a further improvement is expected to be
possible through the optimization of experimental parameters at every stage (e.g., ligation through the
addition of PEG8000, transformation through the electroporation protocol) of the assay. The assay time of
our proposed methodology could be shortened to 11 hours at the current stage. The assay cost of our
diagnostic system is derived from the following ingredients: T4 polynucleotide kinase (RMB0.3 for 0.5
U), T4 DNA ligase (RMB1.6 for 350 U), vector 1 μL (RMB0.4) from a total of 27 μL prep [HindIII
restriction endonuclease (RMB1.7 for 45 U), PstI restriction endonuclease (RMB0.9 for 22.5 U),
AxyPrep Plasmid Miniprep Kit (RMB1.8 for the isolation of plasmid), AxyPrep DNA Gel Extraction Kit
(RMB4.8 for the extraction of vector from the gel), agarose (RMB0.8 for 0.5 g), DNA marker (RMB1.8
for one gel electrophoresis loading)], bacterial growth medium (RMB0.3) [tryptone (RMB0.15 for 0.2 g),
yeast extract (RMB0.04 for 0.1 g), NaCl (RMB0.08 for 0.2 g)]. This translates to RMB2.6 for an IFPE
assay.
Electronic Supplementary Material (ESI) for Chemical ScienceThis journal is © The Royal Society of Chemistry 2012

S5
Table S1. DNA Description and Sequence Information for the Construction of Diagnostic Vectors
Description of DNA Sequence
EGFP1 5’-CCGCTCGAGCCTTACTTGTACAGC-3’
EGFP2 5’-CTGCAGCCAAGCTTAGTGAGCAAGGG-3’
EGFP3 5’-GGAATTCCATATGTCTGCAGCCAAGCTTAGT-3’
GsacB1 5’-AAAACTGCAGATGAACATCAAAAAGTTTG-3’
GsacB2 5’-GGCCCAAGCTTTTATTTGTTAACTGTT-3’
cpV1 5’-CCCAAGCTTCGGTTACTCGATGT-3’
cpV2 5’-CTCGATGGAATTCAGACGGCGGCGT-3’
cpV3 5’-CATGCCATGGGAGCTCGATGGAATTC-3’
CsacB1 5’-AAAGAGCTCATGAACATCAAAAAG-3’
CsacB2 5’-CCGGAATTCTTATTTGTTAACTG-3’
Electronic Supplementary Material (ESI) for Chemical ScienceThis journal is © The Royal Society of Chemistry 2012

S6
Fig. S1 Vector map of pET-EGFPS.
Electronic Supplementary Material (ESI) for Chemical ScienceThis journal is © The Royal Society of Chemistry 2012

S7
Fig. S2 Verification of the successful cleavage of HindIII and PstI sites on pET-EGFPS and fabrication of
assay-ready diagnostic vector pET-EGFP-DV. Agarose gel electrophoresis diagram of pET-EGFPS after
the successive digestion with HindIII and PstI restriction endonucleases. Gel electrophoresis diagram for:
lane 1, DNA marker; lane 2, pET-EGFPS; lane 3, pET-EGFPS after cleavage at the HindIII site; lane 4,
purified product from lane 3 after further cleavage at the PstI site.
Electronic Supplementary Material (ESI) for Chemical ScienceThis journal is © The Royal Society of Chemistry 2012

S8
Fig. S3 DNA hybridization assay based on the fluorescent signal of EGFP. (A) Detection of DNA-1 by
direct fluorescent visualization of the harvested bacteria (under 365 nm UV light illumination). The
detection of target DNA (DNA-1) is enabled through the proper selection of capture DNA (DNA-2) and
blocking DNA (DNA-3). Target concentration (left to right, top to bottom, including the blank spot
designated by the dashed red circle): 0 M, 1 pM, 10 pM, 100 pM, 1 nM, 10 nM. (B) Quantification of
DNA-1 by fluorescence intensity measurement on a fluorimeter (representative fluorescence spectrum,
excited at 486 nm). Target concentration: dark cyan, 0 M; magenta, 1 pM; olive, 10 pM; blue, 100 pM;
red, 1 nM; black, 10 nM. The inset shows the linear relationship between the logarithmic value of the
target concentration and the fluorescence intensity (measured at 510 nm in triplicate).
Electronic Supplementary Material (ESI) for Chemical ScienceThis journal is © The Royal Society of Chemistry 2012

S9
Fig. S4 Detection of genomic DNA of DH10B by fluorescence intensity measurement. (A)
Representative fluorescence spectrum (excited at 486 nm). The detection of expected target DNA (75
nucleotides, DNA-4) after cleavage at the AluI site is enabled through the proper selection of capture
DNA (83 nucleotides, DNA-5) and blocking DNA (20 nucleotides, DNA-6). Genomic DNA
concentration: dark cyan, 0 M; red, 2.3 nM. (B) Bar graph showing the fluorescence intensity (measured
at 510 nm in triplicate) in the absence (1) and presence of genomic DNA (2).
Electronic Supplementary Material (ESI) for Chemical ScienceThis journal is © The Royal Society of Chemistry 2012
S10
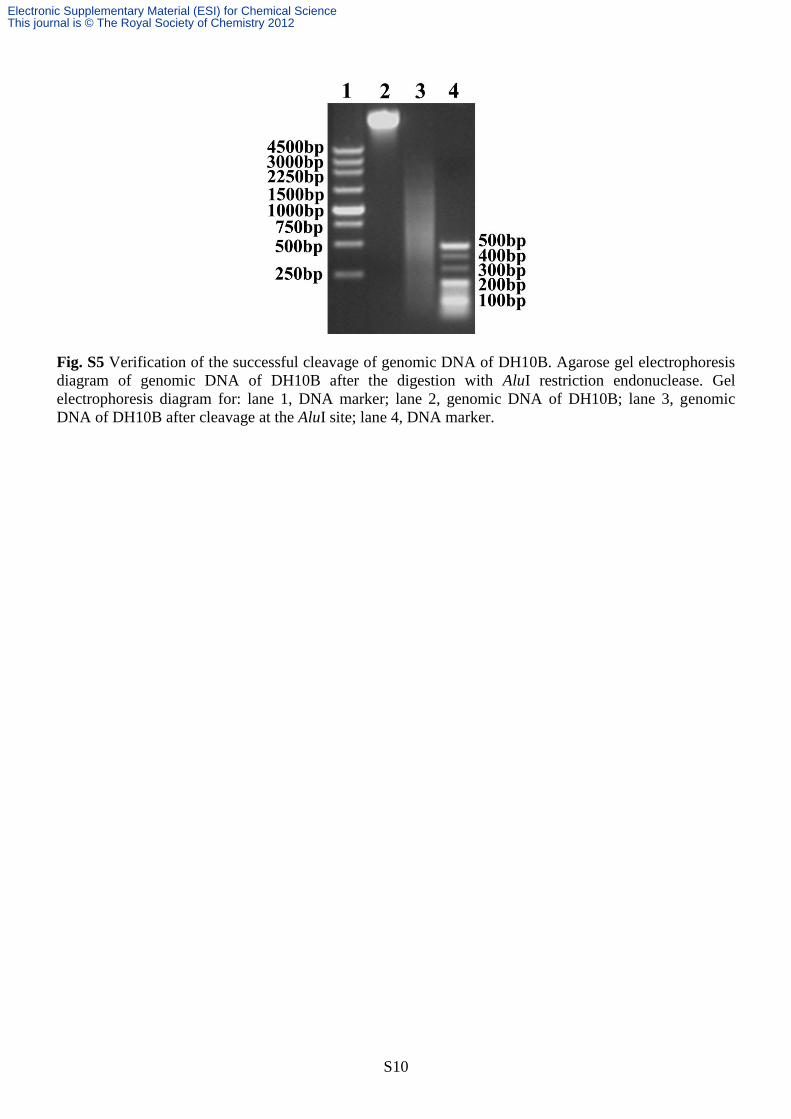
Fig. S5 Verification of the successful cleavage of genomic DNA of DH10B. Agarose gel electrophoresis
diagram of genomic DNA of DH10B after the digestion with AluI restriction endonuclease. Gel
electrophoresis diagram for: lane 1, DNA marker; lane 2, genomic DNA of DH10B; lane 3, genomic
DNA of DH10B after cleavage at the AluI site; lane 4, DNA marker.
Electronic Supplementary Material (ESI) for Chemical ScienceThis journal is © The Royal Society of Chemistry 2012

S11
Fig. S6 Single-base mismatch differentiation capability regardless of the position of the mismatch site. (A)
Quantitative single-base mismatch differentiation (DNA concentration: 100 nM) by fluorescence intensity
measurement (representative fluorescence spectrum, excited at 486 nm). Fluorescence spectrum for: dark
cyan, none; dark yellow (masked by the dark cyan curve), sequence with one-base deletion (DNA-11);
magenta (masked by the dark cyan curve), sequence with one-base insertion (DNA-10); olive, sequence
with a single-base mismatch at the proximal site of capture probe head (DNA-8); blue, sequence with a
single-base mismatch at the capture probe head (DNA-7); red, sequence with a single-base mismatch at
the capture probe middle (DNA-9); black, perfect target (DNA-1). The inset shows an amplified view of
three curves (dark cyan, dark yellow, and magenta). (B) Bar graph showing the fluorescence intensity
(measured at 510 nm in triplicate) in the absence (1) and presence of a sequence with one-base deletion
(DNA-11) (2), a sequence with one-base insertion (DNA-10) (3), a sequence with a single-base mismatch
at the proximal site of capture probe head (DNA-8) (4), a sequence with a single-base mismatch at the
capture probe head (DNA-7) (5), a sequence with a single-base mismatch at the capture probe middle
(DNA-9) (6), and a perfect target (DNA-1) (7).
Electronic Supplementary Material (ESI) for Chemical ScienceThis journal is © The Royal Society of Chemistry 2012

S12
Fig. S7 Vector map of pET-cpVS.
Electronic Supplementary Material (ESI) for Chemical ScienceThis journal is © The Royal Society of Chemistry 2012

S13
Fig. S8 Verification of the successful cleavage of EcoRI and SacI sites on pET-cpVS and fabrication of
assay-ready diagnostic vector pET-cpV-DV. Agarose gel electrophoresis diagram of pET-cpVS after the
successive digestion with EcoRI and SacI restriction endonucleases. Gel electrophoresis diagram for: lane
1, DNA marker; lane 2, pET-cpVS; lane 3, pET-cpVS after cleavage at the EcoRI site; lane 4, purified
product from lane 3 after further cleavage at the SacI site.
Electronic Supplementary Material (ESI) for Chemical ScienceThis journal is © The Royal Society of Chemistry 2012

S14
Fig. S9 DNA hybridization assay based on the fluorescent signal of cpV. Detection of DNA-12 by direct
fluorescent visualization of the harvested bacteria (under 365 nm UV light illumination with a slight mix
of visible light). Target concentration (left to right, top to bottom, including the blank spot designated by
the dashed red circle): 0 M, 1 nM, 10 nM, 100 nM.
Electronic Supplementary Material (ESI) for Chemical ScienceThis journal is © The Royal Society of Chemistry 2012

S15
Fig. S10 Multiple-target identification through antibiotic-enabled readout channel selection. (A)
Two-target detection (DNA concentration: 100 nM) under the selection pressure of kanamycin by
fluorescence intensity measurement (representative fluorescence spectrum, excited at 486 nm).
Fluorescence spectrum for: dark cyan, no target; blue, DNA-12; red, DNA-1; black, two targets (DNA-1
and DNA-12). The inset shows an amplified view of two curves (dark cyan and blue). (B) Two-target
detection (DNA concentration: 100 nM) under the selection pressure of ampicillin by fluorescence
intensity measurement (representative fluorescence spectrum, excited at 517 nm): dark cyan, no target;
blue, DNA-1; red, DNA-12; black, two targets (DNA-1 and DNA-12). The inset shows an amplified view
of two curves (dark cyan and blue). (C) Bar graph showing the fluorescence intensity (measured at 510
nm in triplicate under the selection pressure of kanamycin, measured at 527 nm in triplicate under the
selection pressure of ampicillin) for: no target under the selection pressure of either kanamycin (1) or
ampicillin (2); DNA-1 under the selection pressure of either kanamycin (3) or ampicillin (4); DNA-12
under the selection pressure of either kanamycin (5) or ampicillin (6); two targets (DNA-1 and DNA-12)
under the selection pressure of either kanamycin (7) or ampicillin (8).
Electronic Supplementary Material (ESI) for Chemical ScienceThis journal is © The Royal Society of Chemistry 2012

S16
Fig. S11 DNA reactivity assay based on the fluorescent signal of EGFP. The DNA reactivity assay is
demonstrated on an inorganic-based DNA cleavage system, with FeII-EDTA and H2O2 as the major
reactive components. (A) Detection of DNA cleavage event through fluorescence intensity measurement
(representative fluorescence spectrum, excited at 486 nm) in the absence (dark cyan) and presence (red)
of inorganic cleavage system. The detection of DNA cleavage event on DNA-15 (blocking DNA) is
enabled through the proper selection of target DNA (DNA-1) and capture DNA (DNA-2). The
concentration of DNA-15 is 100 nM. It should be noted that the term target DNA is not defined in the
context of DNA hybridization assay. (B) Bar graph showing the fluorescence intensity (measured at 510
nm in triplicate) in the absence (1) and presence (2) of cleavage system.
Electronic Supplementary Material (ESI) for Chemical ScienceThis journal is © The Royal Society of Chemistry 2012

S17
Fig. S12 Verification of the successful cleavage of DNA by an inorganic-based system. Agarose gel
electrophoresis diagram of blocking DNA (DNA-15) after the successful cleavage with FeII-EDTA and
H2O2. Gel electrophoresis diagram for: lane 1, DNA marker; lane 2, 100 μM DNA-15; lane 3, 100 μM
DNA-15 after the cleavage reaction; lane 4, 10 μM DNA-15; lane 5, 10 μM DNA-15 after the cleavage
reaction; lane 6, DNA marker; lane 7, 1 μM DNA-15; lane 8, 1 μM DNA-15 after the cleavage reaction;
lane 9, 100 nM DNA-15; lane 10, 100 nM DNA-15 after the cleavage reaction. The cleavage reaction at
lower concentrations (below 1 μM) could not be unambiguously monitored with the gel electrophoresis
technology. In contrast, our IFPE protocol provides a pronounced fluorescent signal readout even down at
these concentration ranges.
Electronic Supplementary Material (ESI) for Chemical ScienceThis journal is © The Royal Society of Chemistry 2012

S18
Fig. S13 DNA-small molecule binding assay based on the fluorescent signal of EGFP. The DNA-small
molecule binding assay is demonstrated on two organic-based triplex binding systems (CORA and 9AA).
(A) Detection of triplex-small molecule binding event through fluorescence intensity measurement
(representative fluorescence spectrum, excited at 486 nm) in the absence (dark cyan) and presence (red)
of triplex binder CORA. The detection of DNA-small molecule binding event is enabled through the
proper selection of triplex units DNA-16, DNA-17, and DNA-18 (blocking DNA), capture DNA
(DNA-19), and target DNA (DNA-20). (B) Bar graph showing the fluorescence intensity (measured at
510 nm in triplicate) in the absence (1) and presence (2) of triplex binder CORA.
Electronic Supplementary Material (ESI) for Chemical ScienceThis journal is © The Royal Society of Chemistry 2012

S19
Fig. S14 DNA-small molecule binding assay based on the fluorescent signal of EGFP. The DNA-small
molecule binding assay is demonstrated on two organic-based triplex binding systems (CORA and 9AA).
(A) Detection of triplex-small molecule binding event through fluorescence intensity measurement
(representative fluorescence spectrum, excited at 486 nm) in the absence (dark cyan) and presence (red)
of triplex binder 9AA. The detection of DNA-small molecule binding event is enabled through the proper
selection of triplex units DNA-16, DNA-17, and DNA-18 (blocking DNA), capture DNA (DNA-19), and
target DNA (DNA-20). (B) Bar graph showing the fluorescence intensity (measured at 510 nm in
triplicate) in the absence (1) and presence (2) of triplex binder 9AA.
Electronic Supplementary Material (ESI) for Chemical ScienceThis journal is © The Royal Society of Chemistry 2012

S20
Fig. S15 DNA-protein binding assay based on the fluorescent signal of EGFP. The DNA-protein binding
assay is demonstrated on a SSB-based DNA binding system. (A) Detection of DNA-protein binding event
through fluorescence intensity measurement (representative fluorescence spectrum, excited at 486 nm) in
the absence (dark cyan) and presence (red) of SSB. The detection of DNA-protein binding event is
enabled through the proper selection of blocking DNA (DNA-15, binding partner for SSB), target DNA
(DNA-1), and capture DNA (DNA-2). (B) Bar graph showing the fluorescence intensity (measured at 510
nm in triplicate) in the absence (1) and presence (2) of SSB.
Electronic Supplementary Material (ESI) for Chemical ScienceThis journal is © The Royal Society of Chemistry 2012

S21
References
S1 S. Tyagi and R. Kramer, Nat. Biotechnol., 1996, 14, 303–308.
S2 W. Zhao, M. M. Ali, M. A. Brook and Y. Li, Angew. Chem. Int. Ed., 2008, 47, 6330–6337.
S3 Real-Time PCR, ed. M. T. Dorak, Taylor & Francis Group Press, New York, 2006.
Electronic Supplementary Material (ESI) for Chemical ScienceThis journal is © The Royal Society of Chemistry 2012