dna / cell cycle measurement - flow...
TRANSCRIPT
23/04/16
DNA / Cell cycle
measurement
Slide 2 23/04/16 | Dr. Steffen Schmitt Core Facility Flow Cytometry; W220
DNA/ RNA dyes
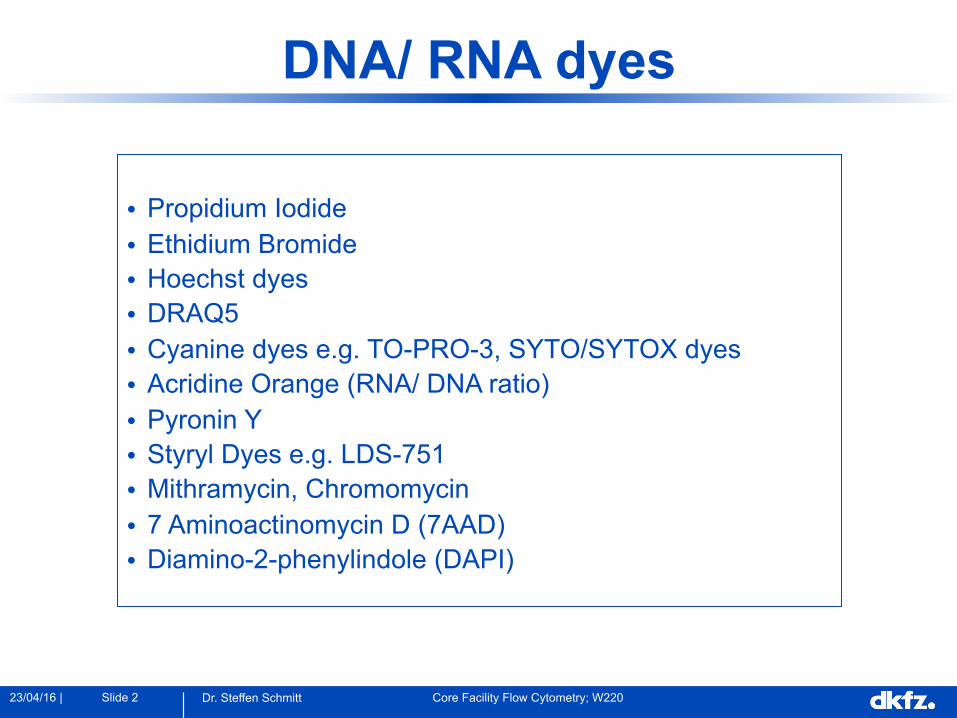
• Propidium Iodide • Ethidium Bromide • Hoechst dyes • DRAQ5 • Cyanine dyes e.g. TO-PRO-3, SYTO/SYTOX dyes • Acridine Orange (RNA/ DNA ratio) • Pyronin Y • Styryl Dyes e.g. LDS-751 • Mithramycin, Chromomycin • 7 Aminoactinomycin D (7AAD) • Diamino-2-phenylindole (DAPI)

Slide 3 23/04/16 | Dr. Steffen Schmitt Core Facility Flow Cytometry; W220
Which dye to use?
Excitation wavelength available UV: Hoechst, DAPI
488: PI, 7AAD
633: TO-PRO-3
Specificity (Sequence) None: PI
A-T: Hoechst, DAPI
G-C: 7AAD, Chromo-Mithramycin
Viability Hoechst 33342
DRAQ5

Slide 4 23/04/16 | Dr. Steffen Schmitt Core Facility Flow Cytometry; W220
We can use the DNA dyes in 2 ways
1. To measure relative cellular DNA content
2. For discrimination of live / dead cells
Slide 5 23/04/16 | Dr. Steffen Schmitt Core Facility Flow Cytometry; W220
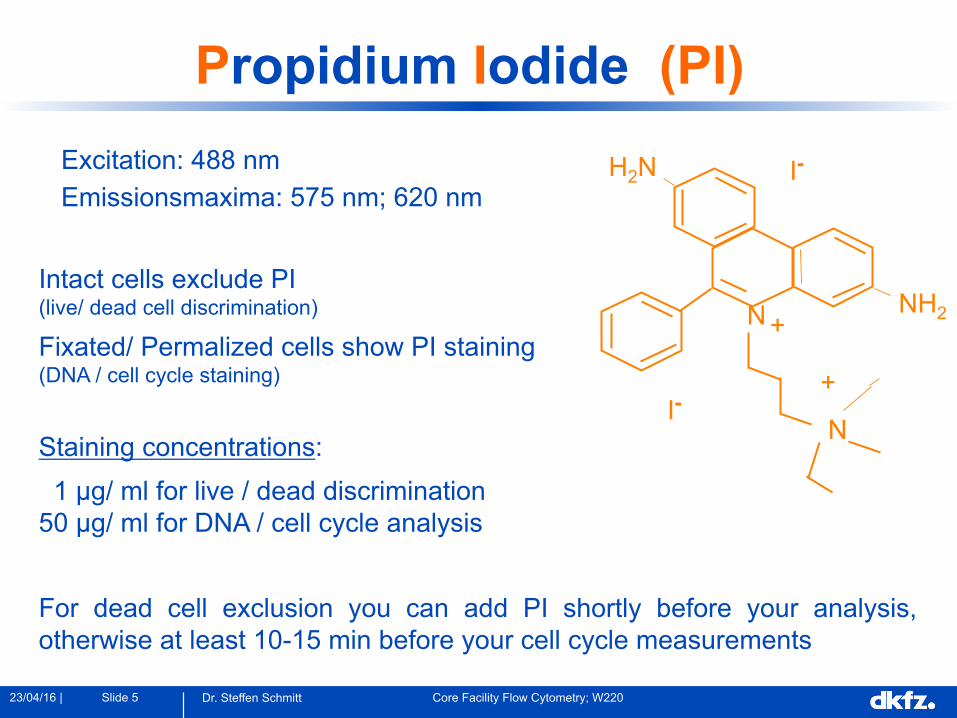
Propidium Iodide (PI) Excitation: 488 nm Emissionsmaxima: 575 nm; 620 nm
Intact cells exclude PI (live/ dead cell discrimination) Fixated/ Permalized cells show PI staining (DNA / cell cycle staining)
Staining concentrations:
1 µg/ ml for live / dead discrimination 50 µg/ ml for DNA / cell cycle analysis
For dead cell exclusion you can add PI shortly before your analysis, otherwise at least 10-15 min before your cell cycle measurements
H2N
NH2
I-
+
I- N
+
N

Slide 6 23/04/16 | Dr. Steffen Schmitt Core Facility Flow Cytometry; W220
G1/
S
G2
M
G0
2n
4n
4n 2n - 4n
G1/ G0
S
G2/ M
0 200 400 600 800 1000FL2-A
subG1
G1
S G2
Marker % GatedAll 100.00
subG1 0.45G1 37.42
S 1.91G2 22.60
Cell cycle
n = chromosome-content From 5 different cell cycle-phases only 3 can be distinguished by Flow Cytometry (due to their DNA-content)

Slide 7 23/04/16 | Dr. Steffen Schmitt Core Facility Flow Cytometry; W220
In an ideal world ...
fluorescence intensity
cell
num
ber
200 400

Slide 8 23/04/16 | Dr. Steffen Schmitt Core Facility Flow Cytometry; W220
In the real world ...
fluorescence intensity
cell
num
ber
200 400

Slide 9 23/04/16 | Dr. Steffen Schmitt Core Facility Flow Cytometry; W220
Cell cycle-Analysis
• A pre-requisite for flow cytometry is, that cells should be in a single cell suspension.
• How do cell clumps affect quantitation of DNA content?

Slide 10 23/04/16 | Dr. Steffen Schmitt Core Facility Flow Cytometry; W220
Cell cycle-Analysis
0 200 400 600 800 1000FL2-A
subG1
G1
S G2
Marker % GatedAll 100.00
subG1 0.45G1 37.42
S 1.91G2 22.60
Note: linear scale !!

Slide 11 23/04/16 | Dr. Steffen Schmitt Core Facility Flow Cytometry; W220
Doublet discrimination
laser beam
laser beam
sign
al in
tens
ity
sign
al in
tens
ity
signal width
signal width
signal height
signal height

Slide 12 23/04/16 | Dr. Steffen Schmitt Core Facility Flow Cytometry; W220
0 200 400 600 800 1000FL2-A
subG1
G1
S G2
Cell cycle-Analysis
gating out the doublets cell cycle-analysis
st031210.003
0 200 400 600 800 1000FL2-A
R1
Marker % GatedAll 100.00
subG1 1.05G1 88.64
S 3.76G2 4.52

Slide 13 23/04/16 | Dr. Steffen Schmitt Core Facility Flow Cytometry; W220
Cell cycle-Analysis
gating out the doublets cell cycle-analysis
0 200 400 600 800 1000FL2-A
subG1
G1
S G2
Marker % GatedAll 100.00
subG1 1.05G1 88.64
S 3.76G2 4.52
0 200 400 600 800 1000FL2-A
subG1
G1
S G2
Marker % GatedAll 100.00
subG1 0.45G1 37.42
S 1.91G2 22.60
with doublets the cell cycle phase G2 is overestimated other populations (e.g. G1) were underestimated
Slide 14 23/04/16 | Dr. Steffen Schmitt Core Facility Flow Cytometry; W220
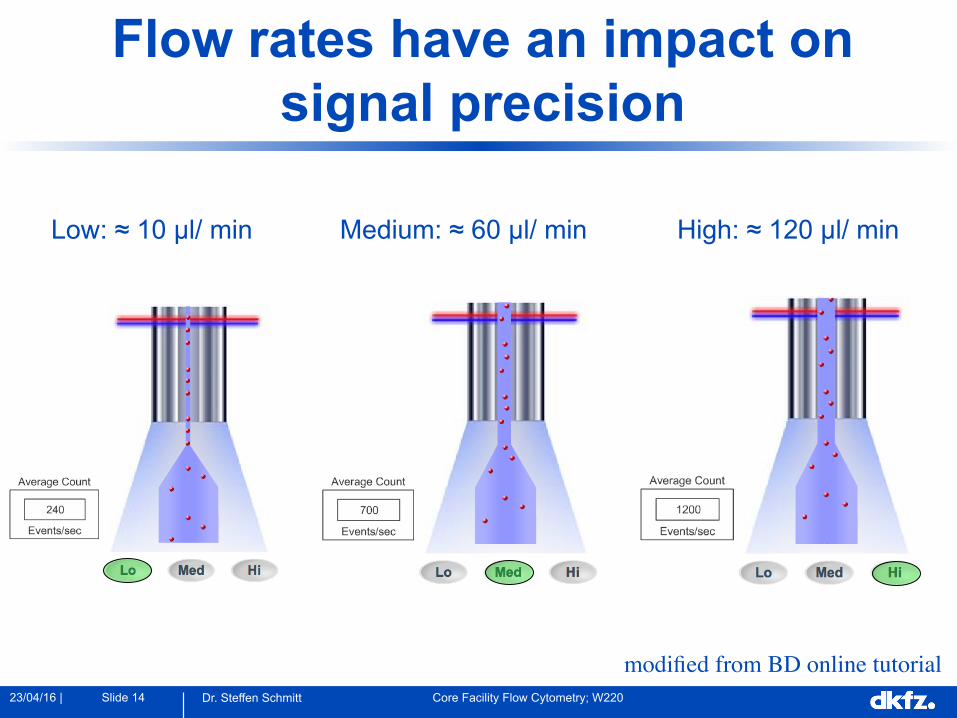
Flow rates have an impact on signal precision
Low: ≈ 10 µl/ min Medium: ≈ 60 µl/ min High: ≈ 120 µl/ min
modified from BD online tutorial

Slide 15 23/04/16 | Dr. Steffen Schmitt Core Facility Flow Cytometry; W220
Hydrodynamic Focus
horizontal view through a flow chamber
sheath
sample
particle Laser
Longitudinal view through a flow chamber
Focussing the cells in the stream

Slide 16 23/04/16 | Dr. Steffen Schmitt Core Facility Flow Cytometry; W220
Flow rate and Quality of histograms
Fl2-A
coun
ts
G1 S G2 small CV´s large CV´s

Slide 17 23/04/16 | Dr. Steffen Schmitt Core Facility Flow Cytometry; W220
Analysis of DNA histograms ...
Fl2-A
coun
ts
G1 S G2 65 % 15 % 20 % 62 % 22 % 16 %
special software, e.g. ModFIT LT, FlowJo, ... automate the process of analysis with mathematical modelling
Slide 18 23/04/16 | Dr. Steffen Schmitt Core Facility Flow Cytometry; W220
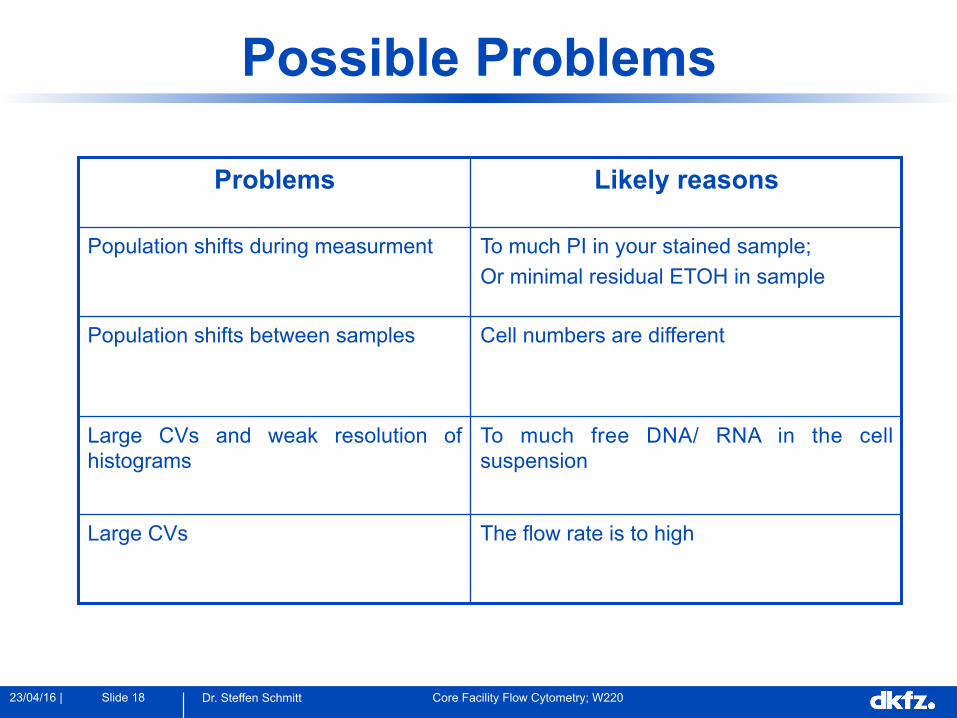
Possible Problems
To much free DNA/ RNA in the cell suspension
Large CVs and weak resolution of histograms
To much PI in your stained sample; Or minimal residual ETOH in sample
Population shifts during measurment
Cell numbers are different Population shifts between samples
The flow rate is to high Large CVs
Likely reasons Problems

Slide 19 23/04/16 | Dr. Steffen Schmitt Core Facility Flow Cytometry; W220
- plate, cultivate and treat the cells
- harvest cells (1x 10⁶ / ml)
- fixate cells for at least 30-60 min (cold Ethanol (-20°C)) - be sure cells are well resuspended - add the cell suspension drop by drop to the alcohol while mixing suspension - (centrifugate cells and resuspend in cold PBS (for storage))
- treat cells (at least 30 min at RT) with RNase (50 µg/ ml)
- (count cells) and resuspend in PI (50 µg/ ml)
- FACS analysis
Protocol for DNA-Analysis/ Cell cycle

Slide 20 23/04/16 | Dr. Steffen Schmitt Core Facility Flow Cytometry; W220
DNA + additional stainings
We can combine antigen staining or fluorescent protein expression with DNA staining and...
... see how many cells are expressing a particular antigen
or
... see which phase an antigen is expressed
or
... look at the DNA profile of a selected subset of cells

Slide 21 23/04/16 | Dr. Steffen Schmitt Core Facility Flow Cytometry; W220
Cell cycle-analysis with viable cells
(e.g. Hoechst 33342)
Hoechst 33342
Slide 22 23/04/16 | Dr. Steffen Schmitt Core Facility Flow Cytometry; W220
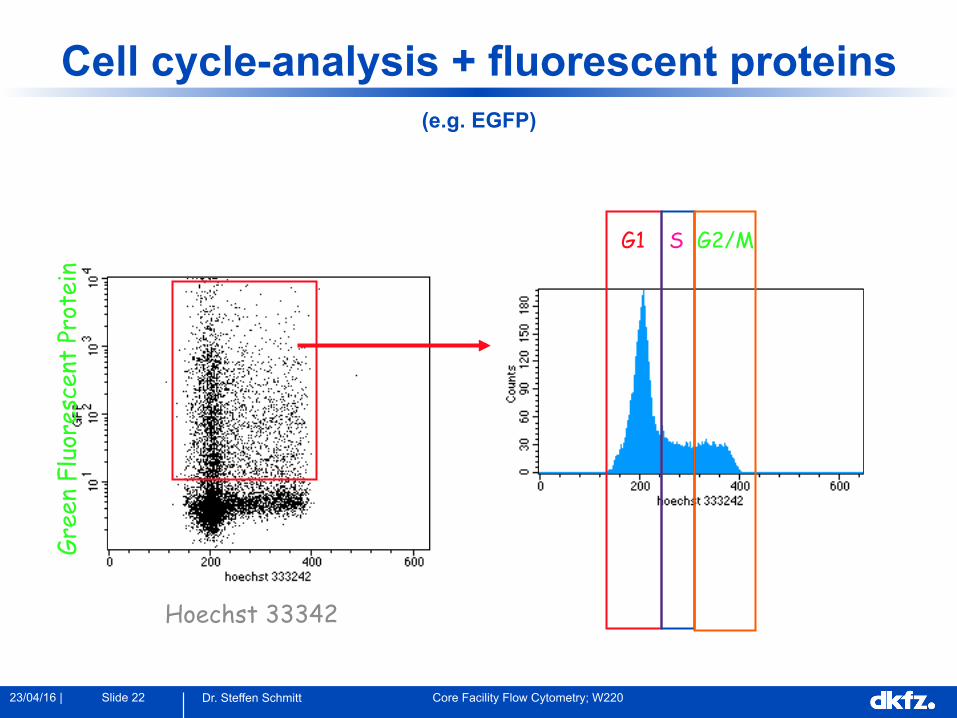
Cell cycle-analysis + fluorescent proteins
(e.g. EGFP)
Hoechst 33342
Gree
n Fl
uore
scen
t Pr
otei
n
G1 S G2/M
Slide 23 23/04/16 | Dr. Steffen Schmitt Core Facility Flow Cytometry; W220
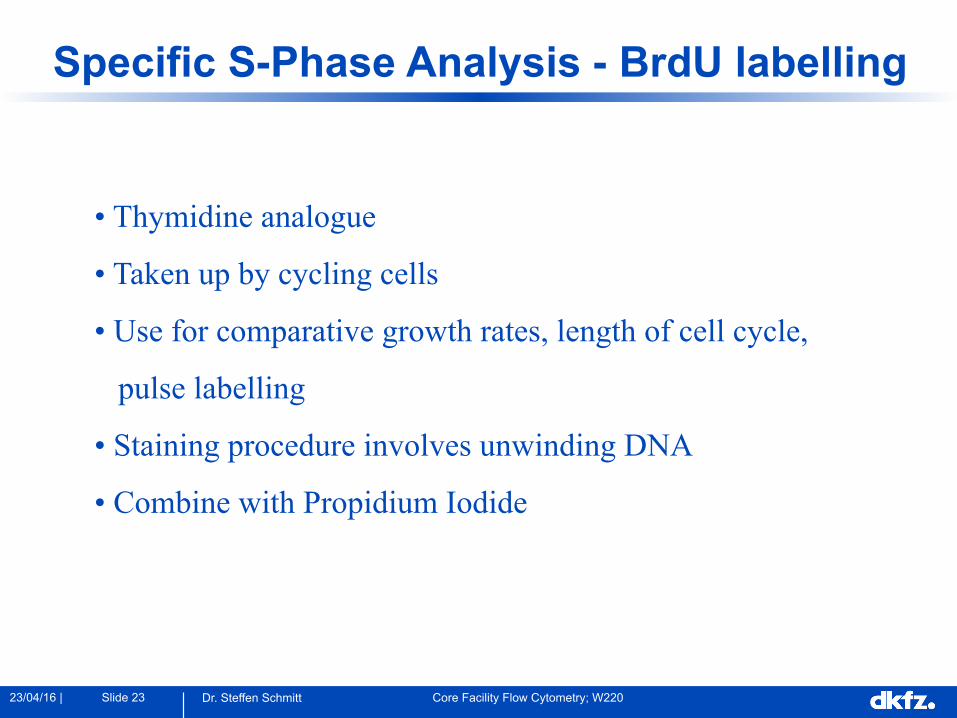
Specific S-Phase Analysis - BrdU labelling
• Thymidine analogue
• Taken up by cycling cells
• Use for comparative growth rates, length of cell cycle,
pulse labelling
• Staining procedure involves unwinding DNA
• Combine with Propidium Iodide

Slide 24 23/04/16 | Dr. Steffen Schmitt Core Facility Flow Cytometry; W220
0 200 400 600FL3-A
G 1
S
G 2
0 200 400 600FL3-A
G 1
S
G 2
S-Phase analysis with BrdU
Bromo-deoxy Uridine is incorporated in DNA of cyclin cells during S phase and can be detected with specific antibodies.
Tatjana Trost
untreated control treated sample

Slide 25 23/04/16 | Dr. Steffen Schmitt Core Facility Flow Cytometry; W220
Following cell proliferation with CFSE
100 101 102 103 104FL1-H CFSE
M1 = 20 %
quiescent cells
1 st cell division
2 nd cell division 3 rd cell division unstained cells
CFSE = carboxyfluorescein succinimidyl ester

Slide 26 23/04/16 | Dr. Steffen Schmitt Core Facility Flow Cytometry; W220
ΑΠΟΠΤΩΣΗ
Slide 27 23/04/16 | Dr. Steffen Schmitt Core Facility Flow Cytometry; W220
Different possibilities to die
! Nekrosis
! Apoptosis

Slide 28 23/04/16 | Dr. Steffen Schmitt Core Facility Flow Cytometry; W220
Apoptosis = programmed cell death
regulated elimination of cells, e.g. for:
• Formation of parts of the body (during embryogenesis) (e.g. finger formation; death of interdigital mesenchymal tissues) • Depletion of injured cells (e.g. infection, DNA-damage) • Thymic selection (elimination of autoreactive and non reactive thymocytes) • Homöostasis of adult organs (turnover: 1/2 mio. cells/ min)

Slide 29 23/04/16 | Dr. Steffen Schmitt Core Facility Flow Cytometry; W220
Apoptosis versus Nekrosis
• Mitochondria and Lysosoms stay intact (reduced Δψ) • No change in plasmamembrane- integrity and function (Phosphatidylserin-exposition)
• Mobilisation of intracellular Ca2+- Ions • Chromatin-condensation • Activation of endonucleases (DNA-degradation )
• Mitochondria swell and break down • Desintegration of plasmamembrane • Release of proteolytic enzyms • local Chromatin-condensation („patchy areas“) • Karyolysis

Slide 30 23/04/16 | Dr. Steffen Schmitt Core Facility Flow Cytometry; W220

Slide 31 23/04/16 | Dr. Steffen Schmitt Core Facility Flow Cytometry; W220

Slide 32 23/04/16 | Dr. Steffen Schmitt Core Facility Flow Cytometry; W220

Slide 33 23/04/16 | Dr. Steffen Schmitt Core Facility Flow Cytometry; W220
Slide 34 23/04/16 | Dr. Steffen Schmitt Core Facility Flow Cytometry; W220

Slide 35 23/04/16 | Dr. Steffen Schmitt Core Facility Flow Cytometry; W220

Slide 36 23/04/16 | Dr. Steffen Schmitt Core Facility Flow Cytometry; W220

Slide 37 23/04/16 | Dr. Steffen Schmitt Core Facility Flow Cytometry; W220
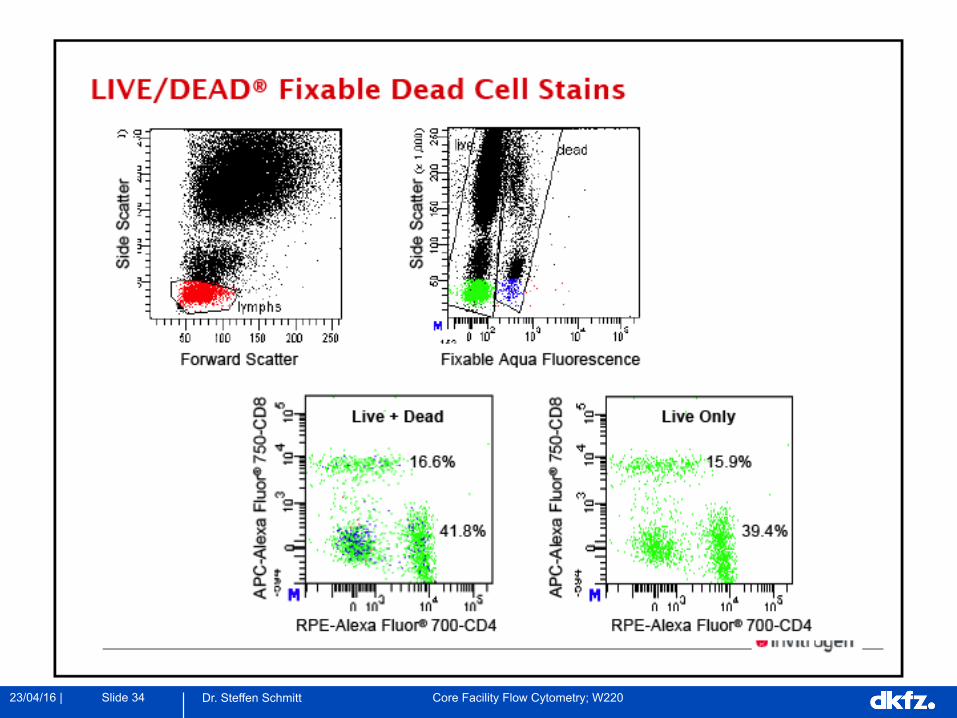
Flow cytometric methods for analysis of Apoptosis/ cell death
• Changes in cell morphology • Changes in plasmamembrane-structure and in transport-functions
• Loss of function of cell organelles (e.g. Mitochondria) • DNA-content (endonucleolytic DNA-degradation)
• Apoptosis associated proteins (e.g. Caspases)

Slide 38 23/04/16 | Dr. Steffen Schmitt Core Facility Flow Cytometry; W220
Flow cytometric methods for analysis of Apoptosis/ cell death
• Changes in cell morphology e.g. different FSC/ SSC signals • Changes in plasmamembrane-structure and in transport-functions
• Loss of function of cell organelles (e.g. Mitochondria) • DNA-content (endonucleolytic DNA-degradation)
• Apoptosis associated proteins (e.g. Caspases)

Slide 39 23/04/16 | Dr. Steffen Schmitt Core Facility Flow Cytometry; W220
CD8 + Lymphocytes
Reduced FSC / SSC signal

Slide 40 23/04/16 | Dr. Steffen Schmitt Core Facility Flow Cytometry; W220
Flow cytometric methods for analysis of Apoptosis
• Changes in cell morphology • Changes in plasmamembrane-structure and in transport-functions e.g. - membrane “flipping” - strong uptake of dyes • Loss of function of cell organelles (e.g. Mitochondria) • DNA-content (endonucleolytic DNA-degradation)
• Apoptosis associated proteins (e.g. Caspases)

Slide 41 23/04/16 | Dr. Steffen Schmitt Core Facility Flow Cytometry; W220
Annexin V - Staining
Theory
normal cells
outer cell membrane
inner cell membrane
Annexin V
lipid
phosphatidylserin
Annexin V Annexin V
apoptotic cells
PE
Slide 42 23/04/16 | Dr. Steffen Schmitt Core Facility Flow Cytometry; W220
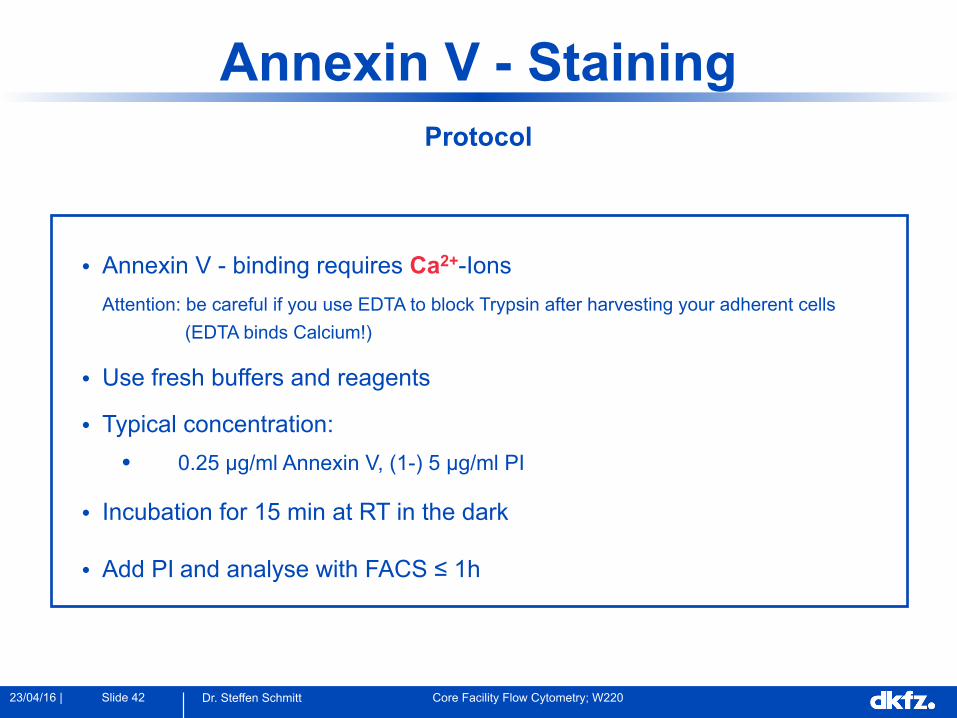
Annexin V - Staining
Protocol
• Annexin V - binding requires Ca2+-Ions
Attention: be careful if you use EDTA to block Trypsin after harvesting your adherent cells (EDTA binds Calcium!)
• Use fresh buffers and reagents
• Typical concentration: • 0.25 µg/ml Annexin V, (1-) 5 µg/ml PI
• Incubation for 15 min at RT in the dark
• Add PI and analyse with FACS ≤ 1h

Slide 43 23/04/16 | Dr. Steffen Schmitt Core Facility Flow Cytometry; W220
Annexin V - Staining
Data analysis
control treated
Tobias Nübel, University Mainz
100 101 102 103 104FL1-H-AnnexinV
100 101 102 103 104FL1-H-AnnexinV
0,9 % 1,6 %
2,5 % 94,8 %
2,9 % 19 %
14,7 % 63,3 %
Annexin V FITC
PI

Slide 44 23/04/16 | Dr. Steffen Schmitt Core Facility Flow Cytometry; W220
Uptake of dyes
• Sytox Green Excitation: 488 nm (blue); Emission: green Fluorescence • Propidium Iodide Excitation: 488 nm (blue); Emission: orange/ red Fluorescence • 7-Actinomycin D (7AAD) Excitation: 488 nm (blue); Emission: red Fluorescence • To-Pro3 Excitation: 633 nm (red); Emission: red Fluorescence ...
Slide 45 23/04/16 | Dr. Steffen Schmitt Core Facility Flow Cytometry; W220
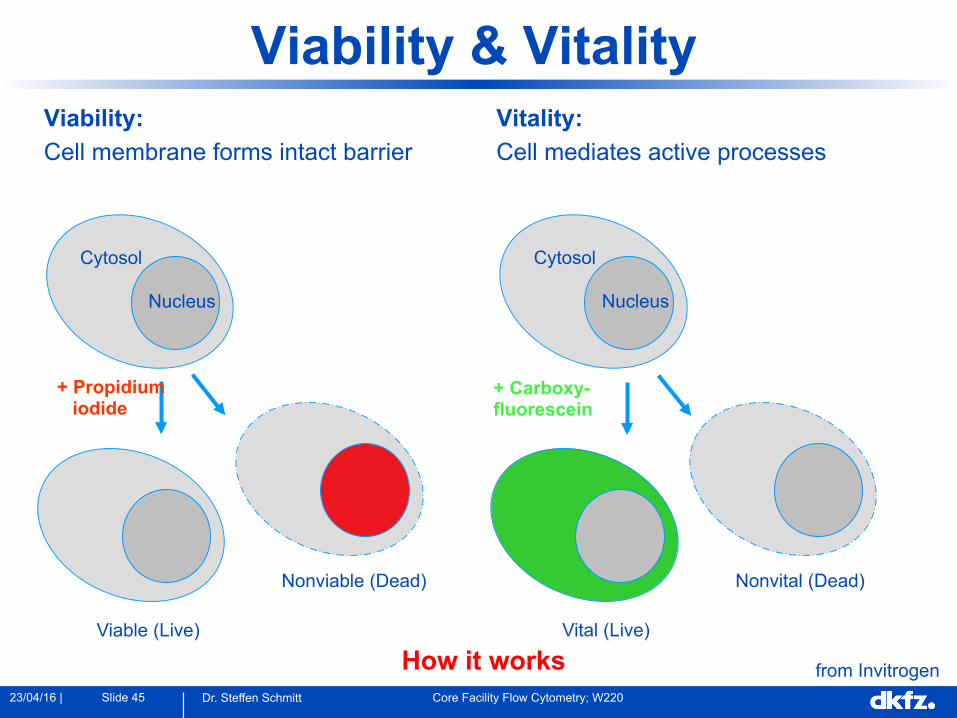
Viability: Cell membrane forms intact barrier
Vitality: Cell mediates active processes
Viability & Vitality
Cytosol
Nucleus
Viable (Live)
Nonviable (Dead)
+ Propidium iodide
Cytosol
Nucleus
Vital (Live)
Nonvital (Dead)
+ Carboxy- fluorescein
How it works from Invitrogen
Slide 46 23/04/16 | Dr. Steffen Schmitt Core Facility Flow Cytometry; W220
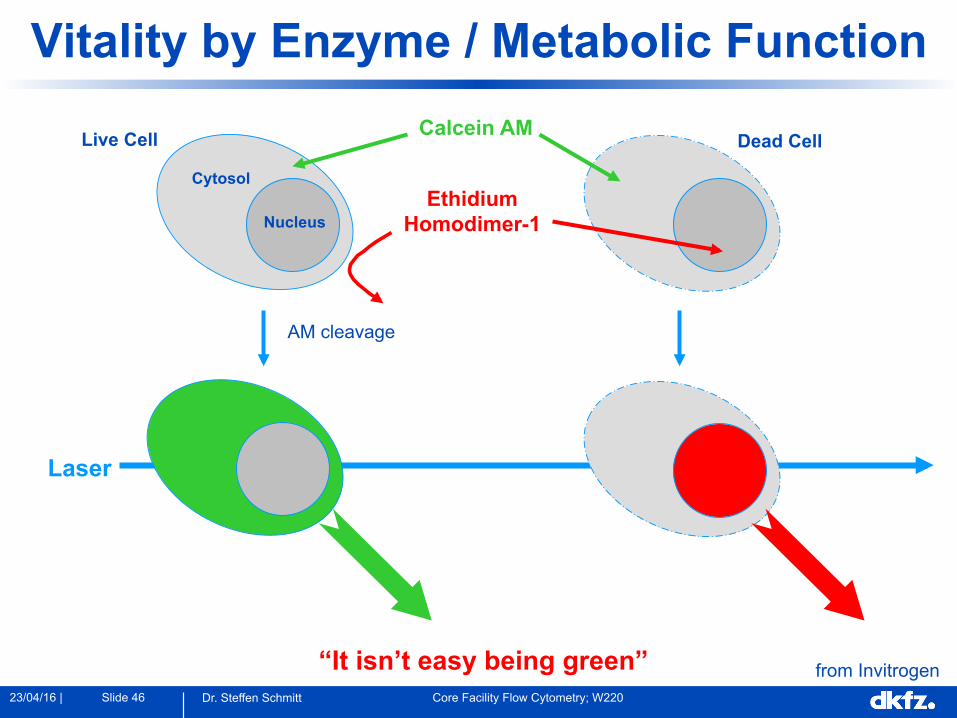
Vitality by Enzyme / Metabolic Function
Laser
Live Cell Dead Cell Calcein AM
Ethidium Homodimer-1
Cytosol
Nucleus
AM cleavage
“It isn’t easy being green” from Invitrogen

Slide 47 23/04/16 | Dr. Steffen Schmitt Core Facility Flow Cytometry; W220
LIVE/DEAD® Viability / Cytotoxicity Kit
Vitality = metabolic activity
• Rapid assay • Detects live and dead cells simultaneously • The most popular viability assay kit for Microscopy, Flow Cytometry and
Multiwell plate scanner
Calcein AM (Green fluorescence)
Ethi
dium
Hom
odim
er-1
(R
ed fl
uore
scen
ce)
Calcein AM and Ethidium Homodimer-1
BPAE cells stained with the LIVE/DEAD Viability/Cytotoxicity Kit (L3224)
Measurement of intracellular esterase activity and membrane integrity
from Invitrogen

Slide 48 23/04/16 | Dr. Steffen Schmitt Core Facility Flow Cytometry; W220
Flow cytometric methods for analysis of Apoptosis
• Changes in cell morphology • Changes in plasmamembrane-structure and in transport-functions
• Loss of function of cell organelles (e.g. Mitochondria) e.g. - JC-1 as indicator for mitochondrial membrane potential - generation of reactive oxygen species (ROS) • DNA-content (endonucleolytic DNA-degradation)
• Apoptosis associated proteins (e.g. Caspases)

Slide 49 23/04/16 | Dr. Steffen Schmitt Core Facility Flow Cytometry; W220
Mitochondrial Membrane potential
! Combining signals from the green-fluorescent JC-1 monomer and the red-fluorescent J-aggregate
! For flow cytometry, JC-1 can be excited at 488 nm and detected using the green channel for the monomer and the red channel for the J-aggregate form
JC-1
from Invitrogen

Slide 50 23/04/16 | Dr. Steffen Schmitt Core Facility Flow Cytometry; W220
JC-1
5,5',6,6'-tetrachloro-1,1',3,3'-tetraethylbenzimidazolylcarbocyanin Iodide
! J-aggregates are formed at the mitochondrial membrane
dependent on the membrane potential. This results in a
shift of the Fluorescence emission (red fluorescence).
! With loss of membrane potential the J-aggregates disintegrate in monomers (green fluorescence).
Slide 51 23/04/16 | Dr. Steffen Schmitt Core Facility Flow Cytometry; W220
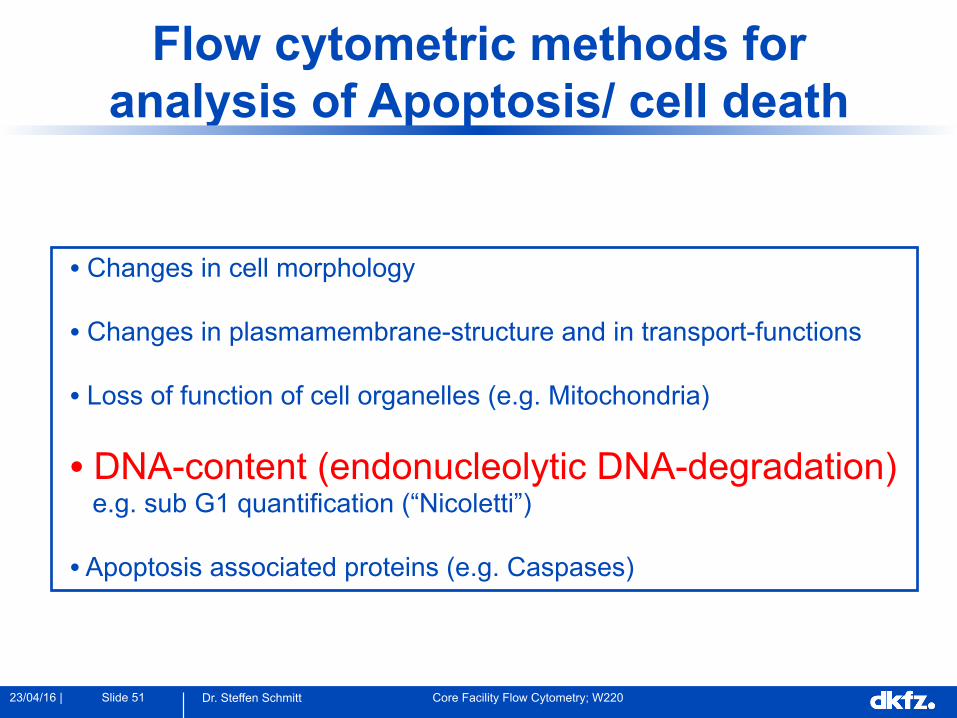
Flow cytometric methods for analysis of Apoptosis/ cell death
• Changes in cell morphology • Changes in plasmamembrane-structure and in transport-functions
• Loss of function of cell organelles (e.g. Mitochondria) • DNA-content (endonucleolytic DNA-degradation) e.g. sub G1 quantification (“Nicoletti”)
• Apoptosis associated proteins (e.g. Caspases)

Slide 52 23/04/16 | Dr. Steffen Schmitt Core Facility Flow Cytometry; W220
We can use the DNA dyes in 2 ways
1. To quantify cellular DNA content
2. As a dead cell discriminator

Slide 53 23/04/16 | Dr. Steffen Schmitt Core Facility Flow Cytometry; W220
DNA-Degradation
sub G1
control irradiated
Binje Fleischer, University Mainz
100 101 102 103 104FL2-H
Sub G1
9,6%
100 101 102 103 104FL2-H
Sub G1
29,6%

Slide 54 23/04/16 | Dr. Steffen Schmitt Core Facility Flow Cytometry; W220
Flow cytometric methods for analysis of Apoptosis/ cell death
• Changes in cell morphology • Changes in plasmamembrane-structure and in transport-functions
• Loss of function of cell organelles (e.g. Mitochondria) • DNA-content (endonucleolytic DNA-degradation)
• Apoptosis associated proteins (e.g. Caspases) e.g. - PARP- cleavage - FLICA

Slide 55 23/04/16 | Dr. Steffen Schmitt Core Facility Flow Cytometry; W220
FLICA Apoptosis Kits
4 out of 5 cells are apoptotic: Jurkat cells were labeled with ICT's Poly-Caspases FLICA™ kit . 4 cells fluoresce green (left), while the grey image (right) reveals 5 cells in the field. The 4 green cells are apoptotic = 80% of cells in this experiment had active caspases. The level of fluorescence can be quantified on a fluorescence plate reader or flow cytometer. Data courtesy of Dr. Brian W. Lee, ICT.
• Fluorescent-Labeled Inhibitor of Caspases
• quantitate apoptosis via active caspases in whole, living cells
• Using inibitor proteins like VAD
taken from immunochemistry Technologies

Slide 56 23/04/16 | Dr. Steffen Schmitt Core Facility Flow Cytometry; W220
Summary Apoptosis
• Consider the cells/model used: - Include supernatant if working with adherent cells - What positive control to use - When to look for apoptosis (time point, kinetic)
• Complement flow studies with other methods: - Microscopy (- DNA laddering, TUNEL-Assay)

Slide 57 23/04/16 | Dr. Steffen Schmitt Core Facility Flow Cytometry; W220
Acknowledgements
Some slides were generated through stimulation/ support of following companies:
BD Biosciences
Beckman Coulter, (Cytomation) Invitrogen
Partec
Some other slides were adapted from slides you can find in the www or in the sources shown on slide 17.
Special thanks to Derek Davis (UK / cell cycle) and
Mario Roederer (USA / compensation, bi-exponential display)