dna contents of chromosome ph1 and chromosome 21 in human chronic granulocytic leukemia
TRANSCRIPT
pH-- 2.2 4.0 pH-- 2.2 4.0 7.0 7.0
Ec Ec
10.0 10.0
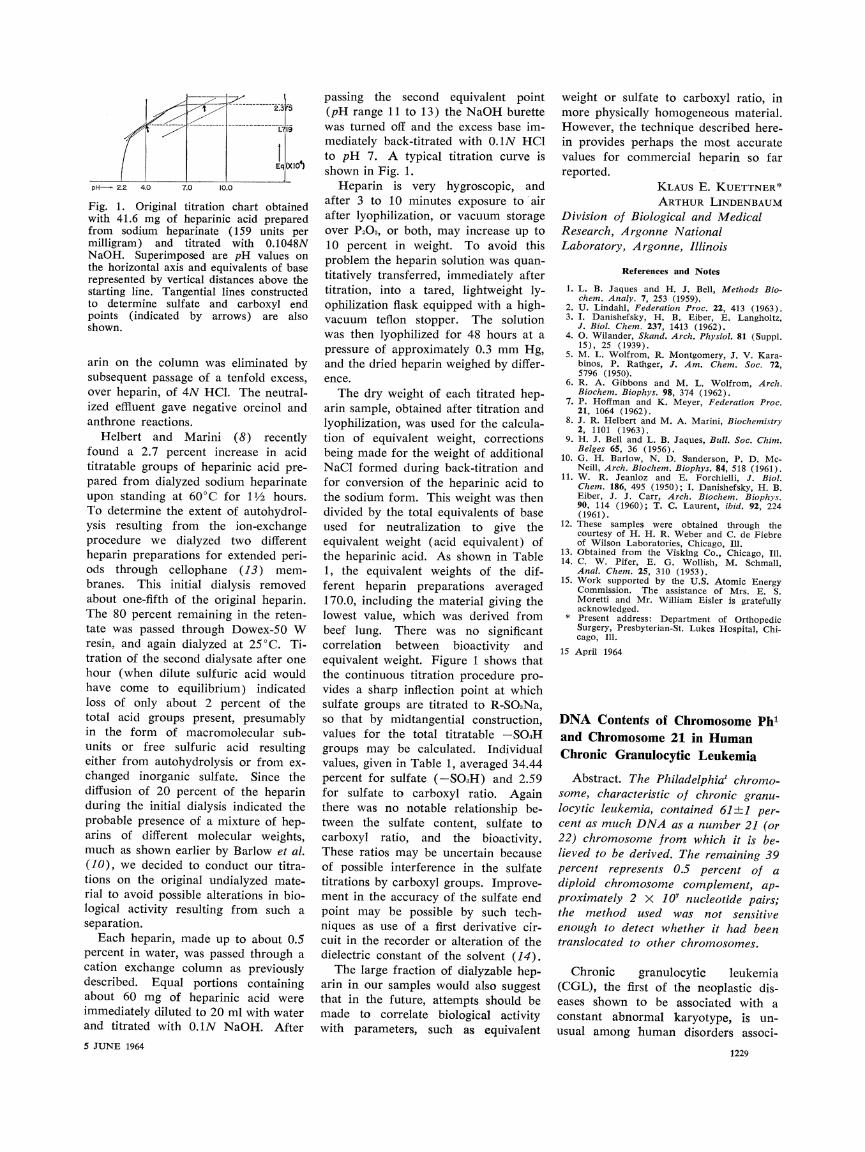
Fig. 1. Original titration chart obtained with 41.6 mg of heparinic acid prepared from sodium heparinate (159 units per milligram) and titrated with 0.1048N NaOH. Superimposed are pH values on the horizontal axis and equivalents of base represented by vertical distances above the starting line. Tangential lines constructed to determine sulfate and carboxyl end points (indicated by arrows) are also shown.
arin on the column was eliminated by subsequent passage of a tenfold excess, over heparin, of 4N HCl. The neutral- ized effluent gave negative orcinol and anthrone reactions.
Helbert and Marini (8) recently found a 2.7 percent increase in acid titratable groups of heparinic acid pre- pared from dialyzed sodium heparinate upon standing at 60?C for 1?2 hours. To determine the extent of autohydrol- ysis resulting from the ion-exchange procedure we dialyzed two different
heparin preparations for extended peri- ods through cellophane (13) mem- branes. This initial dialysis removed about one-fifth of the original heparin. The 80 percent remaining in the reten- tate was passed through Dowex-50 W resin, and again dialyzed at 25?C. Ti- tration of the second dialysate after one hour (when dilute sulfuric acid would have come to equilibrium) indicated loss of only about 2 percent of the total acid groups present, presumably in the form of macromolecular sub- units or free sulfuric acid resulting either from autohydrolysis or from ex-
changed inorganic sulfate. Since the diffusion of 20 percent of the heparin during the initial dialysis indicated the
probable presence of a mixture of hep- arins of different molecular weights, much as shown earlier by Barlow et al. (10), we decided to conduct our titra- tions on the original undialyzed mate- rial to avoid possible alterations in bio- logical activity resulting from such a separation.
Each heparin, made up to about 0.5 percent in water, was passed through a cation exchange column as previously described. Equal portions containing about 60 mg of heparinic acid were immediately diluted to 20 ml with water and titrated with 0.1N NaOH. After
5 JUNE 1964
passing the second equivalent point (pH range 11 to 13) the NaOH burette was turned off and the excess base im- mediately back-titrated with 0.1N HC1 to pH 7. A typical titration curve is shown in Fig. 1.
Heparin is very hygroscopic, and after 3 to 10 minutes exposure to air after lyophilization, or vacuum storage over P205, or both, may increase up to 10 percent in weight. To avoid this problem the heparin solution was quan- titatively transferred, immediately after titration, into a tared, lightweight ly- ophilization flask equipped with a high- vacuum teflon stopper. The solution was then lyophilized for 48 hours at a pressure of approximately 0.3 mm Hg, and the dried heparin weighed by differ- ence.
The dry weight of each titrated hep- arin sample, obtained after titration and lyophilization, was used for the calcula- tion of equivalent weight, corrections being made for the weight of additional NaCl formed during back-titration and for conversion of the heparinic acid to the sodium form. This weight was then divided by the total equivalents of base used for neutralization to give the equivalent weight (acid equivalent) of the heparinic acid. As shown in Table 1, the equivalent weights of the dif- ferent heparin preparations averaged 170.0, including the material giving the lowest value, which was derived from beef lung. There was no significant correlation between bioactivity and equivalent weight. Figure 1 shows that the continuous titration procedure pro- vides a sharp inflection point at which sulfate groups are titrated to R-SO3Na, so that by midtangential construction, values for the total titratable -SO3H groups may be calculated. Individual values, given in Table 1, averaged 34.44 percent for sulfate (-SO3H) and 2.59 for sulfate to carboxyl ratio. Again there was no notable relationship be- tween the sulfate content, sulfate to carboxyl ratio, and the bioactivity. These ratios may be uncertain because of possible interference in the sulfate titrations by carboxyl groups. Improve- ment in the accuracy of the sulfate end point may be possible by such tech- niques as use of a first derivative cir- cuit in the recorder or alteration of the dielectric constant of the solvent (14).
The large fraction of dialyzable hep-
passing the second equivalent point (pH range 11 to 13) the NaOH burette was turned off and the excess base im- mediately back-titrated with 0.1N HC1 to pH 7. A typical titration curve is shown in Fig. 1.
Heparin is very hygroscopic, and after 3 to 10 minutes exposure to air after lyophilization, or vacuum storage over P205, or both, may increase up to 10 percent in weight. To avoid this problem the heparin solution was quan- titatively transferred, immediately after titration, into a tared, lightweight ly- ophilization flask equipped with a high- vacuum teflon stopper. The solution was then lyophilized for 48 hours at a pressure of approximately 0.3 mm Hg, and the dried heparin weighed by differ- ence.
The dry weight of each titrated hep- arin sample, obtained after titration and lyophilization, was used for the calcula- tion of equivalent weight, corrections being made for the weight of additional NaCl formed during back-titration and for conversion of the heparinic acid to the sodium form. This weight was then divided by the total equivalents of base used for neutralization to give the equivalent weight (acid equivalent) of the heparinic acid. As shown in Table 1, the equivalent weights of the dif- ferent heparin preparations averaged 170.0, including the material giving the lowest value, which was derived from beef lung. There was no significant correlation between bioactivity and equivalent weight. Figure 1 shows that the continuous titration procedure pro- vides a sharp inflection point at which sulfate groups are titrated to R-SO3Na, so that by midtangential construction, values for the total titratable -SO3H groups may be calculated. Individual values, given in Table 1, averaged 34.44 percent for sulfate (-SO3H) and 2.59 for sulfate to carboxyl ratio. Again there was no notable relationship be- tween the sulfate content, sulfate to carboxyl ratio, and the bioactivity. These ratios may be uncertain because of possible interference in the sulfate titrations by carboxyl groups. Improve- ment in the accuracy of the sulfate end point may be possible by such tech- niques as use of a first derivative cir- cuit in the recorder or alteration of the dielectric constant of the solvent (14).
The large fraction of dialyzable hep- arin in our samples would also suggest that in the future, attempts should be made to correlate biological activity with parameters, such as equivalent
arin in our samples would also suggest that in the future, attempts should be made to correlate biological activity with parameters, such as equivalent
weight or sulfate to carboxyl ratio, in more physically homogeneous material. However, the technique described here- in provides perhaps the most accurate values for commercial heparin so far reported.
KLAUS E. KUETTNER* ARTHUR LINDENBAUM
Division of Biological and Medical Research, Argonne National Laboratory, Argonne, Illinois
References and Notes
1. L. B. Jaques and H. J. Bell, Methods Bio- chem. Analy. 7, 253 (1959).
2. U. Lindahl, Federation Proc. 22, 413 (1963). 3. I. Danishefsky, H. B. Eiber, E. Langholtz,
J. Biol. Chem. 237, 1413 (1962). 4. 0. Wilander, Skand. Arch. Physiol. 81 (Suppl.
15), 25 (1939). 5. M. L. Wolfrom, R. Montgomery, J. V. Kara-
binos, P. Rathger, J. Am. Chem. Soc. 72, 5796 (1950).
6. R. A. Gibbons and M. L. Wolfrom, Arch. Biochem. Biophys. 98, 374 (1962).
7. P. Hoffman and K. Meyer, Federation Proc. 21, 1064 (1962).
8. J. R. Helbert and M. A. Marini, Biochemistry 2, 1101 (1963).
9. H. J. Bell and L. B. Jaques, Bull. Soc. Chim. Belges 65, 36 (1956).
10. G. H. Barlow, N. D. Sanderson, P. D. Mc- Neill, Arch. Biochem. Biophys. 84, 518 (1961).
11. W. R. Jeanloz and E. Forchielli, J. Biol. Chem. 186, 495 (1950); I. Danishefsky, H. B. Eiber, J. J. Carr, Arch. Biochem. Biophys. 90, 114 (1960); T. C. Laurent, ibid. 92, 224 (1961).
12. These samples were obtained through the courtesy of H. H. R. Weber and C. de Fiebre of Wilson Laboratories, Chicago, Ill.
13. Obtained from the Visking Co., Chicago, Ill. 14. C. W. Pifer, E. G. Wollish, M. Schmall,
Anal. Chem. 25, 310 (1953). 15. Work supported by the U.S. Atomic Energy
Commission. The assistance of Mrs. E. S. Moretti and Mr. William Eisler is gratefully acknowledged.
* Present address: Department of Orthopedic Surgery, Presbyterian-St. Lukes Hospital, Chi- cago, Ill.
15 April 1964
DNA Contents of Chromosome Ph1 and Chromosome 21 in Human Chronic Granulocytic Leukemia
Abstract. The Philadelphia' chromo- some, characteristic of chronic granu- locytic leukemia, contained 61?+1 per- cent as much DNA as a number 21 (or 22) chromosome from which it is be- lieved to be derived. The remaining 39 percent represents 0.5 percent of a diploid chromosome complement, ap- proximately 2 X 10⁷ nucleotide pairs; the method used was not sensitive enough to detect whether it had been translocated to other chromosomes.
Chronic granulocytic leukemia
weight or sulfate to carboxyl ratio, in more physically homogeneous material. However, the technique described here- in provides perhaps the most accurate values for commercial heparin so far reported.
KLAUS E. KUETTNER* ARTHUR LINDENBAUM
Division of Biological and Medical Research, Argonne National Laboratory, Argonne, Illinois
References and Notes
1. L. B. Jaques and H. J. Bell, Methods Bio- chem. Analy. 7, 253 (1959).
2. U. Lindahl, Federation Proc. 22, 413 (1963). 3. I. Danishefsky, H. B. Eiber, E. Langholtz,
J. Biol. Chem. 237, 1413 (1962). 4. 0. Wilander, Skand. Arch. Physiol. 81 (Suppl.
15), 25 (1939). 5. M. L. Wolfrom, R. Montgomery, J. V. Kara-
binos, P. Rathger, J. Am. Chem. Soc. 72, 5796 (1950).
6. R. A. Gibbons and M. L. Wolfrom, Arch. Biochem. Biophys. 98, 374 (1962).
7. P. Hoffman and K. Meyer, Federation Proc. 21, 1064 (1962).
8. J. R. Helbert and M. A. Marini, Biochemistry 2, 1101 (1963).
9. H. J. Bell and L. B. Jaques, Bull. Soc. Chim. Belges 65, 36 (1956).
10. G. H. Barlow, N. D. Sanderson, P. D. Mc- Neill, Arch. Biochem. Biophys. 84, 518 (1961).
11. W. R. Jeanloz and E. Forchielli, J. Biol. Chem. 186, 495 (1950); I. Danishefsky, H. B. Eiber, J. J. Carr, Arch. Biochem. Biophys. 90, 114 (1960); T. C. Laurent, ibid. 92, 224 (1961).
12. These samples were obtained through the courtesy of H. H. R. Weber and C. de Fiebre of Wilson Laboratories, Chicago, Ill.
13. Obtained from the Visking Co., Chicago, Ill. 14. C. W. Pifer, E. G. Wollish, M. Schmall,
Anal. Chem. 25, 310 (1953). 15. Work supported by the U.S. Atomic Energy
Commission. The assistance of Mrs. E. S. Moretti and Mr. William Eisler is gratefully acknowledged.
* Present address: Department of Orthopedic Surgery, Presbyterian-St. Lukes Hospital, Chi- cago, Ill.
15 April 1964
DNA Contents of Chromosome Ph1 and Chromosome 21 in Human Chronic Granulocytic Leukemia
Abstract. The Philadelphia' chromo- some, characteristic of chronic granu- locytic leukemia, contained 61?+1 per- cent as much DNA as a number 21 (or 22) chromosome from which it is be- lieved to be derived. The remaining 39 percent represents 0.5 percent of a diploid chromosome complement, ap- proximately 2 X 10⁷ nucleotide pairs; the method used was not sensitive enough to detect whether it had been translocated to other chromosomes.
Chronic granulocytic leukemia (CGL), the first of the neoplastic dis- eases shown to be associated with a constant abnormal karyotype, is un- usual among human disorders associ-
1229
(CGL), the first of the neoplastic dis- eases shown to be associated with a constant abnormal karyotype, is un- usual among human disorders associ-
1229
4t 2--3 r-
A.0 K ----_ _- _
4t 2--3 r-
A.0 K ----_ _- _
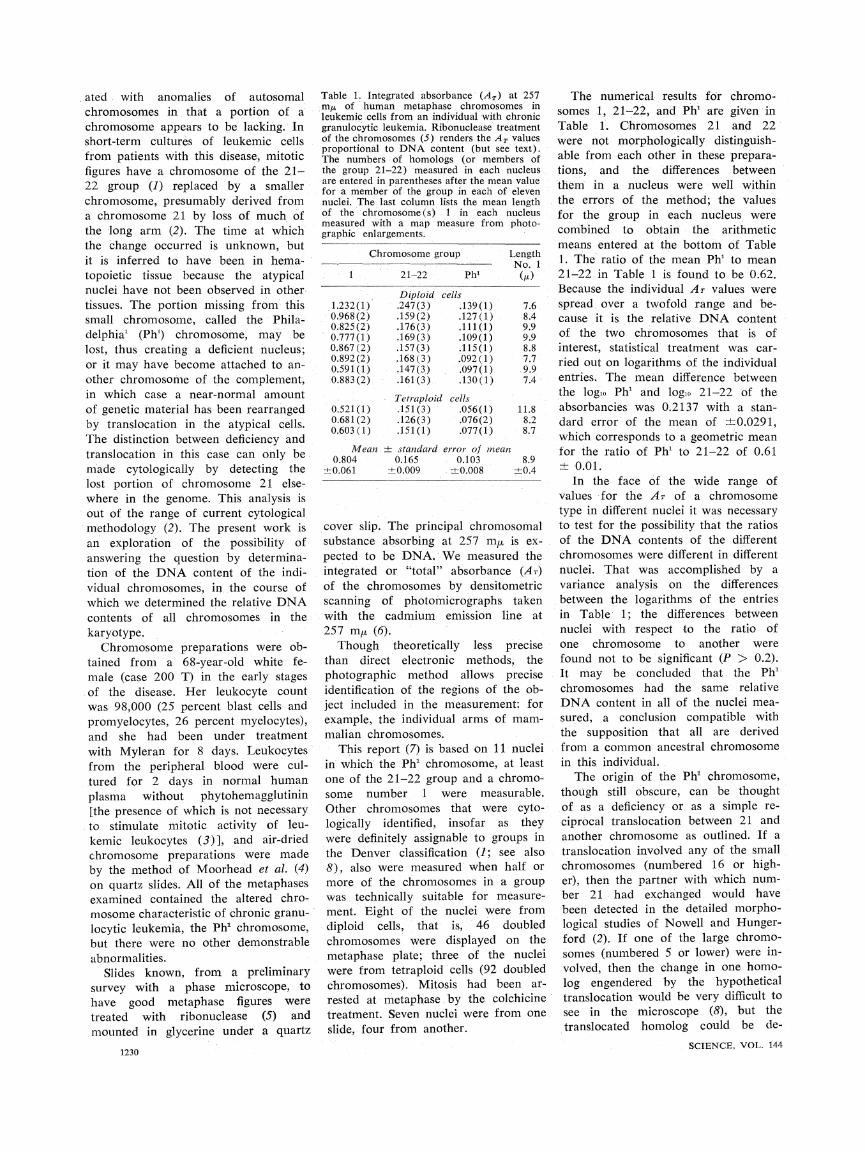
ated with anomalies of autosomal Table 1. Integrated absorbance (AT) at 257 :m.t of human metaphase chromosomes in chromosomes in that a portion of a m of human metaphase chromosomes in leukemic cells from an individual with chronic
chromosome appears to be lacking. In granulocytic leukemia. Ribonuclease treatment
short-term cultures of leukemic cells of the chromosomes (5) renders the An values ? . ~~~~~ . \ - . ,proportional to DNA content (but see text).
from patients with this disease, mitotic The numbers of homologs (or members of
figures have a chromosome of the 21- the group 21-22) measured in each nucleus
22 group (1) replaced by a smaller -are entered in parentheses after the mean value for a member of the group in each of eleven
chromosome, presumably derived from nuclei. The last column lists the mean length a chromosome 21 by loss of much of of the chromosome (s) 1 in each nucleus
measured with a map measure from photo- the long arm (2). The time at which graphic enlargements. the change occurred is unknown, but
Chromosome group Length it is inferred to have been in hema- Chromosome group Length
topoietic tissue because the atypical 1 21-22 Ph' (,) nuclei have not been observed in other Diloid cells
tissues. The portion missing from this 1.232(1) .247(3) .139(1) 7.6 small chromosome, called the Phila- 0.968(2) .159(2) .127(1) 8.4
0.825(2) .176(3) .111(1) 9.9 delphia' (Ph1) chromosome, may be 0.777(1) .169(3) .109(1) 9.9 lost, thus creating a deficient nucleus; 0.867(2) .157(3) .115(1) 8.8
or it may have become attached to an- 0892(2) 168(3) 092(1) 7.7 0.591(1) .147(3) .097(1) 9.9
other chromosome of the complement, 0.883(2) .161(3) .130(1) 7.4
in which case a near-normal amount Tetraploid cells of genetic material has been rearranged 0.521(1) .151(3) .056(1) 11.8
by translocation in the atypical cells. 0.681(2) .126(3) .076(2) 8.2 0.603'(1) .151(1) .077(1) 8.7
The distinction between deficiency and
translocation in this case can only be Mean? standard error lf mean
0.804 0.165 0.103 8.9 made cytologically by detecting the -0.061 +0.009 ?0.008 ?0.4 lost portion of chromosome 21 else- where in the genome. This analysis is out of the range of current cytological methodology (2). The present work is cover slip. The principal chromosomal an exploration of the possibility of substance absorbing at 257 m/I is ex-
answering the question by determina- pected to be DNA. We measured the tion of the DNA content of the indi- integrated or "total" absorbance (Ar) vidual chromosomes, in the course of of the chromosomes by densitometric which we determined the relative DNA scanning of photomicrographs taken contents of all chromosomes in the with the cadmium emission line at
karyotype. 257 m,I (6). Chromosome preparations were ob- Though theoretically less precise
tained from a 68-year-old white fe- than direct electronic methods, the
male (case 200 T) in the early stages photographic method allows precise of the disease. Her leukocyte count identification of the regions of the ob- was 98,000 (25 percent blast cells and ject included in the measurement: for
promyelocytes, 26 percent myelocytes), example, the individual arms of mam-
and she had been under treatment malian chromosomes.
with Myleran for 8 days. Leukocytes This report (7) is based on 11 nuclei
from the peripheral blood were cul- in which the Ph' chromosome, at least
tured for 2 days in normal human one of the 21-22 group and a chromo-
plasma without phytohemagglutinin some number 1 were measurable.
[the presence of which is not necessary Other chromosomes that were cyto- to stimulate mitotic activity of leu- logically identified, insofar as they kemic leukocytes (3)], and air-dried were definitely assignable to groups in
chromosome preparations were made the Denver classification (1; see also
by the method of Moorhead et al. (4) 8), also were measured when half or
on quartz slides. All of the metaphases more of the chromosomes in a group examined contained the altered chro- was technically suitable for measure-
mosome characteristic of chronic granu- ment. Eight of the nuclei were from
locytic leukemia, the Ph' chromosome, diploid cells, that is, 46 doubled
but there were no other demonstrable chromosomes were displayed on the
abnormalities. metaphase plate; three of the nuclei
Slides known, from a preliminary were from tetraploid cells (92 doubled
survey with a phase microscope, to chromosomes). Mitosis had been ar-
have good metaphase figures were rested at metaphase by the colchicine
treated with ribonuclease (5) and treatment. Seven nuclei were from one
mounted in glycerine under a quartz slide, four from another.
1230
The numerical results for chromo- somes 1, 21-22, and Ph' are given in Table 1. Chromosomes 21 and 22 were not morphologically distinguish- able from each other in these prepara- tions, and the differences between them in a nucleus were well within the errors of the method; the values for the group in each nucleus were combined to obtain the arithmetic means entered at the bottom of Table 1. The ratio of the mean Ph' to mean 21-22 in Table 1 is found to be 0.62. Because the individual AT values were spread over a twofold range and be- cause it is the relative DNA content of the two chromosomes that is of interest, statistical treatment was car- ried out on logarithms of the individual entries. The mean difference between the logio Ph' and logio 21-22 of the absorbancies was 0.2137 with a stan- dard error of the mean of ?0.0291, which corresponds to a geometric mean for the ratio of Ph' to 21-22 of 0.61 + 0.01.
In the face of the wide range of values for the AT of a chromosome type in different nuclei it was necessary to test for the possibility that the ratios of the DNA contents of the different chromosomes were different in different nuclei. That was accomplished by a variance analysis on the differences between the logarithms of the entries in Table 1; the differences between nuclei with respect to the ratio of one chromosome to another were found not to be significant (P > 0.2). It may be concluded that the Ph' chromosomes had the same relative DNA content in all of the nuclei mea- sured, a conclusion compatible with the supposition that all are derived from a common ancestral chromosome in this individual.
The origin of the Ph' chromosome, though still obscure, can be thought of as a deficiency or as a simple re- ciprocal translocation between 21 and another chromosome as outlined. If a translocation involved any of the small chromosomes (numbered '16 or high- er), then the partner with which num- ber 21 had exchanged would have been detected in the detailed morpho- logical studies of Nowell and Hunger- ford (2). If one of the large chromo- somes (numbered 5 or lower) were in- volved, then the change in one homo-
log engendered by the hypothetical translocation would be very difficult to see in the microscope (8), but the translocated homolog could be de-
SCIENCE, VOL. 144
tected by absorption measurements, if the precision of the measurements were sufficiently high. The data neces- sary to evaluate the precision, namely the AT of the appropriate chromosomes and the standard deviation of a mea- surement of a homolog, were de- termined for our material. The stan- dard deviation, based on the differences between 28 pairs of homologs within nuclei, is ?0.059 units of AT and is not demonstrably dependent on chro- mosome size. Since the translocated piece would have about the same ab- sorbance (0.062 units from the means in Table 1) it is obvious that we could not detect it, if it did exist, by a com- parison of the two homologs in a single nucleus. An alternative pro- cedure to detect the translocation, that is, a comparison of the variability be- tween homologs in many nuclei for different chromosomes, would not be practical by so laborious a method as the photographic one. That direct electronic measurement would also be inadequate is clear from the varia- bility reported by Carlson et al. (9) in a recent application to mammalian (Chinese hamster) chromosomes.
It must be mentioned in passing that the highly significant differences be- tween nuclei (below the 1 percent level of probability) with respect to AT of individual chromosomes (Table 1) or whole nuclei (Table 2) cannot be at- tributed to the pathological condition of the individual from whom the ma- terial was taken. A separate analysis of the lengths in Table 1 (10) shows that low values of AT are associated with the most extreme effects of treat- ing the cells with a hypotonic solution (hypotonic serum in this case) before fixation. This prior treatment tends to uncoil the metaphase chromosomes rendering them morphologically more distinctive and longer (11); the correla- tion coefficient (r) between AT and length of chromosomes 1 in Table 1 is significantly different from zero (r = -0.62 ? 0.25). This source of vari- ability does not affect the comparisons we have made within nuclei; it does, however, vitiate any conclusions that might be drawn concerning the rela- tion between the content of DNA of chromosomes in diploid and tetraploid nuclei (Table 1) (12).
The magnitude of the amount of DNA lost (as in a deficiency) or trans- located in a chromosomal rearrange- ment to produce the Ph' chromosome can be estimated either directly from
5 JUNE 1964
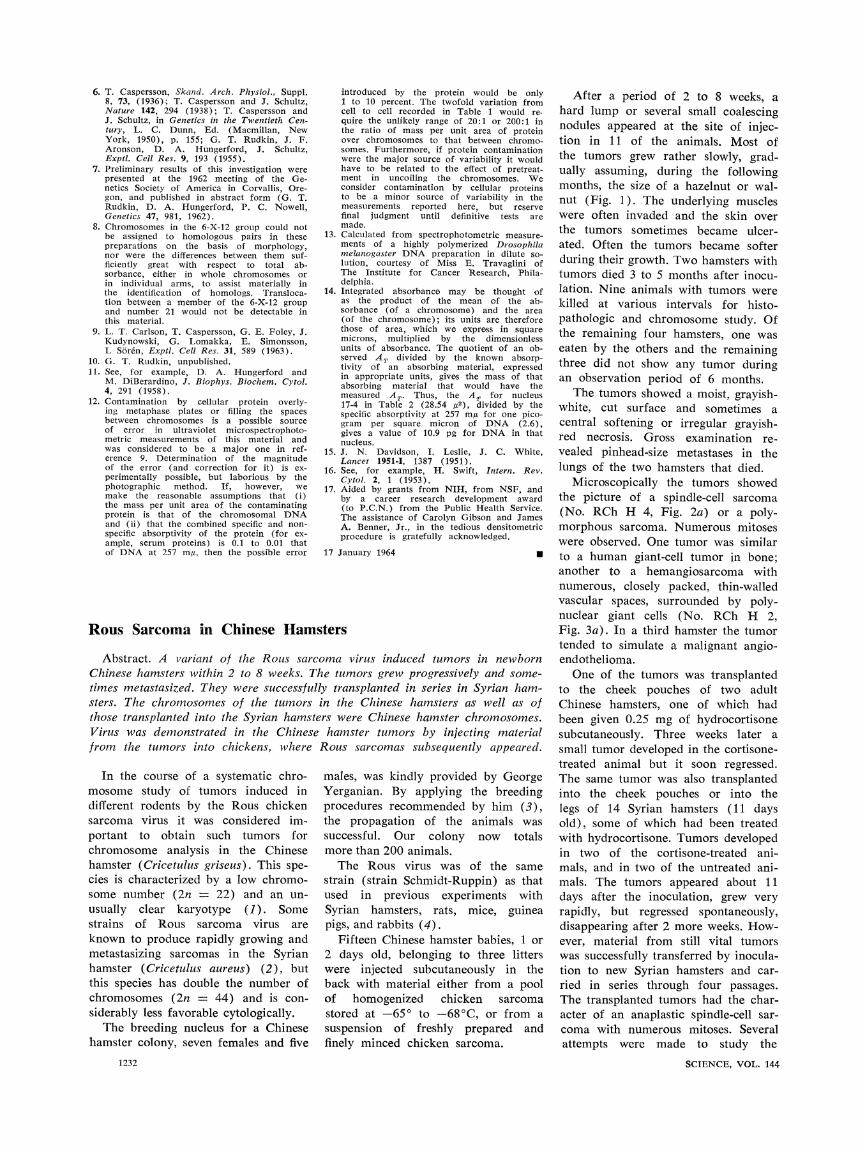
Table 2. Integrated absorbance (AT) at 257 mr of groups of human chromosomes (Denver classification) in metaphase plates of diploid cells from a female with chronic granulocytic leukemia. The numbers in columns 2-6 are the total AT for all of the chromosomes in the group based on measurement of the number of chromosomes given in parentheses. The total number of chromosomes measured out of the possible 46 is given in the last line. Column 7 shows the mean percentage of total nuclear Ar found in each group in a diploid nucleus, and its standard error, based on the individual percentages in the five nuclei. See legend to Table 1 for further explanation.
Mean Denver Nucleus code number % group* of
17-4 8-8 17-9 17-5 17-8 nucleus
1 2.46(1) 1.94(2) 1.65(2) 1.55(1) 1.73(2) 8.33?.24 2 2.10(2) 1.74(1) 1.67(2) 1.56(2) 1.42(2) 7.57?+.18 3 1.81(2) 1.67(1) 1.26(1) 1.26(2) 1.36(2) 6.56?+.19 4-5 3.32(4) 3.01(3) 2.04(3) 2.21(3) 2.35(4) 11.53?.45 6-X-12 11.21(15) 9.82(14) 8.20(15) 7.65(12) 7.05(16) 39.17+.56 13-15 3.03(6) 2.48(5) 2.22(4) 2.17(4) 2.00(6) 10.61+.15 16 0.85(2) 0.63(2) 0.59(2) 0.51(1) 0.55(2) 2.79+.12 17-18 1.66(4) 1.32(4) 1.17(4) 1.30(3) 1.13(3) 5.87?.20 19-20 1.22(4) 1.17(4) 1.10(1) 0.87(2) 0.82(3) 4.62+.20 21-22 0.74(3) 0.48(2) 0.53(3) 0.51(3) 0.47(3) 2.43+.12 Ph' 0.14(1) 0.13(1) 0.11(1) 0.11 (1) 0.12(1) 0.54+.02 Number (44) (39) (38) (34) (44)
*See reference (1).
the microspectrophotometric data or from the relative absorbance values and the chemically determined average DNA in a nucleus. Conversion of ab- sorbance to mass of DNA requires knowledge of the specific absorptivity of DNA as it exists in these chromo- somes, a parameter which is not pre- cisely known. As a first approximation we have used a typical value de- termined by measurement in dilute so- lution (13), and calculated to be 2.6 units of Ar for one picogram of DNA per square micron (14). The sums of the AT values in the five nuclei in Table 2 are 28.54, 24.37, 20.55, 19.70, and 19.0, respectively, from which we obtain 10.9, 9.4, 7.9, 7.6, and 7.3 pg of DNA in the five metaphase plates. These can be compared with chemically determined values such as those of Davidson et al. (15): 7.3 pg in leuko- cytes, 8.6 pg in kidney, 8.7 pg in bone marrow, and 10.4 pg in liver, all ex- pressed per nucleus. The chemical de- terminations, it should be remembered, are expected to be high because of the presence of nuclei with more than the "diploid" amount of DNA in most somatic tissues (16) while the values we have determined are for complete metaphase nuclei, that is, the "tetra- ploid" amount. The "deficiency" in a CGL karyotype, according to the chemical data, would be 0.27 percent of a nucleus (Table 2) with 7.3 pg of DNA, or 0.02 pg, equivalent to 2 X 10⁷ nucleotide pairs. Direct conversion of half the difference between the mean AT values determined by micro- spectrophotometry for 21-22 and Ph' in Table 1 gives 0.012 pg of DNA or
about 107 nucleotide pairs. The range of values in Table 1 would be 0.006 to 0.02 pg or 0.6 to 2.0 X 10⁷ nucleotide pairs per diploid chromosome set.
The question of whether the CGL karyotype is deficient for a part of chromosome 21 or whether the Ph' chromosome is a visible manifestation of more subtle interchromosomal changes remains unresolved by our data. The most serious impediment to further investigation along these lines lies now in the preparation of the ma- terial, which so far appears to intro- duce variations in content of DNA far larger than the cytogenetic ones sought, and which must be investigated before microspectrophotometric data can be more effectively interpreted.
GEORGE T. RUDKIN DAVID A. HUNGERFORD
Institute for Cancer Research, Fox Chase, Philadelphia 11, Pennsylvania
PETER C. NOWELL Department of Pathology, School of Medicine, University of Pennsylvania Philadelphia 4
References and Notes
1. We designate human chromosomes by the Denver system in which the autosomes are numbered consecutively from 1, the longest, to 22, the shortest. "A proposed standard system of nomenclature of human mitotic chromosomes" has appeared in Lancet 1960-I, 1063 (1960); Am. J. Human Genet. 12, 384 (1960); J. Am. Med. Assoc. 174, 159 (1960) and elsewhere. See also the account of the more recent London conference on the normal human karyotype in Cytogenetics 2, 264 (1963).
2. P. C. Nowell and D. A. Hungerford, J. Natl. Cancer Inst. 27, 1013 (1961).
3. P. C. Nowell, Cancer Res. 20, 462 (1960). 4. P. S. Moorhead, P. C. Nowell, W. J. Mell-
man, D. M. Battips, D. A. Hungerford, Exptl. Cell Res. 20, 613 (1960).
5. Crystalline, salt-free ribonuclease, Worthing- ton, 1 percent, pH 7.0, 2 hours, 37?C.
1231
6. T. Caspersson, Skand. Arch. Physiol., Suppl. 8, 73, (1936),; T. Caspersson and J. Schultz, Nature 142, 294 (1938); T. Caspersson and J. Schultz, in Genetics in the Twentieth Cen- tury, L. C. Dunn, Ed. (Macmillan, New York, 1950), p. 155; G. T. Rudkin, J. F. Aronson, D. A. Hungerford, J. Schultz, Exptl. Cell Res. 9, 193 (1955).
7. Preliminary results of this investigation were presented at the 1962 meeting of the Ge- netics Society of America in Corvallis, Ore- gon, and published in abstract form (G. T. Rudkin, D. A. Hungerford, P. C. Nowell, Genetics 47, 981, 1962).
8. Chromosomes in the 6-X-12 group could not be assigned to homologous pairs in these preparations on the basis of morphology, nor were the differences between them suf- ficiently great with respect to total ab- sorbance, either in whole chromosomes or in individual arms, to assist materially in the identification of homologs. Transloca- tion between a member of the 6-X-12 group and number 21 would not be detectable in this material.
9. L. T. Carlson, T. Caspersson, G. E. Foley, J. Kudynowski, G. Lomakka, E. Simonsson, L Sore6n, Exptl. Cell Res. 31, 589 (1963).
10. G. T. Rudkin, unpublished. 11. See, for example, D. A. Hungerford and
M. DiBerardino, J. Biophys. Biochem. Cytol. 4, 291 (1958).
12. Contamination by cellular protein overly- ing metaphase plates or filling the spaces between chromosomes is a possible source of error in ultraviolet microspectrophoto- metric measurements of this material and was considered to be a major one in ref- erence 9. Determination of the magnitude of the error (and correction for it) is ex- perimentally possible, but laborious by the photographic method. If, however, we make the reasonable assumptions that (i) the mass per unit area of the contaminating protein is that of the chromosomal DNA and (ii) that the combined specific and non- specific absorptivity of the protein (for ex- ample, serum proteins) is 0.1 to 0.01 that of DNA at 257 m,u, then the possible error
In the course of a systematic chro- mosome study of tumors induced in different rodents by the Rous chicken sarcoma virus it was considered im- portant to obtain such tumors for chromosome analysis in the Chinese hamster (Cricetulus griseus). This spe- cies is characterized by a low chromo- some number (2n = 22) and an un- usually clear karyotype (1). Some strains of Rous sarcoma virus are known to produce rapidly growing and metastasizing sarcomas in the Syrian hamster (Cricetulus aureus) (2), but this species has double the number of chromosomes (2n = 44) and is con- siderably less favorable cytologically.
The breeding nucleus for a Chinese hamster colony, seven females and five
1232
introduced by the protein would be only 1 to 10 percent. The twofold variation from cell to cell recorded in Table 1 would re. quire the unlikely range of 20:1 or 200:1 in the ratio of mass per unit area of protein over chromosomes to that between chromo- somes. Furthermore, if protein contamination were the major source of variability it would have to be related to the effect of pretreat- ment in uncoiling the chromosomes. We consider contamination by cellular proteins to be a minor source of variability in the measurements reported here, but reserve final judgment until definitive tests are made.
13. Calculated from spectrophotometric measure. ments of a highly polymerized Drosophila melanogaster DNA preparation in dilute so- lution, courtesy of Miss E. Travaglini of The Institute for Cancer Research, Phila- delphia.
14. Integrated absorbance may be thought of as the product of the mean of the ab- sorbance (of a chromosome) and the area (of the chromosome); its units are therefore those of area, which we express in square microns, multiplied by the dimensionless units of absorbance. The quotient of an ob- served AT divided by the known absorp- tivity of an absorbing material, expressed in appropriate units, gives the mass of that absorbing material that would have the measured A . Thus, the AT for nucleus 17-4 in Table 2 (28.54 A2), divided by the specific absorptivity at 257 ma, for one pico- gram per square micron of DNA (2.6), gives a value of 10.9 pg for DNA in that nucleus.
15. J. N. Davidson, I. Leslie, J. C. White, Lancet 1951-1, 1387 (1951).
16. See, for example, H. Swift, Intern. Rev. Cytol. 2, 1 (1953).
17. Aided by grants from NIH, from NSF, and by a career research development award (to P.C.N.) from the Public Health Service. The assistance of Carolyn Gibson and James A. Benner, Jr., in the tedious densitometric procedure is gratefully acknowledged.
17 January 1964 I
males, was kindly provided by George Yerganian. By applying the breeding procedures recommended by him (3), the propagation of the animals was successful. Our colony now totals more than 200 animals.
The Rous virus was of the same strain (strain Schmidt-Ruppin) as that used in previous experiments with Syrian hamsters, rats, mice, guinea pigs, and rabbits (4).
Fifteen Chinese hamster babies, 1 or 2 days old, belonging to three litters were injected subcutaneously in the back with material either from a pool of homogenized chicken sarcoma stored at -65? to -68?C, or from a suspension of freshly prepared and finely minced chicken sarcoma.
After a period of 2 to 8 weeks, a hard lump or several small coalescing nodules appeared at the site of injec- tion in 11 of the animals. Most of the tumors grew rather slowly, grad- ually assuming, during the following months, the size of a hazelnut or wal- nut (Fig. 1). The underlying muscles were often invaded and the skin over the tumors sometimes became ulcer- ated. Often the tumors became softer during their growth. Two hamsters with tumors died 3 to 5 months after inocu- lation. Nine animals with tumors were killed at various intervals for histo- pathologic and chromosome study. Of the remaining four hamsters, one was eaten by the others and the remaining three did not show any tumor during an observation period of 6 months.
The tumors showed a moist, grayish- white, cut surface and sometimes a central softening or irregular grayish- red necrosis. Gross examination re- vealed pinhead-size metastases in the lungs of the two hamsters that died.
Microscopically the tumors showed the picture of a spindle-cell sarcoma (No. RCh H 4, Fig. 2a) or a poly- morphous sarcoma. Numerous mitoses were observed. One tumor was similar to a human giant-cell tumor in bone; another to a hemangiosarcoma with numerous, closely packed, thin-walled vascular spaces, surrounded by poly- nuclear giant cells (No. RCh H 2, Fig. 3a). In a third hamster the tumor tended to simulate a malignant angio- endothelioma.
One of the tumors was transplanted to the cheek pouches of two adult Chinese hamsters, one of which had been given 0.25 mg of hydrocortisone subcutaneously. Three weeks later a small tumor developed in the cortisone- treated animal but it soon regressed. The same tumor was also transplanted into the cheek pouches or into the legs of 14 Syrian hamsters (11 days old), some of which had been treated with hydrocortisone. Tumors developed in two of the cortisone-treated ani- mals, and in two of the untreated ani- mals. The tumors appeared about 11 days after the inoculation, grew very rapidly, but regressed spontaneously, disappearing after 2 more weeks. How- ever, material from still vital tumors was successfully transferred by inocula- tion to new Syrian hamsters and car-
After a period of 2 to 8 weeks, a hard lump or several small coalescing nodules appeared at the site of injec- tion in 11 of the animals. Most of the tumors grew rather slowly, grad- ually assuming, during the following months, the size of a hazelnut or wal- nut (Fig. 1). The underlying muscles were often invaded and the skin over the tumors sometimes became ulcer- ated. Often the tumors became softer during their growth. Two hamsters with tumors died 3 to 5 months after inocu- lation. Nine animals with tumors were killed at various intervals for histo- pathologic and chromosome study. Of the remaining four hamsters, one was eaten by the others and the remaining three did not show any tumor during an observation period of 6 months.
The tumors showed a moist, grayish- white, cut surface and sometimes a central softening or irregular grayish- red necrosis. Gross examination re- vealed pinhead-size metastases in the lungs of the two hamsters that died.
Microscopically the tumors showed the picture of a spindle-cell sarcoma (No. RCh H 4, Fig. 2a) or a poly- morphous sarcoma. Numerous mitoses were observed. One tumor was similar to a human giant-cell tumor in bone; another to a hemangiosarcoma with numerous, closely packed, thin-walled vascular spaces, surrounded by poly- nuclear giant cells (No. RCh H 2, Fig. 3a). In a third hamster the tumor tended to simulate a malignant angio- endothelioma.
One of the tumors was transplanted to the cheek pouches of two adult Chinese hamsters, one of which had been given 0.25 mg of hydrocortisone subcutaneously. Three weeks later a small tumor developed in the cortisone- treated animal but it soon regressed. The same tumor was also transplanted into the cheek pouches or into the legs of 14 Syrian hamsters (11 days old), some of which had been treated with hydrocortisone. Tumors developed in two of the cortisone-treated ani- mals, and in two of the untreated ani- mals. The tumors appeared about 11 days after the inoculation, grew very rapidly, but regressed spontaneously, disappearing after 2 more weeks. How- ever, material from still vital tumors was successfully transferred by inocula- tion to new Syrian hamsters and car- ried in series through four passages. The transplanted tumors had the char- acter of an anaplastic spindle-cell sar- coma with numerous mitoses. Several attempts were made to study the
SCIENCE, VOL. 144
ried in series through four passages. The transplanted tumors had the char- acter of an anaplastic spindle-cell sar- coma with numerous mitoses. Several attempts were made to study the
SCIENCE, VOL. 144
Rous Sarcoma in Chinese Hamsters
Abstract. A variant of the Rous sarcoma virus induced tumors in newborn Chinese hamsters within 2 to 8 weeks. The tumors grew progressively and some- times metastasized. They were successfully transplanted in series in Syrian ham- sters. The chromosomes of the tumors in the Chinese hamsters as well as of those transplanted into the Syrian hamsters were Chinese hamster chromosomes. Virus was demonstrated in the Chinese hamster tumors by injecting material from the tumors into chickens, where Rous sarcomas subsequently appeared.