dna fingerprinting bysampled sequencing - pnas bysampledsequencing ... dna segments that combines...
TRANSCRIPT

Proc. Natl. Acad. Sci. USAVol. 86, pp. 8902-8906, November 1989Genetics
DNA fingerprinting by sampled sequencing(ordered clone bank/fluorescent reporters/genome mapping/biotin)
SYDNEY BRENNER* AND KENNETH J. LIVAKtt*Medical Research Council Molecular Genetics Unit, Hills Road, Cambridge CB2 2QH, England; and tCentral Research & Development Department, E. 1. duPont de Nemours & Company, Experimental Station, P.O. Box 80328, Wilmington, DE 19880-0328
Contributed by Sydney Brenner, August 14, 1989
ABSTRACT We describe a method for characterizingDNA segments that combines limited sequencing with sizeseparation of restriction fragments. As part of a multistepprocedure, 5' overhangs of unknown sequence are generatedby cleavage with a class IIS restriction enzyme. After labelingof these ends by using dideoxynucleotides tagged with distinc-tive fluorescent dyes, the restriction fragments are analyzed bypolyacrylamide gel electrophoresis and detection of fluorescentemissions using a commercially available DNA sequencer. Thenucleotide-specific fluorescent signatures permit determinationof the terminal sequence for each labeled end. The set of labeledfragments, characterized by both size and terminal sequence,constitutes a fingerprint that can be used to compare DNAsegments for overlap or relatedness. The inclusion of terminalsequence data dramatically increases the information contentof the fingerprint, making comparisons more reliable andefficient than those based upon size alone.
An important approach to the physical mapping of complexgenomes involves ordering adjacent DNA fragments in aDNA clone collection. Methods based on restriction enzymeanalysis have been used to order large numbers of clonedDNA segments derived from Caenorhabditis elegans, yeast,and Escherichia coli (1-4). These methods, based on com-parisons of restriction fragment length and/or restriction siteorder, depend critically on the amount of information that canbe extracted from each clone to make a reliable assignmentof overlaps between clones. A qualitative view of the amountof information required to match two clones can be obtainedin the following way. Consider a bacterium with 4 million (=411) base pairs. On the average, an 11-base sequence occursuniquely in such a genome, and this means that an overlapcan be established between two pieces of DNA if they haveidentical undecanucleotides. An 11-base sequence (411) isequivalent to 22 bits (222) of information. By the same token,humans, with 416 base pairs of DNA, have 32-bit genomes.How can equivalent information be obtained from the anal-ysis of restriction fragments?
In the fingerprinting procedure of Coulson et al. (1), thebands were separated in sequencing gels which can accu-rately resolve 256 (= 28) oligonucleotides successively dif-fering by one nucleotide in length. It is irrelevant how thispattern is obtained; each band contributes 8 bits of informa-tion. Thus, a coincidence of three bands, which provides 24bits, will be necessary to establish overlap of clones from abacterial genome. For the human genome, at least four bandswould be required to provide the minimum of 32 bits. Noticethat increasing the resolution of a gel to fragment lengths of500 nucleotides adds only one additional bit of information toeach band. Agarose gel separations, used in restriction en-zyme mapping experiments, would require more bands sincethey have very much lower resolution, perhaps 5 or 6 bits per
band. Low information content per band requires sampling alarge fraction of the clone; this, in turn, restricts the subsetof a random library for which sufficient information canactually be obtained to establish overlaps. Therefore, manymore clones than expected need to be examined to populatethis subset (5). Awkward distributions of restriction enzymesites used to analyze the DNA make matters worse andfurther restrict the subset of clones that can be overlapped.Thus, the best way to improve this method would be toincrease the amount of information obtained from each clone.Here we describe a fluorescent fingerprinting procedure thatcouples band separation with sampled nucleotide sequenc-ing, adding this information to the length information usedpreviously.
MATERIALS AND METHODSDirect Fingerprinting Procedure. Primary cleavage was
performed by incubating 1 ,gg of4X174 replicative form DNA(New England Biolabs) with Fok I (New England Biolabs) inthe supplier's recommended buffer. After precipitation withethanol from 2.5 M ammonium acetate, the DNA was dis-solved in 9 Aul of 10 mM Tris-HCl, pH 8.0/1 mM EDTA.Nucleotide-specific labeling of the Fok I ends was achievedby adding 4 tul of 5x reverse transcriptase buffer (250 mMTris HCl, p118.3/150 mM KCl/40 mM MgCl2/5 mM dithio-threitol), 2 tkl of a solution containing dNTPs at 5 ,tM each,4 ,tl of a solution containing a mixture of succinylfluorescein-labeled 2',3'-dideoxynucleoside triphosphates (SF-ddNTPs)(6), and 1 gl (4.5 units) of avian myeloblastosis virus reversetranscriptase (New England Nuclear). The SF-ddNTP solu-tion contained 2.5 tLM SF-505-ddGTP, 31.25 tLM SF-512-ddATP, 7.5 ,uM SF-519-ddCTP, and 31.25 tuM SF-526-ddTTP (numbers indicate various fluorescein deriva-tives). The SF-ddNTPs were obtained from New EnglandNuclear as 125 /iM stocks and diluted in 10 mM Tris1HCl, pH8.0/1 mM EDTA. The labeling reaction mixture was incu-bated at 420C for 10 min. The DNA was recovered byprecipitation with ethanol, dissolved in 16 41 of 10 mMTris-HCI, pH 7.4/1 mM EDTA, and incubated at 680C for 10min. Secondary cleavage was performed by incubating thesample with Hinfl (Pharmacia) in the supplier's recom-mended buffer. The sample was passed over a spun SephadexG-50 column (5 Prime -- 3 Prime, West Chester, PA) that hadbeen rinsed with water. The eluate from the column was driedunder reduced pressure in a Speed-Vac concentrator (SavantInstruments). The residue was suspended in 10 ttl of 95%(vol/vol) formamide/12.5 mM EDTA, incubated in a boilingwater bath for 5 min, and cooled on ice. One microliter of thissample was loaded on a denaturing polyacrylamide gel con-sisting of 6% acrylamide/bisacrylamide (19:1, wt/wt); 8 Murea in electrophoresis buffer (10x buffer: 162 g of Tris base,27.5 g of boric acid, and 9.3 g of Na2EDTA 2H2O dissolved
Abbreviation: SF-ddNTPs, succinylfluorescein-labeled 2'.3'-dideoxynucleoside triphosphates.tTo whom reprint requests should be addressed.
8902
The publication costs of this article were defrayed in part by page chargepayment. This article must therefore be hereby marked "advertisement"in accordance with 18 U.S.C. §1734 solely to indicate this fact.

Proc. Natl. Acad. Sci. USA 86 (1989) 8903
in H20 to a total volume of 1 liter). The gel was electropho-resed and analyzed for fluorescent emissions by using theGenesis 2000 DNA analysis system (DuPont), following themanufacturer's instructions.Capture Fingerprinting Procedure. Primary cleavage and
attachment of biotin were performed simultaneously by in-cubating each DNA sample in a 40-gl reaction mixturecontaining 25 mM Tris-HCI, pH 7.8; 50 mM NaCI; 10 mMMgCl2; 1 mM dithiothreitol; bovine serum albumin at 100,ug/ml; 5 ,uM dATP; 5 ,uM dGTP; 0.5 AM biotin-11-dUTP(Enzo); 0.5 A.M biotin-11-dCTP (Enzo); 1 unit of avianmyeloblastosis virus reverse transcriptase; and the desiredrestriction enzyme or enzymes. The reaction mixture wasincubated at 370C for 2 hr. After precipitation with ethanolfrom 2.5 M ammonium acetate, the DNA was dissolved in 16Aul of 10 mM Tris HCI, pH 8.0/1 mM EDTA. After incubationat 680C for 10 min, secondary cleavage was performed byincubating with Fok I in the recommended buffer at 370C for3 hr. After the addition of 50 ,ul of 0.15 M NaCI/0.015 Msodium citrate/0.1% sodium dodecyl sulfate, the sample waspassed over a spun Sephadex G-50 column (Select-B columnsfor biotinylated DNA from 5 Prime -+3 Prime). To attach anybiotinylated DNA fragments to a solid support, the followingwere added to the column eluate: 75 p.l of Triton wash (0.17%Triton X-100/100 mM NaCI/10 mM Tris HCI, pH 7.5/1 mMEDTA) and 10 Al of a 0.4% suspension of streptavidin-CrO2particles. These particles are CrO2 particles that have beencoated with silica, treated with y-aminopropyltriethoxysi-lane, and had streptavidin attached by glutaraldehyde cross-linking (7). The streptavidin-CrO2 particles were washedthree times in Triton wash just prior to use. The sample wasincubated at 37°C for 30 min with occasional agitation. Thesample tube was placed in a magnetic rack (Magic separator,Coming), causing the particles to become immobilized alongthe side of the tube. The liquid was removed by using apipettor, the tube was removed from the rack, and theparticles were resuspended in 100 p.l of Triton wash. Thiswashing procedure was repeated two more times. After thefinal wash, the particles were resuspended in 9 p.l of 10 mMTris HCI, pH 8.0/1 mM EDTA. Fluorescence labeling of theFok I ends was performed as described for direct fingerprint-ing. The particles were washed three times with 100 p.1 ofTriton wash, using the magnetic rack as above. After the finalwash, the particles were resuspended in 5 pl of 95% form-amide/12.5 mM EDTA, incubated in a boiling water bath for5 min, and placed in the magnetic rack. The liquid containingthe eluted DNA strands was transferred to a fresh tube. Twomicroliters of the sample was loaded on a denaturing poly-acrylamide gel, electrophoresed, and analyzed as describedfor direct fingerprinting.
RESULTSCritical Reagents. This fingerprinting method takes advan-
tage of the four fluorescent dideoxynucleotides (SF-ddNTPs)developed for automated DNA sequencing (6). Because eachnucleotide is labeled with a slightly different succinylfluo-rescein dye, these molecules are nucleotide-specific report-ers that permit sequence information to be determined di-rectly from fluorescent emissions. The SF-ddNTPs are ac-cepted by a number of DNA polymerases, making it easy toattach these nucleotide-specific reporters to the 3' ends ofDNA fragments.The other critical reagent is a type of restriction enzyme
that leaves a 5' overhang where the sequence of the 5'overhang is not unique and can consist of several differentnucleotide combinations. Examples of these "5'-ambiguousend" restriction enzymes are shown in Fig. 1. The mostimportant enzymes, exemplified by Fok I, are class IISrestriction enzymes that leave 5' overhangs. Class IIS re-
FokI
TthlI11
AccI
-GGATGNNNNNNNNN NNNNNNNN--CCTACNNNNNNNNNNNNN NNNN-
-GACN NNGTC--CTGNN NCAG-
AT-GT CGAC-CATA TG-
GC
FIG. 1. Examples of 5'-ambiguous end restriction enzymes.
striction enzymes do not cleave within the recognition se-quence, but at a precisely defined distance away from it (11).Other enzymes that could be used are those like TthlllI thathave a split recognition sequence and cleave in the middle toleave an ambiguous 5' overhang or those like Acc I that haveambiguity within the recognition sequence.
Direct Fingerprinting. A simple protocol for fingerprintingby sampled sequencing is outlined in Fig. 2. It is basically anextension of the method of Coulson et al. (1). In the primarycleavage step, each DNA sample is cleaved with a 5'-ambiguous end restriction enzyme. In the labeling step, aDNA polymerase is used to attach SF-ddNTPs complemen-tary to the bases in the 5' overhangs. If SF-ddNTPs are usedalone, then only one fluorescent nucleotide will be added perend. The addition of unlabeled deoxynucleoside triphos-phates (dNTPs) at the proper concentrations will allow theappropriate level of incorporation offluorescent label at eachof the positions of the overhang. Then, in the secondarycleavage step, the fluorescently labeled fragments are di-gested with a restriction enzyme or enzymes that are differentfrom the enzyme used initially. This secondary cleavageserves several purposes. The first step labels both strands ofeach DNA fragment, which would prevent the determinationof the sequence at either end. Secondary cleavage generatesshorter fragments so that, in general, each labeled end is ona separate fragment of distinct size. Furthermore, the shorterfragments can be separated by procedures with single-baseresolution, such as electrophoresis through denaturing poly-acrylamide gels.The DNA fragments are analyzed by electrophoresis
through a denaturing polyacrylamide gel and the nucleotide-specific fluorescent dyes are discriminated using DuPont'sGenesis 2000 system (6). With this system, the time taken fora labeled fragment to reach the detection zone is a measureof the mobility of that fragment through the gel. By compar-ing this with the mobility of known size standards, the size ofeach labeled fragment can be determined. Within the detec-tion zone, the DNA fragments are irradiated by a laser beam
Primary cleavage to giveambiguous overhangs
Label with fluorescentnucleotide-specific
terminators
Secondary cleavage
NNNN~~~NN
NNNNN NNNN
A~~~~~~~~~I-f:
N N -
_NNNNN:
Electrophoresis and detection
FIG. 2. Direct sampled sequence fingerprinting procedure. TheNs indicate the four-base 5' overhangs generated by cleavage withFok 1.
Genetics: Brenner and Livak

8904 Genetics: Brenner and Livak
and excitation/emission of the fluorescent dyes occurs as thefragments move through the zone. By using appropriatefilters and a dual-detector system, each of the four fluores-cence-labeled dideoxynucleotides can be identified on thebasis of its distinctive emission spectrum. This informationidentifies the terminal sequence for each of the labeledfragments detected.The feasibility of this simple labeling scheme was initially
demonstrated by analyzing 4X174 replicative form DNA.Fok I was used for primary cleavage and the ends werelabeled by using reverse transcriptase to fill in the 5' over-hangs with a mixture of SF-ddNTPs and unlabeled dNTPs.After secondary cleavage with Hinfl, the labeled fragmentswere analyzed on the Genesis 2000. Representative resultsare shown in Fig. 3. Quartets of labeled fragments, with aspacing of one nucleotide within each quartet, are observedbecause Fok I leaves four-base 5' overhangs. All of thelabeled fragments expected on the basis of the known se-quence of OX174 DNA were found. Where these labeledfragments did not overlap one another, the four-base terminalsequence could be determined. In each case, the terminalsequence was as predicted from the 4X174 sequence.Capture Fingerprinting. One limitation of the direct finger-
printing procedure outlined in Fig. 2 is that a 5'-ambiguousend restriction enzyme was used in the primary cleavagestep. For a large DNA, there would be too many such sitesand this would give a fingerprint in which sequence deter-mination would be impossible. Optimally, a fingerprintshould not have more than about 15 quartets, to avoid thisproblem. The versatility of sampled sequence fingerprintinghas been greatly enhanced by the development of the pro-cedure outlined in Fig. 4. In this fingerprinting procedure,any restriction enzyme or other method of specific cleavageis used in the primary cleavage step. Then, biotin is attachedto each primary cleavage end either by using a DNA poly-merase to fill in 5' overhangs with biotinylated nucleotides orby using terminal transferase to add biotinylated nucleotidesto blunt or 3'-overhang ends. Secondary cleavage is per-formed by using a 5'-ambiguous end restriction enzyme suchas Fok I. Next, the DNA fragments are incubated with avidinor streptavidin immobilized on a solid support. DNA frag-ments with at least one biotinylated primary cleavage endbind to the immobilized avidin or streptavidin and all otherfragments are washed away. The bound fragments are then
36 69 78 92
_.~~~~ ~ ~~~~~~~~~~~~~~~..._.-._..
125 149 162
A
192 203 219
PrimIar-V cleavaa e
Attach biotin to ends
Secondarycleavalc to liCeambiQUOuIS OVCrHancS
A\ttach to
streptavidlin-CrO, beadis
Label With fluoLrO-eSCelltno i clot ide -Sp)eC i fic
termli na;tor1s
Elute labeled strandsand electroplhorese
N-NNN' - NAAN-
';N N S~NN\
10 "
.NNN
C;:
FIG. 4. Capture procedure for sampled sequence fingerprinting.
incubated with reverse transcriptase and SF-ddNTPs (with orwithout unlabeled dNTPs) to label the 5'-ambiguous endsgenerated by the secondary cleavage. Because the biotiny-lated nucleotides are added to the 3' strand of the primarycleavage ends and the SF-ddNTPs are added to the 3' strandof the secondary cleavage ends, the biotin and fluorescencelabel are on opposite strands for each labeled fragment. Thus,the strands labeled with fluorescence are eluted from thesolid support by treatment with a denaturant such as form-amide. The eluted labeled strands are then analyzed on theGenesis 2000 as before.
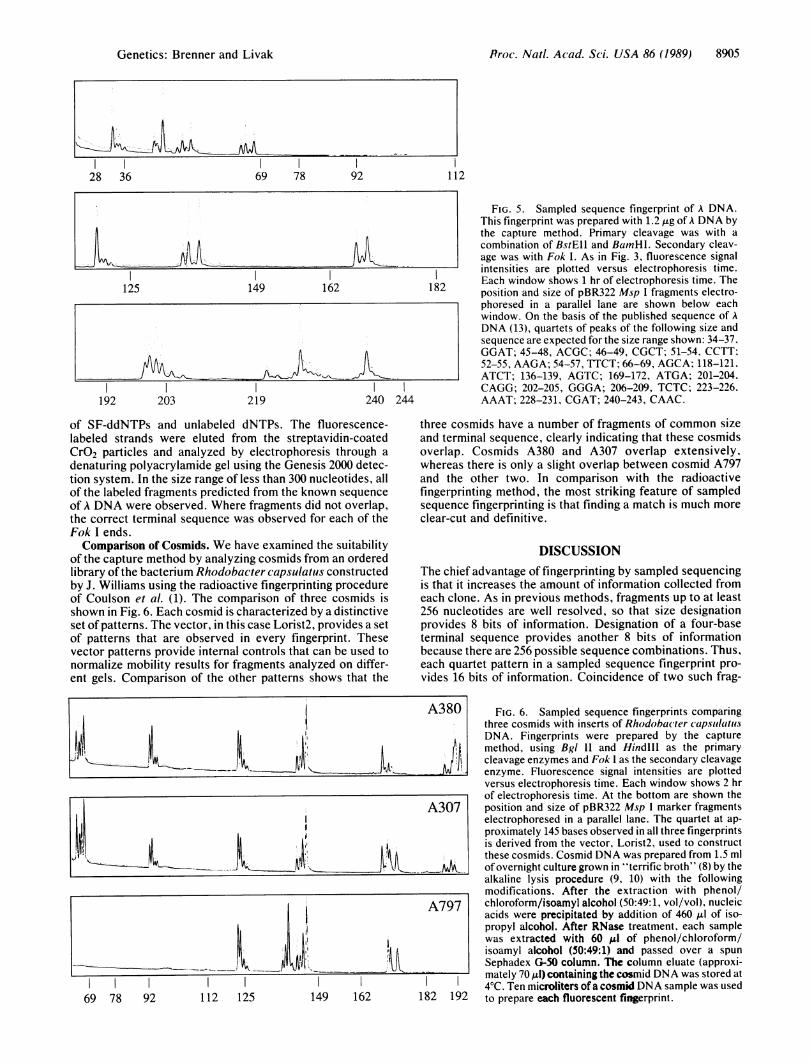
Fig. 5 shows representative results when this procedurewas used to analyze phage A DNA. Primary cleavage wasaccomplished by digestion with both BstEII and Bgl II. Biotinwas attached to the BstEII and Bgl II ends by using bioti-nylated nucleotides as substrates for a polymerase fill-inreaction. After secondary cleavage with Fok I, fragmentshaving a biotinylated BstEII or Bgl II end were bound tostreptavidin cross-linked to CrO2 particles. Any Fok I ends ofthe bound fragments were labeled with fluorescence by usingreverse transcriptase to fill in the 5' overhangs with a mixture
112 FIG. 3. Sampled sequence fingerprint of kX174replicative form DNA. The ordinate represents fluo-rescence signal intensity as measured by the two pho-tomultipliers (distinguished by solid and dotted lines) ofthe Genesis 2000. The abscissa represents electropho-retic migration time. The windows read from left toright and top to bottom, with each window showing 1hr of electrophoresis time. Below each window isshown the position and size, in nucleotides, of marker
182 DNA fragments electrophoresed in a parallel lane. Themarker DNA was a pBR322 Msp I digest (New EnglandBiolabs) that had been labeled by filling in the ends withdCTP and SF-505-ddGTP. On the basis of the pub-lished sequence of 4X174 DNA (12), quartets of peaksof the following size and sequence are expected for thesize range shown: 38-41, GGCT; 38-41, ACAA; 45-48, AGCC; 91-94, CCAC; 113-116, CTGG; 131-134,
_ AATG; 159-162, GTGG; 159-162, ACCG; 199-202,CATT; 199-202, GATT; 225-228, AATC; 243-246,
244 TGCT.
IA
Proc. Natl. Acad. Sci. USA 86 (1989)
240
Proc. Natl. Acad. Sci. USA 86 (1989) 8905
28 36 69 78 92 112
125 149 162 182
192 203 219 240 244
of SF-ddNTPs and unlabeled dNTPs. The fluorescence-labeled strands were eluted from the streptavidin-coatedCrO2 particles and analyzed by electrophoresis through a
denaturing polyacrylamide gel using the Genesis 2000 detec-tion system. In the size range of less than 300 nucleotides, allof the labeled fragments predicted from the known sequenceof A DNA were observed. Where fragments did not overlap,the correct terminal sequence was observed for each of theFok I ends.Comparison of Cosmids. We have examined the suitability
of the capture method by analyzing cosmids from an orderedlibrary of the bacterium Rhodobacter capsulatus constructedby J. Williams using the radioactive fingerprinting procedureof Coulson et al. (1). The comparison of three cosmids isshown in Fig. 6. Each cosmid is characterized by a distinctiveset of patterns. The vector, in this case Lorist2, provides a setof patterns that are observed in every fingerprint. Thesevector patterns provide internal controls that can be used tonormalize mobility results for fragments analyzed on differ-ent gels. Comparison of the other patterns shows that the
69 78 92 112 1251
149 162
FIG. 5. Sampled sequence fingerprint of A DNA.This fingerprint was prepared with 1.2 jig of A DNA bythe capture method. Primary cleavage was with a
combination of BstE1I and BacmHI. Secondary cleav-age was with Fok 1. As in Fig. 3, fluorescence signalintensities are plotted versus electrophoresis time.Each window shows 1 hr of electrophoresis time. Theposition and size of pBR322 Msp I fragments electro-phoresed in a parallel lane are shown below eachwindow. On the basis of the published sequence of ADNA (13), quartets of peaks of the following size andsequence are expected for the size range shown: 34-37.GGAT; 45-48, ACGC; 46-49, CGCT; 51-54, CCTT;52-55, AAGA; 54-57, TTCT; 66-69, AGCA; 118-121.ATCT; 136-139, AGTC; 169-172, ATGA; 201-204.CAGG; 202-205, GGGA; 206-209, TCTC; 223-226.AAAT; 228-231, CGAT; 240-243, CAAC.
three cosmids have a number of fragments of common sizeand terminal sequence, clearly indicating that these cosmidsoverlap. Cosmids A380 and A307 overlap extensively,whereas there is only a slight overlap between cosmid A797and the other two. In comparison with the radioactivefingerprinting method, the most striking feature of sampledsequence fingerprinting is that finding a match is much more
clear-cut and definitive.
DISCUSSIONThe chief advantage of fingerprinting by sampled sequencingis that it increases the amount of information collected fromeach clone. As in previous methods, fragments up to at least256 nucleotides are well resolved, so that size designationprovides 8 bits of information. Designation of a four-baseterminal sequence provides another 8 bits of informationbecause there are 256 possible sequence combinations. Thus,each quartet pattern in a sampled sequence fingerprint pro-vides 16 bits of information. Coincidence of two such frag-
A380 FIG. 6. Sampled sequence fingerprints comparing
three cosmids with inserts of Rhodobacter capsulaitusDNA. Fingerprints were prepared by the capturemethod, using BgI and Hindill as the primarycleavage enzymes and Fok I as the secondary cleavage
enzyme. Fluorescence signal intensities are plottedversus electrophoresis time. Each window shows 2 hrof electrophoresis time. At the bottom are shown the
A307 position and size of pBR322 Msp I marker fragments
electrophoresed in a parallel lane. The quartet at ap-proximately 145 bases observed in all three fingerprintsis derived from the vector, Lorist2, used to constructthese cosmids. Cosmid DNA was prepared from 1.5 ml
.._AAPA> of overnight culture grown in "terrific broth" (8) by thealkaline lysis procedure (9, 10) with the followingmodifications. After the extraction with phenol/
A797 chloroform/isoamyl alcohol (50:49:1, vol/vol), nucleic
acids were precipitated by addition of 460 Al of iso-propyl alcohol. After RNase treatment, each samplewas extracted with 60 Al of phenol/chloroform/isoamyl alcohol (50:49:1) and passed over a spunSephadex G-50 column. The column eluate (approxi-mately 70,l) containing the cosmid DNA was stored at4TC. Ten microliters ofa cosmid DNA sample was used
182 192 to prepare each fluorescent fingerprint.
II :1I'I
k.j
I11,
Iil
'--^
Genetics: Brenner and Livak
Proc. Natl. Acad. Sci. USA 86 (1989)
-PRV-Bartha
PRV-Becker
66 79 84 118 136 164 185 201
E. coli
K-~~~~AJ ~~~~~j A ~~~~~~)
3 3362 378 415 498
ments would certainly establish overlap between fragmentsfrom a bacterial genome and be indicative for human genomeclones.We have noticed that each particular quartet has a distinc-
tive and reproducible pattern of relative peak heights andspacing. This is likely to be an effect of the adjacent sequenceon the efficiency of incorporation of the terminators and onthe mobility of fragments in the gel. Because of these contextinfluences, the exact pattern actually contributes more in-formation than the tetranucleotide sequence itself.Sampled sequence fingerprinting shares many advantages
with the fluorescence-based fingerprinting method of Car-rano et al. (14). In both methods, DNA fragments aredetected at a fixed distance from the origin, leading to moreuniform spacing between fragments than with conventionaldetection. Improved resolution is also realized because thefragments are detected by fluorescence rather than radioac-tivity. Both methods use automated data collection, whichfacilitates rapid and error-free data analysis and storage.However, the Carrano et al. method relies solely on size tocharacterize DNA fragments and thus suffers from limitedinformation content. Carrano et al. can increase the infor-mation content per sample by running up to four separatedigests in one lane. By including terminal sequence, ourmethod of sampled sequence fingerprinting has a muchgreater information content per fingerprint with only a singlefingerprint loaded per lane.Another advantage of sampled sequence fingerprinting is
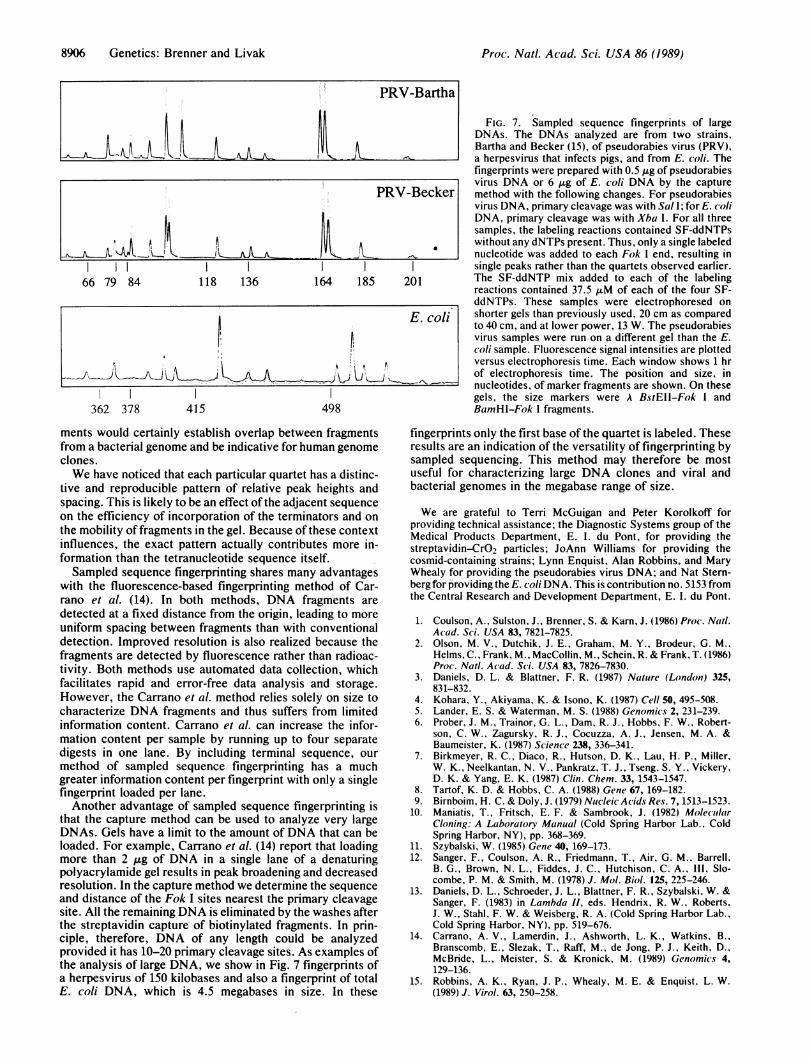
that the capture method can be used to analyze very largeDNAs. Gels have a limit to the amount of DNA that can beloaded. For example, Carrano et al. (14) report that loadingmore than 2 Ag of DNA in a single lane of a denaturingpolyacrylamide gel results in peak broadening and decreasedresolution. In the capture method we determine the sequenceand distance of the Fok I sites nearest the primary cleavagesite. All the remaining DNA is eliminated by the washes afterthe streptavidin capture of biotinylated fragments. In prin-ciple, therefore, DNA of any length could be analyzedprovided it has 10-20 primary cleavage sites. As examples ofthe analysis of large DNA, we show in Fig. 7 fingerprints ofa herpesvirus of 150 kilobases and also a fingerprint of totalE. coli DNA, which is 4.5 megabases in size. In these
FIG. 7. Sampled sequence fingerprints of largeDNAs. The DNAs analyzed are from two strains,Bartha and Becker (15), of pseudorabies virus (PRV),a herpesvirus that infects pigs, and from E. coli. Thefingerprints were prepared with 0.5 ,ug of pseudorabiesvirus DNA or 6 ,ug of E. coli DNA by the capturemethod with the following changes. For pseudorabiesvirus DNA, primary cleavage was with Sal I; for E. coliDNA, primary cleavage was with Xba I. For all threesamples, the labeling reactions contained SF-ddNTPswithout any dNTPs present. Thus, only a single labelednucleotide was added to each Fok I end, resulting insingle peaks rather than the quartets observed earlier.The SF-ddNTP mix added to each of the labelingreactions contained 37.5 AuM of each of the four SF-ddNTPs. These samples were electrophoresed onshorter gels than previously used, 20 cm as comparedto 40 cm, and at lower power, 13 W. The pseudorabiesvirus samples were run on a different gel than the E.coli sample. Fluorescence signal intensities are plottedversus electrophoresis time. Each window shows 1 hrof electrophoresis time. The position and size, innucleotides, of marker fragments are shown. On thesegels, the size markers were A BstEII-Fok I andBamHI-Fok I fragments.
fingerprints only the first base of the quartet is labeled. Theseresults are an indication of the versatility of fingerprinting bysampled sequencing. This method may therefore be mostuseful for characterizing large DNA clones and viral andbacterial genomes in the megabase range of size.
We are grateful to Terri McGuigan and Peter Korolkoff forproviding technical assistance; the Diagnostic Systems group of theMedical Products Department, E. l. du Pont, for providing thestreptavidin-CrO2 particles; JoAnn Williams for providing thecosmid-containing strains; Lynn Enquist, Alan Robbins, and MaryWhealy for providing the pseudorabies virus DNA; and Nat Stem-bergfor providing the E. coli DNA. This is contribution no. 5153 fromthe Central Research and Development Department, E. 1. du Pont.
1. Coulson, A., Sulston, J., Brenner, S. & Karn, J. (1986) Proc. Natl.Acad. Sci. USA 83, 7821-7825.
2. Olson, M. V., Dutchik, J. E., Graham, M. Y., Brodeur, G. M.,Helms, C., Frank, M., MacCollin, M., Schein, R. & Frank, T. (1986)Proc. Natl. Acad. Sci. USA 83, 7826-7830.
3. Daniels, D. L. & Blattner, F. R. (1987) Nature (London) 325,831-832.
4. Kohara, Y., Akiyama, K. & Isono, K. (1987) Cell 50, 495-508.5. Lander, E. S. & Waterman, M. S. (1988) Genomics 2, 231-239.6. Prober, J. M., Trainor, G. L., Dam, R. J., Hobbs, F. W., Robert-
son, C. W., Zagursky, R. J., Cocuzza, A. J., Jensen, M. A. &Baumeister, K. (1987) Science 238, 336-341.
7. Birkmeyer, R. C., Diaco, R., Hutson, D. K., Lau, H. P., Miller,W. K., Neelkantan, N. V., Pankratz, T. J., Tseng, S. Y., Vickery,D. K. & Yang, E. K. (1987) Clin. Chem. 33, 1543-1547.
8. Tartof, K. D. & Hobbs, C. A. (1988) Gene 67, 169-182.9. Birnboim, H. C. & Doly, J. (1979) Nucleic Acids Res. 7, 1513-1523.
10. Maniatis, T., Fritsch, E. F. & Sambrook, J. (1982) MolecularCloning: A Laboratory Manual (Cold Spring Harbor Lab., ColdSpring Harbor, NY), pp. 368-369.
11. Szybalski, W. (1985) Gene 40, 169-173.12. Sanger, F., Coulson, A. R., Friedmann, T., Air, G. M., Barrell.
B. G., Brown, N. L., Fiddes, J. C., Hutchison, C. A., 111, Slo-combe, P. M. & Smith, M. (1978) J. Mol. Biol. 125, 225-246.
13. Daniels, D. L., Schroeder, J. L., Blattner, F. R., Szybalski, W. &Sanger, F. (1983) in Lambda 11, eds. Hendrix, R. W., Roberts,J. W., Stahl, F. W. & Weisberg, R. A. (Cold Spring Harbor Lab..Cold Spring Harbor, NY), pp. 519-676.
14. Carrano, A. V., Lamerdin, J., Ashworth, L. K., Watkins, B.,Branscomb, E., Slezak, T., Raff, M., de Jong, P. J., Keith, D.,McBride, L., Meister, S. & Kronick, M. (1989) Genomics 4,129-136.
15. Robbins, A. K., Ryan, J. P., Whealy, M. E. & Enquist, L. W.(1989) J. Virol. 63, 250-258.
8906 Genetics: Brenner and Livak