do foreign firms really pay higher wages? evidence from
TRANSCRIPT
Do Foreign Firms Really Pay Higher Wages?
Evidence from Different Estimators*
Pedro S. Martins#
Queen Mary, University of London IZA, Bonn
First version: 30 June 2003
This version: 28 March 2006 Abstract: We contribute to the literature on Foreign Direct Investment and labour markets by examining wage differentials between domestic and foreign firms, drawing on a large Portuguese matched employer-employee panel. Using OLS, the foreign-firm premium is large and significantly positive but falls substantially when firm and worker controls are added. Moreover, the premium also does not vary monotonically with foreign control, it increases along the wage distribution and it is generally insignificant when using propensity score matching. Finally, using differences-in-differences, we find lower wage growth for workers in domestic firms that are acquired by foreign investors, a result that holds when combining differences-in-differences and propensity score matching. Overall, our evidence suggests that the commonly-documented OLS premium cannot be interpreted as a causal impact. JEL codes: C23, F23, J31. Keywords: FDI, Wages, Matched Employer-Employee Data, Propensity Score Matching, Portugal.
* I thank, without implicating, Arnaud Chevalier, José Ferreira Machado, Sourafel Girma, Francis Kramarz, Diogo Lucena, Robin Naylor, Pedro Portugal, Ian Walker and conference/seminar participants at HWWA (Hamburg), GEP (Nottingham), Banco de Portugal (Lisbon), EEA (Madrid), EALE (Lisbon) and the London School of Economics for useful comments and suggestions. Financial support from Fundação para a Ciência e a Tecnologia (POCTI/ECO/33089/99, SFRH/BD/934/2000) and logistical support from Banco de Portugal and ETLA (Helsinki) are gratefully acknowledged. The data used in this paper are confidential but the author’s access is not exclusive. For further information concerning the data, please contact Ministério da Segurança Social, Rua Rodrigo da Fonseca, 55, 1250-190 Lisboa, Portugal. # Email: [email protected]. Web: www.qmul.ac.uk/~bsw019. Address: School of Business and Management, Queen Mary, University of London, Mile End Road, London E1 4NS, UK. Phone: +44 (0) 2078827472. Fax: +44 (0) 2078823615.
2
1. Introduction Globalisation, or increasing international economic integration, is arguably one of the main forces that have shaped the world since the second half of the 20th century. The increasing ubiquity of the many symptoms of globalisation, in particular the large trade, investment and worker flows, has therefore led to substantial interest in the economic impacts of these changes. One specific aspect of the role of globalisation that has sparked controversy is the impact of foreign firms on wages. On the one hand, many individuals and organisations, mostly outside academia, claim that multinational firms pay lower wages, especially in developing countries. That perception is then presented as a key motivation for their opposition to globalisation. On the other hand, the view within academia is precisely the opposite of what is asserted by the opponents to globalisation: as discussed below, an overwhelming majority of studies finds that foreign-owned firms pay higher wages to equivalent workers than the domestic firms. This is a debate of great importance also for policy-makers across the world, who have in many cases invested sizeable public funds in order to attract foreign multinationals to their economies, arguing that the presence of these firms could be an important source of increased prosperity. One channel of such presumed impacts includes the employment created by foreign firms, but also the higher wages they are perceived to pay, at least when one takes into account the academic research.1 In this context, it is also important to clarify whether foreign direct investment does indeed lead to the creation of high-wage firms. A third motivation point concerns the debate about the relative importance of international trade and technology in explaining the increasing wage inequality observed in some countries since the 1980’s, in particular the U.S. and the U.K. (Feenstra and Hanson, 1999). Regardless of whether one considers FDI by itself or as component of trade, it is also important in this literature to assess whether increasing FDI flows can explain higher wage inequality in host countries. Of course, this would be the case if similar workers are paid different wages depending on the nationality of their firms, a result that would explain at least part of the observed increase of within or residual inequality. In this context, this paper aims at examining the robustness of the wage premium attributed to foreign firms by previous research. In particular, we try to assess whether that premium can be understood in terms of a causal impact of the firms’ ownership type (domestic or foreign) on wages. This causal impact is, in our view, the parameter of interest should one want to understand the consequences of this aspect of globalisation (its link with wages), rather than simply to describe a statistical stylised fact. Our methodology involves studying differences in pay between workers in foreign and domestic firms using different econometric methods, each of them drawing on different assumptions and focusing on different aspects of the wage determination process. Such variety of methods is facilitated by our use of a large matched employer-employee panel data set, covering a total of more than five million workers-year in the Portuguese labour market over the 1991-99 period. Portugal is also an interesting case study, as it has received large inflows of Foreign Direct Investment, particularly since European Union accession in 1986. Moreover, wages in Portugal
1 Another channel concerns the possible (productivity) spillovers to domestic firms. In this case, recent literature surveys (see Görg and Greenaway, 2004) find, at best, mixed effects.
3
have been the lowest in the European Union up to the 2004 enlargement, a fact that may possibly make it more likely to observe higher wages in foreign-owned firms. As to our results, when using standard (OLS) methods we find that foreign firms pay higher wages. However, this result does not hold with different econometric methods. For instance, we do not observe a higher wage premium for firms that exhibit a stronger degree of control by foreign parties. More importantly, the result of a significantly positive wage premium is not obtained when workers in domestic and foreign firms are matched by their propensity scores. The same occurs when we look at the same set of workers before and after their initially-domestic-owned firms are acquired by foreign investors and compare that set of workers with another set of workers whose firms remain either domestic- or foreign-owned. Overall, we interpret our results as indicating that, unlike previously assumed in the literature, there is not a causal effect of foreign ownership on wages. The structure of the paper is as follows. Section 2 briefly surveys some of the key contributions concerning the foreign-firm wage premium and critically evaluates their possible theoretical underpinnings. Section 3 presents the data set used and some descriptive statistics. Section 4 presents the results, obtained under different estimators. Finally, Section 5 concludes. 2. Literature and Theory As mentioned in the introduction, the empirical literature that examines the impact of foreign firms on host-country labour markets typically finds that such firms pay higher wages. Below we briefly summarise some of the main contributions. In an important study, Aitken et al. (1996) use establishment level cross-sections for Mexico, the US and Venezuela and find evidence of higher wages in foreign firms in the three countries covered. Using OLS, the premium ranges between 38% in Mexico and 12% in the US, across different specifications. Feliciano and Lipsey (1999) focus on the US case using industry-state-ownership cell averages and again find evidence of a positive wage differential. This differential however disappears (although only for the manufacturing sector) when controls for firm characteristics are added. Griffith and Simpson (2003) present estimates for the U.K., finding in all specifications positive premia for foreign firms. In research that focuses only on developing countries, Lipsey and Sjoholm (2001) study the Indonesian case and find a premium of 12% for blue-collar workers and 22% for white-collar workers. The results are obtained by drawing on a 1996 cross-section of plants and regressing average wages on plant characteristics, including their domestic or foreign ownership type. Velde and Morrissey (2003) examine the cases of five African countries (Cameroon, Ghana, Kenya, Zambia and Zimbabwe) and again find that foreign firms pay higher wages (the premia range between 8% and 23% across the countries). Similar results are also documented for Ghana by Görg et al. (2002).2
2 Another strand in this literature adopts a difference-in-differences approach at the wage differences following the acquisition of domestic firms by foreign investors. These studies, which also generally conclude that wages increase in firms that undergo acquisition, are examined in Section 4.5. A different strand, not directly related to our topic in this paper, looks at wage spillovers from foreign to domestic firms: see Aitken et al (1996) and Feenstra and Hanson (1997).
4
From this brief survey, one concludes that there is a great degree of agreement in the empirical research about the wage practices of foreign firms in host labour markets: foreign firms pay higher wages to equivalent workers. One also notices that most papers draw on similar research methodologies, namely by applying OLS to firm-level data. However, it is well known that a causal interpretation of these findings under OLS requires the (strong) assumption of orthogonality of firm ownership with respect to the error term. Moreover, domestic and foreign firms typically display very different (observable) characteristics. For instance, it is not uncommon that the average size (number of workers) of foreign firms is at least five times that of the average size of domestic firms. To this extent, given the lack of a common support for each type of firms, the quality of like-for-like comparisons produced by OLS may be poor, leading to biases. These hypotheses (about orthogonality and the quality of comparisons) are explored in greater detail in Section 4. Before that, we present and critically evaluate some theoretical views that have been put forward to explain the stylised fact that foreign firms pay higher wages. From our reading of the literature, we consider the following four possible views: increased labour demand, rent sharing, compensating differentials, and unobservable heterogeneity. The first explanation is that foreign firms, as they enter the domestic country, may increase labour demand. This will necessarily occur in the case of greenfield investments. It may also possibly occur in the case of acquisitions – the most predominant method of entry for foreign firms in developed countries – if, for instance, (foreign) multinationals3 decide to expand production in the host country beyond the previous output level of the acquired firm and that implies hiring additional workers. Moreover, should the labour supply curve be positively sloped, then wages for the marginal workers hired by multinationals will be higher than those of infra-marginal workers. One concern with this and other similar views is that the nationality of the firm per se would not be expected to matter, in the sense of being a key determinant in the increase of labour demand: the same increase would also apply to domestic firms that entered the market or increased their workforce. Moreover, it is important to stress that the higher wages paid by foreign firms would critically depend on the labour market not being sufficiently competitive. Otherwise, the wage differentials would not be sustained for long as the rents of workers in (new and/or expanding) foreign firms would be competed away via worker mobility from domestic firms. If, on the other hand, labour markets are competitive, such wage differentials would probably not even arise in the first instance, as labour supply curves under competitive markets would be essentially horizontal: this is precisely the standard view in neoclassical trade theory. At this stage, we should underline that a competitive labour market model is unlikely to apply in the case of many countries. This is particularly true for Portugal, the country studied in this paper, given the rigidities brought by institutions (namely labour law) and other non-competitive forces.4 In this context, our choice of the country under study biases our analysis against the rejection of the hypothesis of a foreign-firm premium, at least under the labour demand
3 Throughout the text we use “foreign firms” and “multinationals” interchangeably: Portuguese firms with subsidiaries abroad (which, in any case, are relatively scarce) are considered as domestic firms for the purposes of this paper. 4 For instance, Blanchard and Portugal (2001) highlight the large burden to economic efficiency brought by restrictive firing regulations. Portugal and Cardoso (2003) also do not find any employment effects of minimum wage laws, unlike what one expects in a competitive market. Additionally, Martins (2004b) presents evidence of substantial levels of rent sharing in the Portuguese labour market.
5
explanation. In other words, since the labour market presents many non-competitive features, it is more likely that higher wages in foreign firms will not be competed away by workers in domestic firms and that new or expanding firms will face a positively sloped labour supply curve. A second possible explanation for the higher wages of foreign firms is that multinationals may pay a premium to dissuade workers from moving to other firms or disrupting activity. This is consistent with the Ownership-Location-Internalisation model of Dunning (1977), in particular with the internalisation motive.5 Under this model, foreign firms own special assets (e.g. new products or technologies) that are more profitably exploited abroad via FDI than via exporting (or franchising schemes). Foreign firms would then pay higher wages in order to prevent the costly turnover which would occur once quitters provided insights about the multinationals’ specific assets to competing firms (see Fosfuri et al., 2001). Alternatively, or complementarily, foreign firms may share with workers some of the rents produced by those assets, driving their wages above those of comparable individuals working in firms that do not generate such rents. Although this type of explanation is appealing, it again raises some concerns. One issue is that, while foreign firms may indeed generate rents, such firms are also likely to have stronger bargaining power than domestic firms, since they may easily shift production (and thus employment) across countries (see Caves, 1996, pp. 123-131). It is therefore ambiguous whether the rent sharing effect would outweigh the bargaining power effect. Martins (2004d) compares the extent of rent sharing in domestic- and foreign-owned firms in Portugal and finds evidence consistent with stronger bargaining power effects: the hypothesis that workers in foreign firms benefit more from rent sharing than similar workers in domestic firms is rejected. Another concern is that this rent-sharing view assumes that foreign firms are more likely to draw on special assets than a representative domestic firm. In other words, it may not be “foreignness” itself that drives the pay gap, but rather the differences in the (average) characteristics of domestic and foreign firms. In this case, one again cannot interpret the pay differences between the two types of firms in a causal way. A third explanation for the stylised fact that foreign firms pay higher wages is about compensating differentials. For instance, multinationals may provide less interesting job amenities than domestic firms. Workers would thus have to be offered higher wages in order to take jobs in foreign-owned firms. Although this view is theoretically sensible, it implies that workers are not better-off in foreign-owned firms. Moreover, the little evidence available, including Sutherland (2002) and Brown et al (2003) for developed and developing countries, respectively, suggests that working conditions are better in foreign firms. The first paper finds that workers exhibit higher levels of job satisfaction in foreign-owned firms while the second suggests that working conditions are more enjoyable in foreign firms. In their study of Portugal, Mata and Portugal (2002) also find no differences in exit probabilities between domestic and foreign firms: workers would therefore have no reason to demand a pay premium which would compensate them for a potentially higher probability of displacement when employed by a foreign firm.6
5 Other prominent models of FDI, such as the vertical, horizontal and capital-knowledge models, are more difficult to be applied in the context of pay determination. But see Markusen and Venables (1997) for a study of the role of multinationals in explaining wage inequality (between skilled and unskilled workers) and Martins (2005) for an examination of different FDI models using U.S. domestic and multinational labour market data. 6 Görg and Strobl (2003) find mixed results for the case of Ireland: foreign firms are more likely to exit but the jobs they create are more persistent.
6
Finally, foreign firms may select workers that are more skilled in dimensions unobservable to the researcher. For instance, given the larger size of multinationals, even when only considered individually in each host country and particularly when taken jointly in all countries in which each firm operates, these enterprises may benefit from scale economies in setting up sophisticated human resource departments. This would make it easier for these firms to screen and hire the best applicants, possibly also along skill dimensions not observable by the researcher. Under this view, the wage differential attributed to multinationals would again be spurious as no causal impact of foreign ownership upon wages could be inferred. This also means that evidence of wage differentials should not necessarily support the case for government intervention, to the extent that foreign firms are not effectively paying higher wages to comparable workers. Overall, we conclude in this section that there are relatively few theoretical reasons that warrant a reconciliation of the empirical stylised fact of a foreign-firm wage premium with a causal relationship between foreign ownership and pay. Moreover, the little empirical evidence available does not seem to support such theoretical explanations. The strongest account is probably that labour markets are not sufficiently competitive, but even this view does not offer any reasons why foreign firms would be different from similar domestic firms. This conclusion provides further motivation the empirical work carried out in this paper. 3. Data Our analysis draws on a large matched employer-employee data set, “Quadros de Pessoal” (Personnel Records). This is a compulsory annual census run by the Ministry of Employment of all firms located in Portugal with at least one employee. Those firms are required to provide information about their characteristics and those of their workforce. (Particular care is placed on the reliability of the information, as that is used by the Ministry of Employment for the purpose of checking the employer’s compliance with labour law.) The firm-level variables include geographical location, industry, sales and the share of the firm’s equity owned by foreign parties. The set of worker characteristics includes gender, highest educational qualification, tenure, wages and hours worked. There are also unique (time-invariant) identifiers for each firm and each worker that allow each firm and individual to be followed over time. Information for each worker-year is also matched to his/her employer’s identifier. The data set considered here is a set of annual representative samples of 80% of all manufacturing sector firms. The information refers to each year in the period 1991-99 and to a specific month of each year (March up to 1993 and October from 1994 onwards). There is also individual information on all workers of each firm sampled in each year.7 This amounts to an annual average of about 678,000 workers per year and 29,481 firms (and a total of 71,240 different firms over the nine years). After dropping observations with missing or inconsistent information in key variables and firms based outside continental Portugal we obtain a data set with an annual average of 601,000 workers and 16,935 firms (and a total of 39,783 different firms).
7 This means there is attrition in the panel at the firm level but not at the worker level, in the sense that only the workers of the firms that are not sampled in a given year will not be present in the data.
7
The foreign/domestic firm ownership classification is derived from the share of equity held by foreign nationals. We define as foreign firms those for which at least 50% of equity is owned by foreign parties,8 and we obtain an annual average of 16,557 domestic and 378 foreign firms. These firms correspond to 534,000 workers in domestic firms and 62,600 workers in foreign firms9). This large share of workers in foreign firms is also in line with the considerable flows of inward FDI in Portugal, especially since European Union membership in 1986 – over the 1990’s, such flows averaged about 7% of GDP per year. The descriptive statistics reveal some important differences between foreign and domestic firms. For instance, in all measures of earnings (monthly or hourly), workers in foreign firms earn more than their counterparts in domestic firms. In 1991, for example, the average worker in a foreign firm earned €691 per month (2000 prices), whilst the average worker in a domestic firm earned only €528, implying a pay premium of 30.9%. By the end of the decade, the corresponding values were €863 and €628 (and a pay premium of 37.4%). These differences in earnings can be partly explained by differences in schooling attainment: workers in foreign firms are found to have an (unweighted) average of 6.9 years of schooling across the nine years covered, whereas the same figure for workers in domestic firms is only 5.8. On the other hand, workers in domestic firms are found to be more experienced. This is partly due to their lower schooling, as we are measuring Mincer experience (age-experience-6). As to the distribution of workers by industries, again there are clear differences between domestic and foreign firms. A particularly striking contrast is the over-representation of foreign firms in the Metallic and Transport industry (43% of workers against 19%). On the opposite side there is the Textiles, Clothing and Leather industry (29% of foreign workers versus 38% of domestic workers) and the Wood and Cork industry (1% versus 8%). These differences have also a geographical dimension, as workers of foreign firm are relatively more prevalent in the Lisbon region (40% versus 23%) and less prevalent in the North region (40% versus 52%).10 A complementary way to establish the contrast between domestic and foreign ownership can be pursued by looking at firm (rather than worker) unweighted averages, i.e. without weighting firm characteristics by their firm size. This exercise – see Table 2 – reveals even stronger pay differences between foreign and domestic firms. For instance, in 1999, the average multinational paid €889 to an average worker (€502 for the average domestic firm), which amounts to a pay premium of 77.1%, more than twice the premium documented for same year in Table 1.11
8 Some authors use a 10% threshold, in line with the International Monetary Fund criterion that distinguishes between portfolio and direct foreign investment flows. We have opted for the 50% level instead because we want to focus on the impacts of foreign firm ownership (and not of firms with some positive level of foreign participation). However, we acknowledge that, in our data, a 50% foreign-ownership share is not either a necessary or a sufficient condition for foreign control, since there may be more than one foreign or domestic investor per firm. For the benefit of robustness, we also conduct an analysis of our data using the 10% threshold – results included in Martins (2004e). We find little differences from the results documented in the main text. There is only a small increase in the percentage of workers in foreign firms (from 13% to 16%), as most firms with a non-zero level of foreign ownership are above the 50% threshold. 9 The yearly data are available on Tables 1 (workers) and 2 (firms). See Martins (2004c) for a more complete description. 10 See Guimarães et al. (2000) for a study of FDI agglomeration in Portugal. 11 An important explanation for this difference between the worker and firm data lies on the fact that foreign firms are, on average, much bigger, at least in terms of the number of workers. Foreign firms have an average of 190 workers whereas domestic firms have an average of only 32 workers. This helps in understanding the very large pay
8
4. Results 4.1 OLS estimator In this section, different versions of the following wage equation are considered: yi = Xi’β1 + Fj(i)’β2 + β3Foreignj(i) + εi (1) yi denotes the logarithm of real hourly wages. Xi denotes a set of human capital characteristics (six dummies for educational attainment, a quartic in experience, a quadratic in tenure – measured in months, and a female dummy). Fj(i) denotes a set of characteristics of the firm j of worker i (four regional dummies, log number of workers, a dummy for public firms and eight industry dummies12). Foreignj(i) is a dummy variable taking value 1 if the firm of worker i is foreign and 0 otherwise. Our attention is focused on the β3 coefficient. εi is the error term. The first version of equation (1) includes only the foreign dummy. In this case, the wage premium for workers in foreign firms is found to average 32%, ranging between 27% and 37% across the different years – see the first row of Table 3. However, as suggested before, these wage differences may be attributed to different levels of human capital. Indeed, it is found that, when one controls for these variables, the (unweighted) average premium falls to 27% (ranging between 23% and 32%). Finally, when firm characteristics are also considered, the premium falls further and more substantially than when human capital variables were added. The average premium is now only 11%, ranging between 8% and 13%.13
Overall, these results, which are in line with those of studies for other countries, suggest that about two thirds of the average difference in pay between domestic and foreign firms are determined by the different human capital of their workers and, more importantly, by the different characteristics of foreign and domestic firms. However, at 11%, the pay gap between domestic and foreign firms is still economically significant and may suggest an important effect of multinationals on wages.14 4.2 Different levels of control In this section, we test the hypothesis that a greater share of foreign ownership leads to a greater foreign premium. One can argue that this would occur under the case of a causal impact of foreign ownership upon wages. We test this hypothesis by allowing the wage impact of foreign firms to differ depending on the degree of control of the firm by the multinational, as implicit in the share of the firm’s equity held by foreign parties.
difference, as it is well known that smaller firms pay lower wages (Brown and Medoff, 1989, and Oy and Idson, 1999), although it is less well known why this is so. No other major differences are found in terms of the industry or geographical distributions of domestic and foreign firms in the firm statistics table. 12 A new industry code was adopted in 1995. We use the old, more-aggregated version (“CAE-Rev.1”). 13 As to time trends, there is some evidence, in the first and second specifications, of increasing foreign multinational wage premia between 1991 and 1995, when they peak, and declining premia from then until 1999. This pattern is however not present in the specification that includes both human capital and firm controls. 14 These results are robust to the inclusion of controls for industry effects: see Martins (2004e).
9
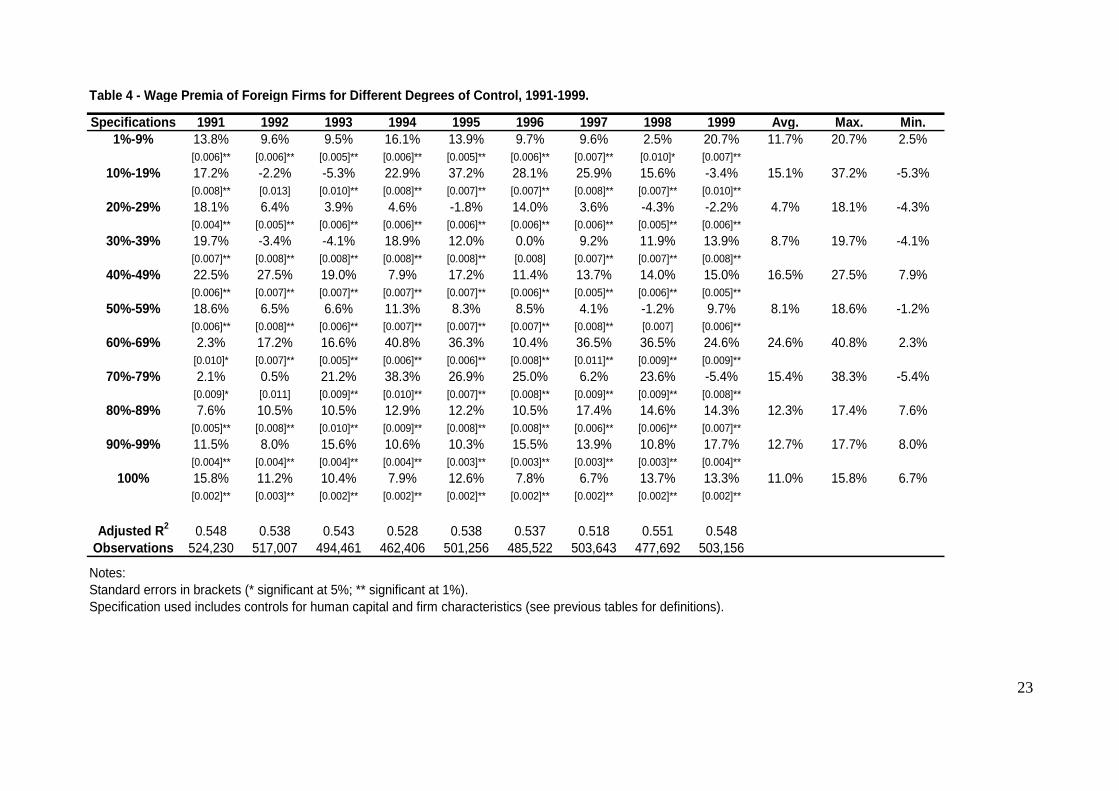
Our first approach is to generate different dummy variables for firms with different shares of foreign control: 1%-9%, 10-19%, …, 40-49%, 50-59%, …, 90%-99% and 100%. We find that, within the group of firms which are considered as foreign-owned, the most prevalent category is that of full foreign control (which accounts for 60% of workers in foreign firms) and then that of 90%-99% (20% of workers). Within the group of firms that have less than 50% foreign shares, they correspond to between .5% and 2% of the workers in domestic firms. We find – see Table 4a – positive premia for all workers whose firms have some positive share of equity held by foreign parties, regardless of the size of that share. For instance, firms with a share of equity of between 1% and 9% pay their workers, on average across the decade, 12% more than similar workers in firms without any share of equity held by foreigners. Although average premia are higher in the 50%-100% range than in the 1%-49% range, there is no clear evidence of a monotonic relationship between premia and the share of foreign ownership. This result weakens the case for a causal relationship between the degree of control and the wage differential. However, one must bear in mind the relatively low number of workers in firms that exhibit low but positive levels of foreign ownership. This may explain the considerable volatility in the estimates for lower levels of foreign ownership at different years.15
4.3 Quantile Regression As suggested in Section 2, the commonly documented wage premium of foreign firms may be explained by unobservable differences between their workers and those of domestic firms, particularly amongst the best paid of each group. Under this view, the average wage in foreign firms could be pushed upwards by a longer right tail of the conditional wage distributions for workers in those firms. Such longer tail would represent the higher ability (and wages) of the more skilled workers hired by foreign firms. This difference between the wage distributions of domestic and foreign firms would however not be uncovered by OLS. This method examines only the impact of regressors on the mean of the dependent variable. In this case, quantile regression (Koenker and Bassett, 1978) can be used instead, as it examines the possibility that the impact of a regressor (the foreign-firm dummy) varies along the distribution of the dependent variable (wages).16 We test this hypothesis drawing on equation 1, including the wider set of controls for firm and worker characteristics. Using quantile regression, we examine the returns at the 75th and 25th
15 As a further check on this link between the degree of foreign control and the wage premium, we also investigated the wage difference between domestic and foreign firms when the latter are defined at different thresholds. Here we consider ownership starting alternatively at the 10%, 20%, 30%, 40% and 50% levels and compute the premium accordingly. Taking into account the hypothesis described above that greater control translates into a higher premium, we expect that the greater the ownership threshold, the higher the premium. Consistently with the findings in this subsection, the results – see Martins (2004c) – indicate that there is no monotonically positive relationship between the premium and the level of control. Moreover, in most years the premium is found to fall at higher levels of control. 16 In the context of inter-industry wage differentials, Martins (2004a) suggests that, if such differentials are explainable by workers’ unobserved heterogeneity, then those wage differentials are likely to be more acute at the top than at the bottom of the wage distribution. Quantile regression would then capture the over-representation of high-ability workers in high-wage industries. Unlike in the present paper, no differences in premia along the distribution are found.
10
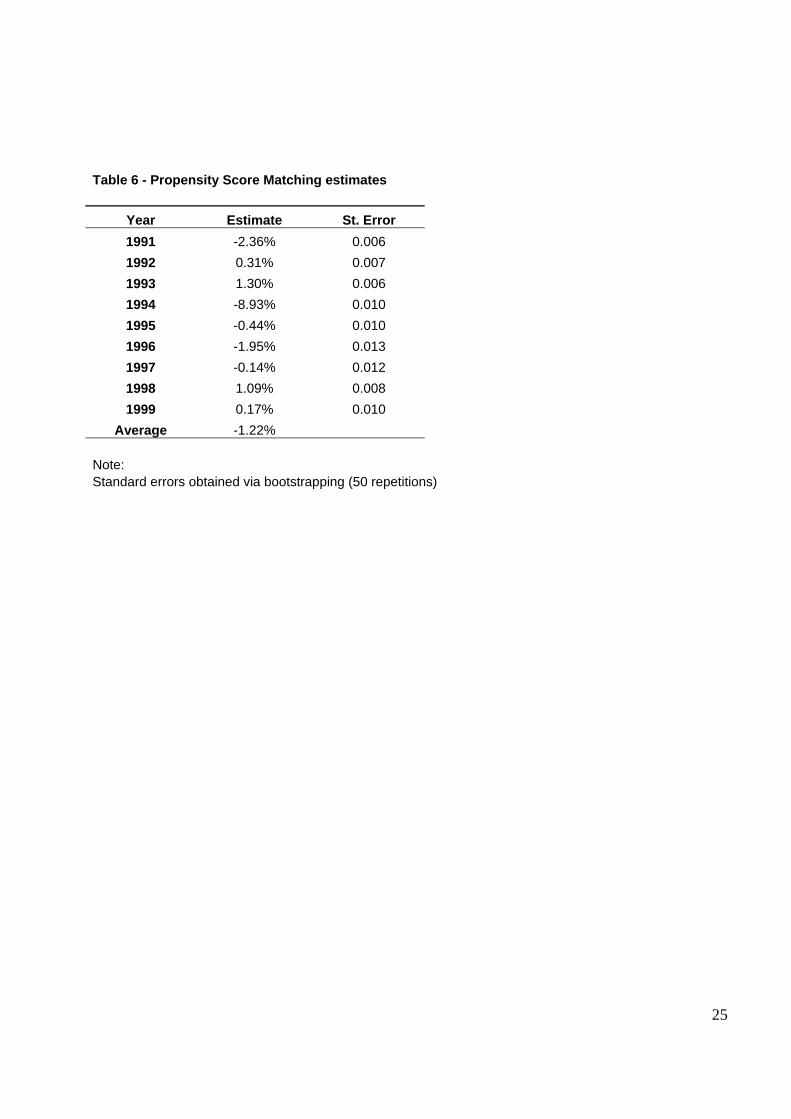
percentiles, which proxy for the top and bottom of the wage distribution, respectively. We find that the foreign-firm wage premium is generally larger at the top than at the bottom of the distribution – see Table 5. Except for 1991 and 1992, the foreign-firm premium is always statistically larger at the top of the distribution, using the 1% level (the tests are carried out using simultaneous estimation of both quantiles) and that the difference in the premia is between about 2 and 3 percentage points. Following the theoretical discussion in Section 2, these findings are consistent with the case of unobserved worker differences driving the foreign-firm premium. Should all workers in foreign firms be of a similar unobserved quality to their counterparts in domestic firms, one would expect the wage premium to be the same along the wage distribution. However, we show here that, although the premium remains positive at the bottom of the distribution, it is even higher at the top. Therefore those workers in foreign firms whose skills place them at the top of their conditional wage distributions benefit from a stronger premium with respect to their counterparts at the bottom of the distribution. This is consistent with the view that workers in foreign firms are more skilled along unobserved dimensions. 4.4 Propensity Score Matching One concern with OLS estimators is that their “like-for-like” comparisons disregard the possibility of a different support (i.e. range of values of the regressors) between observations with and without some characteristic whose impact is of interest. Moreover, the distribution of characteristics over that region of common support may also be very different between the two groups, further biasing OLS results. Heckman et al (1997) suggests that these two biases (non-overlapping support and different distributions of covariates) are more important than the bias related to selection on unobservables. The latter bias has however received much more attention, at least in the literature on programme evaluation (e.g., job training). In their words, “the simple balancing of observables goes a long way towards effective evaluation” (p. 607). Propensity score matching (PSM) is a non-parametric method that tackles these issues directly by restricting the analysis over the region of common support (i.e. by only comparing observations that are effectively comparable) and by taking into account the distribution of the regressors across each group under study. The relevance of this method for the analysis conducted in this paper stems from the large differences documented before in terms of the observable characteristics of workers in domestic and foreign firms, particularly along the education, firm size and industry distributions. Failure to take this into account may thus have seriously biased our previous results. In this sub-section, we implement PSM, using the same annual data sets described before. The variables considered for the estimation of the propensity score are: six education dummies, experience, tenure, gender, log firm size, three region dummies (north, centre and Lisbon) and four industry dummies (textiles, wood, chemicals and metallic). It is this propensity score, obtained via a logit estimation, that will be used to match workers in foreign firms to those in domestic firms, in this case via the one-to-one matching procedure.17
17 Since the estimation proved very time consuming, in particular because the standard errors are obtained via bootstrapping (50 repetitions) and the data set is very large, we use a subset of the original data set in this sub-section. For each year, this subset was made of a random sample of 20% of the observations for workers in domestic firms added to the full sample of workers in foreign firms. Using these smaller samples, we have also
11
The first nine rows of Table 6 present the results. The estimates of the foreign firm premium range between –8.9% (1994) and 1.1% (1998), averaging -1.22% over the nine years studied. Most coefficients are not significant. Therefore, the average premium (and, to a lesser extent, its variability across years) stand in clear contrast with the initial findings in sub-section 4.1 and in the literature of a positive and “large” impact of foreign ownership on wages. However, this is not at odds with the subsequent finding in section 4.1 that a more detailed comparison of workers in domestic and foreign firms leads to substantially lower estimates of the foreign-firm wage premium and the finding in sub-section 4.2 of no monotonic relationship between foreign control and the wage differential. Further analysis – not reported here – indicates that these results are due, at least partially, to the differences in the degree of common support observed between the treatment and comparison groups. 4.5 Acquisitions – difference-in-differences The difference-in-differences method involves contrasting the change in a variable of interest in a group of observations that have undergone some treatment with the change in the same variable in a similar group of observations but which have not undergone that treatment. The advantage of this approach is that one is able to control indirectly for variables that may influence the parameter of interest but which may not be available in the data, provided that such variables are time-invariant and the assignment to treatment is random. In this subsection, we apply this method for the case of domestic firms that are acquired by multinationals: such acquisition is the treatment whose impacts are studied vis-à-vis the control group of domestic firms that are not acquired over the period considered. A similar approach is used in Conyon et al (2002) and Almeida (2003).18 The first paper uses UK firm level panel data and focuses on the productivity and wage impacts of acquisitions, considering the cases of acquisitions of domestic firms originated by foreign multinationals and those originated by other domestic firms. The authors find evidence of higher wage growth when domestic firms are acquired by multinationals than when domestic firms are not acquired by any firm. However, they also note that the domestic firms that are acquired already exhibit higher levels of wage growth before acquisition than those firms that are not acquired, suggesting some degree of “cherry picking”. Another interesting result is that, after controlling for productivity, the wage differential is eliminated.19 However it is not obvious that one would want to control for productivity differences. For instance, if such productivity changes are due to different management practices brought by the new owners, any wage differences that arise should be interpreted as a causal impact of ownership change, even if they can be accounted for by productivity differences.
examined the robustness of our findings to different matching techniques and different sets of control variables. The results – not reported but available upon request – are qualitatively similar to those presented here. 18 Other papers that use this methodology include Girma and Görg (2003) for the UK and Lipsey and Sjoholm (2003) for Indonesia, both drawing on firm-level data. The two papers papers document higher wage growth for acquired firms, although Girma and Görg (2003) finds that this result applies only to some industries and when the acquirers are of specific nationalities. 19 Similar results are obtained when the acquisition dummy is instrumented. However, it is not clear whether the instruments used in the paper pass the validity tests, i.e. whether they can be excluded from the main equation and whether they contribute to the explanatory power of the auxiliary regression.
12
Almeida (2003) also studies the wage impacts of foreign acquisition using the “Quadros de Pessoal” data set; there are, however, some important differences in relation to what is done in this subsection. For instance, Almeida considers both the manufacturing and non-manufacturing sectors, but using data aggregated at the firm level. Moreover, foreign ownership (or acquisition) is defined at the 10% equity threshold. If we focus on the case of manufacturing, in order to compare the two papers, Almeida’s estimates of the foreign firm wage premium fall from 0.16 in the OLS cross-section estimator (a similar value to the 11% premium we estimate using worker-levels regressions) to an insignificant coefficient of 0.02 in the difference-in-differences results. Moreover, as in Conyon et al (2002), important observational differences between acquired and always-domestic firms are also documented, even before acquisition. Our contribution to this literature is twofold. Firstly, we take the analysis to worker-level data, in order to minimise the aggregation bias implicit in firm-level studies. Secondly, we focus on the same workers before and after acquisition (i.e. we consider only stayers). This should substantially decrease the scope of unobserved heterogeneity to bias our estimates of the foreign ownership effect. Moreover, this approach also means that we do not suffer from the selection biases that may occur when, upon acquisition, firms adjust their workforces, particularly when such changes occur along unobserved dimensions. For instance, the wage increase following acquisition which is documented in Conyon et al (2002) could arise if the foreign owners replace some incumbents with more skilled individuals. We construct the data set used in this subsection as follows. The control group includes all firms which are never foreign owned over the up to nine years in which such firms are available in our sample. Only two specific years are considered for the wage analysis: the “before” year is randomly selected in the 1991-1998 range, while the “after” year is the subsequent year available in the sample for that firm. (This is not necessarily the “before” year plus one as the panel is unbalanced.) A total of 23,991 firms (and about 250,000 workers) were selected. The treatment group (domestic firms acquired by foreign parties) is defined as the set of firms whose ownership is initially domestic (i.e. share of equity owned by foreign parties below 50%) and which, in some subsequent year, become foreign owned. Firms that follow this criterion but in which the foreign acquisition process is reversed at a later stage were dropped. In total, there are 231 firms (and about 18,000 workers) that meet our criteria. These two groups of firms and workers were found to be very different, as far as their observable characteristics are concerned – see Table 7. The treatment workers are more educated than their control group counterparts. The former are also over-represented in bigger firms and in the metallic industry while they are under-represented in the clothing industry, for instance. The distribution of acquisitions per year, in terms of workers, is also less balanced than in the control group, particularly in 1992 (25% vs 12%) and in 1995 (6% vs 13%). Importantly, there is also a substantial difference in wage growth for each group of workers over the period in which they are followed: the treatment group has an average wage growth of 0.6% whereas for the control group that figure increases to 5.1%. These differences in wage growth may, however, be due to the different characteristics of each type of workers, and not to the acquisition effect itself. The impact of the treatment was therefore obtained from running a regression in which the dependent variable is wage growth between the “before” and “after” period, i.e. differences of the log hourly wage, as in the equation below:
13
Δyit,t-1 = Xit-1’β1 + Fj(i),t-1’β2 + β3Foreignj(i),t + β4Δtit + εit , (2) The regressors are the characteristics of the workers and their firms in the “before” period (t-1) and a dummy variable (Foreign) taking value one for workers in firms that become foreign-owned and value zero for workers in firms that are still domestically-owned in the second period. A control for the difference in years between the two periods (Δtit) is also included. Consistently with the descriptive statistics, the regression results indicate that, after controlling for the differences in worker characteristics, the impact of foreign acquisition on wages is significantly negative, at –3.1 p.p..20 According to subsequent analysis (not reported here but available upon request), this negative result is due to the fact that the domestic firms that are subject to an acquisition are paying wages (conditional of firm and worker characteristics) much above the market rates, when compared to their domestic counterparts that will not be subject to an acquisition. Taking the latter group as the benchmark, pooled cross-section OLS results find that the domestic firms that will be acquired are paying 11.7% more. After acquisition, the acquired firms are paying a 7.1% premium while those firms that remain domestically owned are paying only 0.8% more. As a further check on the robustness of these results, we considered a different control group: those firms that are always foreign-owned. The motivation for this choice is that the latter firms (and their workers) are, from the observable point of view, more similar to the treatment group under study. To that extent one may argue that foreign firms stand as a better control group. It turns out, however, that wage growth is even lower for acquired firms than for always-foreign-owned firms, controlling or not for worker and firm characteristics. From the regression results – see Table 7 –, the coefficient on the treatment dummy is now –0.042 (–4.1p.p.). For the benefit of robustness, a further treatment group was considered: the subset of firms in the former target group that exhibit a positive level of foreign ownership before acquisition. The motivation was to try to control more directly for the possible selectivity involved in the process of foreign acquisition. To the extent that this subset of firms has already been targeted by foreign firms, we may be more likely to capture with our difference-in-differences estimator in this case only the acquisition effect, rather than a combination between the selection and the acquisition effects. However, we found only 26 firms (and 2,578 workers) that satisfy this condition (non-zero but less than 50% foreign ownership before acquisition). These firms (and their workers) also exhibited characteristics which are even more different, with respect to the control group, than our main treatment group (see below). This forced us to abandon this specific robustness analysis. Coming back to the main results of this sub-section, the findings of negative wage premia can be characterised as surprising, given the opposite stylised fact in the literature. However, this result is not unexpected from the point of view of the literature on takeovers. In this literature, it has been hypothesised that a key motivation for the acquisition of firms is that take-overs enable new employers to renege on implicit contracts established by the previous owners and to appropriate a larger portion of the surplus produced by employees (Schleifer and Summers, 1988). Other authors claim that mergers and acquisitions are the outcome of a process of improved matches between firms and managers, whereby firms that are badly run (for instance
20 Similar results were obtained when one disregards the panel nature of the data (i.e. if one runs a pooled cross-section regression and focuses on the interaction between the before/after and the foreign dummies). This finding suggests that, given the controls used, there are not significant unobservable differences across workers.
14
by paying wages which are too generous given the workers alternative options) are more likely to be taken over (Lichtenberg and Siegel, 1990). Two other matters should be taken into account. The first is that one has to proceed with care when extrapolating from the wage impact of foreign acquisitions to the wage differences between “standard” multinationals and domestic firms. Possibly a better control group in this analysis would be domestic firms acquired by other domestic investors. Unfortunately, it is not possible to identify these firms given the variables available in this data set. On the other hand, this criticism is, however, attenuated when taking into account the stylised fact that most of the current levels of FDI in developed countries (although less in developing countries) are derived from firm acquisitions and not greenfield investment. Therefore, to a large extent, a “standard” foreign firm was, in fact, in an earlier stage domestically owned. In the specific case of Portugal, over the period 1996-2001, acquisitions (and equity increases) took 39% of net inward FDI, while greenfield investment (establishment of new firms) represented only 2% of that total value of FDI inflows (Ministério das Finanças, 2003, p. 17).21
Another concern, possibly more important, is that “cherry picking” may affect the quality of the comparison between acquired and non-acquired domestic firms. This is examined in the next section. 4.6 Robustness analysis: difference-in-differences and propensity score matching Here we combine the research approaches of the two previous sections. As mentioned before, this is motivated, inter alia, by the findings of Heckman et al (1997) that a difference-in-differences extension of the method of matching is particularly effective in eliminating bias, especially bias due to time-invariant unobserved variables. In this case, that of domestic firms acquired by multinationals, there may be an important dimension of “cherry picking” over both observed and unobserved variables. However, the direction of the bias is not so straightforward, as some authors argue that the asymmetry of information inherent in the acquisition of firms may be particularly acute for foreign firms, leading them to pick “lemons” rather than “cherries” (see Gioia and Thomsen, 2003). To the extent that the unobserved variables are time-invariant, the combined method used here will provide unbiased estimates of the impact of foreign ownership upon wages. To the more likely extent that some of those variables are not time-invariant but are picked up by the observable variables controlled for in the analysis, our approach will reduce bias. (See Blundell et al, 2004, for an application of this approach to the evaluation of a job search assistance programme.) In practical terms, we consider as before the same two control groups (always-domestic and always-foreign firms) and the same treatment group (domestic firms that become foreign-owned). In particular, we match workers of acquired firms to workers of always domestic firms along their characteristics in the “before” period. The dependent variable is, however, the change in wages over the two periods, rather than wage levels, as in our earlier propensity score matching analysis.
21 The remaining share concerns credits and reinvested profits.
15
We find again negative estimates (see the bottom row of Table 7): –1.5 p.p. and –7.8 p.p. for the always domestic and the always foreign control groups, respectively. These results reinforce our previous findings as they suggest that the evidence of lower wage growth documented in the simple difference-in-differences analysis is not due to a poor match between workers in the treatment and control groups. 5. Conclusions We provide new evidence on the role of FDI in labour markets from the perspective of wages, using detailed Portuguese matched data and drawing on a variety of methods. In contrast with the received literature, we conclude that the wage differentials between workers in foreign and domestic firms cannot be easily reconciled with a causal impact of ownership upon pay. Although when using OLS methods we find that foreign firms pay more in unconditional terms – the average premium across the nine years covered is about 32% –, the addition of control variables (worker and, in particular, firm characteristics) substantially decreases the premium to an average of about 11%. There was some mild support for a rent-sharing mechanism, as the foreign premium was found to be larger in some industries that may be associated with higher rents. However, no evidence is found of a positive relationship between the degree of foreign control and the wage premium of the firm, unlike what would be expected should foreign control have a positive causal impact upon pay. We also investigate if the foreign premium is constant along the wage distribution. We find that the premium is generally larger for workers at the top of the conditional distributions. This finding of heterogeneity is consistent with the case in which foreign firms select workers that are more skilled in their unobservable characteristics. Moreover, further evidence at odds with a significant wage premium was obtained using Propensity Score Matching, allowing for better like-for-like comparisons. Using this approach, we find a foreign wage premium on average of –1%, ranging between –9% and 1%, and, in most cases, statistically insignificant. Finally, we examine the wage consequences of the acquisition of domestic firms by foreign firms, in a difference-in-differences framework, considering two alternative control groups. Consistently with the previous results, negative coefficients are obtained. This finding also holds when we combine difference-in-differences with Propensity Score Matching. Overall, our results suggest that the foreign-firm wage premium commonly documented in the literature is exaggerated due to a combination of two factors: the lack of a proper like-for-like comparison between domestic and foreign firms; and (to a smaller extent) workers’ unobserved heterogeneity. Moreover, our results were obtained for a country with a labour market which is far from competitive, where one could expect wage differentials to be longer lasting. This aspect reinforces the conclusion that our evidence is at odds with causal interpretations of the foreign-firm wage premium. These findings may have important implications for public policy. For instance, the results suggest that, should governments want to attract high-wage firms, criteria focusing on firm size or industry are more important than the distinction between domestic and foreign/multinational firms. In other words, workers would benefit from the presence of more firms with the characteristics of multinationals, regardless of their nationality. Taken together with the
16
evidence of weak productivity spillover effects, our findings strengthen the case for policy makers to re-think their strategies regarding the attraction of foreign direct investment. References Aitken, B., Harrison, A, and Lipsey, R. (1996) “Wages and Foreign Ownership. A Comparative Study of Mexico, Venezuela, and the United States”, Journal of International Economics, 40, 345-371. Almeida, R. (2003) “The Effects of Foreign Owned Firms on the Labor Market”, IZA Discussion Paper 785. Blanchard, O. and Portugal, P. (2001) “What Hides Behind an Unemployment Rate: Comparing Portuguese and U.S. Labor Markets”, American Economic Review, 91, 187-207. Blundell, R., Costa Dias, M., Meghir, C. and Van Reenen, J. (2004) “Evaluating the Employment Impact of a Mandatory Job Search Assistance Program”, Journal of the European Economic Association, 2, 569-606. Brown, C. and Medoff, J. (1989) “The Employer Size-Wage Effect”, Journal of Political Economy, 97, 1027-1059. Brown, D., Deardoff, A. and Stern, R. (2003) “The Effects of Multinational Production on Wages and Working Conditions in Developing Countries”, National Bureau of Economic Research Working Paper 9669. Caves, R. (1996) Multinational Enterprise and Economic Analysis, 2nd edition, Cambridge University Press: Cambridge. Conyon, M., Girma, S., Thompson, S. and Wright, P. (2002) “The Productivity and Wage Effects of Foreign Acquisition in the United Kingdom”, Journal of Industrial Economics, 50, 85-107. Dunning, J. (1977) “Trade, Location of Economic Activity and the MNEs”, in B. Ohlin, P. Hesselborn and P. Wijkman (eds), The International Allocation of Economic Activity, Macmillan. Feenstra, R. and Hanson, G. (1997) “Foreign Direct Investment and Relative Wages: Evidence from Mexico’s Maquiladoras”, Journal of International Economics, 42, 371-393. Feenstra, R. and Hanson, G. (1999) “Productivity Measurement and the Impact of Trade and Technology on Wages: Estimates For the U.S., 1972-1990”, Quarterly Journal of Economics, 114, 907-940. Feliciano, Z and Lipsey, R. (1999) “Foreign Ownership and Wages in the United States, 1987 – 1992”, National Bureau of Economic Research Working Paper 6923. Fosfuri, A., Motta, M. and Rønde, T. (2001) "Foreign Direct Investments and Spillovers Through Workers' Mobility", Journal of International Economics, 53, 205-222.
17
Gioia, C. and Thomsen, S. (2003) “International Acquisitions in the Danish Business: Selection and Performance”, Copenhagen Business School, mimeo. Girma, S. and Görg, H. (2003) “Evaluating the Causal Effects of Foreign Acquisitions on Domestic Skilled and Unskilled Wages”, IZA Discussion Paper 903. Görg, H. and Greenaway, D. (2004) “Much Ado About Nothing? Do Domestic Firms Really Benefit from Foreign Direct Investment”, World Bank Research Observer, forthcoming. Görg, H., Strobl, E. and Walsh, F. (2002) “Why do Foreign-Owned Firms Pay More? The Role of On-the-Job Training”, University of Nottingham, mimeo. Görg, H. and Strobl, E. (2003) “‘Footloose’ Multinationals?”, Manchester School, 71, 1-19. Griffith, R. and Simpson, H. (2003) “Characteristics of Foreign-Owned Firms In British Manufacturing”, NBER Working Paper 9573. Guimarães, P., Figueiredo, O. and Woodward, D. (2000) “Agglomeration and the Location of Foreign Direct Investment in Portugal”, Journal of Urban Economics, 47, 115-135. Heckman, J. Ichimura, H. and Todd, P. (1997) “Matching as an Econometric Evaluation Estimator: Evidence from Evaluating a Job Training Programme”, Review of Economic Studies, 64, 605-654. Koenker, R. and Bassett, G. (1978) “Regression Quantiles”, Econometrica, 46, 33-50. Lichtenberg, F. and Siegel, D. (1990) “The Effect of Ownership Change on the Employment and Wages of Central-Office and Other Personnel”, Journal of Law and Economics, 33, 383-408. Lipsey, R. and Sjoholm, F. (2001) “Foreign Direct Investment and Wages in Indonesian Manufacturing”, National Bureau of Economic Research Working Paper 8299. Lipsey, R. and Sjoholm, F. (2003) “Foreign Firms and Indonesian Wages: A Panel Study”, National Bureau of Economic Research Working Paper 9417. Markusen, J. and Venables, A. (1997) “The Role of Multinational Firms in the Wage-Gap Debate”, Review of International Economics, 5, 435-451. Martins, P. (2003) “Firm Wage Differentials in a Competitive Industry: Some Matched-Panel Evidence”, International Journal of Manpower, 24, 336-346. Martins, P. (2004a) “Industry Wage Dispersion: Evidence from the Wage Distribution”, Economics Letters, 83, 157-163. Martins, P. (2004b) “Rent Sharing Before and After the Wage Bill”, IZA Discussion Paper 1376. Martins, P. (2004c) “Do Foreign Firms Really Pay Higher Wages? Evidence from Different Estimators”, IZA Discussion Paper 1388.
18
Martins, P. (2004d) “Rent Sharing and Foreign Ownership”, Queen Mary, University of London, mimeo. Martins, P. (2005) “The Inter-Industry Wage Structure of US Multinationals”, Economics Bulletin, 10(1), 1-12. Mata, J. and Portugal, P. (2002) “The Survival of New Domestic and Foreign Owned Firms”, Strategic Management Journal, 23, 323-343. Ministério das Finanças (2003) “Portugal no Espaço Europeu: O Investimento Directo Estrangeiro” [“Portugal in the European Area: Foreign Direct Investment”], Departamento de Prospectiva e Planeamento, Ministério das Finanças [Finance Ministry], Lisbon. Oi, W. and Idson, T. (1999) “Firm Size and Wages”, in O. Ashenfelter and D. Card (eds) Handbook of Labor Economics, Elsevier: Amsterdam. Portugal, P. and Cardoso, A. R. (2003) “Disentangling the Minimum Wage Puzzle: An Analysis of Worker Accessions and Separations”, IZA Discussion Paper 544. Schleifer, A. and Summers, L. (1988) “Breach of Trust in Hostile Take-Overs”, in A. Auerbach (ed) Corporate Take-Overs: Causes and Consequences, NBER: Chicago. Sutherland, J. (2002) “The Experience of Work. Is Working for an Overseas-Owned Multinational So Different?”, Employee Relations, 25, 149-167. Velde, D. and Morrissey, O. (2003) “Do Workers in Africa Get a Wage Premium if Employed in Firms Owned by Foreigners?”, Journal of African Economies, 12, 41-73.
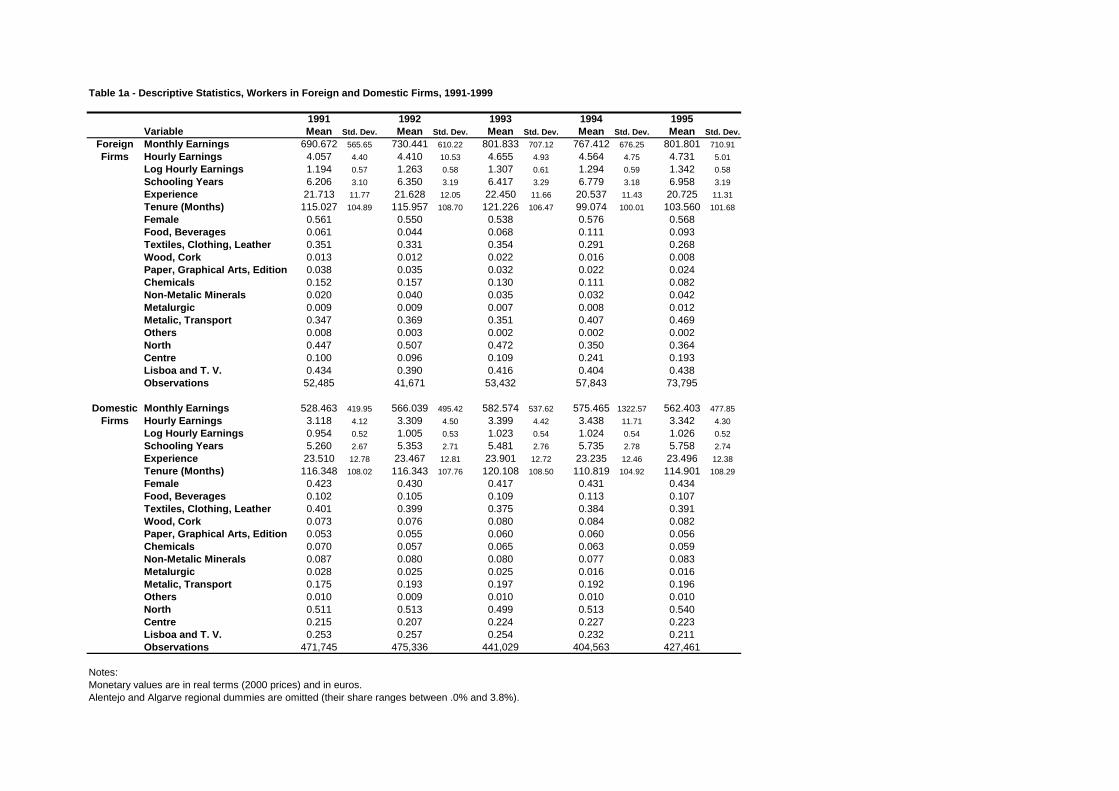
Table 1a - Descriptive Statistics, Workers in Foreign and Domestic Firms, 1991-1999
1991 1992 1993 1994 1995Variable Mean Std. Dev. Mean Std. Dev. Mean Std. Dev. Mean Std. Dev. Mean Std. Dev.
Foreign Monthly Earnings 690.672 565.65 730.441 610.22 801.833 707.12 767.412 676.25 801.801 710.91Firms Hourly Earnings 4.057 4.40 4.410 10.53 4.655 4.93 4.564 4.75 4.731 5.01
Log Hourly Earnings 1.194 0.57 1.263 0.58 1.307 0.61 1.294 0.59 1.342 0.58Schooling Years 6.206 3.10 6.350 3.19 6.417 3.29 6.779 3.18 6.958 3.19Experience 21.713 11.77 21.628 12.05 22.450 11.66 20.537 11.43 20.725 11.31Tenure (Months) 115.027 104.89 115.957 108.70 121.226 106.47 99.074 100.01 103.560 101.68Female 0.561 0.550 0.538 0.576 0.568Food, Beverages 0.061 0.044 0.068 0.111 0.093Textiles, Clothing, Leather 0.351 0.331 0.354 0.291 0.268Wood, Cork 0.013 0.012 0.022 0.016 0.008Paper, Graphical Arts, Edition 0.038 0.035 0.032 0.022 0.024Chemicals 0.152 0.157 0.130 0.111 0.082Non-Metalic Minerals 0.020 0.040 0.035 0.032 0.042Metalurgic 0.009 0.009 0.007 0.008 0.012Metalic, Transport 0.347 0.369 0.351 0.407 0.469Others 0.008 0.003 0.002 0.002 0.002North 0.447 0.507 0.472 0.350 0.364Centre 0.100 0.096 0.109 0.241 0.193Lisboa and T. V. 0.434 0.390 0.416 0.404 0.438Observations 52,485 41,671 53,432 57,843 73,795
Domestic Monthly Earnings 528.463 419.95 566.039 495.42 582.574 537.62 575.465 1322.57 562.403 477.85Firms Hourly Earnings 3.118 4.12 3.309 4.50 3.399 4.42 3.438 11.71 3.342 4.30
Log Hourly Earnings 0.954 0.52 1.005 0.53 1.023 0.54 1.024 0.54 1.026 0.52Schooling Years 5.260 2.67 5.353 2.71 5.481 2.76 5.735 2.78 5.758 2.74Experience 23.510 12.78 23.467 12.81 23.901 12.72 23.235 12.46 23.496 12.38Tenure (Months) 116.348 108.02 116.343 107.76 120.108 108.50 110.819 104.92 114.901 108.29Female 0.423 0.430 0.417 0.431 0.434Food, Beverages 0.102 0.105 0.109 0.113 0.107Textiles, Clothing, Leather 0.401 0.399 0.375 0.384 0.391Wood, Cork 0.073 0.076 0.080 0.084 0.082Paper, Graphical Arts, Edition 0.053 0.055 0.060 0.060 0.056Chemicals 0.070 0.057 0.065 0.063 0.059Non-Metalic Minerals 0.087 0.080 0.080 0.077 0.083Metalurgic 0.028 0.025 0.025 0.016 0.016Metalic, Transport 0.175 0.193 0.197 0.192 0.196Others 0.010 0.009 0.010 0.010 0.010North 0.511 0.513 0.499 0.513 0.540Centre 0.215 0.207 0.224 0.227 0.223Lisboa and T. V. 0.253 0.257 0.254 0.232 0.211Observations 471,745 475,336 441,029 404,563 427,461
Notes:Monetary values are in real terms (2000 prices) and in euros.Alentejo and Algarve regional dummies are omitted (their share ranges between .0% and 3.8%).
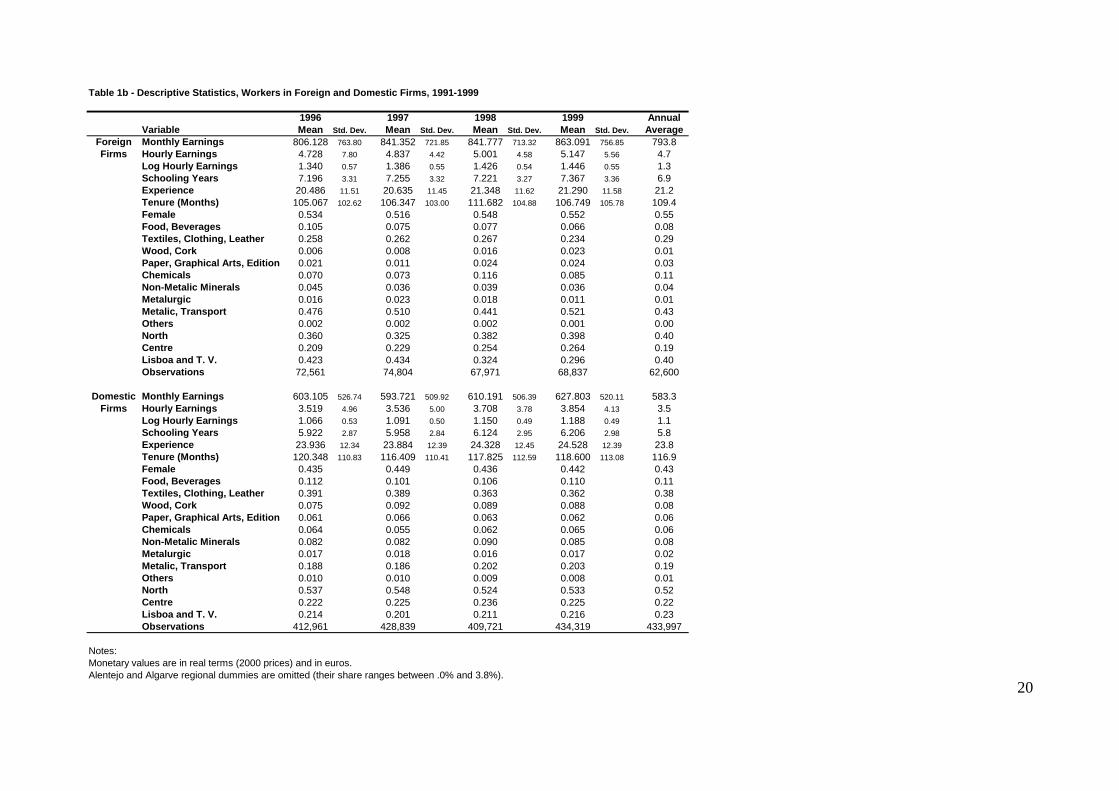
Table 1b - Descriptive Statistics, Workers in Foreign and Domestic Firms, 1991-1999
1996 1997 1998 1999 Annual
20
Variable Mean Std. Dev. Mean Std. Dev. Mean Std. Dev. Mean Std. Dev. AverageForeign Monthly Earnings 806.128 763.80 841.352 721.85 841.777 713.32 863.091 756.85 793.8Firms Hourly Earnings 4.728 7.80 4.837 4.42 5.001 4.58 5.147 5.56 4.7
Log Hourly Earnings 1.340 0.57 1.386 0.55 1.426 0.54 1.446 0.55 1.3Schooling Years 7.196 3.31 7.255 3.32 7.221 3.27 7.367 3.36 6.9Experience 20.486 11.51 20.635 11.45 21.348 11.62 21.290 11.58 21.2Tenure (Months) 105.067 102.62 106.347 103.00 111.682 104.88 106.749 105.78 109.4Female 0.534 0.516 0.548 0.552 0.55Food, Beverages 0.105 0.075 0.077 0.066 0.08Textiles, Clothing, Leather 0.258 0.262 0.267 0.234 0.29Wood, Cork 0.006 0.008 0.016 0.023 0.01Paper, Graphical Arts, Edition 0.021 0.011 0.024 0.024 0.03Chemicals 0.070 0.073 0.116 0.085 0.11Non-Metalic Minerals 0.045 0.036 0.039 0.036 0.04Metalurgic 0.016 0.023 0.018 0.011 0.01Metalic, Transport 0.476 0.510 0.441 0.521 0.43Others 0.002 0.002 0.002 0.001 0.00North 0.360 0.325 0.382 0.398 0.40Centre 0.209 0.229 0.254 0.264 0.19Lisboa and T. V. 0.423 0.434 0.324 0.296 0.40Observations 72,561 74,804 67,971 68,837 62,600
Domestic Monthly Earnings 603.105 526.74 593.721 509.92 610.191 506.39 627.803 520.11 583.3Firms Hourly Earnings 3.519 4.96 3.536 5.00 3.708 3.78 3.854 4.13 3.5
Log Hourly Earnings 1.066 0.53 1.091 0.50 1.150 0.49 1.188 0.49 1.1Schooling Years 5.922 2.87 5.958 2.84 6.124 2.95 6.206 2.98 5.8Experience 23.936 12.34 23.884 12.39 24.328 12.45 24.528 12.39 23.8Tenure (Months) 120.348 110.83 116.409 110.41 117.825 112.59 118.600 113.08 116.9Female 0.435 0.449 0.436 0.442 0.43Food, Beverages 0.112 0.101 0.106 0.110 0.11Textiles, Clothing, Leather 0.391 0.389 0.363 0.362 0.38Wood, Cork 0.075 0.092 0.089 0.088 0.08Paper, Graphical Arts, Edition 0.061 0.066 0.063 0.062 0.06Chemicals 0.064 0.055 0.062 0.065 0.06Non-Metalic Minerals 0.082 0.082 0.090 0.085 0.08Metalurgic 0.017 0.018 0.016 0.017 0.02Metalic, Transport 0.188 0.186 0.202 0.203 0.19Others 0.010 0.010 0.009 0.008 0.01North 0.537 0.548 0.524 0.533 0.52Centre 0.222 0.225 0.236 0.225 0.22Lisboa and T. V. 0.214 0.201 0.211 0.216 0.23Observations 412,961 428,839 409,721 434,319 433,997
Notes:Monetary values are in real terms (2000 prices) and in euros.Alentejo and Algarve regional dummies are omitted (their share ranges between .0% and 3.8%).
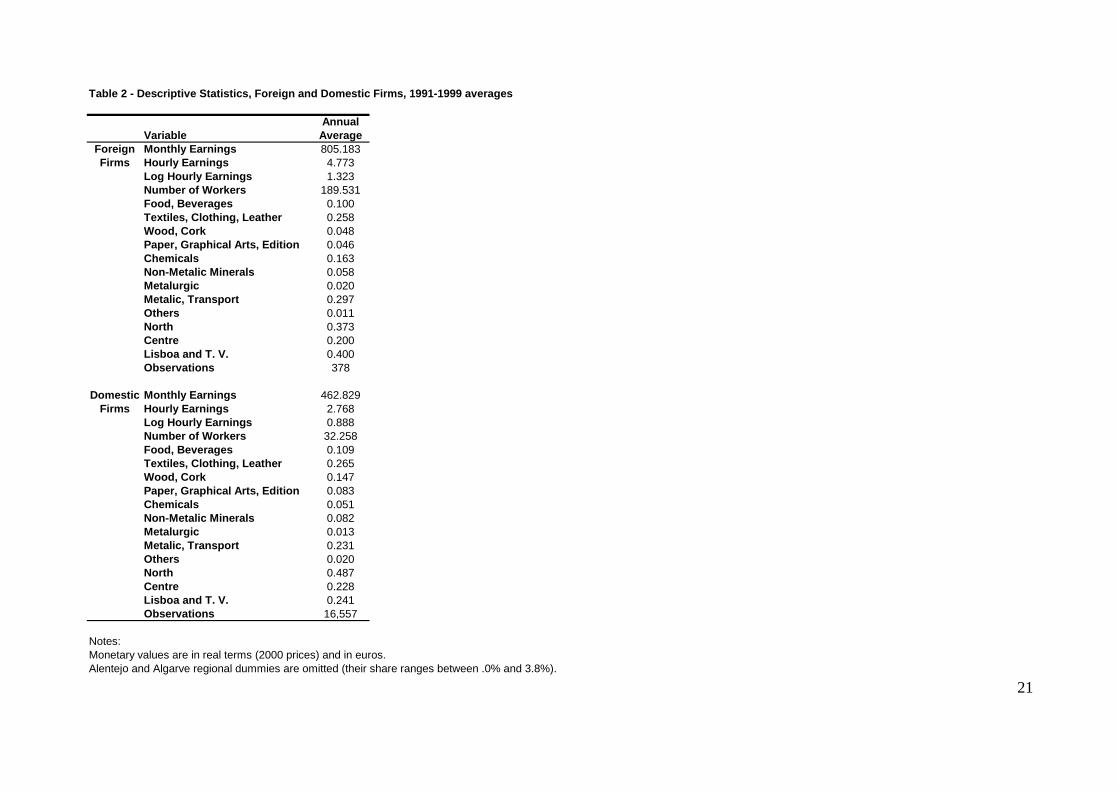
Table 2 - Descriptive Statistics, Foreign and Domestic Firms, 1991-1999 averages
Annual
21
Variable AverageForeign Monthly Earnings 805.183Firms Hourly Earnings 4.773
Log Hourly Earnings 1.323Number of Workers 189.531Food, Beverages 0.100Textiles, Clothing, Leather 0.258Wood, Cork 0.048Paper, Graphical Arts, Edition 0.046Chemicals 0.163Non-Metalic Minerals 0.058Metalurgic 0.020Metalic, Transport 0.297Others 0.011North 0.373Centre 0.200Lisboa and T. V. 0.400Observations 378
Domestic Monthly Earnings 462.829Firms Hourly Earnings 2.768
Log Hourly Earnings 0.888Number of Workers 32.258Food, Beverages 0.109Textiles, Clothing, Leather 0.265Wood, Cork 0.147Paper, Graphical Arts, Edition 0.083Chemicals 0.051Non-Metalic Minerals 0.082Metalurgic 0.013Metalic, Transport 0.231Others 0.020North 0.487Centre 0.228Lisboa and T. V. 0.241Observations 16,557
Notes:Monetary values are in real terms (2000 prices) and in euros.Alentejo and Algarve regional dummies are omitted (their share ranges between .0% and 3.8%).
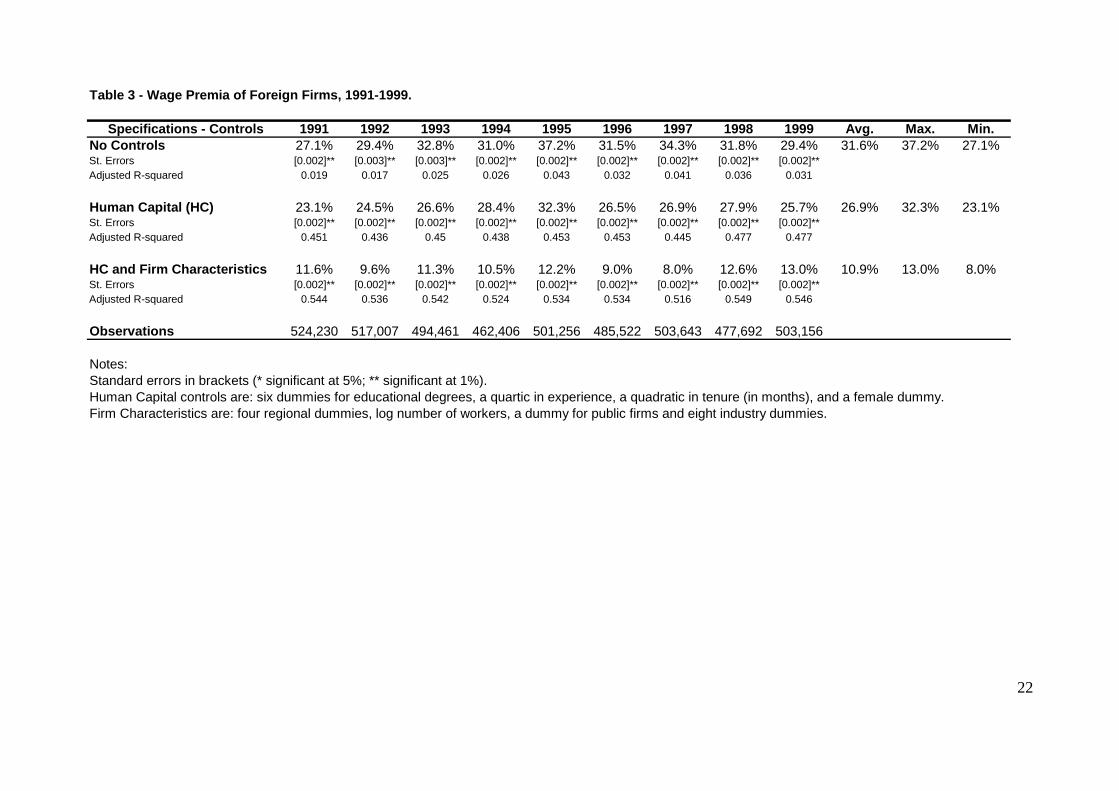
Table 3 - Wage Premia of Foreign Firms, 1991-1999.
Specifications - Controls 1991 1992 1993 1994 1995 1996 1997 1998 1999
22
Avg. Max. Min.No Controls 27.1% 29.4% 32.8% 31.0% 37.2% 31.5% 34.3% 31.8% 29.4% 31.6% 37.2% 27.1%St. Errors [0.002]** [0.003]** [0.003]** [0.002]** [0.002]** [0.002]** [0.002]** [0.002]** [0.002]**Adjusted R-squared 0.019 0.017 0.025 0.026 0.043 0.032 0.041 0.036 0.031
Human Capital (HC) 23.1% 24.5% 26.6% 28.4% 32.3% 26.5% 26.9% 27.9% 25.7% 26.9% 32.3% 23.1%St. Errors [0.002]** [0.002]** [0.002]** [0.002]** [0.002]** [0.002]** [0.002]** [0.002]** [0.002]**Adjusted R-squared 0.451 0.436 0.45 0.438 0.453 0.453 0.445 0.477 0.477
HC and Firm Characteristics 11.6% 9.6% 11.3% 10.5% 12.2% 9.0% 8.0% 12.6% 13.0% 10.9% 13.0% 8.0%St. Errors [0.002]** [0.002]** [0.002]** [0.002]** [0.002]** [0.002]** [0.002]** [0.002]** [0.002]**Adjusted R-squared 0.544 0.536 0.542 0.524 0.534 0.534 0.516 0.549 0.546
Observations 524,230 517,007 494,461 462,406 501,256 485,522 503,643 477,692 503,156
Notes:Standard errors in brackets (* significant at 5%; ** significant at 1%).Human Capital controls are: six dummies for educational degrees, a quartic in experience, a quadratic in tenure (in months), and a female dummy.Firm Characteristics are: four regional dummies, log number of workers, a dummy for public firms and eight industry dummies.
23
Table 4 - Wage Premia of Foreign Firms for Different Degrees of Control, 1991-1999.
Specifications 1991 1992 1993 1994 1995 1996 1997 1998 1999 Avg. Max. Min.1%-9% 13.8% 9.6% 9.5% 16.1% 13.9% 9.7% 9.6% 2.5% 20.7% 11.7% 20.7% 2.5%
[0.006]** [0.006]** [0.005]** [0.006]** [0.005]** [0.006]** [0.007]** [0.010]* [0.007]**10%-19% 17.2% -2.2% -5.3% 22.9% 37.2% 28.1% 25.9% 15.6% -3.4% 15.1% 37.2% -5.3%
[0.008]** [0.013] [0.010]** [0.008]** [0.007]** [0.007]** [0.008]** [0.007]** [0.010]**20%-29% 18.1% 6.4% 3.9% 4.6% -1.8% 14.0% 3.6% -4.3% -2.2% 4.7% 18.1% -4.3%
[0.004]** [0.005]** [0.006]** [0.006]** [0.006]** [0.006]** [0.006]** [0.005]** [0.006]**30%-39% 19.7% -3.4% -4.1% 18.9% 12.0% 0.0% 9.2% 11.9% 13.9% 8.7% 19.7% -4.1%
[0.007]** [0.008]** [0.008]** [0.008]** [0.008]** [0.008] [0.007]** [0.007]** [0.008]**40%-49% 22.5% 27.5% 19.0% 7.9% 17.2% 11.4% 13.7% 14.0% 15.0% 16.5% 27.5% 7.9%
[0.006]** [0.007]** [0.007]** [0.007]** [0.007]** [0.006]** [0.005]** [0.006]** [0.005]**50%-59% 18.6% 6.5% 6.6% 11.3% 8.3% 8.5% 4.1% -1.2% 9.7% 8.1% 18.6% -1.2%
[0.006]** [0.008]** [0.006]** [0.007]** [0.007]** [0.007]** [0.008]** [0.007] [0.006]**60%-69% 2.3% 17.2% 16.6% 40.8% 36.3% 10.4% 36.5% 36.5% 24.6% 24.6% 40.8% 2.3%
[0.010]* [0.007]** [0.005]** [0.006]** [0.006]** [0.008]** [0.011]** [0.009]** [0.009]**70%-79% 2.1% 0.5% 21.2% 38.3% 26.9% 25.0% 6.2% 23.6% -5.4% 15.4% 38.3% -5.4%
[0.009]* [0.011] [0.009]** [0.010]** [0.007]** [0.008]** [0.009]** [0.009]** [0.008]**80%-89% 7.6% 10.5% 10.5% 12.9% 12.2% 10.5% 17.4% 14.6% 14.3% 12.3% 17.4% 7.6%
[0.005]** [0.008]** [0.010]** [0.009]** [0.008]** [0.008]** [0.006]** [0.006]** [0.007]**90%-99% 11.5% 8.0% 15.6% 10.6% 10.3% 15.5% 13.9% 10.8% 17.7% 12.7% 17.7% 8.0%
[0.004]** [0.004]** [0.004]** [0.004]** [0.003]** [0.003]** [0.003]** [0.003]** [0.004]**100% 15.8% 11.2% 10.4% 7.9% 12.6% 7.8% 6.7% 13.7% 13.3% 11.0% 15.8% 6.7%
[0.002]** [0.003]** [0.002]** [0.002]** [0.002]** [0.002]** [0.002]** [0.002]** [0.002]**
Adjusted R2 0.548 0.538 0.543 0.528 0.538 0.537 0.518 0.551 0.548Observations 524,230 517,007 494,461 462,406 501,256 485,522 503,643 477,692 503,156
Notes:Standard errors in brackets (* significant at 5%; ** significant at 1%).Specification used includes controls for human capital and firm characteristics (see previous tables for definitions).
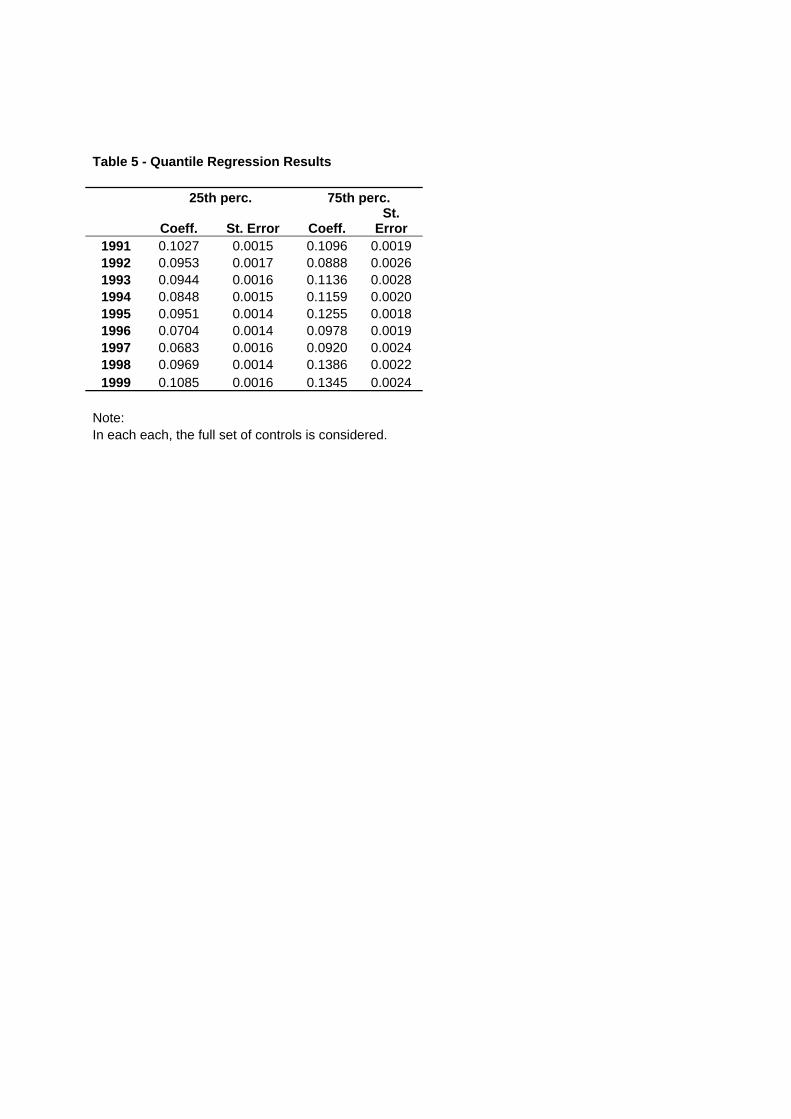
Table 5 - Quantile Regression Results 25th perc. 75th perc.
Coeff. St. Error Coeff. St.
Error 1991 0.1027 0.0015 0.1096 0.0019 1992 0.0953 0.0017 0.0888 0.0026 1993 0.0944 0.0016 0.1136 0.0028 1994 0.0848 0.0015 0.1159 0.0020 1995 0.0951 0.0014 0.1255 0.0018 1996 0.0704 0.0014 0.0978 0.0019 1997 0.0683 0.0016 0.0920 0.0024 1998 0.0969 0.0014 0.1386 0.0022 1999 0.1085 0.0016 0.1345 0.0024
Note: In each each, the full set of controls is considered.
25
Table 6 - Propensity Score Matching estimates
Year Estimate St. Error 1991 -2.36% 0.006 1992 0.31% 0.007 1993 1.30% 0.006 1994 -8.93% 0.010 1995 -0.44% 0.010 1996 -1.95% 0.013 1997 -0.14% 0.012 1998 1.09% 0.008 1999 0.17% 0.010
Average -1.22%
Note: Standard errors obtained via bootstrapping (50 repetitions)
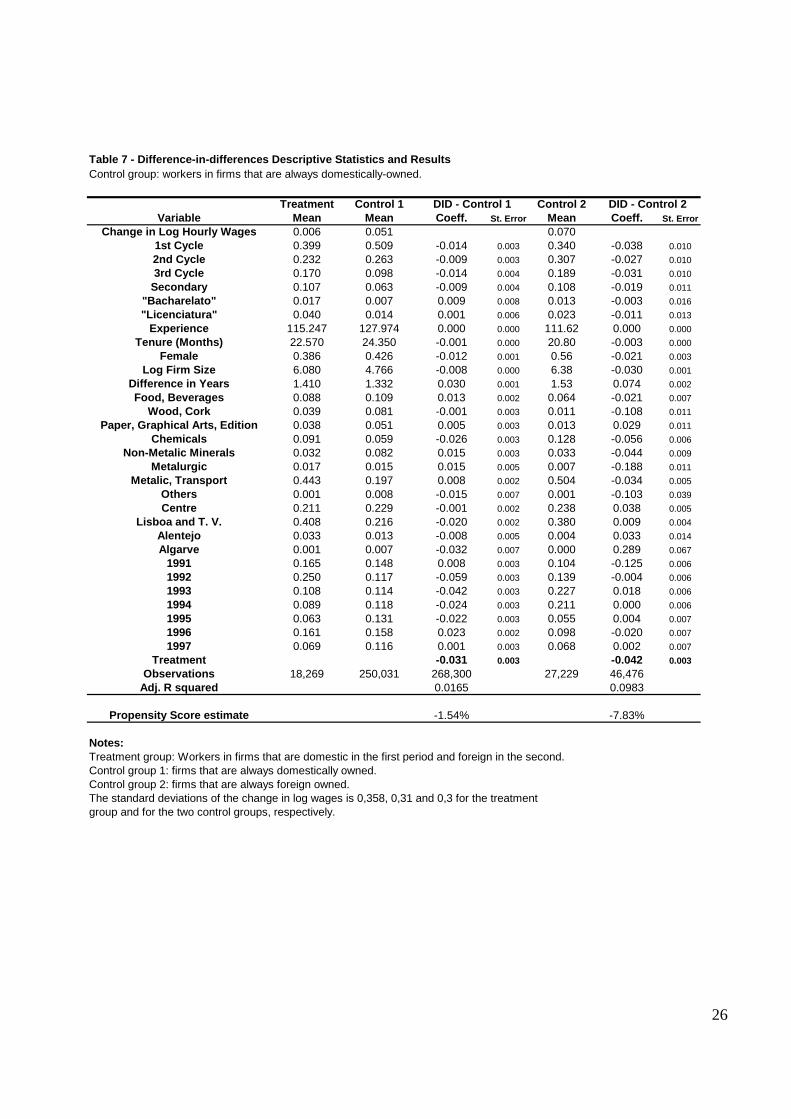
Table 7 - Difference-in-differences Descriptive Statistics and ResultsControl group: workers in firms that are always domestically-owned.
Treatment Control 1 Control 2Variable Mean Mean Coeff. St. Error Mean Coeff. St. Error
Change in Log Hourly Wages 0.006 0.051 0.0701st Cycle 0.399 0.509 -0.014 0.003 0.340 -0.038 0.0102nd Cycle 0.232 0.263 -0.009 0.003 0.307 -0.027 0.0103rd Cycle 0.170 0.098 -0.014 0.004 0.189 -0.031 0.010
Secondary 0.107 0.063 -0.009 0.004 0.108 -0.019 0.011"Bacharelato" 0.017 0.007 0.009 0.008 0.013 -0.003 0.016"Licenciatura" 0.040 0.014 0.001 0.006 0.023 -0.011 0.013
Experience 115.247 127.974 0.000 0.000 111.62 0.000 0.000Tenure (Months) 22.570 24.350 -0.001 0.000 20.80 -0.003 0.000
Female 0.386 0.426 -0.012 0.001 0.56 -0.021 0.003Log Firm Size 6.080 4.766 -0.008 0.000 6.38 -0.030 0.001
Difference in Years 1.410 1.332 0.030 0.001 1.53 0.074 0.002Food, Beverages 0.088 0.109 0.013 0.002 0.064 -0.021 0.007
Wood, Cork 0.039 0.081 -0.001 0.003 0.011 -0.108 0.011Paper, Graphical Arts, Edition 0.038 0.051 0.005 0.003 0.013 0.029 0.011
Chemicals 0.091 0.059 -0.026 0.003 0.128 -0.056 0.006Non-Metalic Minerals 0.032 0.082 0.015 0.003 0.033 -0.044 0.009
Metalurgic 0.017 0.015 0.015 0.005 0.007 -0.188 0.011Metalic, Transport 0.443 0.197 0.008 0.002 0.504 -0.034 0.005
Others 0.001 0.008 -0.015 0.007 0.001 -0.103 0.039Centre 0.211 0.229 -0.001 0.002 0.238 0.038 0.005
Lisboa and T. V. 0.408 0.216 -0.020 0.002 0.380 0.009 0.004Alentejo 0.033 0.013 -0.008 0.005 0.004 0.033 0.014Algarve 0.001 0.007 -0.032 0.007 0.000 0.289 0.067
1991 0.165 0.148 0.008 0.003 0.104 -0.125 0.0061992 0.250 0.117 -0.059 0.003 0.139 -0.004 0.0061993 0.108 0.114 -0.042 0.003 0.227 0.018 0.0061994 0.089 0.118 -0.024 0.003 0.211 0.000 0.0061995 0.063 0.131 -0.022 0.003 0.055 0.004 0.0071996 0.161 0.158 0.023 0.002 0.098 -0.020 0.0071997 0.069 0.116 0.001 0.003 0.068 0.002 0.007
Treatment -0.031 0.003 -0.042 0.003Observations 18,269 250,031 268,300 27,229 46,476
Adj. R squared 0.0165 0.0983
Propensity Score estimate -1.54% -7.83%
Notes:Treatment group: Workers in firms that are domestic in the first period and foreign in the second.
DID - Control 2DID - Control 1
Control group 1: firms that are always domestically owned.Control group 2: firms that are always foreign owned.The standard deviations of the change in log wages is 0,358, 0,31 and 0,3 for the treatmentgroup and for the two control groups, respectively.
26