do gender quotas influence women’s representation and policies? november, 2009 li-ju chen
TRANSCRIPT

Do Gender Quotas Influence Women’s Representation and Policies?
November, 2009
Li-Ju Chen

2
• Outline
1. Motivation
2. Background
- What are quotas?
- The world of quotas
3. Empirical strategy and data
4. Results
5. Robustness check
6. Summary

3
1. Motivation
Average Proportion of Women in National Parliaments (%)
Single House or lower House
Nordic countries 41.4
Americas 20.7
Europe-OSCE member countries
Excluding Nordic countries
19.0
Sub-Saharan Africa 17.3
Asia 16.9
Pacific 12.9
Arab States 9.6
Source: Inter-Parliamentary Union (IPU), March 2008

4
Women in National Parliaments (%)
Rank Country Single House or lower House
Rank Country Single House or lower House
1 Rwanda 48.8 11 Belgium 35.3
2 Sweden 47.0 12 Mozambique 34.8
3 Finland* 41.5 13 Iceland 33.3
4 Argentina 40.0 14 New Zealand 33.1
5 Netherlands 39.3 15 South Africa 33.0
6 Denmark* 38.0 16 Austria 32.8
7 Costa Rica 36.8 17 Germany 31.6
8 Spain 36.6 18 Uganda 30.7
9 Norway 36.1 19 Burundi 30.5
10 Cuba* 36.0 20 United Republic of Tanzania
30.4
Source: IPU, March 2008
5
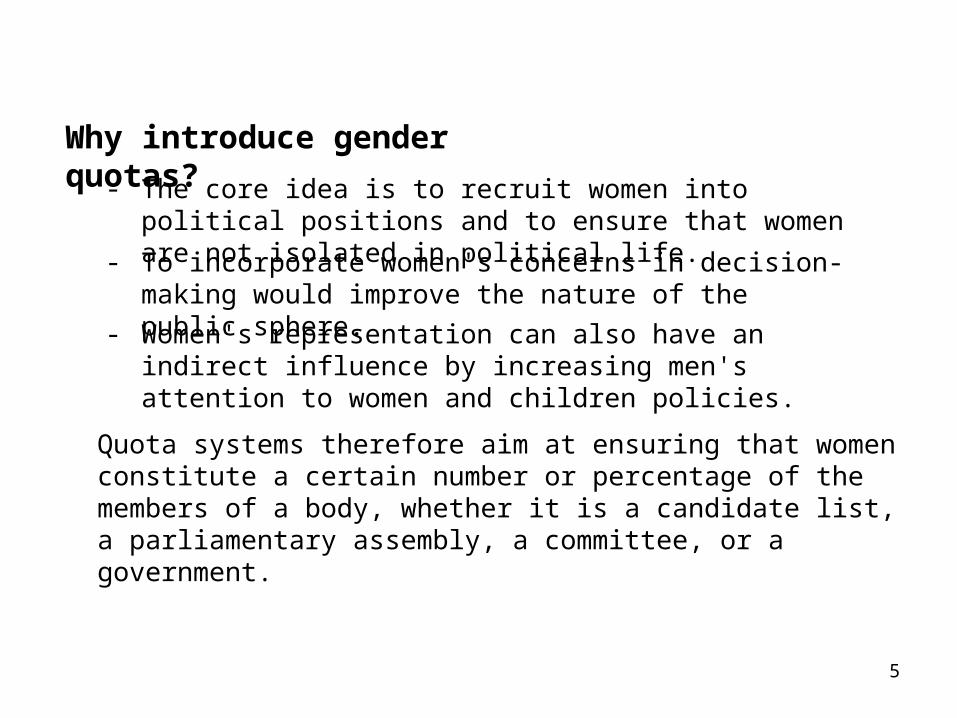
Quota systems therefore aim at ensuring that women constitute a certain number or percentage of the members of a body, whether it is a candidate list, a parliamentary assembly, a committee, or a government.
Why introduce gender quotas?
- The core idea is to recruit women into political positions and to ensure that women are not isolated in political life.
- To incorporate women's concerns in decision-making would improve the nature of the public sphere.
- Women's representation can also have an indirect influence by increasing men's attention to women and children policies.
6
- Pande (2003) and Chattopadhyay and Duflo (2004).
Theoretically, if the candidates could not commit to implement specific policies once elected, the identity of the legislator matters for policy determination. This influence in policy increases as there is increasing political representation of a group.
- Besley and Coate (1997) and Osborne and Slivinski (1996)
Empirically, the studies focus on the effect of political reservations on policy outcomes in the cases of individual country.
Do quotas work as well in general?

7
1. The fraction of female legislators in countries after adopting gender quotas is 5.03 percentage points higher than that in countries without any type of gender quotas.
2. Counties after applying gender quotas give the weight of government expenditure on social welfare 3.83 percentage points higher than those countries without gender quotas on average.
3. An increase in the share of female legislators by one percentage point increases 0.67 percentage points the ratio of government expenditure on social welfare to GDP.
Main findings:

8
2. Background – what are quotas? Quotas for women are a form of affirmative action to help them overcome the obstacles that prevent them from entering politics in the same way as their male colleagues.
- Voluntary party quotas
- Legal gender quotas
adopted voluntarily by political parties, which are set by the parties themselves to guarantee the nomination of a certain number or proportion of women.
mandated either by the constitution or by the electoral law, obliging all political entities participating in elections to apply them equally.
International Institute for Democracy and Electoral Assistance
9
2. Background – the world of quotas Dahlerup (2006) defines two different tracks to equal political representation for women and men
- The incremental track
- The fast track
rests on a gradual increase in women's overall resources and on gradual historical changes in the perceptions of womanhood.
represents a historical leap forward in women's representation in parliaments.

10
2. Background – the world of quotas - The incremental track
1. Nordic countries:
2. Western Europe, North America, Australia and New Zealand:
- Quotas were not introduced among these countries until women had already reached about 25% of the seats in 1980s.
- No legal quotas in Nordic countries force all political parties to nominate a certain minimum of women on their lists.
- Only some political parties and today only in Norway, Iceland and Sweden have quotas for public election.
- Political parties and national legislatures across the region have taken steps over the last 20 years to promote women's access to political office through party quotas and legal quotas.
- There are only two countries with legal quotas

11
2. Background – the world of quotas - The fast track
3. The Beijing Platform in 1995 has been very influential, and women's movements all over the world have attempted to give the controversial demand for gender quotas legitimacy by referring to the Platform for Action.
2. In 1990 the UN Economic and Social Council endorsed a target of 30% women in decision-making positions in the world by 1995. However, only 10% of the world's parliaments are women in 1995.
1. In line with this conception of women's under-representation, mandated quotas for the recruitment and election of female candidates are needed.
4. Examples: Latin America, African countries
12
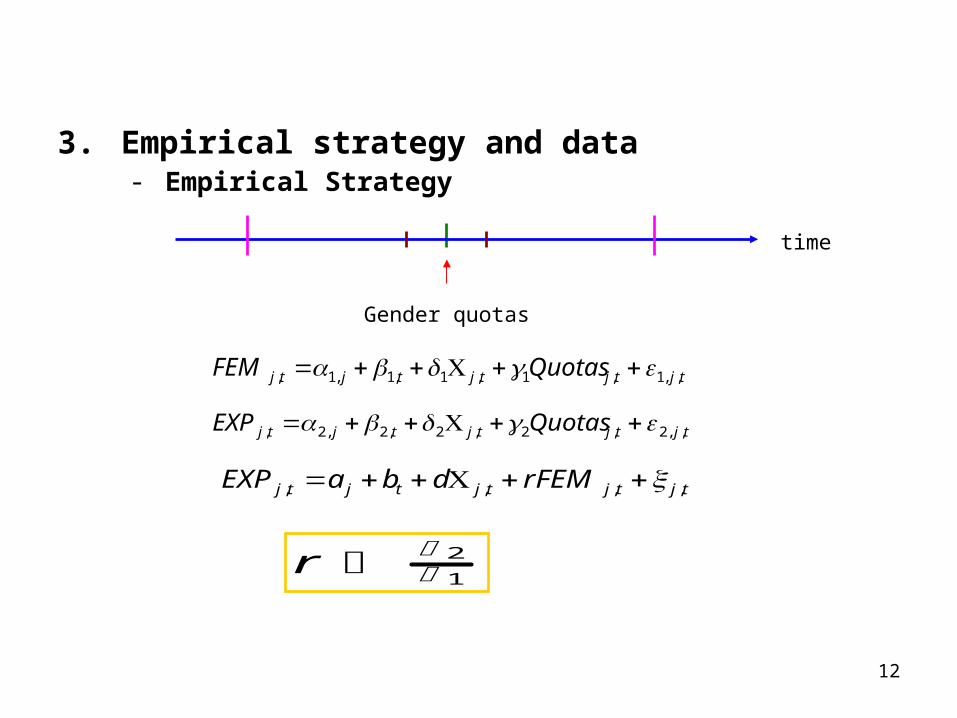
- Empirical Strategy
Gender quotas
time
r 2 1
tjtjtjtjtj rFEMdbaEXP ,,,,
tjtjtjtjtj QuotasFEM ,,1,1,1,1,1,
tjtjtjtjtj QuotasEXP ,,2,2,2,2,2,
3. Empirical strategy and data

13
- Data
covers 103 countries between 1970 and 2006
22 countries with legal gender quotas
47 countries with voluntary party quotas
43 countries without any type of gender quotas
gender quotas: International IDEA
female legislators: IPU
policy outcomes: Government Finance Statistics (GFS) Yearbook issued by IMF
3. Empirical strategy and data

14
Source: Government Finance Statistics Manual 2001

15
4. Results – mean level of female legislators (%)
Female Legislators
with OECD countries without OECD countries
Before After Observations Before After Observations
Quotas 6.24 18.41 56 5.82 14.45 38
(0.76) (1.36) (0.94) (1.15)
Party quotas 6.86 19.46 47 6.71 14.93 29
(0.87) (1.52) (1.16) (1.34)
Legal quotas 4.21 18.41 22 3.62 14.67 19
(0.79) (1.36) (0.56) (1.94)
No quotas 6.23 12.12 43 5.98 11.01 40
(1.06) (1.37) (1.07) (1.26)
Note: standard errors in parentheses.

Note: standard errors in parentheses.
Dependent Variable Female Legislators General Public Services Defense Health
(1) (2) (1) (2) (1) (2) (1) (2)
Quotas 5.034 - 1.684 - -.567 - .881 -
(1.710)*** (1.092) (.728) (.559)
Party Quotas - 4.184 - 1.828 - -.105 - 1.018
(1.828)** (.939)* (.701) (.499)**
Legal Quotas - 2.325 - .948 - -.413 - -.561
(2.369) (1.314) (.730) (.604)
R2 0.24 0.24 0.04 0.05 0.02 0.02 0.05 0.07
Observations 94 94 94 94 94 94 94 94
Dependent Variable Education Housing Economic Affairs Social Welfare
(1) (2) (1) (2) (1) (2) (1) (2)
Quotas .156 - -.458 - 1.508 - 3.383 -
(.793) (.383) (1.406) (1.189)***
Party Quotas - .242 - -.476 - 1.465 - 3.545
(.699) (.343) (1.275) (1.033)***
Legal Quotas - -.228 - .015 - .216 - -.548
(.646) (.212) (1.413) (.999)
R2 0.06 0.06 0.05 0.06 0.08 0.08 0.13 0.14
Observations 94 94 94 94 94 94 94 94
4. Result – Reduced form effect

17Note: standard errors in parentheses.
4. Result – IV approachGeneral Public Services Defense Health Education
(1) (2) (1) (2) (1) (2) (1) (2)
Fem .334 .390 -.113 -.055 .175 .115 .031 .019
(.233) (.210)* (.154) (.111) (.113) (.109) (.133) (.139)
IV
Gender quotas Y - Y - Y - Y -
Party & Legal quotas - Y - Y - Y - Y
p-value 0.108 0.447 0.091 0.813
Observations 94 94 94 94 94 94 94 94
(# of countries) 94 94 94 94 94 94 94 94
Housing Economic Affairs Social Welfare
(1) (2) (1) (2) (1) (2)
Fem -.091 -.077 .299 .262 .672 .533
(.060) (.068) (.259) (.241) (.322)** (.277)*
IV
Gender quotas Y - Y - Y -
Party & Legal quotas - Y - Y - Y
p-value 0.093 0.253 0.002
Observations 94 94 94 94 94 94
(# of countries) 94 94 94 94 94 94

18
5. Robustness check- Does civil war matter?
Control for War
Exclude African countries / Exclude Latin American countries
Female Legislators Social Welfare
(1) (2) (3) (4) (1) (2) (3) (4)
Quotas 5.034 4.801 5.136 6.116 3.383 3.378 3.924 4.533
(1.710)*** (1.691)*** (2.009)** (2.211)*** (1.189)*** (1.213)*** (1.427)*** (1.758)**
War - Y - - - Y - -
Africa Y Y N N Y Y N N
Latin America Y Y Y N Y Y Y N
R2 0.24 0.30 0.24 0.29 0.13 0.13 0.15 0.18
Observations 94 94 78 62 94 94 78 62
(# of countries) 94 94 78 62 94 94 78 62

19
5. Robustness check- Do OECD countries drive the results?
Dependent Variable Female Legislators Social Welfare
(1) (2) (1) (2)
Quotas 3.113 - 1.924 -
(1.813)* (.714)***
Party Quotas - .718 - 2.316
(1.937) (.761)***
Legal Quotas - 6.561 - -.549
(2.370)*** (.867)
R2 0.10 0.19 0.11 0.14
Observations 73 73 73 73
(# of countries) 73 73 73 73
Note: standard errors in parentheses.

20
General Public Services Defense Health Education
(1) (2) (1) (2) (1) (2) (1) (2)
Fem .272 .028 -.340 -.105 .076 -.024 -.128 -.028
(.408) (.246) (.346) (.122) (.109) (.061) (.165) (.084)
IV
Gender quotas Y - Y - Y - Y -
Party & Legal quotas - Y - Y - Y - Y
p-value 0.483 0.233 0.468 0.407
Observations 73 73 73 73 73 73 73 73
(# of countries) 73 73 73 73 73 73 73 73
Housing Economic Affairs Social Welfare
(1) (2) (1) (2) (1) (2)
Fem -.136 -.022 .062 .089 .618 .021
(.128) (.047) (.411) (.210) (.406) (.116)
IV
Gender quotas Y - Y - Y -
Party & Legal quotas - Y - Y - Y
p-value 0.195 0.884 0.007
Observations 73 73 73 73 73 73
(# of countries) 73 73 73 73 73 73
Note: standard errors in parentheses.
21
5. Robustness check- Do trends matter?
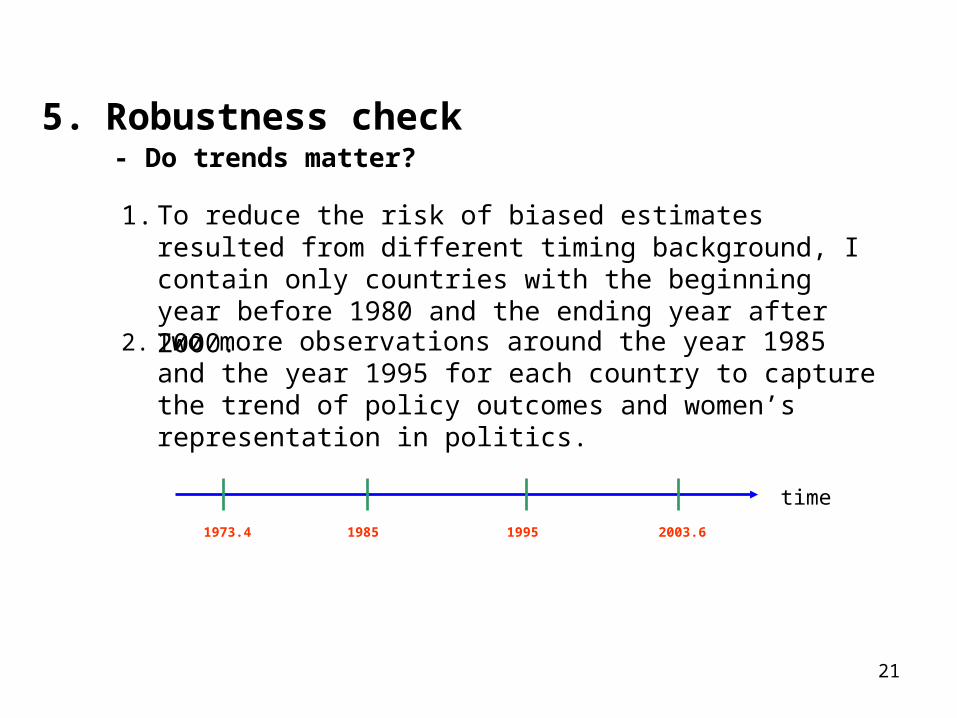
1. To reduce the risk of biased estimates resulted from different timing background, I contain only countries with the beginning year before 1980 and the ending year after 2000.
2. Two more observations around the year 1985 and the year 1995 for each country to capture the trend of policy outcomes and women’s representation in politics.
time
1973.4 1985 1995 2003.6

22
5. Robustness check- Do trends matter?
2.3928572.3928572.3928572.3928572.3928572.3928572.3928572.3928572.3928572.3928572.3928572.3928572.3928572.3928573.2071433.2071433.2071433.2071433.2071433.2071433.2071433.2071433.2071433.2071433.2071433.2071433.2071433.207143
5.8114295.8114295.8114295.8114295.8114295.8114295.8114295.8114295.8114295.8114295.8114295.8114295.8114295.811429
9.3759.3759.3759.3759.3759.3759.3759.3759.3759.3759.3759.3759.3759.375
6.0352946.0352946.0352946.0352946.0352946.0352946.0352946.0352946.0352946.0352946.0352946.0352946.0352946.0352946.0352946.0352946.0352946.0352946.0352946.0352946.0352946.0352946.0352946.0352946.0352946.0352946.0352946.0352946.0352946.0352946.0352946.0352946.0352946.035294
9.9212129.9212129.9212129.9212129.9212129.9212129.9212129.9212129.9212129.9212129.9212129.9212129.9212129.9212129.9212129.9212129.9212129.9212129.9212129.9212129.9212129.9212129.9212129.9212129.9212129.9212129.9212129.9212129.9212129.9212129.9212129.9212129.921212
15.252515.252515.252515.252515.252515.252515.252515.252515.252515.252515.252515.252515.252515.252515.252515.252515.252515.252515.252515.252515.252515.252515.252515.252515.252515.252515.252515.252515.252515.252515.252515.2525
20.6820620.6820620.6820620.6820620.6820620.6820620.6820620.6820620.6820620.6820620.6820620.6820620.6820620.6820620.6820620.6820620.6820620.6820620.6820620.6820620.6820620.6820620.6820620.6820620.6820620.6820620.6820620.6820620.6820620.6820620.6820620.6820620.6820620.68206
05
10
15
20
Avera
ge
pro
po
rtio
n o
f fe
ma
le legis
lato
rs (
%)
1970 1980 1990 2000 2010year
control group treatment group
A finer set of sample countries and two more observations The panel dataset covers 49 countries 12 countries w/ legal gender quotas 29 countries w/ voluntary party quotas 15 countries w/o any type of gender quotas

23
5. Robustness check- Do trends matter?
Note: standard errors in parentheses.
Dependent Variable Female Legislators General Public Services Social Welfare
(1) (2) (1) (2) (1) (2)
Quotas 4.459 - 2.380 - 1.246 -
(1.780)** (.922)** (.558)**
Party Quotas - 5.593 - 1.506 - 1.325
(1.707)*** (.791)* (.583)**
Legal Quotas - 3.018 - 2.232 - .131
(2.463) (1.251)* (.704)
R2 0.82 0.83 0.65 0.64 0.86 0.86
Observations 189 184 189 184 189 184
(# of countries) 48 47 48 47 48 47

24
5. Robustness check- Do trends matter?
Note: standard errors in parentheses.
General Public Services Social Welfare
(1) (2) (1) (2)
Fem .534 .334 .279 .210
(.256)** (.142)** (.122)** (.081)***
IV
Gender quotas Y - Y -
Party & Legal quotas - Y - Y
Observations 189 184 189 184
(# of countries) 48 47 48 47

25
6. Conclusion
• The contribution of this study is to investigate the political reservation effect for women on cross-country data.
• Gender quotas may influence the types of policy outcomes through its effect on the proportion of female legislators. The increasing representation of women in politics raises the influence on government spending decisions, especially those issues related to women's traditional role in family, i.e. social welfare.
• Keep tracking the data would facilitate investigation of the effect of women in politics on policy outcomes because female legislators in countries with the fast track of gender equality may not yield their effect on policy decision making yet.