do groups fall prey to the winner’s curse? - zora.uzh.ch filewe gratefully acknowledge financial...
TRANSCRIPT

Institute for Empirical Research in Economics University of Zurich
Working Paper Series
ISSN 1424-0459
Working Paper No. 504
Do groups fall prey to the winner’s curse?
Marco Casari, Jingjing Zhang and Christine Jackson
September 2010

DO GROUPS FALL PREY TO THE WINNER’S CURSE? *
Marco Casari
Jingjing Zhang
Christine Jackson
Abstract
In a company takeover experiment, groups placed better bids than individuals and substantially
reduced the winner’s curse. This improvement was mostly due to peer pressure over the minority
opinion and to group learning. Learning took place from interacting and negotiating consensus
with others, not simply from observing their bids. When there was disagreement within a group,
what prevailed was not the best proposal but the one of the majority. Groups underperformed
with respect to a “truth wins” benchmark although they outperformed individuals deciding in
isolation. We draw general lessons about when to employ groups instead of individuals in
intellectual tasks.
JEL Classifications : C91, C92, D03, D81
Keywords: winner’s curse, takeover game, group decision making, communication, experiments
* Corresponding Authors: M. Casari, University of Bologna, Department of Economics, Piazza Scaravilli 2, 40126 Bologna, Italy, phone +39-051-209 8662, [email protected]; J. Zhang, Chair for Organizational Design, Institute for Empirical Research in Economics, University of Zurich, Blümlisalpstrasse 10, CH-8006, Zürich, [email protected]; C. Jackson, Purdue University, Krannert School of Management, 403 W. State St., W. Lafayette, IN 47906-2056, [email protected]. We gratefully acknowledge financial support from the European Research Council (ERC Advanced grant, ESEI-249433). We thank Anya Savikhin for valuable research assistance, Tim Cason for comments on an earlier version of the paper as well as seminar participants at the IMEBE meeting in Alicante, Spain, the 2008 ESA meeting in Tucson, AZ, and Bocconi University, Italy.

2
1 Introduction
The winner’s curse indicates a large overbidding in common-value auctions that likely
leads to an expected loss for the auction winner. Experimental data has documented its
persistence in controlled situations (Kagel and Levin, 2002) and field evidence has been
accumulated for a variety of economic situations, from mineral right auctions (Capen et al.,
1971), to baseball’s free agency market (Belcherman and Camerer, 1998), to IPOs pricing
(Levis, 1990) and to corporate takeovers (Roll, 1986). Investigations based on field data have
been unable to pin down the origin of the winner’s curse or to identify public policies or
managerial procedures to lessen its impact. However, through laboratory experiments one can
cleanly control the cost and information structure of the interaction in ways unavailable in the
field.
Accordingly, we designed an experiment to understand if groups are able to overcome
this robust behavioral bias better than individuals bidding in isolation. Two previous studies
found that groups did not help to overcome the winner’s curse in auctions with a common-value
component (Cox and Hayne, 2006, Sutter et al., 2009). This paper takes a fresh look at the issue
through the company takeover game introduced by Samuelson and Bazerman (1985). The
essential features of the winner’s curse exist in the company takeover game, which presents a
much simpler environment than a multi-person auction and hence may provide cleaner evidence
(Charness and Levin, 2009). Optimal bidding in auctions depends on involved calculations,
belief about other’s rationality, and on strategic uncertainty, which are absent in our company
takeover game with a robot seller.1
1 “the origin of this phenomenon [winner’s curse] must stem from some form of bounded rationality, such as the decision maker’s failure to recognize that a “future” event, per se, is informative and relevant for their current decisions, compounded by poor updating when this idea is even considered.” Charness and Levin (2009).
To the best of our knowledge, this is the first experiment
investigating groups’ behavior in a company takeover game.

3
In the company takeover game, a potential buyer makes a take-it-or-leave-it offer to a
potential seller to acquire the target company. The seller can either accept or reject the offer. The
seller will accept the offer if and only if it is higher than the company value to him. What makes
the interaction non-trivial is that the seller has more accurate information than the buyer about
the value of the company and is aware that the company will be worth 50% more under the
management of the buyer. The seller knows the company value while the buyer knows the set of
possible values, where each value may occur with equal probability.
In bidding, the buyer should consider the expected value of the company, when acquired.
Importantly, companies that are worth more to the seller than the buyer’s bid will never be
transferred to the buyer. As a consequence, the expected value of the company acquired is
conditional on the bid, because lowering the bid causes an adverse-selection in the values of the
companies that will be acquired. In practice, many bids are around the unconditional expected
value of the company, which yields lower expected profits and, in some settings, systematic
losses. Several studies in management and economics have found a remarkably robust winner’s
curse in company takeover experiments (e.g., Charness and Levin, 2009, Bereby-Meyer and
Grosskopf, 2008).
We adhered to the state-of-the-art of group experiments and compared treatments with
individual versus group choices. The design allows both within and between subject comparisons
in order to detect whether differences come from learning, aggregation of preferences, or both.
Moreover, we recorded and coded messages exchanged by group members, following the
methodology of content analysis (Krippendorf, 2004) and improving upon Cooper and Kagel
(2005). The experiment presents several innovative features. First, before the discussion stage,
each participant was required to post a bid proposal, a feature that saves discussion time and
4
prevents shy members from being silenced. This piece of information allows us to perform an
individual-level analysis of the group process for reaching a consensual choice. One can count
the frequency of each aggregation rule in the groups and see if what emerged was the best
proposal (truth-wins norm), the median proposal, the proposal of the majority, the worst
proposal, a rotation scheme, or other rules. Second, we investigate what aspects of group
decision-making affect performance, whether it is the simple exposure to diversity or group
communication and negotiation. In a signal treatment, subjects could observe the bids of two
other participants from the past sessions, without the option of discussing or the need of
negotiating choices with them. In a group treatment, instead of individuals acting alone, groups
of three members, who could chat and exchange bid proposals, submitted a joint bid. Third, in
the group treatment, we granted veto power to each group member. If there was disagreement on
the group choice after three attempts, everyone in the group earned zero. This generates strong
incentives to communicate and to negotiate within a group. 2
2 Existing studies of group decision making greatly differ on this point, which crucial affects the incentives for communicating with others and for convincing them of one's opinion (Zhang and Casari, 2009). Cooper and Kagel (2005) randomly select one member’s proposal as the group choice. Blinder and Morgan (2005) and Gillet et al. (2009) either implement a majority rule or give members no time limit to reach a unanimous decision. Kocher and Sutter (2007) is the most closely related paper with a veto power feature. In a gift-exchange game, Kocher and Sutter allowed groups of three up to 10 rounds to reach agreement. If there was no agreement in the 10th round, each group member received only a show-up fee of $20. Only one group failed to reach an agreement. They didn’t analyze the effect of such veto power though. Kagel et al. (2010) studied the veto power in a committee where only one of the three committee members is a veto player.
Lastly, we also isolate the group
effect on the task per se from the shift in risk attitude by measuring the extent of risky shift from
individual to group decision making. We report that groups substantially reduced the winner's
curse and generally placed better bids than individuals deciding in isolation. Groups
underperformed with respect to a “truth wins” benchmark (Lorge and Solomon, 1955), although
they outperformed individuals. This result was attributed to both the effect of group learning and
the aggregation rule within the group. When there was disagreement within a group, what

5
prevailed was not the best but the opinion of the majority. This result is not an unconditional
endorsement of the superiority of groups over individuals, but leads to punctual implications
about when to employ groups and when to employ individuals in decision making.
The remainder of the paper is organized as follows. Section 2 reviews literature on the
winner’s curse and group decision-making. Section 3 describes theoretical predictions,
experimental design and procedures for the present study, and section 4 reports the main results
of our study. Section 5 examines alternative explanations for the superiority of groups over
individuals, while section 6 analyzes the content of group communication during the company
takeover task. Section 7 concludes with practical implications of the study findings.
2 Literature Review
The present study draws from both the literature on the winner’s curse and group
decision-making in order to support our proposition that individuals working in a group are less
likely to fall victim to the winner’s curse than individuals working alone. We will review both
literatures relevant to this proposition, starting with the winner’s curse. The main experimental
finding of the common value auction literature is that the winner’s curse is a robust phenomenon
in many auction formats (Kagel and Levin, 2002). The literature further argues that such
persistent losses (or below-normal profits) are not part of any equilibrium behavior with fully
rational bidders and that the winner's curse would eventually correct itself given sufficient time
and the right kind of information feedback. In practice, though, most of the adjustment toward
the rational strategy happens through market learning as the less skilled firms and bidders go
bankrupt and exit the market (Casari et al., 2007, Kagel and Levin, 1986). The brutal force of
market selection intervenes because individual learning is much slower than market forces. One

6
way around this intervention could be to study group decision makers in the absence of market
selection. This paper examines the conditions under which groups will eventually learn to avoid
the winner's curse in the setting of a company takeover. We review eight experimental studies
that have utilized the company takeover game in the economics and management literature.3
In the experiment, we followed the state-of-the art design features for company takeover
studies. First, some studies place the equilibrium bid at the corner of the choice space, either at
0% or 100%, or in the middle at 50%.. We changed this to avoid classifying noisy players as
mostly out of equilibrium or mostly at equilibrium (Holt and Sherman, 1994, Selton et al., 2005).
Second, most of the studies on the company takeover game found a very high share of sub-
optimal bids, suggesting that the task is well beyond the ability of participants to solve it.
Following Charness and Levin (2009), in our experiment the task was simplified by adopting a
discrete and small set of company values for the seller. Third, existing studies have varied in
repeating the task from 1 to 100 but generally have found that a very slow improvement in
performance with repetition. We had participants repeat the task 26 times, which still allowed us
to detect learning. Fourth, all studies used robot sellers, so do we, with the exception of Carroll et
al. (1990, treatments 5 and 6 only).
In
all of these studies, decision makers were individuals. In none of them, does the winner’s curse
disappear with a reasonable amount of experience and feedback. Indeed, individuals in these
studies failed to avoid the winner's curse even when they were paid for good performance, when
their intellectual reputations were at stake, when they were given hints, and when unusually
analytical participants were used.
The group decision-making literature provides some insights into group performance
3 Ball, Bazerman, Carroll (1991), Charness and Levin (2009), Holt and Sherman (1994), Selton, Abbink, and Cox (2005), Bereby-Meyer and Grosskopf (2008), Grosskopf, Bereby-Meyer, Bazerman (2007), Carroll, Delquie, Halpern, Bazerman (1990), Tor and Bazerman (2003).
7
relative to individuals on a task such as the company takeover game. The psychological literature
on group versus individual decision-making distinguishes between judgmental and intellective
tasks. A judgemental task involves problems where there is no obvious “correct” action and
individuals may legitimately differ on their choices because of their values or preferences. An
example of this task is choice under risk (Stoner, 1961), ultimatum games (Bornstein and Yaniv,
1998) and the dictator game (Cason and Mui, 1997). In a review of individuals’ and groups’
resistance to judgmental biases, Kerr and his colleagues found that groups may actually amplify
rather than suppress judgmental biases regarding errors in how information is used, errors caused
by overlooking useful information, and errors caused by a reliance on mental rules of thumb that
oversimplify the decision (Kerr et al., 1996). In contrast, an intellective task has a demonstrably
“correct” solution. While this solution may be difficult to discover, it is self-explanatory once
discovered and can easily be demonstrated to others (Cooper and Kagel, 2005). We argue that
the company takeover game is closer to an intellective task because once a subject understands
what the optimal bid is; it is straight forward to explain it to others. In comparing individual and
group performance, Lorge and Solomon (1955) proposed to replace absolute performance of the
group with the “truth wins” benchmark (i.e., the group should be able to achieve a correct answer
if at least one member would have chosen it in isolation). Thus, if a fraction p of individuals
working alone reaches the correct solution, the probability that in a randomly selected group of n
persons at least one knows it is 1 – (1-p) n. The truth wins benchmark sets a higher standard for
the group superiority than absolute performance. While the management literature on intellective
tasks suggests that the absolute performance of groups is superior to the performance of
individuals (Laughlin et al., 2003), research on group performance in the psychology literature
documents that freely interacting groups very rarely exceed and usually fall below the truth wins

8
standard (Davis, 1992).
Results from experimental economics on group performance in intellective tasks are
more mixed. In a beauty-contest game, Kocher and Sutter (2005) found that groups of three
subjects did not do more iteration of reasoning than individuals, but learned faster than
individuals via face to face communication. In a common value auction, Cox and Hayne (2006)
documented that groups of five subjects who could talk face to face fell prey to the winner’s
curse to a similar extent than individuals or more, depending on the treatment. More precisely,
groups underperformed individuals when group members had to exchange more information. In
an ascending sealed-bid English auction with both private and common value components, Sutter
et al. (2009) reported that groups of three who submited a joint bid after face to face
communication were more likely to fall prey to the winner’s curse. Apparently, groups
competing with other groups in auctions are more “aggressive” than individuals competing with
other individuals. Our experiment eliminates the interaction between bidders by using a robot
seller who accepts the buyer’s bid as long as it is equal or higher than the company value.
Moreover, with a company takeover game it is easier for bidders to explain to others the
rationale for the optimal bid than in the common value auction, because there is no need to
consider the bids of other potential buyers.4
4 A typical quote on reasoning of the optimal bid in the company takeover game is: “let’s not go with 90 because the only way we can make money is if its [the company value] 90. [the company value] might as well go with 60, it came out less times, and if 38 comes out we don’t lose as much and 60 makes the most economic sense.”
In signalling games, Cooper and Kagel (2005, 2009)
reported that teams of two play more strategically than individuals after exchanging messages in
online chatrooms and a change in the meaningful context of the game stalled individual learning
process but had no effect on the strategic play of teams. Cooper and Kagel (2005, 2009)
conclude that teams of two outperformed the truth win benchmark using a simulation of team
play based on randomly drawing two individuals from the individual treatment. Instead of
9
relying on simulated data, our within-subject design allows us to count the instances in which the
optimal proposal from the individual member prevailed to a final group choice. Also, we
examined team play in groups of three rather than two, which permits interesting majority or
minority behaviour.
3 Predictions, Experimental Design and Procedures
The experiment is framed as a company takeover game where there is a buyer and a seller
who move sequentially (Samuelson, 1984, Samuelson and Bazerman, 1985). The buyer makes a
take-it-or-leave-it offer b∈{0, 1, 2,…,360} to a seller whose company’s value is s. The seller
either rejects or accepts the bid. The payoffs for the seller are s if she rejects and b if she accepts.
The payoffs for the buyer are 0 if the seller rejects and (1.5s – b) if she accepts. The company
can have five possible values, s∈{38, 60, 90, 130, 240}. When making a decision, the seller has
private information about s, while the buyer knows that each realization of s has equal
probability.
Hence, the task is a bilateral bargaining problem with asymmetric information and
valuations. The informational disadvantage of the buyer is offset by an assumption that the
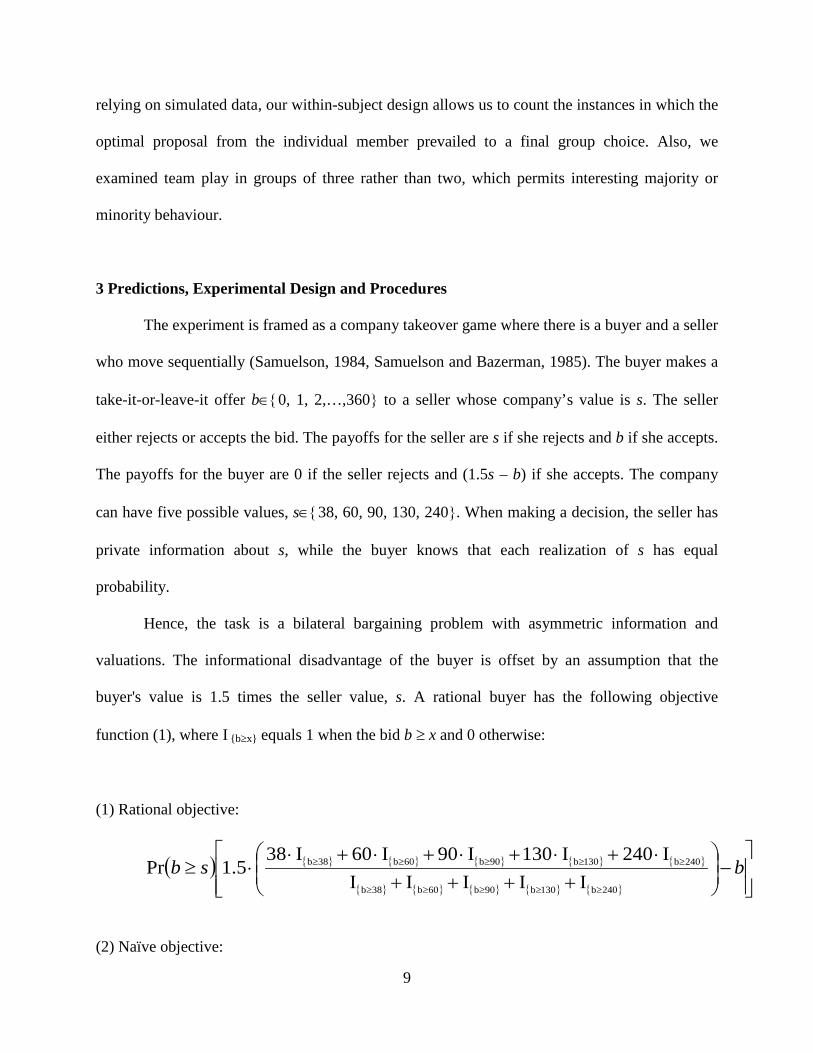
buyer's value is 1.5 times the seller value, s. A rational buyer has the following objective
function (1), where I {b≥x} equals 1 when the bid b ≥ x and 0 otherwise:
(1) Rational objective:
( ) { } { } { } { } { }
{ } { } { } { } { }
−
++++⋅+⋅+⋅+⋅+⋅
⋅≥≥≥≥≥≥
≥≥≥≥≥ bsb240b301b09b60b38b
240b301b09b60b38b
IIIIII240I130I90I60I38
5.1Pr
(2) Naïve objective:

10
( )
−
++++⋅≥ bsb
52401309060385.1Pr
A bid of 60 is the risk-neutral Nash equilibrium (RNNE) strategy for the buyer and yields
an expected profit of 5.4. Table 1 shows buyer’s profits for the RNNE strategy and other bidding
strategies. Instead, an incorrect reasoning may lead some participants to bid 90 and earn an
expected profit of 2.4, which is sub-optimal. We computed this prediction following the Holt and
Sherman (1994) model of naïve bidding (2) in order to select a design for the experiment with a
rational bid lower than the naïve bid. A naïve bidder does not condition the value of the company
on the level of the accepted bid, rather, assumes that the value is always the expected value of s,
which is 111.6. As illustrated by the objective (2), a naïve bidder erroneously thinks a bid of 90
would yield an expected profit of 0.6⋅(1.5⋅111.6 – 90)=46.44. Instead, when placing a bid of 90,
the company is sold only for values s 38, 60, 90 but not for 130 and 240. As illustrated by (1),
the expected value conditional on being accepted is not 111.6, but (38+60+90)/3 = 62.66. Thus,
the expected profit is 2.4 (Table 1). When the buyer does not take into account that acceptance is
itself an informative event, the buyer may overbid and even incur an expected loss.
The possible company values for the present study were chosen to satisfy some
requirements. First, to make the task easier to tackle, it has only a discrete number of company
values; two pilot experiments suggested that with three values the task was too easy for our
subject pool and with one hundred values it was too difficult. Second, in order to ensure that the
participants were engaged in the task, it was necessary to have an RNNE bid with a substantial
probability of acquiring the company. In our design, this probability was set to 40%. Third, to
ensure that the naïve bid was higher than the rational bid; after fixing the lower four company
values one needs to add a very high maximum company value; we decided that the maximum bid

11
would be 240, in order to put a large enough profit distance between the RNNE and naïve bid
according to expression (2).5
We manipulated the decision making process in a company takeover task using three
treatments: Individual decision making (Individual), individual decision making when observing
the bids of two other people (Signal), and group decision making (Group). Each session included
four parts (1) individual risk attitude elicitation using a multiple price list design for one period;
(2) group risk attitude elicitation using a multiple price list design for one period; (3) individual
company takeover game for six periods; (4) company takeover game with procedures differing
by treatment for twenty periods.
Third, we avoided placing the RNNE and the naïve bids at the
extremes values (i.e., 38 or 240). Sellers were simulated by a computer accepting only when the
bid b was greater than or equal to s. This simplified game allows us to isolate the origins of the
winner’s curse from possible explanations such as complicated strategic interactions between
sellers and buyers and misunderstanding of the game.
6
There were a total of 15 participants in each session. In part 1, we measured participants’
risk attitude with fifteen binary choices between lotteries. Although, no studies we reviewed in
section 2 (footnote 3) did it, the elicitation of risk attitudes may help in the interpretation of
choices in the company takeover game. The overall incentive structure was similar to that in Holt
and Laury (2002). Participants chose between a “safe” Option A and a “risky” Option B. The
payoff of Option A was deterministic (50 tokens) and the payoffs for Option B were either 150
or 0. On the first decision, the probability of the high payoff (150) for Option B was zero. In
Our main interests are with parts 3 and 4; however, parts 1 and
2 provided a benchmark to evaluate results. We will now describe each part in detail.
5 According to objective (2), with a fifth company value of at least 183, a 60 and 90 bids yield equal “profits”; with a 240 value, the “profit” distance is 7.5%. 6 We adopted the same group composition in part 2 group risk attitude elicitation and in part 4 group company takeover game.
12
subsequent choices, the probability of the high payoff increased by 1/20 each line, {0, 1/20, …,
14/20}. A risk neutral person would choose A in lotteries one through seven and then switch to B
in lottery eight. Risk seeking agents may switch to option B earlier than lottery 7 and risk averse
agents may switch later than lottery 7. Any rational agent should choose option A over option B
in the first lottery (50 vs. 0 francs always) and later on eventually switch to B. Multiple switches
would be a signal of confusion. We gave a payout for only one of the fifteen decisions, chosen
randomly at the end of the session. Random choices were all implemented through drawings
from a bingo cage.
In part 2, participants were randomly divided into groups of three and faced the same task
as part 1. Hence, there were five groups in each session. In this group version, for each of the
fifteen lottery choices, there was a proposal phase, a chat phase, and a group choice phase. In the
proposal phase, all group members simultaneously made an individual proposal about each of the
fifteen lottery choices, followed by immediate feedback regarding disagreements. At this point,
participants could switch to a chat window and had two minutes to send free-format messages to
others in their group. We asked participants to follow two basic rules: to be civil to one another
and not use profanities, and not to identify themselves in any manner. Messages were recorded.
In the chat window, participants received an id number 1-3 in the order they sent messages in
that specific period. After about two minutes, everyone had to submit a choice for the group
decision. A group choice had to be unanimous (i.e., for the specific decision line, choices of all
three group members must be identical). If there was unanimity on all fifteen choices, then part 2
was over. Otherwise, the line(s) with disagreement was (were) highlighted again, and all three
group members were invited to submit a new proposal. If there was still disagreement, there was
another final round of proposals. At this point, part 2 was over even if disagreement remained.

13
Participants were paid for only one of the fifteen decisions, which was chosen randomly at the
end of the session. Random choices were all implemented through drawings from a bingo cage.
If the group was still in disagreement by the end of part 2, then the group earned zero for part 2.
In part 3, all participants faced six periods of the company takeover game as potential
buyers. Participants started part 3 with a 200 token endowment. There was a practice period with
forced input. Every period the computer drew 15 company values in each session, one for each
participant. To favor learning, each participant observed the company value that was drawn both
when the company was acquired and when it was not, and were required to write it along with
their bid and period profit on a record sheet. Participants were paid for all six periods based on
their performance. Note that when cumulative earnings were low, there was a problem of limited
liability, which we will discuss in the Result section. The instruction explained:
“What if my earnings are negative? They will be compensated with your other gains. More
precisely, if you have a loss in a single period, it will decrease your cumulative earnings. If
your cumulative earnings in this part are negative, they will decrease your earnings in other
parts of the experiment. However, if at the end of the session your earnings are negative, you
will receive $5.”
Part 4 comprised twenty periods of the same company takeover game they faced as
individuals in Part 3. At the beginning of Part 4, each participant received an endowment of 300
tokens. Rules for Part 4 differed from treatment to treatment as described below.
For the Group treatment, in part 4, participants faced the company takeover game in
groups of three members. Groups were the same as in part 2 and every period they had a
proposal phase, a chat phase, and a bidding phase. In each period, participants initially shared
their proposals with others, in particular: (1) a bid proposal (an integer between 0 and 360) (2) a
14
confidence level in the bid (low, medium, high), and (3) a brief text with reasons for the choice
of that bid (optional). This information was placed on a public board for all three group members
to see. At that point, participants could switch to a chat window for up to two minutes after
which they submitted a bid for the group decision without further possibility to chat. If the
individual bids of all three group members were identical (unanimity), then it became the group
bid and part 4 was over. Otherwise, all three group members were invited to submit new bids. If
there was still disagreement, there was another final round of bidding. Disagreement implied that
no bid was submitted. Every period the computer drew five company values for each session,
one for each group.
For the Individual treatment, in part 4, the task was identical to part 3 except for minor
procedural changes. When submitting a bid, participants had to submit (1) their confidence level
in the bid (low, medium, high) and (2) a brief text with reasons for the choice of that bid
(optional). In the Individual treatment, only the experimenter could observe this information.
Every period the computer drew five company values for each session, one for each group of
three persons that was formed in part 2.
For the Signal treatment, part 4 was identical to the Individual treatment except for one
element. Participants chose individually their bid level and were informed about the bids of two
other people. More precisely, we used the data from the individual treatment sessions (part 4)
and displayed, period by period, the bids independently placed by two people. To make the
decisional process more comparable across treatments, we employed the same random draws
realized in the individual treatment sessions.7
7 More precisely, consider a group of three members formed in part 2. In the signal treatment each group member received the same random draw. For “signal” member 1 we displayed the bids of “individual” members 2 and 3. For “signal” member 2 we displayed the bids of “individual” members 1 and 3. For “signal” member 3 we displayed the bids of “individual” members 1 and 2. Session dates were 27 Sep 07, 23 Oct 07 (Individual), 28 Oct 07(a), 28 Oct
When submitting a bid, participants were required

15
to submit (1) their confidence level in the bid (low, medium, high) and had the option to submit
(2) a brief text with reasons for the choice of that bid (optional).
For all parts of the design, we distributed written instructions, which were read aloud.
The experiment was performed with a z-tree application (Fishbacher, 2007). No person
participated in more than one experimental session. We guaranteed a minimum payment of $5
for everyone showing up on time, left the experiment, or participated but earned overall less by
the end of the session. We converted each experimental token to actual dollars at the rate of
$0.03. A session lasted on average about 2 hours and average earnings per person were about
$20. We conducted eight experimental sessions with 15 participants for a total of 120 people; 60
people were in the Group treatment and 30 each in the Individual and Signal treatments.
Participants were recruited from the undergraduate campus population of (omissis) University.
4 Main Results
Result 1: In the individual treatment of the company takeover game, there was no
significant learning over time in the following measures of performance: (1) the fraction of
optimal bids, (2) the fraction of winner’s curse bids, and (3) the fraction of dispersed bids.
We first report the bidding of participants in isolation in the company take over game
(Table 2, part 3 in all treatments, col. a, c, f). Note that when aggregated across all sessions,
28.1% of bids were optimal and 23.1% were winner’s curse bids.
Table 3 (col. a and col. b) puts forward various probit regressions to explain when an
individual bid was optimal or when it was a winner’s curse bid in part 3, across all treatments,
for periods one through six. Regressors included past company values, risk attitude, levels of
07(b) (Signal), 25 Sep 07, 2 Oct 07, 4 Oct 07, 11 Oct 07 (Group). For the signal session 28 Oct 07 (a) we used the random draws of individual session Sep 27 and for signal session Oct 28b we used the random draws of individual session 23 Oct 07.

16
confidence indicated on the proposed bid, measures of skill, demographic characteristics, a trend
dummy (1/period), and session dummies.8
Now let us focus on the individual treatment. Overall, a minority of bids were at the
optimal value of 60. There were 35.6% optimal bids in part 3 (Table 2, col. a) and 37.5% optimal
bids in part 4 (Table 2, col. b). This difference was not significant according to a Wilcoxon
signed-rank test.
The results show that science and engineering major
placed optimal bids significantly more often than Economics & Business and other majors
(Table 3, col. a). The results also show that ability captured by SAT/ACT scores mattered in
handling the company takeover game. Bottom quartile of the SAT/ACT takers was likely to
place less optimal bids and more winner’s curse bids. No gender effect was observed.
9
As sub-optimal bids were the majority of bids placed, we present two other measures of
performance. Winner’s curse bids are those that yield an expected loss, which are in the intervals
(57, 60), (73.5, 90), or (94, 360). A subject is better off to bid 0, rather than placing a winner’s
curse bid. In part 3, about 20.0% of the bids were winner’s curse bids and 18.3% in part 4. This
difference was not significant according to a Wilcoxon signed-rank test (N=30, p=0.50).
Moreover, any bid in between 0 and 360 is weakly dominated by 38, 60, 90, 130, or 240. Even if
unable to identify the optimal bid, participants should recognize that bids different from the ones
above are dominated. We call these bids “dispersed,” but exclude from the definition 39, 61, 91,
8 In terms of risk attitude, risk seeking participants are coded as one when they switched from option A to B at question seven or earlier, while participants who switched at question 13 or later are coded with risk averse dummy equals one. Hence, risk averse dummy identifies participants with a very high degree of risk aversion, rather than every risk-averse participant. One dummy regressor coded whether the subject had high confidence in the bid placed. Participants were asked to indicate the confidence level only in part 4 of all treatments. Skill proxies were the SAT/ACT scores obtained from the university Registrar’s Office. SAT/ACT scores were collected for 92.5% of the participants (missingdata=0), who are coded using the US nationwide distribution of the SAT-takers (College Board of Education, 2006). The threshold for low ability was set at the lower quartile. The cutoff values were the average between male and female national tables. Other demographic variables we included were gender, economics and business major and science and engineering major. 9 N=30, p=0.316 when considering all periods of Part 4; N=30, p=0.316 when restricting to the last 6 period of Part 4.

17
131, and 241 in case participants did not understand the tie-breaking rule. No dispersed bids
should be placed in equilibrium. The fraction of dispersed bids declined from 9.4% in part 3 to
4.8% in part 4. This difference was not significant according to a Wilcoxon signed-rank test
(N=30, p=0.66).
Table 3 (col. c and col. d) presents probit regressions to explain when an individual’s bid
was optimal or when it was a winner’s curse bid from the individual treatment of periods 7-27,
part 4. In comparison to columns a and b for part 3, columns c and d include one new dummy
regressor, which was whether the subject had high confidence in the bid placed
(highconfidence=1). Participants were asked to indicate the confidence level only in part 4 of all
treatments. This dummy shows no significant effect. Contrary to part 3 result, Economics &
Business major catch up in periods 7-27 (part 4). Men were more likely to place a winner’s curse
bid. This result is at odds with findings by Casari et al. (2007) in a common value auction setting
where they found that women performed worse than men. The significant effects of SAT/ACT
scores also disappear.
Result 2: In the group treatment of the company takeover game, there was significant
learning in the following measures of performance: (1) the fraction of optimal bids, (2) the
fraction of winner’s curse bids, and (3) the fraction of dispersed bids.
Table 2 (group treatment) and Figures 1, 2, and 3 provide support for result 2. The
fraction of optimal bids in part 3 was 30.6% and increased to 50.5% in part 4. This difference
was significant according to a Wilcoxon signed-rank test (N=60, p=0.0004). The fraction of
winner’s curse bids in part 3 was 18.3% and declined to 9.75% in part 4. This difference was
significant according to a Wilcoxon signed-rank test (N=60, p=0.032). The fraction of dispersed
bids was 11.1% in part 3 and it basically disappeared in part 4 (0.2%). Also, this difference was

18
significant according to a Wilcoxon signed-rank test (N=60, p=0.002). Result 2 holds also when
we account for limited liability issues. One can see that for low cash balances (below 23.25
tokens) it is optimal for a subject to bid 240 instead of 60.10
For the group treatment, part 4, we studied in more detail the process of making
proposals in the group. Table 3 (col. e and f) puts forward various probit regressions to explain
when an individual proposal was optimal or winner’s cursed in part 4 for the group treatment.
First, the significant negative relationship between risk averse and likelihood to fall prey to
winner’s curse conforms our conjecture that more risk averse participants would choose to bid
38, while risk seeker may bid 90. Yet, we will discuss later that aggregated group risk preference
cannot account for group improvement over individual bids, as groups are closer to risk neutral
rather than risk averse decision makers. Second, participants who had high confidence in their
proposals were less likely to make winner’s curse bids. Third, there is a significant improvement
of the fraction of optimal proposals over time (negative coefficient on trend dummy 1/period),
which is in contrast with the absence of improvement observed in the individual treatment.
Fourth, there was no significant effect of major, skill, and gender.
At some point, five participants had
low cash balances and bidding 240 was optimal. These occurrences involve only 1.2% of all
bids. Removing these observations did not change Result 2, because the issue affected part 4
relatively more than part 3, and the group treatment relatively more often than the individual
treatment (Table 2). To avoid confounding effects, we dropped these observations from all
regression analysis.
10 Bidding 240 yields a 120 profit with probability 0.2 and a loss y with probability 0.8.The variable y is the minimum between the actuall loss (i.e. 240 minus the value of the company) and the cash balance. If the cash balance is below y the loss is inconsequential. When y<23.25 the expected profit from a 240 bid are higher than 5.4 i.e. the expected profits from a 60 bid. Two caveats are in order. First, we guarantee $5 minimum earnings, which translates into 166.6 tokens, hence the relevant threshold for cash balances is 189.9. Second, the reference cash balance includes the expected earnings from part 1 and 2 lotteries, the part 3 and 4 endowments and the cumulative profits from the company takeover game up to that period.

19
Result 3: The group treatment outperformed the individual treatment in the fraction of
winners’ curse bids and the fraction of dispersed bids.
Table 2 provides support for Result 3. We conducted a series of Mann-Whitney tests on
cross-treatment comparisons for part 4. The group treatment exhibited less winners’ curse bids
(n=30, m=60, p=0.058) and less dispersed bids (n=30, m=60, p= 0.007) than the individual
treatment.11
There is no reason to believe that this better performance comes from more high
skilled participants participating in the group treatment than in the individual treatment sessions.
In fact, in part 3 the group treatment had no significantly different levels of optimal bids,
dispersed bids and winner’s curse bids (n=30, m=60, p= 0.928 for optimal bids, p= 0.118 for
dispersed bids, and p= 0.080 for winner’s curse bid). Also, in part 4, there were more optimal
bids in the group treatment than in the individual treatment, but the difference was not significant
(n=30, m=60, p= 0.168).
5 Explanations of the Main Results
Why do groups outperform individuals? In order to answer this question, we look at three
possible aspects regarding how groups decided on their bids: aggregation of risk attitude in group
decisions, observational learning, and the aggregation of individual proposed bids within the
group.
Can patterns of risk attitude explain the winner’s curse phenomenon? Not in this
experiment. Risk attitudes explained neither the point predictions of the individual treatment nor
the comparison across individual treatment and group treatment. While for the buyer, the Risk
Neutral Nash Equilibrium (RNNE) bidding strategy is to bid 60, participants which were risk
11 An observation is the fraction of bids in the relevant category for each subject in all part 4 periods. We get similar results if we treat a group of 3 as an observation instead of 3 observations. The group treatment has also significantly more optimal bids (n=30, m=60, p= 0.006) than the signal treatment.

20
averse may choose to bid 38 and risk seeking may bid 90. Bidding 130 or 240 yields negative
expected payoff, and hence should never be chosen. The differences in individual risk attitude
we observed from part 1 cannot explain the winner’s curse phenomenon. Less than six percent of
the participants showed risk seeking behaviour in part 1, and hence 94% of bids should be either
38 or 60. Instead, in the individual treatment, they were 47.5% (Table 2, col. b).
The shift in risk attitude cannot explain the better performance of groups than individuals.
A potential explanation for group improvement is a prudent shift in risk attitude when
individuals decide in a group instead of in isolation. As reported below in Result 4, this does not
seem to be the case. Hence, we can rule out risk attitude as an explanation for the observed
individual-group differences in bidding.
Result 4: The shift in risk attitude generated by group decision-making cannot explain
the better performance of groups over individuals in the company takeover game. In lottery
choices, groups are closer to a risk neutral decision maker compared to individuals.
Figure 4 illustrates the lottery choices in part 2 of 120 participants divided into 40 groups.
Each group made 15 choices for a total of 1800 individual decisions. In 73.5% of the group
decisions, everyone was in agreement. We focus exclusively on those decisions where there was
disagreement. Disagreement is defined by comparing individual choices (part 1) and group
choices (part 2). There were 465 group decisions with disagreement as illustrated by the line in
Figure 4. What rule governed conflict resolution within a group in disagreement? Most of the
time, the median member determined the group decision (76.8% of cases), while in other cases,
there was a risky shift (16.8%), and in other cases there was a prudent shift (6.5%). The data on
choices over lotteries suggest that the median member choice is the most widespread aggregation
rule. However, there is a nontrivial amount of group decisions that are more risky than the
21
decisions taken by the median member. 12
In our sample pool, the fraction of risk seeking groups was 2.6%, which was lower than
the fraction of risk seeking individuals, 5.7% (prudent shift). A two-sample Kolmogorov-
Smirnov test did not show a significant difference though (p=0.875). Moreover, this explanation
for the improved group performance is weak because it is counterbalanced by a massive opposite
shift—risky shifts (Figure 4). Overall, we found that group choices were closer to the behavior of
a risk neutral agent than individual choices.
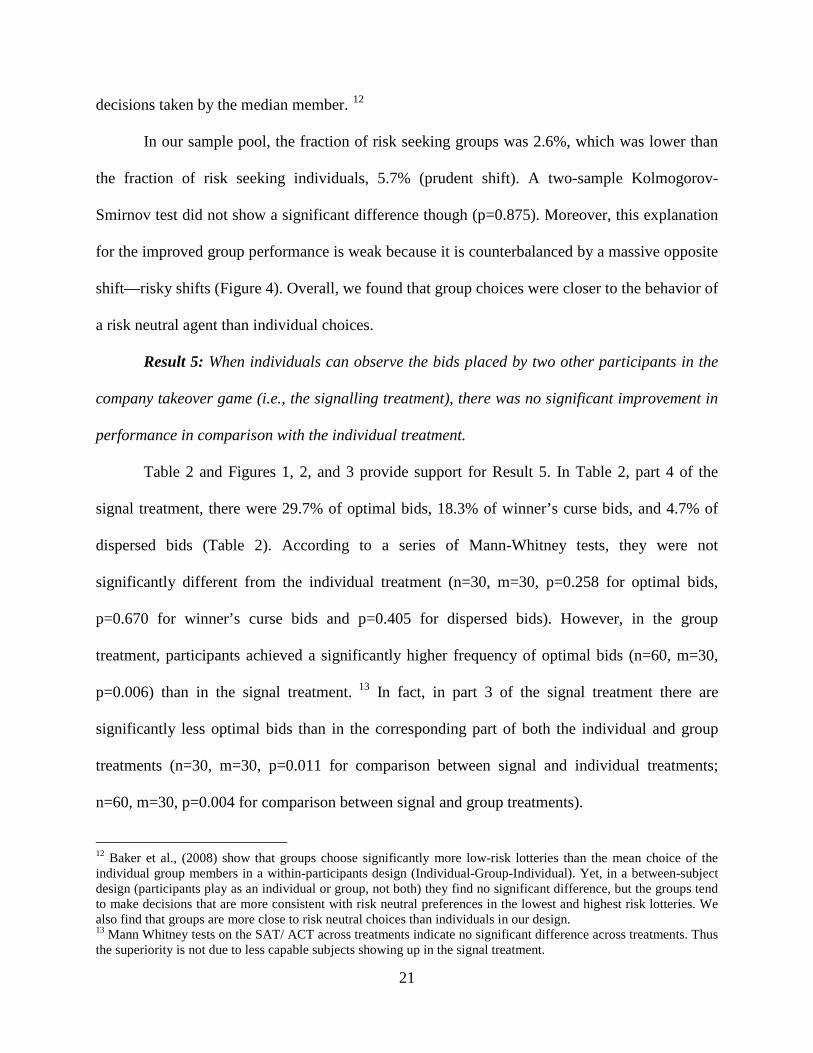
Result 5: When individuals can observe the bids placed by two other participants in the
company takeover game (i.e., the signalling treatment), there was no significant improvement in
performance in comparison with the individual treatment.
Table 2 and Figures 1, 2, and 3 provide support for Result 5. In Table 2, part 4 of the
signal treatment, there were 29.7% of optimal bids, 18.3% of winner’s curse bids, and 4.7% of
dispersed bids (Table 2). According to a series of Mann-Whitney tests, they were not
significantly different from the individual treatment (n=30, m=30, p=0.258 for optimal bids,
p=0.670 for winner’s curse bids and p=0.405 for dispersed bids). However, in the group
treatment, participants achieved a significantly higher frequency of optimal bids (n=60, m=30,
p=0.006) than in the signal treatment. 13
12 Baker et al., (2008) show that groups choose significantly more low-risk lotteries than the mean choice of the individual group members in a within-participants design (Individual-Group-Individual). Yet, in a between-subject design (participants play as an individual or group, not both) they find no significant difference, but the groups tend to make decisions that are more consistent with risk neutral preferences in the lowest and highest risk lotteries. We also find that groups are more close to risk neutral choices than individuals in our design.
In fact, in part 3 of the signal treatment there are
significantly less optimal bids than in the corresponding part of both the individual and group
treatments (n=30, m=30, p=0.011 for comparison between signal and individual treatments;
n=60, m=30, p=0.004 for comparison between signal and group treatments).
13 Mann Whitney tests on the SAT/ ACT across treatments indicate no significant difference across treatments. Thus the superiority is not due to less capable subjects showing up in the signal treatment.

22
As for the other treatments, Table 3 presents probit regressions on who placed optimal or
winner’s curse bids (col. g and h). Regressors for the signal treatment control for the type of bids
subjects observed. More specifically, whether at least one of the observed bids, or both, were
optimal; whether at least one of the observed bids, or both, yielded an expected loss. According
to the regression results, participants did not strongly react to the observed bids and when they
did react, it was sometimes in an unexpected direction. The regression shows an improvement in
optimal bids over time.14
We argue that the reason for the superiority of groups over individuals lies in the way
individual opinions were aggregated into a group choice, as explained below.
Yet, according to a series of Wilcoxon signed-rank tests comparing the
fractions of optimal bids and winner’s curse bids between part 3 and part 4, the learning in part 4
is neither enough to increase the fraction of optimal bids nor to reduce the fraction of winner’s
curse bid (N=30, p=0.064; N=30, p=0.094). There was no significant difference in terms of
dispersed bids (N=30, p=0.366).
Result 6: When there was disagreement among group members on what bid to place in
taking over the company, the median proposal prevailed in 75% of the cases. The final group
bids were better than the median proposal in 7% of the cases and worse than the median
proposal in 17% of the cases. Groups underperformed with respect to a “truth wins”
benchmark.
A key feature of the group treatment in part 4 is to ask for individual bid proposals before
the group discussion; hence there is a complete record of ex-ante agreement or disagreement
among group members. At the proposal stage, group members unanimously agreed 46.2% of the
time. In all other instances, there was disagreement (i.e., at least one member placed a proposal
14 The estimated coefficients for High confidence proposal, bottom quartile SAT/ACT scores, Science and Engineering have sometimes a different sign than in the other treatments.

23
different from the group bid). Hence, there was lively disagreement within groups; especially in
the initial periods. At the group bid stage, all groups eventually reached a unanimous group
decision.
We focus on the subsample where there was disagreement on individual proposals in
order to understand how the group dynamic aggregated diverging opinions. Table 5,
specifications (a) report the results from probit regressions on the disagreement subsample. The
dependent variable was 1 when an individual proposal became a group choice, 0 otherwise. After
controlling for risk attitude, confidence level, major, gender and skills, we also included a
dummy for participants with low cash balance, a dummy for a median proposal that was also a
majority proposal, a dummy for a median proposal that was not a majority proposal, and a
dummy for the best proposal in a group which yielded the highest expected payoff. Period
dummies were also included but not reported in the table.
In the first regression, we pooled data from periods 1 to 6 where participants learned how
to play the game in a faster rate than the latter periods. The second regression is based on data
from periods 7-20. The comparison between the regressions using the first 6 and the last 14
periods allowed us to examine the change in the determinants of group outcome across time. The
main result from specifications (a) is that the median proposal was the strongest determinant of
group choice, especially when it was a majority proposal. . Such strong impact remains over
time. The best proposal had no significant effect on group choices initially and was less likely to
prevail as group choices later on, which suggests that the “truth wins” norm does not apply to
this experiment. In the early periods, more risk seeking participants, who had bottom 25%
SAT/ACT scores, were less likely to convert their proposals to group choices. These significant
effects disappeared after period 6 though. High confidence, major and gender did not seem to be

24
important factors.In intellective tasks, such as the company takeover game, one smart subject
who knows the optimal bidding strategy can explain it in the chat to the other two group
members and hence prove to them the superiority of his or her proposal.15
By design, every participant had veto power in group decisions. Recall each group had
three rounds to reach a unanimous bid after the individual proposals were revealed and text
messages were exchanged among them. If there was disagreement on the final bid, the group lost
the opportunity to place a bid for the period and everyone in the group earned zero. The veto
power could have been usefully employed by a subject every time others in the group wanted to
place a winner’s curse bid. For risk neutral and risk averse participants, a sure gain of zero is
preferred to an expected loss. Did participants employ such veto power? Not much. First, there
was no case where groups did not reach a final bid by the third trial. Second, the aggregation of
winner’s curse proposals did not differ from the aggregation of proposals in general (Table 4).
When the proposal of one member was winner’s curse bid and the other two were not, it
prevailed in 25.0% of the cases. When the proposals of two members were winner’s curse bids
and the other was not, it prevailed in 77.8% of the cases. These percentages are aligned with
those stated in Result 6. In the hypothetical case that a subject with a non-winner’s curse
proposal always vetoed group decisions for a winner’s curse bid, in the group treatment in part 4,
In a well-working
group, this may well happen but it did not in the experiment. Consider the following back-of-the-
envelope calculation. About 30.6% of part 3 bids were optimal. Absent any learning, the chances
that at least one group member proposed the optimal strategy were 66.4%. Actual optimal bids in
group decisions of part 4 were 50.5%, which is considerably less than a “truth wins” norm (Table
2).
15 At the beginning of each period, subjects must make a proposal in the pre-discussion stage which worked as an open brick for their discussion and also saved their chat time which was up to 2 minutes. There were 15 periods involved. Thus the smart subject had 30 minutes in total to explain the strategy to other two group members.

25
only 1.5% of bids would have been winner’s curse (and not 9.75%). In other words, a rational
use of veto power could have substantially reduced the fraction of winner’s curse bids.
Participants simply did not employ it as much as they could. Our conjecture is that this is due to
pressure to conform in group decision making.
One aspect that needs clarification is how group decisions strictly based on the median
bid proposal could improve performance in the company takeover game. We ran simulations by
taking the median bid among three randomly drawn individual bids among all the bids placed in
a given treatment in each period. We consider averages of 6000 simulations for each period.
When comparing the actual results from Table 3 to the simulation results, there are two main
conclusions. First, simulation on the part 4 individual treatment data, show a reduction of about
half of the frequency of winner’s curse bids, from 18.3% to 9.4%. This reduction is similar to the
actual result for the part 4 group treatment (9.7%, Table 3). Hence, a median aggregation rule in
group decision would explain the better performance of groups compared to individuals with
respect to placing winner’s curse bids. Even if groups do not match the performance of the “truth
wins norm”, they are still a valuable tool in handling the company takeover task. The role of the
group is to reduce the frequency of very high or very low bids entering into the market. While
encouraging, this result may not extend to all possible intellective tasks. In particular, it may
work in this setting where less than one third of the bids in any given treatment are winner’s
curse bids but may possibly fail with a more difficult company takeover task where a majority of
bids are winner’s curse bids.
The second conclusion is that group decision processes cannot be simply reduced to a
median-taking rule. This conclusion is based on the simulated and actual fraction of optimal bids.
The actual fraction of optimal bids in the group treatment of 50.5% (Table 3) is slightly better

26
than the simulated median bid in the individual treatment (44.4%). This comparison suggests that
additional learning took place within groups, which did not take place for stand-alone
individuals. At the same time, based on the simulated median bids on the group proposals one
may have expected an even better group performance (60.1% vs. 50.5%). A similar conclusion
derives from the fraction of winner’s curse bids (3.5% vs. 9.75%). While the median proposal
has a strong drawing power in group decision making, there are other forces at work, which
make decisions worse than the median proposal.
6 Results: Content Analysis of Chat Messages
Additional evidence on group dynamics comes from the analysis of messages exchanged
within each group through a chat function. Units of messages were coded for select groups and
periods of the experiment in which there was a disagreement in the proposal stage, with at least
one of the proposals being a winner’s curse bid (282 observations) or when a group’s final
decision was a winner’s curse bid even though none of the other proposal’s were winner’s curse
bids (3 observations).16 A total of 1150 units of messages fit this criterion. We randomly selected
one tenth of the messages to develop a coding scheme, which classifies messages into 22
categories (see Table 6). Two coders trained separately, independently coded the messages
according to the coding scheme.17 The reliabilities of the coding for each category are reported in
Table 6.18
16 Following the methodology utilized in Zhang (2009), a chat unit is defined as a message that was sent out by a subject in a given period during one intervention. Units could be a single word or several sentences entered by the subject before he or she hit the “enter” button to submit the message.
17 Using binary coding, a message was coded as a 1 if it was deemed by a coder to represent one or more of the 22 categories and 0 otherwise. Each message could be coded under as many or as few categories as the coders deemed appropriate. Messages were coded under one category the majority of time (93.4%), under two categories 6.1% of the time, and rarely coded under three categories (0.5%). Coding instructions are attached in the appendix. 18 The Kappa statistic measures the degree of agreement between the variables above that expected by chance alone. It has a maximum of 1 when agreement is perfect, 0 when agreement is no better than chance, and negative values

27
Table 6 provides a summary of the coded messages during the twenty periods of the
takeover game.19 Group discussions were primarily focused on the task, as about 70% of the
messages were coded as task focused. Of these messages, participants talked mostly about
numerical proposal’s (25.4%) or simply expressed agreement to any particular proposal (25.8%).
Groups also spent a decent amount of time discussing how to find the best bidding strategy
(12.0%+2.1%+3.4%) and how to aggregate conflicting proposals (6.4%+1.6%+0.7%).20
Statements of threat of disagreement by individual group members were modestly common
(6.0%), while an explicit mention of veto power was less common (0.3%+0.1%).21 There was
little mention of losses (3.4%), as the frequency of a loss during the 20 periods of group
interactions during the takeover game was low (1.9%).22
To see the effects of the various categories of messages, we report regression results in
Table 5 (specifications b and c). The probit regressions with robust standard errors (clusters on
groups) include all the observations when there is a disagreement in the proposal stage with at
least one proposal being a winner’s curse bid (282 observations) and when the final group
decision was a winner’s curse bid even though none of the proposals are winner curse bids (3
observations). Besides the common independent variables included in all regressions,
when agreement is worse than chance. In general, a Kappa less than 0.20 represents poor agreement, 0.40 represents fair agreement, 0.60 represents moderate agreement, 0.80 presents good agreement and 1.00 represents very good agreement. The p-value is the probability of rejecting the null hypothesis, that agreement between the variables is no better than chance, when it is in fact true. A significant p-value implies that the agreement between the variables is not just chance. 19 All discussions of coding hereafter are based on the average of the two independent codings, unless otherwise stated. Specifically, the value of the coding is treated as 1 if two coders agreed that a message belongs to a given category; 0 if the two coders agreed that a message does not belong to a given category; 0.5 if two coders disagreed with each other. 20 A typical quote is “I still like the 60. It’s very safe, maximize our potential winnings with little risk.” 21 A typical quote is “I’m going to bit [bid] 60 regardless of your consensus b/c it’s the best choice, we win [“avoid winner’s curse] if we are in disagreement”. 22 The chat pattern over time suggest that groups spent more time during the first six periods, and the next six periods to a lesser extent, trying to figure out how to succeed at the takeover game. In contrast, the frequency of occurrence for direct pressure and reinforcement was the highest during the first six periods and the last eight periods and dropped slightly during periods seven through twelve.
28
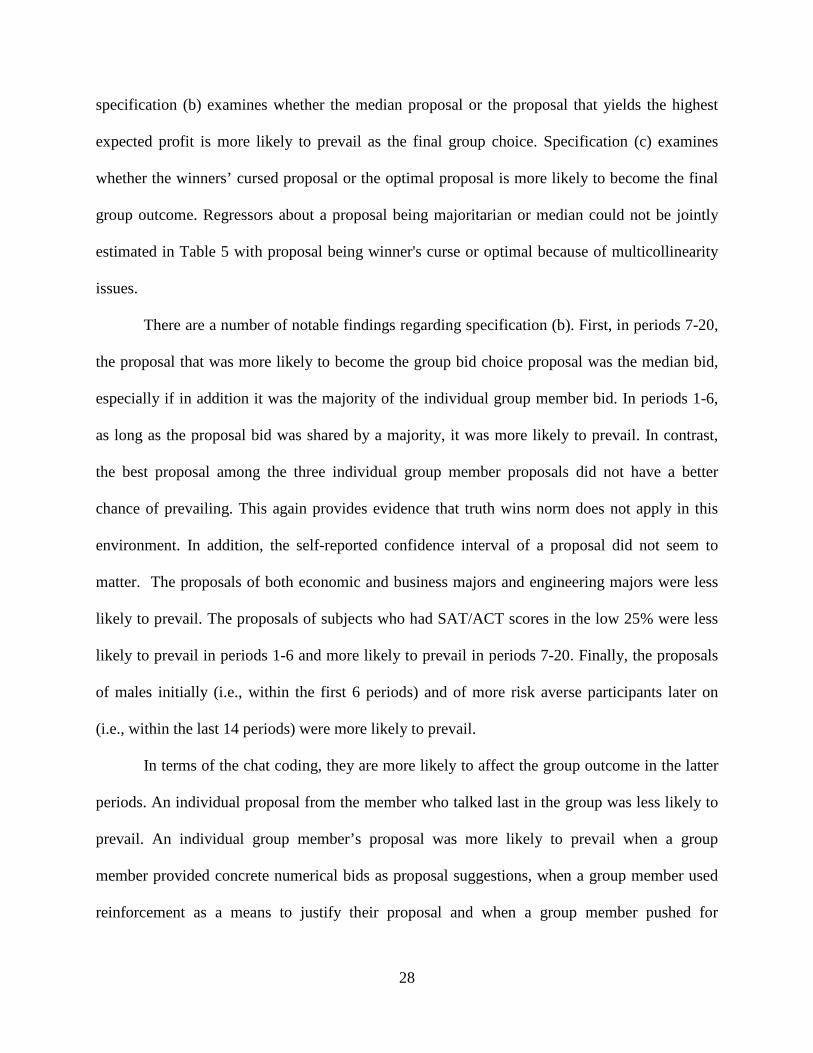
specification (b) examines whether the median proposal or the proposal that yields the highest
expected profit is more likely to prevail as the final group choice. Specification (c) examines
whether the winners’ cursed proposal or the optimal proposal is more likely to become the final
group outcome. Regressors about a proposal being majoritarian or median could not be jointly
estimated in Table 5 with proposal being winner's curse or optimal because of multicollinearity
issues.
There are a number of notable findings regarding specification (b). First, in periods 7-20,
the proposal that was more likely to become the group bid choice proposal was the median bid,
especially if in addition it was the majority of the individual group member bid. In periods 1-6,
as long as the proposal bid was shared by a majority, it was more likely to prevail. In contrast,
the best proposal among the three individual group member proposals did not have a better
chance of prevailing. This again provides evidence that truth wins norm does not apply in this
environment. In addition, the self-reported confidence interval of a proposal did not seem to
matter. The proposals of both economic and business majors and engineering majors were less
likely to prevail. The proposals of subjects who had SAT/ACT scores in the low 25% were less
likely to prevail in periods 1-6 and more likely to prevail in periods 7-20. Finally, the proposals
of males initially (i.e., within the first 6 periods) and of more risk averse participants later on
(i.e., within the last 14 periods) were more likely to prevail.
In terms of the chat coding, they are more likely to affect the group outcome in the latter
periods. An individual proposal from the member who talked last in the group was less likely to
prevail. An individual group member’s proposal was more likely to prevail when a group
member provided concrete numerical bids as proposal suggestions, when a group member used
reinforcement as a means to justify their proposal and when a group member pushed for

29
consensus. An individual group member’s proposal was less likely to prevail when he or she
discussed irrelevant issues that were unrelated to the takeover game. When people rotated to
determine the final group choice, it also reduced the likelihood of a proposal to prevail. Also,
when a group member explicitly agreed with a proposal suggested by another group member, his
or her proposal was less likely to prevail. A puzzling negative effect on the likelihood of a
proposal being prevailed is observed when the group member discussed the best strategies for
determining the group’s final bid choice.
In specification (c), proposals that are winner’s cursed bids and proposals from risk
averse subjects in early periods have a negative effect on the likelihood of the prevalence of a
proposal. The effects of gender and ability disappear and the effects of majors and the chat
coding are similar to what we observed in specification (b).
7 Discussion and Conclusions
The winner’s curse is a widespread behavioral bias in common value auctions and in other
environments, where people systematically incur in losses when trying to acquire a good. In a
company takeover game experiment, individual buyers making take-it-or-leave it offers to
company owners frequently fall prey to the winner’s curse. Our aim is not to find the origin of
the winner’s curse but to study whether deciding in groups reduces its magnitude and how this
result is achieved.
We report that small groups made better choices than individuals in isolation and
substantially reduced the frequency of winner’s curse offers (Result 3). Groups make better
decisions due to a combination of learning and the way member’s proposals are aggregated into
a group choice. There are four main results. First, groups learn faster than individuals. In our

30
experiment, as well as in most of the literature, there is no significant learning by individuals
who bid in a company takeover game (Result 1). We report substantial learning by groups in
terms of frequency of optimal bids, dispersed bids, and winner’s curse bids (Result 2). This study
makes clear that group learning does not come from the simple exposure to diversity of opinions
but from engaging in communication and negotiation in search of a consensus. In fact, individual
bidding is not significantly different if a subject can observe and imitate the bids of two other
subjects without the possibility to chat with them or the need to reach consensus on a bid (Result
5). One contribution of this study has been to clarify what generates group learning.
Second, individual opinions are aggregated within the group largely by taking the median
opinion. This result is novel. When in disagreement, 75% of groups’ choices coincide with the
opinion of the median member (Result 6). This percentage is even higher when the median is
also the majority opinion (two against one, 80%). Other factors matter, such as risk attitude,
some demographic characteristics, and the content of the messages exchanged. The
counterintuitive result is that, controlling for all the above factors, the best proposal is less likely
to emerge than other proposals. The internal dynamics in aggregating individual opinions into a
single group choice provides no support for the truth-wins norm. Other papers compare group
choices with simulations on individual choices (Cooper and Kagel, 2005, 2009). Instead, this
study provides direct evidence by comparing each group choice with the individual proposals of
all group members. If two people do not get the correct solution, bringing a smart guy into the
group will not be enough, on average, to overturn the group decisions.
Third, there was some herd behavior. We provide indirect support on this point. When
there was an initial disagreement, the median was more likely to prevail in two-against-one
situations than with three distinct opinions (80% vs. 72.6%). While there was a group dynamic to

31
converge to a middle ground as a compromise, this evidence suggests that there also existed
another dynamic of herd behavior at play. Such behavior may take the explicit form of pressure
from the majority or could be implicit, a self-retreat to conform to the majority. Some chat
messages refer to statements or threats to disagree, but not many (6.4%, Table 7). A way to
detect the role of minority opinion is to look at the use of veto power. The veto power could have
been usefully employed by a subject every time others in the group wanted to place a winner’s
curse bid. For risk neutral and risk averse participants, a sure gain of zero is preferred to an
expected loss. Subjects exerted veto power less often than optimal (Table 5). An optimal use of
veto power in groups would have further reduced the frequency of winner’s curse bids from
9.7% to 1.5%.
Fourth, we can rule out that the superiority of groups over individuals in the company
takeover game is due to shifts in risk attitudes generated by group processes. Very few
experiments on group decision making controlled for this possible confounding factor. 23
Based on the above results we can draw three general lessons about group decision
making on intellective tasks. First, group size is a key variable. Some group experiments are
done with two members (Cooper and Kagel, 2005, 2009, Cason and Mui, 1997). If the group
choice is generally the median opinion and there is herd behavior, we expect groups of two to
behave very differently than groups of three. In other words, when stating a result about groups
vs. individuals, one should always specify group size.
Second, groups produce a “majority boost.” Groups outperform individuals in tasks
where a (large) majority of individuals would choose the correct option when deciding in
isolation. In those situations, which include our experiment, groups are likely to have a majority 23 An exception is Sheremeta and Zhang (2010). Following a similar group risk preference elicitation methods, they find groups are more risk averse than individuals yet risk-aversion does not have a significant effect on groups’ bidding behavior in contests.

32
in favor of the correct option. An implication of this study is that in tasks where only a minority
of individuals would choose the correct option, groups are expected to underperform individuals.
This implication is also confirmed by evidence from a pilot experiment with a more difficult
version of the company take over game, where companies had 100 different values.24
Third, the big advantage of groups is in learning over time. In a one-shot interaction
groups of three are unlikely to beat the truth-wins benchmark when they follow a median
aggregation rule. When the majority is correct, they will match the truth-wins benchmark;
otherwise, they will likely underperform. They will rarely outperform the truth wins benchmark.
In repeated interactions, groups of three may beat a truth-wins benchmark on tasks where group
learning is relatively faster than individual learning. A median aggregation rule hinders groups
from reaching a truth-wins benchmark but group learning may more than compensate for it. The
key to promoting group learning is to craft a communication and negotiation set-up that will
engage a positive interaction among members. This includes the default rule in case of
disagreement - random, majority, unanimity - and the format of communication - face-to-face,
chat, or simple numerical suggestions. In conclusions, are groups better decision-makers than
individuals? This question is not well posed as there is no universally valid answer. We cannot
Moreover,
the poor performance of groups in the common value auctions of Cox and Hayne (2006) and in
Sutter et al. (2009) could result from the majority boost. The majority boost also helps to answer
a key question for management: when should we adopt groups in problem solving? The answer
depends on how difficult the task is. We should adopt groups only if the majority of the people
are already able to get the right answer when deciding in isolation, otherwise groups are unlikely
to improve performance.
24 In the pilot session, optimal bids wereonly 3.3% in the individual treatment and 0% in the group treatment. When considering all bids in an interval ranging between optimal-10 and optimal+10, they were 13.3% in the individual treatment and 4.0% in the group treatment.

33
even conclude that in general groups can overcome the winner’s curse. They did in our
experiment, but they are likely to fail if we make the task more difficult. This study suggests that
the answer will be specific to the task and to the group interaction rules.
References
Baker, R. J., Laury, S. and Williams, A. W. (2008), Comparing Small-Group and Individual
Behavior in Lottery-Choice Experiments, Southern Economic Journal, 75(2), 367-382.
Ball, S. B., Bazerman, M. H. and Carroll, J. S. (1991), An Evaluation of Learning in the Bilateral

34
Winner's Curse, Organizational Behavior and Human Decision Processes, 48, 1-22.
Bornstein, G. and Yaniv, I. (1998), Individual and Group Behavior in the Ultimatum Game: Are
Groups More “Rational” Players? Experimental Economics, 1, 109-118.
Bereby-Meyer, Y. and Grosskopf, B. (2008), Overcoming the Winner’s Curse: An Adaptive
Learning Perspective, Journal of Behavioral Decision Making, 21(1), 15 – 27.
Blinder, A. S. and Morgan, J. (2005), Are Two Heads Better Than One? Monetary Policy By
Committee, Journal of Money, Credit, and Banking, 37(5), 769-811.
Capen, E. C., Clapp, R.V. and Campbell, W. M. (1971), Competitive Bidding in High-Risk
Situations, Journal of Petroleum Technology, 23, 641-653.
Carroll, J. S., Delquie, P., Halpern, J. and Bazerman, M.H. (1990), Improving Negotiators'
Cognitive Processes, Working Paper, MIT, Cambridge, MA.
Casari, M., Ham, J. and Kagel, J. (2007), Selection Bias, Demographic Effects and Ability
Effects in Common Value Auctions Experiments, American Economic Review, 97(4), 1278-
1304.
Cason, T. N. and Mui, V.-L. (1997), A Laboratory Study of Group Polarization in the Team
Dictator Game, Economic Journal, 107(444), 1465-1483.
Charness, G. and Levin, D. (2009), The Origin of the Winner’s Curse: A Laboratory Study,
American Economic Journal: Microeconomics, 1 (1), 207-236
College Board of Education (2006), SAT Percentile Ranks for Males, Females, and Total Group,
College-Bound Seniors—Critical Reading + Mathematics + Writing. Retrieved May 29 2007.
http://www.collegeboard.com/prod_downloads/highered/ra/sat/SATPercentileRanksComposi
teCR_M_W.pdf
Cooper, D. J. and Kagel, J. H. (2005), Are Two Heads Better than One? Team Versus Individual
Play in Signaling Games, American Economic Review, 95 (33), 477-509.
Cooper, D. J. and Kagel, J. H. (2009), The Role of Context and Team Play in Cross-Game

35
Learning, Journal of the European Economic Association, 7 (5), 1101–1139.
Cox, J. C. and Hayne, S. C. (2006), Barking Up the Right Tree: Are Small groups Rational
Agents? Experimental Economics, 9(3), 209-222.
Davis, J. H. (1992), Some Compelling Intuitions about Group Consensus Decisions, Theoretical
and Empirical Research, and Interpersonal Aggregation Phenomena: Selected Examples,
1950-1990, Organizational Behavior and Human Decision Processes, 52, 3-38.
Fischbacher, U. (2007), z-Tree-Zurich Toolbox for Readymade Economic Experiments,
Experimental Economics, 10 (2), 171-178.
Grosskopf, B., Bereby-Meyer, Y., and Bazerman M. (2007). On the Robustness of the Winner’s
Curse Phenomenon, Theory and Decision, 63(4), 389-418.
Holt, C. A. and Laury, S. K. (2002), Risk Aversion and Incentive Effects, American Economic
Review, 92, 1644–1655.
Holt, C. A. and Sherman, R. (1994), The Loser’s Curse, American Economic Review, 84 (3),
642-652.
Kagel, J. H. and Levin, D. (1986), The Winner's Curse and Public Information in Common
Value Auctions, American Economic Review, 76, 894-920.
Kagel, J. H. and Levin, D. (2002), Common Value Auctions and the Winner’s Curse, Princeton:
Princeton University Press.
Kagel, J. H. , Sung, H. and Winter, E. (2010), Veto Power in Committees: an Experimental
Study, Experimental Economics, 13, 167–188.
Kerr, N. L., MacCoun, R. J., and Kramer, G. P. (1996), When Are N Heads Better (or Worse)
Than One? Biased Judgments in Individuals and Groups, In E. H. Witte & J. H. Davis (Eds.),
Understanding Group Behavior: Consensual Action By Small Groups, 1, 105-136, Mahwah,
NJ: Erlbaum.
Kocher, M. G. and Sutter, M. (2005), The Decision Maker Matters: Individual versus Group

36
Behavior in Experimental Beauty-Contest Games, Economic Journal, 115, 200-23.
Kocher, M. G. and Sutter, M. (2007). Individual versus Group Behavior and the Role of the
Decision Making Procedure in Gift-exchange Experiments. Empirica 31, 63-88.
Krippendorf, K. (2004). Content Analysis: An Introduction to Its Methodology. 2nd edition,
Thousand Oaks, CA: Sage.
Laughlin, P. R., Zander, M. L., Knievel, E. M., and Tan, T. K. (2003), Groups Perform Better
than the Best Individuals on Letters-to-numbers Problems: Informative Equations and
Effective Strategies, Journal of Personality and Social Psychology, 85, 684-694.
Levis, M. (1990), The Winner’s Curse Problem, Interest Costs and the Underpricing of Initial
Public Offerings, Economic Journal, 100, 76-89.
Lorge, I. and Solomon, H. (1955), Two Models of Group Behavior in the Solution of Eureka-
Type Problems, Psychometrika, 20 (2), 139-148.
Roll, R. (1986), The Hubris Hypothesis of Corporate Takeovers, Journal of Business, 59, 197-
216.
Samuelson, W. (1984), Bargaining Under Asymmetric Information, Econometrica, 52(4), 995-
1006.
Samuelson, W. F. and Bazerman, M. H. (1985), The Winner's Curse in Bilateral Negotiations, in
V.L. Smith (ed.), Research in Experimental Economics, 3, Greenwich, CT: JAI Press.
Tor, A. and Bazerman, M.H. (2003). Focusing Failures in Competitive Environments;
Explaining Decision Errors in the Monty Hall Game, the Acquiring a Company Game, and
Multiparty Ultimatums, Journal of Behavioral Decision Making, 16, 353-374.
Sheremeta, R. M. and Zhang, J. (2010), Can Groups Solve the Problem of Over-bidding in
Contests? Social Choice and Welfare, forthcoming.
Selton, R., Abbink, K. and Cox, R. (2005), Learning Direction Theory and the Winner’s Curse,
Experimental Economics, 8 (1), 5-20.

37
Stoner, J. A. F. (1961), A Comparison of Individual and Group Decisions Under Risk,
Unpublished Master's Thesis, Massachusetts Institute of Technology, School of Management.
Sutter, M., Kocher, M. and Strauss, S. (2009), Individuals and Teams in Auctions. Oxford
Economic Papers, 61, 380-394.
Zhang, J. (2009), Communication in Asymmetric Group Competition over Public Goods,
Working Paper, McMaster University.
Zhang, J. and M. Casari (2010), How Groups Reach Agreement in Risky Choices: An
Experiment, Economic Inquiry, forthcoming.

DO GROUPS FALL PREY TO THE WINNER’S CURSE?
Tables and Figures
Table 1: Buyer’s profits for selected bids
Actual profits
depending on the company value s Expected
Bid, b s = 38 s = 60 s = 90 s = 130 s = 240 profits
38 (loss free) 19 0 0 0 0 3.8
60 (optimal) -3 30 0 0 0 5.4
90(naïve) -33 0 45 0 0 2.4
130 -73 -40 5 65 0 -8.6
240 -183 -150 -105 -45 120 -72.6

Table 2: Descriptive statistics for the company takeover bids
Treatment
Individual Group Signal
part 3
(a)
part 4
(b)
part 3
(c)
part 4
bids (d)
part 4
proposals (e)
part 3
(f)
part 4
(g)
Bid distribution (percentages)
38 (loss free) and 39 3.3 10 8.6 8.0 9.0 4.4 7.3
60 (optimal) and 61 35.6 37.5 30.6 50.5 48.5 17.8 29.7
90 (naïve) and 91 38.9 31.7 36.7 31.5 30.2 45 40.8
130 and 131 11.1 14 11.7 7.2 6.8 21.1 16.5
240 and 241 1.7 2 1.4 2.5 3.1 1.1 1
All others (dispersed bids) 9.4 4.8 11.1 0.2 2.5 10.6 4.7
Other measures of performance
Winner's curse (percentage of bids with negative expected profits) 20 18.3 18.3 9.75 10.5 31.1 18.3
Actual profits per period (tokens) -1.65 0.4 1.21 2.13 2.13 1.41 2.1
Simulated profits per period with optimal bids (tokens) 4.8 6.93 5.73 5.93 5.93 4.8 6.93
Fraction of obs. with low cash balances (limited liability) 0% 2% 0.8% 3.2% -- 0% 0%
Number of obs., Number of subjects 180, 30 600, 30 360, 60 400,60 1200,60 180, 30 600, 30
Notes to Table 2: Distribution of bid signals for (g) is the same as for (b)

Table 3: Who placed optimal bids and winners’ curse bids
All treatments
(part 3 – Individual bids)
Individual treatment (part 4)
Group treatment Individual proposals
(part 4)
Signal treatment (part 4)
Dependent variable Optimal
bid (a)
Winner’s curse bid
(b)
Optimal bid (c)
Winner’s curse bid
(d)
Optimal proposal
(e)
Winner’s curse
proposal (f)
Optimal bid (g)
Winner’s curse bid
(h)
Risk averse (switch point>13) 0.07 -0.04 (^) (^) -0.06 -0.06* (~) (~) (0.09) (0.07) (0.14) (0.03) Risk seeking (switch point<8) -0.13 -0.08 (^) (^) (~) (~) -0.15 0.30 (0.08) (0.08) (0.11) (0.26) High confidence in bid or proposal (-) (-) 0.05 -0.09 0.02 -0.08*** -0.13** 0.24* (0.14) (0.08) (0.08) (0.03) (0.06) (0.13)
Demographics Economics and Business Major 0.10 -0.06 0.31*** -0.08 0.14 0.06 -0.24 0.10 (0.09) (0.08) (0.09) (0.06) (0.13) (0.09) (0.16) (0.15) Science and Engineering Major 0.20*** -0.11 0.40*** -0.10 0.13 0.02 -0.44*** 0.16 (0.08) (0.09) (0.11) (0.08) (0.14) (0.07) (0.11) (0.19) Bottom 25percentile SAT/ACT -0.10* 0.24*** 0.05 0.00 -0.01 0.01 -0.13* -0.09* (0.06) (0.08) (0.14) (0.08) (0.12) (0.04) (0.08) (0.05) Male 0.05 0.07 0.00 0.14*** 0.02 0.05 -0.11 0.04 (0.06) (0.06) (0.14) (0.04) (0.09) (0.03) (0.08) (0.09) Missing demographic data -0.02 0.06 -0.25*** 0.22** -0.14 0.09 -0.18* 0.06 (0.10) (0.13) (0.07) (0.11) (0.16) (0.14) (0.10) (0.11) 1/period -0.07 -0.08 1.20 -0.12 -1.69** -0.06 -1.49* 0.98 (0.07) (0.06) (0.92) (0.65) (0.71) (0.29) (0.89) (0.63) At least one signal from two other subjects is optimal bid 0.08 (0.06) Both signals from two other subjects are optimal bids 0.04 (0.10) At least one signal from two other subjects is winner’s curse bid 0.01
(0.04) Both signals from two other subjects are winner’s curse bids -0.09**
(0.04) Number of observations, Number of subjects 717, 120 717, 120 589, 30 589, 30 1166, 60 1166, 60 600, 30 600, 30 Pseudo R-squared 0.098 0.098 0.090 0.071 0.058 0.086 0.233 0.249 Log likelihood -387.8 -355.3 -354.1 -259.3 -760.5 -353.3 -279.9 -215.9

Notes to Table 3: Marginal effects from probit regression with robust errors on individuals. Observations with low cash balance were excluded from the regression (limited
liability issue). Four dummies for the value taken by the company in the previous period were in the regression but not reported in the table, value_was60, value_was90,
value_was130, value_was240 (company value was 60, 90, 130 or 240 in the last period); for period one they were set to zero value. (-) Across all treatments subjects were
required to indicate the level of confidence on the bid in part 4 but not in part 3. (^) everyone in this treatment is risk neutral or moderately risk averse. (~) risk preference
regressors are dropped because of collinearity Session dummies were included in the regression but not reported in the table. Robust standard errors are in parentheses.
Significance levels are *** p<0.01, ** p<0.05, * p<0.1.

Table 4: Aggregation of individual proposals into a group choice
Group treatment, Part 4
Group classification based on individual
proposals:
No. of
proposals
Actual no. of
winner’s
cursed bids
Expected no. of
winner’s cursed bids
if subjects exercise
veto power
No winner's curse proposals 912 3 0
There is only one winner’s curse proposal 216 54 0
There are two winner’s curse proposals 54 42 0
All winner's curse proposals 18 18 18
Total 1,200 117 18
Frequency of winner’s curse
(out of 1200) 10.6% 9.7% 1.5%

Table 5: Solving disagreement among individual proposals
Group treatment, Part 4
Dependent variable:
1=individual proposal became group
choice,
0= otherwise
All obs.
Periods
1-6
(a)
All obs.
Periods
7-20
(a)
Periods
1-6
(b)
Periods
7-20
(b)
Periods
1-6
(c)
Periods
7-20
(c)
Proposal is median and majority 0.67*** 0.69*** 0.95*** 0.73***
(0.06) (0.04) (0.02) (0.13)
Proposal is median but not majority 0.05 0.40*** 0.15 0.39**
(0.15) (0.05) (0.16) (0.16)
Among group proposals, it yields 0.14 -0.11* -0.24* -0.34*
the highest expected profit (0.09) (0.06) (0.13) (0.19)
Proposal is winner's curse -0.45*** -0.01
(0.13) (0.15)
Proposal is optimal: 60 or 61 -0.19 -0.10
(0.13) (0.13)
Low cash endowment, 0.14 0.05 (^) -0.19 (^) -0.11
below limited liability threshold (0.31) (0.24) (0.14) (0.15)
Subject is risk averse 0.03 0.09 -0.20 0.35** -0.42*** 0.05
(switch point>13) (0.13) (0.10) (0.21) (0.15) (0.13) (0.20)
Subject is risk seeking -0.31*** -0.06 -0.00 -0.17 0.12 -0.06
(switch point<8) (0.12) (0.09) (0.22) (0.19) (0.17) (0.18)
High confidence proposal -0.13 0.06 -0.36 0.02 -0.00 0.07
(0.10) (0.07) (0.24) (0.13) (0.21) (0.14)
Demographics
Economics and Business major 0.01 0.03 -0.17 -0.46*** -0.53*** -0.54***
(0.15) (0.11) (0.31) (0.12) (0.17) (0.08)
Science and Engineering major 0.05 0.09 -0.37** -0.33** -0.52*** -0.37***
(0.14) (0.10) (0.18) (0.15) (0.17) (0.10)
Bottom 25% SAT/ACT score -0.19* 0.07 -0.40* 0.20** -0.06 0.11
(0.10) (0.08) (0.21) (0.09) (0.23) (0.12)

Male 0.14 -0.01 0.48*** -0.13 0.07 -0.16
(0.09) (0.07) (0.12) (0.12) (0.13) (0.15)
Missing demographic data 0.02 0.13 0.22* 0.13 0.07 -0.16
(0.15) (0.10) (0.13) (0.19) (0.23) (0.23)
Chat message coding
I talked first (1 or 0) -0.07 0.22 0.11 0.08
(0.27) (0.19) (0.19) (0.16)
I talked last (1 or 0) 0.03 -0.23** -0.03 -0.16**
(0.21) (0.11) (0.11) (0.08)
Numerical -0.00 0.13*** -0.00 0.10***
(0.07) (0.04) (0.05) (0.03)
Think -0.07 -0.24** -0.04 -0.25***
(0.09) (0.10) (0.06) (0.08)
Pressure 0.01 0.08* -0.05 0.08
(0.19) (0.04) (0.09) (0.05)
Reinforcement -0.11 0.47*** 0.10 0.50***
(0.16) (0.13) (0.13) (0.13)
Loss -0.18 0.11 0.12 0.13
(0.17) (0.12) (0.09) (0.08)
Aggregate 0.15 (-) -0.16* (-)
(0.11) (0.09)
Rotate 0.49 -0.66*** 0.23 -0.50**
(0.41) (0.22) (0.34) (0.24)
Agreement -0.22** -0.01 -0.25*** -0.02
(0.10) (0.06) (0.09) (0.06)
Irrelevant -0.07* -0.05* -0.04 -0.02
(0.04) (0.03) (0.04) (0.03)
Number of obs., Number of subjects 240, 60 405, 60 101, 39 176, 36 101, 39 176, 36
Pseudo R-squared 0.370 0.325 0.564 0.405 0.246 0.187
Log likelihood -104.1 -188.6 -30.48 -72.53 -52.79 -99.18

Notes to Table 5: Probit regression with robust standard errors (clusters on groups). Significance levels *** p<0.01, ** p<0.05, * p<0.1.
Specifications (a) include all individual proposals unless all identical within the group in a given period (645 obs.) Specifications (b) and
(c) include all the observations when there is a disagreement in the proposal stage with at least one proposal is a winners’ cursed bid (282
obs.) and when the final group decision is winner’s cursed bid even though none of the proposals are winner’s cursed bids (3 obs.). (^) for
periods 1-6, the limited liability regressor is a structural zero: it perfectly predicts failure (proposal does not prevail in group choice), one
observation is dropped from the regression; (-) for period 7-20, chat message coding “aggregate” regressor perfectly predicts failure, 7
observation are dropped from the regression.

Table 6: Messages in groups facing winner's curse proposals
Code Category Description Kappa Z
Frequency
%
coder1
Frequency
%
coder2
Average
frequency
a - talk about numerical bids 25.44
19 Persuade other to bid 60 0.9275 31.45 3.74 3.74
20 Persuade others to bid 90 0.8903 30.19 9.57 9.74
21 Persuade others to place a very high bid
(i.e., any bid above 94) 0.9528 32.31 10.09 10.43
16 Argue in favor of their own bid 0.9255 31.39 1.74 1.83
b - thinking process of individual except mentioning losses 11.96
5 Talk about past random draws 0.6978 23.66 1.39 1.83
6 Learning through trials and errors 0.9087 30.81 0.43 0.52
8 Think through the potential payoffs of a given
bid for alternative random draws 0.8885 30.13 0.43 0.35
9 Stick to the same bid for several periods 0.9728 32.99 3.22 3.39
2 Take risks, enjoyment of risky choices 0.9059 30.72 3.13 3.57
3 Play safe, fear of risky choices 0.8892 30.15 2.7 2.96
c - direct pressure (statements or threats to disagree) 6.39
10 Threat to disagree with others in the final
group decision 0.6662 22.59 0.09 0.17
11 Talk about earning zero in case of
disagreement 1 33.91 0.26 0.26
18 Disagreement with someone else's proposals 0.9537 32.34 5.91 6.09
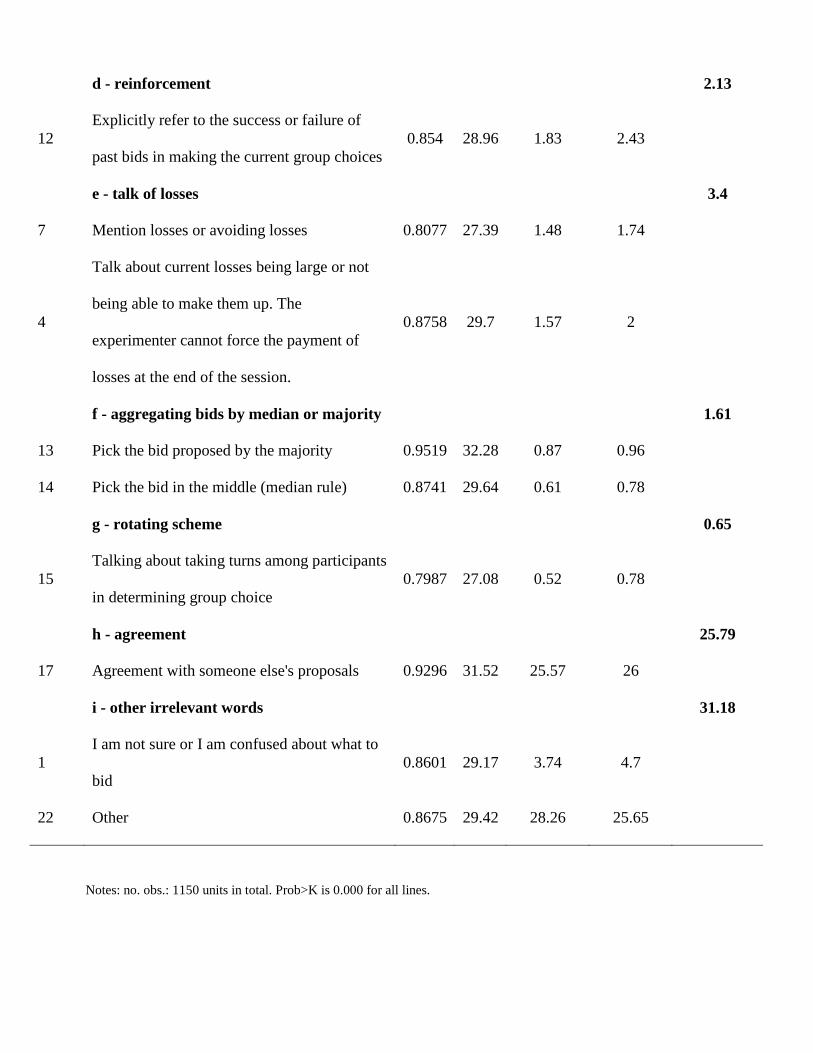
d - reinforcement
2.13
12 Explicitly refer to the success or failure of
past bids in making the current group choices 0.854 28.96 1.83 2.43
e - talk of losses 3.4
7 Mention losses or avoiding losses 0.8077 27.39 1.48 1.74
4
Talk about current losses being large or not
being able to make them up. The
experimenter cannot force the payment of
losses at the end of the session.
0.8758 29.7 1.57 2
f - aggregating bids by median or majority 1.61
13 Pick the bid proposed by the majority 0.9519 32.28 0.87 0.96
14 Pick the bid in the middle (median rule) 0.8741 29.64 0.61 0.78
g - rotating scheme 0.65
15 Talking about taking turns among participants
in determining group choice 0.7987 27.08 0.52 0.78
h - agreement 25.79
17 Agreement with someone else's proposals 0.9296 31.52 25.57 26
i - other irrelevant words 31.18
1 I am not sure or I am confused about what to
bid 0.8601 29.17 3.74 4.7
22 Other 0.8675 29.42 28.26 25.65
Notes: no. obs.: 1150 units in total. Prob>K is 0.000 for all lines.

Figure 1: Fraction of optimal bids over time
Period 1-6 (Individual) Period 1-6 Period 7-12 Period 13-200%
5%
10%
15%
20%
25%
30%
35%
40%
45%
50%
55%
60%
IndividualGroupSignal

Figure 2: Fraction of winner’s curse bids over time
Period 1-6 (Individual) Period 1-6 Period 7-12 Period 13-200%
5%
10%
15%
20%
25%
30%
35%
40%
45%
50%
55%
60%
IndividualGroupSignal

Figure 3: Fraction of dispersed bids over time
Period 1-6 (Individual) Period 1-6 Period 7-12 Period 13-200%
5%
10%
15%
20%
25%
30%
35%
40%
45%
50%
55%
60%
IndividualGroupSignal

Figure 4: Lottery choices in group (part 2)
0%
10%
20%
30%
40%
50%
60%
70%
80%
90%
100%
1 2 3 4 5 6 7 8 9 10 11 12 13 14 15Lottery number
Frac
tion
of d
ecis
ions
with
dis
agre
emen
t
0
20
40
60
80
100
120
PRUDENTSHIFT
MEDIAN
RISKYSHIFT
total no. ofdecisions