do investment banks matter for m&a returns?
TRANSCRIPT
University of Pennsylvania University of Pennsylvania
ScholarlyCommons ScholarlyCommons
Finance Papers Wharton Faculty Research
2011
Do Investment Banks Matter for M&A Returns? Do Investment Banks Matter for M&A Returns?
Jack Bao
Alex Edmans University of Pennsylvania
Follow this and additional works at: https://repository.upenn.edu/fnce_papers
Part of the Finance Commons, and the Finance and Financial Management Commons
Recommended Citation Recommended Citation Bao, J., & Edmans, A. (2011). Do Investment Banks Matter for M&A Returns?. Review of Financial Studies, 24 (7), 2286-2315. http://dx.doi.org/10.1093/rfs/hhr014
This paper is posted at ScholarlyCommons. https://repository.upenn.edu/fnce_papers/331 For more information, please contact [email protected].

Do Investment Banks Matter for M&A Returns? Do Investment Banks Matter for M&A Returns?
Abstract Abstract We document a significant investment bank fixed effect in the announcement returns of M&A deals. The interquartile range of bank fixed effects is 1.26%, compared with a full-sample average return of 0.72%. The results remain significant after controlling for the component of returns attributable to the acquirer. Our findings suggest that investment banks matter for M&A outcomes, and contrast earlier studies that show no positive link between various measures of advisor quality and M&A returns. Differences in average returns across banks are also persistent over time and predictable from prior performance. Clients do not chase past returns, which may explain why persistence exists in M&A performance while it is absent in mutual funds.
Disciplines Disciplines Finance | Finance and Financial Management
This journal article is available at ScholarlyCommons: https://repository.upenn.edu/fnce_papers/331
Electronic copy available at: http://ssrn.com/abstract=952935Electronic copy available at: http://ssrn.com/abstract=952935
Do Investment Banks Matter for M&A Returns?
Jack Bao Fisher College of Business, Ohio State University
814 Fisher Hall 2100 Neil Ave
Columbus, OH 43210 [email protected]
Alex Edmans
The Wharton School, University of Pennsylvania 2318 Steinberg Hall – Dietrich Hall
3620 Locust Walk Philadelphia, PA 19104
Review of Financial Studies, forthcoming
Abstract We document a significant investment bank fixed effect in the announcement returns of an M&A deal. The inter-quartile range of bank fixed effects is 1.26%, compared to a full-sample average return of 0.72%. The results remain significant after controlling for the component of returns attributable to the acquirer. Our findings suggest that investment banks matter for M&A outcomes, and contrast earlier studies which show no positive link between various measures of advisor quality and M&A returns. Differences in average returns across banks are also persistent over time and predictable from prior performance. Clients do not chase past returns, which may explain why persistence exists in M&A performance while it is absent in mutual funds. JEL Classification Codes: G24, G34 __________________ We thank an anonymous referee, the Editor (Alexander Ljungqvist), Franklin Allen, Alexander Dyck, Florian Ederer, Vincent Glode, Itay Goldstein, Todd Gormley, Dirk Hackbarth, Kewei Hou, Jeff Jaffe, Dirk Jenter, Adam Kolasinski, Anna Kovner, Gilberto Loureiro, Qingzhong Ma, Stew Myers, Micah Officer, David Pedersen, Nagpurnanand Prabhala, Jun Qian, Michael Roberts, Rob Stambaugh, René Stulz, Torben Voetmann, Mike Weisbach, Fei Xie and seminar participants at the 2008 WFA meetings, 2008 FIRS meetings, the 2007 EFA meetings, BYU, Exeter, MIT Sloan, New York Fed, Toronto, Vanderbilt, Virginia and Warwick for valued input. Special thanks to Jerry Hoberg, Wei Jiang and Luke Taylor for extensive insightful comments. We are grateful to Michael Roberts for generously providing Dealscan-Compustat data, and Cong Wang for data that was used in an earlier draft of this project. Bao thanks the Dice Center for financial support. This paper was previously circulated under the titles “Do Investment Banks Have Skill? Performance Persistence of M&A Advisors” and “How Should Acquirers Select Advisors? Persistence in Investment Bank Performance.”

Electronic copy available at: http://ssrn.com/abstract=952935Electronic copy available at: http://ssrn.com/abstract=952935
2
Mergers and acquisitions (M&A) are among the most critical decisions a CEO can make.
Successful mergers can create substantial synergies, while misguided acquisitions can
lead to misallocation of companies to parents unable to reap their full potential. In
addition to these large effects on shareholder value, a bad acquisition also increases the
CEO’s risk of being fired (Lehn and Zhao (2006)). A prominent example is the departure
of Carly Fiorina from Hewlett Packard, which was widely attributed to her acquisition of
Compaq. The quality of M&A transactions is also of great importance to the economy as
a whole. The total value of M&A announced by a U.S. acquirer in 2007 was $2.1tr,
around 15% of GDP.
Since CEOs make M&A decisions rarely, they typically lack experience and seek
counsel from investment banks. The skilled advice hypothesis is that banks help clients
to identify synergistic targets and negotiate favorable terms. If banks indeed provide
valuable advice, it is reasonable to expect that the highest-quality advisors lead to the best
outcomes. However, existing research generally fails to find such a relationship. Bowers
and Miller (1990) and Michel, Shaked and Lee (1991) measure an advisor’s quality by
the prestige of its name and find no link with acquirer returns; Rau (2000) uses market
share to measure quality and documents a negative relationship. Servaes and Zenner
(1996) find no benefit of hiring any advisor at all, compared to executing the deal in-
house.1 These findings instead appear to support the passive execution hypothesis, that
banks do not provide true advice but are simply “execution houses” who undertake deals
as instructed by the client. If true, such a conclusion has troubling implications. The
investment banking industry, which consumes a significant proportion of an economy’s
talented human capital, is mainly a deadweight loss to society. CEOs’ inexperience in
M&A is not mitigated by hiring an advisor, which may explain why so many acquisitions
destroy value.
This paper reaches a different conclusion. Prior studies investigate the
importance of investment banks for M&A outcomes by hypothesizing a measure of
advisor quality, such as market share or name prestige, and correlating it with this
measure of quality. Such studies will only find significant results if their chosen 1 To our knowledge, only Kale, Kini and Ryan (2003) find gains to employing market-leading advisors. They study 324 contested takeovers of public targets, and find that large banks are more likely to withdraw when the price becomes too high. By contrast, both we and Rau (2000) find a negative link between market share and performance across all M&A transactions (over 15,000 in our sample), of which approximately 1/3 are public. One reason may be that the incentives to act in the client’s interest are far stronger in public situations, where “honest” advice to withdraw from a deal is widely observed.

3
measures are truly accurate proxies of ability. We instead employ a fixed effects
analysis. This is a broader approach which examines whether banks exhibit differential
deal returns in the first place, without having to specify a measure of advisor quality with
which any differential will be correlated. Indeed, we find significant bank fixed effects to
a deal’s 3-day cumulative abnormal return (CAR). Studying all banks that advised on at
least 10 deals over 1980-2007 and controlling for time effects, the difference between the
25th and 75th percentile bank is 1.26%. This difference is economically meaningful
applied to the mean bidder size of $10 billion and compared to the mean CAR of 0.72%.
An F-test that bank fixed effects are equal is rejected at the 1% significance level. Our
results support the skilled advice hypothesis and contrast prior findings that banks have
little effect on M&A outcomes, as predicted by the passive execution hypothesis.
Returns analyses have also been used to evaluate skill in mutual funds, hedge
funds and security analysts. Our setting shares two challenges also faced by studies of
stock-picking ability. The first is performance attribution: returns are not purely the
responsibility of the financial intermediary. In an investment setting, returns also depend
on the portfolio’s factor loadings and realized factor outcomes. Since investment skill
depends on how a portfolio performs over the long run, investment studies typically
investigate long-horizon returns. Therefore, the results are highly contingent on the
benchmark asset pricing model used (Fama (1998)). Benchmark adjustment is less of an
issue here, since performance can be measured by short-horizon announcement returns:
in an efficient market, they capture the full value impact of an acquisition. Our setting
faces a different performance attribution challenge – CAR may be the responsibility of
either the bank or the client. A bank may be associated with positive (negative) CARs if
it is systematically mandated by high-quality (empire-building) clients. Many prior
studies (e.g. Bowers and Miller (1990), Michel, Shaked and Lee (1991), Rau (2000),
Hunter and Jagtiani (2003)) do not tackle performance attribution and assume CAR
results entirely from the bank. Others control for deal characteristics (e.g. Servaes and
Zenner (1996), Kale, Kini and Ryan (2003)), but acknowledge that this solution may go
too far the other way, since deal characteristics are often the advisor’s responsibility.2
We control for the component of CAR that can be explained by acquirer characteristics
2 For example, Servaes and Zenner (1996) caveat their conclusion by acknowledging “it is not certain that the [deal characteristics] affecting investment banking choice are exogenous. For example, it is possible that investment banks influence the form of payment or the decision to pursue the acquisition.”

4
that proxy for the likelihood that the client is empire-building (such as free cash flow and
various governance measures, as used by Masulis, Wang and Xie (2007)) and high-
quality (such as stock and operating performance, and Tobin’s Q). We also add acquirer
fixed effects to proxy for time-invariant unobservable measures of quality. Even after
these controls, the bank fixed effects remain statistically and economically significant,
with an inter-quartile range of 1.23%.
A second shared challenge is that average returns depend not only on ability, but
also scale. Maksimovic and Phillips (2002) argue that conglomerate firms’ lower
productivity arises since they are able to accept all projects with positive NPV (including
those with modestly-positive NPV), whereas single-segment firms with financing
constraints can only pursue those with high NPV. Applied to our setting, this limited
capacity hypothesis posits that banks differ not in ability, but capacity to accept
mandates. Small banks can work only on the highest-return deals; large banks also
accept mandates with small (but positive) value and thus exhibit lower average returns.
We refute this hypothesis by showing that the banks with the lowest average returns are
not the most frequent advisors – the correlation between bank fixed effects and market
share is an insignificant 0.03 (p-value of 0.72). Indeed, the most frequent advisors
occupy the middle of the fixed effects distribution.
While addressing the limited capacity hypothesis, that the most positive and most
negative fixed effects are associated with infrequent advisors may give rise to two quite
different concerns. First, these extreme fixed effects may result from measurement error
arising from few observations, rather than a “true” dispersion of advisor quality. Second,
it may be that there is little dispersion among the major banks who matter more for the
M&A market – i.e. the result is not generalizable to the most important advisors. Note
that infrequent advisors will not drive the statistical significance of our results: if many
banks have imprecisely measured fixed-effects, the F-test will have little power. To
address concerns that they drive our economic magnitudes, the inter-quartile range
reported earlier is based on fixed effects weighted by the inverse of their standard errors.
Moreover, to further investigate whether our results hold among frequent advisors alone,
we then test the equality of bank fixed effects on a sub-sample of the largest banks who
advise on at least 84 deals over the 28-year sample period (i.e. 3 per year). Even though
the number of banks falls markedly from 143 to 42, the results stay significant with an
inter-quartile range of 0.74% (controlling for acquirer characteristics and acquirer fixed
5
effects) and the F-test of equality is rejected at the 1% level. Thus, there are meaningful
differences even among the most active advisors.
Having documented that banks are associated with different CARs over the entire
period, we then ask whether these differences are predictable based on historic data, and
thus can be used by clients to guide their selection of advisors. The fixed effect implies a
persistent component to a bank’s CAR and thus provides us with a priori motivation to
predict future returns using past returns, rather than the market share and prestige
measures previously studied. Indeed, we find that performance is persistent: the top
quintile of banks based on CAR over the past 2 years outperforms the bottom quintile by
0.94% over the next 2 years (significant at 1%). Persistence remains after removing the
component of CAR that can be attributed to client characteristics. Inconsistent with the
limited capacity hypothesis, the low CARs of the bottom-quintile banks do not arise from
executing mildly positive transactions, but from executing double the proportion of
value-destructive deals as the top quintile. Regression analyses yield similar results: a
bank’s average returns are significantly linked to its past average returns, even when
controlling for market share. When interacting past returns with market share, the
interaction term is insignificant but past returns alone remain significant, suggesting that
effect of past returns is similar for both frequent and infrequent advisors.
The existence of persistence in M&A advice contrasts the lack of persistence in
mutual funds. Berk and Green (2004) show that, even if mutual funds possess skill, this
does not translate into persistence if investor flows respond to past performance and there
are diminishing returns to scale. We find that a bank’s market share is independent of its
past CAR (also found by Rau (2000)). This lack of performance-chasing can potentially
reconcile why persistence exists in M&A advice but not mutual funds (e.g. Carhart
(1997)). Instead, we find that mandate awards are highly correlated with past market
share, even though market share negatively predicts future performance.
The selection of high-market share rather than high-CAR advisors has two quite
different interpretations. First, it may be efficient, if clients build up relationship-specific
capital with particular banks and thus rationally retain the same advisor irrespective of
past performance; market share has predictive power as it measures a bank’s existing
relationships. We show that retaining a past advisor is associated with worse future
performance, particularly if the bank advised on negative-CAR transactions in the past,
which does not support the view that relationship-specific capital improves future M&A
6
performance. However, clients may derive other services from banking relationships,
such as lending and underwriting, which rationally induces them to retain their existing
bank (see Yasuda (2005), Ljungqvist, Marston and Wilhelm (2006, 2009)).
Alternatively, it may be inefficient if clients are not locked into relationships but
voluntarily choose advisors based on market share, under the misperception that it
predicts superior returns. Such behavior is consistent with real-life practices: market
share league tables are widely publicized by both the media and the banks themselves,
and so both academics and practitioners have come to use them as a measure of expertise.
Ertugurul and Krishnan (2010) also study the existence of ability in investment
banking. They focus on individual bankers who switch advisors, rather than banks
themselves.3 Another difference is that, in addition to identifying a fixed effect in the full
sample, we also investigate persistence and thus the predictability of future outcomes
using past performance. Jaffe, Pedersen and Voetmann (2009) demonstrate persistence
in M&A performance at the client level. Mikhail, Walther and Willis (2004) and Hoberg
(2007) document persistence in two other banking services, security analysis and equity
underwriting.
This paper proceeds as follows. Section 1 discusses the potential sources of
differential M&A returns across banks and Section 2 describes the data. Section 3
documents significant advisor fixed effects to M&A returns and shows that average
returns are predictable using past performance. Section 4 shows that mandate awards are
correlated not with past performance but with market share, and Section 5 concludes.
1. Motivation: Why Might Banks Be Associated With Differential M&A Returns?
This section discusses a theoretical framework for why there may be a bank fixed
effect to M&A returns, i.e. why certain banks may be systematically associated with high
or low return deals. To understand the possible sources of correlation, we first outline the
role that advisors play in M&A deals. Their actual level of involvement can vary
significantly across transactions, and falls under three broad categories.
3 We study banks rather than individual bankers for two reasons. First, a transaction typically leverages resources across the entire bank (e.g. a debt-financed acquisition of a German chemicals target by a UK pharmaceuticals firm may involve the M&A and debt product groups and the pharmaceuticals, chemicals, UK and Germany coverage teams). Second, it is difficult to know which particular banker worked on a certain deal. A bank’s chemicals team consists of several bankers, many of whom will not be involved in the deal. If a bank’s skill hinges on particular star bankers (who often move between firms) rather than the whole organization, we should find weak bank fixed effects and bank-level persistence.

7
In a “bank-initiated deal,” the advisor is involved in both selecting the deal and
negotiating terms, and thus is responsible for the entire CAR. In a “standard client-
initiated deal,” the client proposes the transaction, but lacks the ability to identify good
deals and so relies on the bank to advise whether to pursue it. Since the bank can reject a
bad deal, it is again responsible for deal selection in addition to negotiation, and thus the
entire CAR. Not all banks will reject the deal, but for reasons which are their
responsibility. Some lack the ability to identify bad deals; others know that a deal will
destroy value but undertake it to maximize their own fee income rather than pursuing the
client’s interests. A bank cannot blame low CARs on having to work on bad deals, since
it controls its deal flow – just as a lender cannot blame losses on poor credit quality, since
it controls the loans it chooses to write.
In a “fixated client deal,” the acquirer has already decided on the target and does
not seek advice on its appropriateness; it uses the bank simply to execute the transaction
on the best terms possible. This may occur in two cases. First, the client may be skilled
in identifying targets and does not need the bank’s input. At the other extreme, the client
is empire-building or hubristic and wishes to pursue a bad deal even if the bank cautions
otherwise. By accepting the mandate, the bank may be adding value compared to the
counterfactual of the client pursuing the acquisition with a rival advisor. The bank is not
responsible for the component of CAR that can be attributed to the acquirer’s skill or
hubris, only the orthogonal component.
Given banks’ varying levels of involvement, systematic differences in average
returns may stem from three sources. The skilled advice hypothesis is that certain
advisors possess ability, either in proposing targets (for bank-initiated deals) or in
negotiating terms (for all deals). Alternatively, variation may stem from systematically
turning away bad deals. This requires ability to identify such deals, plus trustworthiness
to turn them down. We use the term “skilled advice” to include these three qualities of
deal identification, transaction negotiation and trustworthiness. Thus, even a bank with
high-quality employees may be classified as low-ability if its business model is to accept
every mandate, regardless of whether it will create client value.
The passive execution hypothesis is that banks lack ability in target selection or
deal negotiation. Instead, variation in returns arises because the bank is systematically

8
mandated by skilled (empire-building) clients.4 In reality, banks exert substantial effort
in pitching deals to clients: they allocate the majority of bankers to client coverage (rather
than deal execution) groups which are primarily responsible for pitching. Therefore, it
seems unlikely that fixated client deals are sufficiently prevalent to explain differences in
average returns. However, since it is impossible to observe which party initiates a
transaction and provide direct statistics on this prevalence, to be conservative we also
report results controlling for the component of returns attributable to acquirer
characteristics. The passive execution hypothesis would also be supported if bank fixed
effects are not significant in the first place.
The limited capacity hypothesis posits that banks differ not in ability, but their
capacity to accept mandates. A bank may exhibit a high average CAR because it can
work on only the highest value-creating deals, whereas low CAR may arise if a bank has
the capacity to execute also mildly good deals. We evaluate this hypothesis by
investigating whether a bank’s low average CAR stems from advising on deals with
modest value, or value-destructive deals. 5
2. Performance Metrics, Data and Descriptive Statistics
We use Thomson Financial’s Securities Data Company (SDC) data for mergers
announced between January 1980 and December 2007. Since deals that involve a change
of control are most likely to affect acquirer returns, we retain only transactions
categorized as “Merger”, “Acquisition”, “Acquisition of Assets” or “Acquisition of
Majority Interest” and drop all deals for which the acquirer’s initial stake exceeded 50%,
or its final stake was below 50%. We also drop transactions for which the acquirer had
no stock returns on CRSP or the deal value was below $1m (as in Rau (2000)). Our final
sample contains 15,344 deals.
Our value-creation measure is the acquirer’s (-1, +1) CAR over the CRSP value-
weighted index, which we winsorize at 1% and 99%.6 Stock returns are the relevant
4 Fernando, Gatchev and Spindt (2005) construct an assignment model where high-quality banks are systematically mandated by high-quality clients. 5 The limited capacity hypothesis is less likely for investment banks than corporations or mutual funds. Even small banks are able to work on very large transactions - for example, the boutique Gleacher employs 50 staff and advised on Bank of Scotland’s $40b merger with Halifax, AT&T’s $22b sale to SBC Communications and MFS Communications’ $14b merger with WorldCom. 6 We also obtain beta model returns from Eventus and find similar results. The correlation between beta model returns and returns above the CRSP value-weighted (VW) index is 98.5%. Since the beta model
9
performance measure as they represent the change in shareholder wealth, capitalizing all
of the future effects of an acquisition; they are thus used in the vast majority of
investment banking studies (see, e.g., Bowers and Miller (1990), Servaes and Zenner
(1996), Rau (2000)). While CAR refers to one specific deal, RET is the average CAR to
all deals advised by a bank in a j-year period. To be included in the analysis, a bank must
have announced at least 2j deals within the period.7
Some papers attribute the entire CAR to the bank, which constitutes an over-
attribution in fixated client deals. Others remove the component explained by deal
characteristics but this leads to an under-attribution, since deal characteristics may be
chosen by the advisor, either directly by initiating the deal or indirectly by accepting a
client-proposed mandate. We control for acquirer characteristics that proxy for client
quality or empire-building since they are outside a bank’s control, taking its client base as
given. Note that banks may have some control over their client base: if a bank advises a
standard client to abandon a bad deal, it does not enter its client base. Therefore,
controlling for acquirer characteristics is conservative.
A number of our characteristics are related to governance. Masulis, Wang and
Xie (2007) find that governance mechanisms are significantly related to acquirer returns.
Their primary measure is the Gompers, Ishii, and Metrick (2003) index. Unfortunately, it
is not suitable here since it is only available from 1990 and we require a long time series
to test for persistence; moreover, it is only available for a subset of firms in a given year.
We therefore include other governance mechanisms studied by Masulis et al.:
institutional ownership, leverage, and product market competition (measured by the
Herfindahl index and the industry’s median ratio of selling expense to sales). The second
group of characteristics are proxies for acquirer quality, also from Masulis et al: Tobin’s
Q, stock price run-up, and operating performance. We also use the other bidder
characteristics studied by Masulis et al.: free cash flow (which may facilitate empire-
building) and size (which Moeller, Schlingemann and Stulz (2004) show is negatively
correlated with returns). Since omitted acquirer characteristics may over-attribute CAR
to the bank, we add additional controls over and above those featured in prior literature. cannot be calculated for several acquirers, we use returns above the CRSP VW index. In addition, Hackbarth and Morellec (2007) show that betas change substantially upon a merger, and so a beta calculated based on historical data is likely to be misleading. We use the CRSP VW index as a benchmark as Rau and Vermaelen (1998) document biases when using size and book-to-market adjusted CARs. 7 Where a deal has multiple advisors, the deal is credited to each advisor separately. This is consistent with how SDC constructs market share league tables.
10
We include inside ownership from Compact Disclosure, to measure management’s
alignment with shareholders. Where missing, we impute it using firm sales and age.8 To
proxy for empire-building intent, we include the number of acquirer SIC codes and a
dummy for whether it made an acquisition in the previous five years. Finally, we include
dummies for the bidder’s Fama-French industry.9 Full variable definitions are given in
Table 1. All variables are calculated for the fiscal year ending the year before deal
announcement.10
We use CARRES to denote the residual CAR after controlling for acquirer
characteristics, and define RETRES as the average CARRES over a j-year period. The
regression results are shown in Table 2. Most coefficients are of the expected sign:
returns are increasing in leverage, operating performance and inside ownership, and
decreasing in free cash flow and the number of SIC codes. The R2 of 4% is
commensurate with Masulis et al.’s R2 of 5%. Their R2 is marginally higher as they
include deal characteristics, which are not appropriate here since they are under the
bank’s control.
Since the bank is responsible for raw CAR in all but fixated client deals, it
constitutes our core measure. As with any investment decision, an M&A transaction
should be undertaken if the NPV, irrespective of project characteristics, exceeds zero. A
bank cannot justify a negative-NPV transaction by arguing that other clients with (say)
the same number of SIC codes undertook even worse deals, if it had the option to turn
away the deal in the first place.
3. Return Differences Across Investment Banks
3.1. Full-Sample Fixed Effects
8 Specifically, we winsorize sales at 1% and 99% and regress inside ownership on sales and age. We then use the coefficients to predict inside ownership for the firms where it is missing. The R2 of the first-stage regression is 13%. 9 We use acquirer industry fixed effects rather than running the analysis for each industry separately (i.e. studying the fixed effect of a particular bank-industry group) because very few banks undertake at least 2j transactions within a given industry in j years, the minimum required to calculate an accurate RET measure. 10 Our regression of CAR on characteristics is run on the entire sample with year-fixed effects. Using a rolling window would cause data from the early period of the sample to be dropped and would also produce less precise estimates. Full-sample regressions are thus often used in asset pricing. We are not assuming that clients use past data to estimate the characteristics parameters for themselves when choosing banks. Instead, we posit that clients already have in mind a model of the effect of acquirer characteristics on returns, which they use to isolate the portion of CAR that is outside the bank’s control. As econometricians, we are attempting to estimate this model, for which we require the full sample.
11
Most prior research on advisor ability attributes a deal’s CAR entirely to the bank
and studies the association between average CAR and a variable hypothesized to proxy
for bank quality, such as market share or reputation (measured by the prestige of the
bank’s name). Such analyses will only find significant results if ability is correlated with
their chosen measures of advisor quality. Thus, the absence of a link with market share
or reputation need not imply that banks do not matter for M&A outcomes.
We therefore take a broader approach. Rather than hypothesizing a measure of
bank ability, we investigate whether banks exhibit differential CARs in the first place by
estimating the bank fixed effect component of a deal’s returns. We regress CAR on bank
fixed effects while controlling for time fixed effects, since market enthusiasm for M&A
may have varied over time. We then add acquirer characteristics to proxy for observable
measures of quality or empire-building. Finally, we add acquirer fixed effects, to proxy
for time-invariant unobservable measures of advisor quality. If two banks merge (e.g.
Deutsche Bank buys Bankers Trust), we construct one fixed effect for the target (Bankers
Trust) and a separate fixed effect for the acquirer (Deutsche Bank) both before and after
the merger.
The results are shown in Table 3, for the 143 banks that advised on at least 10
deals over 1980-2007 or were acquired by a bank that advised on at least 10 deals. Panel
A finds that, in all specifications, the fixed effects are highly significantly different from
each other (p-values < 0.01). Panel B demonstrates economic significance of these
differences. The difference between the 25th and 75th percentile banks is 0.9-1.3%11,
compared with the average CAR of 0.72% and the mean bidder size of $10 billion. To
our knowledge, these results constitute the first large-scale evidence that certain banks
are systematically associated with superior M&A returns, and contradict prior findings
that advisor quality has no positive effect on M&A outcomes.
While supportive of the skilled advice hypothesis, differential returns could also
be consistent with the limited capacity hypothesis, if the banks with the highest fixed
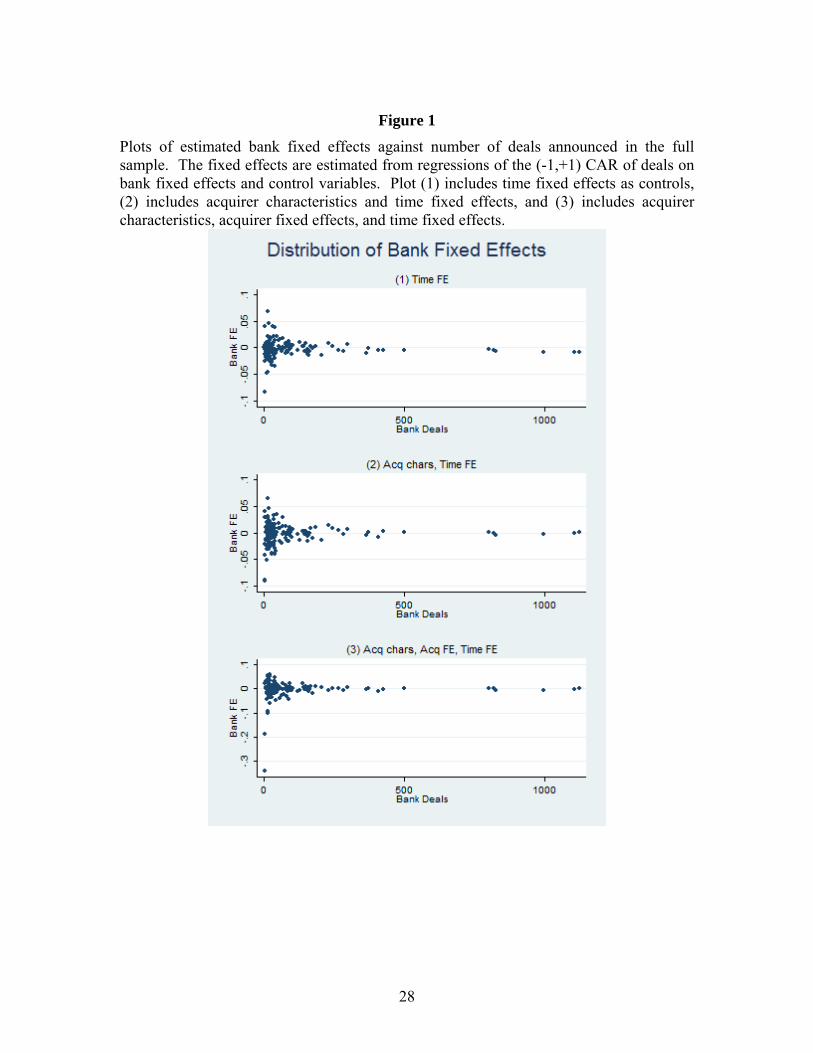
effects advise on the fewest transactions. To investigate this, Figure 1 presents a scatter
plot of a bank’s fixed effect against its market share (by number of deals). Inconsistent
with the limited capacity hypothesis, the most frequent advisors occupy the middle, rather
than the lower end of the distribution. There is a hump-shaped relationship between
11 Following Bertrand and Schoar (2003) we weight each fixed effect by the inverse of its standard error to account for estimation error. Without this weighting, the inter-quartile range of fixed effects is 1.7-2.2%.

12
market share and fixed effects, and the correlation between the two variables is an
insignificant -0.05 to 0.05.
While Figure 1 provides evidence against the limited capacity hypothesis, it may
raise a different concern – perhaps the significant results of Table 3 are driven by
infrequent advisors whose fixed effects are noisily measured, or who are relatively
unimportant for the M&A market as a whole. To address this concern, the inter-quartile
ranges of fixed effects that we reported above are after weighting each fixed effect by the
inverse of its standard error. Moreover, we further investigate this hypothesis by testing
for equality of fixed effects focusing only on the largest banks who advised on at least 84
transactions over the sample period, i.e. 3 per year. 42 banks meet this criterion. Panel C
shows that the fixed effects remain jointly statistically significant at the 1% level, and the
inter-quartile range is an economically meaningful 0.74%, even when continuing to
control for acquirer characteristics and acquirer fixed effects.
Another measurement concern is that, while CAR measures the full value impact
of a deal in an efficient market, it may understate it if part is incorporated into prices
before or after announcement. The former will occur if the deal leaks out early, bringing
the measured returns of both good and bad deals towards zero. The latter will occur if
investors do not notice certain effects of the transaction until later and this failure is not
unbiased (i.e. they fail to notice more good than bad effects, or vice-versa). While long-
run returns would capture a greater proportion of the transaction’s impact, they would
also incorporate many other corporate events (e.g. dividend and earnings changes not due
to the acquisition) and hence suffer from a high noise-to-signal ratio. Moreover, errors
resulting from failure to use the “true” benchmark model of stock returns are
compounded over long horizons (Fama (1998)).
In the classical “errors-in-variables” problem, where measurement error is
symmetric (i.e. the average error is zero) and similar across observations,
mismeasurement simply attenuates the results. Our setting differs from the standard
problem in two ways. First, mismeasurement arising from leakage or delayed reaction is
asymmetric: positive (negative) true returns are associated with negative (positive) errors.
If the mean return were zero, positive and negative true returns would be equally likely
and so the average error would also be zero – thus, the results would again be attenuated.
By contrast, our mean CAR is positive and so the average error is negative, biasing
reported returns towards zero and thus below the mean. This would not be a problem if

13
mismeasurement was similar across banks, since it would reduce measured RET evenly
across the sample. However, our second difference is that mismeasurement may be more
serious for certain banks. For example, small banks may advise small clients, whose
deals are less closely followed by M&A arbitrageurs or the media, leading to less leakage
and thus higher measured CAR. Thus, a low RET fixed effect may result from
measurement error rather than underperformance.12 We address the mismeasurement
explanation in a number of ways. First, it is reasonable to assume that transactions with
measured CARs exceeding 10% in absolute value did not suffer from attenuation. The
remaining 87% of deals is the subset for which attenuation may be present. The mean
CAR for this subset is -0.016%, very close to zero. Hence, any attenuation is indeed
towards the mean as in the classic errors-in-variables setting, and leads to our results
being understated.13 Second, in Panels D and E we filter out low-price and low-volume
acquirers, and show that the results are barely affected.14 For example, the inter-quartile
range is 0.8%, even when focusing on the 42 largest banks and adding all controls.
Third, we later show (in Panel D of Table 5) that the low average returns of low-RET
banks stem from them undertaking a high proportion of value-destructive deals, rather
than deals with small but positive measured value.15
To demonstrate the results on an individual bank level, Table 4 provides summary
statistics on the 15 largest banks by number of deals. There is significant variation in the
average returns to each bank, which range from -0.12% (UBS) to 1.47% (Bank of
America). Controlling for acquirer characteristics sometimes has a marked impact on
12 For example, assume banks A and B both execute deals with true value creation of 1.5%, 1.0% and -1.0% (i.e. a positive mean). Bank A’s CARs fully capture the value, and so its RET is 0.5%. Bank B’s CARs capture only half of the value due to leakage or underreaction, and so its CARs will be 0.75%, 0.5% and -0.5%, yielding a RET of 0.25%. 13 Continuing the earlier example, assume banks A and B both execute deals with true value creation of 12%, 1% and -1%. Bank A’s CARs fully capture the value and Bank B’s CARs for the final two deals are halved. Since the deals that exhibit attenuation have a zero average return, both banks will have the same RET. 14 Specifically, we keep only cases where the acquirer’s price is at least $1 before the acquisition and where there is trading volume either 2 or 3 days before the announcement and trading volume on the day after the announcement. These filters are similar in spirit to Diether, Lee, and Werner (2009) who use an initial $1 and zero volume screen. Our setting differs from the anomalies literature (e.g. Diether et al.) in that we only require that CAR be a signal of value creation and do not require that it be tradable; thus, the M&A literature does not typically employ such filters. Further, CRSP reports the midpoint of bid and ask if a closing price is not available. 15 A further hypothesis is that banks differ not in skill, but the fees that they charge: low RET banks may be adding the same value as their rivals, but charging higher fees. We are unable to calculate “pre-fee” CARs as fees are only available for 2,046 deals within our sample. However, among the deals that do have fee data, we find that the correlation between acquirer returns and fees (scaled by market cap) is a slightly positive 0.013, inconsistent with the hypothesis that low RET results from high fees.

14
banks’ performance measures: for example, Goldman Sachs has the second lowest fixed
effect (-0.93%) when only controlling for year dummies, but it rises to an above-average
0.17% when adding acquirer characteristics and acquirer fixed effects.
3.2. Persistence in Announcement Returns
While significant bank fixed effects suggest that advisors matter for M&A
returns, the results of Table 3 are not actionable by clients in their selection decisions,
since they are based on the full 28-year sample. We therefore analyze whether clients
can predict positive future returns based on historic data. The existence of a bank fixed
effect implies a persistent component to a bank’s average CAR and thus provides a priori
motivation for predicting future returns using an advisor’s past returns, rather than the
market share and reputation measures previously studied. This a priori motivation
mitigates potential concerns of data-mining for advisor characteristics with predictive
power. We calculate persistence in advisor performance in a similar manner to Jegadeesh
and Titman (1993) for stocks and Carhart (1997) for mutual funds. At the start of each
year, we sort banks into quintiles based on RET for the past j calendar years, where j =
{1,2,3}. Next, for each quintile, we calculate RET for all banks within the quintile over
the next k calendar years, where k = {1,2,3}. We report the difference in RET between
the top (Q5) and bottom (Q1) quintiles.16,17
Table 5 illustrates the results. Panel A documents significant persistence in raw
CAR in 8 out of the 9 time horizons. For example, when j=k=2, the difference between
Q1 and Q5 is 0.94%, significant at the 1% level. This result need not imply differential
ability, if fixated client deals comprise a substantial proportion of all transactions, and so
we next control for acquirer characteristics.18 Panel B illustrates persistence in the
component attributable to advisors (RETRES). Thus, the persistence in RET does not
16As future returns are overlapping, we correct for mechanical autocovariance by using Newey-West standard errors for panel data. 17 To illustrate our treatment of bank mergers, we continue with the example of the Deutsche Bank (DB) and Bankers Trust (BT) merger in June 1999. Consider a regression of 2-year RET on past 2-year RET. For any observations where RET ends in 1998 or earlier, DB and BT enter separately and both RET and RET are calculated on a standalone basis. For any observations where RET ends in 1999 or later, we drop the two standalone observations and create one combined observation. Specifically, RET for 1998-1999 includes all deals advised by either DB, BT or the merged entity during this period. To be consistent, the past RET measure will also include all deals advised by either bank or the merged entity in 1996-1997. 18 Since the persistence analysis uses short windows of 1-3 years, we do not include acquirer fixed effects, because identifying purely on repeat acquirers who switch advisors would mean that very few deals are used to calculate RETRES and lead to substantial noise.
15
arise because banks are systematically mandated by fixated acquirers, consistent with the
skilled advice hypothesis.
The above panels calculate RET and RETRES using an equally-weighted average
of a bank’s CARs. Equal-weighting is appropriate if one believes that each transaction is
a separate measure of the bank’s ability and thus should be considered equally; it is also
consistent with the main analysis on bank fixed effects which treats each deal equally.
Indeed, Mikhail, Walther and Willis (2004) and Hoberg (2007), who study performance
persistence in two other investment banking services (analyst recommendations and
equity underwriting) also use equal-weighting. However, weighting CARs by the size of
the transaction may be appropriate if one believes that banks put greater effort into larger
deals and so they are a more accurate measure of ability, or larger deals are more
complex and thus a truer test of advisor quality. Panel C repeats the analysis under size-
weighting. The results for our core performance measure, RET, are now stronger in
terms of economic significance in 8 of the 9 cells, and are at least 10% significant in six.
The results for RETRES remain positive in all cells but are significant in only two.
While suggestive of persistence, the above results admit other interpretations. A
notable feature of Panel A is that the average returns are positive even for Q1. Thus, it is
consistent with both the limited capacity and mismeasurement hypotheses: Q1’s low RET
arises not due to bad deals, but deals with modest measured returns – either because they
actually generate small value, or they actually generate large value which is under-
measured. We address both interpretations by calculating the “success ratio” of each
bank: the percentage of deals which have a positive CAR. The correlation between one-
year RET and bank success ratio is 0.68. Panel D illustrates that Q5 has approximately
double the success ratio of Q1, 65-72% compared to 27-38%. Therefore, inconsistent
with these hypotheses, Q1’s low RET stems from a high proportion of value-destructive
deals, rather than deals with small but positive measured returns. Additional suggestive
evidence against the limited capacity hypothesis is in Figure 1, which shows no
correlation between a bank’s RET and its market share.
While Table 5 is a bank-level analysis, which considers each bank equally,
another approach is a deal-level analysis. The Online Appendix shows that the results
remain robust – deals where the advisor was in the top quintile based on 2-year prior
performance outperform the bottom quintile by 0.91%, significant at the 1% level. This
persistence continues to hold after controlling for acquirer characteristics. The Online

16
Appendix also considers other performance measures than CAR. It documents
persistence in a bank’s completion ratio and speed of completion, and show that these are
weakly positively correlated with RET.
As in Section 3.1, we also subdivide the analysis into the largest and smallest
banks. Note that such a division significantly reduces power by lowering our sample
size. Other persistence analyses in corporate finance typically study accounting variables
(e.g. Bertrand and Schoar (2003), Lemmon, Roberts and Zender (2008)) which are
directly under the manager’s control. Moreover, many accounting variables are naturally
persistent: for example, Lemmon et al. study the level of leverage, which is naturally
persistent as any changes to leverage are with respect to last period’s leverage as a
starting point. Thus, far fewer observations are needed to achieve power. By contrast,
M&A returns start from a “clean slate” each time – the starting point is zero, rather than
the return of the last M&A deal. Moreover, M&A returns are notoriously noisy because
they reflect the market’s reaction rather than a variable controlled by management;
indeed, previous studies of M&A returns (e.g. Masulis, Wang and Xie (2007)) find low
R-squareds, implying they are difficult to explain. Thus, stratifying the sample will
markedly reduce the statistical power of our tests, as well as lowering the cross-sectional
variation within each subsample. Nevertheless, we perform such a stratification to
investigate the source of the significant results in Table 5. We define “large banks” as
those in the top 2/3 by number of deals in the period over which past performance is
measured, and “small banks” as those in the lowest third. We divide banks into terciles
of past performance in the large bank subsample and halves within the small bank
subsample, rather than quintiles, to obtain approximately the same number of banks in
each quantile as before (since 2/3 * 5 is close to 3 and 1/3 * 5 is close to 2). While the
number of banks remains similar within each quantile, moving from quintiles to terciles
or halves reduces the variation between the top and bottom quantile.
The left side of Panel E of Table 5 gives the RET results for large banks. 7 of the
9 cells are significant which suggests that persistence does exist among the large bank
subsample alone. The results are slightly weaker than in Table 5, consistent with reduced
power. The right side of Panel E demonstrates the findings for small banks. The results
remain significant in 7 of the 9 cells even though the sample size has fallen by 2/3. One
of the motivations for removing small banks is that their RET may be measured with
significant error given the small number of deals. Thus, the variations in bank fixed

17
effects in Table 3 may reflect noise rather than true differences in performance.
However, while noise may explain cross-sectional variation at a given point in time, it is
unlikely to account for time series persistence – noise implies that returns might be
measured to be very high in one period, and then very low in an adjacent period. By
contrast, we find evidence of persistence for even infrequent advisors, suggesting their
return differences reflect true variation in performance rather than noise.
3.3. Regression Analysis
The analysis of Section 3.2 studies differences in average performance between
the top and bottom quantiles. To ensure that the results are not purely driven by banks at
the extremes (i.e. the best and worst banks alone), we conduct a similar analysis using
regressions. In addition to using all banks in the sample, regressions also allow us to
control for other potential predictors of past returns. In particular, Rau (2000) finds that
RET is negatively related to a bank’s past market share; he does not examine the effect of
past returns. We wish to examine whether the explanatory power of past RET remains
when controlling for market share. We run the following pooled regression:
RETt,t = αt + βRRETt-j,t-1 + βSSHARE t-j,t-1. (1)
SHAREt-j,t-1 is the market share over the past j calendar years, by dollar value of
deals (using number of deals leads to similar results). Since we have shown that bank
fixed effects are significant, and our regressors may not capture the full fixed effects, the
residuals for deals advised by the same bank might be correlated. We therefore cluster
standard errors by bank. The results are illustrated in Panel A of Table 6. The
regressions replicate the positive association between future RET and past RET
documented in the quintile analysis, for all values of j. Market share is significantly
negatively related to future returns in all three specifications in which it is included. The
Online Appendix shows similar results in a deal-level analysis.
We are again interested whether our results apply to the M&A advisory market in
general, or instead are driven by small acquirers. Panel B adds an interaction term
between RET and SHARE. The interaction term is insignificant (t-statistics all below
0.5), suggesting that persistence is not weaker for larger banks. Moreover, the
18
coefficients on RET and SHARE alone retain their significant coefficients in all
specifications. While stratifying the quintile analysis of Section 3.2 significantly reduces
sample size, a regression analysis allows us to use an interaction term to study how the
results vary across banks of different sizes without such a reduction. In addition, while
the coefficient on RET gives the significance of the marginal effect if SHARE = 0, we
also include the coefficient if SHARE = 5%, i.e. for a frequent advisor with a 5% market
share. From Table 4, a bank with a 5% market share would be in the top 10 advisors.
The table demonstrates that the marginal effect of past RET remains significant even for
frequent advisors.
Another interesting question is whether ability differences have decreased over
time. Morrison and Wilhelm (2007, 2008) show that investment banking skills have
become commoditized over time, in part due to rapid increases in computer power and
the rise in general skills resulting from MBA degrees. If true, and if our results are
primarily driven by the early part of our sample, our findings become less interesting
because we are documenting a phenomenon that is no longer in existence. We
investigate this hypothesis in Panel C of Table 6 by adding an additional regressor,
RET*FIRSTHALF, where FIRSTHALF is a dummy variable that equals 1 if the
dependent variable is in the first half of our performance sample, 1981-1994. This is an
appropriate cut-off as Morrison and Wilhelm (2008, Figure 3) document a marked
increase in computer power around 1993-4. The interaction term is positive but
insignificant in all six specifications. In the presence of the interaction term, the
coefficient on RET now measures persistence using the second half of the dataset only.
Importantly, even though we have less power, past RET remains significant in all
specifications for j≥2, suggesting that the ability differences we document remain
significant today.
4. Do Clients Chase Performance?
Even if a financial intermediary possesses superior ability (our fixed effects
results of Table 3), Berk and Green (2004) show that this need not translate into
performance persistence (our quintile and regression results of Tables 5-6) if two
necessary conditions hold: clients chase past returns and there are diminishing returns to
scale. Indeed, our persistence results for M&A advice contrast the lack of persistence in
19
mutual funds (see, e.g., Carhart (1997).) Since past RET positively predicts future RET, it
would seem logical for clients to select banks based on past performance, in which case
persistence will disappear if there are diminishing returns to scale. For ability to translate
into persistence, it is sufficient for one of the necessary conditions in Berk and Green to
be violated. We investigate whether clients respond to past performance (the first
condition) as it is much cleaner to measure than returns to scale.
Table 7 studies the effect of past performance on a bank’s future market share.
Since bank-client relationships take time to develop, large banks are likely to have
persistently high market shares irrespective of past performance. We therefore either
include a bank fixed effect or the bank’s past market share as regressors. Standard errors
are clustered at the bank level.
Strikingly, even though RET is a positive predictor of future performance, the first
six columns of Table 7 show that it is an insignificant determinant of market share
(consistent with Rau (2000)). By contrast, even though market share negatively predicts
performance, it is strongly significantly related to future share. The last three columns of
Table 7 repeat the analysis adding an interaction between RET and SHARE which is
generally insignificant, suggesting that the results are similar across all sizes of banks.19
This lack of performance chasing is a sufficient condition for ability to translate into
persistence and thus underpins the results of Section 3. The strong performance-chasing
by mutual fund investors, and the absence of such behavior by acquirers, may thus
reconcile the performance persistence in M&A with its absence in mutual funds. Our
results echo Kaplan and Schoar (2005), who document persistence in private equity
performance (also found by Axelson et al. (2010)), and that top performing funds grow
proportionally more slowly than poorly performing funds, which explains why
persistence can arise.
The significance of past market share, even though it negatively predicts future
performance, and irrelevance of past returns, even though it is a positive predictor, may
appear at first glance to be inefficient. However, applying the Berk and Green (2004)
framework to our setting, responsiveness to performance requires not only learning about
ability from past returns but also competitive provision of M&A mandates by clients.
Thus, lack of performance-chasing can occur if either assumption is violated, and
19 The coefficient on the interaction term in the 1-year analysis is significant at the 10% level, but the marginal effect of RET at a 5% market share is not significant.

20
therefore has different interpretations. Mandate awards may be non-competitive if clients
build up relationship-specific capital with a particular bank, which can be leveraged by
continuing to use it for future deals. Thus, while past market share is a predictor of
future mandates, it may not be a determinant (i.e. actively be used by acquirers in their
selection decisions) – instead, its significance arises as it proxies for the extent of existing
relationships. Table 8 investigates the relationship-specific capital hypothesis by
studying repeat acquirers, who have conducted at least one acquisition in the prior five
years while being public. Using a previously-mandated advisor is associated with a
lower CAR of 0.24 percentage points (t-statistic of 1.74). If the advisor had generated a
negative average CAR for that particular client in question, the CAR is 0.79 percentage
points lower than using past advisors that generated positive CARs (t-statistic of 4.09).
These findings are consistent with the RET persistence results of Section 3. However,
even if using a past advisor is correlated with poor future M&A performance, it is not
inefficient if the bank provides many other non-M&A services. For example, Yasuda
(2005) and Ljungqvist, Marston and Wilhelm (2006, 2009) find that clients select
underwriters based on lending relationships or analyst coverage. Even if banks are
providing no other services, clients may be “locked in” to a past advisor since working on
a previous deal gives the advisor an information monopoly: Ljungqvist et al. (2006,
2009) find that past co- or lead underwriters are typically appointed as future lead
underwriters. Asker and Ljungqvist (2010) highlight another source of lock-in: clients’
wish to avoid sharing banks with product market rivals.
Learning about ability from past returns will not occur if clients are unaware of
the persistence of RET and mistakenly believe that market share is a good measure of
quality. Under this interpretation, market share is significant not because clients are
locked in and it proxies for existing relationships, but because they actively select on it.
Indeed, both the insignificance of RET and the significance of SHARE are fully consistent
with real-life practices in the investment banking industry, where league tables on market
share are widely publicized and used as a proxy for expertise. Therefore, industry
participants have grown to take it for granted that market share equates with quality;
similarly, many academic studies such as Rau (2000), Kale, Kini and Ryan (2003) and
Hunter and Jagtiani (2003) use market share as their measure of quality. However, we
show that it is actually negatively correlated with performance. By contrast, measures of
21
returns are less publicized, which hinders clients’ ability to use returns as an additional
metric to learn about quality even if they are not locked-in.
Given the lack of performance-chasing and importance of prior relationships, it is
logical for banks to accept even bad deals. Not only will the mandate boost fee income
today, but it will also create new relationships and thus the ability to win future mandates.
Even though accepting bad deals will depress RET, this does not reduce future mandates,
either due to lock-in or failure to learn. Indeed, if certain banks are systematically non-
selective and accept bad deals, this would lead to the negative correlation between market
share and RET that we document.
As a preliminary investigation into the importance of lock-in for M&A, we study
the extent to which clients switch M&A advisors. During 1985-2007, we find that on
21.4% of M&A deals where the acquirer had made at least one acquisition in the past five
years, the advisors also covered all of the acquirer’s M&A deals over the past five years.
On 50.1% of deals, the advisors covered at least one deal over the past five years.
Ljungqvist and Wilhelm (2005) find that 64.1% of equity issuers used the same
underwriter for their IPO and first SEO. Our figures are somewhat lower, tentatively
suggesting that lock-in may be slightly weaker in M&A. One potential explanation is
that a significant amount of M&A advice is target-specific, and thus knowledge built up
during one transaction may be less applicable for future deals. Our findings are
consistent with Francis, Hasan and Sun (2009), who find that fewer than 20% of deals are
conducted by exclusive advisors, which they interpret as evidence that existing
relationships are less influential for advisor choice in M&A than other banking services.
Given the importance of other banking services, we also gather SDC issuance
data to measure debt and equity underwriting relationships, and Dealscan data to measure
lending relationships.20 Since Dealscan data is sparse until 1988, the lending numbers are
calculated from 1993; for consistency, we use the same timeframe for the issuance data.
We find that, on 9.5% of M&A deals over 1993-2007, the advisors also covered all of the
acquirer’s issuance over the past five years; on 45.4% of deals, banks covered at least one
issue. For lending, the numbers drop to 6.7% and 15.8% respectively. While we do not
have a benchmark for a formal test, these relatively low numbers suggest that clients use
different advisors for their M&A business than for their underwriting and borrowing
20 We thank Michael Roberts for providing us with the table to link Dealscan to Compustat, used in Chava and Roberts (2008).

22
decisions. Indeed, while there are plausibly strong synergies between lending and bond
underwriting (Yasuda (2005)), the connection between lending and M&A advice appears
to be weaker. We also attempt to study the selection decisions of clients who are not
locked in and thus have freedom on advisor choice. We take a subsample of clients that
engaged in no M&A deals, issuance or borrowing with our 143 advisors in the past five
years, and thus have no existing relationships. We note that this is not a perfect measure
of freedom. First, it may include “un-free” clients: if some of these acquirers intend to
engage in issuance or borrowing in the future, they may select an M&A advisor who
provides these services. Second, it may exclude “free” clients: some clients may have
engaged in issuance or borrowing with an M&A advisor in the past, but have no intention
of doing so in the foreseeable future. If lock-in, rather than failure to learn, is the reason
for the aggregate insignificance of RET for market share in Table 7, then RET should be
positively correlated with future mandates for “free” acquirers. By contrast, Table 9
shows that RET is negatively correlated with future mandates in most specifications
(though statistically insignificant) for this subsample. This suggests that failure to learn
is a cause of the insignificance of past performance. However, we note that these results
are only suggestive, due to the difficulty of identifying “free” clients mentioned earlier,
and our small sample size: we can only identify “free” clients from 1993 onwards, and
only 1,224 deals were conducted by such acquirers.
If clients are indeed not fully locked-in, our results suggest that they may be able
to improve their advisor selection decisions by using information on past returns to
supplement market share information.21 An increased focus on returns may in turn
dissuade banks from accepting value-destructive transactions. The findings also have
implications for the nature of contracts between acquirers and advisors. McLaughlin
(1990) finds that banks are paid for deal completion but not value creation. He suggests
that reputational concerns may be sufficient to align banks with clients, since a bank that
performs poorly will not win future mandates. However, the insignificance of RET
implies that banks’ implicit incentives are also low – if clients are locked in or do not
learn from RET, banks can be less concerned with returns – and so explicit incentives 21 Since shareholders are diversified, they are not concerned with idiosyncratic risk. Thus, a value-maximizing manager should maximize expected CAR rather than a measure adjusted for the variance. However, managers may care about the variance of CAR if they are concerned with their own undiversified human capital. We find that a bank’s RET is highly correlated with its “Sharpe ratio” of RET divided by the standard deviation of CAR. Over three-year non-overlapping windows beginning in 1981, we find the average Spearman rank correlation of RET and the “Sharpe ratio” to be 0.965.
23
would be valuable. In a similar vein, clients frequently solicit fairness opinions to verify
that the terms are “fair” (Kisgen, Qian and Song (2009)). As part of its mandate, an
advisor should ensure that the client is undertaking only favorable deals in the first place,
and there should be no need for a separate fairness opinion. The prevalence of such
opinions is consistent with the view that incentives to act in clients’ interests are
insufficient, either due to lock-in or failure to learn.
5. Conclusion
This paper finds a significant investment bank fixed effect in the announcement
returns to an acquisition. The positive association between certain banks and high returns
can be predicted by clients using past performance – a bank’s returns are persistent.
While most prior research attributes the entire CAR to the advisor, we remove the
component that can be explained by acquirer characteristics; the orthogonal component
remains persistent. These results suggest that certain banks have ability in identifying
acquisitions or negotiating terms, or trustworthiness in turning down bad deals. They
contrast prior findings that bank quality, as measured by market share or reputation, has
no positive effect on M&A outcomes, thus suggesting that banks do not matter. The lack
of performance-chasing by clients potentially explains why persistence exists in M&A
advice even though it is absent in mutual fund performance.
This paper suggests a number of questions for future research. First, it may be
interesting to study why clients do not chase performance and whether such behavior is
efficient – i.e. disentangle whether it results from rational lock-in or inefficient failure to
learn (e.g. due to an acquirer’s private benefits from working with a prestigious bank.)
Agency variables such as governance may explain advisor choice, just as they do for
acquirer returns (Masulis et al. (2007)). Second, the low returns to ability appear
puzzling. While superior performance in equity underwriting is rewarded with higher
future market share (Dunbar (2000), Hoberg (2007)), and superior returns to private
equity investing increases future fund flows (Chung et al. (2010)), there seems to be little
reward for good M&A advice. Third, we have focused on acquirer returns since these are
frequently negative, and so advisor selection is particularly important for bidders to
ensure value creation; in addition, far more bidders are public than targets. It would be

24
fruitful to investigate whether target returns also exhibit a bank fixed effect, and whether
the banks that consistently create value for bidders are also skilled at defense mandates.

25
References
Asker, John and Alexander Ljungqvist (2010): “Competition and the Structure of Vertical Relationships in Capital Markets,” Journal of Political Economy, forthcoming.
Axelson, Ulf, Tim Jenkinson, Per Strömberg and Michael S. Weisbach (2010): “Borrow Cheap, Buy High? The Determinants of Leverage and Pricing in Buyouts,” Working paper, London School of Economics.
Berk, Jonathan B. and Richard C. Green (2004): “Mutual Fund Flows and Performance in Rational Markets,” Journal of Political Economy 112, 1269-1295.
Bertrand, Marianne and Antoinette Schoar (2003): “Managing With Style: The Effect of Managers of Firm Policies,” Quarterly Journal of Economics 118, 1169-1208.
Bowers, Helen and Robert Miller (1990): “Choice of Investment Banker and Shareholders’ Wealth of Firms Involved in Acquisitions,” Financial Management 19, 34-44.
Carhart, Mark (1997): “On Persistence in Mutual Fund Performance,” Journal of Finance 52, 57-82.
Chava, Sudheer and Michael R. Roberts (2008): “How Does Financing Impact Investment? The Role of Debt Covenants,” Journal of Finance 63, 2085-2121.
Chung, Ji-woong, Berk Sensoy, Lea H. Stern and Michael S. Weisbach (2010): “Pay for Performance from Future Fund Flows: The Case of Private Equity,” Working Paper, Ohio State University.
Diether, Karl B., Kuan-Hui Lee, and Ingrid M. Werner (2009): “Short-Sale Strategies and Return Predictability,” Review of Financial Studies 22, 575-607.
Dunbar, Craig (2000): “Factors Affecting Investment Bank Initial Public Offering Market Share,” Journal of Financial Economics 55, 3-41.
Ertugurul, Mine and Karthik Krishnan (2010): “Advisor Skill and Acquisition Performance: Do Investment Bankers Make a Difference?” Working paper, University of Massachusetts.
Fama, Eugene (1998): “Market Efficiency, Long-Term Returns, and Behavioral Finance,” Journal of Financial Economics 49, 283-306.
Fernando, Chitru S., Vladimir A. Gatchev and Paul A. Spindt (2005): “Wanna Dance? How Firms and Underwriters Choose Each Other,” Journal of Finance 60, 2437-2469.
Francis, Bill B., Iftekhar Hasan and Xian Sun (2009): “Choice of Financial Advisors and Reasons to Switch: Evidence From M&As,” Working paper, Rensselaer Polytechnic Institute.
Gompers, Paul, Joy Ishii and Andrew Metrick (2003): “Corporate Governance and Equity Prices,” Quarterly Journal of Economics 118, 107-155.
Hackbarth, Dirk and Erwan Morellec (2007): “Stock Returns in Mergers and Acquisitions,” Journal of Finance 63, 1213-1252.

26
Hoberg, Gerard (2007): “The Underwriter Persistence Phenomenon,” Journal of Finance 62, 1169-1206.
Hunter, William and Julapa Jagtiani (2003): “An Analysis of Advisor Choice, Fees and Effort in Mergers and Acquisitions,” Review of Financial Economics 12, 65-81.
Jaffe, Jeffrey, David Pedersen and Torben Voetmann (2009): “Mergers and Persistence: A Test of Differential Skill in Corporate Finance,” Working paper, University of Pennsylvania.
Jegadeesh, Narasimhan and Sheridan Titman (1993): “Returns to Buying Winners and Selling Losers: Implications for Stock Market Efficiency,” Journal of Finance 48, 65-91.
Kale, Jayant R., Omesh Kini and Harley E. Ryan (2003): “Financial Advisors and Shareholder Wealth Gains in Corporate Takeovers,” Journal of Financial and Quantitative Analysis 38, 475-501.
Kaplan, Steven N. and Antoinette Schoar (2005): “Private Equity Performance: Returns, Persistence, and Capital Flows,” Journal of Finance 60, 1791-1823
Kisgen, Darren, Jun Qian and Weihong Song (2009): “Are Fairness Opinions Fair? The Case of Mergers and Acquisitions,” Journal of Financial Economics 91, 179-207.
Lehn, Kenneth and Mengxin Zhao (2006): “CEO Turnover After Acquisitions: Are Bad Bidders Fired,” Journal of Finance 61, 1759-1811.
Lemmon, Michael L., Michael R. Roberts and Jaime F. Zender (2008): “Back to the Beginning: Persistence and the Cross-Section of Corporate Capital Structure,” Journal of Finance 63, 1575-1608.
Ljungqvist, Alexander, Felicia Marston and William J. Wilhelm, Jr. (2006): “Competing for Securities Underwriting Mandates: Banking Relationships and Analyst Recommendations,” Journal of Finance 61, 301-340.
Ljungqvist, Alexander, Felicia Marston and William J. Wilhelm, Jr. (2009): “Scaling the Hierarchy: How and Why Investment Banks Compete for Syndicate Co-management Appointments,” Review of Financial Studies 22, 3977-4007.
Ljungqvist, Alexander and William J. Wilhelm, Jr. (2005): “Does Prospect Theory Explain IPO Market Behavior?” Journal of Finance 60, 1759-1790
Maksimovic, Vojislav and Gordon M. Phillips (2002): “Do Conglomerate Firms Allocate Resources Inefficiently Across Industries? Theory and Evidence,” Journal of Finance 57, 721-768.
Masulis, Ronald, Cong Wang and Fei Xie (2007): “Corporate Governance and Acquirer Returns,” Journal of Finance 62, 1851-1889.
McLaughlin, Robyn (1990): “Investment-Banking Contracts in Tender Offers: An Empirical Analysis,” Journal of Financial Economics 28, 209-232.

27
Michel, Allen, Israel Shaked and You-Tay Lee (1991): “An Evaluation of Investment Banker Acquisition Advice: The Shareholders’ Perspective,” Financial Management 20, 40-49.
Mikhail, Michael, Beverly Walther and Richard Willis (2004): “Do Security Analysts Exhibit Persistent Differences in Stock Picking Ability?” Journal of Financial Economics 74, 67-91.
Moeller, Sara B., Frederik P. Schlingemann and René M. Stulz (2004): “Firm Size and the Gains from Acquisitions,” Journal of Financial Economics 73, 201-228.
Morrison, Alan D. and William J. Wilhelm, Jr. (2007): “Investment Banking: Institutions, Politics, and Law,” Oxford University Press, Oxford.
Morrison, Alan D. and William J. Wilhelm, Jr. (2008): “The Demise of Investment Banking Partnerships: Theory and Evidence,” Journal of Finance 63, 311-350
Rau, P. Raghavendra (2000): “Investment Bank Market Share, Contingent Fee Payments, and the Performance of Acquiring Firms,” Journal of Financial Economics 56, 293-324.
Rau, P. Raghavendra and Theo Vermaelen (1998): “Glamour, Value and the Post-Acquisition Performance of Acquiring Firms,” Journal of Financial Economics 49, 223-253.
Servaes, Henri and Marc Zenner (1996): “The Role of Investment Banks in Acquisition,” Review of Financial Studies 9, 787-815.
Yasuda, Ayako (2005): “Do Bank Relationships Affect the Firm’s Underwriter Choice in the Corporate-Bond Underwriting Market?” Journal of Finance 60, 1259-1292.
28
Figure 1
Plots of estimated bank fixed effects against number of deals announced in the full sample. The fixed effects are estimated from regressions of the (-1,+1) CAR of deals on bank fixed effects and control variables. Plot (1) includes time fixed effects as controls, (2) includes acquirer characteristics and time fixed effects, and (3) includes acquirer characteristics, acquirer fixed effects, and time fixed effects.

29
Table 1
Definition of variables used in the analyses. Where applicable, we include the Compustat item number in the description.
Panel A: Used in the calculation of residuals for CAR Variable Definition RUNUP Log stock return for the acquirer from -210 to -11.
Q Log of Tobin’s Q. Tobin’s Q = Market value of assets / Total assets (#6). Market value of common stock = Common shares outstanding (#25) * Price (#199). Market value of assets = Book value of assets (#6) + Market value of common stock – Book value of common stock (#60) – Balance sheet deferred taxes (#74).
LEVERAGE LEVERAGE = Book debt / (Total assets (#6) – Book equity + Market equity). Book equity = Total assets (#6) – Total liabilities (#181) – Preferred stock (#10) + Deferred taxes (#35, if available) Substitute Redemption value of preferred stock (#56) if Preferred stock is missing. Book debt = Total assets (#6) – Book equity. Market equity = Common shares outstanding (#25) * Price (#199).
FCF FCF = Free cash flow / Total assets (#6). Free cash flow = Operating income before depreciation (#13) – Interest expense (#15) – Income taxes (#16) + ∆ Deferred taxes and investment tax credit (#35 - #35 from previous year) – Preferred dividends (#19) – Common dividends (#21).
SIZE Log of Total assets (#6).
HERFINDAHL 2)_
)12(#_(
i
i
salesindustry
salesfirm , where industries are defined by the
Fama-French 49 industries.
SELLEXP SELLEXP = median selling expenses (#189) over Sales (#12) for industry
INST Fraction of outstanding common shares owned by institutions from Thomson Financial 13f filings.
OPPERF Firm operating performance minus the industry median in the past year. Operating performance = Operating income before depreciation (#13) / 0.5(Total assets + last year’s total assets (#6)).
INSIDER
Insider ownership as a fraction of total shares outstanding, from Compact Disclosure. Where missing, we impute it using Sales (#12) and firm age (from CRSP).

30
ACQSIC Log of number of acquirer SIC codes.
REPEAT ACQUIRER
Dummy variable that equals 1 if the acquirer announced an acquisition in the previous 5 years.
Panel B: Constructed for direct use in quintile analysis and regressions
Variable Definition RET Average CAR (3-day cumulative abnormal return) for deals
advised by an investment bank over a given number of years.
RETRES Average residual from a regression of CAR on acquirer characteristics defined in Panel A.
SHARE Market share by value of acquirer-advised deals for an investment bank over a calendar year.

31
Table 2
Regression of CAR on acquirer characteristics. CAR is the return in excess of the CRSP value-weighted index over a (-1,+1) window relative to the announcement date. The regressors are described in Table 1. The sample period is 1980-2007 and t-statistics are in parentheses.
CAR RUNUP -0.0018
(1.07) Q -0.0055
(2.89)*** LEVERAGE 0.0185
(4.05)*** FCF -0.0569
(7.45)*** SIZE -0.0033
(8.57)*** HERFINDAHL 0.0008
(0.06) SELLEXP -0.0433
(2.22)** INST -0.0097
(4.06)*** OPPERF 0.0475
(5.72)*** INSIDER 0.0110
(2.08)** ACQSIC -0.0018
(1.92)* REPEAT ACQUIRER -0.0028
(1.89)* Year FE Yes Acquirer Industry FE Yes # obs 12,622 R-sqd (%) 4.17
* significant at 10%; ** significant at 5%; *** significant at 1%

32
Table 3
Bank fixed effects to a deal’s CAR. Panel A reports F-tests for the joint significance of bank fixed effects from a regression of (-1,+1) CAR on bank fixed effects and listed controls. Acquirer characteristics are defined in Table 1. Panel B reports the distribution of bank fixed effects, weighted by the inverse of the standard errors of the fixed effects. Panel C reports analysis on fixed effects for banks that announced at least 84 deals over the full sample. Panels D and E repeat these analyses filtering out acquirers with stock prices below $1 and missing trading volume either on the day after announcement or both 2 and 3 days before announcement. F-statistics, p-values, and numbers of constraints are listed. The number of constraints equals the number of bank fixed effects estimated in the regression minus one. In specification (3), the adjusted R-squared for this specification is after removing acquirers that undertake only one transaction, and then de-meaning by acquirer before regressing on acquirer characteristics, time dummies and bank dummies. The sample period is 1980-2007.
Panel A: Investment Bank Fixed Effects
Controls Bank FE F-test Obs Adj R-sqd (%)
(1) Time FE 1.65 (0.0000, 142) 15,344 0.97
(2) Acq chars, time FE 1.44 (0.0006, 141) 12,622 3.98
(3) Acq chars, acq FE, time FE 1.47 (0.0003, 138) 10,430 3.27
Panel B: Distribution of Bank Fixed Effects
Std Dev 25th 75th Interquartile Range
(1) 1.37% -0.91% 0.35% 1.26%
(2) 1.39% -0.53% 0.41% 0.94%
(3) 2.00% -0.65% 0.58% 1.23%
Panel C: Fixed Effects for Active Banks
Bank FE F-test Std Dev 25th 75th Interquartile Range
(1) 1.69 (0.0038, 41) 0.64% -0.85% 0.21% 1.06%
(2) 1.41 (0.0431, 41) 0.66% -0.45% 0.28% 0.74%
(3) 1.60 (0.0092, 41) 0.86% -0.47% 0.27% 0.74%
Panel D: Investment Bank Fixed Effects with Filters
Controls Bank FE F-test (all banks)
Banks FE F-test (active banks) Obs
Adj R-sqd (%)
(1) Time FE 1.60 (0.0000, 142) 1.68 (0.0043, 41) 14,955 0.98
(2) Acq chars, time FE 1.45 (0.0004, 141) 1.45 (0.0305, 41) 12,347 3.62
(3) Acq chars, acq FE, time FE 1.48 (0.0002, 138) 1.70 (0.0036, 41) 10,235 3.37

33
Panel E: Distribution of Bank Fixed Effects with Filters
Banks Std Dev 25th 75th Interquartile Range
(1) All 1.36% -0.88% 0.34% 1.22%
(1) Active Banks 0.64% -0.80% 0.31% 1.11%
(2) All 1.40% -0.74% 0.39% 1.12%
(2) Active Banks 0.67% -0.45% 0.17% 0.61%
(3) All 2.00% -0.73% 0.51% 1.23%
(3) Active Banks 0.88% -0.53% 0.25% 0.78%
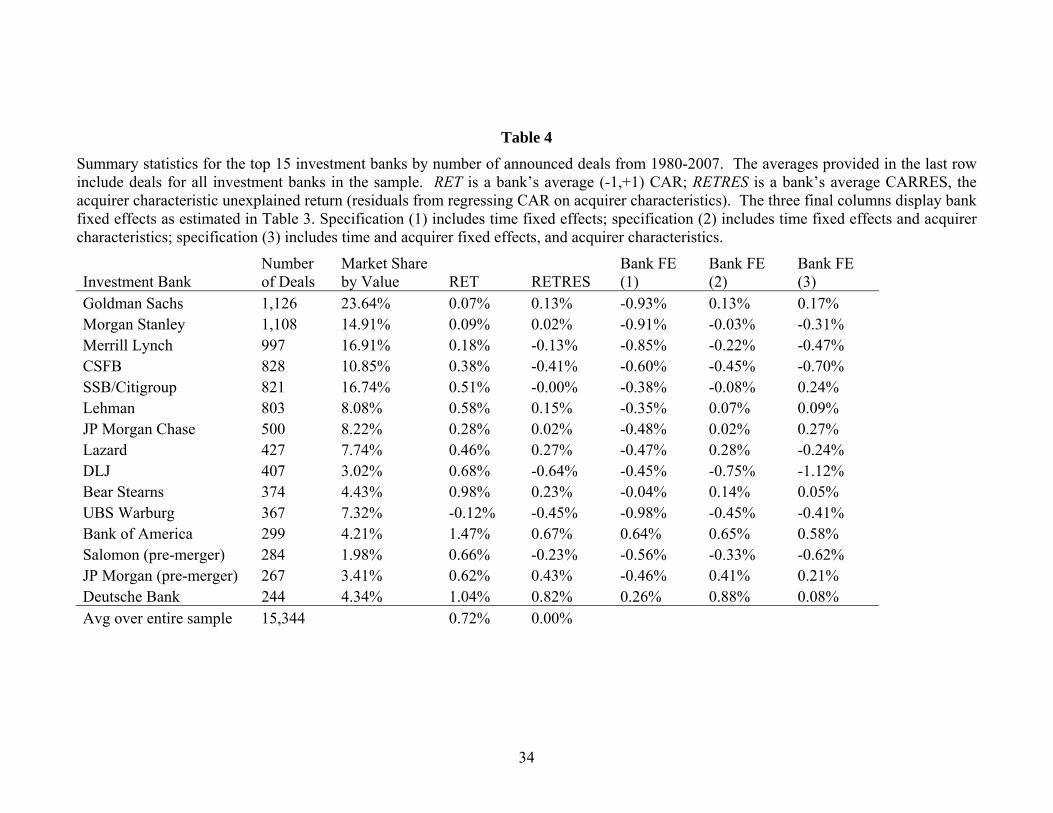
34
Table 4
Summary statistics for the top 15 investment banks by number of announced deals from 1980-2007. The averages provided in the last row include deals for all investment banks in the sample. RET is a bank’s average (-1,+1) CAR; RETRES is a bank’s average CARRES, the acquirer characteristic unexplained return (residuals from regressing CAR on acquirer characteristics). The three final columns display bank fixed effects as estimated in Table 3. Specification (1) includes time fixed effects; specification (2) includes time fixed effects and acquirer characteristics; specification (3) includes time and acquirer fixed effects, and acquirer characteristics.
Investment Bank Number of Deals
Market Share by Value RET RETRES
Bank FE (1)
Bank FE (2)
Bank FE (3)
Goldman Sachs 1,126 23.64% 0.07% 0.13% -0.93% 0.13% 0.17% Morgan Stanley 1,108 14.91% 0.09% 0.02% -0.91% -0.03% -0.31% Merrill Lynch 997 16.91% 0.18% -0.13% -0.85% -0.22% -0.47% CSFB 828 10.85% 0.38% -0.41% -0.60% -0.45% -0.70% SSB/Citigroup 821 16.74% 0.51% -0.00% -0.38% -0.08% 0.24% Lehman 803 8.08% 0.58% 0.15% -0.35% 0.07% 0.09% JP Morgan Chase 500 8.22% 0.28% 0.02% -0.48% 0.02% 0.27% Lazard 427 7.74% 0.46% 0.27% -0.47% 0.28% -0.24% DLJ 407 3.02% 0.68% -0.64% -0.45% -0.75% -1.12% Bear Stearns 374 4.43% 0.98% 0.23% -0.04% 0.14% 0.05% UBS Warburg 367 7.32% -0.12% -0.45% -0.98% -0.45% -0.41% Bank of America 299 4.21% 1.47% 0.67% 0.64% 0.65% 0.58% Salomon (pre-merger) 284 1.98% 0.66% -0.23% -0.56% -0.33% -0.62% JP Morgan (pre-merger) 267 3.41% 0.62% 0.43% -0.46% 0.41% 0.21% Deutsche Bank 244 4.34% 1.04% 0.82% 0.26% 0.88% 0.08% Avg over entire sample 15,344 0.72% 0.00%

35
Table 5
Persistence in a bank’s average returns and source of low returns. Panel A sorts banks into quintiles based on their RET (average (-1,+1) CAR) over the past j calendar years, where j = {1,2,3}. To be included in the analysis, a bank must have announced at least 2j deals over the relevant period. Q1 represents the banks with the lowest past RET, Q5 the highest. For each quintile, we then calculate the average CAR to future acquisitions announced by the banks in that quintile over the next k calendar years, where k = {1,2,3}. Panel B and repeats the analysis for RETRES (average of CARRES, the acquirer characteristic unexplained return). Panel C examines RET and RETRES calculated using transaction-value weighted measures. Panel D studies the correlation between RET and the contemporaneous percentage of positive CAR deals. Panels E subdivides the sample into the top 2/3 of banks by number of deals in each sorting period (Large Advisors) and the bottom 1/3 (Small Advisors). Banks are sorted each period into terciles and halves, respectively. The sample period is 1981-2007. Newey-West t-statistics are in parentheses.
Panel A: Persistence in Raw Returns Future RET Measured Over
Quintiles Measured Over 1yr 2yrs 3yrs 1yr RET Q1 0.92% 0.66% 0.69% Q5 1.49% 1.48% 1.44% Q5 - Q1 0.57% 0.82% 0.76% (1.32) (2.73)*** (2.85)*** 2yrs RET Q1 0.52% 0.61% 0.74% Q5 1.47% 1.55% 1.36% Q5 - Q1 0.95% 0.94% 0.63% (2.58)** (3.07)*** (1.99)** 3yrs RET Q1 0.59% 0.57% 0.60% Q5 1.68% 1.73% 1.54% Q5 - Q1 1.09% 1.16% 0.94% (2.74)*** (3.55)*** (2.91)***
Panel B: Persistence in Residual Returns Future RETRES Measured Over
Quintiles Measured Over 1yr 2yrs 3yrs 1yr RETRES Q5 - Q1 0.78% 0.80% 0.85%
(1.71)* (2.51)** (3.32)*** 2yrs RETRES Q5 - Q1 1.35% 0.92% 0.55%
(2.86)*** (2.85)*** (1.88)* 3yrs RETRES Q5 - Q1 0.75% 0.55% 0.37% (1.76)* (1.82)* (1.29)
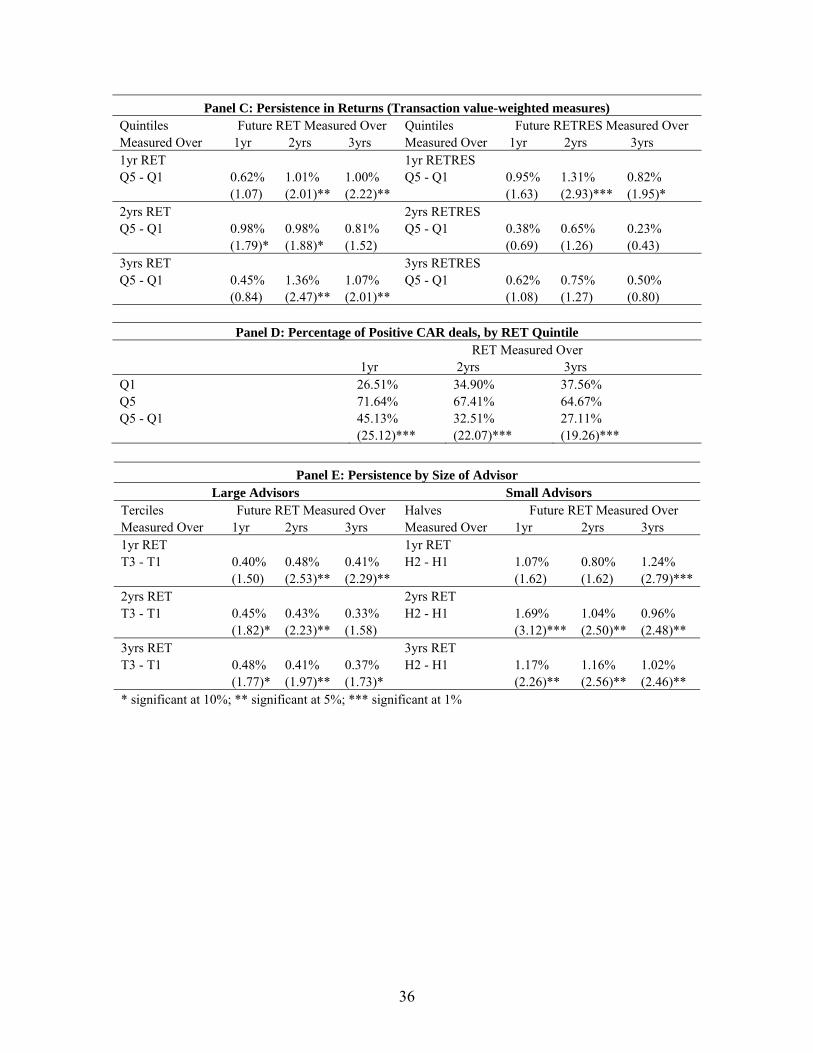
36
Panel C: Persistence in Returns (Transaction value-weighted measures)
Quintiles Future RET Measured Over Quintiles Future RETRES Measured Over Measured Over 1yr 2yrs 3yrs Measured Over 1yr 2yrs 3yrs 1yr RET 1yr RETRES Q5 - Q1 0.62% 1.01% 1.00% Q5 - Q1 0.95% 1.31% 0.82% (1.07) (2.01)** (2.22)** (1.63) (2.93)*** (1.95)* 2yrs RET 2yrs RETRES Q5 - Q1 0.98% 0.98% 0.81% Q5 - Q1 0.38% 0.65% 0.23% (1.79)* (1.88)* (1.52) (0.69) (1.26) (0.43) 3yrs RET 3yrs RETRES Q5 - Q1 0.45% 1.36% 1.07% Q5 - Q1 0.62% 0.75% 0.50% (0.84) (2.47)** (2.01)** (1.08) (1.27) (0.80)
Panel D: Percentage of Positive CAR deals, by RET Quintile RET Measured Over
1yr 2yrs 3yrs Q1 26.51% 34.90% 37.56% Q5 71.64% 67.41% 64.67% Q5 - Q1 45.13% 32.51% 27.11% (25.12)*** (22.07)*** (19.26)***
Panel E: Persistence by Size of Advisor Large Advisors Small Advisors
Terciles Future RET Measured Over Halves Future RET Measured Over Measured Over 1yr 2yrs 3yrs Measured Over 1yr 2yrs 3yrs 1yr RET 1yr RET T3 - T1 0.40% 0.48% 0.41% H2 - H1 1.07% 0.80% 1.24% (1.50) (2.53)** (2.29)** (1.62) (1.62) (2.79)*** 2yrs RET 2yrs RET T3 - T1 0.45% 0.43% 0.33% H2 - H1 1.69% 1.04% 0.96% (1.82)* (2.23)** (1.58) (3.12)*** (2.50)** (2.48)** 3yrs RET 3yrs RET T3 - T1 0.48% 0.41% 0.37% H2 - H1 1.17% 1.16% 1.02% (1.77)* (1.97)** (1.73)* (2.26)** (2.56)** (2.46)** * significant at 10%; ** significant at 5%; *** significant at 1%

37
Table 6
Determinants of RET. The dependent variable is RET, a bank’s average (-1,+1) CAR across all deals announced by the bank over a single calendar year. The explanatory variable RET is the average CAR over the past j calendar years, where j = {1,2,3}. SHARE is the bank’s market share, by value of deals, over the past j calendar years. To be included in the regression, a bank must have announced at least 2j deals over the relevant period. In Panel B, an interaction term between RET and SHARE is included. The marginal effect of RET at a SHARE of 5% is also included. In Panel C, FIRSTHALF equals 1 if the dependent variable is in 1994 or earlier and 0 otherwise. The data is pooled across all banks and regressions are estimated using year fixed effects, clustering standard errors by bank. The sample period is 1981-2007 and t-statistics are in parentheses.
Panel A: Determinants of Bank-Level RET 1yr 1yr 2yrs 2yrs 3yrs 3yrs Past j years
RET 0.0958 0.0908 0.1974 0.1876 0.1789 0.1619 (2.22)** (2.09)** (3.38)*** (3.21)*** (2.82)*** (2.56)**
SHARE -0.0346 -0.0351 -0.0416 (3.17)*** (3.00)*** (3.59)***
# obs 993 993 947 947 897 897 R-sqd (%) 6.16 6.51 6.22 6.56 5.06 5.56
Panel B: Determinants of Bank-Level RET with RET-SHARE Interaction 1yr 1yr 2yrs 2yrs 3yrs 3yrs Past j years
RET 0.0968 0.0919 0.2044 0.1920 0.1786 0.1566 (2.03)** (1.93)* (3.25)*** (3.05)*** (2.66)*** (2.33)**
SHARE -0.0346 -0.0347 -0.0421 (3.16)*** (2.95)*** (3.66)***

38
RET X -0.0893 -0.0945 -0.6364 -0.3889 0.0280 0.4964 SHARE (0.11) (0.11) (0.46) (0.27) (0.02) (0.35)
# obs 993 993 947 947 897 897 R-sqd (%) 6.16 6.52 6.24 6.57 5.06 5.57
RET (at 0.0924 0.0871 0.1726 0.1725 0.1800 0.1814 5% SHARE) (2.12)** (1.92)* (2.40)** (2.34)** (2.31)** (2.30)**
Panel C: Determinants of Bank-Level RET with First-Half Interaction 1yr 1yr 2yrs 2yrs 3yrs 3yrs Past j years
RET X 0.0406 0.0290 0.0998 0.0806 0.1222 0.0921 FIRST HALF (0.43) (0.31) (0.81) (0.64) (0.88) (0.64)
RET 0.0826 0.0805 0.1666 0.1618 0.1404 0.1310 (1.49) (1.46) (2.19)** (2.14)** (1.87)* (1.76)*
SHARE X -0.0256 -0.0219 -0.0326 FIRST HALF (1.05) (0.77) (1.16)
SHARE -0.0244 -0.0265 -0.0304 (2.01)** (2.36)** (2.58)**
# obs 993 993 947 947 897 897 R-sqd (%) 6.19 6.58 6.33 6.67 5.19 5.72 * significant at 10%; ** significant at 5%; *** significant at 1%
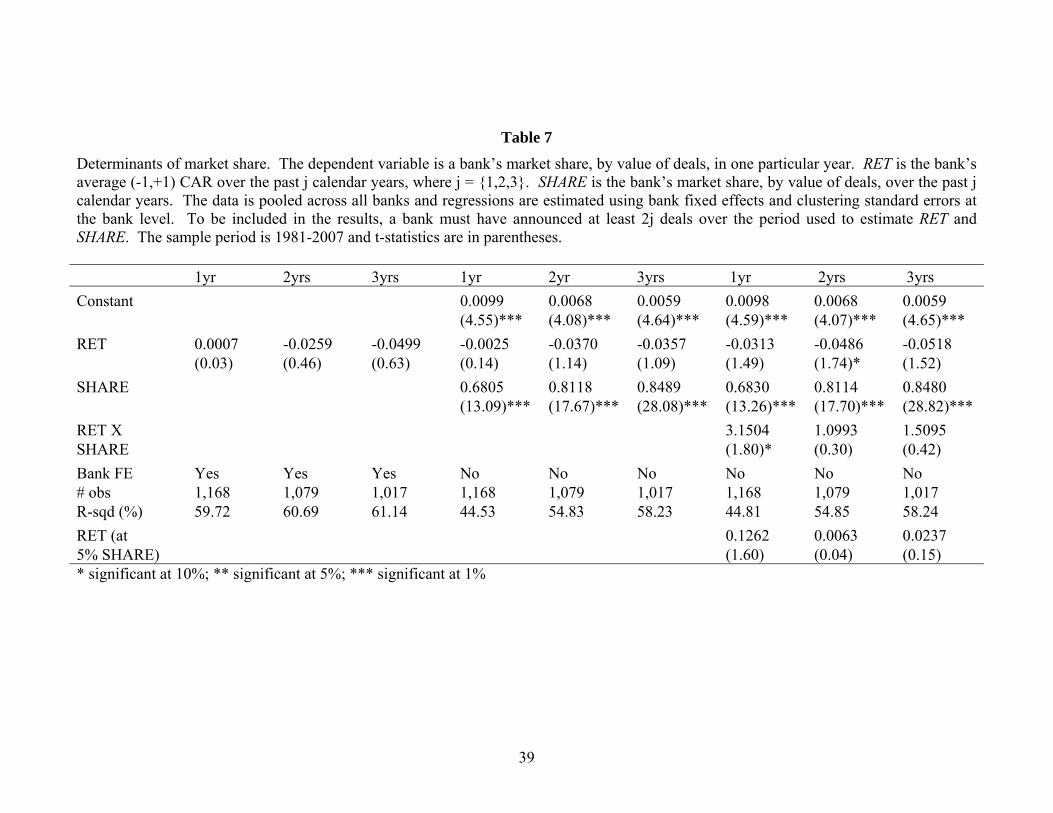
39
Table 7
Determinants of market share. The dependent variable is a bank’s market share, by value of deals, in one particular year. RET is the bank’s average (-1,+1) CAR over the past j calendar years, where j = {1,2,3}. SHARE is the bank’s market share, by value of deals, over the past j calendar years. The data is pooled across all banks and regressions are estimated using bank fixed effects and clustering standard errors at the bank level. To be included in the results, a bank must have announced at least 2j deals over the period used to estimate RET and SHARE. The sample period is 1981-2007 and t-statistics are in parentheses. 1yr 2yrs 3yrs 1yr 2yr 3yrs 1yr 2yrs 3yrs
Constant 0.0099 0.0068 0.0059 0.0098 0.0068 0.0059 (4.55)*** (4.08)*** (4.64)*** (4.59)*** (4.07)*** (4.65)***
RET 0.0007 -0.0259 -0.0499 -0.0025 -0.0370 -0.0357 -0.0313 -0.0486 -0.0518 (0.03) (0.46) (0.63) (0.14) (1.14) (1.09) (1.49) (1.74)* (1.52)
SHARE 0.6805 0.8118 0.8489 0.6830 0.8114 0.8480 (13.09)*** (17.67)*** (28.08)*** (13.26)*** (17.70)*** (28.82)***
RET X 3.1504 1.0993 1.5095 SHARE (1.80)* (0.30) (0.42)
Bank FE Yes Yes Yes No No No No No No # obs 1,168 1,079 1,017 1,168 1,079 1,017 1,168 1,079 1,017 R-sqd (%) 59.72 60.69 61.14 44.53 54.83 58.23 44.81 54.85 58.24
RET (at 0.1262 0.0063 0.0237 5% SHARE) (1.60) (0.04) (0.15) * significant at 10%; ** significant at 5%; *** significant at 1%

40
Table 8
Relationship between a deal’s (-1,+1) CAR and the use of a past advisor. Deals in which the acquirer has made an acquisition in the last five years while public are considered. Panel A divides deals into groups according to whether the acquirer retained an advisor from a past transaction. Panel B examines the differences in average CAR between groups. The sample period is 1985-2007 and t-statistics are in parentheses.
Panel A (1) (2) (3) (4)
Did not retain and old advisor
Retained an old advisor
Retained only advisors with positive past performance
Retained an old advisor with negative past performance
CAR 0.33% 0.09% 0.46% -0.33% t-statistic (3.28)*** (0.89) (3.37)*** (2.41)** # obs 3,793 4,291 2,263 2,028
Panel B (1) - (2) (1) - (3) (1) - (4) (3) - (4)
CAR 0.24% -0.13% 0.66% 0.79% t-statistic (1.74)* (0.78) (3.89)*** (4.09)***
* significant at 10%; ** significant at 5%; *** significant at 1%
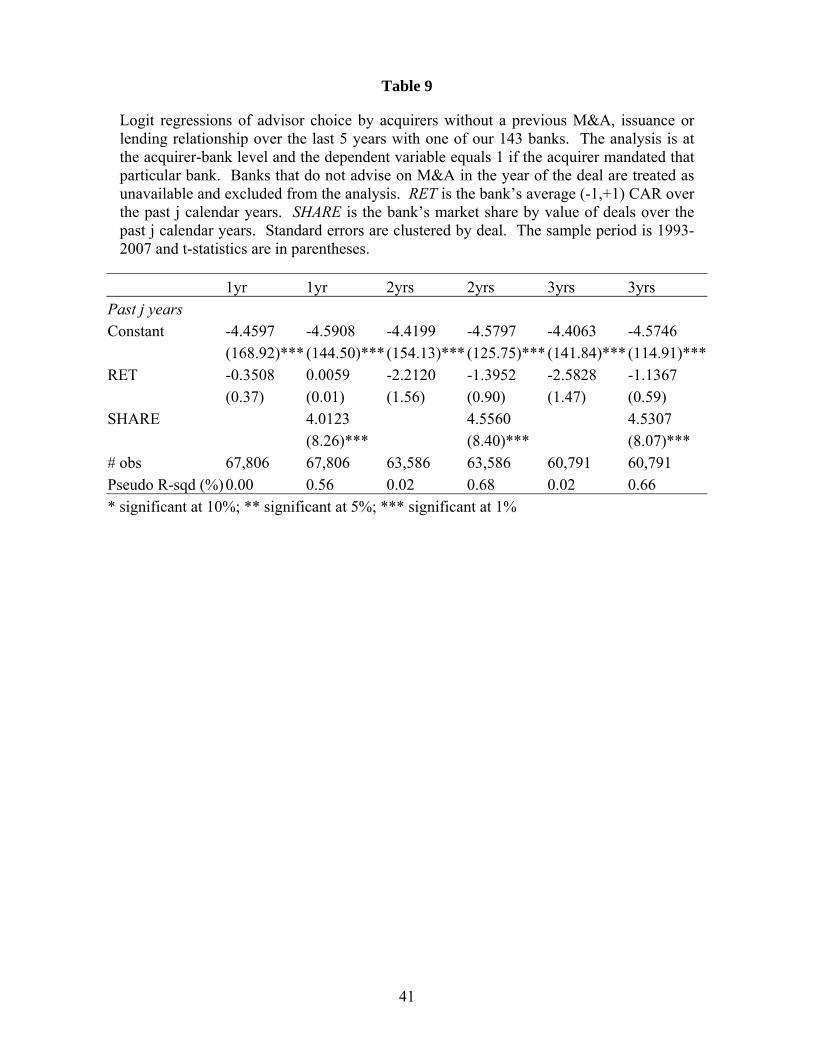
41
Table 9
Logit regressions of advisor choice by acquirers without a previous M&A, issuance or lending relationship over the last 5 years with one of our 143 banks. The analysis is at the acquirer-bank level and the dependent variable equals 1 if the acquirer mandated that particular bank. Banks that do not advise on M&A in the year of the deal are treated as unavailable and excluded from the analysis. RET is the bank’s average (-1,+1) CAR over the past j calendar years. SHARE is the bank’s market share by value of deals over the past j calendar years. Standard errors are clustered by deal. The sample period is 1993-2007 and t-statistics are in parentheses.
1yr 1yr 2yrs 2yrs 3yrs 3yrs Past j years Constant -4.4597 -4.5908 -4.4199 -4.5797 -4.4063 -4.5746
(168.92)*** (144.50)***(154.13)***(125.75)*** (141.84)*** (114.91)***RET -0.3508 0.0059 -2.2120 -1.3952 -2.5828 -1.1367
(0.37) (0.01) (1.56) (0.90) (1.47) (0.59) SHARE 4.0123 4.5560 4.5307
(8.26)*** (8.40)*** (8.07)*** # obs 67,806 67,806 63,586 63,586 60,791 60,791 Pseudo R-sqd (%) 0.00 0.56 0.02 0.68 0.02 0.66 * significant at 10%; ** significant at 5%; *** significant at 1%