do learning logs have an impact on the conceptual mastery
TRANSCRIPT

Louisiana State UniversityLSU Digital Commons
LSU Master's Theses Graduate School
2012
Do learning logs have an impact on the conceptualmastery of force and motion?: subtitleJohn Arthur UnderwoodLouisiana State University and Agricultural and Mechanical College, [email protected]
Follow this and additional works at: https://digitalcommons.lsu.edu/gradschool_theses
Part of the Physical Sciences and Mathematics Commons
This Thesis is brought to you for free and open access by the Graduate School at LSU Digital Commons. It has been accepted for inclusion in LSUMaster's Theses by an authorized graduate school editor of LSU Digital Commons. For more information, please contact [email protected].
Recommended CitationUnderwood, John Arthur, "Do learning logs have an impact on the conceptual mastery of force and motion?: subtitle" (2012). LSUMaster's Theses. 4280.https://digitalcommons.lsu.edu/gradschool_theses/4280

DO LEARNING LOGS HAVE AN IMPACT ON THE CONCEPTUAL MASTERY OF
FORCE AND MOTION?
A Thesis
Submitted to the Graduate Faculty of the Louisiana State University and
Agricultural and Mechanical College in partial fulfillment of the
requirements for the degree of Master of Natural Sciences
in
The Interdepartmental Program in Natural Sciences
by John Arthur Underwood
B.S., Boston University, 2003 August 2012

ii
Acknowledgments
I would like to express my gratitude and appreciation to my committee chair, Dr.
Cyrill Slezak, for helping me bring order to the chaos that was my preliminary data,
exposing me to new ideas in pedagogy, and for always looking at new ways to help me
understand this process. I have appreciated the advice, encouragement, and guidance of
Dr. Juana Moreno as I hit many walls in this thesis. I am very grateful to Dr. Dana
Browne for his statistical analysis tools, patience, and guidance over the past three years.
To my colleagues in LaMSTI, I want to thank each of you for your insight, good
humor, and collaboration as we navigated the master program. I want to thank the four
teachers who graciously allowed me into their classrooms and opened themselves up to
increasing the conceptual knowledge of themselves to better future groups of students. I
do not know the words to fully express my commendation of the courage and dedication
that these four teachers have demonstrated. I would also like to thank the school district
and student participants whose cooperation and participation made this study possible.

iii
Table of Contents
Acknowledgments ....................................................................................................................................... ii Abstract .......................................................................................................................................................... iv Introduction .................................................................................................................................................... 1 Methodology .............................................................................................................................................. 13 Results/Analysis ........................................................................................................................................ 22 Conclusions ................................................................................................................................................. 36 References ................................................................................................................................................... 39 Appendix A T1 FMCE % Changes .................................................................................................... 42 Appendix B Bell Ringer Questions .................................................................................................... 48 Appendix C IRB Exemption Documentation .................................................................................. 54 Vita ................................................................................................................................................................ 55

iv
Abstract This two-week study was conducted to investigate the impact Learning Logs have
on student conceptual mastery of force, motion, and kinematics. To begin the study a
sample of 554 ninth grade students were selected from a suburban public school in
Louisiana. The students were randomly divided into experimental and control groups
within four teachers’ classrooms. This distribution was to examine the impact of
Learning Logs regardless of the teaching style or time of day. Upon the study’s
conclusion there was no significant differences noted due to teaching style or time of day.
The Force Motion Concept Evaluation (FMCE) was used to establish conceptual
knowledge gained throughout the unit.
Further analysis of the data was done to see if other variables such as gender,
ethnicity, economic status, or student learning exceptionalities had a significant impact
on conceptual mastery. None of the aforementioned variables showed statistical
significance. The students in this study did not make significant gains on the FMCE. The
data showed that students stayed with their personal explanations regardless of the
Learning Logs. Students appeared to have held onto their own explanation or an
Aristotelian view despite the variables discussed. The persistence of student responses is
greater than the random guessing threshold. Students were more likely select and
maintain their misconception on the FMCE.

1
Introduction Each year there is an increasing amount of pressure placed on teachers to
incorporate new techniques into instruction by both the state of Louisiana and local
school boards. At my research school site the push was to use Literacy Strategies in all
classrooms kindergarten through twelfth grade. Literacy Strategies are designed to
incorporate higher-order thinking skills as well as English/Language Arts skills, and to
increase student-writing abilities in all academic areas. These strategies were first
adopted by the Louisiana State Department of Education in June of 2008 (Louisiana
Department of Education Grade Level Expectations). The school’s administration
selected Learning Logs as part of their mandatory school improvement process. The
administration saw these tools as a means of helping Science students achieve the state’s
mandated goals for the required high stakes End of Course Exams. The idea of the
Learning Log practice is centered upon students utilizing journaling to reflect on the
science concepts and skills presented to them. Students are able to talk with their
classmates or instructors through writing in the logs after collaboration or knowledge
sharing with peers/instructors. The Louisiana Department of Education’s website gives
the following rationale for Learning Logs:
A learning log is a notebook, binder, or some other repository that students maintain in order to record ideas, questions, reactions, and reflections, and to summarize newly learned content. Documenting ideas in a log about content being read and studied forces students to “put into words” what they know or do not know (Audet, Hichman, & Dobrynina, 1996). This process offers a reflection of understanding that can lead to further study and alternative learning paths (Baker, 2003). It combines writing and reading with content learning (McIntosh & Draper, 2001; Sanders, 1985). Learning logs can become the place for virtually any kind of content-focused writing (Brozo & Simpson, 2007).

2
To prepare for the use of this technique state wide, teachers were given two hours
of professional development training in the late summer of 2009. Teachers were expected
to implement the strategies immediately at their schools. Three years of Learning Log
utilization would occur prior to this study’s conduction. According to the Physical
Science teachers, at the study school, the learning technique was difficult for them to
grade. The grading process was often complicated due to the fact that responses to the
prompts were very open to student interpretation. Over time, another variable surfaced
which was due to the students’ exposure and mastery of basic writing techniques.
Because classes are composed of students at various learning levels (Regular Education,
Special Education, 504, Retained Students, and Gifted Students), the challenge of
meeting many different learning styles has further complicated instructional delivery.
The school was unique in the fact that it only has a ninth grade population. The students
come from three feeder schools and often have three very different instructional
backgrounds.
After some student surveying, the teachers reported that none of the middle
schools had used Learning Logs in their daily instruction. I began by looking at an
analysis of the literature, which led to the state selecting this strategy. Were these studies
cited beneficial in a high school Physical Science classroom? I also wanted to know how
much of an impact Learning Logs had on students’ conceptual mastery of Force, Motion,
and Newtonian Physics. These G.L.E.s are the only exposure some students, in
Louisiana, may get to Physics. The state no longer requires students to take Physics, so
many will not see these G.L.E.s ever again.

3
A starting point in this process was to locate an operational definition of a
Learning Log, research that analyzed its benefits or negative effects, and how valid the
data this technique generated is in terms of assessing student mastery of knowledge. The
term Learning Log is directly linked to an older concept previously referred to as
“reflective journaling” or “journaling”. (Henderson et al., 2002) Henderson et al. stated
“a major challenge teachers face when using reflective journaling, is how to address
misconceptions without affecting the learners’ motivation.” During this process it is easy
for a learner to make improper linkages to concepts that in many cases run contrary to the
factual presentations before them. In numerous studies it has been shown that learners
will cling to these misconceptions despite having opportunities to experience first hand
the proper foundational knowledge (Henderson et al., 2002; Fellows, 1994; Force
Concept Inventory; Thornton et al. 1998; Okhee, 1993). It has also been demonstrated
that by making learners come “into direct conflict with their misconceptions, new
knowledge may begin to take root” (Hammer, 1996).
Cooperative learning models have also shown that the role of the instructor shifts
from that of a direct lecturer and becomes more of a guide (Burron et. al 1993). When
serving as a guide, the educator must avoid giving students knowledge directly, but
instead focus on probing questions and exercises to provide opportunities for learners to
bridge gaps in understanding. As the title of guide implies, the teacher must also make
judgment free responses to redirect the learner when they stumble along the path to
conceptual mastery (Lee, 1997). Learning Logs should therefore allow students to
confront their misconceptions privately and with interaction from other learners. The
Learning Log format provides for students a collaboration time. This allows for students

4
to use the information gained from class and peer-to-peer interactions as they construct
their responses (Audet 1996).
It is clear from the prior studies that no isolated feature of writing garners a
complete picture of a learner (Audet, 1996). English Language Arts teachers have long
utilized the reflective journal to reinforce learning and reading comprehension (Lee,
1997). Lee used this idea to convey the basics of the use of the technique for any
academic area. She explains the practice of a reflective journal as the teacher selecting a
topic of study and designing questions that are appropriate to guiding students towards
the desired conceptual mastery. Students will then proceed to use a journaling format to
respond to the topic. The journal is read by peers and in some cases the teacher to check
for student understanding. As each student reads the entry, feedback is given and the
learner is afforded an opportunity to absorb the feedback as well as reflect upon its added
educational value. The students are then able to respond, in writing, to the feedback
solicited and in this process provide a window into their own conceptual grasp. The
writing generated by each student will show a more in depth explanation of the
individual’s grasp of the concept. Students, when properly using this technique, can have
a space to share ideas free of any judgments. Ideally these journals will aid students in
exposing their thoughts without the uncomfortable worry of being labeled “incorrect”.
Through this indirect form of interaction a picture will emerge of the student’s conceptual
mastery. Teachers will be able to read each entry, examine each student’s
misconceptions, and use the feedback created by the entries to guide instruction (Baker
2003; Fellows, 1994; Lee, 1997; McIntosh et al., 2001; Sanders, 1985).

5
At this point these “reflective journals” were suggested as a viable tool for
mastering science concepts. The “reflective journal” maintains its function, but now bears
a new name, the Learning Log (Audet, 1996; Baker, 2003; McIntosh et al., 2001;
Sanders, 1985). The students’ writings continued to be used as a tool for educator’s to
gain insight into the students’ thinking pathways and new knowledge mastery. Now
Learning Logs were also used to guide student knowledge mastery in procedural or
conceptual ideas as well (Nussbaum et al., 1982; Audet, 1996). For this methodology to
properly work in a science classroom the potential source of student misconception must
be addressed prior to the methodology’s utilization. Without the appropriate format for
questioning and responding being used, by the teacher, the value of this method may
become lost in a science classroom. In the setting of an English Language Arts
classroom, questions are often framed in an open-ended manner relying more on student
interpretation of a topic or literary work to begin the guided learning process (Lee 1997;
Fellows 1994). In the scientific classroom however, open-ended response questions may
afford learners the risk of further complicating new knowledge mastery. Learners may
compound, reinforce, or completely misinterpret the proposed topic (Hammer, 1996;
Burron et al., 1993; Lee, 1993). To correct this potential source of initial confusion, it is
feasible to use research based multiple-choice questions to begin the student’s foray into
learning (Force Concept Inventory Simplified, Thornton et al. 1998). Students can still be
guided to make a selection, but will also be provided space beneath the question to give
feedback to the reader. When the process of using the previously mentioned “reflective
journal” is merged with guidance a Learning Log is now established (Hammer, 1996;
Sanders, 2010).

6
One of the main proponents of the Learning Log methodology, Nancy Fellows,
has devoted a great deal of discussion to the methodologies’ extensive use of writing to
generate reflection on the concepts of science. Fellows argues that many past studies on
understanding how students perceive science lack a “window” to individual student
thinking (Fellows, 1994). This problem is further complicated by how the educator
themselves approach the new instructional technique (Krajcik et al. 1994). Educational
training practices, taught to educators themselves, have largely relied upon the
methodology of direct instructional content delivery followed by limited guided practice
and a brief amount of independent practice, which culminates into a summative
assessment (Dart et al. 1991). The primary deficit in this instructional model is the lack
of self-generated learner feedback. This model “does not tell us how students’ knowledge
has actually changed, how their thinking has developed, or how they themselves
experience their learning” (Tynjala, 1998). Students often gain a better sense of self-
generated understanding when they can rectify their self-imposed errors without fear of a
grade or some other form of negative feedback (Hammer 1996). Mary Hanrahan
abdicates that affirmational feedback will not only bolster student interest in science, but
will make students more receptive to deeper levels of concept pursuit. Similarly,
Hanrahan sees journaling responses as a way to assure that answers are not “judged on
scientific orthodoxy or for orthographical or grammatical correctness” in order that
students’ answers are welcomed in the spirit of individuals having the “right to make
sense of their own experience” (Hanrahan, 1999).
Elizabeth Lee sees that “an essential benefit of the learning response log is the
creation of an environment where students feel free to express their concerns and

7
experiment.” Lee was an English teacher who often saw weaker students attempt new
explanations, be they correct or incorrect, more frequently in journal format. She saw
these attempts at gaining new knowledge as experimental approaches by students as they
sought conceptual understanding of the content. Lee describes in her research experiences
where students developed a deeper rapport with her, which in turn led to them wanting to
explain their work as opposed to merely seeking the right answer. Lee contends that
higher-order thinking occurs from students explaining how an answer was achieved and
not from simply completing a complex task. Additionally, Lee argues that Learning Logs
promote a constructivist approach to learning with a greater emphasis on the student
directing their interests (Lee, 1997).
Krajcik et al., 1994 has also proposed the use of Learning Logs, not only to
promote higher order reasoning skills in students, but also because they can have the
same affect on educators. In a series of interviews of university professors conducted by
Henderson, he found that many instructors believed student learning was directly
impacted by their abilities to use peer/instructor feedback, working out and discussing
physics problems, and by recording observations on an on-going basis. The interviews
showed some discrepancies in the individual instructors’ attitudes towards learning, but
all agreed their courses and instructional methodologies were impacted by feedback from
their students. Henderson, like Krajick, sees the use of the Learning Log as a dialogue or
data gathering tool, which results in teachers beneficially redesigning their lessons and a
better understanding of their students (Henderson et al. 2002; Krajick et al. 1994).
With all of the beneficial arguments for Learning Logs made, I began searching
for the supporting empirical research generated on Learning Logs. The Louisiana State

8
Department of Education’s website lists four studies as evidence for the Learning Log’s
application to Science (Audet 1996, Baker 2003, McIntosh et al. 2001, & Sanders 2010).
Of the four studies referenced, only Audet utilized quantitative data to attempt to show
some slight gains in student conceptual mastery. This study, which is currently the
primary piece of supporting research, was not a true experimental study. The study was
conducted without a true experimental design and was more of an analysis of a method
after its implementation (Audet 1996; Louisiana Department of Education Website).
Audet’s study focused on the educational effects of using computerized Learning
Logs with a group of high school sophomore Physics students. The study utilized the
format of a student and teacher dialogue in a digital journal over an eight-week unit. A
comparison group from a previous year who did not use Learning Logs was used as the
control. For this study, student’s responses were scored using Kagen’s qualitative scoring
guide (Kagen, 1990). Within this qualitative framework, student responses were tracked
and quantified to see if patterns of knowledge demonstration became more evident as the
Learning Logs were utilized. The study had inconclusive results as far as knowledge
gained due to several factors. The primary sources of error were a fundamental lack of
empirical data, the data not being collected during the trial’s conduction, and a lack of
experimental design (Audet, 1996).
I think Audet attempted to analyze the knowledge gained by the students after the
school year had concluded. Audet had not intended to study Learning Logs, but noticed
some observances in his students’ performance on a particular unit. He attempted to then
retrospectively turn these observances into a study. This approach led to many questions
on the exact variables that may have impacted the study’s outcome. The responses that

9
were submitted by the students were in the format of open-ended responses. Due to this
open format Audet was forced to score many students in a qualitative method. This
disconnect in grading raised doubts as to the accuracy and fidelity of his empirical
conclusions. The study cited no research with a proven methodology in scoring student
responses. Audet’s work did highlight the necessity of looking for a methodology to
collect more empirical data or to utilize other methodologies to address some of the
variables that were previously unaccounted for (Audet, 1996).
The next influential study on Learning Logs occurred in the United Kingdom.
Stephens et al. sought to look at the five-week utilization of learning logs with a group of
fourteen to fifteen year olds. This study sought to explore the questions of how Learning
Logs contribute to student self-reflection and in turn lead to conceptual mastery. Unlike
Audet’s study this one did have an experimental design. Despite having a small sample
size of 30 students and no control group, the study broached upon the idea of gathering
empirical data via a questionnaire. The questionnaire, created by McLellan (McLellan,
2005), was used as a pre/post test to measure student gains. Students were asked to
complete exercises, which were scored under a Wilcoxon scale. This scale correlated the
students’ mastery to a predetermined numerical value to assess whether their population
mean ranks differ (Wilcoxon, 1945). Stephens et al. attempted to use a quantitative scale
to score open-ended student responses. Once again a fundamental problem arose in the
transference of qualitative data into empirical data. The experiment concluded that the
format and time scale were inadequate for the experiment to garner any conclusive data.
The standard deviation showed a clear case of non-clarity in the fact that pre and posttest
scores were nearly identical. Stephens et al. suggested that other researchers might rectify

10
the data errors by narrowing the options students could answer with and focusing on
specific topics that could be used in student responses (Stephens et al., 2010).
Following the recommendations of the Stephens et al. study many other studies
were conducted using learning logs. A study conducted by Barry Dart and John Clarke
used the Learning Log itself as the primary data collection tool. A group of sixty-seven
pre-service science teachers who were asked to use Learning Logs as a means of tracking
their own responses to various teaching techniques. The pre-service teachers were asked
to record their thoughts on the affect different lessons and labs had upon their learning
motivation. There was no control group used for this study. The study’s design allowed
its participants to use learning groups, discussions within their groups, and independent
research to master the course’s objectives provided daily entries were made in Learning
Logs. The Study Processes Questionnaire (SPQ) by Biggs was used as a pre and post
quantitative assessment. The SPQ tests provided a narrower topic focus on a specific set
of skills. While the empirical data generated from the questionnaire was promising, the
lack of a control group raises questions as to the study’s validity or true applicability. It
was also difficult to see the rationale behind the numerical correlation assigned to the
students’ verbal scores due to a weak correlation in the SPQ’s key with the actual data
gathered from the Learning Log (Dart et al, 1991).
The Clarke and Dart study stated, “In their Learning Logs, students commented
on their personal learning experiences. These were unstructured open-ended responses
and provided qualitative data to both compliment and supplement the quantitative data”
(Dart et al, 1991). While a great deal of discussion was made on the participant’s
comments the study never attempted to quantify or establish a concrete methodology for

11
numerically rating the responses. The study presented data that supported an overall
growth in participant knowledge and stated that the majority of Learning Log entries
showed a “favorable attitude directed towards reflection learning through the logs” (Dart
et al. 1991). Dart’s study made it clear that the use of Learning Logs as an assessment
tool would require a more definitive scoring methodology.
The primary challenge of scoring Learning Log responses is clearly a major
roadblock in this process. Promise for solving this problem came in a study by Burron et
al, as they investigated the impact Learning Logs coupled with peer team interactions,
had on students’ attitudes towards learning Physical Science in a laboratory setting. They
did have a control group, which used the traditional methodologies of lectures and
independent work. Burron et al.’s study used a twelfth grade National Assessment of
Educational Progress (NAEP) Science Exam as a pretest and post-test to track their
participants’ content knowledge. Unlike other studies Burron et al. also used the
Instructional Strategies Evaluation (ISE) to “measure the students’ perceptions of the
relative strengths and weaknesses of cooperative learning” (Burron et al., 1993). The data
from the ISE displayed significant evidence in favor of cooperative learning and
demonstrated in all but one subtopic a benefit from the proposed methodology. The
methodology of the ISE as a research tool still relied heavily upon having Burron and his
colleagues qualitatively analyze the open ended responses (Burron et al., 1993).
To understand student thinking required investigation into what are the common
ideas students share. A starting point in this process was an understanding of Aristotelian
thinking. Aristotelian Physics uses the idea that motion is due to a change in position and
requires set reference points. (Halloun, et. al 1985) While most of the ideas of

12
Aristotelian Physics would sync up with the data recorded it is important to note some
discrepancies in student thought processes and true Aristotelian Physics. Halloun et al.
points these out in the fact that while students may not think the Earth’s surface is
stationary (non-rotating) many would agree that heavier objects fall faster, an increase in
speed must mean that there is an increase in force, movement only occurs with the
application of a force, a constant force would lead to a constant increase in speed, and if
no motion is occurring then no forces are applied to the object. Halloun et al.’s study was
conducted to see the thought processes used; by first time college physics students, as
they explained their thought processes on a series of questions. The outcome of Halloun
et al suggested that students were not using only Aristotelian Physics but a combination
of personal observations, misconceptions, life experiences, and Aristotelian ideas. The
study’s suggestions that students’ personal ideas are often difficult to completely explain,
but must be considered when designing experimental exams.
13
Methodology
Study Format
It is clear that in order to create a proper study, I need to design a method of
empirically measuring student conceptual mastery as well as assessing the portion of the
student’s qualitative responses. I began by selecting a study school that would afford the
maximum data yield. A ninth grade academy was chosen since it is both the first
exposure many students have to Physical Science and it has a cohort with a n=554. I
looked at the format of Audet’s study to construct a rough framework. I started by
designing the Learning Log to collect data from a very narrow set of objectives.
For guidance in selecting an appropriate set of objectives I used the Louisiana
Department of Education’s Grade Level Expectations (G.L.E.s) for Physical Science.
The G.L.E.s are used state wide to ensure that all students are receiving the content in a
semi-standardized way. Each parish is permitted to develop their own methodology for
tracking teachers as they use the G.L.E.s to guide their teaching (Louisiana Department
of Education Grade Level Expectations for Physical Science). In the study school the
faculty are required to follow a parish developed pacing guide. A parish-selected team of
teachers made the pacing guide, which was developed by a team of veteran Physical
Science teachers. This team met for four hours in 2008 and set the weekly objective
mastery goals. The parish’s policy permitted teachers to be either two days ahead or
behind of the preset goals. If a teacher were outside of this guideline they would face
disciplinary action by their principal. Under this framework the G.L.E.’s for Newton’s
laws of force and motion were allotted two weeks in the second semester. The objectives

14
from the Louisiana Department of Education Grade Level Expectations for Physical
Science were:
1. Measure the physical properties of different forms of matter in metric system units (e.g., length, mass, volume, temperature) (PS-H-A1)
2. Gather and organize data in charts, tables, and graphs (PS-H-A1) 3. Differentiate between mass and weight (PS-H-E1) 4. Compare the characteristics and strengths of forces in nature (e.g.,
gravitational, electrical, magnetic, nuclear) (PS-H-E1) 5. Differentiate between speed and velocity (PS-H-E2) 6. Plot and compare line graphs of acceleration and velocity (PS-H-E2) 7. Calculate velocity and acceleration using equations (PS-H-E2) 8. Demonstrate Newton’s three laws of motion (e.g., inertia, net force using F =
ma, equal and opposite forces) (PS-H-E3) 9. Describe and demonstrate the motion of common objects in terms of the
position of the observer (PS-H-E4) 10. Model and explain how momentum is conserved during collisions (PS-H-
F2) (Louisiana Department of Education’s Grade Level Expectations for Physical Science)
A total of five hundred and fifty instructional minutes were needed to cover these
topics. The study’s focus was now centered on the conceptual mastery of force, motion,
and newton’s three laws, which needed to occur in this time period. With a clear focus on
the student learning objectives selected an empirically accurate means of scoring student
responses was necessary. The Force Motion Concept Evaluation (FMCE) provided
research proven method of assessing student knowledge that was free of subjective
influences. The FMCE is a forty-seven question multiple-choice formatted exam. The
FMCE has been used on students at this grade level many times and is considered to be a
reliable assessment of conceptual learning (Thornton et al., 1998). The exam dedicated
six questions to Newton’s First Law, fifteen questions to Newton’s Second Law, ten
questions to Newton’s Third Law, and twelve questions to Kinematics. The exam offered
five to seven responses for students to choose from on each question. The FMCE was

15
Week 1 Day 2: You toss a ball up into the air. Which of these statements is true
of the ball as it is going up into the air? A. the force of gravity > the force the ball is tossed up with B. the force of gravity = the force that the ball is tossed up with C. the force of gravity < the force the ball is tossed up with D. gravity is the only force acting on the ball E. there is not enough information provided to answer this question
utilized as a pre and post-test of student conceptual mastery in my study with permission
form Robert Thornton at Tufts University (Thornton et al., 1998).
In designing the Learning Log implementation I relied upon the procedure used
in Stephens et al’s study. Stephens et al used learning logs for lab reflection on very
specific techniques and concepts in the United Kingdom. The study generated no
discernable difference in its pretest or post-test scores due to data errors resulting from
students having too broad of a response field. The study recommended a narrowing of the
options and topics that students could use in their responses. I proceeded to do this
through the design of multiple-choice questions with a space for free response provided.
To clarify the issue of seeing if students were gaining knowledge from their own
self-analysis of their work, I began looking at aligning the Learning Log questions to the
prescribed lesson cycle. To accomplish alignment a sequence of prior year’s lessons was
analyzed from each of the study’s participating teachers. After this review was
completed, a series of multiple-choice questions was generated for use on each day. The
questions were structured similar to the FMCE and would provide a means of empirically
tracking the students’ daily conceptual knowledge, regardless of their use of reflection.
Below is a sample Learning Log question that I created, a complete set of questions used
is shown in Appendix B.
Figure 1: Sample Learning Log question used during the study

16
With the format of the Learning Log selected it was now time to find a
mechanism of incorporating a place for students to show reflection. It was important to
note that the study’s focus was on the actual use of reflection by the student and not
necessarily a “correct” expression of the reflection. For this purpose I decided to score
the reflection on a basis of whether a student attempted to respond or not. An attempt at
reflection would receive a score of one and no attempt would yield a student score of
zero. I chose to incorporate a place for reflection as shown in Figure 2.
Week 1 Day 2: You toss a ball up into the air. Which of these statements is true of the ball as it is going up into the air?
A. the force of gravity > the force the ball is tossed up with B. the force of gravity = the force that the ball is tossed up with C. the force of gravity < the force the ball is tossed up with D. gravity is the only force acting on the ball E. there is not enough information provided to answer this question
Did you change your answer from the start of class? Yes No If yes explain why:_______________________________________
Figure 2: Sample Learning Log, with space for reflection, used in this study.
Participants/Implementation
The Learning Logs were administered daily for a ten day period. The students
were divided, by class section, into either an experimental or control group. The entire
class section would be given either a control or experimental question each day. (A
discussion of the actual procedure used in these sections is explained further in this
paper.) Each teacher taught either four or six sections of Physical Science. All class
sections were composed of randomly assembled numbers of sub groups, which are listed
in Tables 1 and 2. The study school had a large 9th grade population above 500 students,
with all but two groups taking Physical Science. Of the students who did not take

17
Physical Science forty-six were taking Biology only and twenty were self-contained non-
diploma bound special education students. The forty-six Biology students were simply
taking Biology by choice instead of Physical Science. This study included five hundred
and fifty four students. These students were divided amongst the four teachers in twenty
sections. The target population had five hundred and twenty eight students (85%) who
qualified for free/reduced lunch and was composed of three hundred and forty one male
(55%) and two hundred and seventy nine female students (45%).
Table 1: School wide ethnic groups reflective of trends
Racial Groups %
Caucasian Above 80%
African American Less than 10%
Hispanic Less than 10%
Asian Less than 10%
Table 2: School wide sub groups reflective of trends
Educational Groups
%
504 Less than 10%
Gifted Less than 10%
Special Education Greater than 10%
All students were given the FMCE prior to the two-week unit being taught. After
the pretest was given there was a slight difference in the activities carried out in each
class section. The study school utilized a start of class activity called a “bell ringer” as a

18
means of getting students to enter the room and get settled. These “bell ringers” were for
a daily grade and a key part of the students daily routine. The “bell ringers” were
typically open-ended questions as seen in Figure 3.
What is Newton’s First Law? Give an example from yesterday’s notes.
Figure 3: A sample “bell ringer” question.
Using this school-wide system, the Learning Log was substituted for the “bell
ringer”. Teachers were given the Learning Log questions copied and sorted by section
prior to starting the study. In the control sections the teachers allowed for students to
work on the Learning Log question, such as the example in Figure 1, for five minutes and
before it was collected. In the experimental sections students kept their Learning Log
slips until the end of class. Five minutes prior to the end of class students in the
experimental classes were asked to turn their slip over. Students were presented with the
exact same question as the start of the class but with a probing question as seen in Figure
2. Students were given permission and time to interact with their peers seated near them.
Their responses on the end of class question afforded them a chance to explain their
reasoning. Each student had the opportunity to converse with other learners, record their
thoughts, make corrections to errors in their answers and resubmit the new response if
they chose. The FMCE posttest was given at the end of the two-week unit to assess
conceptual mastery. Upon the study’s conclusion one hundred and fifty four students had
to be removed due to a lack of a pre or post-test.
The remaining student demographics for the groups are listed in Tables 3, 4, 5 and
6. Tables 3 and 4 are for the control group. There were one hundred and ninety eight total
students in the control group. The control had one hundred and four students (53%) who

19
qualify for free/reduced lunch. The control had ninety-two Males (46%) and one hundred
and six Females (54%) as participants. Tables 5 and 6 are for the experimental group.
There were two hundred and two total students in the experimental group. The group had
one hundred and three students (53%) who qualify for free/reduced lunch. The control
had one hundred and two Males (55%) and ninety Females as participants (45%). The
only significant difference in the targeted population’s make up and the actual study was
the percentage of free and reduced lunch students. It is unclear as to what impact this may
have had on the study’s data.
Table 3: Control study group’s ethnic groups
Con. Racial Groups
Number %
Caucasian 172 86.8%
African American 22 11.1%
Hispanic 9 2%
Asian 1 < 1%
Table 4: Control study group’s sub groups
Con. Educational Groups
Number %
504 4 2%
Gifted 7 3.5%
Special Education 17 8.5%

20
Table 5: Experimental study group’s ethnic groups
Exp. Racial Groups
Number %
Caucasian 164 81%
African American 21 10%
Hispanic 11 5%
Asian 2 < 1%
Table 6: Control study group’s sub groups
Exp. Educational Groups
Number %
504 4 1.9%
Gifted 6 2.9%
Special Education 14 6.9%
The teachers participating in this study were all experienced teachers within their
field. For the purpose of data collection the teachers were randomly assigned a code T1,
T2, T3, or T4.This system will be used for data tracking in this study. All four were
certified by the state of Louisiana, met the definition of the national requirement to be
highly qualified in the area of Physical Science, and had taught the content for at least
two consecutive years using the local parish’s pacing guide. While each teacher was
allowed to structure their content delivery cycle in their own manner, they also had to
follow the previously discussed parish and state guidelines. All teachers had access to the
same textbooks, teacher resources, lab equipment, visual aids, demonstration tools, and

21
educational videos. All four teachers were present for the entire two week study and
taught their students for two FMCE administration periods and ten forty-five minute class
sessions.

22
Results/Analysis
Preliminary Analysis
Upon collection of the data the FMCE was scored using the accepted key and
data, was recorded as discussed in Appendix A. The average mean of the control and
experimental groups pre and post-tests was calculated. The uncertainty of the mean
showed no difference in the pretest scores, but the data showed a very small visible
difference between the post-test data.
Figure 4: The mean of the pretest and post-test values for the experimental (dark gray) and control (light gray) groups. For the control N=197 and for the experimental N=203. There were 47 questions on the FMCE. A two-sample t test was conducted to establish whether the data between control and
experimental groups were statistically different. The alpha value of 0.05 will be used to
aid in confidence calculations here and throughout the study. The error bars depicted
show standard error of the means here and throughout the study. The t test yielded a
value of 0.1. This indicated that there was no real significance, but the results are more
likely due to random chance.
0
1
2
3
4
5
6
7
8
Pre Post

23
Equation 1: t test ! !"#$% = !!!!!!!!
!!!!
!!
At this juncture in the data analysis an examination of the actual raw gains was
conducted. This statistical test showed no significant difference due to an uncertainty of
the mean of 0.17. To further examine the data from the gains a Normalized Gain (g), as
shown in Equation 2, was calculated. The Normalized Gain reflects the fraction of the
available improvement attained between the pretest and post-test.
Once again no significant difference was observed due to the uncertainty of the mean
being 0.16.
Equation 2: Normalized Gains
! =!"#$$%#$ − !"#$#%$47 − !"#$#%$
Figure 5: Raw Gains for the control and experimental groups. Control is shown in dark gray with an N of 197. Experimental is in light gray with a N of 203. Normalized Gains for the control and experimental groups.
0%
1%
2%
Raw Normalized

24
With no clear significance in the prior analyses, an examination of the possible
variations in genders was conducted using the t test. The data once again showed no
significance in any of the possible comparisons, as seen in Table 7 and Figure 6.
Table 7: The t test values for the various groupings of males and females. Due to the fact that no values are less than 0.05 there is no significance in the groups.
Gender Pre Test Post Test
Male Experimental Vs. Male Control
0.65 0.16
Female Experimental Vs. Female Control
0.78 0.47
Male Control Vs. Female Control
0.90 0.57
Male Experimental Vs. Female Experimental
0.79 0.81
All Male Vs. All Female 0.69 0.91
Figure 6: The mean scores on the pretest and post-test for the control and experimental groups broken down by gender. The uncertainty of the mean values are shown. Due to overlap in the error bars it is clear that there is no significant differences.
0 1 2 3 4 5 6 7 8 9
All Pre All Post Male Con Pre
Male Con Post
Male Exp Pre
Male Exp Post
Female Con Pre
Female Con Post
Female Exp Pre
Female Exp Post
Mean Scores By Gender

25
The analysis of the subgroups was then conducted using the analysis of variance
(ANOVA). The ANOVA fixed effects model was selected as a means of measuring the
possible change in the usage of Learning Logs between groups. The ANOVA test showed
a p value of 0.34 between the various ethnic subgroups pretests and post-tests (African
American, Asian, Caucasian, and Hispanic). There was a not significant effect on the
population due to ethnic group as seen with a p> 0.05 for eight conditions [F (3, 453) =
0.20, p = 0.26]. The p value between the educational subgroups (Special Education,
Gifted, Free/Reduced Lunch, and 504) was 0.70. There was not a significant effect on the
population due to sub-group as seen with a p> 0.05 for eight conditions [F (7, 276) =
0.65, p = 0.70]. Each of the aforementioned data analysis methods yielded little evidence
of the students making conceptual gains. A more in depth analysis of the data was
merited.
Learning Log Impact
The Learning Logs for the control groups were scored using a correct answer key
for the multiple-choice format (Figure 1). The experimental groups’ were empirically
scored as well, but students within this group were also scored for their use of reflection
on a scale of one to zero (Figure 2). Students earned a one for making some attempt at
writing a qualitative response. When the experimental data was analyzed, there were two
thousand and twenty opportunities for student reflection. Of the opportunities available
reflection was used a total of fifty-one times. The data showed that reflection was used
only two percent of the total possible opportunities (Figure 7).

26
Figure 7: Pi chart showing the percentage that used reflection out of the total number of reflection opportunities. The reflection opportunities for the fifty-one responses was then examined to see
if the reflection contributed to the student properly selecting a correct response on the end
of class question. The data showed that only two of the fifty-one responses resulted in the
student moving to the correct answer. In the forty-nine other response situations students
did change their responses to another incorrect response. It was also noted that only two
participants in all of the experimental groups used the reflection space more than once.
Of the two respondents to use reflection more than twice, one wrote nonsensical
statements about “waffles”. All of the reflection responses were in an incomplete
sentence format.
I was able to visit the teachers’ classrooms through out the study for ten to fifteen
minute intervals. During three of these visitations I was able to observe the experimental
group’s final five minutes of class. During this time the qualitative view of students
would appear to be consistent with the numerous background studies’ findings. I
observed students having conversations about the problems, some simply marking an
Opportunities To Use
ReJlection 97%
ReJlection Used 3%

27
answer to turn in, and out of the ninety students observed only one appeared to take an
extended amount of time (roughly four minutes) to reflect and write a response. If I had
not empirically scored the Learning Logs and the reflection opportunities I would have
agreed that the practice appeared to foster more student interactions. However, when
comparing this empirical data to that of the prior analyses of the FMCE data it did not
appear to be any discernible impact due to the Learning Log.
Focused Analysis
To obtain further insight on the students’ knowledge an examination of the
average student score on the pre and post-test was conducted for each of the four teachers
data sets. The analysis grouped the control and experimental groups into one set of pre
and post-test data (Figure 8).
Figure 8: The average number of correct responses out of 47 questions. This graph groups all of the students by teacher. The control and experimental students are graphed together. From a series of random visitations I conducted and review of their lesson plans I
could see that each teacher did try different methods. The visitations totaled twenty in
0.
1.
2.
3.
4.
5.
6.
7.
8.
T1 Pre Test
T1 Post Test
T2 Pretest
T2 Post Test
T3 Pre Test
T3 Post Test
T4 Pretest
T4 Post Test
Averages

28
number and were throughout the sections each teacher taught. I visited each teacher five
times and observed the practices for approximately ten to fifteen minutes. The teachers
were all observed at the start and end of their lessons. One teacher, T4, was
predominantly lecture based and relied heavily on the textbook resources to guide
learning opportunities for the students. Another teacher, T1, was very lab and inquiry
based in their instruction. The lessons had a thought provoking incident, demonstration,
or example used as a catalyst to begin the day’s lesson. Students were given a brief
lecture but often class discussion and peer-to-peer interactions guided class. The
remaining teachers, T3 and T4, relied upon a hybrid of the previous teachers’ methods.
Students in these groups conducted three labs, relied mainly on lecture to receive content,
but did have two discussion prompts.
The data from each teacher’s sections display no real significance, but it did raise
the question of what impact the teacher’s teaching style did have on student gains. I
looked at the correlation of the teacher’s class FMCE score to their students (Table 8).
The data showed that the teachers’ style did not appear to have an impact on the mastery
of the concepts. When the class average post-test scores were compared to each other the
gains were of a non-significant statistical difference. Despite the varied teaching styles,
the gains made by students were so minimal that it is clear that no delivery method was
extremely effective. Students did not appear to master the concepts whether they were
presented with labs, lecture, or discussions. I think that in future studies would be useful
to analyze the role of the teacher’s personal content knowledge understanding on student
gains. It is possible that the teachers in this study were working with their own personal
29
ideas and that those may have factored into student understanding. This study did not
focus on the teachers and therefore it is difficult to make a clear determination on this.
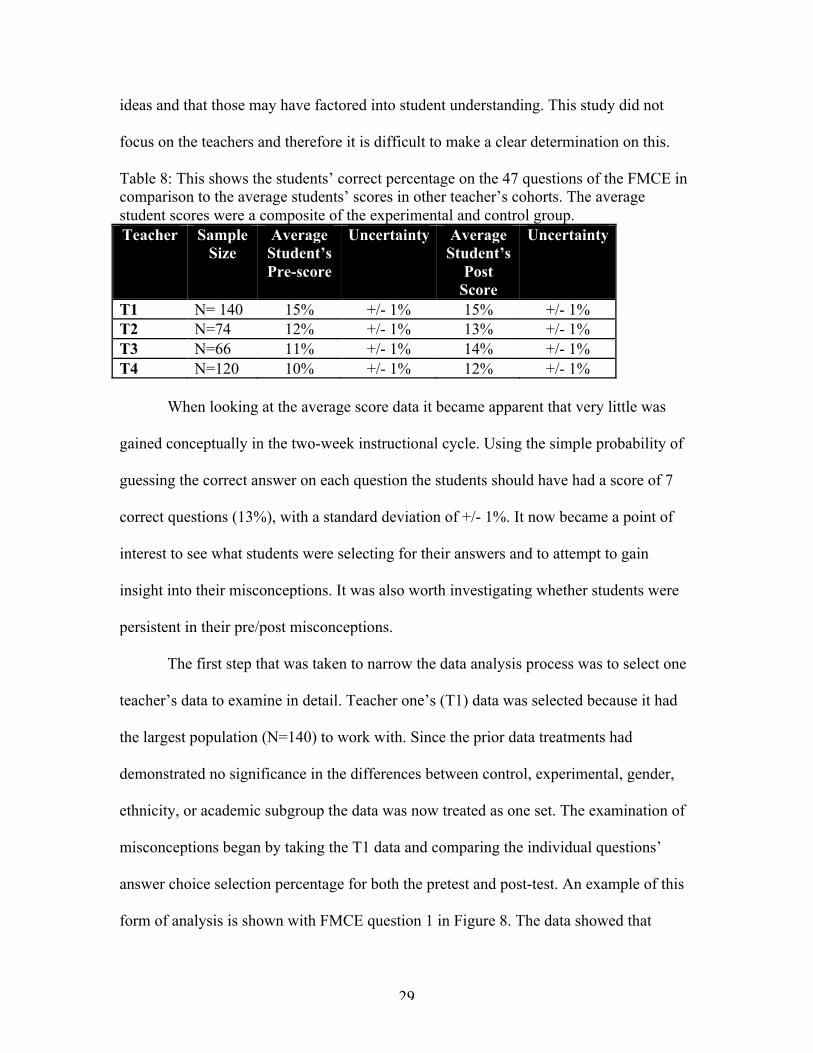
Table 8: This shows the students’ correct percentage on the 47 questions of the FMCE in comparison to the average students’ scores in other teacher’s cohorts. The average student scores were a composite of the experimental and control group. Teacher Sample
Size Average
Student’s Pre-score
Uncertainty Average Student’s
Post Score
Uncertainty
T1 N= 140 15% +/- 1% 15% +/- 1% T2 N=74 12% +/- 1% 13% +/- 1% T3 N=66 11% +/- 1% 14% +/- 1% T4 N=120 10% +/- 1% 12% +/- 1% When looking at the average score data it became apparent that very little was
gained conceptually in the two-week instructional cycle. Using the simple probability of
guessing the correct answer on each question the students should have had a score of 7
correct questions (13%), with a standard deviation of +/- 1%. It now became a point of
interest to see what students were selecting for their answers and to attempt to gain
insight into their misconceptions. It was also worth investigating whether students were
persistent in their pre/post misconceptions.
The first step that was taken to narrow the data analysis process was to select one
teacher’s data to examine in detail. Teacher one’s (T1) data was selected because it had
the largest population (N=140) to work with. Since the prior data treatments had
demonstrated no significance in the differences between control, experimental, gender,
ethnicity, or academic subgroup the data was now treated as one set. The examination of
misconceptions began by taking the T1 data and comparing the individual questions’
answer choice selection percentage for both the pretest and post-test. An example of this
form of analysis is shown with FMCE question 1 in Figure 8. The data showed that

30
students were gravitating towards at least one misconception more than others (Table 9).
When looking at Figure 8, it is noticeable that a slight movement away from choice A is
occurring by 6% of the students. The 6% movement was analyzed in Figure 9. Figure 9
shows a net movement of students from the Aristotelian answer to the other
misconception choices. It does not show a student migration towards the Newtonian
answers. The trend that was highlighted in question one from the T1 data was repeated in
all but three questions of the students’ data. Students were fluctuating in their responses
on the pretest to post-test but they were not migrating to the Newtonian answer.The three
questions that did not fit this trend involved students selecting the correct answer 58% to
76% of the time on the pretest and maintaining that percentage or increasing it on the
post-test. This may indicate that students are taking this test with a desire to answer the
questions correctly. When these three questions were cross-referenced, with other
studies, it was clear that there was a high persistence for respondents answering them
correctly (Thornton et al. 1998).
Figure 8: This chart shows the percentage of students for each answer choice on number one from the FMCE. The correct answer was choice b. A majority of the students are gravitating to choice a.
a b c d e f g h i j Pre 75% 21% 2% 0% 1% 0% 1% 0% 0% 0% Post 68% 21% 6% 3% 0% 1% 1% 0% 0% 1%
0% 10% 20% 30% 40% 50% 60% 70% 80%

31
Figure 9: The percentage of students who moved away from the selected choices on their pretest for question 1 is shown here. While 7% migrate from choice a they are not moving towards the correct answer choice b. This reoccurring trend was an area that required an in depth analysis of the answer
choices and student’s reasoning in selecting them. This process began by looking at the
individual participant’s selection of misconception answers and how frequently the
individual changed their response. The data showed a strong correlation to one of three
distinct thought processes Newtonian Physics, Aristotelian Physics, and Personal Ideas
based upon life experiences. Three questions showed the Newtonian Physics logic as the
predominant factor in answer choice selection (See Figure 10). Thornton et al. also noted
these same three questions as being strongly answered with Newtonian Physics in the
FMCE study. The students’ personal ideas accounted for fifteen questions (See Figure
11). These personal ideas appeared to not fit either an Aristotelian or Newtonian
definition, but did show a high percentage of selection by a greater than random guessing
percentage of students. It is however, important to note that no exit interviews were
conducted with the students so an exact explanation of the reasoning cannot be made. A
misconception or student generated idea key was created by taking each question’s most
-‐7%
0%
4% 3%
-‐1%
1% 0% 0% 0%
1%
-‐8%
-‐6%
-‐4%
-‐2%
0%
2%
4%
6%

32
selected incorrect answer. This Misconception key would be the basis for an in depth
analysis method discussed further in this study. Aristotelian Physics appeared to be the
guiding logic for twenty-nine questions (See Figure 12). The fact became apparent that
many students were selecting and maintaining their personal ideas and misconceptions on
both the pretest and the post-test. It was now necessary to investigate if this was with true
persistence on the part of the students or random guessing.
Figure 10: This shows the number of responses that had a statistical significance in terms of students providing an large percentage of correct responses. In dark gray the pretest is shown and the post-test is in light gray. The total sample was 140 students. Trends became apparent by graphing the probability distribution of the percentage
of students’ selecting the same answer choice pretest versus post-test. An analysis of the
kurtosis could be examined for each graph. The kurtosis is a measure of the “peakedness”
0%
10%
20%
30%
40%
50%
60%
70%
15 33 43 FMCE Question Number

33
Figure 11: This shows the responses that were answered incorrectly by students in the group T1. Students maintained the same answer choice, which did not follow the Newtonian or Aristotelian logic. In dark gray the pretest is shown and the post-test is in light gray. The total sample was 140 students.
Figure 12: This shows the responses where the same Aristotelian choice was selected and maintained. In dark gray the pretest is shown and the post-test is in light gray. The total sample was 140 students. of the probability curve. In a Gaussian distribution the narrower the bell curve is the
greater the kurtosis. This suggested a great significance as to the students’ responses
being due to purposeful selection on the students’ part. For the three questions where the
0%
10%
20%
30%
40%
50%
60%
70%
6 8 9 11 14 17 21 23 24 25 27 29 44 45 47 FMCE Question Number
0
10
20
30
40
50
60
70
80
90
1 2 3 4 5 7 10 12 13 16 18 19 20 22 26 28 30 31 32 34 35 36 37 38 39 40 41 42 46 FMCE Question Number
34
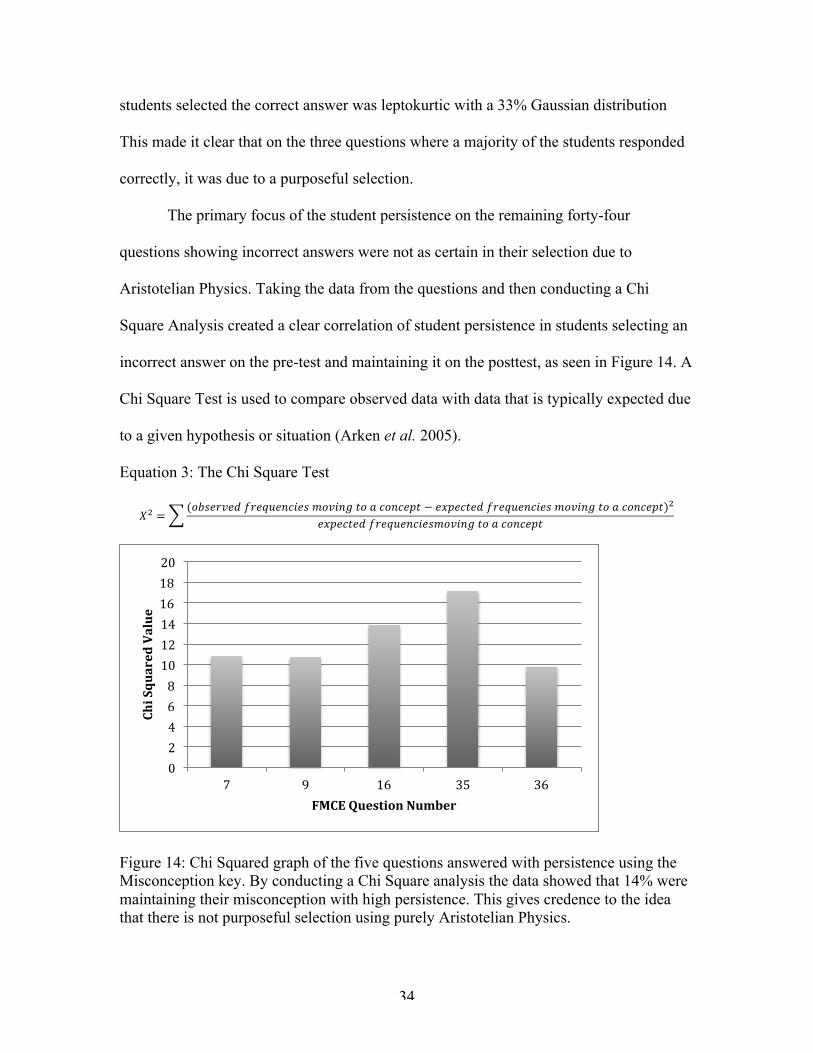
students selected the correct answer was leptokurtic with a 33% Gaussian distribution
This made it clear that on the three questions where a majority of the students responded
correctly, it was due to a purposeful selection.
The primary focus of the student persistence on the remaining forty-four
questions showing incorrect answers were not as certain in their selection due to
Aristotelian Physics. Taking the data from the questions and then conducting a Chi
Square Analysis created a clear correlation of student persistence in students selecting an
incorrect answer on the pre-test and maintaining it on the posttest, as seen in Figure 14. A
Chi Square Test is used to compare observed data with data that is typically expected due
to a given hypothesis or situation (Arken et al. 2005).
Equation 3: The Chi Square Test
!! =(!"#$%&$' !"#$%#&'(#) !"#$%& !" ! !"#!$%& − !"#!$%!& !"#$%#&'(#) !"#$%& !" ! !"#!$%&)!
!"#!$%!& !"#$%#&'(#)*+,(&- !" ! !"#!$%&
Figure 14: Chi Squared graph of the five questions answered with persistence using the Misconception key. By conducting a Chi Square analysis the data showed that 14% were maintaining their misconception with high persistence. This gives credence to the idea that there is not purposeful selection using purely Aristotelian Physics.
0 2 4 6 8 10 12 14 16 18 20
7 9 16 35 36
Chi Squared Value
FMCE Question Number

35
The data shows that students maintained their own ideas regardless of whether
they selected their own ideas, Newtonian, or Aristotelian reasoning. Calculating the Chi
Square for each student and comparing it with the accepted Chi Square table value of
9.48 found a correlation of 14%. The 9.48 value was selected due to there being four
degrees of freedom and corresponds to a p-value of 0.05. Students held very firmly to
their personal ideas on forty-three out of the forty-seven questions. It is quite clear that
students were not randomly selecting answers, but felt there was fidelity in their
reasoning. This firmness of choice selection held true for both the experimental and
control students in the T1 study group.

36
Conclusions The data that I collected led me into a series of investigations that I had not
previously expected. The study itself set out to see the potential impact of one specific
teaching technique, but opened up a very broad and essential area for further study. I
think that after examining the students’ data on Learning Log utilization and its impact on
their conceptual mastery it is clear that the strategy fails to deliver any meaningful impact
on force/motion conceptual mastery. Very few students used the technique and often
those who did moved from the incorrect answer they selected at the start of the class to
another incorrect answer. In the course of examining the FMCE data I found that
students were holding firm to their ideas regardless of whether they were correct or
incorrect.
The fact that students held firm to their personal ideas despite having four
different teachers, using different teaching methodologies suggests that there is a great
need for further exploration on why students are not mastering the concepts. The four
teachers were all dedicated to their careers and through all available assessments of them
were qualified and motivated to teach their students. In looking at the format of the
concepts being taught and the time period that these teachers had to instruct it is
questionable as to whether or not the time constraints impacted student learning.
The teachers had five hundred and fifty minutes to cover ten G.L.E. s, which
means that the teachers had approximately one day to cover each topic and to also find
the means to continuously review the prior days’ topics. I cannot help but note that given
the nature of this introductory course many students and teachers may be overwhelmed
by the need to cover so much content in so little time. I also think that with a ten day

37
instructional cycle there would be very few opportunities for the teacher to grade an
entire cohorts’ papers, reflect on each, and provide detailed feedback to increase the
individual student’s conceptual mastery.
When I first looked at the data from the FMCE I thought that a lack of student
motivation had impacted the results. As I began to see patterns arise from the data and the
analysis I feel confident in saying that students were genuinely making a concentrated
effort. The students appeared to believe in their answers so firmly that even when they
did move away from them it was often to another incorrect answer, which incorporated a
portion of their original answer or held similarity to their original pretest response. This
made me wonder if there is a larger process at play in how students face their
misconceptions. Are students able to go immediately from the incorrect answer to the
correct one or is it more of a progression from incorrect to incorrect before arriving at the
correct? I was also unable to answer the question of when and where students make false
linkages in content. If a false linkage is made then what must occur to challenge the
linkage sufficiently to make a student accept and internalize the correct answer? With
students holding on to their personal ideas fourteen percent of the time it was not possible
to see the possible progression in this study.
I think that another interesting question raised by this study was what impact does
the teacher’s knowledge of the content area and their selections of teaching methods have
on student gains? In this study there was no in-depth analysis of the teacher’s background
in the content area or the teacher’s own familiarity with the concepts that were being
instructed. It would be of interest to collect more data on this in future studies. I was also

38
not able to examine the conceptual approach that the teachers in this study used to convey
the information on the G.L.E.S. to students.
I think that this study has shown that minor changes in curriculum or simply using
a new teaching tool that is not first empirically proven, will not create student gains. If we
are to increase the conceptual mastery of students I do think that more investigations
must be done on effective teaching strategies and methods. Students’ personal ideas must
be acknowledged, addressed, and challenged in order for new knowledge to be gained.
The data from this study shows that students will not give up an idea in a short period of
time. More research needs to be conducted to answer the over arching question of why
students do not accept the Newtonian explanation and to see if the migration from a
personal idea to the correct answer is a process. Time should be devoted to tracking
students as they take new content and work it into their own personal ideas. An
interesting study could easily develop on trying to see what factors would best facilitate
conceptual transformation in the students.
The data collected from the FMCE displayed that students were not relying upon
random guessing to answer questions. Students appeared to narrow their answer choice
range to two or three choices depending on the question. Students clearly showed a lack
of selection preference for a Newtonian answer. In many questions the students were
demonstrating persistence to a choice despite two weeks on instruction.

39
References Arfken, George, and Weber, Hans. Mathematical Methods For Physicists. Burlington, MA, 2005, PP. 1143-1145 Audet, Richard. “Learning Logs: A Classroom Practice for Enhancing Scientific Sense
Making” Journal of Science Teaching. VOL. 33, NO. 2 (1996), PP. 205-222
Baker, H.J. (2003). The learning log. Journal of Information Systems Education, 14, 11- 14 Brozo, William G. “Content Literacy Strategy Descriptions for the Louisiana Comprehensive Curriculum” (Revisions 2008 & 2012) http://www.louisianaschools.net/lde/uploads/11056.doc. Burron, Bruce, M. Lynn James, and Anthony J. Ambrosio. “The Effects of Cooperative Learning in a Physical Science Course for Elementary/Middle Level Preservice Teachers” JOURNAL OF RESEARCH IN SCIENCE TEACHING VOL. 30 (1993), NO. 7, PP. 697-707 Dart, Barry C., and John A. Clarke. “Helping Students Become Better Learners: A Case Study in Teacher Education” Higher Education, Vol. 22, No. 3, Approaches to Learning and Perceptions of the Learning Environment (Oct., 1991), pp. 317-335 Fellows, Nancy J. “A window into thinking: Using student writing to understand conceptual change in science learning.” Journal of Research in Science Teaching (1994) Vol.31, NO. 9, pp 985-1001 Force Motion Concept Inventory http://modeling.asu.edu/MNS/MNS.html Halloun, Ibrahim, Hestenes, David. “Common sense concepts about motion.” American Journal of Physics, VOL. 53, NO. 11 November (1985) Hammer, David. “More than misconceptions: Multiple perspectives on student knowledge and reasoning, and an appropriate role for educational research.” American Journal of Physics, VOL. 64, NO.10 October (1996), PP.1316-1325 Hanrahan, Mary. “Rethinking science literacy: enhancing Communication and Participation in School Science through affirmational Dialogue Journal Writing.’ Journal of Research in science Teaching, Vol.36, No.6, (1999) PP699-717

40
Henderson, Charles; Heller, Kenneth; Heller, Patricia; Kuo, Vince H.; Yerushalmi, Edit. “Students Learning Problem Solving in Introductory Physics –Forming an initial Hypothesis of Instructors’ Beliefs.” (2002) Paper presented at the Physics Educational Research Conference. Boisie, ID Kagan, D. K. (1990). Ways of evaluating teacher cognition: Inferences concerning the Goldilock's principle. Review of Educational Research, 60, 419–469. Krajcik, Joseph, Phyllis C. Blumenfeld, Ronald W. Marx, Elliot Soloway. “A Collaborative Model for Helping Middle Grade Science Teachers Learn Project- Based Instruction” The Elementary School Journal, Vol. 94, No. 5 (May, 1994), pp. 483-497 Lee, Elizabeth Perritt. “ The Learning log: an Assessment Tool” The English Journal. (1997) Vol. 86, No. 1 pp.41-44 Lee, Okhee, David C. Eichinger, Charles W. Anderson, Glenn D. Berkheimer, and Theron D. Blakeslee. “Changing Middle School Students’ Conceptions of Matter and Molecules” JOURNAL OF RESEARCH IN SCIENCE TEACHING VOL. 30, NO. 3 (1993), PP. 249-270 Louisiana Department of Education Curriculum/ Black Line Masters http://www.doe.state.la.us Louisiana Department of Education Grade Level Expectations for Physical Science http://www.doe.state.la.us/topics/gle.html McLellan R (2005) Motivational goal theory as a possible explanatory framework for differential effects of a lower secondary school cognitive intervention programme (PhD Thesis). London, UK: King’s College. McIntosh,M.E., & Draper, RJ. “Using learning logs in mathematics: writing to learn.” Mathematics Teacher, (2001) 94, pp. 554-557 National Center For Education Statistics, National Assessment of Educational Progress (NAEP) Science Exam http://nces.ed.gov/nationsreportcard/science/ Nussbaum, J., & Novick, S. (1982, April). A study of the conceptual change in the classroom. Paper presented at the annual meeting of the National association for Research in Science Teaching. Lake Geneva, WI. Okhee, Lee. Changing Middle School Students’ Conceptions of Matter and Molecules. Journal of Research in Science Teaching. (1993) Vol 30, NO. 3, pp 249-270
41
Sanders, A. “Learning logs: A communication strategy for all subject areas.” Educational Leadership, 42, (1985) pp. 7-10Stephens, Karen and Mark Winterbottom “Using a learning log to support students’ learning in biology lessons.” Journal of Biological Education Vol. 44, NO. 2 (Spring 2010), PP.72-80 Stephens, Karen and Mark Winterbottom “Using a learning log to support students’ learning in biology lessons.” Journal of Biological Education VOL. 44, NO. 2 (Spring 2010), PP.72-80 Thornton, Ronald K., & Sokoloff, David R. “Assessing student learning of Newton’s laws: The Force and Motion Conceptual Evaluation and the Evaluation of Active Learning Laboratory and Lecture Curricula.” American Journal of Physics, Vol. 66, No. 4, April 1998, PP. 338-352 Tynjala, Paivi. “Writing as a Tool for constructive Learning Students’ Learning experiences during an Experiment.” Higher Education. Vol. 36, No. 2 (Sept 1998) pp. 209-230 Wilcoxon, Frank. “Individual Comparisons by Ranking Methods.” Biometrics Bulletin, Vol. 1, No. 6. (Dec., 1945), pp. 80-83

42
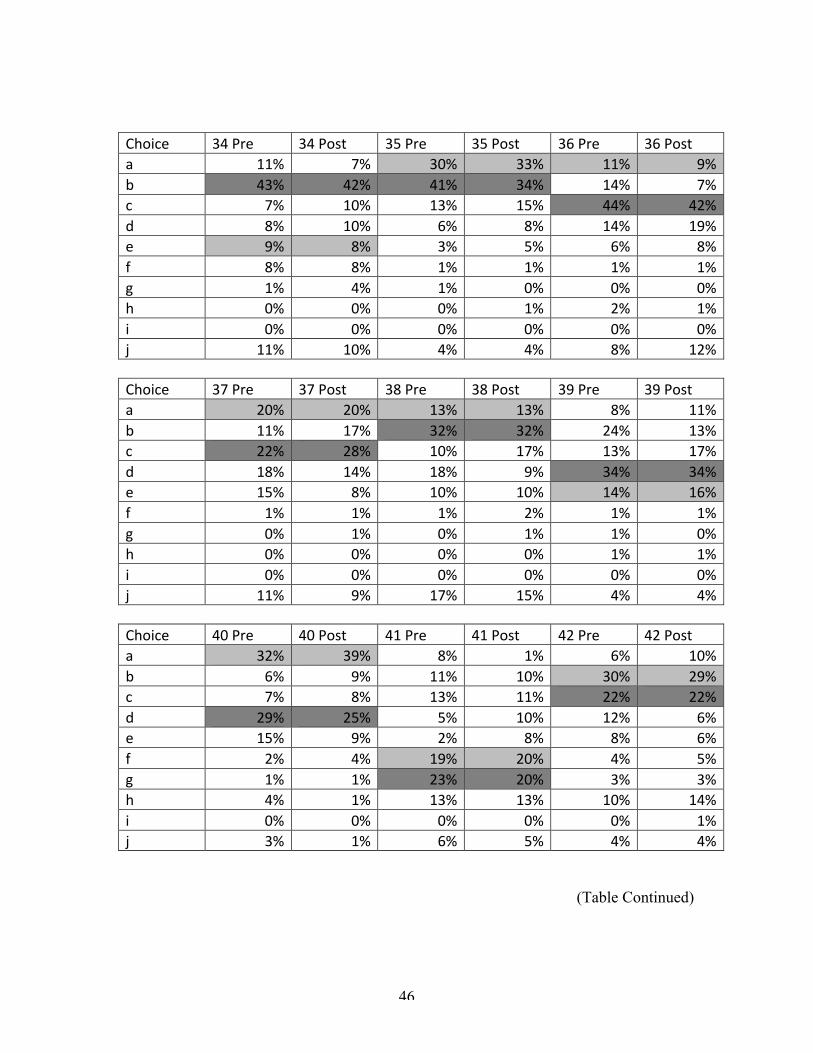
Appendix A T1 FMCE % Changes This table shows T1’s percentage change between pretest and post-test for each of the 47 FMCE questions. The correct answer choice is in light gray. The incorrect choice, receiving the most selections, is in dark gray
Choice 1 Pre 1 Post 2 Pre 2 Post 3 Pre 3 Post a 75% 68% 6% 7% 2% 6% b 21% 21% 77% 75% 1% 6% c 2% 6% 6% 8% 75% 68% d 0% 3% 7% 5% 6% 7% e 1% 0% 1% 1% 6% 4% f 0% 1% 2% 4% 7% 5% g 1% 1% 1% 1% 1% 4% h 0% 0% 0% 0% 0% 0% i 0% 0% 0% 0% 0% 0% j 0% 1% 0% 0% 1% 0%
Choice 4 Pre 4 Post 5 Pre 5 Post 6 Pre 6 Post a 5% 4% 6% 6% 5% 4% b 1% 3% 32% 32% 3% 4% c 2% 4% 3% 2% 32% 39% d 1% 3% 19% 23% 21% 12% e 6% 8% 4% 5% 20% 21% f 20% 18% 21% 25% 7% 8% g 63% 61% 11% 4% 5% 12% h 0% 1% 0% 0% 0% 0% i 0% 0% 0% 0% 0% 0% j 0% 0% 4% 1% 6% 0%
(Table Continued)

43
Choice 7 Pre 7 Post 8 Pre 8 Post 9 Pre 9 Post a 2% 5% 5% 6% 4% 6% b 2% 6% 4% 11% 8% 8% c 5% 3% 2% 3% 3% 6% d 12% 8% 6% 5% 52% 62% e 55% 48% 15% 11% 13% 8% f 13% 16% 40% 38% 8% 4% g 9% 13% 25% 25% 6% 1% h 0% 1% 0% 0% 0% 0% i 0% 0% 0% 0% 0% 0% j 1% 0% 2% 1% 5% 0%
Choice 10 Pre 10 Post 11 Pre 11 Post 12 Pre 12 Post a 18% 15% 4% 4% 4% 5% b 59% 49% 4% 8% 8% 4% c 10% 17% 5% 6% 2% 4% d 5% 6% 4% 3% 56% 64% e 1% 4% 22% 19% 15% 10% f 1% 2% 36% 35% 6% 4% g 4% 5% 23% 24% 6% 4% h 1% 1% 0% 0% 0% 0% i 0% 0% 0% 0% 0% 0% j 1% 1% 1% 1% 2% 1%
Choice 13 Pre 13 Post 14 Pre 14 Post 15 Pre 15 Post a 15% 16% 50% 46% 11% 10% b 61% 54% 5% 7% 13% 6% c 9% 13% 25% 28% 3% 5% d 4% 3% 4% 5% 4% 5% e 4% 3% 8% 6% 56% 64% f 4% 4% 1% 1% 4% 4% g 3% 6% 3% 2% 1% 2% h 1% 1% 1% 1% 0% 0% i 0% 0% 0% 0% 0% 0% j 0% 0% 1% 2% 9% 4%
(Table Continued)

44
Choice 16 Pre 16 Post 17 Pre 17 Post 18 Pre 18 Post a 9% 9% 7% 4% 5% 7% b 2% 4% 23% 23% 9% 5% c 65% 65% 5% 8% 1% 4% d 8% 5% 17% 17% 17% 23% e 4% 3% 6% 4% 1% 4% f 2% 4% 1% 4% 13% 6% g 4% 4% 11% 11% 15% 15% h 2% 4% 22% 20% 27% 27% i 0% 0% 0% 0% 1% 0% j 4% 1% 5% 8% 10% 9%
Choice 19 Pre 19 Post 20 Pre 20 Post 21 Pre 21 Post a 4% 4% 2% 5% 8% 9% b 6% 11% 4% 3% 14% 9% c 11% 14% 6% 1% 8% 10% d 16% 21% 4% 1% 10% 8% e 4% 1% 4% 7% 7% 4% f 6% 3% 65% 70% 8% 10% g 24% 17% 3% 1% 9% 21% h 15% 14% 8% 4% 13% 11% i 0% 0% 0% 0% 0% 0% j 13% 13% 5% 7% 20% 18%
Choice 22 Pre 22 Post 23 Pre 23 Post 24 Pre 24 Post a 9% 12% 3% 7% 10% 12% b 2% 3% 7% 6% 25% 30% c 4% 5% 6% 2% 12% 9% d 2% 2% 19% 13% 8% 5% e 71% 70% 3% 4% 2% 7% f 4% 4% 26% 30% 19% 11% g 4% 3% 31% 35% 16% 21% h 0% 0% 1% 0% 1% 0% i 0% 0% 0% 0% 0% 0% j 4% 1% 4% 4% 6% 4%
(Table Continued)

45
Choice 25 Pre 25 Post 26 Pre 26 Pre 27 Pre 27 Post a 6% 11% 45% 41% 8% 10% b 9% 7% 8% 8% 6% 12% c 2% 5% 13% 15% 8% 8% d 11% 11% 4% 6% 2% 5% e 18% 15% 13% 18% 20% 15% f 25% 27% 4% 1% 39% 27% g 20% 17% 4% 4% 14% 20% h 0% 0% 0% 0% 0% 0% i 0% 0% 0% 0% 0% 0% j 8% 7% 8% 7% 1% 2%
Choice 28 Pre 28 Post 29 Pre 29 Post 30 Pre 30 Post a 3% 4% 13% 20% 46% 54% b 6% 6% 47% 39% 7% 12% c 6% 9% 15% 18% 9% 10% d 62% 56% 7% 5% 11% 3% e 8% 11% 4% 7% 19% 13% f 9% 4% 7% 6% 4% 4% g 4% 4% 3% 4% 0% 0% h 0% 0% 1% 0% 0% 0% i 0% 0% 0% 0% 0% 0% j 1% 1% 3% 1% 3% 4%
Choice 31 Pre 31 Post 32 Pre 32 Post 33 Pre 33 Post a 13% 17% 8% 10% 10% 11% b 33% 32% 42% 36% 7% 6% c 12% 13% 8% 13% 12% 5% d 9% 12% 11% 6% 5% 6% e 13% 11% 8% 11% 51% 58% f 11% 8% 10% 11% 7% 4% g 1% 1% 1% 0% 0% 0% h 0% 1% 0% 0% 1% 0% i 0% 0% 0% 0% 0% 0% j 8% 5% 11% 13% 6% 8%
(Table Continued)
46
Choice 34 Pre 34 Post 35 Pre 35 Post 36 Pre 36 Post a 11% 7% 30% 33% 11% 9% b 43% 42% 41% 34% 14% 7% c 7% 10% 13% 15% 44% 42% d 8% 10% 6% 8% 14% 19% e 9% 8% 3% 5% 6% 8% f 8% 8% 1% 1% 1% 1% g 1% 4% 1% 0% 0% 0% h 0% 0% 0% 1% 2% 1% i 0% 0% 0% 0% 0% 0% j 11% 10% 4% 4% 8% 12%
Choice 37 Pre 37 Post 38 Pre 38 Post 39 Pre 39 Post a 20% 20% 13% 13% 8% 11% b 11% 17% 32% 32% 24% 13% c 22% 28% 10% 17% 13% 17% d 18% 14% 18% 9% 34% 34% e 15% 8% 10% 10% 14% 16% f 1% 1% 1% 2% 1% 1% g 0% 1% 0% 1% 1% 0% h 0% 0% 0% 0% 1% 1% i 0% 0% 0% 0% 0% 0% j 11% 9% 17% 15% 4% 4%
Choice 40 Pre 40 Post 41 Pre 41 Post 42 Pre 42 Post a 32% 39% 8% 1% 6% 10% b 6% 9% 11% 10% 30% 29% c 7% 8% 13% 11% 22% 22% d 29% 25% 5% 10% 12% 6% e 15% 9% 2% 8% 8% 6% f 2% 4% 19% 20% 4% 5% g 1% 1% 23% 20% 3% 3% h 4% 1% 13% 13% 10% 14% i 0% 0% 0% 0% 0% 1% j 3% 1% 6% 5% 4% 4%
(Table Continued)

47
Choice 43 Pre 43 Post 44 Pre 44 Post 45 Pre 45 Post a 13% 11% 44% 50% 35% 37% b 6% 8% 17% 13% 22% 18% c 9% 5% 17% 25% 27% 27% d 48% 44% 13% 6% 8% 8% e 8% 8% 0% 1% 0% 1% f 3% 2% 1% 1% 1% 0% g 1% 1% 1% 1% 1% 1% h 5% 10% 0% 0% 1% 0% i 0% 0% 0% 0% 0% 0% j 5% 8% 6% 4% 4% 7%
Choice 46 Pre 46 Post 47 Pre 47 Post a 30% 29% 20% 25% b 18% 18% 29% 25% c 25% 24% 23% 18% d 18% 18% 14% 14% e 1% 1% 2% 1% f 0% 0% 1% 1% g 0% 0% 0% 1% h 0% 1% 0% 0% i 0% 0% 0% 0% j 8% 8% 9% 14%

48
Appendix B Bell Ringer Questions Student Name:___________________________Hour:_______ Day 1 Week 1 Which of these is an example of a force?
a. a car pushing a truck up a hill b. a pitcher throwing a baseball c. a gun shooting a bullet d. all of the above
_________________________________________________________________________________________________ Student Name:___________________________Hour:_______ Day 2 Week 1 You toss a ball up into the air. As the ball is moving from your hand towards the highest point of the toss, which of these statements is true of the forces acting on the ball ?
a. the gravity > force of the ball is tossed up with b. the force of gravity = the force that the ball is tossed up with c. the force of gravity < the force the ball is tossed up with d. the only force acting is gravity
_________________________________________________________________________________________________ Student Name:___________________________Hour:_______ Day 3 Week 1 You toss a ball up into the air. Which of these statements is true of the ball as it is falling back down through the air?
a. the main force acting on the ball is down and decreasing b. the main force acting on the ball is down and constant c. the main force acting on the ball is down and increasing d. there is not enough information provided to answer this question

49

50
Student Name:___________________________Hour:_______ Day 4 Week 1 You are playing with a toy matchbox car. The floor is super smooth so there is very little friction. Which force would keep the car moving to the right at a steady (constant) rate? a. putting no force on the car b. the force toward the right is decreasing in magnitude c. the force toward the right is staying the same in magnitude d. the force towards the right is increasing in magnitude Student Name:___________________________Hour:_______ Day 5 Week 1 You are playing with a toy matchbox car. As you push it to the right friction is acting on the car. You maintain the same force as you push the car, but the car is slowing down due to a rougher surface. What can you say about the forces acting on the car as it moves to the right?
a. the force towards the left would increase and the force towards the right would increase
b. the force towards the left would increase and the force towards the right would decrease
c. the forces would be equal d. the force towards the left would decrease and the force towards the right would
decrease e. the force towards the left would decrease and the force towards the right would
increase

51
Student Name:___________________________Hour:_______ Day 1 Week 2 You are rolling a ball to a friend. Assuming that there is no friction, you roll the ball to the right and it is speeding up with a steady rate (Constant Acceleration). Which graph best represents this?

52
Student Name:___________________________Hour:_______ Day 2 Week 2 You are rolling a ball to a friend. Assuming that there is no friction, you roll the ball to the right and it is slowing down with a steady rate (Constant Acceleration). Which graph best represents this?

53
Student Name:___________________________Hour:_______ Day 3 Week 2 An 18-wheeler and a mini-cooper car are driving towards each other at 45 mph on a street. For reasons unknown to us they are heading straight for each other. Which choice describes the forces in the moment of the impact?
a. the force the truck exerts on the car is greater than the force the car exerts on the truck
b. the force the truck exerts on the car is less than the force the car exerts on the truck
c. neither exerts a force on the other the car is smashed because it is in the trucks way
d. the truck and car both exert the same force on each other Student Name:___________________________Hour:_______ Day 4 Week 2 An astronaut is working on the Hubble Space Telescope when she drops her screwdriver. Since she is in space what is most likely to happen to the screwdriver?
a. it will continue to move in a straight line b. it will go straight until the force of being dropped is used up c. it will fall straight down towards earth d. it will float in place until she picks it up
Student Name:___________________________Hour:_______ Day 5 Week 2 You toss a ball up into the air. As the ball is at highest point of the toss, which of these statements is true of the forces acting on the ball ?
a. the gravity > force of the ball is tossed up with b. the force of gravity = the force that the ball is tossed up with c. the force of gravity < the force the ball is tossed up with d. the air is holding it in place

54
Appendix C IRB Exemption Documentation

55
Vita John Underwood was born to Jack and Gail Underwood in November of 1980 in
Rome, Georgia. He attended elementary, middle, and high school in the Gordon County
School District in Calhoun, Georgia. Upon his graduation in 1999 John attended Boston
University in Boston, Massachusetts. John graduated in 2003 and joined Teach For
America’s South Louisiana Corps. After completing the New Teacher Project he became
a highly qualified Biology, AP Biology, Environmental Science, Earth Science, Life
Science, Physical Science, Forensic Science, Emergency First Responder, Medical
Terminology, and 9-12 Social Studies teacher in Louisiana. He is a licensed American
Heart Association Basic Cardiac Life Support for Health Care Providers Instructor and
Emergency First Responder Instructor. He is currently entering into his tenth year of
teaching and is a candidate for the Master of Natural Sciences Degree at Louisiana State
University in Baton Rouge, Louisiana.