do managers influence their own pay? evidence from stock
TRANSCRIPT

320 Int. J. Accounting and Finance, Vol. 3, No. 4, 2012
Copyright © 2012 Inderscience Enterprises Ltd.
Do managers influence their own pay? Evidence from stock incentive plans in an emerging market economy
Huihui Yang School of Accounting, Shanghai Institute of Foreign Trade, 1900 Wenxiang Road, Songjiang, Shanghai, 201620, China E-mail: [email protected]
Fei Pan School of Accounting, Shanghai University of Finance and Economics, 111 Wuchuan Road, Shanghai, 200433, China E-mail: [email protected]
Siqi Li* Department of Accounting, Leavey School of Business, Santa Clara University, 500 El Camino Real, Santa Clara, CA 95053, USA E-mail: [email protected] *Corresponding author
Thomas W. Lin Leventhal School of Accounting, Marshall School of Business, University of Southern California, Los Angeles, CA 90089, USA E-mail: [email protected]
Abstract: This study examines the extent of managers’ opportunistic behaviour in influencing their own executive stock incentive plans in an emerging market economy, namely, China. Using a sample of 53 stock incentive plans in Chinese publicly listed companies during 2006–2007, we find a significant decline in stock prices before the disclosure of stock incentive plans and a significant increase in stock prices shortly after the disclosure, consistent with self-interested managers undertaking self-dealing opportunities to affect the exercise price of incentive plans. We also find that abnormal stock return reversals are more pronounced for non-state-owned enterprises (SOEs) with less independent compensation committees, thus suggesting that strong
Do managers influence their own pay? 321
corporate governance plays an important role in curbing opportunistic behaviour related to stock incentive compensations. Taken together, our findings suggest that managers in Chinese publicly listed companies engage in opportunistic behaviour that maximises their personal compensations.
Keywords: stock option incentive plans; China; event studies; cumulative abnormal returns; CAR.
Reference to this paper should be made as follows: Yang, H., Pan, F., Li, S. and Lin, T.W. (2012) ‘Do managers influence their own pay? Evidence from stock incentive plans in an emerging market economy’, Int. J. Accounting and Finance, Vol. 3, No. 4, pp.320–342.
Biographical notes: Huihui Yang is an Associate Professor of Accounting at the School of Accounting, Shanghai Institute of Foreign Trade in China. She received her PhD in Corporate Management from Donghua University. Her research interests include equity compensation issues in China. She has published several papers in leading accounting journals in China.
Fei Pan is Professor of Accounting at the School of Accounting, Shanghai University of Finance and Economics, China. He received his PhD in Accounting from Shanghai University of Finance and Economics. His research interests include management control systems in China. He has published numerous papers in leading accounting journals in China.
Siqi Li is an Assistant Professor of Accounting at the Department of Accounting, Leavey School of Business, Santa Clara University, USA. She received her PhD in Accounting from the University of Southern California. Her research interests include the role of accounting information in global capital markets. She has published papers in The Accounting Review and Journal of Accounting and Economics.
Thomas W. Lin is a Professor of Accounting at the Marshall School of Business, University of Southern California, USA. He received his PhD in Accounting from Ohio State University, MS in Accounting and Information Systems from UCLA, and BA in Business Administration from National Taiwan University. His research interests include management control systems and accounting issues in China. He has published papers in The Accounting Review, Journal of Management Accounting Research, Journal of Information Systems, Auditing Journal, Behavioral Research in Accounting, International Journal of Accounting and Information Management, and International Journal of Business and Systems Research.
1 Introduction
In the past two decades, the use of stock incentive plans, especially stock options, has been on the rise among public companies in the USA. Stock-based compensation aligns the interests of executives in the value of the company with those of shareholders by rewarding executives for maximising the company’s long-term stock performance, and hence is often viewed as an effective device of mitigating agency problems between managers and shareholders (Murphy, 1999). Recent studies, however, challenge this view and argue that incentive compensation plans create their own set of agency problems

322 H. Yang et al.
(e.g., Bertrand and Mullainathan, 2000; Bebchuk and Fried, 2004). The unintended consequences of incentive compensation arise because managers can potentially exert influence over their own compensation contracts and extract private benefits. Extensive research to date has been focused in the USA on managers’ opportunistic behaviour in manipulating the compensation contracting process and increasing their own incentive compensations (e.g., Yermack, 1997; Aboody and Kasznik, 2000; Lie, 2005; Heron and Lie, 2007). Meanwhile, there is relatively little evidence on the existence and implications of equity-based compensation in developing markets.
Equity-based compensations were legally introduced into China in 2006, when the Measures for the Administration of Stock Incentive Plans of Listed Companies (hereafter CSRC Measures) took effect. Proponents argue that the incentive plans are useful tools to reward employees for improved commitment and long-term stock performance, and therefore are significant steps towards building the modern enterprise structure in China. Skeptics, however, note that incentive plans, especially stock option schemes could be a double-edged sword in an emerging market economy (Hu, 2006). Self-interested managers may opportunistically manipulate the incentive plans to maximise their personal compensation in an environment with weak corporate governance. As Core et al. (2003) point out, the dominance of share-based compensation in the USA is likely a function of the interplay of the unique economic, legal and cultural environments, and hence evidence in the USA is not necessarily generalisable to countries with different institutional characteristics. Thus, the purpose of this study is to explore managers’ opportunistic behaviour in influencing their own incentive compensations in an emerging market economy, namely, China.
Using a sample of 53 stock incentive plans in Chinese publicly listed companies during 2006–2007, we investigate the extent of managerial influence on their stock-based compensation by analysing the abnormal stock returns around the initial disclosure of the incentive plans. Since stock incentive plans in Chinese companies are generally awarded with a fixed exercise price equal to the higher of the closing stock price one trading day before the disclosure of the stock incentive plan and the average closing price during the 30 trading days before the disclosure of the incentive plan, managers may opportunistically time the disclosure date to maximise their compensation. Consistent with this conjecture, we find that stock prices fall significantly prior to the disclosure date and rise significantly afterwards. The market-adjusted return for the 60 days preceding the disclosure date is –20.6% and the return for the 60 days following the disclosure date is 12.7%. The magnitude of the negative abnormal returns prior to the disclosure date is significantly larger than the returns found in the US markets. While this may reflect a more volatile Chinese stock market and therefore a greater opportunity to be exploited by managers, it is also consistent with substantial managerial influence over their compensation in Chinese listed companies. In addition, we find that the abnormal stock return reversals are more pronounced for non-state-owned enterprises (non-SOEs) with less independent compensation committees than state-owned enterprises (SOEs), suggesting that board director independence plays an effective governance role in curbing opportunistic behaviour related to stock incentive compensations (e.g., Collins et al., 2010).
Our additional analysis indicates that the U-shaped stock return pattern does not exist for the eight restricted stock option plans whose exercise prices are unrelated to stock prices. We also find that the actual exercise price of our sample incentive plans lies at the left tail of the (‘as-if’) exercise prices that would have occurred for the potential

Do managers influence their own pay? 323
announcement days in the 20-day period starting 30 trading days before and ending ten trading days before the actual announcement date. These results provide corroborating evidence that managers strategically time the disclosure of their incentive plans in order to maximise their compensation.
Our study contributes to the literature in the following ways. First, it adds to the limited evidence on the consequences of equity-based compensation in China. Core et al. (2003) suggest that the dominance of equity-based compensation in the USA is likely a result of its economic and institutional arrangements. It is unclear whether the evidence in the USA can be generalised to other settings, particularly in emerging countries with inefficient capital markets and poor investor protection. The findings in this study are consistent with managers’ self-interested behaviour in response to the structure of their incentive plans, and hence improve our understanding of the implications of introducing stock incentive plans in an emerging market economy.
Second, the results in this study highlight the significance of strong corporate governance in curbing opportunistic behaviour related to stock incentive plans. This study also underlines the problems of corporate governance in China and how they impact the consequences of introducing equity-based compensation in a newly developed market economy.
The remainder of the paper proceeds as follows. Section 2 reviews prior literature and provides institutional background related to the equity-based compensation in China. Section 3 describes the sample and presents descriptive statistics. Section 4 outlines the research design and reports the empirical results. Section 5 summarises and concludes the study.
2 Prior literature and institutional background
2.1 Prior literature
The past two decades have witnessed a growing trend of granting stock options for executive compensation in publicly traded US corporations (Murphy, 1999). Providing a direct link between managerial awards and share price appreciation, stock options are often considered as a device of aligning the interests of managers with those of shareholders. However, an unintended incentive arises with stock option grants. Specifically, most executive stock options are granted with the exercise price set at the stock price on the grant date. Managers therefore benefit from temporary stock price declines before the option grant date and from stock price increases after the grant date.
Prior research has shown that top executives can exert power over corporate boards to influence their own compensation contracts (e.g., Crystal, 1991; Bertrand and Mullainathan, 2000; Bebchuk and Fried, 2004; Chen and Lin, 2008; Kanagaretnam et al., 2008). In the case of stock options, there are at least three ways through which executives may manipulate grant date stock prices and maximise their compensation. First, managers can opportunistically time the option award date so that the stock price is lower on that date. Yermack (1997) examines the timing of CEO stock option grants to Fortune 500 companies between 1992 and 1994, and finds positive abnormal stock returns for the 50-day period following the grant date (but no significant abnormal returns before the grant date). He also finds that CEOs are more likely to receive stock option awards before favourable earnings announcements. He concludes that CEOs influence

324 H. Yang et al.
the timing of compensation committee meetings to receive option grants when the stock price is relatively low.
Another way to affect grant date stock prices is by manipulating information flows to the market. Aboody and Kasznik (2000) investigate a sample of CEO options with fixed award schedules between 1992 and 1996, and find results consistent with CEOs making opportunistic voluntary disclosure decisions that maximise their stock option compensations. Specifically, they show that CEOs receiving options before the earnings announcement are more likely to issue bad news forecasts before and good news forecasts after the fixed option grant dates. Chauvin and Shenoy (2001) examine a sample of CEO stock option grants between 1981 and 1992, and find a significant abnormal decrease in stock prices during the ten-day period immediately preceding the option grant date. Their results suggest that executives manipulate their communications with the market by accelerating the release of bad news and delaying the release of good news around the time of fixed option grants.
The third method through which executives may influence the grant date stock price is by the ex post timing of the grant date (i.e., back-dating). In other words, executives retroactively set the grant date with low stock prices. Consistent with the back-dating hypothesis, both Lie (2005) and Narayanan and Seyhun (2005) document negative abnormal stock returns before and positive abnormal returns after the option grants for a sample of executive stock option awards between 1992 and 2002. Narayanan and Seyhun (2005) further show that the extent of return reversals around the grant date is positively related to the magnitude of the time intervals between the grant date and the report date, suggesting that executives pick a date from the past with a lower stock price to maximise the value of option grants. In addition, Cicero (2006) and Cai (2007) identify three option exercise mechanisms with different back-dating incentives and document different stock returns patterns around the reported exercise date.
In 2002, the US Securities Exchange Commission (SEC) changed the reporting regulations for stock option grants. Specifically, Section 403 of the Sarbanes-Oxley Act (SOX) accelerates the reporting deadline of executive option grants to be within two business days after the grants instead of 45 days after the fiscal yearend. Recent studies have exploited this recent change and conducted refined tests of the timing manipulation of option grants. For example, Collins et al. (2005) report that the accelerated reporting requirement of SOX 403 significantly reduces CEO’s influence over grant date stock prices in the post-SOX period. Heron and Lie (2007) show that the abnormal stock return pattern around executive option grants substantially dampens after the new regulation became effective, which is consistent with the findings that most of the abnormal return pattern is attributable to backdating option grant dates.
2.2 China’s institutional background
Despite its extensive use for executive compensations in the USA, equity-based incentive programmes were rare in China until the early 1990s. In December 1993, the Chinese government issued the first Company Law that fully delineated the rights and responsibilities of modern companies in China. As a result, share-based incentive plans emerged along with China’s experimentation in the modern enterprise structure. Corporatisation (gongsihua) of state-owned enterprises (SOEs), which means privatising the state-controlled enterprises, has quickly become the central theme for corporate governance reforms and economic development in China. Many SOEs had been

Do managers influence their own pay? 325
corporatised and even made their initial public offerings in China’s newly established stock exchanges in Shanghai and Shenzhen. Managers often owned (non-tradable) shares of their listed SOEs as part of their compensation. Restricted by the 1993 Company Law and the 1998 Securities Law, however, companies were not allowed to repurchase their stocks, nor were the employees allowed to legally trade their stocks in the open market. Thus, until 2005, equity-based compensation in Chinese companies only remained on paper.
In October 2005, the Chinese government passed a revision of the Company Law, which marked a significant step toward strengthening corporate governance and protecting minority shareholder rights. Under the new Company Law, companies were allowed to buy back shares when granting stocks to the employees. The new law also provided greater clarity on the procedures for share transfers, granting employees the right to transfer their shares in stock exchanges each year up to 25% of the total shares they hold. Thus, the 2005 version of the Company Law legalises de facto the circulation of stocks in equity-based incentive plans. In December 2005, the China Securities Regulatory Commission (CSRC) promulgated the Measures for the Administration of Stock Incentive Plans of Listed Companies (trial implementation) (CSRC Measures), effective as of January 1st, 2006. In September 2006, the State-Owned Assets Supervision and Administration Commission (SASAC) and the Ministry of Finance (MOF) promulgated Measures for Implementing Stock Incentive Plans of Domestic State-Holding Listed Companies (trial implementation) (SASAC Domestic Measures). These regulations effectively lifted the ban that kept publicly listed companies from issuing stock incentive plans to their management and employees.
Currently, there are three types of stock incentive plans permitted in Chinese publicly listed companies, namely, stock option plans, restricted stock plans and phantom stock option plans. Under a stock option plan, the listed company grants qualified employees the right to purchase a certain number of shares in a certain period in the future at the price and conditions as provided in the stock option plan as duly approved. A restricted stock plan is a certain number of restricted stocks granted to the qualified employees. These restricted stocks are locked for a certain period before they can be sold as provided in the restricted stock plan as duly approved, and in the case of a state-holding listed company, the period is for at least two years. Under a phantom stock option plan, the listed company grants qualified employees the value-added right of the fictitious stock in a certain period, and the option grantee will not hold the stock or its voting rights after exercising the option, but will enjoy the added value of the fictitious stock.
Although the introduction of stock incentive plans is designed to better align the interests of managers with those of shareholders, the effectiveness of such plans remains questionable given China’s immature capital markets and weak corporate governance. In an economy characterised by a concentration of state ownership and strong government interference, minority shareholders do not have the right to disagree with majority shareholders (Liu and Gao, 2000; Lin, 2004); board directors are often chosen by the government to be symbolic figures (Tenev and Zhang, 2002; Lin, 2004); and insider trading is rampant among listed companies due to inefficient enforcement and the lack of mechanisms to encourage whistle-blowing (Lin, 2004; Tomasic and Andrews, 2006). Additionally, China’s economic system has weak independent board of directors, a feeble auditing profession, and a meager external governance structure (Lin, 2004). All of these challenges combined with the decentralised pyramidal ownership arrangement in the majority of state controlled listed companies exacerbate information asymmetry problems
326 H. Yang et al.
(Fan and Wong, 2002). Managers in such a weak corporate governance environment could easily manipulate their own compensation contracting process to appropriate value from shareholders.
According to the CSRC Measures, the exercise price for stock options is set to be the higher of the closing stock price one trading day before the disclosure of the stock incentive plan and the average closing price during the 30 trading days before the disclosure of the stock incentive plan. Thus, managers may influence the timing of the disclosure of the stock incentive plan to ensure that the plan is granted on a date with relatively low stock prices, or prior to a forthcoming release of good news.
While prior literature finds evidence that top executives in the USA opportunistically manipulate the stock incentive plans to influence their pay, little empirical evidence to date supports this argument for publicly listed companies in China. Further, since the stock incentive plans were officially introduced to China only recently, our understanding on the effectiveness of such plans is limited. Chen et al. (2008) offers a descriptive analysis of equity-based compensation in Mainland-China-controlled companied listed on the Hong Kong Stock Exchange (Red Chip companies) from 1999–2005. They find that stock options are the dominant form of share-based compensation in Red Chip companies and the specific features of stock option plans differ significantly from the US companies. However, it remains largely unclear whether executives in Chinese publicly listed companies manipulate certain elements of the incentive plans to maximise their compensation.
3 Sample and descriptive statistics
We collect information on stock incentive plans from the CCFR financial database and cninfo.com. Our initial sample consists of 61 incentive plans released by 59 publicly traded companies between January 2006 and December 2007. We eliminate eight plans because their exercise prices are not based on any form of stock prices. The remaining 53 plans associated with 51 companies are the final sample, among which 47 are stock option plans, five are restricted stock plans, and one is a phantom stock option plan.1
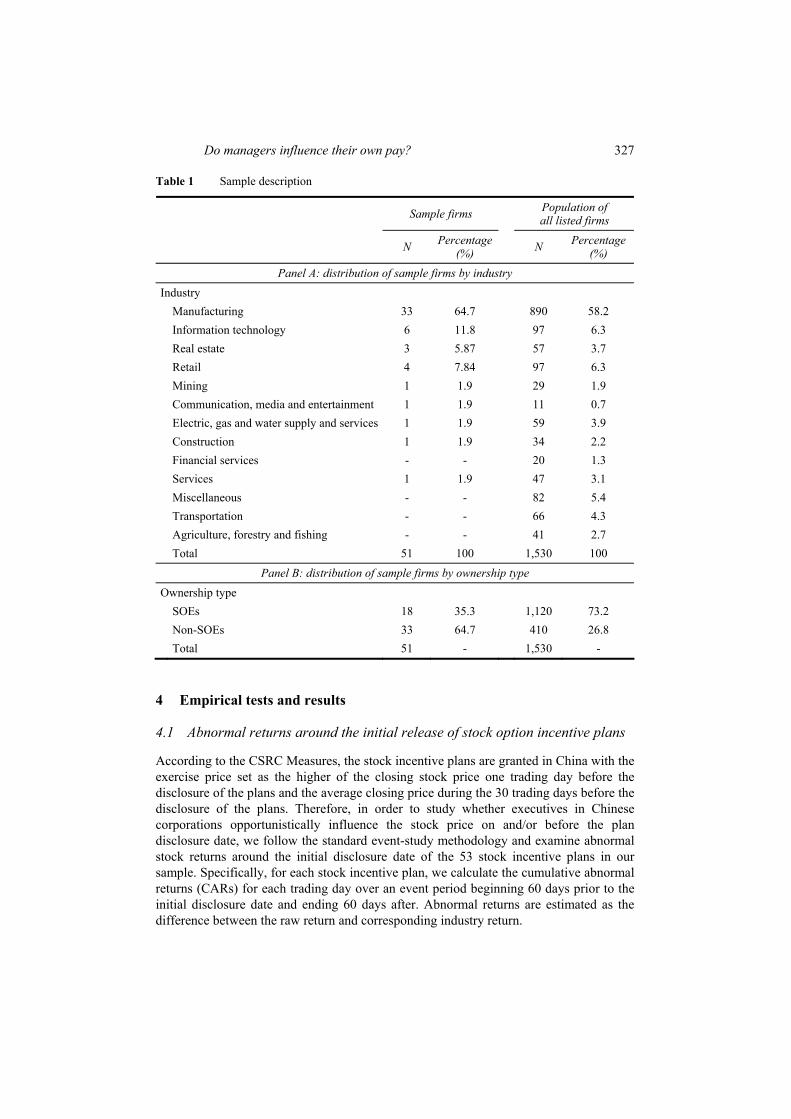
Table 1 Panel A provides the industry distribution of sample firms. The industry most heavily represented is manufacturing (64.7%), followed by information technology (11.8%). Further analysis (not tabulated) indicates that manufacturing firms in the sample are mostly those related to the so-called ‘new economy’ such as manufacturing of chemicals, electronics, and pharmaceuticals, rather than traditional manufacturing industries such as food or textile products. Compared with the population of all publicly traded companies in China during the sample period of 2006–2007, the industry composition of our sample indicates that new economy firms are more likely than old economy firms to offer share incentive plans to their executives, consistent with the evidence in the USA (e.g., Murphy, 2003).
Table 1 Panel B presents the distribution of sample firms across different ownership types. Specifically, the proportion of SOEs versus non-SOEs in our sample is 35.3% versus 64.7%, much smaller than the proportion in the population of all publicly traded companies in China (73.2% versus 26.8%). This is consistent with non-SOEs being more market-orientated and more likely to adopt incentive plans to retain key employees and stimulate performance.
Do managers influence their own pay? 327
Table 1 Sample description
Sample firms Population of all listed firms
N Percentage (%)
N Percentage
(%) Panel A: distribution of sample firms by industry
Industry Manufacturing 33 64.7 890 58.2 Information technology 6 11.8 97 6.3 Real estate 3 5.87 57 3.7 Retail 4 7.84 97 6.3 Mining 1 1.9 29 1.9 Communication, media and entertainment 1 1.9 11 0.7 Electric, gas and water supply and services 1 1.9 59 3.9 Construction 1 1.9 34 2.2 Financial services - - 20 1.3 Services 1 1.9 47 3.1 Miscellaneous - - 82 5.4 Transportation - - 66 4.3 Agriculture, forestry and fishing - - 41 2.7 Total 51 100 1,530 100
Panel B: distribution of sample firms by ownership type
Ownership type SOEs 18 35.3 1,120 73.2 Non-SOEs 33 64.7 410 26.8 Total 51 - 1,530 -
4 Empirical tests and results
4.1 Abnormal returns around the initial release of stock option incentive plans
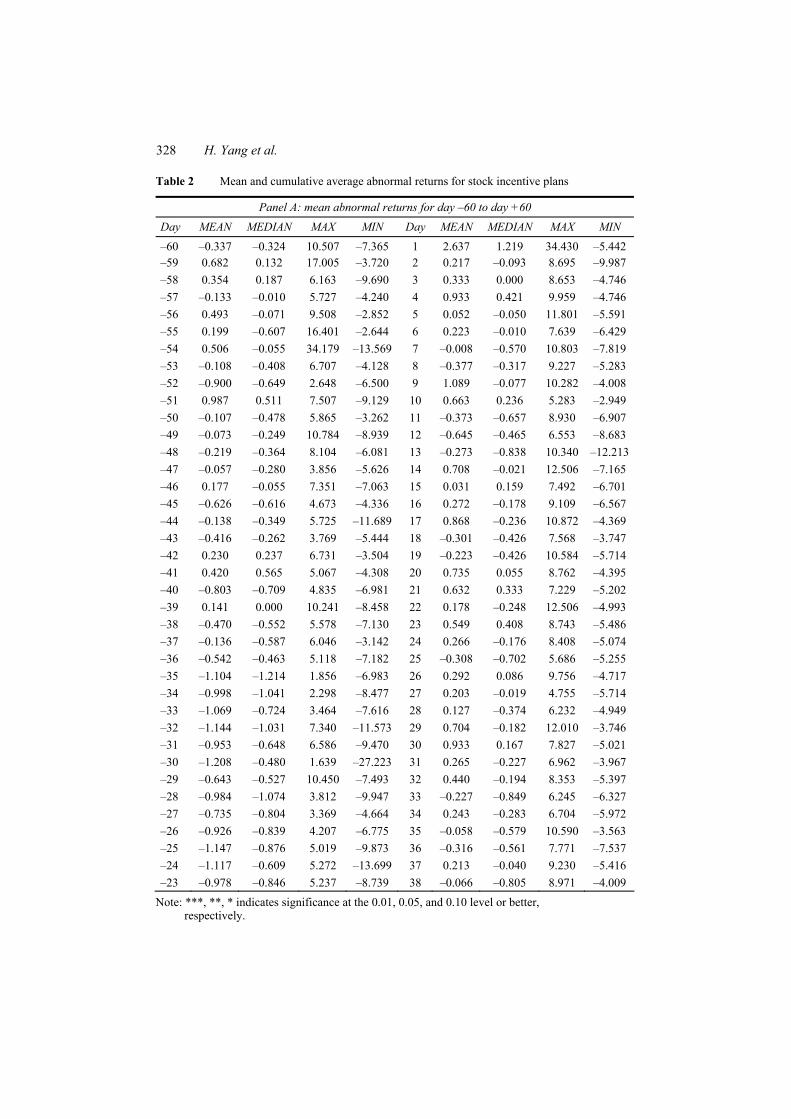
According to the CSRC Measures, the stock incentive plans are granted in China with the exercise price set as the higher of the closing stock price one trading day before the disclosure of the plans and the average closing price during the 30 trading days before the disclosure of the plans. Therefore, in order to study whether executives in Chinese corporations opportunistically influence the stock price on and/or before the plan disclosure date, we follow the standard event-study methodology and examine abnormal stock returns around the initial disclosure date of the 53 stock incentive plans in our sample. Specifically, for each stock incentive plan, we calculate the cumulative abnormal returns (CARs) for each trading day over an event period beginning 60 days prior to the initial disclosure date and ending 60 days after. Abnormal returns are estimated as the difference between the raw return and corresponding industry return.
328 H. Yang et al.
Table 2 Mean and cumulative average abnormal returns for stock incentive plans
Panel A: mean abnormal returns for day –60 to day +60
Day MEAN MEDIAN MAX MIN Day MEAN MEDIAN MAX MIN
–60 –0.337 –0.324 10.507 –7.365 1 2.637 1.219 34.430 –5.442 –59 0.682 0.132 17.005 –3.720 2 0.217 –0.093 8.695 –9.987 –58 0.354 0.187 6.163 –9.690 3 0.333 0.000 8.653 –4.746 –57 –0.133 –0.010 5.727 –4.240 4 0.933 0.421 9.959 –4.746 –56 0.493 –0.071 9.508 –2.852 5 0.052 –0.050 11.801 –5.591 –55 0.199 –0.607 16.401 –2.644 6 0.223 –0.010 7.639 –6.429 –54 0.506 –0.055 34.179 –13.569 7 –0.008 –0.570 10.803 –7.819 –53 –0.108 –0.408 6.707 –4.128 8 –0.377 –0.317 9.227 –5.283 –52 –0.900 –0.649 2.648 –6.500 9 1.089 –0.077 10.282 –4.008 –51 0.987 0.511 7.507 –9.129 10 0.663 0.236 5.283 –2.949 –50 –0.107 –0.478 5.865 –3.262 11 –0.373 –0.657 8.930 –6.907 –49 –0.073 –0.249 10.784 –8.939 12 –0.645 –0.465 6.553 –8.683 –48 –0.219 –0.364 8.104 –6.081 13 –0.273 –0.838 10.340 –12.213 –47 –0.057 –0.280 3.856 –5.626 14 0.708 –0.021 12.506 –7.165 –46 0.177 –0.055 7.351 –7.063 15 0.031 0.159 7.492 –6.701 –45 –0.626 –0.616 4.673 –4.336 16 0.272 –0.178 9.109 –6.567 –44 –0.138 –0.349 5.725 –11.689 17 0.868 –0.236 10.872 –4.369 –43 –0.416 –0.262 3.769 –5.444 18 –0.301 –0.426 7.568 –3.747 –42 0.230 0.237 6.731 –3.504 19 –0.223 –0.426 10.584 –5.714 –41 0.420 0.565 5.067 –4.308 20 0.735 0.055 8.762 –4.395 –40 –0.803 –0.709 4.835 –6.981 21 0.632 0.333 7.229 –5.202 –39 0.141 0.000 10.241 –8.458 22 0.178 –0.248 12.506 –4.993 –38 –0.470 –0.552 5.578 –7.130 23 0.549 0.408 8.743 –5.486 –37 –0.136 –0.587 6.046 –3.142 24 0.266 –0.176 8.408 –5.074 –36 –0.542 –0.463 5.118 –7.182 25 –0.308 –0.702 5.686 –5.255 –35 –1.104 –1.214 1.856 –6.983 26 0.292 0.086 9.756 –4.717 –34 –0.998 –1.041 2.298 –8.477 27 0.203 –0.019 4.755 –5.714 –33 –1.069 –0.724 3.464 –7.616 28 0.127 –0.374 6.232 –4.949 –32 –1.144 –1.031 7.340 –11.573 29 0.704 –0.182 12.010 –3.746 –31 –0.953 –0.648 6.586 –9.470 30 0.933 0.167 7.827 –5.021 –30 –1.208 –0.480 1.639 –27.223 31 0.265 –0.227 6.962 –3.967 –29 –0.643 –0.527 10.450 –7.493 32 0.440 –0.194 8.353 –5.397 –28 –0.984 –1.074 3.812 –9.947 33 –0.227 –0.849 6.245 –6.327 –27 –0.735 –0.804 3.369 –4.664 34 0.243 –0.283 6.704 –5.972 –26 –0.926 –0.839 4.207 –6.775 35 –0.058 –0.579 10.590 –3.563 –25 –1.147 –0.876 5.019 –9.873 36 –0.316 –0.561 7.771 –7.537 –24 –1.117 –0.609 5.272 –13.699 37 0.213 –0.040 9.230 –5.416 –23 –0.978 –0.846 5.237 –8.739 38 –0.066 –0.805 8.971 –4.009
Note: ***, **, * indicates significance at the 0.01, 0.05, and 0.10 level or better, respectively.

Do managers influence their own pay? 329
Table 2 Mean and cumulative average abnormal returns for stock incentive plans (continued)
Panel A: mean abnormal returns for day –60 to day +60
Day MEAN MEDIAN MAX MIN Day MEAN MEDIAN MAX MIN
–22 –0.834 –0.511 1.853 –8.361 39 0.288 –0.338 9.183 –4.728 –21 –0.678 –0.474 5.442 –13.129 40 –0.034 –0.036 6.732 –8.818 –20 –0.714 –0.377 3.379 –6.962 41 0.019 –0.350 8.159 –5.996 –19 –0.878 –0.699 3.919 –5.244 42 –0.138 –0.381 14.844 –6.773 –18 –0.963 –0.554 9.060 –19.540 43 –0.506 –0.602 4.197 –6.899 –17 –0.627 –0.735 3.861 –6.440 44 –0.414 –0.546 5.810 –3.501 –16 –1.082 –0.663 2.376 –7.559 45 –0.022 –0.276 5.169 –8.173 –15 –0.497 –0.203 9.022 –5.443 46 –0.369 –0.593 10.034 –6.067 –14 –0.672 –0.308 4.457 –6.156 47 0.061 –0.531 9.286 –5.111 –13 –1.003 –1.018 7.187 –6.441 48 0.015 –0.480 10.550 –5.496 –12 –0.617 –0.820 6.493 –5.289 49 0.262 –0.248 9.413 –5.120 –11 –0.748 –0.360 12.291 –11.207 50 0.287 0.233 8.231 –3.714 –10 –0.468 –0.374 20.600 –8.022 51 –0.533 –0.472 5.951 –5.675 –9 0.011 –0.412 9.875 –7.144 52 0.143 –0.226 8.034 –8.295 –8 0.858 0.004 9.562 –4.710 53 0.127 –0.159 5.169 –5.844 –7 0.034 –0.118 9.767 –6.173 54 0.209 –0.259 7.867 –5.946 –6 0.039 –0.506 8.682 –6.173 55 0.200 0.220 6.035 –5.111 –5 0.415 0.123 6.838 –4.264 56 0.279 0.075 10.664 –5.240 –4 –0.812 –0.605 2.793 –8.214 57 0.075 –0.168 7.084 –5.910 –3 –0.246 –0.144 6.854 –10.301 58 0.576 0.023 9.972 –4.382 –2 0.561 –0.170 9.866 –5.826 59 0.517 –0.150 9.836 –3.854 –1 0.573 –0.077 8.734 –12.847 60 –0.633 –0.680 5.054 –7.713 0 1.654 0.731 10.539 –7.701
Panel B: cumulative average abnormal returns
Days Cumulative abnormal returns T-statistic Significance
(–60, 0) –0.206 –5.628 0.0000*** (–30, 0) –0.144 –4.608 0.0000*** (–20, 0) –0.052 –2.276 0.0270** (–10, 0) 0.026 1.986 0.0524* (–5, 0) 0.021 2.144 0.0367** (–1, 0) 0.022 3.131 0.0029*** (0, 1) 0.043 3.84 0.0003*** (0, 5) 0.058 4.265 0.0001*** (0, 10) 0.074 4.369 0.0001*** (0, 20) 0.082 3.531 0.0009*** (0, 30) 0.118 4.597 0.0000*** (0, 60) 0.127 4.9613 0.0000***
Note: ***, **, * indicates significance at the 0.01, 0.05, and 0.10 level or better, respectively.

330 H. Yang et al.
Table 2 Panel A reports abnormal returns for the sample incentive plans. During the period of day –38 and day –10, mean abnormal returns are negative each day. Mean abnormal returns during the five days after the disclosure date are positive each day. Median abnormal returns follow a similar pattern but are positive only in two out of five days immediately after the release date. During the period of day –9 and day –1, however, there are no consistent patterns of abnormal returns.
Table 2 Panel B shows that the mean CAR for 60 days prior to the release date is –20.6%, significant at p < 1%. The mean CAR for the 60-day period following the release date is 12.7%, significant at p < 1%.
Figure 1 displays the mean CARs between –60 and 60 days around the initial plan release date for the 53 incentive plans in our sample. It shows that the mean CAR is negative and decreasing beginning 32 trading days prior to the plan disclosure date, and positive and increasing until 23 trading days after the disclosure date. The mean CAR is significantly different from zero during the period of day –32 to day 23. While this return reversal pattern is similar to that in prior studies such as Narayanan and Seyhun (2005), Lie (2005) and Heron and Lie (2007), significant differences exist in at least three aspects.
Figure 1 Mean abnormal stock returns around the initial release date of the stock incentive plans
First, the magnitude of negative abnormal stock returns during the period prior to the plan disclosure date is substantially larger than the evidence on US stock option grants. For example, the mean CAR between day –10 and 0 is –0.57% in Chauvin and Shenoy (2001), and the mean CAR between day –90 and 0 is –3.26% in Narayanan and Seyhun (2005). By contrast, as Table 2 shows, the mean CAR in our sample is 20.6% for the holding period of (–60, 0). The difference in the return magnitude suggests that the benefits of manipulating the plan release date are much more significant in an emerging market economy with poor shareholder protection and weak corporate governance.
Second, the abnormal stock return reversal occurs around day –10, rather than day 0 documented in prior literature (Narayanan and Seyhun, 2005). As Figure 1 shows, the

Do managers influence their own pay? 331
mean CAR prior to the event date reaches to the lowest level of –23.7% on day –10, and the mean abnormal returns start to increase afterwards. One possible explanation is that the market may have anticipated the release of stock incentive plans as early as a company discloses in advance the details (such as date, place and topics) of a board meeting required by the corporate law.
Third, the magnitude of the abnormal return reversal starting on day –10 is not large enough to reach the level of 60 days prior to the event date. As Figure 1 indicates, the mean CAR between day 0 and day 60 is 12.7%, significantly lower than the mean CAR between day –60 and day 0 (–20.6%). According to the CSRC Measures, executives receiving these incentive plans may exercise them no earlier than one year after the grant date. So managers who opportunistically manipulate the plan disclosure dates are not necessarily concerned about the inadequate return reversal on day 60 as they are not yet allowed to exercise these plans.
4.2 Impact of compensation committee independence on the abnormal return results
Prior research has shown that a higher proportion of independent directors is associated with strong corporate governance (e.g., Weisbach, 1988; Rosenstein and Wyatt, 1990; Brickley et al., 1994; Dechow et al., 1996; Core et al., 1999). Having a majority of independent directors in the compensation committee, in particular, is expected to reduce the likelihood that managers influence the contracting process for their own pay. To examine the impact of compensation committee independence on the opportunistic timing of stock incentive plans, we perform an additional analysis on how the abnormal return results in Section 4.1 vary across firms with strong or weak board independence.
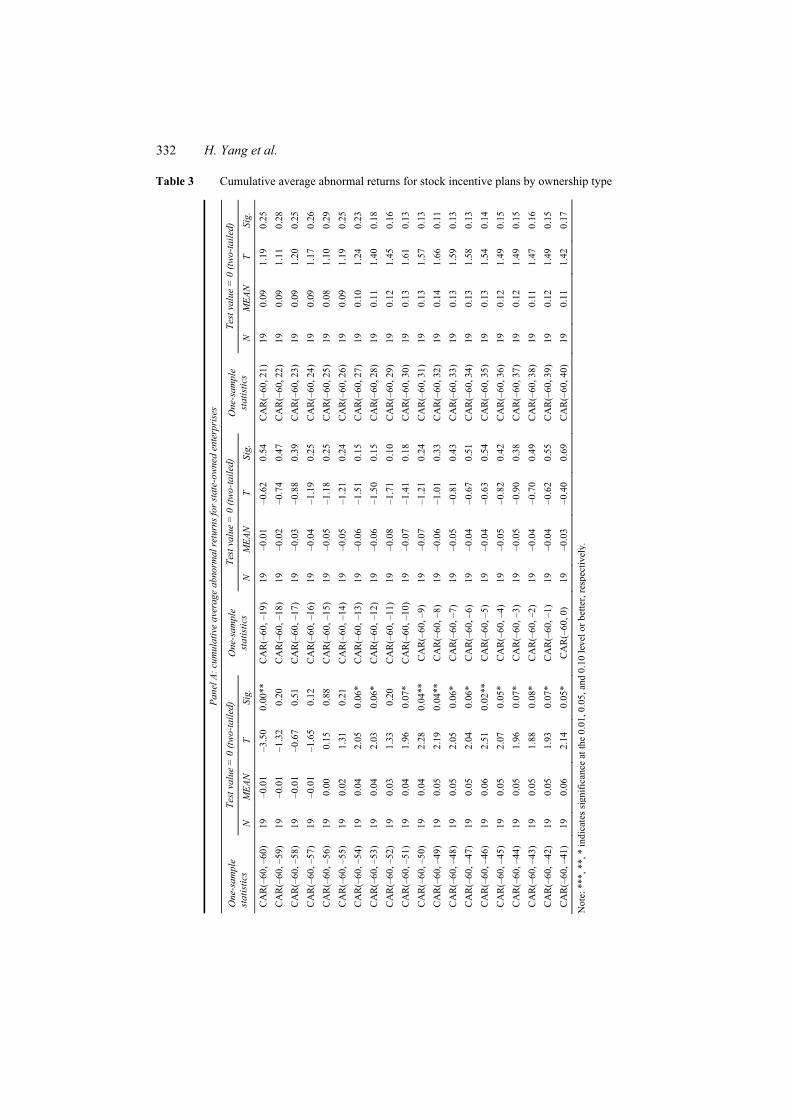
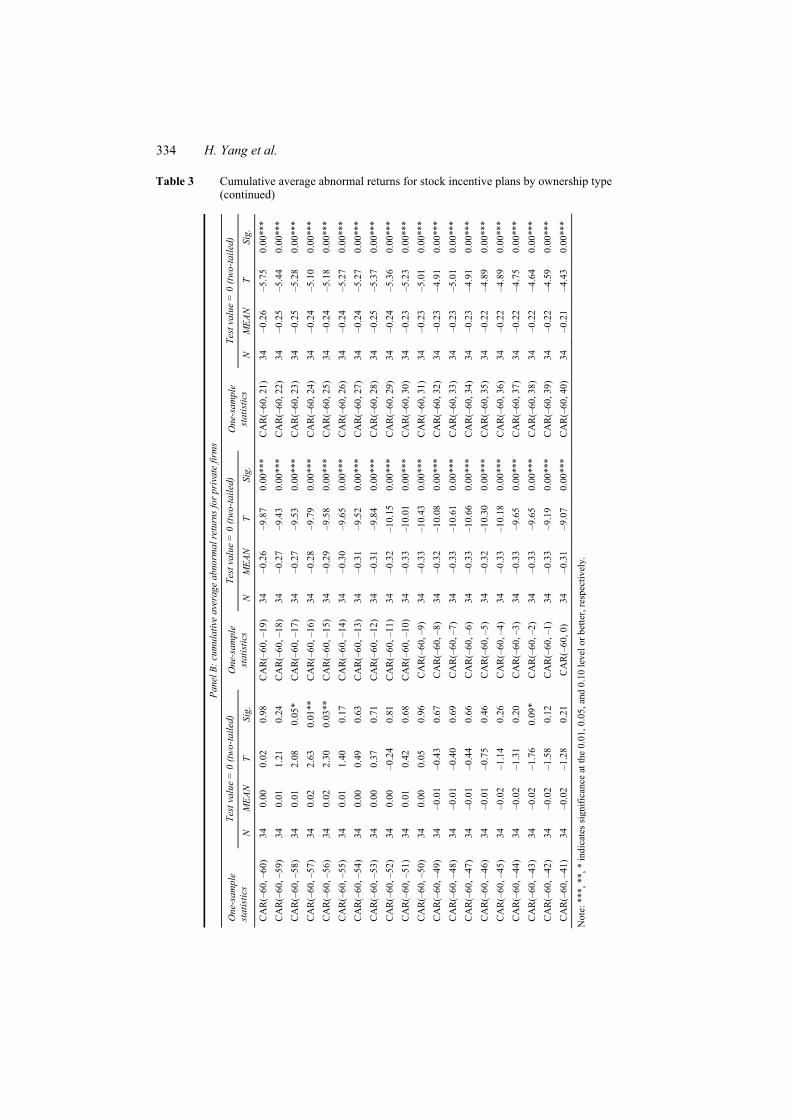
Publicly traded companies in China are not required to disclose information regarding their compensation committees. According to the SASAC Domestic Measures, however, the compensation committees in SOEs that adopt stock incentive schemes have to consist of all independent directors, whereas non-SOEs are only required to have a majority of independent directors in their compensation committees. Thus, we partition our sample into 19 SOEs and 34 non-SOEs, and compare the abnormal returns across these two groups.
Table 3 presents the mean CARs from day –60 to day 60 for SOEs (Panel A) and non-SOEs (Panel B). During the 60-day period prior to the event date, the CAR for SOEs is –3%, not significantly different from zero. The CAR for non-SOEs during the same period (–60, 0), by contrast, is –31% and significant at p < 1%.
Figure 2 displays the mean CARs in the 121-day event window for SOEs versus non-SOEs. The graph shows that both groups experience negative abnormal returns prior to the event date and the upward trend following the event date. The abnormal return reversal, however, is much smoother for SOEs than for non-SOEs. Particularly, the mean CAR for SOEs is insignificantly different from zero during the period between day –30 and day 60, whereas the mean CAR for non-SOEs is significantly different from zero during the same period. Thus, the contrast in their abnormal return patterns between these two groups provides evidence consistent with director independence being an effective instrument of improving board oversight over executive compensation and mitigating executive influence on stock incentive plans.
332 H. Yang et al.
Table 3 Cumulative average abnormal returns for stock incentive plans by ownership type
Pane
l A: c
umul
ativ
e av
erag
e ab
norm
al re
turn
s for
stat
e-ow
ned
ente
rpri
ses
Test
val
ue =
0 (t
wo-
taile
d)
Test
val
ue =
0 (t
wo-
taile
d)
Test
val
ue =
0 (t
wo-
taile
d)
One
-sam
ple
stat
istic
s N
M
EAN
T
Sig.
O
ne-s
ampl
e st
atis
tics
N
MEA
N
T Si
g.
One
-sam
ple
stat
istic
s N
M
EAN
T
Sig.
CA
R(–
60, –
60)
19
–0.0
1 –3
.50
0.00
**
CA
R(–
60, –
19)
19
–0.0
1 –0
.62
0.54
C
AR
(–60
, 21)
19
0.
09
1.19
0.
25
CA
R(–
60, –
59)
19
–0.0
1 –1
.32
0.20
C
AR
(–60
, –18
) 19
–0
.02
–0.7
4 0.
47
CA
R(–
60, 2
2)
19
0.09
1.
11
0.28
C
AR
(–60
, –58
) 19
–0
.01
–0.6
7 0.
51
CA
R(–
60, –
17)
19
–0.0
3 –0
.88
0.39
C
AR
(–60
, 23)
19
0.
09
1.20
0.
25
CA
R(–
60, –
57)
19
–0.0
1 –1
.65
0.12
C
AR
(–60
, –16
) 19
–0
.04
–1.1
9 0.
25
CA
R(–
60, 2
4)
19
0.09
1.
17
0.26
C
AR
(–60
, –56
) 19
0.
00
0.15
0.
88
CA
R(–
60, –
15)
19
–0.0
5 –1
.18
0.25
C
AR
(–60
, 25)
19
0.
08
1.10
0.
29
CA
R(–
60, –
55)
19
0.02
1.
31
0.21
C
AR
(–60
, –14
) 19
–0
.05
–1.2
1 0.
24
CA
R(–
60, 2
6)
19
0.09
1.
19
0.25
C
AR
(–60
, –54
) 19
0.
04
2.05
0.
06*
CA
R(–
60, –
13)
19
–0.0
6 –1
.51
0.15
C
AR
(–60
, 27)
19
0.
10
1.24
0.
23
CA
R(–
60, –
53)
19
0.04
2.
03
0.06
* C
AR
(–60
, –12
) 19
–0
.06
–1.5
0 0.
15
CA
R(–
60, 2
8)
19
0.11
1.
40
0.18
C
AR
(–60
, –52
) 19
0.
03
1.33
0.
20
CA
R(–
60, –
11)
19
–0.0
8 –1
.71
0.10
C
AR
(–60
, 29)
19
0.
12
1.45
0.
16
CA
R(–
60, –
51)
19
0.04
1.
96
0.07
* C
AR
(–60
, –10
) 19
–0
.07
–1.4
1 0.
18
CA
R(–
60, 3
0)
19
0.13
1.
61
0.13
C
AR
(–60
, –50
) 19
0.
04
2.28
0.
04**
C
AR
(–60
, –9)
19
–0
.07
–1.2
1 0.
24
CA
R(–
60, 3
1)
19
0.13
1.
57
0.13
C
AR
(–60
, –49
) 19
0.
05
2.19
0.
04**
C
AR
(–60
, –8)
19
–0
.06
–1.0
1 0.
33
CA
R(–
60, 3
2)
19
0.14
1.
66
0.11
C
AR
(–60
, –48
) 19
0.
05
2.05
0.
06*
CA
R(–
60, –
7)
19
–0.0
5 –0
.81
0.43
C
AR
(–60
, 33)
19
0.
13
1.59
0.
13
CA
R(–
60, –
47)
19
0.05
2.
04
0.06
* C
AR
(–60
, –6)
19
–0
.04
–0.6
7 0.
51
CA
R(–
60, 3
4)
19
0.13
1.
58
0.13
C
AR
(–60
, –46
) 19
0.
06
2.51
0.
02**
C
AR
(–60
, –5)
19
–0
.04
–0.6
3 0.
54
CA
R(–
60, 3
5)
19
0.13
1.
54
0.14
C
AR
(–60
, –45
) 19
0.
05
2.07
0.
05*
CA
R(–
60, –
4)
19
–0.0
5 –0
.82
0.42
C
AR
(–60
, 36)
19
0.
12
1.49
0.
15
CA
R(–
60, –
44)
19
0.05
1.
96
0.07
* C
AR
(–60
, –3)
19
–0
.05
–0.9
0 0.
38
CA
R(–
60, 3
7)
19
0.12
1.
49
0.15
C
AR
(–60
, –43
) 19
0.
05
1.88
0.
08*
CA
R(–
60, –
2)
19
–0.0
4 –0
.70
0.49
C
AR
(–60
, 38)
19
0.
11
1.47
0.
16
CA
R(–
60, –
42)
19
0.05
1.
93
0.07
* C
AR
(–60
, –1)
19
–0
.04
–0.6
2 0.
55
CA
R(–
60, 3
9)
19
0.12
1.
49
0.15
C
AR
(–60
, –41
) 19
0.
06
2.14
0.
05*
CA
R(–
60, 0
) 19
–0
.03
–0.4
0 0.
69
CA
R(–
60, 4
0)
19
0.11
1.
42
0.17
Not
e: *
**, *
*, *
indi
cate
s sig
nific
ance
at t
he 0
.01,
0.0
5, a
nd 0
.10
leve
l or b
ette
r, re
spec
tivel
y.

Do managers influence their own pay? 333
Table 3 Cumulative average abnormal returns for stock incentive plans by ownership type (continued)
Pane
l A: c
umul
ativ
e av
erag
e ab
norm
al re
turn
s for
stat
e-ow
ned
ente
rpri
ses
Test
val
ue =
0 (t
wo-
taile
d)
Test
val
ue =
0 (t
wo-
taile
d)
Test
val
ue =
0 (t
wo-
taile
d)
One
-sam
ple
stat
istic
s N
M
EAN
T
Sig.
O
ne-s
ampl
e st
atis
tics
N
MEA
N
T Si
g.
One
-sam
ple
stat
istic
s N
M
EAN
T
Sig.
CA
R(–
60, –
40)
19
0.06
2.
30
0.03
**
CA
R(–
60, 1
) 19
0.
01
0.12
0.
90
CA
R(–
60, 4
1)
19
0.11
1.
42
0.17
C
AR
(–60
, –39
) 19
0.
07
2.47
0.
02**
C
AR
(–60
, 2)
19
0.02
0.
23
0.82
C
AR
(–60
, 42)
19
0.
10
1.31
0.
21
CA
R(–
60, –
38)
19
0.07
2.
23
0.04
**
CA
R(–
60, 3
) 19
0.
02
0.26
0.
79
CA
R(–
60, 4
3)
19
0.09
1.
22
0.24
C
AR
(–60
, –37
) 19
0.
07
2.17
0.
04**
C
AR
(–60
, 4)
19
0.03
0.
41
0.69
C
AR
(–60
, 44)
19
0.
08
1.17
0.
26
CA
R(–
60, –
36)
19
0.07
2.
34
0.03
**
CA
R(–
60, 5
) 19
0.
05
0.63
0.
54
CA
R(–
60, 4
5)
19
0.09
1.
28
0.22
C
AR
(–60
, –35
) 19
0.
07
2.30
0.
03**
C
AR
(–60
, 6)
19
0.04
0.
63
0.54
C
AR
(–60
, 46)
19
0.
09
1.20
0.
24
CA
R(–
60, –
34)
19
0.06
2.
23
0.04
**
CA
R(–
60, 7
) 19
0.
04
0.59
0.
56
CA
R(–
60, 4
7)
19
0.09
1.
20
0.25
C
AR
(–60
, –33
) 19
0.
05
2.13
0.
05*
CA
R(–
60, 8
) 19
0.
04
0.58
0.
57
CA
R(–
60, 4
8)
19
0.09
1.
22
0.24
C
AR
(–60
, –32
) 19
0.
05
1.88
0.
08*
CA
R(–
60, 9
) 19
0.
06
0.78
0.
45
CA
R(–
60, 4
9)
19
0.09
1.
18
0.25
C
AR
(–60
, –31
) 19
0.
04
1.79
0.
09*
CA
R(–
60, 1
0)
19
0.08
0.
99
0.33
C
AR
(–60
, 50)
19
0.
09
1.29
0.
21
CA
R(–
60, –
30)
19
0.03
1.
32
0.20
C
AR
(–60
, 11)
19
0.
06
0.83
0.
42
CA
R(–
60, 5
1)
19
0.09
1.
25
0.23
C
AR
(–60
, –29
) 19
0.
02
0.79
0.
44
CA
R(–
60, 1
2)
19
0.05
0.
74
0.47
C
AR
(–60
, 52)
19
0.
09
1.32
0.
20
CA
R(–
60, –
28)
19
0.01
0.
60
0.56
C
AR
(–60
, 13)
19
0.
06
0.79
0.
44
CA
R(–
60, 5
3)
19
0.10
1.
38
0.18
C
AR
(–60
, –27
) 19
0.
02
0.75
0.
46
CA
R(–
60, 1
4)
19
0.07
0.
89
0.38
C
AR
(–60
, 54)
19
0.
11
1.56
0.
14
CA
R(–
60, –
26)
19
0.02
0.
63
0.53
C
AR
(–60
, 15)
19
0.
06
0.85
0.
40
CA
R(–
60, 5
5)
19
0.11
1.
52
0.15
C
AR
(–60
, –25
) 19
0.
01
0.61
0.
55
CA
R(–
60, 1
6)
19
0.06
0.
80
0.43
C
AR
(–60
, 56)
19
0.
11
1.60
0.
13
CA
R(–
60, –
24)
19
0.01
0.
58
0.57
C
AR
(–60
, 17)
19
0.
08
1.06
0.
30
CA
R(–
60, 5
7)
19
0.12
1.
66
0.11
C
AR
(–60
, –23
) 19
0.
01
0.33
0.
74
CA
R(–
60, 1
8)
19
0.08
1.
00
0.33
C
AR
(–60
, 58)
19
0.
12
1.73
0.
10
CA
R(–
60, –
22)
19
0.00
0.
07
0.95
C
AR
(–60
, 19)
19
0.
08
1.03
0.
32
CA
R(–
60, 5
9)
19
0.13
1.
78
0.09
C
AR
(–60
, –21
) 19
0.
00
–0.1
3 0.
90
CA
R(–
60, 2
0)
19
0.09
1.
12
0.28
C
AR
(–60
, 60)
19
0.
13
1.71
0.
11
CA
R(–
60, –
20)
19
–0.0
1 –0
.33
0.74
Not
e: *
**, *
*, *
indi
cate
s sig
nific
ance
at t
he 0
.01,
0.0
5, a
nd 0
.10
leve
l or b
ette
r, re
spec
tivel
y.
334 H. Yang et al.
Table 3 Cumulative average abnormal returns for stock incentive plans by ownership type (continued)
Pane
l B: c
umul
ativ
e av
erag
e ab
norm
al re
turn
s for
pri
vate
firm
s
Test
val
ue =
0 (t
wo-
taile
d)
Test
val
ue =
0 (t
wo-
taile
d)
Test
val
ue =
0 (t
wo-
taile
d)
One
-sam
ple
stat
istic
s N
M
EAN
T
Sig.
O
ne-s
ampl
e st
atis
tics
N
MEA
N
T Si
g.
One
-sam
ple
stat
istic
s N
M
EAN
T
Sig.
CA
R(–
60, –
60)
34
0.00
0.
02
0.98
C
AR
(–60
, –19
) 34
–0
.26
–9.8
7 0.
00**
* C
AR
(–60
, 21)
34
–0
.26
–5.7
5 0.
00**
* C
AR
(–60
, –59
) 34
0.
01
1.21
0.
24
CA
R(–
60, –
18)
34
–0.2
7 –9
.43
0.00
***
CA
R(–
60, 2
2)
34
–0.2
5 –5
.44
0.00
***
CA
R(–
60, –
58)
34
0.01
2.
08
0.05
* C
AR
(–60
, –17
) 34
–0
.27
–9.5
3 0.
00**
* C
AR
(–60
, 23)
34
–0
.25
–5.2
8 0.
00**
* C
AR
(–60
, –57
) 34
0.
02
2.63
0.
01**
C
AR
(–60
, –16
) 34
–0
.28
–9.7
9 0.
00**
* C
AR
(–60
, 24)
34
–0
.24
–5.1
0 0.
00**
* C
AR
(–60
, –56
) 34
0.
02
2.30
0.
03**
C
AR
(–60
, –15
) 34
–0
.29
–9.5
8 0.
00**
* C
AR
(–60
, 25)
34
–0
.24
–5.1
8 0.
00**
* C
AR
(–60
, –55
) 34
0.
01
1.40
0.
17
CA
R(–
60, –
14)
34
–0.3
0 –9
.65
0.00
***
CA
R(–
60, 2
6)
34
–0.2
4 –5
.27
0.00
***
CA
R(–
60, –
54)
34
0.00
0.
49
0.63
C
AR
(–60
, –13
) 34
–0
.31
–9.5
2 0.
00**
* C
AR
(–60
, 27)
34
–0
.24
–5.2
7 0.
00**
* C
AR
(–60
, –53
) 34
0.
00
0.37
0.
71
CA
R(–
60, –
12)
34
–0.3
1 –9
.84
0.00
***
CA
R(–
60, 2
8)
34
–0.2
5 –5
.37
0.00
***
CA
R(–
60, –
52)
34
0.00
–0
.24
0.81
C
AR
(–60
, –11
) 34
–0
.32
–10.
15
0.00
***
CA
R(–
60, 2
9)
34
–0.2
4 –5
.36
0.00
***
CA
R(–
60, –
51)
34
0.01
0.
42
0.68
C
AR
(–60
, –10
) 34
–0
.33
–10.
01
0.00
***
CA
R(–
60, 3
0)
34
–0.2
3 –5
.23
0.00
***
CA
R(–
60, –
50)
34
0.00
0.
05
0.96
C
AR
(–60
, –9)
34
–0
.33
–10.
43
0.00
***
CA
R(–
60, 3
1)
34
–0.2
3 –5
.01
0.00
***
CA
R(–
60, –
49)
34
–0.0
1 –0
.43
0.67
C
AR
(–60
, –8)
34
–0
.32
–10.
08
0.00
***
CA
R(–
60, 3
2)
34
–0.2
3 –4
.91
0.00
***
CA
R(–
60, –
48)
34
–0.0
1 –0
.40
0.69
C
AR
(–60
, –7)
34
–0
.33
–10.
61
0.00
***
CA
R(–
60, 3
3)
34
–0.2
3 –5
.01
0.00
***
CA
R(–
60, –
47)
34
–0.0
1 –0
.44
0.66
C
AR
(–60
, –6)
34
–0
.33
–10.
66
0.00
***
CA
R(–
60, 3
4)
34
–0.2
3 –4
.91
0.00
***
CA
R(–
60, –
46)
34
–0.0
1 –0
.75
0.46
C
AR
(–60
, –5)
34
–0
.32
–10.
30
0.00
***
CA
R(–
60, 3
5)
34
–0.2
2 –4
.89
0.00
***
CA
R(–
60, –
45)
34
–0.0
2 –1
.14
0.26
C
AR
(–60
, –4)
34
–0
.33
–10.
18
0.00
***
CA
R(–
60, 3
6)
34
–0.2
2 –4
.89
0.00
***
CA
R(–
60, –
44)
34
–0.0
2 –1
.31
0.20
C
AR
(–60
, –3)
34
–0
.33
–9.6
5 0.
00**
* C
AR
(–60
, 37)
34
–0
.22
–4.7
5 0.
00**
* C
AR
(–60
, –43
) 34
–0
.02
–1.7
6 0.
09*
CA
R(–
60, –
2)
34
–0.3
3 –9
.65
0.00
***
CA
R(–
60, 3
8)
34
–0.2
2 –4
.64
0.00
***
CA
R(–
60, –
42)
34
–0.0
2 –1
.58
0.12
C
AR
(–60
, –1)
34
–0
.33
–9.1
9 0.
00**
* C
AR
(–60
, 39)
34
–0
.22
–4.5
9 0.
00**
* C
AR
(–60
, –41
) 34
–0
.02
–1.2
8 0.
21
CA
R(–
60, 0
) 34
–0
.31
–9.0
7 0.
00**
* C
AR
(–60
, 40)
34
–0
.21
–4.4
3 0.
00**
*
Not
e: *
**, *
*, *
indi
cate
s sig
nific
ance
at t
he 0
.01,
0.0
5, a
nd 0
.10
leve
l or b
ette
r, re
spec
tivel
y.

Do managers influence their own pay? 335
Table 3 Cumulative average abnormal returns for stock incentive plans by ownership type (continued)
Pane
l B: c
umul
ativ
e av
erag
e ab
norm
al re
turn
s for
pri
vate
firm
s
Test
val
ue =
0 (t
wo-
taile
d)
Test
val
ue =
0 (t
wo-
taile
d)
Test
val
ue =
0 (t
wo-
taile
d)
One
-sam
ple
stat
istic
s N
M
EAN
T
Sig.
O
ne-s
ampl
e st
atis
tics
N
MEA
N
T Si
g.
One
-sam
ple
stat
istic
s N
M
EAN
T
Sig.
CA
R(–
60, –
40)
34
–0.0
3 –2
.09
0.04
**
CA
R(–
60, 1
) 34
–0
.28
–8.0
2 0.
00**
* C
AR
(–60
, 41)
34
–0
.21
–4.4
5 0.
00**
* C
AR
(–60
, –39
) 34
–0
.04
–2.2
6 0.
03**
C
AR
(–60
, 2)
34
–0.2
9 –8
.16
0.00
***
CA
R(–
60, 4
2)
34
–0.2
1 –4
.28
0.00
***
CA
R(–
60, –
38)
34
–0.0
4 –2
.52
0.02
**
CA
R(–
60, 3
) 34
–0
.28
–7.8
5 0.
00**
* C
AR
(–60
, 43)
34
–0
.21
–4.3
5 0.
00**
* C
AR
(–60
, –37
) 34
–0
.04
–2.7
2 0.
01**
C
AR
(–60
, 4)
34
–0.2
7 –7
.71
0.00
***
CA
R(–
60, 4
4)
34
–0.2
1 –4
.44
0.00
***
CA
R(–
60, –
36)
34
–0.0
5 –3
.16
0.00
***
CA
R(–
60, 5
) 34
–0
.28
–7.7
3 0.
00**
* C
AR
(–60
, 45)
34
–0
.22
–4.5
1 0.
00**
* C
AR
(–60
, –35
) 34
–0
.07
–3.8
7 0.
00**
* C
AR
(–60
, 6)
34
–0.2
8 –7
.48
0.00
***
CA
R(–
60, 4
6)
34
–0.2
2 –4
.56
0.00
***
CA
R(–
60, –
34)
34
–0.0
8 –4
.56
0.00
***
CA
R(–
60, 7
) 34
–0
.28
–7.5
9 0.
00**
* C
AR
(–60
, 47)
34
–0
.22
–4.5
7 0.
00**
* C
AR
(–60
, –33
) 34
–0
.09
–5.5
4 0.
00**
* C
AR
(–60
, 8)
34
–0.2
8 –7
.89
0.00
***
CA
R(–
60, 4
8)
34
–0.2
2 –4
.47
0.00
***
CA
R(–
60, –
32)
34
–0.1
1 –6
.96
0.00
***
CA
R(–
60, 9
) 34
–0
.27
–7.6
4 0.
00**
* C
AR
(–60
, 49)
34
–0
.22
–4.2
7 0.
00**
* C
AR
(–60
, –31
) 34
–0
.12
–7.2
1 0.
00**
* C
AR
(–60
, 10)
34
–0
.27
–7.5
6 0.
00**
* C
AR
(–60
, 50)
34
–0
.22
–4.3
1 0.
00**
* C
AR
(–60
, –30
) 34
–0
.13
–7.7
2 0.
00**
* C
AR
(–60
, 11)
34
–0
.27
–8.0
0 0.
00**
* C
AR
(–60
, 51)
34
–0
.22
–4.5
4 0.
00**
* C
AR
(–60
, –29
) 34
–0
.13
–8.3
1 0.
00**
* C
AR
(–60
, 12)
34
–0
.28
–8.2
5 0.
00**
* C
AR
(–60
, 52)
34
–0
.22
–4.4
4 0.
00**
* C
AR
(–60
, –28
) 34
–0
.15
–8.5
4 0.
00**
* C
AR
(–60
, 13)
34
–0
.28
–7.8
3 0.
00**
* C
AR
(–60
, 53)
34
–0
.22
–4.4
8 0.
00**
* C
AR
(–60
, –27
) 34
–0
.16
–9.0
3 0.
00**
* C
AR
(–60
, 14)
34
–0
.28
–7.1
2 0.
00**
* C
AR
(–60
, 54)
34
–0
.23
–4.4
4 0.
00**
* C
AR
(–60
, –26
) 34
–0
.17
–9.8
4 0.
00**
* C
AR
(–60
, 15)
34
–0
.27
–6.7
3 0.
00**
* C
AR
(–60
, 55)
34
–0
.22
–4.3
2 0.
00**
* C
AR
(–60
, –25
) 34
–0
.19
–9.8
9 0.
00**
* C
AR
(–60
, 16)
34
–0
.27
–6.1
6 0.
00**
* C
AR
(–60
, 56)
34
–0
.22
–4.2
6 0.
00**
* C
AR
(–60
, –24
) 34
–0
.21
–9.7
1 0.
00**
* C
AR
(–60
, 17)
34
–0
.27
–6.0
9 0.
00**
* C
AR
(–60
, 57)
34
–0
.22
–4.3
9 0.
00**
* C
AR
(–60
, –23
) 34
–0
.22
–9.8
6 0.
00**
* C
AR
(–60
, 18)
34
–0
.27
–6.3
0 0.
00**
* C
AR
(–60
, 58)
34
–0
.22
–4.3
0 0.
00**
* C
AR
(–60
, –22
) 34
–0
.23
–9.4
3 0.
00**
* C
AR
(–60
, 19)
34
–0
.27
–6.3
8 0.
00**
* C
AR
(–60
, 59)
34
–0
.21
–4.1
9 0.
00**
* C
AR
(–60
, –21
) 34
–0
.24
–9.1
6 0.
00**
* C
AR
(–60
, 20)
34
–0
.27
–6.0
9 0.
00**
* C
AR
(–60
, 60)
34
–0
.22
–4.2
9 0.
00**
* C
AR
(–60
, –20
) 34
–0
.25
–9.5
9 0.
00**
*
Not
e: *
**, *
*, *
indi
cate
s sig
nific
ance
at t
he 0
.01,
0.0
5, a
nd 0
.10
leve
l or b
ette
r, re
spec
tivel
y.

336 H. Yang et al.
Figure 2 Mean abnormal stock returns around the initial release date of the stock incentive plans, by ownership type
Notes: Real line: state-owned enterprises (SOEs); dashed line: non-SOEs.
4.3 Additional analysis on restricted stock plans
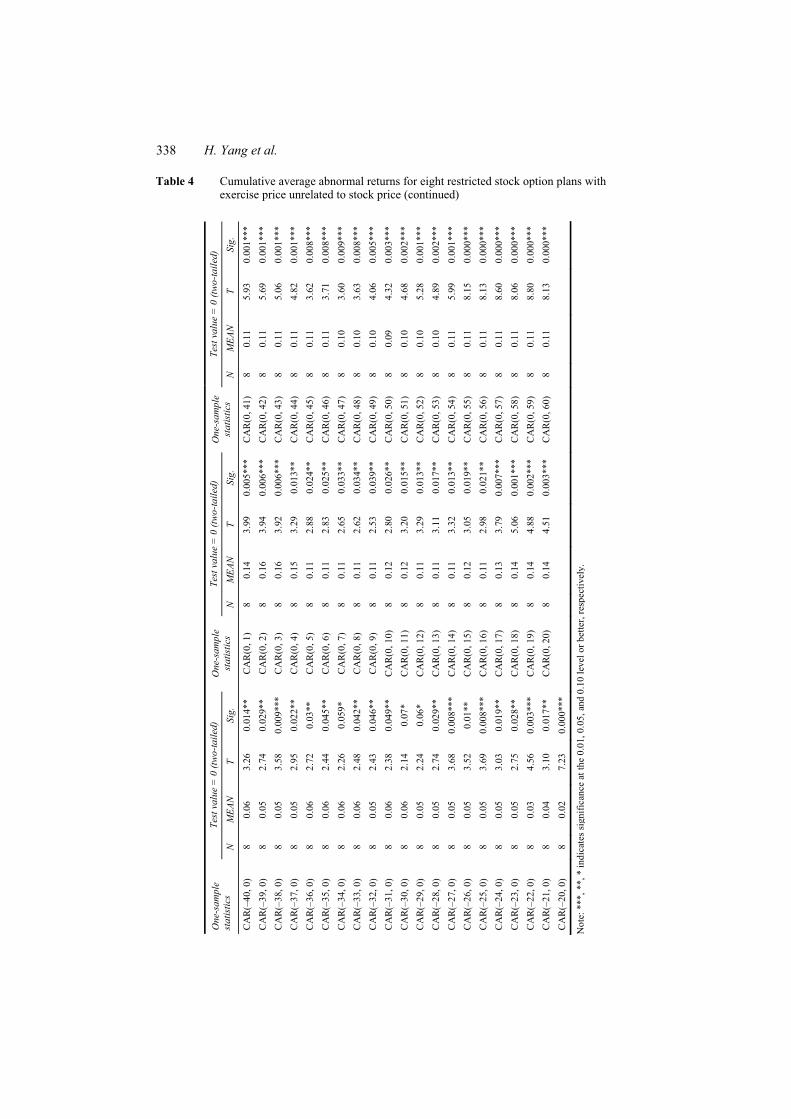
In this section, we provide further evidence on managerial influence over their compensation by separately examining the abnormal returns around the initial disclosure of restricted stock plans. As described in Section 3, our final sample excludes eight restricted stock incentive plans because their exercise prices are not based on any form of stock prices. If the exercise price of these eight plans is unrelated to any stock price, we expect managers to have little incentive to manipulate the stock price around the grant date, and consequently we shall not observe the same pattern of abnormal returns around the announcement of these plans.
Figure 3 Mean abnormal stock returns around the initial release date of the eight restricted stock plans with exercise prices unrelated to stock prices

Do managers influence their own pay? 337
Table 4 Cumulative average abnormal returns for eight restricted stock option plans with exercise price unrelated to stock price
Test
val
ue =
0 (t
wo-
taile
d)
Test
val
ue =
0 (t
wo-
taile
d)
Test
val
ue =
0 (t
wo-
taile
d)
One
-sam
ple
stat
istic
s N
M
EAN
T
Sig.
O
ne-s
ampl
e st
atis
tics
N
MEA
N
T Si
g.
One
-sam
ple
stat
istic
s N
M
EAN
T
Sig.
CA
R(–
60, 0
) 8
0.02
1.
16
0.28
4 C
AR
(–19
, 0)
8 0.
04
3.79
0.
007*
**
CA
R(0
, 21)
8
0.14
4.
90
0.00
2***
CA
R(–
59, 0
) 8
0.03
1.
61
0.15
2 C
AR
(–18
, 0)
8 0.
04
3.13
0.
017*
* C
AR
(0, 2
2)
8 0.
14
5.10
0.
001*
**
CA
R(–
58, 0
) 8
0.02
1.
54
0.16
7 C
AR
(–17
, 0)
8 0.
05
2.90
0.
023*
* C
AR
(0, 2
3)
8 0.
14
4.88
0.
002
CA
R(–
57, 0
) 8
0.03
2.
14
0.07
* C
AR
(–16
, 0)
8 0.
06
3.04
0.
019*
* C
AR
(0, 2
4)
8 0.
14
5.29
0.
001*
**
CA
R(–
56, 0
) 8
0.02
1.
65
0.14
4 C
AR
(–15
, 0)
8 0.
06
3.03
0.
019*
* C
AR
(0, 2
5)
8 0.
13
5.41
0.
001*
**
CA
R(–
55, 0
) 8
0.02
2.
04
0.08
1*
CA
R(–
14, 0
) 8
0.06
2.
91
0.02
3**
CA
R(0
, 26)
8
0.13
4.
92
0.00
2***
CA
R(–
54, 0
) 8
0.02
2.
38
0.04
9**
CA
R(–
13, 0
) 8
0.06
3.
32
0.01
3**
CA
R(0
, 27)
8
0.13
4.
61
0.00
2***
CA
R(–
53, 0
) 8
0.02
20
.40
0.04
8**
CA
R(–
12, 0
) 8
0.06
3.
03
0.01
9**
CA
R(0
, 28)
8
0.13
5.
01
0.00
2***
CA
R(–
52, 0
) 8
0.03
2.
70
0.03
1**
CA
R(–
11, 0
) 8
0.06
3.
16
0.01
6**
CA
R(0
, 29)
8
0.13
6.
24
0.00
0***
CA
R(–
51, 0
) 8
0.04
2.
40
0.04
7**
CA
R(–
10, 0
) 8
0.06
3.
11
0.01
7**
CA
R(0
, 30)
8
0.13
6.
23
0.00
0***
CA
R(–
50, 0
) 8
0.04
2.
45
0.04
4**
CA
R(–
9, 0
) 8
0.06
2.
87
0.02
6**
CA
R(0
, 31)
8
0.13
5.
26
0.00
1***
CA
R(–
49, 0
) 8
0.04
2.
49
0.04
2**
CA
R(–
8, 0
) 8
0.06
2.
97
0.02
1**
CA
R(0
, 32)
8
0.12
5.
61
0.00
1***
CA
R(–
48, 0
) 8
0.04
3.
02
0.01
9**
CA
R(–
7, 0
) 8
0.06
3.
08
0.01
8**
CA
R(0
, 33)
8
0.12
5.
07
0.00
1***
CA
R(–
47, 0
) 8
0.05
3.
80
0.00
7***
C
AR
(–6,
0)
8 0.
06
3.20
0.
015*
* C
AR
(0, 3
4)
8 0.
12
5.34
0.
001*
**
CA
R(–
46, 0
) 8
0.05
3.
44
0.01
1**
CA
R(–
5, 0
) 8
0.06
2.
87
0.02
4**
CA
R(0
, 35)
8
0.12
4.
98
0.00
2***
CA
R(–
45, 0
) 8
0.05
3.
57
0.00
9***
C
AR
(–4,
0)
8 0.
06
3.11
0.
017*
* C
AR
(0, 3
6)
8 0.
13
5.71
0.
001*
**
CA
R(–
44, 0
) 8
0.05
5.
31
0.00
1***
C
AR
(–3,
0)
8 0.
06
3.03
0.
019*
* C
AR
(0, 3
7)
8 0.
14
5.68
0.
001*
**
CA
R(–
43, 0
) 8
0.05
4.
67
0.00
2***
C
AR
(–2,
0)
8 0.
07
3.96
0.
005*
**
CA
R(0
, 38)
8
0.13
5.
20
0.00
1***
CA
R(–
42, 0
) 8
0.02
1.
31
0.23
1 C
AR
(–1,
0)
8 0.
08
4.23
0.
004*
**
CA
R(0
, 39)
8
0.12
5.
01
0.00
2***
CA
R(–
41, 0
) 8
0.06
4.
53
0.00
3***
C
AR
(–0,
0)
8 0.
14
3.33
0.
013*
* C
AR
(0, 4
0)
8 0.
12
5.58
0.
001*
**
Not
e: *
**, *
*, *
indi
cate
s sig
nific
ance
at t
he 0
.01,
0.0
5, a
nd 0
.10
leve
l or b
ette
r, re
spec
tivel
y.
338 H. Yang et al.
Table 4 Cumulative average abnormal returns for eight restricted stock option plans with exercise price unrelated to stock price (continued)
Test
val
ue =
0 (t
wo-
taile
d)
Test
val
ue =
0 (t
wo-
taile
d)
Test
val
ue =
0 (t
wo-
taile
d)
One
-sam
ple
stat
istic
s N
M
EAN
T
Sig.
O
ne-s
ampl
e st
atis
tics
N
MEA
N
T Si
g.
One
-sam
ple
stat
istic
s N
M
EAN
T
Sig.
CA
R(–
40, 0
) 8
0.06
3.
26
0.01
4**
CA
R(0
, 1)
8 0.
14
3.99
0.
005*
**
CA
R(0
, 41)
8
0.11
5.
93
0.00
1***
CA
R(–
39, 0
) 8
0.05
2.
74
0.02
9**
CA
R(0
, 2)
8 0.
16
3.94
0.
006*
**
CA
R(0
, 42)
8
0.11
5.
69
0.00
1***
CA
R(–
38, 0
) 8
0.05
3.
58
0.00
9***
C
AR
(0, 3
) 8
0.16
3.
92
0.00
6***
C
AR
(0, 4
3)
8 0.
11
5.06
0.
001*
**
CA
R(–
37, 0
) 8
0.05
2.
95
0.02
2**
CA
R(0
, 4)
8 0.
15
3.29
0.
013*
* C
AR
(0, 4
4)
8 0.
11
4.82
0.
001*
**
CA
R(–
36, 0
) 8
0.06
2.
72
0.03
**
CA
R(0
, 5)
8 0.
11
2.88
0.
024*
* C
AR
(0, 4
5)
8 0.
11
3.62
0.
008*
**
CA
R(–
35, 0
) 8
0.06
2.
44
0.04
5**
CA
R(0
, 6)
8 0.
11
2.83
0.
025*
* C
AR
(0, 4
6)
8 0.
11
3.71
0.
008*
**
CA
R(–
34, 0
) 8
0.06
2.
26
0.05
9*
CA
R(0
, 7)
8 0.
11
2.65
0.
033*
* C
AR
(0, 4
7)
8 0.
10
3.60
0.
009*
**
CA
R(–
33, 0
) 8
0.06
2.
48
0.04
2**
CA
R(0
, 8)
8 0.
11
2.62
0.
034*
* C
AR
(0, 4
8)
8 0.
10
3.63
0.
008*
**
CA
R(–
32, 0
) 8
0.05
2.
43
0.04
6**
CA
R(0
, 9)
8 0.
11
2.53
0.
039*
* C
AR
(0, 4
9)
8 0.
10
4.06
0.
005*
**
CA
R(–
31, 0
) 8
0.06
2.
38
0.04
9**
CA
R(0
, 10)
8
0.12
2.
80
0.02
6**
CA
R(0
, 50)
8
0.09
4.
32
0.00
3***
CA
R(–
30, 0
) 8
0.06
2.
14
0.07
* C
AR
(0, 1
1)
8 0.
12
3.20
0.
015*
* C
AR
(0, 5
1)
8 0.
10
4.68
0.
002*
**
CA
R(–
29, 0
) 8
0.05
2.
24
0.06
* C
AR
(0, 1
2)
8 0.
11
3.29
0.
013*
* C
AR
(0, 5
2)
8 0.
10
5.28
0.
001*
**
CA
R(–
28, 0
) 8
0.05
2.
74
0.02
9**
CA
R(0
, 13)
8
0.11
3.
11
0.01
7**
CA
R(0
, 53)
8
0.10
4.
89
0.00
2***
CA
R(–
27, 0
) 8
0.05
3.
68
0.00
8***
C
AR
(0, 1
4)
8 0.
11
3.32
0.
013*
* C
AR
(0, 5
4)
8 0.
11
5.99
0.
001*
**
CA
R(–
26, 0
) 8
0.05
3.
52
0.01
**
CA
R(0
, 15)
8
0.12
3.
05
0.01
9**
CA
R(0
, 55)
8
0.11
8.
15
0.00
0***
CA
R(–
25, 0
) 8
0.05
3.
69
0.00
8***
C
AR
(0, 1
6)
8 0.
11
2.98
0.
021*
* C
AR
(0, 5
6)
8 0.
11
8.13
0.
000*
**
CA
R(–
24, 0
) 8
0.05
3.
03
0.01
9**
CA
R(0
, 17)
8
0.13
3.
79
0.00
7***
C
AR
(0, 5
7)
8 0.
11
8.60
0.
000*
**
CA
R(–
23, 0
) 8
0.05
2.
75
0.02
8**
CA
R(0
, 18)
8
0.14
5.
06
0.00
1***
C
AR
(0, 5
8)
8 0.
11
8.06
0.
000*
**
CA
R(–
22, 0
) 8
0.03
4.
56
0.00
3***
C
AR
(0, 1
9)
8 0.
14
4.88
0.
002*
**
CA
R(0
, 59)
8
0.11
8.
80
0.00
0***
CA
R(–
21, 0
) 8
0.04
3.
10
0.01
7**
CA
R(0
, 20)
8
0.14
4.
51
0.00
3***
C
AR
(0, 6
0)
8 0.
11
8.13
0.
000*
**
CA
R(–
20, 0
) 8
0.02
7.
23
0.00
0***
Not
e: *
**, *
*, *
indi
cate
s sig
nific
ance
at t
he 0
.01,
0.0
5, a
nd 0
.10
leve
l or b
ette
r, re
spec
tivel
y.

Do managers influence their own pay? 339
Figure 3 displays the mean CARs between –60 and 60 days around the initial disclosure date for the eight restricted stock plans excluded from our sample. Unlike the incentive plans in our sample with exercise prices related to stock prices, the mean CAR of these eight incentive plans does not exhibit the U-shaped reversal pattern. Instead, the mean CAR is positive and generally increases throughout the period, with a significant jump within three days after the announcement, followed by a decreasing trend afterwards. Table 4 shows that the mean CAR for 50 days prior to the release date is 4%, significant at p < 5%. The mean CAR for the three days after the announcement is 16%, significant at p < 1%, and the mean CAR for 60 days following the announcement is 11%, significant at p < 1%. The significant increase in abnormal returns following the announcement seems to suggest that the market generally views these incentive plans as positive signals in helping reducing the agency conflicts between managers and shareholders. In sum, our findings indicate that these eight incentive plans have exercise prices unrelated to the stock price and therefore exhibit different abnormal return patterns compared to the incentive plans in our sample. This is consistent with the different managerial incentives in response to the structure of the compensation plans.
4.4 Additional analysis on the as-if exercise price of the incentive plans
We argue that managers opportunistically time the announcement of the incentive plans to maximise their compensation. This indicates that a strategic manager would try to time the announcement some time after a decline in the stock price, not immediately following a price decline, because the incentive plans are awarded with a fixed exercise price equal to the maximum of the closing price the day before the announcement, and the average price over the previous 30 trading days. To provide corroborating evidence on our conclusion, we calculate and compare the exercise price that would have occurred for any of these potential announcement dates (‘as-if exercise prices’) in the previous 20 trading days ending on the tenth day prior to the announcement with the actual exercise price. We focus on the 20 trading days ending on the tenth day before the announcement because our findings in Section 4.1 indicate a reversal starting around ten days prior to the announcement. If managers indeed try to optimally time the announcement, then the actual exercise price would fall into the low tail of the as-if exercise price. Consistent with our expectation, we find that 43.4% of our sample has the actual exercise price below the first quartile of the as-if exercise prices in the previous 20 trading days ending on the tenth day prior to the announcement, and 58.5% has the actual exercise price below the median of the as-if exercise prices. These percentages become even higher when we exclude the five restricted stock plans and the one phantom stock option plan (46.8% below the first quartile and 63.8% below the median). Thus, our result provides additional support on managers optimally timing the announcement of their incentive plans.
5 Conclusions
The Chinese government introduced the stock-based executive compensation for publicly listed companies in 2006. We investigate the extent of managerial influence on their

340 H. Yang et al.
stock-based compensation by analysing the abnormal stock returns around the initial disclosure date of 53 stock incentive plans in Chinese publicly listed companies during 2006–2007. We find that stock prices fall significantly prior to the disclosure date and rise significantly afterwards. The industry-adjusted return for the 60 days preceding the disclosure date is about –20.6% and the return for the 60 days following the disclosure date is about 12.7%. The magnitude of the negative abnormal returns prior to the disclosure date is significantly larger than the magnitude of returns found in the US markets. This result is consistent with substantial managerial influence over their compensation in Chinese listed companies. We also find that the abnormal stock return reversals are more pronounced for non-SOEs with less independent compensation committees than those of SOEs, suggesting that board independence plays an effective governance role in stock incentive compensations.
Compared with the evidence on equity-based compensation in the USA, the findings in the study indicate that executives in China have an incentive, ability, and opportunity to influence their personal stock incentive plans, and the benefit of doing so is substantially greater in an environment with emerging capital markets and weak investor protection. The results also speak to the importance of further strengthening Chinese corporate governance in improving the efficacy of equity-based compensation as an incentive alignment device. Policies such as enhancing board independence, increasing legal liabilities of controlling shareholders, improving internal controls and auditor independence, strengthening shareholder rights, and increasing information disclosure and transparency could help improve governance (Lin, 2004).
This study is subject to several caveats. First, although the sample in this study covers all available stock incentive plans in Chinese publicly listed companies during 2006–2007, the sample period is short and the sample size is relatively small compared to prior literature in the USA. Thus, the results may not fully capture the long-run implications of stock incentive plans in China, and hence should be interpreted as preliminary. Second, the results in this study are also consistent with managers opportunistically manipulating their communications with the market by accelerating the release of bad news and delaying the release of good news around the disclosure of the incentive plans (Aboody and Kasznik, 2000; Chauvin and Shenoy, 2001). The empirical analysis in this study does not provide a direct test to differentiate whether managers manipulate the disclosure of the incentive plans and/or their communications with the market. Such an analysis remains an interesting avenue for future research.
Acknowledgements
We acknowledge the financial support from the China Ministry of Education Humanities and Social Science Research Institute (‘Behavior research of management accounting in Chinese company’, Project No. 10JJD630005), the China Natural Science Research Institute (‘Value-based and strategy-oriented management accounting research in China’, Project No. 71032005), the Leading Academic Discipline Project (Phase V) of Shanghai Municipal Education Commission (Project No. J51202), the ‘Eleventh five-year plan’ at the Shanghai University of Finance and Economics, the third phase of China’s ‘211 project’, and the Presidential Research Grant at Santa Clara University. We also thank Margaret Palisoc for her helpful comments.

Do managers influence their own pay? 341
References Aboody, D. and Kasznik, R. (2000) ‘CEO stock option awards and the timing of corporate
voluntary disclosures’, Journal of Accounting and Economics, Vol. 29, No. 1, pp.73–100. Bebchuk, L. and Fried, J. (2004) Pay without Performance: The Unfulfilled Promise of Executive
Compensation, Harvard University Press, Cambridge, MA. Bertrand, M. and Mullainathan, S. (2000) ‘Agents with and without principals’, American
Economic Review, Vol. 90, No. 2, pp.203–208. Brickley, J.A., Coels, J.L. and Terry, R.L. (1994) ‘Outside directors and the adoption of poison
pills’, Journal of Financial Economics, Vol. 35, No. 3, pp.371–90. Cai, J. (2007) ‘Executive stock option exercises: good timing or backdating?’, Working paper,
Drexel University. Chauvin, K. and Shenoy, C. (2001) ‘Stock price decreases prior to executive stock option grants’,
Journal of Corporate Finance, Vol. 7, No. 1, pp.53–76. Chen, C-H. and Lin, L-Y. (2008) ‘Determinants and incentive effect of employee stock bonus
policy: evidence from Taiwan’, International Journal of Accounting and Finance, Vol. 1, No. 2, pp.121–148.
Chen, Z., Guan, Y. and Ke, B. (2008) ‘Stock option compensation with Chinese characteristics: the case of Hong Kong-listed red chip firms’, Working paper, City University of Hong Kong, Pennsylvania State University.
Cicero, D. (2006) ‘Timing and backdating of executive stock option exercises – before and after the Sarbanes-Oxley Act’, Working paper, University of Georgia.
Collins, D., Gong, G. and Li, H. (2005) ‘The effect of the Sarbanes-Oxley Act on the timing manipulation of CEO stock option awards’, Working paper, University of Iowa and Pennsylvania State University.
Collins, D., Gong, G. and Li, H. (2010) ‘Corporate governance and backdating of executive stock options’, Contemporary Accounting Research, Vol. 26, No. 2, pp.403–445.
Core, J.E., Guay, W.R. and Larcker, D.F. (2003) ‘Executive equity compensation and incentives: a survey’, Economic Policy Review, Vol. 9, No. 1, pp.27–50.
Core, J.E., Holthausen, R.W. and Larcker, D.F. (1999) ‘Corporate governance, chief executive officer compensation, and firm performance’, Journal of Financial Economics, Vol. 51, No. 3, pp.371–406.
Crystal, G. (1991) In Search of Excess: The Overcompensation of American Executives, Norton, New York.
Dechow, P.M., Sloan, R.G. and Sweeney, A.P. (1996) ‘Causes and consequences of earnings manipulation: an analysis of firms subject to enforcement actions by the SEC’, Contemporary Accounting Research, Vol. 13, No. 1, pp.1–36.
Fan, J. and Wong, T.J. (2002) ‘Corporate ownership structure and the informativeness of accounting earnings in East Asia’, Journal of Accounting and Economics, Vol. 33, No. 3, pp.401–425.
Heron, R. and Lie, E. (2007) ‘Does backdating explain the stock price pattern around executive stock option grants?’, Journal of Financial Economics, Vol. 83, No. 2, pp.271–295.
Hu, Y. (2006) ‘SOEs to get stock incentive plan’, China Daily, 16 August 2006. Kanagaretnam, K., Lobo, G. and Mohammad, E. (2008) ‘Determinants and consequences of large
CEO pay’, International Journal of Accounting and Finance, Vol. 1, No. 1, pp.61–82. Lie, E. (2005) ‘On the timing of CEO stock option awards’, Management Science, Vol. 51, No. 5,
pp.802–812. Lin, T.W. (2004) ‘Corporate governance in China: recent developments, key problems, and
solutions’, Journal of Accounting and Corporate Governance, June, Vol. 1, No. 1, pp.1–23. Liu, H.R. and Gao, X.Q. (2000) ‘For the establishment of H shares’, China-Review.com
(in Chinese), 16 October 2000.

342 H. Yang et al.
Murphy, K. (1999) ‘Executive compensation’, in Ashenfelter, O. and Card, D. (Eds.): Handbook of Labor Economics, Vol. 3, Elsevier Science, North Holland.
Murphy, K. (2003) ‘Stock-based pay in new economy firms’, Journal of Accounting and Economics, Vol. 34, Nos. 1–3, pp.129–147.
Narayanan, M.P. and Seyhun, H.N. (2005) ‘Do managers influence their pay? Evidence from stock price reversals around executive stock option grants’, Unpublished working paper, University of Michigan.
Rosenstein, S. and Wyatt, J.G. (1990) ‘Outside directors, board independence, and shareholder wealth’, Journal of Financial Economics, Vol. 26, No. 2, pp.175–91.
Tenev, S. and Zhang, C. (2002) ‘Corporate governance and enterprise reform in China’, World Bank and the International Finance Corporation, Washington, DC.
Tomasic, R. and Andrews, N. (2006) ‘Minority shareholder protection in China’s top 100 listed companies’, Paper presented at the Meeting of the Association for Chinese Economic Studies, 13–14 July, Melbourne, Australia.
Weisbach, M.S. (1988) ‘Outside directors and CEO turnover’, Journal of Financial Economics, Vol. 20, Nos. 1–2, pp.431–460.
Yermack, D. (1997) ‘Good timing: CEO stock option awards and company news announcements’, Journal of Finance, Vol. 52, No. 2, pp.449–476.
Notes 1 Specifically, for the five restricted stock plans, the minimum of the exercise price is
determined by the 50% of the average closing price during the 20-day period prior to the release date. The exercise price for the phantom stock option plan is determined by the average closing price during the 30-day period prior to the release date. In other words, these five plans included in our final sample all have exercise prices that are based on the stock price around the release date. In untabulated analysis, we find a consistent reversal pattern for the abnormal returns of these six plans. Our results are also qualitatively similar when excluding these six plans.