do managers systematically underestimate the potential for ... · proposed that managers could...
TRANSCRIPT

Do Managers Systematically Underestimate The Potential for Waste
Reduction?
LUCA BERCHICCI
Rotterdam School of Management
Erasmus University,
Rotterdam, the Netherlands
ANDREW A. KING
Tuck School of Bus. at Dartmouth College
114 Buchanan Hall
Hanover, NH 03755
Tel: 603-646-8985
Abstract: Scholars have long inferred the managers make systematically biased assessments of the
potential for waste reduction, and these biases partially explain reported examples of x-inefficiency in
waste reduction. Previous studies have neither developed the underlying logic of this conjecture nor
tested it empirically. In this article we do both. We also show that managers indeed underestimate
the potential for waste reduction, and we show that well-known heuristics and biases may account for
these erroneous estimations. Our research extends the environmental literature, and for the broader
literature it uncovers a potential cause for other types of x-inefficiency.

Do Managers Systematically Underestimate The Potential for Waste
Reduction?
Introduction
Almost 20 years ago, scholars such as Michael Porter and Claus van der Linde suggested with a
growing confidence that firms might be able to be both green and competitive (Porter & Van der
Linde, 1995a, 1995b). Their articles and closely allied research had an enormous effect on
scholarship, public policy, and business policy. Porter’s claim was also part of a broader literature
suggesting that managers might systematically miss opportunities to make their firms more profitable.
For example, scholars proposed that managers often underestimate the true benefit of inventory
reduction, or new market entry, or markets dominated by lower income people (Christensen, 1997;
Prahalad & Hammond, 2002). In some cases, the broad predictions of these theories have been tested
empirically. For example, many scholars have tested whether waste reduction is associated with
higher profitability (Hart & Ahuja, 1996; King & Lenox, 2002; Russo & Fouts, 1997). The underlying
mechanisms of these theories, however, have been barely explored. In this paper, we attempt to fill
this gap by testing one of the commonly proposed mechanisms for why managers might miss profit
opportunities. We explore whether managerial heuristics and biases may be a root cause of missed
opportunities for waste reduction among US manufacturers.
There is little need to wonder why no previous study has directly tested quantitatively whether
managerial expectations provide one cause of missed profit opportunities. Conducting such research
seems almost comically infeasible. To study the issue, one must have access to a panel of
expectations or predictions from many managers and over many years. One needs to directly measure
compare these expectations to what actually happened, and one needs to have access to other
measures of activity in order to limit the potential for rival hypotheses. Finally, to avoid problems
associated with cross-sectional studies, a longitudinal panel is required. These requirements seem
impossible to meet, but remarkably, all (and more) are met by data from a little known part of the US
Toxic Release Inventory. The TRI requires “technicians” in many US facilities to report waste levels
for current years and predict waste for the future year. They do this for each waste chemical in the
facility and the data have been collected in a consistent manner since 1991.

Our research contributes directly to theories of why managers may miss improvement opportunities --
sometimes referred to as "systematic x-inefficiency" (Leibenstein, 1966). It provides the most direct
evidence of possible cognitive underpinnings for one specific theory, which says that managers
systematically miss opportunities to reduce waste. It also directly tests the role of cognitive
heuristics in determining managerial expectations, and it provides the first large scale test of recent
theorizing connecting loss aversion and goal setting. It shows that managers respond more strongly
when they fail to meet the expectations they have set. It also tests the theory of "under confidence
with practice" (Koriat, Sheffer, & Ma'ayan, 2002) as a possible explanation for biased managerial
expectations. In summary, this article provides both an important test of practical theory and new
empirical information on the role played by managerial heuristics and biases.
Theory
Several management theories predict that managers systematically miss opportunities to make their
firms more profitable. As a result, firms are consistently x-inefficient. That is they are not on the
efficiency frontier in turning organizational inputs into valuable outputs. These theories have had
important implications four both management scholarship and education because they provide a clear
role for advancing productivity. For example, in the late 1980s and early 1990s, several scholars
proposed that managers could improve the profitability of their firms by reducing the pollution
generated by these firms (Cebon, 1992; Green & Berry, 1985; Kleiner, 1991). The implication of this
theory was clear: managers were not investing enough effort in waste reduction. As a result, the
average facility or firm could become more profitable by redirecting efforts towards waste reduction.
Similarly, theories of lean production suggested that firms systematically held too much inventory and
that firms could become more profitable by reducing inventories below current levels (King & Lenox,
2001; Klassen, 2000; Lenox & King, 2004; Pil & Rothenberg, 2003). Finally, theories of disruptive
innovation suggest that managers underestimate the potential value of emerging markets and so do not
allocate sufficient resources to entering these markets (Christensen, 1997). Once again the
implication is that most firms could benefit by redirecting effort towards market exploration.
All three of these theories provide multiple explanations for why managers might systematically miss
opportunities to improve profits. Each suggests that missing information or misaligned incentives can
be important. They also suggest that organizational barriers and inertia can be important contributors
to x-inefficiency. Each theory also suggests the managerial perceptions and expectations may play an

important role. For example in the case of lean production, scholars propose that managers
understanding of the value of inventories may overlook the potential learning benefits created by
lower inventory levels (King & Lenox, 2001; Klassen, 2000; Lenox & King, 2004; Pil & Rothenberg,
2003). Similarly, managers facing new markets may frame these new markets using existing
performance criteria and so misperceive the potential of these new markets (Christensen, 1997). In
the case of “pays to be green” (PTBG) theory, scholars suggest that managers may not understand
how and why waste reduction efforts can be successful (Hart & Ahuja, 1996; King & Lenox, 2002;
Russo & Fouts, 1997).
Misperceptions of the opportunities for performance improvement can interact with other theories in
explaining x-inefficiency. For example if managers believe that they can make little headway in
reducing waste in manufacturing operations, they may provide misleading information to higher-up
decision makers. Thus, biased perceptions at one level may lead to missing information at another
level. Similarly, misunderstanding of the potential costs and benefits improvement may cause the
organization to adopt inefficient incentives with respect to improvement efforts.
As shown in Figure 1, a misperception of the potential for waste reduction can lead to unexpected
waste reductions. If a manager’s perception of waste reduction (dashed line) is that it is more difficult
than it actually is, he will expect too little waste reduction for any level of effort. Of course, such a
simple analysis ignores that the effort level is also chosen by managers. Waste reduction efforts, like
many activities, have diminishing returns and economic theory suggests that managers should
optimize their firm’s performance by spending effort in waste reduction up to the point where the
marginal cost of abating waste equals the marginal benefit of waste reduction. Appendix 1 provides
an example of a simple calculation of the optimal effort level, and Figure 2 shows the result for one
set of parameters. If managers misperceive the true difficulty of waste reduction, they will not choose
the optimal effort level and will miss opportunities to profitably reduce waste. Also as shown in the
graph, when managers overestimate the difficulty of waste reduction, they may tend to predict less
waste reduction than will actually occur. They will also choose an inefficient level of effort and less
waste reduction will be done than is optimal.
As discussed earlier, this correlation between misperceptions of efficacy (or difficulty) of waste
reduction and suboptimal waste reduction is a key part of theories that it “pays to be green”. Many
scholars have argued that managers systematically overestimate the difficulty of waste reduction –
particularly with respect to the benefits (Palmer, Oates, & Portney, 1995). The same logic has been

applied in several other theories of x-inefficiency. For example, scholars of lean production have
argued that managers hold too much work-in-process inventory because they overestimate the
difficulty of reducing inventory and underestimate the value of doing so. A similar logic exists in
several other theories of x-inefficiency.
The theory could be best tested by direct access to the managerial mental models of waste reduction
difficulty. A close and far more tractable test is that managers will tend to expect less waste reduction
than actually occurs (i.e. forecast that the facility will produce more waste than actually occurs).
H1: Managers will systematically underestimate the potential for waste reduction.
Mechanisms
Why would these errors in estimation persist over time? If managers are able to learn from past
experience, they should adjust their future predictions until they are unbiased. For underestimation to
continue, managers must respond more strongly to overestimation of waste reductions than
underestimations? Why might this be?
One possible explanation is that predictions of future performance actually become benchmarks
against which performance is measured. If the perceived cost of failing to meet a benchmark is
greater than the benefit of exceeding it, managers may choose to adjust their predictions so as to
increase their chances of success. Why might failing to achieve a goal be more costly than the benefit
of exceeding it by an equal amount? One explanation may be that organizations meet out
punishments for failure that are disproportionate to the rewards they set for success. Consider a
situation where an actor wishes to make an accurate prediction of future improvement. They are
uncertain about future outcomes but they have an unbiased expectation of what these might be (see
Figure 3). If they are penalized equally whether or not they guess to high or too low, they will make
an unbiased prediction. If, however, they are penalized more for error on one side, they will make a
biased prediction. Why might they be penalized more for a biased prediction? In many cases a
prediction that is too high results only in some excess capacity or excess pending, but a prediction that
is too low results in a functional failure. Imagine, for example, making a prediction about how much
water to take on a hike. Too much and the hikers expend unnecessary effort on carrying the water,
too little and they risk heat exhaustion. Such asymmetric penalties are especially likely to occur in

organizations if predictions are used as “goals”. In this case, failure to meet a goal may be punished
more than an equally scaled exceeding of a goal. When accuracy costs are asymmetric, the actor may
adjust his expectations (consciously or unconsciously) to be more pessimistic. This notion is
popularly understood as “sandbagging” or “expectations management”: the process of setting a goal
that one has a good chance of meeting.
This process of biasing expectations would mean that managers would systematically under predict future
improvement. It also suggests that when err on the negative side (failure to meet expectations) they will
adjust future scores more strongly than if they err by exceeding expectations.
H2a: Managers will update future expectations more strongly when they fail to meet a past
expectation than when the overreach a past estimation.
In our discussion above, we assume that an actor is communicating to another person who will administer
penalties for inaccuracy. As recently pointed out by Heath (1999), however, the same logic can be
applied even when an individual is unsupervised. Heath (1999) argues that there are differing cognitive
costs of obtaining or failing to meet self-set goals, and he argues that these asymmetric costs can cause
people to underestimate what they can achieve and set their expectations too low. He suggests that any
predictions of future performance (or goals) divide the space of future outcomes into two regions –gains
and losses. Individuals who meet their goals will see this as a “success” while those that fail to meet them
will see this as a failure. Prospect Theory predicts that losses are perceived to be more painful than gains
even if their magnitudes are equivalent (Kahneman & Tversky, 1979). As a result, individuals who fail to
meet a predicted goal suffer more than they would take pleasure in exceeding the goal. Heath notes that
the implication of loss aversion is that managers will set expectations low so as order to increase the
chance of success.
For instance, if a manager predicts he can increase sales by 10% in the next year, then he will perceive a
gain of only 8% as a failure or loss, while a growth of 12% will be seen as a success or gain. If people
value gains and losses equally then they should make predictions about future performance in an unbiased
manner and the probability of success or loss should be 50%. If, however, managers perceive a 2%
deficit to be more important than a 2% excess then they will tend to make predictions or set goals that
make it more likely they will achieve their goal.

In our specific case, this would suggest that managers should be more likely to predict lower levels of
waste reduction. To avoid feeling disappointed by not meeting their prediction, they downgrade their
prediction to make it more likely they can achieve it. For example, a manager thinks that next year 5% to
10% waste reduction could be achieved. Combining prospect theory and goal setting, we predict he is
more likely to set a goal at 5% waste reduction to prevent self-dissatisfaction.
H2b: Even when self-supervised, managers will update future expectations more strongly when they
fail to meet a past expectation than when the overreach a past estimation.
A final explanation for the failure of managers to adjust to past errors in prediction is that become more
pessimistic over time about the potential for future improvement. Recent research suggests that when
individuals engage in repetitive assignments they become more pessimistic about their own ability. They
discover, in other words, “how much they don’t know” and they doubt that they will be able to continue
to perform well. Scholars suggest that individuals tend to be overconfident in their ability to learn in their
first trial (the predicted degree of learning is greater than the observed one) but become gradually under-
confident in the succeeding trials.
Koriat, Sheffer, and Ma’ayan (Koriat et al., 2002) coined the term “underconfidence-with-practice”
(UWC) for the tendency of people to doubt themselves as they gain more experience. Many mechanisms
have been proposed to explain this effect, although with little explanatory power. Our setting provides a
good opportunity to conduct a large scale test. If UWC is at work, we should expect managers to
overestimate their ability to estimate waste reduction in the first year of their reporting, but then
increasingly underestimate the potential for waste reduction as they gain more experience.
H3: Managers with greater experience will tend to underestimate future waste reduction.
Method
Data
To test our hypotheses, we make use of the US EPA’s Toxics Release Inventory (TRI). Started in 1987,
the TRI data collect information from all facilities that process, manufacture or use any of the 612-listed
chemical in quantities greater than the EPA’s established threshold. And only facilities that have 10 or
more employees are required to report to EPA. The TRI data include not only information on the
chemicals but also facility characteristics, such as location, industry, production changes and the identity

of individuals involved in providing the required information. In 1990 the US congress with the Pollution
Prevention Act expanded the TRI to include additional information on efforts in reducing waste.
Therefore we use TRI data from 1991 until 2005 because this time-window provides reliable and
consistent information about chemical waste generation and source reduction. Our unit of analysis is at
the chemical level, which allows us to use more fine-grained and precise data. This means that we are
able to use a rigorous differences-in-differences test. That is we measure changes in the rate of reduction
of chemical waste each facility produces over time. Our final sample consists of 486,359 observations for
a total of 95,980 plant-chemical-year observations. There are 23,733 facilities and they use or produce on
average 3.5 toxic chemicals.
The TRI data have been used extensively by scholars to measure environmental performance and
efficiency (Berchicci, Dowell, & King, 2012; Freudenberg, 2005; King & Lenox, 2002; King & Lenox,
2000; Klassen & Whybark, 1999; Konar & Cohen, 1997). However, two sections of the TRI have been
largely overlooked by prior research – the identity of the certifiers and technical personnel who report the
information and their predictions for the following year’s waste generation. We make use of these two
relevant sections to test our “underestimation” hypothesis.
The US Environmental protection agency requires managers to report the quantities of waste chemicals
they manage, and these data have been used by many previous researchers. The EPA also requires TRI
techs (and their form certifiers) to predict waste generation not only for forthcoming two years. These
projections are meant to encourage managers to consider their future waste generation and to explore
opportunities for source reduction. They are not used by any federal, state, or local regulator.
Dependent Variable
We will use three dependent variables in our analysis. First, to directly evaluate whether managers
systematically predict too much waste, we will compare their predictions to what actually happened.
Second, to understand how managers adjust these predictions based on whether they met or did not meet
these expectations, we will look at the change in these predictions. Finally, to account for potential
motivational changes, we will predict changes in waste reduction trends.

1) Prediction relative to actual: Our dependent variable captures the difference between the predicted
chemical waste for time t+1 and the chemical waste that was actually generated in time t+1. Managers
make the prediction for t+1 in time t.
To estimate it, we measure total waste that was generated for a given toxic chemical (waste). In a similar
fashion we measure the predicted amount of waste that managers have estimated for the following year.
Our dependent variable captures the difference between a managers’ predictions of future waste output in
t+1 and actual waste generated in t+1 for a given chemical (or chemical mixture) and for a given facility.
(1) 100* Waste
WastePredictedlnactual torelative Prediction
1
1
1
cit
cit
cit
Wastecit+1 is the pounds of waste generated for chemical c by facility i in time t+1. Predicted Wastecit+1 is
the predicted amount for the same chemical c made by managers in time t for t+1. We utilize the
logarithmic transformation of the ratio in equation 1, so that the dependent variable is not bounded by 0
and we multiply the ratio by 100 such that the coefficient will be approximately equivalent to percentage
difference in waste per change in the independent variable. Moreover, the logarithmic form of a ratio
allows us to calculate the difference between the predicted amount and the actual amount since Equation 1
is identical to the log of Predicted Wastecit+1 minus the log of Wastecit+1. Thus, in the analysis that follows,
positive values correspond to an overestimation of waste to be generated in t+1. Or as we suggest in our
first hypothesis positive values are consistent with an underestimation of waste reduction. Negative values
mean that managers predicted less waste related to year t+1 than the actual amount generated in year t+1.
For example, assume one production line in a pharmaceutical manufacturing facility creates 100 lbs of
waste ammonia this year. The manager reports this on the TRI form as current waste (year t) for that line
of business. The facility expects that next year the production of the drug which entails the creation of
waste ammonia will increase of 5% due to market growth. The reporting manager assumes that this will
lead to a proportional increase in waste (5% as well). Thus the manager reports an expectation that next
year’s waste levels will be 105 lbs.
2) Change in predictions: To understand how managers adjust their predictions, we need a second
variable. This variable captures the change in the percentage increase (or decrease) in waste they predict
for year t+1 relative to year t. For example, a manager in year t-1 might predict that the waste level
would increase from the current level (e.g. 100 lbs) by 10% (e.g. 110 lbs) in year t. Then, in year t he or

she might predict that this would increase further to 130 lbs (or 18%). We are interested in comparing
this year’s prediction of an 18% increase to last year’s prediction of a 10% increase.
Change in Predictioncit+1 = lnPredicted Wastecit+1
Wastecit
æ
èç
ö
ø÷- ln
Predicted Wastecit
Wastecit-1
æ
èç
ö
ø÷
é
ëê
ù
ûú *100 (2)
Predicted Wastecit+1 is the predicted amount for the chemical c made by managers in year t for t+1.
Wastecit is the pounds of waste generated for chemical c by facility i in time t.
3) Change in Waste Trends: To understand how waste reduction (or increase) trends are influenced by
our independent variables, we create a final DV. This measure captures the changes in waste trends. For
example, imagine that between year t-1 and year t waste increased from 1000 to 1200 lbs. (ln(1200/1000)
=0.18 ) and further imagine that waste increased from 1200 to 2000 lbs. between year t and t+1
((ln(1200/1000) =0.51). We wish to note the change growing trend in waste growth (0.51-0.18 = 0.33).
Change in Waste Trend:CWTcit+1 = lnWastecit+1
Wastecit
æ
èç
ö
ø÷- ln
Wastecit
Wastecit-1
æ
èç
ö
ø÷
é
ëê
ù
ûú *100 (3)
Mechanisms: Independent variables
Prediction Relative to Actual
To test hypotheses H2, we want to evaluate how a manager in period t might be influenced by his or her
current performance relative to the expectation they set in t-1. This is simply the lagged form of our first
DV. This variable measures whether prior managerial expectations are exceeded (or not) by what
actually happened.
Prediction relative to actual:PRAcit = lnPredicted Wastecit
Wastecit
æ
èç
ö
ø÷ *100 (4)
We also hypothesize that managers may respond to failing to meet a prediction differently than if they
exceed it. We capture this potential difference in two ways. First, we create a binary variable measuring
if previous expectations for the current period t have not been met or have been exceeded.
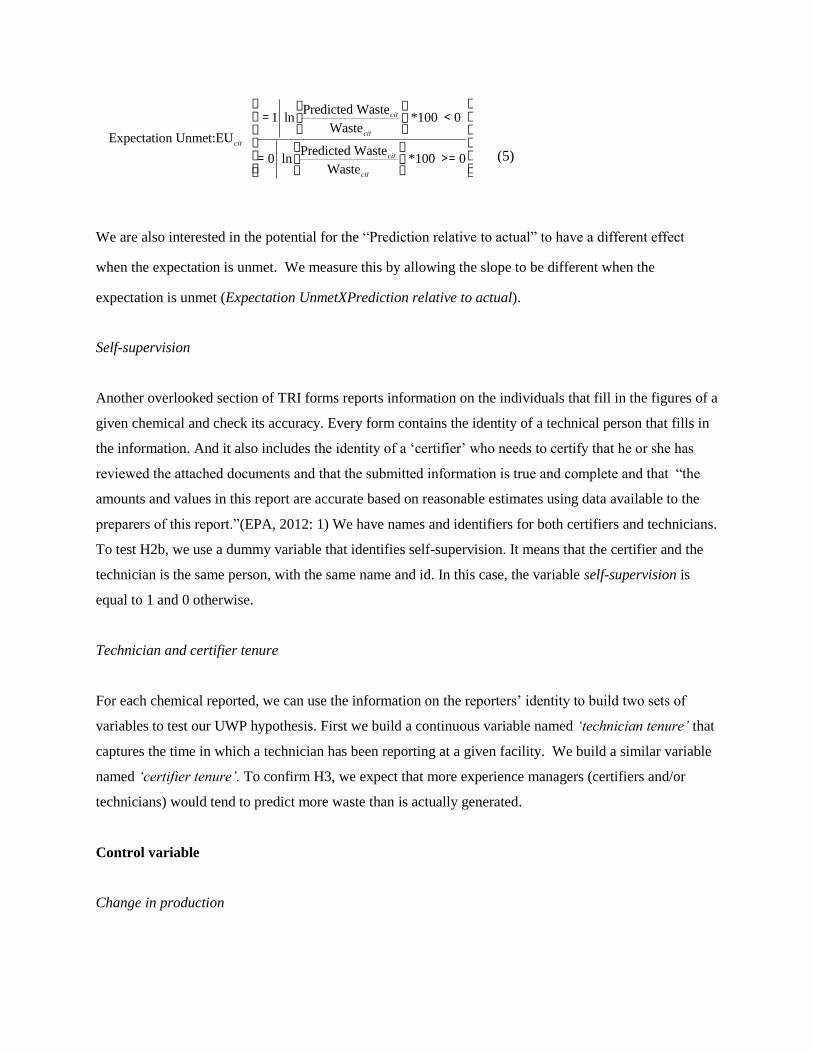
Expectation Unmet:EUcit
=1 lnPredicted Wastecit
Wastecit
æ
èç
ö
ø÷ *100 < 0
= 0 lnPredicted Wastecit
Wastecit
æ
èç
ö
ø÷ *100 >= 0
é
ë
êêêêê
ù
û
úúúúú (5)
We are also interested in the potential for the “Prediction relative to actual” to have a different effect
when the expectation is unmet. We measure this by allowing the slope to be different when the
expectation is unmet (Expectation UnmetXPrediction relative to actual).
Self-supervision
Another overlooked section of TRI forms reports information on the individuals that fill in the figures of a
given chemical and check its accuracy. Every form contains the identity of a technical person that fills in
the information. And it also includes the identity of a ‘certifier’ who needs to certify that he or she has
reviewed the attached documents and that the submitted information is true and complete and that “the
amounts and values in this report are accurate based on reasonable estimates using data available to the
preparers of this report.”(EPA, 2012: 1) We have names and identifiers for both certifiers and technicians.
To test H2b, we use a dummy variable that identifies self-supervision. It means that the certifier and the
technician is the same person, with the same name and id. In this case, the variable self-supervision is
equal to 1 and 0 otherwise.
Technician and certifier tenure
For each chemical reported, we can use the information on the reporters’ identity to build two sets of
variables to test our UWP hypothesis. First we build a continuous variable named ‘technician tenure’ that
captures the time in which a technician has been reporting at a given facility. We build a similar variable
named ‘certifier tenure’. To confirm H3, we expect that more experience managers (certifiers and/or
technicians) would tend to predict more waste than is actually generated.
Control variable
Change in production

As we discussed in the example above, changes in waste generation are related to changes in production
activities. The TRI data include a “production ratio”, which denotes changes of the production activity of
any given chemical from the current year to the next year. We use this variable to control for changes in
production volume since an increase or decrease of production may have a direct effect both on the waste
generated and on its predicted value. We include the natural logarithm of the production ratio in the
analysis multiplied by 100.
Change in production:CIPcit = lnProductioncit
Productioncit-1
æ
èç
ö
ø÷ *100 (6)
where Production volumecit is the amount of the waste generated for chemical c by facility i in time t.
Production ratio captures changes in production activities from year t to year t+1. Positive values
correspond to an increase of these activities in next year relative to the previous year.
Size
We control for the size of the facility as well. Size is the logarithmic form of the number of employees in
a given facility.
Empirical approach
To test hypothesis 1, we conduct several t-tests at the chemical level to examine whether the mean of our
dependent variable Predicted relative to actualcit+1 is different from zero in different conditions. If the
means of the various tests were different from zero, it would suggest that managers tend to overestimate
waste generation. We perform such tests making use of the chemical attributes and facility’s
characteristics. For example, we compare chemicals that are strictly regulated with those that are not or
the “core” chemicals (those chemicals that have been reported since 1987) with the rest.
To investigate the mechanisms and test the remaining hypotheses, we employ a fixed-effect regression at
the facility-chemical level. The nice feature of fixed effect regression is the control for all kind of
unobserved factors that are constant across time such as industry affiliation or location. These constants
can be removed from the equation through differentiating (e.g. first difference). The general model is:

( )
where is Prediction relative to actual, is Expectation unmet, and are certifier
tenure and technician tenure respectively are facility plus chemical fixed effects. The total number
of fixed effects is thus the number of facilities i multiplied the number of chemical c in each facility.
is an error term which is assumed to be independent and identically distributed.
To test hypothesis 2a, we introduce the interaction term
( )
We run two fixed-effect regressions where the is Change in prediction and Change in waste trend.
To test hypothesis H2b we restrict the sample to include observations with self-supervision only.
Therefore the sample drops to XXX observations.
Finally, to test Hypothesis 3 we make use of Predicted relative to actual as our dependent variable. In this
way we can examine whether an increase of tenure time of certifiers and technicians corresponds an
increase in their prediction of more waste relative to the actual waste in year t+1 as UWP theory suggests.
Analysis
Table 1 shows the descriptive statistics of our sample. Figure 4 presents the trends of production
(black line), waste generation (green line), prediction of waste generation (blue line) and the gap
between predicted and actual waste generation (red line). The latter is our first dependent variable,
Predicted relative to actualcit+1. From the graph it is clear that the forecasted waste generation line is
on average always above the actual waste generated line. Therefore the difference between predicted
and actual waste is always positive. The drop in production in 2001 is presumably caused by a period
of recession which began in 2001 and deepened with the September 11 event. It is not a surprise that
the greatest difference between predicted and actual waste is recorded in this year. The overall
picture gives us a preliminary evidence of a systematic overestimation of waste generated.
Table 2 provides a set of one sample t-tests where the null hypothesis states that the mean of our
dependent variable (difference in predicted waste) is equal to zero. In this first table, we run the tests
based on different samples defined by specifications of chemical characteristics. We start with the

full sample – 866,893 observations. The number of observations decreases as we add the next
specification. As shown, we run separate t-tests based on whether the lists of chemicals were
unchanged since 1987 (the ‘core’ chemicals), whether chemicals were part of the Pollution Priority
list, whether the production did not experience significant changes, whether the chemical were
regulated and finally whether the chemicals were recorded with a Form A (for facilities with
relatively low quantities of listed toxic chemicals). Overall, we find that the difference between
predicted and actual waste is always greater than zero. The only exception regards chemicals reported
with Form A. Although the predicted value is significantly lower than the actual value, their
contribution is very marginal since they represent only the 0.006% of the whole sample (52 out of
866,893 observations). Table2a presents additional t-tests with other types of specifications. The first
three specifications refer to the location of the waste treatment (onsite only, offsite only and both
onsite and offsite). The fourth specification includes only those chemicals reported by facilities in
environmentally sensitive industries (such as Mining, Oil & Gas, Chemical, Paper, Metal industries).
Finally the last specification refers to whether a given chemical was handled with source reduction
activities. Again, all our tests suggest that the mean is different from zero and thus the null hypothesis
can be rejected. Overall, we find that managers tend to overestimate the waste generation, giving
strong support for our underestimation hypothesis (H1).
Table 3 presents a series of models that test hypotheses 2a and 2b. All the models are fixed-effect
regressions at the chemical level. The first four models have Change in predictioncit+1 as dependent
variables, whereas from Model 5 to Model 8 the dependent variable is Change in waste trendcit+1.
Model 1 and Model 5 include the control variables only. The coefficient in Change in productioncit+1
is negative and significant suggesting that an increase of production volume from time t to time t+1
corresponds a decrease of change in prediction the predicted waste in t+1 relative to the actual waste
generated in t+1while sizeit seems do to affect neither the dependent variables.
Model 2 introduces Prediction relative to actualcit that captures the error in prediction between what
was predicted for time t and what actually was generated in time t. We estimate a positive coefficient
– suggesting that positive error in prediction (the amount of waste predicted is bigger than the amount
of waste generated) is associated with a similarly signed error in the next period. This suggests that
managerial predictions are sticky and they adjust their estimates only slowly as they get information
about errors in prediction. However, the coefficients are less than 1, suggesting they reduce the error
in the future period.

Similarly, a positive error in prediction corresponds to an increase of change in waste trend in time
t+1 (Model 6). This is surprising, because it suggests that my expectations of additional waste
actually increase when I predicted too much waste in this period. It may be that managers expected a
problem or change which did not happen in a given year and now they are even more certain it will
happen in the following year. And they are usually right! The small coefficients for Prediction
relative to actualcit estimated in the first three models suggest they errors are indeed get smaller.
To test H2a and 2b, we allow both a step change and a slope change for positive and negative
prediction errors. To do this, we include both Expectation unmetcit and its interaction with
Prediction relative to actualcit . Model 3 shows that the interaction term is negative and significant.
To better interpret the result, we plot the interaction in Figure 5. The X-axis is the error in prediction
(Prediction relative to actualcit ) and it ranges between -100% and +100% that corresponds
approximately to one standard deviation below and one above the mean respectively. The blued
dotted line corresponds to Expectation unmetcit equal to one. Figure 4 suggests that failing to meet
expectations in t causes managers to make overly pessimistic predictions (too much waste) for t+1
(the dotted blue line on the right of the plot). Consistent with H2a, we find that managers respond
more strongly to failure to meet expectations than to exceeding them. Indeed, they do not respond at
all to exceeding them (the continuous red line on the left of the plot). Indeed, they again tend to make
erroneously high predictions! This means that when managers make prediction errors in either
direction, they tend to predict too much waste in the next period. This finding has great importance
for explaining systematic x-inefficiency. To test Hypothesis 2b, Model 4 includes only a restricted
number of observations where technicians and certifiers are the same person. Again, we find a
negative and significant effect of the interaction term on our dependent variable. Consistent with H2b,
we find that this correction for prediction is true whether or not the individual making the prediction
oversees his own work. Thus these findings seem to suggest that both our hypotheses 2a and 2b are
supported.
To further understand whether errors in predictions could motive managers to reduce waste
generation, we run Models 6 to 8. The interaction term in Model 7 and Model 8 are negative and
significant. Following the previous approach, we plot the effect graphically. Figure 6 captures the
effect of current errors in prediction on predictions of future waste reduction. The continuous red line
corresponds to a positive prediction error in time t. As the magnitude of positive prediction errors
increases, waste trend increases as well in time t+1. However, when expectations are unmet (the
dotted blue line) changes in waste trend tend to be negative. And this effect could not be fully

explained by a “regression to the mean” effect since the blue line lies above. This result suggests that
failure to achieve goals increases future waste reduction. In other words, managers are more
motivated to find ways to reduce wastes when they fail to reach goals previously set.
Table 4 tests the “underconfidence with practice hypothesis”. We test this hypothesis using Prediction
relative to actualcit+1 as dependent variable, because we are interested in how the tenure of the
reporters influences the error in prediction in time t+1 relative to time t. Model 1 includes the control
variables and Model 2 and Model 3 add technician tenure and certifier tenure respectively. Both of
them are significant and positive. It means that managers that have been reporting a given chemical
for longer time tend to overestimate future waste generation. These findings suggest that our
hypothesis 4 is confirmed. Finally, Model 4 includes all the variables and the direction and
significance of their coefficients are unchanged.
Robustness test
In our previous models the difficulty to predict waste generation may be associated with the difficulty
to predict production volume. This prediction difficulty could be due to the level of uncertainty in
predicting waste generation or even more critically due to inability to obtain reliable information on
the changes in production volume. We run two robustness tests that attempt to reduce this uncertainty
by controlling the changes in chemical production. Our first test restricts the sample by keeping
constant the changes in production as shown in Table 5. Our second robustness test includes only
those cases in which the production volume is unchanged from time t to time t+1 (Table 6). In spite
of the substantial decrease in the number of observations, both tables show that the interaction term
Prediction relative to actualcit X Expectation unmetcit is still negative and significant both for models
with change in predictioncit+1 and for models with change in waste trendcit+1 as dependent variables.
Overall, our Hypotheses 2a and 2b are supported. With regard to Hypothesis 3, we find that the effect
of certifier and technician tenures is less significant. These results suggest that when the level of
uncertainty is lower managers are less subject to “under-confidence with practice” bias.

Discussion
Although preliminary, our findings suggest that managers tend to underestimate opportunities for waste
reduction by predicting too much waste. And they do so systematically under different conditions. This is
an important finding for both the environmental management literature and the broader literature in
business administration. If managers are systematically erring in their estimate, and reporting these errors
repeatedly over time, optimal choice of investment is made much more difficult. As a result, firms might
indeed systematically miss opportunities to be more efficient. Thus our findings provide another solid
empirical support for the causes of systematic x-inefficiency. We also show why these errors may persist
over time. Managers, we show tend to respond to errors in either direction by increasing forecasts of
future waste. And, managers tend to get more pessimistic about the potential for waste reduction as they
become more experienced. Perhaps they believe that they have already found all of the “low hanging
fruit.”
Our paper also contributes to a larger literature on cognitive heuristics and biases. Consistent with recent
theories on goal setting, we find support that managers adjust future predictions more when they fail to
meet expectations than when they exceed them. This result is consistent with theories suggesting that
managers who fail to meet a goal may be sanctioned more than when they are rewarded when they exceed
it. We show that this sense of costly failure is true whether or not the individual setting the goal is self-
supervised. Thus personal perceptions of failure, not organizational penalties, may cause biased
predictions. Consistently, we show that failing to meet a goal may motivate managers to work harder at
reducing waste. Finally we find evidence in support of the “underconfidence with practice” conjecture:
we show that experience on the job may actually make managers more pessimistic about the potential for
further waste reduction.
We hope that the bridges we make between different theories and the new data and methods we uncover
will provide a new direction for research on x-inefficiency. By getting directly at the predictions of
managers, future research may be able to link cognitive heuristics and biases to observed economic
conditions. In future research, we hope to further build the theoretical and empirical structures needed to
advance along this new research path.

Reference
Berchicci L, Dowell G, King A. 2012. Environmental Capabilities and Corporate Strategy: Exploring
Acquisitions Among US Manufacturing Firms (forthcoming). Strategic Management Journal
Cebon PB. 1992. Organizational-Behavior, Technical Prediction and Conservation Practice. Energy
Policy 20(9): 802-814.
Christensen CM. 1997. The innovator's dilemma, when new technologies cause great firms to fail.
Harvard Business School Press
EPA. 2012. TRI report: Form R.http://www.epa.gov/tri/report/ February 2nd, 2012
Freudenberg WR. 2005. Privileged Access, Privileged Accounts: Toward a Socially Structured Theory of
Resources and Discourses. Social Forces 84: 89-114.
Green MJ, Berry JF. 1985. The challenge of hidden profits : reducing corporate bureaucracy and waste
(1st ed.). W. Morrow: New York.
Hart SL, Ahuja G. 1996. Does it pay to be green? An empirical examination of the relationship between
emission reduction and firm performance. Business Strategy and the Environment 5(1): 30-37.
Heath C, Larrick RP, Wu G. 1999. Goals as reference points. Cognitive Psychology 38(1): 79-109.
Kahneman D, Tversky A. 1979. Prospect Theory - Analysis of Decision under Risk. Econometrica 47(2):
263-291.
King A, Lenox M. 2002. Exploring the locus of profitable pollution reduction. Management Science
48(2): 289-299.
King AA, Lenox MJ. 2000. Industry self-regulation without sanctions: The chemical industry's
Responsible Care Program. Academy of Management Journal 43(4): 698-716.
King AA, Lenox MJ. 2001. Lean and green? An empirical examination of the relationship between lean
production and environmental performance. Production and Operations Management 10(3): 244-
256.
Klassen RD. 2000. Exploring the linkage between investment in manufacturing and environmental
technologies. International Journal of Operations & Production Management 20(2): 127-147.
Klassen RD, Whybark DC. 1999. The impact of environmental technologies on manufacturing
performance. Academy of Management Journal 42(6): 599-615.
Kleiner A. 1991. What Does It Mean to Be Green. Harvard Business Review 69(4): 38-47.
Konar S, Cohen MA. 1997. Information as regulation: The effect of community right to know laws on
toxic emissions. Journal of Environmental Economics and Management 32(1): 109-124.

Koriat A, Sheffer L, Ma'ayan H. 2002. Comparing objective and subjective learning curves: Judgments of
learning exhibit increased underconfidence with practice. Journal of Experimental Psychology-
General 131(2): 147-162.
Leibenstein H. 1966. Allocative Efficiency Vs X-Efficiency. American Economic Review 56(3): 392-415.
Lenox M, King A. 2004. Prospects for developing absorptive capacity through internal information
provision. Strategic Management Journal 25(4): 331-345.
Matta E, McGuire J. 2008. Too risky to hold? The effect of downside risk, accumulated equity wealth,
and firm performance on CEO equity reduction. Organization Science 19(4): 567-580.
Palmer K, Oates WE, Portney PR. 1995. Tightening Environmental Standards - the Benefit-Cost or the
No-Cost Paradigm. Journal of Economic Perspectives 9(4): 119-132.
Pil FK, Rothenberg S. 2003. Environmental performance as a driver of superior quality. Production and
Operations Management 12(3): 404-415.
Porter ME, Van der Linde C. 1995a. Green and Competitive - Ending the Stalemate. Harvard Business
Review 73(5): 120-134.
Porter ME, Van der Linde C. 1995b. Toward a New Conception of the Environment-Competitiveness
Relationship. Journal of Economic Perspectives 9(4): 97-118.
Prahalad CK, Hammond A. 2002. Serving the world's poor, profitably. Harvard Business Review 80(9):
48-+.
Russo MV, Fouts PA. 1997. A resource-based perspective on corporate environmental performance and
profitability. Academy of Management Journal 40(3): 539-559.

Figure 1: Direct effect of misperception of waste reduction efficacy on reduction predictions.
Figure 2: Effect of misperception of waste reduction efficacy on waste reduction effort and
reduction predictions.

Figure 3: Effect of asymmetric incentive on goal setting.
0
0.05
0.1
0.15
0.2
0.25
0.3
0.35
0.4
0.45
-7
-6
-5
-4
-3
-2
-1
0
1
-3 -2 -1 0 1 2 3
Pro
bab
ility
of
Re
sult
Pe
nal
ty f
or
Erro
r in
Est
imat
e
Performance Next Year Relative to This Year
Unbiased Accuracy Penalty
Accuracy + Goal Penalty
Goal Penalty
Actual Performance Probability
Perceived probability that minimizes expected penalty
Expected performance
adjusted down.

Figure 4: Trend in production, waste generation and expectation of waste generation.
-0.2
-0.15
-0.1
-0.05
0
0.05
0.1
0.15
0.2
1991 1993 1995 1997 1999 2001 2003
Log R
atio
Year
Production Forecast Generation Difference in predicted waste

Figure 5: Effect of current prediction error on future prediction
Figure 6: Effect of current prediction error on future waste reduction
0%
1%
2%
3%
4%
5%
6%
7%
8%
9%
-100% -80% -60% -40% -20% 0% 20% 40% 60% 80% 100%
Pre
dic
tie
d r
ela
tive
to
act
ual
was
te (
fo
r t+
1 r
el
t )
Error in Prediction (+ Prediction >actual)
Errors in current
predictions in either
direction cause a
predicted increase in
-150%
-100%
-50%
0%
50%
100%
150%
-100% -80% -60% -40% -20% 0% 20% 40% 60% 80% 100%
Ch
an
ge
in w
ast
e tr
en
d
( t+
1 r
el
to t)
Error in Prediction (+ Prediction > actual)
Regression to the
mean is mitigated
when current
predictions were too
low. This suggests
failure to achieve goal
increases future
reductions.

Table 1. Descriptive statistics (486, 359 observations)
Variable Mean
Std.
Dev. Min Max 1 2 3 4 5 6 7 8 9
1
Prediction relative to
actualcit+1 5.6 117.1 -1545.4 1721.6 1
2 Change in predictioncit+1 -1.3 65.9 -1810.9 2006.1 0.14 1
3 Change in waste trendcit+1 -8.3 172.5 -2975.8 2914.1 -0.67 0.30 1
4 Change in productioncit+1 1.2 42.7 -460.5 690.7 0.01 -0.07 -0.11 1
5 Sizeit 5.1 1.6 0.69 10.3 0.00 0.00 0.00 -0.01 1
6
Prediction relative to
actualcit
-1.4 108.3 -1541.3 1727.5 -0.07 0.01 0.68 -0.12 0.01 1
7 Expectation unmetcit 0.5 0.5 0 1 0.03 -0.01 -0.34 0.14 0.00 -0.50 1
8 Technician tenurecit 3.2 2.4 1 14 0.00 0.00 0.01 -0.02 -0.01 0.02 -0.02 1
9 Certifier tenurecit 2.8 2.1 1 14 0.00 0.00 0.01 -0.02 -0.08 0.02 -0.02 0.40 1
10 Self-supervisionit 0.1 0.3 0 1 0.00 0.00 0.00 0.00 -0.17 0.00 -0.01 0.08 0.11

Table 2: One Sample T-tests. Each specification is added to the prior one.
T-test Mean != 0
Prediction Core
chemicals
t obs All
chemicals
t obs
ln(predicted waste t+1/
waste t+1) Full sample 5.04*** 32.7 646,803 5.06*** 37.2 866,893
Chemical not in
the pollution
priority list
6.49*** 33.5 383,632 6.81*** 40.4 536,202
And changes in
production from
last year smaller
than 10%
4.6*** 25.71 449,547 4.57*** 29.7 646,996
And not
regulated 4.1*** 15.6 194,146 3.93*** 17.5 281,209
Form A ONLY 4.43*** 2.5 3,802 3.39** 2.3 6,129
Standard errors in parentheses * p<0.10 ** p<0.05 *** p<0.01
Table 2a: One sample t-tests.
T-test Mean != 0
Prediction Core
chemicals
t obs All
chemicals
t obs
ln(predicted wastet+1/
wastet+1)
Onsite only 6.06*** 14.63 110,351 6.56*** 20.23 178,170
Offsite only 4.66*** 17.11 197,224 4.89*** 19.51 245,826
Both onsite and
offsite 9.24*** 39.61 253,070 9.70*** 44.63 308,726
Environmentally
sensible
industries
3.45*** 15.16 321,304 3.64*** 18.36 436,620
Source
reduction
activities
4.5*** 13.97 130,276 4.59*** 15.63 161,266
Standard errors in parentheses * p<0.10 ** p<0.05 *** p<0.01

Table 3. Fixed-effect regressions. Teting hypothesis 2 and 2a
Change in
predictioncit+1
Change in
predictioncit+1
Change in
predictioncit+1
Change in
predictioncit+1
Change in
waste
trendcit+1
Change in
waste
trendcit+1
Change in
waste trendcit+1
Change in
waste
trendcit+1
Self-
supervisionit
only
Self-
supervisionit
only
Variable Model 1 Model 2 Model 3 Model 4 Model 5 Model 6 Model 7 Model 8
Change in
productioncit+1 -0.137*** -0.136*** -0.133*** -0.127*** -0.573*** -0.140*** -0.135*** -0.126***
(0.003) (0.003) (0.003) (0.008) (0.007) (0.005) (0.005) (0.014)
Sizeit 0.142 0.140 0.171 0.268 -0.651 -0.667* -0.597 -2.625*
(0.213) (0.213) (0.212) (0.897) (0.556) (0.382) (0.379) (1.563)
Prediction
relative to
actualcit
0.007*** 0.081*** 0.134***
1.212*** 1.381*** 1.415***
(0.001) (0.002) (0.006)
(0.002) (0.003) (0.010)
Expectation
unmetcit
0.424 0.255 0.182
2.012*** 1.631*** 1.797
(0.259) (0.258) (0.758)
(0.464) (0.461) (1.321)
Prediction
relative to
actualcit X
Expectation
unmetcit
-0.140*** -0.215***
-0.315*** -0.310***
(0.003) (0.008)
(0.005) (0.014)
Year Dummies Yes Yes Yes Yes Yes Yes Yes Yes
Constant -1.947* -2.123* -5.797*** -5.990 -3.225 -4.265** -12.549*** -3.676
(1.166) (1.171) (1.169) (4.163) (3.037) (2.097) (2.088) (7.251)
Observations 486359 486359 486359 64371 486359 486359 486359 64371
R-sq 0.006 0.006 0.014 0.024 0.016 0.535 0.541 0.549
Standard errors in parentheses
* p<0.10 ** p<0.05 *** p<0.01

Table 4. Fixed-effect regressions. Teting hypothesis 3
Prediction relative to actualcit+1
Model 1 Model 2 Model 3 Model 4
Change in
productioncit+1 0.060*** 0.061*** 0.061*** 0.061***
(0.004) (0.004) (0.004) (0.004)
Sizeit 0.637* 0.547 0.485 0.452
(0.344) (0.344) (0.344) (0.344)
Technician tenurecit
1.060***
0.731***
(0.102)
(0.108)
Certifier tenurecit
1.373*** 1.118***
(0.111) (0.118)
Constant -3.504* -4.976*** -5.065*** -5.790***
(1.818) (1.823) (1.822) (1.825)
Year Dummies Yes Yes Yes Yes
Observations 584542 584542 584542 584542
R-sq 0.001 0.002 0.002 0.002
Standard errors in parentheses
* p<0.10 ** p<0.05 *** p<0.01

Table 5. Robustness test: constant change in production.
Change in predictioncit+1 Change in waste trendcit+1 Prediction relative to actualcit+1
Self-
supervisionit
only
Self-
supervisionit
only
Model 1 Model 2 Model 3 Model 4 Model 5 Model 6 Model 7 Model 8 Model 9
Change in
productioncit+1 0.001 0.000 -0.023 -0.056* -0.056* -0.135 0.052* 0.053* 0.052*
(0.018) (0.018) (0.044) (0.033) (0.033) (0.090) (0.031) (0.031) (0.031)
Sizeit 0.185 0.469 -0.604 -2.422 -1.904 -2.051 2.836 2.860* 2.848
(1.004) (0.995) (2.970) (1.830) (1.814) (6.075) (1.737) (1.737) (1.738)
Prediction
relative to
actualcit
0.010** 0.130*** 0.141*** 1.277*** 1.496*** 1.393***
(0.004) (0.007) (0.016) (0.008) (0.013) (0.032)
Expectation
unmetcit -4.099*** -3.838*** -3.493 1.979 2.455 7.421
(1.059) (1.050) (2.428) (1.930) (1.913) (4.967)
Prediction
relative to
actualcit X
Expectation
unmetcit
-0.212*** -0.262*** -0.386*** -0.018
(0.010) (0.022) (0.018) (0.045)
Technician
tenurecit
0.233
0.275
(0.503)
(0.526)
Certifier
tenurecit
-0.063 -0.143
(0.500) (0.523)
Year
Dummies yes yes yes yes yes yes yes yes yes
Constant -2.674 -9.473* -2.957 8.717 -3.653 11.161 -13.069 -11.763 -12.755
(5.412) (5.375) (14.325) (9.866) (9.797) (29.303) (9.565) (9.444) (9.634)
Observations 54337 54337 9298 54337 54337 9298 55528 55528 55528
R-sq. 0.002 0.020 0.551 0.559 0.040 0.596 0.002 0.002 0.002
Standard errors in parentheses * p<0.10 ** p<0.05
*** p<0.01

Table 6. Robustness test: Change in production is equal to zero.
Change in predictioncit+1 Change in waste trendcit+1 Prediction relative to actualcit+1
Self-
supervisionit
only
Self-
supervisionit
only
Model 1 Model 2 Model 3 Model 4 Model 5 Model 6 Model 7 Model 8 Model 9
Sizeit -0.043 0.144 -0.764 -1.691 -1.273 -1.957 1.034 1.017 1.033
(1.244) (1.238) (4.099) (2.219) (2.201) (7.469) (1.997) (1.997) (1.997)
Prediction
relative to
actualcit
0.026*** 0.115*** 0.247*** 1.286*** 1.485*** 1.570***
(0.005) (0.008) (0.023) (0.009) (0.014) (0.043)
Expectation
unmetcit
0.184 0.171 0.550 4.395* 4.368* 6.964
(1.313) (1.306) (3.531) (2.341) (2.322) (6.436)
Prediction
relative to
actualcit X
Expectation
unmetcit
-0.160*** -0.272*** -0.356*** -0.352***
(0.011) (0.032) (0.020) (0.059)
Technician
tenurecit
0.878*
0.523
(0.525)
(0.583)
Certifier
tenurecit
1.120** 0.878
(0.563) (0.624)
Year
Dummies yes yes yes yes yes yes yes yes yes
Constant -0.960 -6.630 -1.183 3.680 -8.967 -2.728 -11.707 -11.802 -12.715
(6.743) (6.720) (19.584) (12.028) (11.950) (35.689) (10.437) (10.412) (10.461)
Observations 42770 42770 6320 42770 42770 6320 54072 54072 54072
R-sq. 0.003 0.013 0.053 0.580 0.587 0.573 0.003 0.003 0.003
Standard errors in parentheses * p<0.10 ** p<0.05
*** p<0.01

Appendix 1: Simple analysis of endogenous effort choice and expectations of waste reduction.
This simple model assumes that the marginal benefit of waste reduction ( – ) is a and the
marginal cost of waste redcution ( ) are both linear where and A > 0. People
also have a perceived marginal cost of waste reduction PX and that P > 0.
We assume people pick a total effort level to exert on waste reduction based on their perceive
costs and real benefits. They then exert this effort level but achieve waste reduction according
the actual marginal cost of waste reduction. Figure A.1. show the basic setup.
Figure A.1
Assumptions:
–
The planned effort is thus:
(
)
The actual waste reduction level is thus:
(
)

Note that actual wastereduction is greater than expected waste reduction if:
(
)
or
The optimal waste reduction is:
And that actual waste reduction <than optimal wast reduction when
(
)
(
)
When is small relative to A or P, this approximates:
So, the theory that missed waste reduction opportunities will be caused by perceptions that waste
reduction is more difficult than it actually is will hold when the marginal benefit of waste
reduction is relatively constant, but the cost of performing waste reduction is increasing.