do news consumers want explanations for personalized … · do news consumers want explanations for...
TRANSCRIPT
Do News Consumers Want Explanations for Personalized NewsRankings?
Maartje ter Hoeve∗University of Amsterdam
Amsterdam, The [email protected]
Mathieu HeruerBlendle
Utrecht, The [email protected]
Daan OdijkBlendle
Utrecht, The [email protected]
Anne SchuthBlendle
Utrecht, The [email protected]
Martijn SpittersBlendle
Utrecht, The [email protected]
Maarten de RijkeUniversity of Amsterdam
Amsterdam, The [email protected]
ABSTRACTTo gain more insight in the question whether personalized newsrecommender systems should be responsible for their recommen-dations and transparent about their decisions, we study whethernews consumers want explanations of why these news articles arerecommended to them and what they find the best way to explainthis. We survey users of Blendle’s news recommendation system,and from 120 respondents we learn that news consumers do wantexplanations, yet do not have a very strong preference for howexplanations should be shown to them. Moreover, we perform anA/B test that shows that the open rate per user does not change ifusers are provided with reasons for the articles recommended forthem. Most likely this is because users did not pay attention to thereasons.
CCS CONCEPTS• Information systems → Personalization; Recommender sys-tems; Relevance assessment; Presentation of retrieval results;
KEYWORDSNews recommendation; Transparency; Explainable models
1 INTRODUCTIONThe European Union has approved the General Data ProtectionRegulation (GDPR) on April 14, 2016. The GDPR will be enforcedon May 25, 2018, and states, amongst others, that one needs tobe able to explain algorithmic decisions. At the time of writing(mid 2017), the broader implications of this regulation are not clear,but there does seem to be a broadly accepted view that citizens ina transparent society are entitled to explanations of technology-driven processes, especially as algorithmic decisions increasinglyinfluence our daily life. To which degree do citizens actually care∗Research performed while intern at Blendle.
Additional authors: Ron Mulder (Blendle, [email protected]), Nick van derWildt (Blendle, [email protected]).
This article may be copied, reproduced, and shared under the terms of the CreativeCommons Attribution-ShareAlike license (CC BY-SA 4.0).FATREC 2017, August 31, 2017, Como, Italy© 2017 Copyright held by the owner/author(s).ACM ISBN .https://doi.org/10.18122/B24D7N
about this? That is, are people who base their decisions and liveson the outcomes of algorithmic decisions, interested in receivinginformation on why a decision was made for them?
One area in which transparency and explainability are particu-larly important is news, both concerning news content and concern-ing the technology used to expose citizens to news (e.g. [2, 5, 11]).We focus on one aspect of technology that helps to expose citizensto news: news search and recommendation. Increasingly, news con-sumers use personalized services to consume news, often based onalgorithmic or mixed algorithmic/editorial selections (e.g. [4, 6]).These personalized services determine to a large extent what newsitems their consumers read. It is tempting to state that these ser-vices should take their responsibility and be transparent about theirchoices by explaining their decisions to their users. However, doconsumers of personalized news services care about explanationsof the way in which their personalized selections were determined?We study this question in the setting of Blendle,1 a Dutch start-upbacked by amonst others The New York Times. Every day, Blendleusers receive a personalized selection of news articles, selectedbased on a number of features that capture their reading behav-ior and topical interests. On top of this, Blendle users also receivea number of must reads every day; these articles are selected byBlendle’s editorial staff and are the same for everyone. This is oneof the ways to prevent users ending up in their own filter bubble.Blendle allows users to purchase a single news article instead ofhaving to buy an entire newspaper (using micropayments) or to pre-pay via a subscription for their personal selection (called BlendlePremium). Users have the possibility to receive a refund for anarticle if they are not satisfied with it.
We have three research questions. Firstly, we investigate whetherusers would like to see explanations about why they see the ar-ticles selected for them. Secondly, we study what users find thebest way to receive these explanations. Thirdly, we would like toknow whether users open more articles if they are provided withexplanations. In answering these research questions, our findingscontribute to our understanding of the urge that news consumersfeel to read articles from a transparent news recommender system,and because of this, to what extent news recommender systems
1http://www.blendle.com

FATREC 2017, August 31, 2017, Como, Italy M. ter Hoeve et al.
should be accountable for their decisions. More broadly, our find-ings contribute to our understanding of how explainability can beoperationalized.
2 RELATEDWORKTintarev andMasthoff [12] list seven possible aims when explainingthe outcomes of an algorithm to users: transparency, scrutability,trust, effectiveness, persuasiveness, efficiency and satisfaction. Viget al. [13] describe two explanation styles: justifications and descrip-tions. Justifications are focused on providing conceptual explana-tions that do not necessarily expose the underlying structure of thealgorithm, whereas descriptions are meant to do exactly that. Sev-eral studies have investigated the explainability of recommendersystems and the effects of adding explanations to the system (e.g.[1, 3, 8–10]). A number of these studies use collaborative filteringas recommendation technique [1, 3]. Collaborative filtering hasbeen proven to be difficult to use for news recommendations dueto what is known as the cold start or first rater problem [7, 14]. I.e.,a news article needs to be recommended right after its release. Atthat moment the article has not been read yet and for this reasonno information that can be used for collaborative filtering is knownyet. In particular, Herlocker et al. [3] investigate the addition ofexplanations to the recommender system of MovieLens, that usescollaborative filtering as its recommendation technique. Users ofMovieLens answer positively to the question whether they wouldlike to see explanations added to the recommender system. Thisstudy differs from our study in its domain (i.e. news recommen-dations as opposed to movie recommendations), the underlyingrecommender system and because of that, the explanations thatcan be used (the aforementioned collaborative filtering) and it datesfrom the year 2000, whereas the recommender system researchfield has not been static since then. Several studies show that usersare sensitive to the way explanations are shown [1, 9]. E.g., Bil-gic and Mooney [1] find that users are more accurately able todecide which items are relevant for them based on “key-word style”explanations (a content based approach: which other items theyinteracted with before contain similar words) than on “neighbour-hood style” explanations (how similar people rated this particularitem).
3 RESEARCH QUESTIONS AND DESIGNWe address the following research questions: (RQ1) Do users wantto receive explanationswhy particular news items are recommendedto them? (RQ2) What way of showing news recommendations dousers prefer? (RQ3) Do users open more articles if we provide expla-nations of why users see these articles? To answer these researchquestions, we design two experiments: a user study to answer RQ1and RQ2 and an A/B test to answer RQ3. Both are detailed below.
3.1 User studyOur user study investigates whether users find it helpful to receiveexplanations about why particular news articles are selected forthem and how they would like to see these explanations.
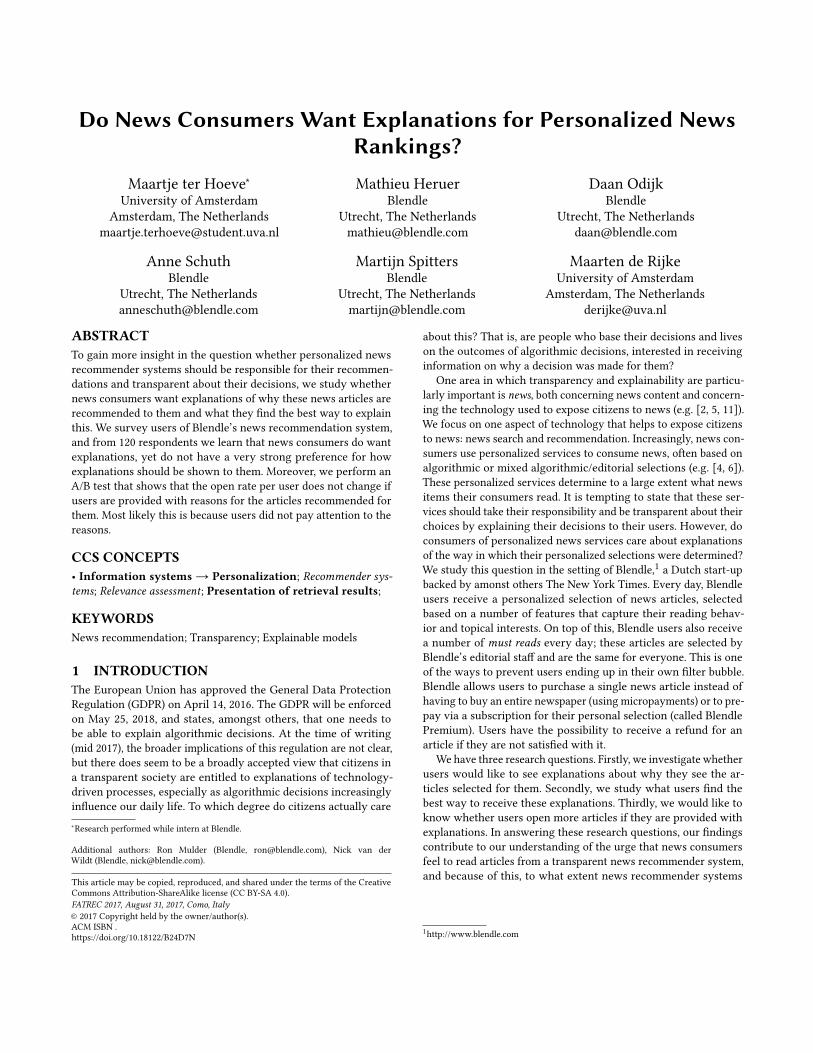
We designed five different types of reasons to explain our rec-ommendations, to be judged by participants in the study. Table 1summarizes all five reason types. Visible reasons are reasons that
Table 1: Reason types used in the user study.
Reason type Example
1. Single reason, visible Because you like politics2. Single reason, invisible Because you like this author3. Multiple reasons, visible Because you like politics and
long articles4. Multiple reasons, combined Because you like De Tijd and
this author5. Bar chart See Figure 1e
can be found on the card (e.g., the topic or the length of the article),invisible reasons are reasons that cannot be found on the card itself(e.g., the author). Figure 1 shows examples of items that were shownto participants.
Figure 2: Example interface of the questionnaire, for a singlequestion. Judgment at the top (Q4, see Table 2).
We sent out an email questionnaire to a selection of Blendleusers, 541 in total. Approximately two third of these users had aBlendle Premium subscription at the time of sending. The rest ofthese users used the micropayment system, but had used BlendlePremium at least once, for example via a free trial that lasted forone week.
Participants were shown three different types of explanations(“reason types”) and subsequently asked to answer five questionsper type. To limit the length of the survey, participants are asked tojudge three types of explanations, out of the five described above.Figure 2 shows an example of the interface of the questionnaire. Tomake sure the results are not biased by the type or content of anarticle, three different articles were considered: 179 users were sentthe first article, 180 users were sent the second, and 182 users weresent the third article.
Explanations for Personalized News Ranking FATREC 2017, August 31, 2017, Como, Italy
(a) Single reason, visible – “Because youlike reading about politics."
(b) Single reason, invisible – “Because youlike long reads and tech."
(c) Multiple reasons, visible – “Becauseyou often read from this author."
(d) Multiple reasons, combined – “Becauseyou follow De Tijd and read from theseauthors more often."
(e) Bar chart – “Selected for you based on:Author(s): Maarten Keulemans;Publication: De Volkskrant; Topic: Tech"
Figure 1: Examples of reason types as shown to users in our user study. Textual reasons are in the lines that start with “Omdat"(because). For the bar chart layout the reasons starts with “Voor jou gekozen" (selected for you). Translations are given beloweach article.
Table 2: Questions used in the questionnaire as part of our user study.
Type Question asked (English translations of the Dutch questions)
Q1. Wants reasons? On the figure below you can see what an article currently looks like on Blendle Premium. The articles that yousee are chosen based on your personal preferences and what you like to read. Imagine we would give you moreinformation about why we chose a certain article for you. Would you find that useful?
Q2. Transparency I understand the way that is used to explain why I see this article.
Q3. Sufficiency I get enough information to decide whether I would like to read this article.
Q4. Trust The reason why I see this article, makes me trust the algorithm that selected this article for me.
Q5. Satisfaction I am satisfied with the way in which this article is shown to me.
FATREC 2017, August 31, 2017, Como, Italy M. ter Hoeve et al.
Note that users were not sent the entire article, but only theintroduction card to the article. This article card contains a picture,a brief introduction to the article, the name of the newspaper or themagazine, a topic, the approximate reading time of the article, howmany people liked the article and the reason type. The card func-tions to give the news consumer a brief introduction to the articleto decide whether he or she would like to read it. Figures 1a, 1b, 1cshow the three different types of article cards that are used. Notethat users are randomly divided over all three article types and overreason types. That is, no personalization was used here. We did not,however, completely randomize the order in which participantsanswer questions. First, users are either shown reason type 1 or 2,then 3 or 4. All users are shown reason type 5, as reason type 5 isvery different from the other reason types. In three final questionsparticipants are asked to fill in their age and gender and whetherthey would like to add some final remarks (if any).
The questions that were asked for each participant are detailed inTable 2. First, we ask participants whether they would find explana-tions useful and we ask them to choose between yes, somewhat, noor I don’t know as possible answers. We then show several examplesof explanations and ask participants to judge the examples on fourTintarev and Masthoff [12]’s dimensions: transparency, sufficiency,trust and satisfaction, all on a five point scale. We decided to omitquestions on Tintarev and Masthoff [12]’s scrutability, efficiencyand effectiveness as metrics at this stage of our research, as partici-pants are not confronted with their own personal selection of news.For this reason, they will not be able to reliably judge whether theywould open this article. Note that if participants have selected noor I don’t know as a reply to whether they would like explanations,we tell them we would still like to show them some possible waysof explaining their articles and ask for their judgment.
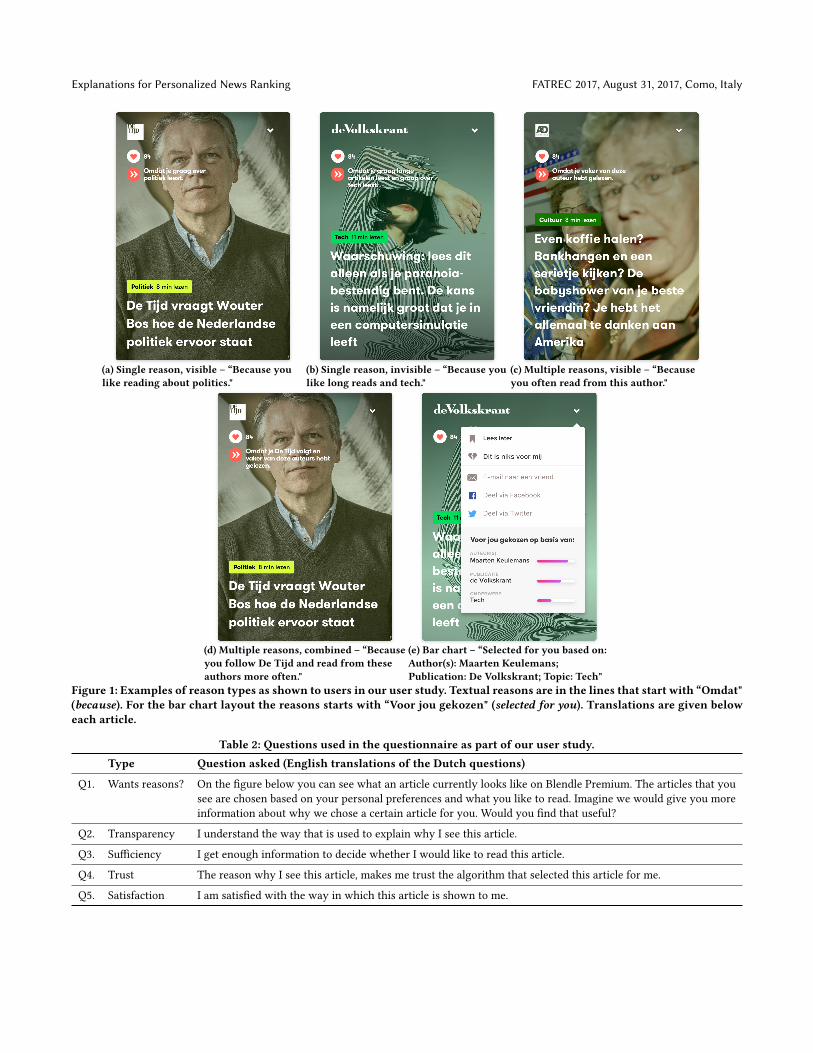
3.2 A/B testIn order to investigate whether users open more articles whenthey are provided with reasons of why they see these articles, weperform an A/B-test with two groups of Blendle users. Users arerandomly assigned to a group. One of these groups is providedwith explanations for the articles they see. The other group doesnot receive any explanations. Both groups are real Blendle users,i.e., we do not use an artificial experimental setting, but use theevery day Blendle environment. The reasons shown to users inthe “treatment group” are created heuristically. That is, we use ajustification instead of an actual description in the sense of [13]. Inour experiment, we use textual justifications. Two examples aregiven in Figure 3; the justifications are provided at the top of thearticle card, in the black boxes that pop up once a user has hoveredover the “i” icon. This is different from the reasons tested in theuser study, as we decided to launch a change in design that was assmall as possible. All reasons are given in Table 4.
We run the A/B test for 24 days on 100% of our users.2 As ourobjective, we measure the open rate, per day in each group.
In this study we define open rate as the number of reads overthe number of users. We define the number of reads as the numberarticles that are opened by a user, without them asking for a refund.
2For competitiveness reasons we cannot reveal the size of the control and treatmentgroups.
(a) Example reasons 1 – “Becauseyou are interested in longinterviews and Culture”.
(b) Example reasons 2 –“Because you seem to likelonger articles".
Figure 3: Example reason types used during the A/B test.
Table 3: Participant answers to Q1: Would you like to seemore information on why articles are selected for you?
User wants reasons Times answered
Yes 65Somewhat 24No 26I don’t know 5
If users open an article multiple times (over any number of days),we only count the first time. The number of users is defined as thenumber of unique users that viewed their selection.
We test for differences in open rate between the two groups usinga two-tailed paired t-test with α = 0.05. Samples from both groupson one day form a pair. We discretize by days as news consumptionvaries over time. For the “reason group” we also count whetherusers have actively seen reasons, that is, hovered over the “i” icon.Moreover, we track whether users have seen reasons within twominutes before opening the article and if so, which reason that was.
4 RESULTS AND DISCUSSIONHere we answer our research questions. The first two questionsare answered in Sections 4.1 and 4.2 by analyzing the results ofour user study. In Section 4.3 we use the results of our A/B test toanswer the last question.
A total of 120 users filled out our survey, of which 41 answeredquestions about the first article type, 36 about the second and 43about the third article type. Of these 120 users, 103 users had aBlendle Premium subscription, while 17 users used the micropay-ment system at the time of sending out the survey. As there are notenough responses of non-premium users to put them in a separategroup, we perform our analysis on all respondents together.
4.1 Do users want recommendation reasons?Table 3 shows the results of what users answered to the questionwhether they would like to see better explained why they see ar-ticles in their selection. The significant majority answered yes orsomewhat to this question, if compared to the number of peoplethat answered no or I don’t know (χ2 = 14.55,p < 0.001).
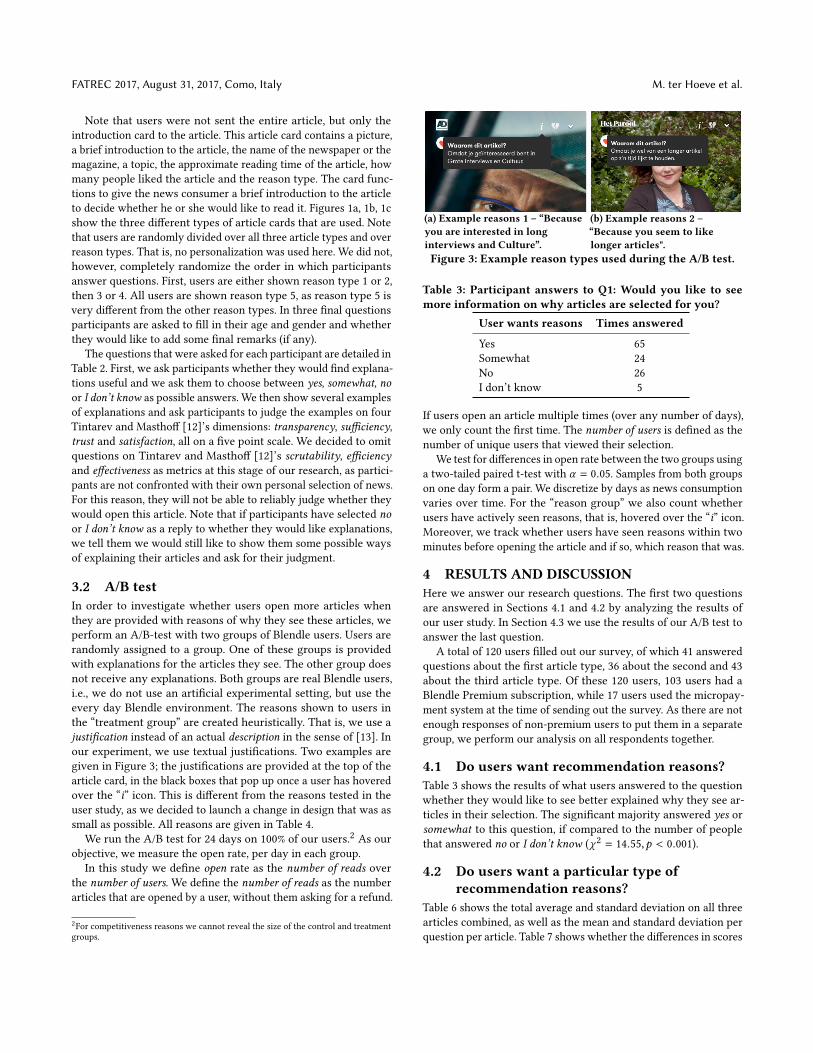
4.2 Do users want a particular type ofrecommendation reasons?
Table 6 shows the total average and standard deviation on all threearticles combined, as well as the mean and standard deviation perquestion per article. Table 7 shows whether the differences in scores

Explanations for Personalized News Ranking FATREC 2017, August 31, 2017, Como, Italy
0 5 10 15 20 25
−10
0
10
Days
Liftover
baselin
e(%)
Figure 4: Lift in open rate for the group with recommenda-tion reasons over the baseline without reasons.
for the different types of questions are statistically significant ornot. As the answers are independent, yet not necessarily sampledfrom the normal distribution, we use the two-sided Mann-WhitneyU test, with α = 0.05 as significance level. The sample sizes can befound in Table 5. From these results a few points stand out. Firstof all, although users do want more information about why theysee a certain article, the results do not show a clear preference asto which type of explanation users prefer. Only a few differenceswere significant (shown in boldface in Table 7). However, whenwe correct for the number of comparisons that we make, and takeα = 0.001 as significance level (using the Bonferroni correction anddividing our original α by 50, the number of comparisons that wemake), none of the reason types scores significantly higher thananother reason type. Another interesting point to make is that thestandard deviations of the scores on the fifth reasoning type are,on average, bigger than the standard deviations of the scores onthe other reasoning types, i.e., users either seem to like this way ofshowing reasons, or they do not.
4.3 Do users open more articles when providedwith explanations?
In our A/B test, after 24 days, we see that users that were shownthe recommendation reasons (the “reason group”) have a lift inopen rate of 0.33%. This difference is plotted in Figure 4 and is notsignificant (t = −0.29,p = 0.77).
Of all individual users in the reason group, 9.8% has seen at leastone recommendation reason. Of all users who opened an article,1.08% had seen the recommendation reason within two minutesbefore they opened that particular article. These users saw 1.27reasons on average, with a standard deviation of 0.73. That is, notmany users saw the reasons, which explains why we do not observea difference in open rate per user between the two groups. Different,more prominent designs, may yield different results.
Figure 5 shows how often users saw each particular reason, incomparison to the total number of times users saw a reason. Reasontype 6 is seen most often. This is the explanation that is given forthemust-reads, i.e., not based on any form of personalization. Thesemust-reads are on top of the user’s page, which can bias theseresults.
1 2 3 4 5 6 7 8 90
20
40
Reasons
Percentage
reason
was
clicked
Figure 5: Reasons clicked before opening the article, see Ta-ble 4 for mapping.
Table 4: Reason mapping for reasons used in A/B test.
Number Reason
Reason 1 Because you often read about TOPICReason 2 Because you are interested in TOPICReason 3 Because we think NEWSPAPER could be interesting
for youReason 4 The editors really liked this pieceReason 5 Because you follow NEWSPAPERReason 6 According to the editors, this is one of the best stories
of the day. No matter your preferencesReason 7 Because you often read from NEWSPAPERReason 8 Because you seem to like a long read every now and
thenReason 9 Because you often read from AUTHOR
Table 5: Sample sizes per reason type
Type 1 Type 2 Type 3 Type 4 Type 5
66 56 63 55 120
5 CONCLUSIONIn this study we investigated whether news consumers would liketo receive explanations about why articles were selected for theirpersonalized selections of news articles. We also investigated howthey would prefer to receive these explanations. Moreover, westudied whether news consumers open more articles, if they areprovided with reasons.
Our questionnaire showed that a large majority of the respon-dents would like to receive these explanations, yet they do notshow a clear preference as to how they would like to see these. OurA/B test shows that the open rate per user does not increase byadding explanations. In fact, in many cases, users do not read thethe explanations.
More broadly, our research shows that users nowadays still at-tach importance to explanations of algorithmic decisions broaderthan the domain described in [3] and it motivates us to strive fortransparent, responsible and accountable recommender systems.
Even though we tested several designs for explanations in ourquestionnaire, the number of options that we were able to expose toour participants was limited. It could very well be that alternativedesigns would be preferred by news consumers.
FATREC 2017, August 31, 2017, Como, Italy M. ter Hoeve et al.
Table 6: Mean and standard deviations of the scores on different types of judgments in the user study. The “reason types” referback to the types of reason listed in Table 1.
Reason type 1 2 3 4 5
Question Mean Std Mean Std Mean Std Mean Std Mean Std
Transparency 3.697 1.141 3.786 1.129 3.587 1.107 3.873 1.096 3.650 1.339Sufficiency 3.530 1.076 3.625 1.028 3.333 1.098 3.764 0.953 3.408 1.275Trust 3.000 1.115 3.250 1.122 3.032 1.023 3.400 0.984 3.500 1.258Satisfaction 3.606 0.919 3.661 0.969 3.317 1.096 3.582 1.073 3.233 1.327Average 3.458 0.798 3.580 0.836 3.317 0.916 3.655 0.798 3.448 1.154
Table 7: Statistical differences between reason types, between different questions.Type 2 Type 3 Type 4 Type 5
Type 1Transparency U = 1811.0,p > 0.05 U = 2059.0,p > 0.05 U = 1597.0,p > 0.05 U = 3858.0,p > 0.05Sufficiency U = 1868.0,p > 0.05 U = 2147.5,p > 0.05 U = 1571.5,p > 0.05 U = 4005.0,p > 0.05Trust U = 1860.5,p > 0.05 U = 2016.5,p > 0.05 U = 1512.0,p > 0.05 U = 3001.0,p < 0.05Satisfaction U = 1748.0,p > 0.05 U = 2347.0,p > 0.05 U = 1740.0,p > 0.05 U = 4304.0,p > 0.05Average U = 1684.0,p > 0.05 U = 2257.5,p > 0.05 U = 1591.0,p > 0.05 U = 3848.0,p > 0.05Type 2Transparency U = 1838.5,p > 0.05 U = 1422.5,p > 0.05 U = 3404.0,p > 0.05Sufficiency U = 1899.5,p > 0.05 U = 1397.0,p > 0.05 U = 3529.0,p > 0.05Trust U = 1938.0,p > 0.05 U = 1472.0,p > 0.05 U = 2900.0,p > 0.05Satisfaction U = 2038.5,p > 0.05 U = 1523.0,p > 0.05 U = 3734.5,p > 0.05Average U = 2041.0,p > 0.05 U = 1493.0,p > 0.05 U = 3505.0,p > 0.05Type 3Transparency U = 1417.5,p > 0.05 U = 3476.0,p > 0.05Sufficiency U = 1324.0,p < 0.05 U = 3472.0,p > 0.05Trust U = 1411.5,p > 0.05 U = 2847.5,p < 0.05Satisfaction U = 1441.5,p > 0.05 U = 3657.5,p > 0.05Average U = 1369.5,p < 0.05 U = 3416.5,p > 0.05Type 4Transparency U = 3469.5,p > 0.05Sufficiency U = 3676.0,p > 0.05Trust U = 2992.0,p > 0.05Satisfaction U = 3586.0,p > 0.05Average U = 3575.0,p > 0.05
Hence, as future work, we recommend that A/B tests with addi-tional designs are conducted. They may either result in a clearerpreference for a particular way of explaining recommendationsor further strengthen our conclusions. We especially recommendconducting A/B tests with reasons clearly visible, that is, not behindan icon as in the work reported here. More research in differentdomains, with different user groups, should lead to insights intothe generalizability of our findings.Acknowledgments. This research was supported by Ahold Delhaize, Ams-terdamData Science, the Bloomberg Research Grant program, the Criteo Fac-ulty Research Award program, the Dutch national program COMMIT, Else-vier, the European Community’s Seventh Framework Programme (FP7/2007-2013) under grant agreement nr 312827 (VOX-Pol), the Microsoft ResearchPh.D. program, the Netherlands Institute for Sound and Vision, the Nether-lands Organisation for Scientific Research (NWO) under project nrs 612.001.-116, HOR-11-10, CI-14-25, 652.002.001, 612.001.551, 652.001.003, and Yandex.All content represents the opinion of the authors, which is not necessarilyshared or endorsed by their respective employers and/or sponsors.
REFERENCES[1] M. Bilgic and R. J. Mooney. Explaining recommendations: Satisfaction vs. pro-
motion. In Beyond Personalization Workshop, IUI, volume 5, page 153, 2005.
[2] N. Diakopoulos. Algorithmic accountability: Journalistic investigation of compu-tational power structures. Digital Journalism, 3(3):398–415, 2015.
[3] J. L. Herlocker, J. A. Konstan, and J. Riedl. Explaining collaborative filtering rec-ommendations. In Proceedings of the 2000 ACM conference on Computer supportedcooperative work, pages 241–250. ACM, 2000.
[4] I. Ilievski and S. Roy. Personalized news recommendation based on implicitfeedback. In Proceedings of the 2013 International News Recommender SystemsWorkshop and Challenge, pages 10–15. ACM, 2013.
[5] M. Karlsson. The immediacy of online news, the visibility of journalistic processesand a restructuring of journalistic authority. Journalism, 12(3):279–295, 2011.
[6] J. Liu, P. Dolan, and E. R. Pedersen. Personalized news recommendation basedon click behavior. In Proceedings of the 15th international conference on Intelligentuser interfaces, pages 31–40. ACM, 2010.
[7] P. Melville, R. J. Mooney, and R. Nagarajan. Content-boosted collaborativefiltering for improved recommendations. In Aaai/iaai, pages 187–192, 2002.
[8] C. Musto, F. Narducci, P. Lops, M. De Gemmis, and G. Semeraro. Explod: Aframework for explaining recommendations based on the linked open data cloud.In Proceedings of the 10th ACM Conference on Recommender Systems, pages 151–154. ACM, 2016.
[9] P. Pu and L. Chen. Trust-inspiring explanation interfaces for recommendersystems. Knowledge-Based Systems, 20(6):542–556, 2007.
[10] M. T. Ribeiro, S. Singh, and C. Guestrin. Why should I trust you?: Explaining thepredictions of any classifier. In Proceedings of the 22nd ACM SIGKDD InternationalConference on Knowledge Discovery and Data Mining, pages 1135–1144. ACM,2016.
[11] J. B. Singer. Contested autonomy: Professional and popular claims on journalisticnorms. Journalism studies, 8(1):79–95, 2007.

Explanations for Personalized News Ranking FATREC 2017, August 31, 2017, Como, Italy
[12] N. Tintarev and J. Masthoff. A survey of explanations in recommender systems.In Data Engineering Workshop, 2007 IEEE 23rd International Conference on, pages801–810. IEEE, 2007.
[13] J. Vig, S. Sen, and J. Riedl. Tagsplanations: explaining recommendations usingtags. In Proceedings of the 14th international conference on Intelligent user interfaces,pages 47–56. ACM, 2009.
[14] E. Vozalis and K. G. Margaritis. Analysis of recommender systems algorithms. InThe 6th Hellenic European Conference on Computer Mathematics & its Applications,pages 732–745, 2003.