do what (you think) the rich will do: inequality and
TRANSCRIPT

Andrea Martinangeli
Do What (You Think) the Rich Will Do: Inequality and Belief Heterogeneity in Public Good
Provision1
Max Planck Institute for Tax Law and Public Finance Working Paper 2017 – 06
November 2017
Max Planck Institute for Tax Law and Public Finance
Department of Business and Tax Law
Department of Public Economics
http://www.tax.mpg.de
1 A previous version of this paper was entitled “Do What (You Think) the Rich Will Do: Inequality, Belief Formation and Group Identity in Public Good Games”

Max Planck Institute for Tax Law and Public Finance Marstallplatz 1 D-80539 Munich Tel: +49 89 24246 – 0 Fax: +49 89 24246 – 501 E-mail: [email protected] http://www.tax.mpg.de
Working papers of the Max Planck Institute for Tax Law and Public Finance Research Paper Series serve to disseminate the research results of work in progress prior to publication to encourage the exchange of ideas and academic debate. Inclusion of a paper in the Research Paper Series does not constitute publication and should not limit publication in any other venue. The preprints published by the Max Planck Institute for Tax Law and Public Finance represent the views of the respective author(s) and not of the Institute as a whole. Copyright remains with the author(s).

Do What (You Think) the Rich Will DoInequality and Belief Heterogeneity in Public Good Provision
Andrea F. M. Martinangeli∗
December 10, 2018
Abstract
Beliefs about others’ cooperativeness are among the strongest determinants of coop-erative behaviours. Beliefs about different others, however, are not necessarily uniform,nor necessarily related to past behaviours: different expectations about different othersmight solely originate from differences in observed individual characteristics. Finally,not all such beliefs need drive conditional behaviour alike.In an experimental public good game with heterogeneous endowments, I find thatrich subjects are expected to cooperate more by both rich and poor individuals, andthat behaviours of both the rich and poor significantly correlate only with beliefsabout the rich. I further find that an intervention aimed at downplaying the salienceof heterogeneity has no impact on neither beliefs nor cooperation. I conclude withimplications for information dissemination about uncooperative behaviour in the massmedia and avenues for further research.
JEL classification codes: C91, H41Keywords: belief formation, cooperation, experiment, group identity, inequality, publicgoods
∗Max Planck Institute for Tax Law and Public Finance; Marstallpl. 1, 80539, Munich, Germany.Tel.: +49 89 24246-5254; E-mail: [email protected]
Thanks to Ali Ahmed, Simona Bejenariu-Tudor, Jana Cahlikova, Fredrik Carlsson, Sverker Jagers,Olof Johansson-Stenman, Thomas Markussen, Peter Martinsson, Katarina Nordblom, Amrish Patel,Rupert Sausgruber, Lisa Windsteiger, Conny Wollbrant, the participants in the CNEE, BIM, SEET andIMEBESS conferences, and in seminars at Linkoping University, the University of Gothenburg, TechnischeUniversitat Munchen and Ludwig-Maximilian Universitat Munchen and the Max Planck Institute for TaxLaw and Public Finance for valuable discussions.The Wallander Foundation generously funded this project through grant No. P2012-0097-1.Special gratitude goes to Ignacio Alastrue, Alberto Badenes, Penelope Hernandez, Neus Planells, SergioSapina and the staff at the LINEEX laboratory (Valencia). Their professionalism and personalities maderunning the sessions smooth and entertaining.
1

1 Introduction
Beliefs about others’ behaviours in strategic interactions are crucial determinants of indi-viduals’ choices, and hence of the resulting outcomes. For instance, when willingness tocooperate hinges on one’s belief that others won’t take a free ride, pessimism about others’cooperativeness can ultimately stifle cooperative efforts and result in the breakdown ofcooperation (Fischbacher and Gachter, 2010; Smith, 2013). How beliefs are formed be-yond the reference point provided by others’ observed past actions, however, is a largelyneglected question. I present evidence from a novel experimental paradigm that the charac-teristics observed in others drive ex-ante beliefs about their future behaviour in the publicgood game. Ex-ante beliefs1 are intended as expectations formed not upon knowledge ofothers’ past behaviour (e.g. Fischbacher and Gachter (2010)), often unobservable in every-day interactions, but upon more readily observable characteristics among a diverse groupof individuals prior to any interaction taking place.2 Appearance (clothing, voice, vehiclestatus) is found to lead to widely different expectations (competence, criminal behaviour,trustworthiness), and hence social and individual outcomes (employment, credit, benevo-lence), even in anonymous interactions and after a very short amount of time (Christopherand Schlenker, 2000; Fiske et al., 2002; Little and Roberts, 2012; Bull and Rumsey, 2012;Duarte et al., 2012). Whose behaviour are then individuals more or less pessimistic of, andon their expectations of which groups do they more strongly condition their own conduct?Such question is made the more relevant by the negative impact of social heterogeneityon a wide array of socio-economic outcomes, including but not limited to a community’sability to provide public goods (Alesina et al., 1999; Alesina and La Ferrara, 2000; Luttmer,2001). With a focus on economic diversity, this paper investigates a potential and so farpoorly understood deep mechanism leading to persistent cooperation failures in sociallydiverse contexts: ex-ante beliefs about the cooperativeness of specific social groups, andindividuals’ tendency to condition their cooperation on what is observed or expected ofothers. (Fischbacher et al., 2001; Fischbacher and Gachter, 2010; Chaudhuri et al., 2017).
Heterogeneity in the amount of resources disposable for mutually beneficial cooperationavailable to the interacting partners is of particular interest. Besides being a visible, salientand heatedly debated social gradient with a yet unclear impact on social cooperativeness(Gachter, 2015; Anderson et al., 2008), the way in which inequality shapes individuals’ex-ante beliefs is unknown and not trivial. The different amount of resources available formutual cooperation might in fact offer cues to individuals’ disposition towards pro-socialactions. On one hand, as the less wealthy depend on social cooperation to a greater extentthan their more wealthy counterparts, scholars argue and observe that the poor exhibita greater propensity towards mutual engagement, prosociality and a greater attention to
1I will often use the word belief or expectation as a shorthand reference to this paper’s ex-ante belief.2While some settings allow for greater transparency on others’ previous conduct, in others, such as
everyday anonymous interactions, incomplete or totally lacking information is more realistic (Ghosh andRay, 1996).
2
others’ wellbeing (e.g. Piff et al. (2010); Dubois et al. (2015); for a review of the litera-ture see Kraus et al. (2012)). On the other hand, however, contributing own resources tocommon projects exposes the contributor to others’ free riding behaviours, placing less af-fluent individuals in a particularly vulnerable position. As they bear a greater relative costfrom cooperative actions, less endowed individuals can therefore generate in others morepessimistic beliefs about their cooperativeness (Dovidio et al., 2006; Piff et al., 2010). Willthen a poorer person be expected to contribute more of her resources than richer people, orwill a richer person be expected to contribute more of her resources in cooperative effortsthan poorer ones? A third alternative hypothesis is generated by social identity theory(Turner and Tajfel, 1986) and the related literature: people recognised as more similar tooneself along salient and relevant dimensions are attributed more positive qualities and areexpected to engage in prosocial actions more than others (Hewstone et al., 2002; Chen andLi, 2009; Guala et al., 2013). Will then those equally poor or rich as oneself be attributedgreater cooperativeness than others? The experimental design here presented allows todiscriminate between all of these hypotheses.
I in fact present evidence that a relationship between individuals’ ex-ante beliefs abouttheir counterparts’ cooperativeness and the amount of resources to these available indeedexists, that more cooperation is expected of the rich independent of the observer’s endow-ment size, and that cooperation is more strongly conditioned on behaviours expected ofthe rich than of the poor.3 I adopt a novel experimental paradigm removing the interpre-tation hurdle represented by contingent endowment differences: a poor4 subject might bebelieved to be more or less cooperative than a rich one contributing a lower relative butlarger absolute amount depending on the observers’ reference framework. The coexistenceof these reference frameworks (Reuben and Riedl, 2013) makes it difficult to understandhow cooperative others with different endowment sizes are expected to be given any set ofelicited beliefs. I exploit the flexibility offered by the laboratory to provide a common scaleto all elicited beliefs, making the distinction between relative and absolute contributionsirrelevant for their interpretation, while preserving the impact of endowment heterogene-ity on their formation. Beliefs thus elicited are therefore fully comparable measures ofthe cooperativeness expected of others with different endowment sizes. Beliefs about richand about poor subjects are elicited from each individual and compared in a within sub-ject fashion. The laboratory moreover allows to abstract from worldviews, socio-economicbackgrounds and cultural (e.g. the discourse on inequality and redistribution) confounds.
In a further step, the analysis relates subjects’ behaviours in the public good gamewith the two sets of beliefs they provided. While Fischbacher and Gachter (2010) andSmith (2013) find beliefs to be a strong driver of individuals’ cooperativeness, individuals
3Notice that this study focuses on the pure impact of having more or less, and by adopting an exper-imental approach it abstracts from the influence of beliefs about the social mechanisms leading to wealthaccumulation (Christopher and Schlenker, 2000).
4To simplify the language, I will throughout the paper refer to subjects with a high and low endowmentas to the rich and poor subjects respectively.
3

might in fact not attach the same importance to all beliefs they form. In other words,beliefs about different individuals might be weighed differently. It is the case for instancein Smith (2011), who finds that when non-economic heterogeneity5 is induced within thegroup, behaviours correlate positively with beliefs about team members only. Are peoplethen more willing to cooperate provided those who can contribute the most to the commongood also do so, or do they cooperate provided those who benefit the most also contributeof their own? However, in choosing how to behave, it is natural to ask oneself how othersin a similar socio-economic position, in terms for instance of social class, profession, age,ethnic group, education, as oneself would act (Akerlof and Kranton, 2000). Andreoni andScholz (1998) show in fact that individuals tend to conform to behaviours of others similarto themselves along an array of socio-demographic characteristics. Similar to Smith (2011),will then behaviours be conditioned on the expected cooperativeness of (endowment-wise)similar others? The elicitation of distinct beliefs about rich and poor subjects allows toanswer this question, finding a stronger relationship between own cooperativeness andbeliefs about rich rather than poor subjects for both types of players.
In Stage 1 of the experiment, subjects are randomised into an Equal Endowment(EQUAL) and an Unequal Endowment (UNEQUAL) treatment, are organised into anony-mous groups of four, and are immediately communicated their own and their group mem-bers’ endowments. Stage 1 of the experiment consists only of these randomisation andinformation dissemination procedures. Subjects are informed that their group will remainthe same during the whole session. In UNEQUAL, endowments are assigned in two levels(two subjects with a high and two with a low endowment) with a 3:1 ratio. Such endow-ment distribution allows to maximise the salience of the distinction between the rich andthe poor subjects and allows to elicit the same set of beliefs from all subjects in the group6.
For clarity of exposition, I will postpone a description of Stage 2 of the experiment,and begin with the main stages of the experiment, Stage 3 and Stage 4, consisting oftwo (strategically and payoff) independent public goods games.7 The public good gamesin Stages 3 and 4 are both described in detail before the beginning of Stage 3, such thatsubjects are aware of the existence and mechanics of Stage 4 while participating in Stage 3.
Stage 4, the last in the session, is devoted only to the elicitation of cooperative choicesvia a repeated public goods game with the unequal endowments assigned in Stage 1. Thebehaviours elicited in Stage 4 are the contribution choices of interest and on which theanalysis will focus.
The preceding stage, Stage 3, is dedicated to the incentivised elicitation of subjects’beliefs about their group members’ contributions in a one-shot public good game taking
5Subjects within a public good provision group are organised in teams with different colours. I referthe interested reader to the original article for further details.
6For instance, had each group member a different endowment, beliefs about others with the sameendowment as oneself could not be elicited.
7A systematic, sequential description is in Section 2. Figures 1 and 3 summarise the design and itsstages. I will also relegate to Section 2 a description of the EQUAL condition.
4

place within Stage 3. As beliefs are the main object of interest, they are elicited prior tothe elicitation of cooperative behaviours in order to obtain as clean a measures as possibleof subjects’ expectations. At the very beginning of Stage 3, subjects are told on-screenthat only in the Stage 3 public good game all group members would be contributing froma uniform and commonly known endowment instead of the heterogeneous distributionassigned in Stage 1. Beliefs about others’ contributions from such uniform endowment areimmediately elicited, and incentivised via the immediately following Stage 3 one-shot publicgood game.8 As subjects are already aware of the heterogeneous endowment distributionassigned in Stage 1 and of the Stage 4 public good game, separate beliefs about rich andpoor subjects could be elicited. Further, the separate elicitation of beliefs in Stage 3, takento precede and determine cooperativeness, and contributions in Stage 4, reduces the riskof unwanted endogeneities upward biasing their correlation.
Important to stress out is that this paper is not focused on beliefs born by experienceof previous interactions, but rather on variations in ex-ante beliefs (generated prior to anyinteraction taking place) due to observation of others’ fixed and exogenous characteristics,i.e. their endowment level. Such beliefs can be understood as individuals’ naıve view of theworld and might establish long-run cooperation levels by path dependence (Chaudhuri andPaichayontvijit, 2006)9 in the presence of limited information about others’ actions (Ghoshand Ray, 1996). In other words, (ex-ante) optimistic individuals might repeatedly coop-erate more than pessimistic ones when belief updating is impeded by lack of information.To capture such long-run impact, Stage Stage 4 withholds information about other groupmembers’ past choices, as these would allow for continuous belief updating disrupting therelationship of interest. This investigation can therefore provide insights into the causes ofpersistent cooperation failures when observability of others’ previous choices is not perfect.
The remaining stage of the experiment, Stage 2, is instead intended to investigate theimpact on beliefs of interventions aimed at reinforcing group cohesion. In order to formdifferent beliefs about different others, however, it must be that interpersonal differences aresalient and deemed relevant for the interaction (Turner et al., 1987; Roccas and Brewer,2002): The salience of heterogeneous individual traits (e.g. income, ethnicity, religion,regional belonging) relative to that of membership to a superordinate group entity (e.g.national rather than regional identity (Wenzel, 2007), an organisation rather than a specificblue or white collar position (Akerlof and Kranton, 2000)) will determine the degree ofperceived social cohesion and hence the willingness to cooperate towards common goalsindependent of the identity of one’s partners. A natural question to ask in this frameworkis then whether enhancing the salience of common group membership at the expense ofthat of group heterogeneity modifies any relationship observed between others’ endowment
8Within Stage 3, the order in which beliefs and the one-shot interaction by which they are incentivisedare elicited is functional to the collection of as precise as possible measures of subjects’ beliefs.
9Chaudhuri et al. (2006) find evidence, in a repeated homogeneous endowment public goods game, thatfirst period behaviour correlates positively with beliefs updated immediately prior to the beginning of theinteraction.
5

sizes and subjects’ beliefs. Group cohesion is thus reinforced by means of free within-groupcommunication in the context of a problem solving task. Similar to Charness et al. (2014)and Weng and Carlsson (2015), the approach is here that of reinforcing cohesion in a groupthat is already structurally heterogeneous, thus departing from the literature focusing on theimpact of induced heterogeneity on cooperation in an otherwise homogeneous group (e.g.Chen and Li (2009); Chen and Chen (2011); Smith (2011); Chakravarty and Fonseca (2014);Currarini and Mengel (2016))10. In addition to being closer to the situation faced by socialplanners in diverse societies, this approach addresses whether the effects of desirable socialcohesion can be achieved in diverse societies with simple interventions. This paper departshowever from Charness et al. (2014) and Weng and Carlsson (2015) by focusing on theimpact of reinforced group cohesion on belief formation rather than on cooperation, thusgoing beyond investigations of the outcomes of interest (cooperation) by looking directlyat one of its deep drivers. Because I hypothesize reinforced cohesion to reduce the salienceof endowment heterogeneity in the formation of beliefs about others, the task by whichgroup cohesion is reinforced takes place in Stage 2 of the experiment, prior to the beliefelicitation procedure, in half of the groups. It is the within-group communication exchangethat is taken to enhance group cohesion, and not the problem-solving exercise itself. Theremaining groups therefore participate in the exact same problem solving task withoutthe possibility to communicate. These groups provide the benchmark upon which theeffectiveness of the cohesion-enhancing intervention is evaluated.
Summarising, this paper seeks answers to the following questions: i) Does inequalityshape beliefs about others’ cooperativeness?, ii) What is the relationship of such beliefs withindividuals’ behaviour?, and iii) How does reinforcement of group cohesion impact the roleof inequality in belief formation?
The results show that individuals’ ex-ante beliefs about their counterparts’ coopera-tiveness is driven by the amount of resources to these available: rich subjects are alwaysexpected, by both the rich and the poor, to cooperate more. Further, absent informa-tion allowing to precisely update expectations, individuals’ long-run behaviours correlatestrongly, positively and significantly with their beliefs about the rich but not with thoseabout the poor. Finally, reinforcement of group cohesion has no impact on belief formationor cooperative behaviours, but in unequal groups poor subjects’ contributions increase.
Section 2 describes the experimental design, Section 3 formulates the hypotheses, Sec-tion 4 presents the results and Section 5 discusses and concludes.
10Smith (2011) is related to this paper in that beliefs are elicited about others in different sub-groupswithin the public good provision group. However, heterogeneity is there induced within an otherwisehomogeneous by random assignment to teams distinguished by different colours.
6

2 Experimental design and procedures
Experimental conditions
The 2x2 factorial design in Figure 1 varies whether cooperation occurs under endowmentequality or inequality on one dimension (EQUAL and UNEQUAL) and whether the salienceof group cohesion is or is not reinforced via communication in a team-building activity (e.g.Chen and Chen (2011); Charness et al. (2014)) on the other (ID and NoID).
No. of Observations: 360 Group cohesion conditions:No. of sessions: 6 communication in problem solving
NoID ID
EQUALEQUAL-NoID (84 obs.) EQUAL-ID (84 obs.)
Inequalityconditions
Equal endowments
No communication allowed
Equal endowments
Communication allowed
UNEQUALUNEQUAL-NoID (96 obs.) UNEQUAL-ID (96 obs.)
Unqual endowments
No communication allowed
Unqual endowments
Communication allowed
Figure 1: 2x2 factorial experimental design
Stage 1. Assignment of endowment size: EQUAL and UNEQUAL
In Stage 1, subjects were randomly organised into groups of four and assigned to an EQUALor an UNEQUAL condition.11 The groups thus formed remained fixed for the whole session(partner matching), which was made common knowledge by the instructions and of whichthe subjects were reminded at the beginning of each stage. In the EQUAL condition, allsubjects received a uniform endowment of 40 Tokens. In the UNEQUAL condition, twosubjects in each group were endowed with a larger endowment of 60 Tokens and two witha smaller endowment of 20. Total endowments and maximal social earnings were thus heldconstant.
Subjects could immediately see their endowment and that of the other group membersdisplayed in the upper portion of their screen (Figure 2). All subjects saw their ownendowment (marked “you”) on the left side. The other group members were marked withan X to prevent subjects from identifying each other during the subsequent phases of theexperiment.
11Stages were referred to as Sections in the instructions. I will use the term Stage throughout the paperfor clarity of exposition.
7

You X X X
UNEQ (poor) 20 20 60 60UNEQ (rich) 60 60 20 20EQUAL 40 40 40 40
Figure 2: Information provided at the beginning of each session topoor and rich subjects as well as subjects in EQUAL.Subject were given only information about their own group.
Stage 2. Reinforcement of group cohesion: ID and NoID
Group cohesion was either reinforced (ID) or not reinforced (NoID) via a team buildingactivity in all groups within a session in Stage 2. Similar to Chen and Chen (2011) eachsubject, irrespective of condition, was given 5 minutes to review 5 pairs of paintings. Eachpair consisted of one painting by Klee and one by Kandinsky. A sixth pair of paintingsdisplayed no information about the artists. At the end of the review time, subjects wereasked to guess whether each unmarked painting was painted by Klee or Kandinsky. Theyearned 3 euros (approximately 25% of the average earnings) by correctly guessing theauthor of both paintings. Earnings from this stage were communicated at the very end ofthe session.
To reinforce group cohesion, subjects in the ID conditions could anonymously discussthe task in an on-line chat with their group during the review time. To ensure isomor-phicity across conditions all subjects, irrespective of condition, could review the paintingsfor 5 minutes before providing their answers. The only difference between the conditionsconsisted in the possibility for subjects in ID to communicate to discuss the task whilecommunication was not allowed in NoID. Discussion was unrestricted except that abu-sive or threatening language was prohibited under exclusion from the experiment and allpayments. Colour identifiers linked chat entries from the same subject together whilepreserving anonymity and preventing subjects from linking chat entries to a specific en-dowment size in the following stages. After the end of the reviewing time, answers weresubmitted privately.
Stage 3 and Stage 4. Belief elicitation and public good provision
Stage 3 and Stage 4 each consisted of a public good game, independent both strategicallyand in payoffs. Stage 3, consisted of a one-shot public good game with belief elicitation,while Stage 4 consisted of a 10 Period repeated public good game. The remainder of thissection provides detailed description of the two stages.
Denote with G player i ’s group of size n = 4. Player i ’s payoffs are then
8

πi = Ei − ci + α∑j∈G
cj ,
where α = 0.5 is the MPCR of the public good game, Ei denotes player i’s endowmentand 0 ≤ ci ≤ Ei player i ’s contribution to the public good. As 1/n < α < 1, thegame induces a conflict between individual self interest (full free riding, coinciding withthe predicted Nash equilibrium of the game, and social welfare (full contributions). Thedescription of the game did not make any reference to specific endowment sizes and thegeneric term “endowment” was used in referring to the resources available to each subject.This precaution prevented subjects from gathering information about the experimentalconditions they were not taking part ion, from being primed with specific examples, andallowed to provide identical instructions to all participants. After the mechanics of thepublic good game were described in detail, Stage 3 and Stage 4 were described in detailand instructions for both stages were distributed together prior to the beginning of Stage 3.
Stage 3 and Stage 4 served two distinct purposes. Stage 3 was devoted to the elicitationof subjects’ ex-ante beliefs about others. Stage 4 was instead devoted to the measurementof the subjects’ own cooperativeness in a standard repeated public good game with unequalendowments. The two Stages were disjoint (after the end of Stage 3 subjects were informedthat Stage 4 would begin after a few seconds) and payoff independent (only one of the twopublic good games would be randomly selected for payment at the end of the session,of which subjects were made aware in the instructions). The reason behind these designfeatures is as follows.
The primary objectives of this study are i) the measurement of ex-ante beliefs aboutothers’ cooperativeness in search for systematic relationships with their endowment size,and ii) the investigation of how ex-ante beliefs correlate with long-run repeated coopera-tion. The elicitation strategy adopted for both beliefs and behaviour must therefore ensurethat beliefs and cooperativeness be measured as precisely and faithfully as possible, min-imising any unwanted distortion introduced by their simultaneous (or near-simultaneous)elicitation. Beliefs elicited after the cooperative behaviours risk being distorted by ex-postrationalisation of choices. Moreover, the formation of beliefs is taken to precede and de-termine cooperative choices. Ex-ante beliefs are therefore the first to be elicited in Stage3 before any interaction takes place. The one-shot game in Stage 3 provides a clear andsimple framework for their incentivisation. The beliefs elicited are then related to coop-eration occurring in the following Stage 4. The clear temporal and strategic separationbetween Stage 3 and Stage 4 minimises the risk that feedbacks might take place betweenthe contributions elicited in Stage 3 and those elicited in Stage 4, which are an object ofinterest in this study.
Stage 3: belief elicitation and one-shot public good game Ex-ante beliefs weremeasured in Stage 3. Belief elicitation under endowment inequality is ridden with an
9

interpretation hurdle: did subjects have an absolute or a relative reference framework(Reuben and Riedl, 2013) in mind when stating their beliefs? In other words, is a richperson believed to contribute more in absolute but less in relative terms than a poor personconsidered more or less prosocial than the latter? It is not obvious that imposing eitherof the two frameworks via the choice architecture would constitute an innocuous designchoice. The purpose of Stage 3 is hence that of providing a common reference frameworkby removing the contingent impact of endowment heterogeneity on belief elicitation andevaluation, while maintaining its salience for belief formation.
First, subjects were informed that Stage 3 consisted of a one-shot public good gameand that within the context of such game they would be asked to guess the contributionsof other group members.12 Because beliefs are the main object of interest in this study,they were elicited at the very beginning of Stage 3, thus minimising the risk that theirmeasurement might be contaminated by preceding contribution choices.13 The ensuingStage 3 contributions provided instead the basis upon which beliefs were incentivised, andare not used in the analysis of behaviours.
Second, always at the beginning of Stage 3, subjects were privately informed that in andonly in Stage 3 everyone in their group would contribute to the one-shot public good gamefrom an equal endowment of 40 Tokens, regardless of the endowment they were assigned inStage 1. Subjects knew via the instructions already in their possession that an additional(repeated) public good game with unequal endowmnts would follow in Stage 4, and thatin Stage 3 only would they be contributing from a uniform endowment. A reminder of thegroup’s endowment distribution for Stage 4 was provided in the upper portion of the screen(see Figure 2), this time with random numerical identifiers marking each group memberand their endowment. Elicitation of the others’ expected cooperativeness, freed of thecontingent confound introduced by heterogeneous endowment sizes while preserving theirsalience arising from awareness of the ensuing Stage 4, was thus made possible.14
The belief elicitation procedure was described privately. Subjects in EQUAL wereasked for a single guess of the average amount that will be contributed in Stage 3 by theother three group members (rounded to the closest integer). Subjects in UNEQUAL wereasked to make two guesses: one about the exact amount that will be contributed in Stage3 by the single other person holding the same Stage 4 endowment as them (a poor or arich, for a poor or rich subject respectively), and the other concerning the average amount(rounded to the closest integer) that will be contributed in Stage 3 by the two subjectsholding a different Stage 4 endowment (two rich or two poor, for a poor or a rich subject
12To provide identical information to all subjects, the instructions made no reference to how the guesseswould be made. Detailed instructions on the guessing task were provided privately, on screen, after Stage3 started.
13E.g. via ex-post rationalisation.14Notice that because of the existence of Stage 4, rich and poor subjects are, in expectation, respectively
still rich and poor in Stage 3.
10

respectively).15 I will refer to these guesses as to the subject’s beliefs about rich and aboutpoor subjects.16 Subjects were informed that correct guesses would earn them additionalincome, decreasing in the distance from the actual value.17 Subjects were only informed oftheir performance in guessing others’ contributions at the end of the experiment. After theguesses were made, subjects could choose to contribute an integer in the 0-40 range to theStage 3 one-shot game. Belief elicitation was incentivised based upon these contributions.18
The instructions reported that all earnings from Stage 3 would be communicated at theend of the experiment and that the amount of tokens earned in the one-shot game wouldbe exchanged at a rate of 1 Euro = 15 Tokens.
Stage 4: repeated public good game In Stage 4, subjects played a public good gamefor 10 periods. The instructions informed the subjects that final earnings from Stage 4would consist of the sum of their earnings in all 10 periods converted to euros at a rate of1 Euro = 150 Tokens.
The public good game in Stage 4 occurred under endowment heterogeneity, with the en-dowments assigned in Stage 1. Subjects were not given any feedback about the group’s per-formance or about the contributions of other group members throughout Stage 4. As mea-surement of the correlation of players’ beliefs elicited in Stage 3 with repeated behavioursin Stage 4 is among the main objectives of this study, the absence of feedback minimisesthe noise introduced by continuous updated information about others’ behaviours, whichwould potentially disrupt the relationship of interest. Instead, they were only informed oftheir own earnings in each period. Figure 3 offers a summary of the design.
15Asking for separate guesses for all subjects runs into the problem of distinguishing between the two (orthree) subjects holding the same endowments. These subjects are identical from the guesser’s perspective,thus adding an additional layer of uncertainty to the task and increasing the noise contained in the data. Inaddition, incentivisation based on the guesses’ proximity to the observed values would be made problematic.
16The order in which beliefs were elicited was randomised over the subject pool to avoid introducingorder effects. When asked to make their guesses, the question referred to the random identifier of thesubject for which beliefs were being elicited rather than to their endowment sizes.
17Subjects in the EQUAL conditions were paid 2 Euros for each correct guess, 1.2 Euros for each guessthat differed by at most 1 point from the actual value and 0.8 Euro for each guess that differed by at most 2points from the actual value. Guesses that differed by 3 points or more were not remunerated. Subjects inUNEQUAL and EQUAL-ID were paid half the amounts for each guess they were asked for, as they guessedtwice.
18Earnings from belief incentivisation would always be paid out regardless of whether Stage 3 or 4 wouldbe valid for payment. This was made common knowledge. Notice that while a distortionary impact ofbelief elicitation onto the contributions collected in Stage 3 cannot be excluded, the only purpose of thelatter is that of allowing for the incentivisation of beliefs and will not be used in the analyses of behaviours.Contribution behaviours of interest are instead those collected in ensuing and independent Stage 4.
11

Sequence of events Task Explanation Condition
Subjects are registered and assigned to a computer
Instructions forStage 1
Stage 1 Assignment ofendowment
The subject obtains in-formation about how en-dowments are distributedamong the group members
EQUAL: all subjects have equal en-dowments (40 tokens).UNEQUAL: two subjects receive alarge and two a small endowment(60 and 20 tokens, respectively).
Instructions forStage 2
Stage 2 Reinforcementof group cohe-sion
Subjects solve an incen-tivised problem: guessingwho painted two art pieces.
ID: communication is allowed dur-ing problem solving: group cohe-sion is reinforced.NoID: communication is not al-lowed: group cohesion is not rein-forced.
Instructions forStage 3 and Stage 4
Stage 3 Belief elicita-tion followedby a one-shot publicgood gamewith uniformendowments.
Subjects are informed thatin this section everybodycontributes from an equalendowment of 40 tokens in-stead of the endowmentsassigned in Stage 1.Subjects are asked to guessthe contributions of othergroup members in this sec-tion before making theirs.
EQUAL: subjects guess the aver-age contribution of the other threegroup members.UNEQUAL: subjects guess thecontribution of the other subjectwith the same Stage 1 endowmentas theirs and the average contribu-tion of the subjects with a differentStage 1 endowment.Guesses are incentivised.
Stage 4 Repeated pub-lic good game.
All subjects participatein a repeated public goodgame using the endow-ments assigned in Stage1 and no feedback aboutgroup peroformance orothers’ contributions.
All conditions follow the same pro-cedures.
Subjects are informed about all their earnings, debriefing, and payout
Figure 3: Summary of experimental design.
Experimental procedures
The experiment consisted of six sessions at the LINEEX laboratory of the University ofValencia (5-6 October 2016). The experiment was computerised and coded in z-Tree (Fis-
12

chbacher, 2007). In total, 360 subjects were recruited via the laboratory’s own recruitmentsystem.19 IEach subject participated only once and was remunerated privately upon check-out. Group cohesion was reinforced in three of the sessions. Subjects were not made awarethat multiple conditions would be implemented. At the beginning of each session, instruc-tions providing an overview of the experiment and of the randomisation procedures weredistributed and read out loud. All subjects were informed that they would be assigned anendowment and a group of four as soon as the session started. Instructions for Sections 2and 3 were distributed and read out loud right before the respective sections started. Sub-jects were hence unaware of what tasks the following sections involved. In order to avoidhedging, subjects were informed about their performance in the Stage 2 task, in the beliefelicitation, and in the Stage 3 public good game only at the very end of the session. Theinstructions made it clear that either Stage 3 or 4 would be randomly selected as payoffrelevant and that incentivised belief elicitation would be paid out regardless. Paymentswere made at the end of the session.
Prior to Stage 3, subjects answered a series of unincentivised control questions to en-sure comprehension of the public good game. Each subject could proceed to subsequentquestions only after answering a question correctly. The entire experiment was conductedin Spanish. An English version of the instructions can be found in Appendix C. A sessionlasted approximately 75 minutes. Payments averaged 12 Euros per subject.
3 Hypotheses
Endowments and ex-ante beliefs I investigate whether endowment heterogeneitydrives the formation of beliefs about others’ cooperativeness. It is for instance well es-tablished in social psychology that similarities and differences in salient individual traitsare among the bases upon which individuals form their expectations of others (Turneret al., 1987; Hewstone et al., 2002; Roccas and Brewer, 2002; Chen and Li, 2009; Gualaet al., 2013). Rich and poor would thus be expected to believe others with the same en-dowment size as themselves being more cooperative. Alternatively, beliefs might be drivenby heterogeneity in the relative costs associated with cooperative behaviours. Accordingto this perspective, the rich might be expected to act benevolently towards the poor be-cause of the greater endowment size and hence lower relative cost of cooperation (Dovidioet al., 2006; Piff et al., 2010). A third possibility is for beliefs to be driven instead byheterogeneity in the stakes individuals have in group cooperation. The poor might thus
19More details are provided in Figure 1. In this experiment, each group of four subjects is considered anindependent observation. In total, 24 groups participated in the UNEQUAL and UNEQUAL-ID conditions,and 21 in the EQUAL and in the EQUAL-ID conditions. Based on the effect size uncovered by Weng andCarlsson (2015) the power of this experiment at the 10% significance level exceeds 0.9 in comparisons ofequal and unequal groups, 0.85 in comparisons of heterogeneous groups across group cohesion conditions(UNEQUAL vs. UNEQUAL-ID) and 0.56 in comparisons of homogeneous groups across group cohesionconditions (EQUAL vs. EQUAL-ID).
13

be expected to cooperate more because of their greater reliance on group cooperation (Piffet al., 2010; Kraus et al., 2012; Dubois et al., 2015). As these lines of reasoning gener-ate competitive hypotheses, I will test for an association between individuals’ endowmentsand others’ beliefs about their cooperativeness, and let the results distinguish between theproposed mechanisms.
Hypothesis 1.
In UNEQUAL-NoID, beliefs about others’ contributions are driven by the size of theirendowment.
Ex-ante beliefs and contributions Croson (2007) and Fischbacher and Gachter (2010)have shown beliefs about others’ cooperativeness to strongly drive cooperative behaviour.In these papers beliefs elicited in a repeated game, following the distribution of informationabout other group members’ previous period behaviour, are related to cooperativeness inthe following period. I hypothesise that ex-ante beliefs based on observation of the group’sstructure prior to the interaction taking place can influence cooperation levels and long-run performance via path dependence (Chaudhuri et al., 2017).20 The elicitation of beliefsabout both rich and poor group members from each individual allows to gain insights intowhether either set of beliefs correlates more strongly with each individual’s own actions.
Hypothesis 2.
Ex-ante beliefs are positively correlated with cooperation in the subsequent repeatedpublic good game.
Group cohesion, ex-ante beliefs and cooperation The salience of specific individualtraits depends on their relevance to the interaction at hand, and on the salience of thesuperordinate group-entity (Roccas and Brewer, 2002): The greater the latter, the weakerthe importance of individual traits within the interaction. Therefore, if membership to asuperordinate group entity is made salient relative to heterogeneous individual traits, theimportance of these in driving belief formation (see Hypothesis 1) should be reduced.
Hypothesis 3.
In UNEQUAL-ID, beliefs about others’ contributions are unrelated to the size of theirendowment.
Group cohesion might ultimately impact behaviours (Chen and Li, 2009; Chen andChen, 2011; Chakravarty and Fonseca, 2014; Currarini and Mengel, 2016) beyond belief
20Recall that in order to investigate the correlation of ex-ante beliefs with cooperation in the repeatedgame I do not elicit beliefs in each period, and withhold information about group and individual contribu-tions.
14

formation. The reasoning is as follows: salient endowment differences divide the groupalong the endowment dimension, preventing subjects from perceiving each other as mem-bers of a uniform and cohesive group. By reinforcing one’s sense of belonging to the group,group cohesion will therefore induce greater interest in group welfare and spurn coopera-tiveness (Roccas and Brewer, 2002; Hofmeyr et al., 2007). On the other hand, it is notobvious why reinforcement of group cohesion should impact cooperation in the absence ofheterogeneity (Chakravarty and Fonseca, 2014).21
Hypothesis 4.
Reinforced group cohesion (EQUAL-ID and UNEQUAL-NoID) results in greatergroup contributions to the public good.
4 Results
I will first investigate individuals’ ex-ante beliefs in search for a relationship with others’endowment sizes, and with own cooperativeness. I will next look for evidence of an impactof group cohesion reinforcement on beliefs and cooperative behaviour alike. Table 1 reportssummary statistics of ex-ante beliefs and contributions to the public good in Stage 4 of allconditions.
21Chakravarty and Fonseca (2014) find support for an analogous hypothesis.
15

Table 1: Ex-ante beliefs and contributions in Stage 4, summary statistics
Average beliefs (share of endowment contributed) by condition
Condition Mean St. dev. Sample sizeEQUAL-NoID 50.68 21.62 84UNEQUAL-NoID 48.42 22.44 96EQUAL-ID 54.52 21.80 84UNEQUAL-ID 43.31 18.52 96
Beliefs about rich and poor in UNEQUAL (share of endowment contributed)by rich or poor subject, and ID and NoID condition
Poor-NoID, n=48 Poor-ID, n=48
Mean St dev Mean St devBeliefs about poor 39.01 25.94 38.12 23.70Beliefs about rich 53.02 29.98 50.21 23.53
Rich-NoID, n=48 Rich-ID, n=48
Mean St dev Mean St devBeliefs about poor 46.67 21.23 38.75 20.01Beliefs about rich 55.00 26.41 46.14 21.9
Average contributions, by condition
Share of endowment contributed Absolute amount contributed
Mean St. dev. Mean St. dev.EQUAL-NoID 43.43 31.21 17.37 12.48UNEQUAL-NoID 39.47 30.05 15.26 13.95EQUAL-ID 43.25 32.36 17.30 12.48UNEQUAL-ID 35.82 30.34 12.69 12.07
Average contributions in UNEQUAL, by rich/poor and ID
Share of endowment contributed Absolute amount contributed
Mean St. dev. Mean St. dev.Poor-NoID 42.09 33.07 8.41 6.61Poor-ID 44.00 33.24 8.80 6.65Rich-NoID 36.84 26.46 22.10 15.87Rich-ID 27.63 24.56 16.58 14.73
16
Endowments and ex-ante beliefs
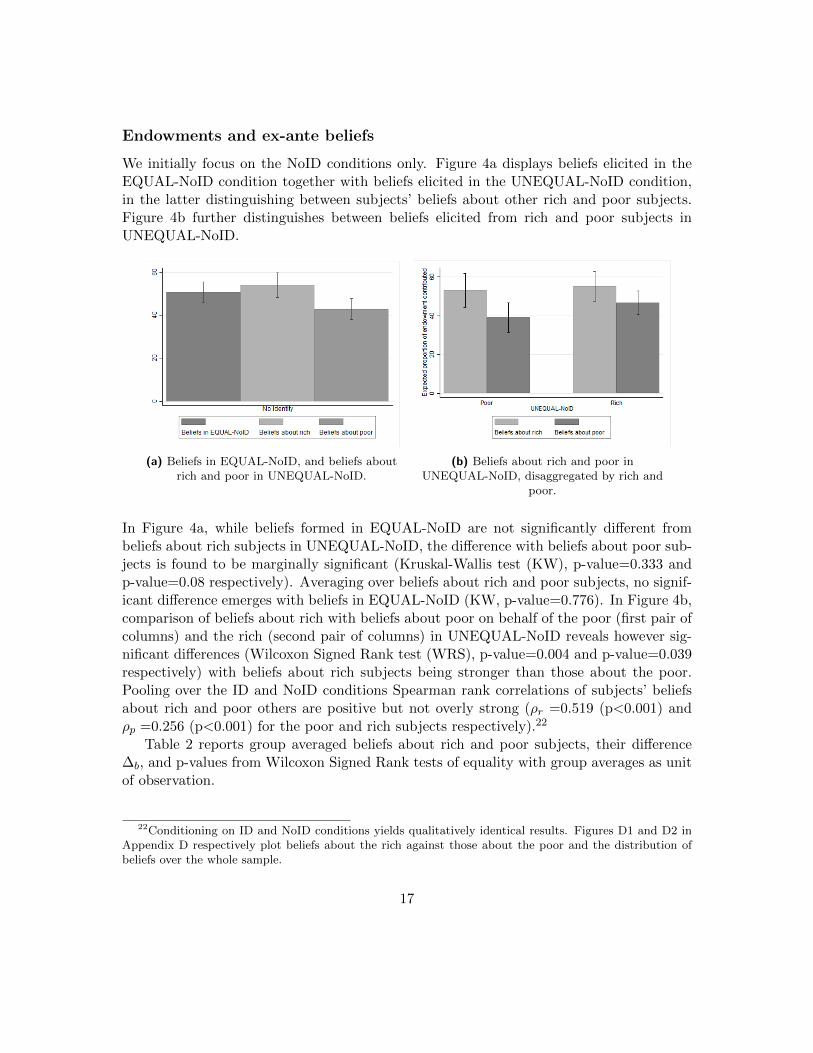
We initially focus on the NoID conditions only. Figure 4a displays beliefs elicited in theEQUAL-NoID condition together with beliefs elicited in the UNEQUAL-NoID condition,in the latter distinguishing between subjects’ beliefs about other rich and poor subjects.Figure 4b further distinguishes between beliefs elicited from rich and poor subjects inUNEQUAL-NoID.
(a) Beliefs in EQUAL-NoID, and beliefs aboutrich and poor in UNEQUAL-NoID.
(b) Beliefs about rich and poor inUNEQUAL-NoID, disaggregated by rich and
poor.
In Figure 4a, while beliefs formed in EQUAL-NoID are not significantly different frombeliefs about rich subjects in UNEQUAL-NoID, the difference with beliefs about poor sub-jects is found to be marginally significant (Kruskal-Wallis test (KW), p-value=0.333 andp-value=0.08 respectively). Averaging over beliefs about rich and poor subjects, no signif-icant difference emerges with beliefs in EQUAL-NoID (KW, p-value=0.776). In Figure 4b,comparison of beliefs about rich with beliefs about poor on behalf of the poor (first pair ofcolumns) and the rich (second pair of columns) in UNEQUAL-NoID reveals however sig-nificant differences (Wilcoxon Signed Rank test (WRS), p-value=0.004 and p-value=0.039respectively) with beliefs about rich subjects being stronger than those about the poor.Pooling over the ID and NoID conditions Spearman rank correlations of subjects’ beliefsabout rich and poor others are positive but not overly strong (ρr =0.519 (p<0.001) andρp =0.256 (p<0.001) for the poor and rich subjects respectively).22
Table 2 reports group averaged beliefs about rich and poor subjects, their difference∆b, and p-values from Wilcoxon Signed Rank tests of equality with group averages as unitof observation.
22Conditioning on ID and NoID conditions yields qualitatively identical results. Figures D1 and D2 inAppendix D respectively plot beliefs about the rich against those about the poor and the distribution ofbeliefs over the whole sample.
17

Table 2: Comparisons of rich or poor subjects’ beliefs (group-averaged) about richand poor subjects (UNEQUAL-NoID and UNEQUAL-ID).
Beliefs elicited from:N=24 Poor-NoID Rich-NoID Poor-ID Rich-ID
Beliefs about rich 53.02 55.00 50.21 46.15Beliefs about poor 39.01 46.67 38.13 38.75
∆b 14.01 8.33 12.08 7.4
Wilcoxon Signed Rank testH0 : belief about rich=belief about poor
WSR p-value 0.004 0.039 0.005 0.120
Focusing on the NoID condition, the null of equality is rejected at least at the 5%significance level in both comparisons, providing evidence that expectations of cooperationare indeed driven by endowment sizes, with more cooperativeness expected of rich subjects.Specifically, the rich are expected by poor and rich subjects alike to be more cooperativeby 14.01 and 8.33 percentage points respectively.23
Result 1. In UNEQUAL, beliefs about others’ behaviours are driven by their endowmentsize. The rich are expected to contribute more.Expectations in UNEQUAL-NoID and EQUAL-NoID do not differ on average.
Result 1 supports Hypothesis 1: differences in endowment size are salient for individuals’formation of ex-ante beliefs about others’ cooperativeness. Greater cooperation is expectedfrom the rich, lending credibility to arguments predicting expectations of greater benev-olence on behalf of those with greater endowments, for whom cooperation is less costly.Inequality per se therefore shapes expectations of others’ cooperativeness, but it does notaffect aggregate expected cooperativeness.
Ex-ante beliefs and cooperation
Figure 5 displays the time series of average contributions in all conditions throughout therepeated game. The behavioural patterns commonly observed in public good games can behere observed: initially high and declining contributions, though patterns appear as beingrelatively stable over time.
23A different way to look at these results is to investigate how beliefs about others with a same or adifferent endowment as one’s own compare across rich and poor subjects. Table B2 in Appendix B.2 reportsresults from this exercise using OLS regressions.
18

Figure 5: Endowment contributed (%), Stage 4
In the analyses of subjects’ behaviour, I will measure contributions as the proportionof the endowment contributed to the public good. As full contribution on behalf of allsubjects maximises social collective earnings, the proportion of endowment contributedcan be taken as a measure of subjects’ cooperativeness.24 In previous studies contributionsby rich participants tend to be relatively smaller and close to those of poor participants inabsolute terms. As subjects are here unaware of others’ behaviour, matching of absolutecontributions (e.g. Buckley and Croson, 2006; Reuben and Riedl, 2013) is unlikely to beobserved.
The remainder of this section investigates beliefs and behaviours by means of OLSregressions with standard errors are clustered at group level. The results are robust tocorresponding Tobit regressions.25 All regressions control for subject- and group-levelcharacteristics. Subject-level controls include success in Stage 2, gender, age, professionand the number of subjects in the session they personally were acquainted with. Group-level controls include the proportion of subjects who guessed correctly in Stage 2, theproportion of women. The groups’ chat activity intensity in ID conditions measures thenumber of chat lines exchanged.26 The number of chat lines controls for heterogeneity inthe condition effects generated by participation in the group cohesion reinforcement task.27
24For instance, Sugden (1984) suggests reciprocity norms in income-heterogeneous contexts require sub-jects to contribute equal proportions of their endowments. In Reuben and Riedl (2013), equality in pro-portions of endowment contributed substitutes equality in absolute amounts contributed as a behaviouralnorm if subjects can enforce it via punishment.
25As all correlations between OLS and Tobit predicted values exceed ρ=0.95 (Fischbacher and Gachter,2010), I report results from the OLS regressions for ease of interpretation and relegate Tobit results toAppendix C.1.
26This variable takes on a continuous measure ranging from 0 to 23. It is interacted with the ID conditionindicator to distinguish between the groups in ID conditions who did not chat from groups in the NoIDconditions who couldn’t chat.
27That groups in ID could interact does not mean they would do so. The amount of interaction occurring
19

Because I am interested in how ex-ante expectations of others’ cooperativeness arerelated to contribution behaviour, I will include the beliefs elicited in Stage 3 in the regres-sions.28 In addition, analyses of contributions in the repeated game in Stage 4 will controlfor the time trend and, for each subject, for the average contribution of the other threeremaining group members in the previous period.
Table 3: Panel OLS regression of endowment contributed (%) in Stage 4.
Endowment contributed (%)Stage 4, all conditions
Baseline: UNEQUAL NoID
EQUAL-NoID 5.147 3.877 3.595 3.119(3.840) (3.059) (3.138) (3.115)
UNEQUAL-ID -0.177 1.11 0.896 0.921(3.978) (3.562) (3.497) (3.263)
EQUAL-ID 6.459* 1.695 1.205 1.272(3.910) (3.055) (3.079) (2.951)
Period -1.627*** -1.627*** -1.783*** -1.776***(0.173) (0.173) (0.189) (0.188)
Average beliefs 0.546*** 0.529*** 0.293***(0.0515) (0.0531) (0.0685)
Others’ previous contrib. 0.0337 0.0385(0.0318) (0.0321)
Contribution in Stage 3 0.270***(0.0568)
Constant 54.64*** 22.46*** 23.18*** 20.64***(6.730) (6.213) (6.786) (6.453)
Group controls
Chat activity
Individual controls
Observations 3,600 3,600 3,240 3,240Size of cross-section 360 360 360 360
Coefficient comparisonsH0: EQUAL-NoID=EQUAL-ID, p-value 0.755 0.538 0.505 0.599
Notes: Robust standard errors in parenthesis*** Significant at the 1 percent level.** Significant at the 5 percent level.* Significant at the 10 percent level.Subject level controls: success in Stage 2, gender, age, profession, number of acquaintances inthe session. Group level controls: proportion of correct Stage 2 guesses, proportion of women.Chat activity: number of chat lines exchanged by the group in the ID conditions.
in Stage 2 will determine the strength and success of the team building activity in reinforcing group cohesion,resulting in heterogeneous effects on both individuals’ cooperativeness and their beliefs about that of others.Sensitivity checks for the inclusion of chat activity and condition indicators for all sets of regressions canbe found in Appendix C.6.
28When pooling all conditions, the variable is constructed as the beliefs elicited in EQUAL groups andthe average of beliefs about rich and poor subjects in UNEQUAL groups.
20

Table 3 reports estimates from a panel OLS regression of contributions to the repeatedpublic good game in Stage 4.29 First, here and throughout the remaining analyses thenegative coefficient on the Period variable indicates that contributions are following thedeclining patterns observed in previous research. This result is driven by the (observed)decline in own earnings for any given level of own previous contribution due to decliningcooperation on behalf of other group members (“Others’ previous contrib.”).30 As noinformation on individual contributions was provided to the subjects, no benchmarkingof own contributions against that of any specific other group member could take place.Such behaviour would have weakened any relationship between ex-ante beliefs and owncontribution levels in the repeated game. From columns 2-4 of Table 3, ex-ante beliefsstrongly predict cooperation levels: a 1 percentage point increase in average beliefs isassociated with approximately a 0.5 percentage points increase in cooperation,31 close tothe impact of beliefs on cooperation estimated by Fischbacher and Gachter (2010).
29Separate analyses for periods 1 to 5 and 6 to 10 can be found in Appendix C.3.30Regressions excluding the Period variable can be found in Appendix C.6.31The drop in size of this estimate once contributions in Stage 3 are controlled for is clarified by the
analysis of Stage 3 behaviours reported in Appendix B.1.
21

Table 4: UNEQUAL: Panel OLS regression of endowment contributed (%) inStage 4.
Endowment contributed (%)Stage 4, UNEQUAL conditions
Baseline: PoorNoID
RichNoID -6.489* -7.837** -7.640** -9.860***(3.464) (3.219) (3.223) (3.114)
PoorID 8.731* 8.861** 8.875** 8.418**(4.630) (4.450) (4.496) (4.041)
RichID -7.944* -6.662 -6.765 -9.586**(4.208) (4.238) (4.179) (3.869)
Period -1.541*** -1.541*** -1.759*** -1.754*** -1.750***(0.249) (0.249) (0.273) (0.270) (0.271)
Beliefs about rich 0.330*** 0.323*** 0.221***(0.0638) (0.0652) (0.0693)
Beliefs about poor 0.118 0.0969 -0.0748(0.0757) (0.0788) (0.0686)
Others’ previous contribution 0.00553 0.00911 0.0120(0.0422) (0.0430) (0.0427)
Contribution in Stage 3 0.301***(0.0622)
Interactions: beliefs about richPoorNoID 0.254*
(0.149)RichNoID 0.379***
(0.0696)PoorID 0.473***
(0.116)RichID 0.155
(0.117)Interactions: beliefs about poorPoorNoID 0.235
(0.206)RichNoID -0.128
(0.0873)PoorID 0.129
(0.117)RichID 0.129
(0.111)
Constant 57.49*** 26.35*** 29.83*** 27.70*** 30.67***(8.260) (9.012) (10.03) (9.007) (9.541)
Group controls
Chat activity
Individual controls
Observations 1,920 1,920 1,728 1,728 1,728Size of cross-section 192 192 192 192 192
Coefficient comparisonsH0: RichNoID=RichID, p-value 0.712 0.768 0.822 0.938H0: Beliefs ab. rich=Beliefs ab. poor,p-value
0.083 0.072 0.007
Notes: Robust standard errors in parenthesis*** Significant at the 1 percent level.** Significant at the 5 percent level.* Significant at the 10 percent level.Subject level controls: success in Stage 2, gender, age, profession, number of acquaintances in the session.Group level controls: proportion of correct Stage 2 guesses, proportion of women. Chat activity: numberof chat lines exchanged by the group in the ID conditions.
22

Table 4 restricts the analysis to the unequal groups. I here include dummies for richand poor subjects by NoID and ID conditions, and include beliefs about rich and poorsubjects as separate regressors.32 Strikingly, while the correlation between cooperationand beliefs about rich subjects is large, positive and significant, that between cooperationand beliefs about poor subjects is significantly smaller and not significantly different fromzero. Similar to what observed in Table 3, we find a reduction in the size of the coefficienton beliefs about rich subjects after controlling for individual contributions in Stage 3. Thelast column of Table 4, estimating separate coefficients for beliefs about rich and poorsubjects interacted with subject type and ID and NoID condition confirms these results.
Result 2. Ex-ante beliefs about others’ cooperativeness are positively correlated with co-operation levels. In UNEQUAL groups cooperation is more strongly correlated with beliefsabout the rich than with those about the poor.
In addition to supporting Hypothesis 2 that behaviours correlate positively with ex-antebeliefs, Result 2 also uncovers an asymmetry in cooperative behaviours: subjects appearto be conditionally cooperative with respect to their beliefs about the rich but not withrespect to those about the poor.
Group cohesion, ex-ante beliefs and cooperation
From Table 2, rich subjects are still expected to contribute more after group cohesion isreinforced. Despite losing significance on the difference between beliefs about rich andpoor subjects elicited from rich subjects, the absolute size of the difference remains largeand similar in magnitude to that observed in the NoID condition after group cohesion hasbeen reinforced (12.08 and 7.4 percentage points for poor and rich subjects respectively).Similarly, differences in beliefs about rich and poor subjects can still be recognised aftercohesion reinforcement from the estimated coefficients in Table B2 (the point estimate onPoorID and the baseline PoorNoID, and the point estimates on RichID and RichNoIDcannot be distinguished).
Result 3. No evidence of an impact of reinforced group cohesion on the salience of en-dowment differences for belief formation.
Result 3 rejects Hypothesis 3.Moreover, Table 3 reveals that little of the variation in contributions can be explained
by reinforcement of group cohesion. Contributions in EQUAL-ID cannot be distinguishedfrom those in EQUAL-NoID as emerging from the p-values of coefficient comparisons. Sim-ilarly, contributions in UNEQUAL-ID cannot be distinguished from those in the baselineUNEQUAL-NoID.
32Analyses relating contributions to beliefs according to endowment similarity and split-sample analyseson rich and poor subjects can be found in Appendix C.2 and C.4 respectively.
23

Result 4. Reinforced group cohesion does not significantly impact contributions to thepublic goods.
Result 4 provides evidence in favour of Hypothesis 4a and against Hypothesis 4b: Inneither EQUAL nor UNEQUAL does reinforcing group cohesion translate into increasedcontributions. A more complex picture emerges from Table 4: When focusing on unequalgroups and distinguishing between rich and poor subjects, reinforcement of group cohesionhas a positive effect on poor subjects’ contributions, but not on those of the rich. Pointestimates on PoorID indicate that poor subjects who participated to the team buildingactivity exceed by 8 percentage points those of poor subjects in the UNEQUAL-NoIDcondition.33
5 Discussion and conclusion
Conditional cooperation has been widely documented and investigated in previous litera-ture. Following the seminal works of Keser and Van Winden (2000) and Fischbacher et al.(2001), such behavioural regularity has been repeatedly observed in a wide array of dif-ferent contexts using laboratory, field as well as survey data (Frey and Meier, 2004; Freyand Torgler, 2004; Croson et al., 2005; Kocher et al., 2008; Herrmann and Thoni, 2009;Fischbacher et al., 2012; Martinsson et al., 2013; Bazart and Bonein, 2014; Cubitt et al.,2017). More recent evidence has gathered that cooperation is not only conditioned on oth-ers’ observed behaviours, but also on what individuals believe about others’ cooperativebehaviour following continuously updated information about their past behaviours (Fis-chbacher and Gachter, 2010; Smith, 2011). While these mechanisms have been extensivelystudied in the context of homogeneous groups, little attention has been however devoted tothe fact that individuals might have different beliefs about different interacting partners.In economic interactions, where individuals must spend their resources into cooperativejoint projects, the amount of resources available to different cooperating partners mightinfluence what is believed about their cooperativeness, with far reaching consequences. Inan extreme example, a single individual’s observable characteristics inducing low expecta-tions of cooperation in a group of strong conditional cooperators might cause cooperationto unravel quickly, preventing the group from reaping potential benefits.
This paper provides evidence that indeed what is expected of others prior to any inter-action taking place, based solely on what is observed of the interacting partners, namely theresources available for cooperation, shapes individuals’ beliefs of others’ cooperativeness.The beliefs here studied hence are born out of the cooperativeness individuals subjectivelyattribute others with different endowments, rather than out of what others are known tohave done in the past. What is observed of others, from clothing and car model to ethnicity,is often observed with greater precision than private past behaviours, might offer cues to
33An analysis of behaviours in Stage 3 is relegated to Appendix B.1.
24
the person’s socio-economic status, and might constitute the basis upon which subjectivebeliefs about that person are formed.
The findings here presented reveal that endowment sizes do influence what people ex-pect of each other. In particular, rich subjects are expected to cooperate more than poorones (Result 1), in line with arguments that greater affluence and lower costs of cooper-ation would lead others to believe the rich will cooperate more. Result 1 contrasts withfindings that others similar to oneself are attributed more positive qualities (Hewstoneet al., 2002; Chen and Li, 2009; Guala et al., 2013), pointing towards differences betweennon-economic and economic forms of heterogeneity and a prevalence of the economic di-mension over the non-economic one.
Ex-ante beliefs about others formed prior to the interaction taking place are stronglycorrelated with long-run cooperation levels, both under equality and inequality. This paperhowever highlights a striking asymmetry between beliefs formed about rich or poor subjectsin unequal groups: beliefs about richer subjects are stronger correlates of behaviour thanbeliefs about poorer ones (Result 2), an important finding in the light of Result 1, showingthat more cooperation is expected of rich subjects.
It appears moreover as the salience of endowment differences in the formation of beliefsis robust to reinforcement of group cohesion: The rich are still expected to cooperate morethan the poor (Result 3). This evidence is aligned with Charness et al. (2014), who findthat high-endowment individuals tend to segregate from others despite participation inteam building activities. Likewise, aggregate cooperativeness is not affected by reinforcedgroup cohesion (Result 4), though a positive and statistically significant effect on poorsubjects’ contributions can be detected in unequal groups. Previous research against whichto benchmark these results is recent and scarce. Though important design differenceslimit comparability, the results here obtained in unequal groups contradict the findingsby Charness et al. (2014) and Weng and Carlsson (2015), who found participation inteam building exercises to increase contributions. This begs a companion question to theone asked above: Is information about others’ actions a crucial ingredient necessary forinterventions reinforcing group cohesion to exert a positive impact on cooperation?
This paper contributes to our understanding of how economic heterogeneity shapesindividuals’ beliefs, and how such beliefs are used to steer one’s cooperative choices. Onetake-away from these results is that how information is disseminated, about who and towhom might prove to be consequential choices: the design of information and feedbackschemes should pay attention to the belief patterns shaped by social heterogeneity, andto the consequent (belief driven) conditional cooperation generated. For instance, I havehere drawn attention to the fact that stronger conditional cooperation is observed withrespect to behaviours of those who are expected to behave most cooperatively. Gaining abetter insight into which social groups, along different dimensions, generate higher expec-tations and stronger conditional behaviours would prove a viable tool for future researchto improve the effectiveness of information dissemination as a way to foster greater con-ditional cooperation. These considerations moreover provide a new real-world dimension
25
to the conditional cooperation phenomenon, which gains new relevance in the light of theresonance antisocial and uncooperative behaviours (for instance tax evasion or avoidance(Garside, 2016)) has in the mass and new media. Moreover, an important question arisesas to whether institutional design should take asymmetric conditional cooperation intoaccount (e.g. in the design of tax schemes or in planning tax cuts).
Recent literature has investigated the behavioural consequences of misplaced expec-tations, finding evidence for a strong aversion to being let-down: investigating the roleof let-down aversion in interaction with the subjects’ reference framework (absolute orrelative) in generating the weaker cooperation often (but not consistently) observed in en-dowment heterogeneous experimental public good games is a promising avenue for futureresearch.34
Future work should also investigate whether the same patterns here uncovered are alsogenerated by non-economic forms of heterogeneity, where different forces than the economicone might drive individuals’ expectations (e.g. in/out-groups, non-economic status), andat directly observing asymmetries in conditional behaviours. Finally, I hope the findingshere presented will moreover spur theoretical and empirical research into the origin ofasymmetric conditional cooperation and of the asymmetric belief formation process hereobserved, both in the context of the evolution of human society and of its hierarchicalstructures and in that of contemporary social organizations.
34Though not reported here, the data collected for this experiment clearly shows that the rich system-atically contribute relatively less than their poor counterparts.
26
References
Akerlof, G. A. and Kranton, R. E. (2000), ‘Economics and Identity’, The Quarterly Journalof Economics 115(3), 715–753.
Alesina, A., Baqir, R. and Easterly, W. (1999), ‘Public Goods and Ethnic Divisions’, TheQuarterly Journal of Economics 114(4), 1243–1284.
Alesina, A. and La Ferrara, E. (2000), ‘Participation in Heterogeneous Communities’, TheQuarterly Journal of Economics 115(3), 847–904.
Anderson, L. R., Mellor, J. M. and Milyo, J. (2008), ‘Inequality and public good provision:An experimental analysis’, The Journal of Socio-Economics 37(3), 1010–1028.
Andreoni, J. and Scholz, J. K. (1998), ‘An Econometric Analysis of Charitable Giving withInterdependent Preferences’, Economic Inquiry 36(3), 410–428.URL: https://onlinelibrary.wiley.com/doi/abs/10.1111/j.1465-7295.1998.tb01723.x
Bazart, C. and Bonein, A. (2014), ‘Reciprocal relationships in tax compliance decisions’,Journal of Economic Psychology 40, 83–102.URL: http://www.sciencedirect.com/science/article/pii/S0167487012001183
Bull, R. and Rumsey, N. (2012), The Social Psychology of Facial Appearance, SpringerScience & Business Media. Google-Books-ID: whvSBwAAQBAJ.
Chakravarty, S. and Fonseca, M. A. (2014), ‘The effect of social fragmentation on pub-lic good provision: An experimental study’, Journal of Behavioral and ExperimentalEconomics 53, 1–9.
Charness, G., Cobo-Reyes, R. and Jimenez, N. (2014), ‘Identities, selection, and contribu-tions in a public-goods game’, Games and Economic Behavior 87, 322–338.
Chaudhuri, A., Graziano, S. and Maitra, P. (2006), ‘Social Learning and Norms in a PublicGoods Experiment with Inter-Generational Advice’, Rev Econ Stud 73(2), 357–380.URL: https://academic.oup.com/restud/article/73/2/357/1520908
Chaudhuri, A. and Paichayontvijit, T. (2006), ‘Conditional cooperation and voluntarycontributions to a public good’, Economics Bulletin 3(8), 1–14.
Chaudhuri, A., Paichayontvijit, T. and Smith, A. (2017), ‘Belief heterogeneity and contri-butions decay among conditional cooperators in public goods games’, Journal of Eco-nomic Psychology 58, 15–30.URL: http://www.sciencedirect.com/science/article/pii/S0167487016300277
Chen, R. and Chen, Y. (2011), ‘The Potential of Social Identity for Equilibrium Selection’,The American Economic Review 101(6), 2562–2589.
27

Chen, Y. and Li, S. X. (2009), ‘Group identity and social preferences’, The AmericanEconomic Review 99(1), 431–457.
Christopher, A. N. and Schlenker, B. R. (2000), ‘The impact of perceived material wealthand perceiver personality on first impressions’, Journal of Economic Psychology 21(1), 1–19.URL: http://www.sciencedirect.com/science/article/pii/S0167487099000331
Croson, R., Fatas, E. and Neugebauer, T. (2005), ‘Reciprocity, matching and conditionalcooperation in two public goods games’, Economics Letters 87(1), 95–101.URL: http://www.sciencedirect.com/science/article/pii/S0165176504003325
Croson, R. T. A. (2007), ‘Theories of Commitment, Altruism and Reciprocity: Evidencefrom Linear Public Goods Games’, Economic Inquiry 45(2), 199–216.
Cubitt, R., Gachter, S. and Quercia, S. (2017), ‘Conditional cooperation and betrayalaversion’, Journal of Economic Behavior & Organization 141, 110–121.URL: https://linkinghub.elsevier.com/retrieve/pii/S0167268117301713
Currarini, S. and Mengel, F. (2016), ‘Identity, homophily and in-group bias’, EuropeanEconomic Review 90, 40–55.
Dovidio, J. F., Piliavin, J. A., Schroeder, D. A. and Penner, L. (2006), The social psychologyof prosocial behavior, Lawrence Erlbaum Associates Publishers.
Duarte, J., Siegel, S. and Young, L. (2012), ‘Trust and Credit: The Role of Appearance inPeer-to-peer Lending’, Rev Financ Stud 25(8), 2455–2484.URL: https://academic.oup.com/rfs/article/25/8/2455/1570804
Dubois, D., Rucker, D. D. and Galinsky, A. D. (2015), ‘Social class, power, and selfishness:When and why upper and lower class individuals behave unethically.’, Journal of Per-sonality and Social Psychology 108(3), 436–449.URL: http://doi.apa.org/getdoi.cfm?doi=10.1037/pspi0000008
Fischbacher, U. (2007), ‘Z-Tree: Zurich toolbox for ready-made economic experiments’,Experimental economics 10(2), 171–178.
Fischbacher, U. and Gachter, S. (2010), ‘Social Preferences, Beliefs, and the Dynamics ofFree Riding in Public Goods Experiments’, American Economic Review 100(1), 541–556.
Fischbacher, U., Gachter, S. and Fehr, E. (2001), ‘Are people conditionally cooperative?Evidence from a public goods experiment’, Economics Letters 71(3), 397–404.
Fischbacher, U., Gachter, S. and Quercia, S. (2012), ‘The behavioral validity of the strategymethod in public good experiments’, Journal of Economic Psychology 33(4), 897–913.URL: http://www.sciencedirect.com/science/article/pii/S0167487012000499
28

Fiske, S. T., Cuddy, A. J. C., Glick, P. and Xu, J. (2002), ‘A model of (often mixed)stereotype content: Competence and warmth respectively follow from perceived statusand competition.’, Journal of Personality and Social Psychology 82(6), 878–902.URL: http://doi.apa.org/getdoi.cfm?doi=10.1037/0022-3514.82.6.878
Frey, B. and Meier, S. (2004), ‘Social comparisons and pro-social behaviour: testing condi-tional cooperation in a field experiment’, American Economic Review 94(5), 1717–1722.
Frey, B. S. and Torgler, B. (2004), Taxation and Conditional Cooperation, SSRN ScholarlyPaper ID 662083, Social Science Research Network, Rochester, NY.URL: https://papers.ssrn.com/abstract=662083
Gachter, S. (2015), ‘Behavioural economics: Visible inequality breeds more inequality’,Nature 526(7573), 333.
Garside, J. (2016), ‘A world of hidden wealth: why we are shining a light offshore’, TheGuardian .
Ghosh, P. and Ray, D. (1996), ‘Cooperation in Community Interaction Without Informa-tion Flows’, Rev Econ Stud 63(3), 491–519.URL: https://academic.oup.com/restud/article/63/3/491/1553002
Guala, F., Mittone, L. and Ploner, M. (2013), ‘Group membership, team preferences, andexpectations’, Journal of Economic Behavior & Organization 86(Supplement C), 183–190.
Herrmann, B. and Thoni, C. (2009), ‘Measuring conditional cooperation: a replicationstudy in Russia’, Exp Econ 12(1), 87–92.URL: https://doi.org/10.1007/s10683-008-9197-1
Hewstone, M., Rubin, M. and Willis, H. (2002), ‘Intergroup Bias’, Annual Review of Psy-chology 53(1), 575–604.
Hofmeyr, A., Burns, J. and Visser, M. (2007), ‘Income inequality, reciprocity and pub-lic good provision: An experimental analysis’, South African Journal of Economics75(3), 508–520.
Keser, C. and Van Winden, F. (2000), ‘Conditional Cooperation and Voluntary Contribu-tions to Public Goods’, Scandinavian Journal of Economics 102(1), 23–39.
Kocher, M. G., Cherry, T., Kroll, S., Netzer, R. J. and Sutter, M. (2008), ‘Conditionalcooperation on three continents’, Economics Letters 101(3), 175–178.URL: http://www.sciencedirect.com/science/article/pii/S0165176508002036
29

Kraus, M. W., Piff, P. K., Mendoza-Denton, R., Rheinschmidt, M. L. and Keltner, D.(2012), ‘Social class, solipsism, and contextualism: How the rich are different from thepoor.’, Psychological Review 119(3), 546–572.
Little, A. C. and Roberts, S. C. (2012), ‘Evolution, Appearance, and Occupational Success’,Evol Psychol 10(5), 147470491201000503.URL: https://doi.org/10.1177/147470491201000503
Luttmer, E. F. P. (2001), ‘Group Loyalty and the Taste for Redistribution’, Journal ofPolitical Economy 109(3), 500–528.
Martinsson, P., Pham-Khanh, N. and Villegas-Palacio, C. (2013), ‘Conditional cooperationand disclosure in developing countries’, Journal of Economic Psychology 34, 148–155.URL: http://www.sciencedirect.com/science/article/pii/S0167487012001055
Piff, P. K., Kraus, M. W., Cote, S., Cheng, B. H. and Keltner, D. (2010), ‘Having less,giving more: The influence of social class on prosocial behavior.’, Journal of Personalityand Social Psychology 99(5), 771–784.
Reuben, E. and Riedl, A. (2013), ‘Enforcement of contribution norms in public good gameswith heterogeneous populations’, Games and Economic Behavior 77(1), 122–137.
Roccas, S. and Brewer, M. B. (2002), ‘Social identity complexity’, Personality and SocialPsychology Review 6(2), 88–106.
Smith, A. (2011), ‘Group composition and conditional cooperation’, The Journal of Socio-Economics 40(5), 616–622.
Smith, A. (2013), ‘Estimating the causal effect of beliefs on contributions in repeated publicgood games’, Experimental Economics 16(3), 414–425.URL: https://link.springer.com/article/10.1007/s10683-012-9345-5
Sugden, R. (1984), ‘Reciprocity: The supply of public goods through voluntary contribu-tions’, The Economic Journal 94(376), 772–787.
Turner, J. C., Hogg, M. A., Oakes, P. J., Reicher, S. D. and Wetherell, M. S. (1987),Rediscovering the Social Group: A Self-Categorization Theory, Vol. x, Basil Blackwell,Cambridge, MA, US.
Turner, J. C. and Tajfel, H. (1986), The social identity theory of intergroup behavior, inS. Worchel and W. Austin, eds, ‘The Psychology of Intergroup Relations’, Nelson-Hall,Chicago, pp. 7–24.
Weng, Q. and Carlsson, F. (2015), ‘Cooperation in teams: The role of identity, punishment,and endowment distribution’, Journal of Public Economics 126, 25–38.
30

Wenzel, M. (2007), ‘The multiplicity of taxpayer identities and their implications for taxethics’, Law & Policy 29(1), 31–50.
31

Appendix
A Experimental instructions
32

Welcome!
You are now taking part in a study which has been financed by various science foundations.
Please read these instructions carefully before the study starts.
These instructions are only for your own information.
Do not communicate with other people in this room during the course of the session.
Should you have any questions please ask us by raising your hand and you’ll be answered privately.
If you violate this rule, you shall be excluded from the study and from all payments.
You will receive a show-up fee of 5 Euros for being here, in addition to your earnings from the study.
The study is computerized; hence all your choices and actions will be made via the computer
terminal in front of you. Similarly, you will receive information on the computer screen.
Every choice you make will be recorded in data files and linked to each other via an anonymous
identification number. Therefore we will never be able to link choices to the identity of the person
taking them.
Further, no other person in this room will ever know which choices you made, nor will you be
informed of which person in the room made a particular choice.
The information on the following pages describes the study in detail.
The study is divided into three Sections.
These instructions refer to Section I. The instructions for Section II will be distributed at the end of
Section I.
Section I
In Section I, you will be assigned an amount of Points which you will use in Section III of the study.
You will also be assigned to a group 4 people. This group will remain the same in Sections II and III.
The number of points you will have at the end of the study can vary according to your choices and to
those of the other group members in Section III. The amount of points you will have at the end of the
study will be converted into Euros at a predefined exchange rate, equal for everyone, which will be
communicated later on.
You will see your group displayed on your screen as soon as Section I starts.
Should you have any questions, please raise your hand.
NB: Please return all materials at the end of the study!

Section II
These are the instructions for Section II. The instructions for Section III will be distributed at the end
of Section II.
In Section II you will be shown 5 pairs of paintings by two artists. You will have 5 minutes to study
these paintings. You can scroll between the pairs with the NEXT and PREVIOUS buttons.
At the end of the sequence of 5 pairs, you will find two extra paintings. You will be asked to answer
questions about these two other paintings. The questions are visible below each painting.
If you answer all questions correctly you will be awarded 4 additional euros in addition to your
earnings from the study.
You will have 5 minutes to review the paintings; then you will be asked to provide your answers.
---The following paragraph was provided to subjects in EQUAL-ID and UNEQUAL-ID only ---
[You may get help from or help other members in your own group while reviewing the paintings
through an online chat box on your screen. Only your group will be able to read your chat messages.]
The answers you submit are individual. Your earnings from this Section will be determined only by
the answers you provided, and are not influenced by the answers provided by the other members
of your group.
You will be told whether you answered correctly and receive answer keys to the questions at the end
of the study.
If you answer all questions correctly you will earn 3 euros in addition to your earnings from Section
III.
Notice that your task and earnings in this section do not affect, and are not affected by, Section I.
Similarly, your earnings from this Section will not affect, and will not be affected by, your choices in
Section III.
Please raise your hand if you have any questions, and we will come to help you.
NB: Please return all materials at the end of the study!

Section III
Your group in Section III is the same as in Section II.
We will compute earnings from Section III in “Tokens”.
Section III is divided into Part A and Part B. In both parts you will participate to the same task.
The difference between Part A and Part B are described after the description of the task.
The task
Your group has a project. Each group member has an amount of Points in their endowment.
Your task is to decide how many Points of your endowment you want to contribute to the project
and how many you want to keep for yourself.
Your earnings depend on how many Points you contribute to the project and on how many Points
are contributed by the other group members.
Your earnings consist of two parts:
(1) The Points which you have kept for yourself (“Earnings from Points kept”) for which
1 Point= 1 Token, and
(2) The “earnings from the project”, for which:
Earnings in Tokens from the project = 0.5 x total amount of Points contributed by the group.
Therefore, your earnings are given by:
Earnings in Tokens = (Your endowment – your contribution to the project) + 0.5 x (total Points
contributed to the project by the group).
The earnings from the project of each group member are calculated in the same way. This means
that each group member receives the same earnings from the project.
Suppose that the sum of contributions of all group members is 20 Points. In this case each member
of the group earns from the project 0.5*20=10 Tokens. If the total contribution to the project is 10
Points, then each group member will earn 0.5*10=5 Tokens from the project.
For each Point you keep you earn 1 Token.
If instead you contributed that 1 Point to the project, the total contribution to the project would then
rise by one Point, and your earnings from the project would rise by 0.5*1=0.5 Tokens.
Similarly, the earnings from the project of each other group member would also rise by 0.5 Tokens
each, so that the total earnings of the group would rise by 0.5*4=2 Tokens. Your contribution to the
project therefore also raises the income of the other group members. Similarly, your earnings
increase for each Point contributed by the other members to the group project.
For each Point contributed by any other member you earn 0.5*1=0.5 Tokens.
You will make your choices on the input screen. In the top right corner there is a clock in seconds,
showing how much time remains for you to make a decision.
In the top section you will find the information about the composition of your group which you saw
at the end of Section I. You are highlighted in Red. Each group member is now identified by a

randomly assigned number, which will remain the same for the whole duration of Section III. This
random number is assigned to each group member as soon as Section III starts and it cannot be
changed.
It is impossible for other group members, to link this number to your identity.
At the bottom of the screen you can enter your contribution in Points to the project.
The amount of Points you can choose how to allocate between your private account and the project
is equal to your endowment. You choose your contribution to the project by entering a number
between 0 and your endowment in the window. As soon as you have defined your contribution in
Points you will also have defined the amount of Points you will keep for yourself:
Points kept = Endowment - your contribution in Points to the project.
After you entered your contribution, you can press the OK-button to confirm it.
Part A
In Part A you will participate to the task only once. Your earnings in Tokens from Part A will be
converted in Euros at a rate of 15 Tokens = 1 Euro.
In Part A, you will also be asked to guess the contributions of other group members. You can receive
additional payments from guessing accurately.
You will receive additional information about Part A on your screen at the beginning of Part A.
Part B
In Part B you will instead participate to the task for 10 Periods.
Your earnings in Tokens from Part B are the sum of your earnings in Tokens in the 10 periods.
Your earnings in Tokens from Part B will be converted in Euros at a rate of 150 Tokens = 1 Euro.
At the end of the study, only one of Part A and Part B will be valid for payment, and will be
randomly selected by the software. If Part A is selected, you will be paid in cash according to your
earnings in Part A. If Part B is selected, you will be paid in cash according to your earnings in Part B.
This does not affect your earnings from Section II.
You will receive information about your earnings in Part A and B at the end of Section III.
Notice: your earnings from the guesses in Part A will always be paid out, regardless of whether Part A
or Part B has been randomly selected to be valid for payment.
Remark:
In each Period of Part B you will receive information about your earnings in Tokens in the previous
period. Since Period 1 is the first period, your earnings in the previous Period cannot be shown.
A Period ends the moment in which each member of each group made their choice. Your earnings in
each Period of Part B are only affected by your and the other’s choices in that Period, independently
of your earnings and choices in previous or later Periods.
Do you have any questions? (Please, raise your hand and we will come to help you)
Before starting Section III, please take 5 minutes to answer some questions. These are only meant for
you to get familiar with the task and gauge your understanding, and will not affect your earnings.
NB: Please return all materials at the end of the study!

B Further analyses
B.1 Behaviours in Stage 3
It is worth spending some time on the behaviours observed in Stage 3, analysed via OLSin Table B1. Columns 1 and 2 pool all conditions together, while columns 3 to 6 restrictthe sample to data from UNEQUAL conditions. Columns 1 and 2 reveal no significantdifferences in contributions across conditions, while Column 2 reveals that an increase inaverage beliefs is associated with an increase in cooperation at a rate close though not equalto unity (p-value=0.028), confirming that subjects appear to condition their cooperationon their beliefs. Such high correlation between Stage 3 behaviours and beliefs helps explainthe drop in the coefficients associated with beliefs observed in Tables 3 and 4 once Stage 3behaviours are included in the regression. Focusing on the unequal conditions, we find incolumn 3 that the rich appear now contributing more than the poor (in absolute terms),contrary to what Table 4. This observation is not robust to the inclusion of beliefs incolumn 5, suggesting the latter are capturing the difference.
Turning to beliefs, from column 4, both beliefs about rich and poor subjects are strongly,positively and significantly correlated with behaviours. Adopting an alternative perspec-tive and looking at how beliefs about others with a same and different endowment correlatewith behaviours reveals that while the coefficient on same-endowment beliefs is large, pre-cisely estimated and close to unity (p-value=0.025), that on different-endowment beliefsturns out to be small and not significantly different from zero. The last column of TableB1 confirms that this finding holds separately within each of the conditions. Spearmanrank correlations of beliefs about same and different-endowment subjects with Stage 3 con-tributions equal 0.755 (p<0.001) and 0.292 (p<0.001), respectively35: cooperation is morestrongly correlated with beliefs about others with one’s same endowment.
35Scatter plots can be found in Figure D4 in Appendix D.
37

Table B1: Stage 3: OLS regression of contribution on conditions.
Endowment contributed (%), Stage 3All conditions Unequal conditions only
Baseline: UNEQUAL-NoID
EQUAL 3.718 1.683(4.183) (3.265)
UNEQ-ID -2.148 -0.0755(5.360) (4.210)
EQUAL-ID 7.298 -0.343(4.901) (3.677)
Average beliefs 0.876***(0.0554)
Baseline: PoorNoIDRichNoID 11.68* 7.345 -1.592
(6.461) (5.308) (4.167)PoorID 3.565 1.504 2.152
(6.704) (5.362) (4.325)RichID 10.28 9.288 2.018
(7.244) (6.344) (5.032)
Beliefs about rich 0.336***(0.0774)
Beliefs about poor 0.570***(0.0969)
Endowment similaritySame-endowment belief 0.858***
(0.0614)Different-endowment belief 0.0207
(0.0577)
Constant 59.97*** 8.365 49.28*** 6.358 -1.815(8.974) (5.938) (10.59) (8.197) (6.143)
Group controls
Chat activity
Individual controls
Observations 360 360 192 192 192R-squared 0.052 0.480 0.092 0.502 0.632
Notes: Robust standard errors in parenthesis*** Significant at the 1 percent level.** Significant at the 5 percent level.* Significant at the 10 percent level.Subject level controls: success in Stage 2, gender, age, profession, number of acquaintancesin the session. Group level controls: proportion of correct Stage 2 guesses, proportion ofwomen. Chat activity: number of chat lines exchanged by the group in the ID conditions.
This observation is in line with Smith (2011), exploring the impact of subjects’ beliefs aboutother group members under non-economic36 forms of heterogeneity (endowments are uni-
36I refer the interested reader to the original article for details about the implementation.
38
formly distributed), finding that subjects tend to more strongly condition their behaviourson beliefs about others perceived as most similar to themselves. As in Smith (2011), sub-jects in this paper all contribute to the public good in Stage 3 from a uniform endowment.With regard to cooperation, endowment heterogeneity in Stage 3 can be therefore thoughtof as non-economic in nature, only distinguishing individuals based on the label attached totheir endowment (“20” or “60”). Once the relevance of endowment differences is removedfrom the contingent situation in which the players are called upon to cooperate, this wouldsuggests inequality to organise behaviours and conditional cooperation in the same wayas other forms of non-economic heterogeneity 37: As in Smith (2011), individuals tend tomore strongly condition behaviours on beliefs about similar others. Caution is warrantedhowever in interpreting the correlations here described: Because behaviours in Stage 3 wereelicited after the elicitation of beliefs the presence of endogeneities upward biasing suchcorrelation cannot be excluded.38
B.2 Beliefs by endowment similarity
Table B2 reports regression estimates of beliefs in UNEQUAL conditions only.39 As twobelief measures are elicited from each subject, the analyses takes the form of seeminglyunrelated regressions.40 Estimates on individual and group controls are omitted.
Pooling over group cohesion conditions, the analysis in the first two columns esti-mates the difference in same-endowment beliefs and different-endowment beliefs (i.e. beliefsformed about subjects with the same and a different endowment as oneself, respectively,included as dependent variables) between rich and poor subjects (the dummy ‘rich’). Thecoefficient estimates on the ‘rich’ dummy reveal that beliefs about others’ cooperativenessare linked to their endowment size. In particular, rich subjects expect greater cooperationfrom fellow rich than poor subjects do from fellow poor. The effect is strong and statisti-cally significant. Conversely, rich subjects’ expectations of poor subjects’ cooperativenessare significantly lower than poor subjects’ expectations of rich subjects’ cooperativeness.The last two columns perform the same analysis but including a dummy variable for richand poor subjects who did and did not participate in the group cohesion reinforcementconditions. The same patterns can be recognised here, though statistical significance isweaker.
37See also Piff et al. (2010) for a discussion in social-psychology.38See Sections 1 and 2 for a detailed discussion of the design features here adopted to remove such endo-
geneities from the main analyses and results presented. An analysis of the relationship between behavioursin Stage 4 and beliefs according to endowment similarity can be found in Appendix C.2.
39Table C4 reports results of corresponding Tobit regressions.40Separate OLS regressions with standard errors clustered at group level yield the same results.
39

Table B2: OLS regression of beliefs by endowment similarity on subject typeindicators.
Separate Tobit regressionsUNEQUAL cond.
Same-end.beliefs
Different-end. beliefs
Same-end.beliefs
Different-end. beliefs
Baseline: Poor
Rich 11.93*** -9.488***(3.445) (3.367)
Baseline:Poor-NoID
Rich-NoID 15.66*** -7.347(4.853) (4.753)
Poor-ID 1.620 1.117(6.413) (6.281)
Rich-ID 9.883 -10.49*(6.413) (6.280)
Constant 59.68*** 52.767*** 58.32*** 51.94***(14.898) (14.549) (14.98) (14.67)
Group controls
Chat activity
Individual controls
Observations 192 192 192 192R-squared 0.119 0.096 0.125 0.099
Notes: Robust standard errors in parenthesis*** Significant at the 1 percent level.** Significant at the 5 percent level.* Significant at the 10 percent level.Subject level controls: success in Stage 2, gender, age, profession, number of acquaintancesin the session. Group level controls: proportion of correct Stage 2 guesses, proportion ofwomen. Chat activity: number of chat lines exchanged by the group in the ID conditions.Robust standard errors, clustered at group level, in parentheses. Same-endowmentbeliefs: beliefs about subjects with the same endowment as one’s own.Different-endowment beliefs: beliefs about subjects with a different endowment fromone’s own.
40
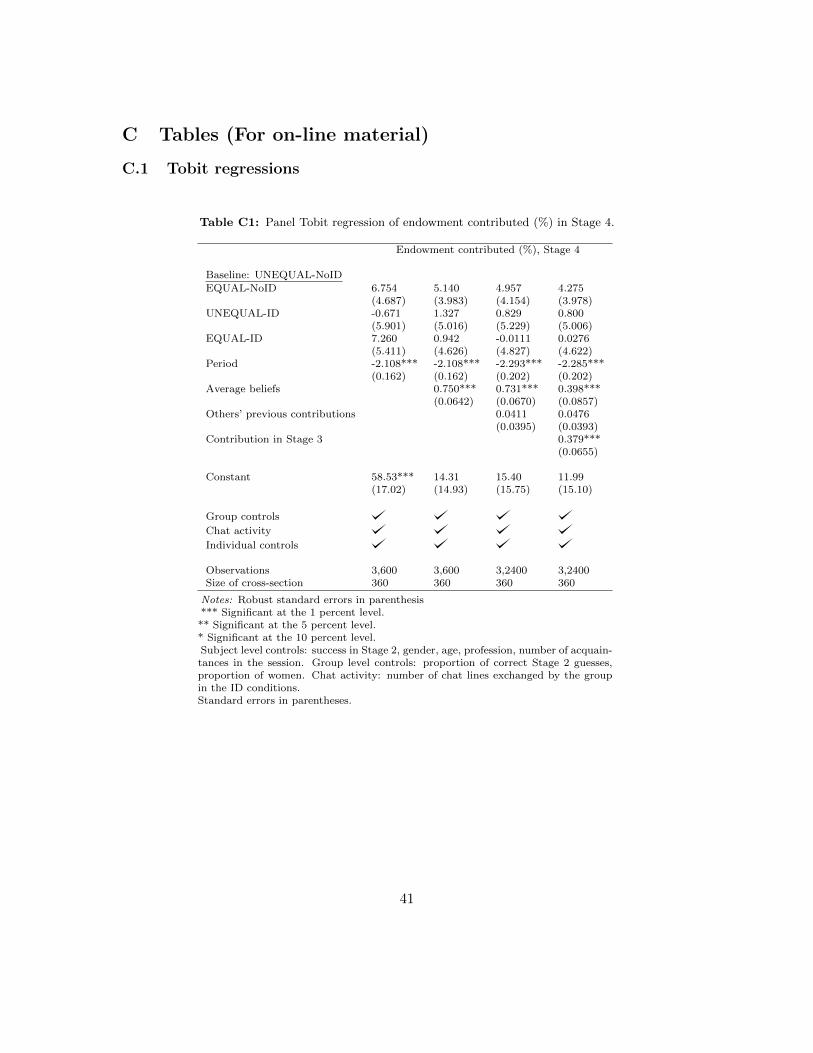
C Tables (For on-line material)
C.1 Tobit regressions
Table C1: Panel Tobit regression of endowment contributed (%) in Stage 4.
Endowment contributed (%), Stage 4
Baseline: UNEQUAL-NoID
EQUAL-NoID 6.754 5.140 4.957 4.275(4.687) (3.983) (4.154) (3.978)
UNEQUAL-ID -0.671 1.327 0.829 0.800(5.901) (5.016) (5.229) (5.006)
EQUAL-ID 7.260 0.942 -0.0111 0.0276(5.411) (4.626) (4.827) (4.622)
Period -2.108*** -2.108*** -2.293*** -2.285***(0.162) (0.162) (0.202) (0.202)
Average beliefs 0.750*** 0.731*** 0.398***(0.0642) (0.0670) (0.0857)
Others’ previous contributions 0.0411 0.0476(0.0395) (0.0393)
Contribution in Stage 3 0.379***(0.0655)
Constant 58.53*** 14.31 15.40 11.99(17.02) (14.93) (15.75) (15.10)
Group controls
Chat activity
Individual controls
Observations 3,600 3,600 3,2400 3,2400Size of cross-section 360 360 360 360
Notes: Robust standard errors in parenthesis*** Significant at the 1 percent level.** Significant at the 5 percent level.* Significant at the 10 percent level.Subject level controls: success in Stage 2, gender, age, profession, number of acquain-tances in the session. Group level controls: proportion of correct Stage 2 guesses,proportion of women. Chat activity: number of chat lines exchanged by the groupin the ID conditions.Standard errors in parentheses.
41

Table C2: UNEQUAL: Panel Tobit regression of endowment contributed (%)inStage 4.
Endowment contributed (%), Stage 4UNEQUAL conditions
Baseline: Poor-NoIDRichNoID -7.867 -9.517** -13.02***
(5.163) (4.504) (4.183)PoorID 9.759 10.11* 9.213*
(6.830) (5.949) (5.469)RichID -11.29* -9.303 -13.70**
(6.837) (5.975) (5.546)
Period -2.002*** -2.000*** -2.001***(0.219) (0.219) (0.219)
Beliefs about rich 0.441*** 0.291***(0.0734) (0.0718)
Beliefs about poor 0.149* -0.102(0.0806) (0.0853)
Contribution in stage 3 0.440***(0.0742)
Constant 62.38*** 20.98 18.43(15.91) (14.91) (13.71)
Group controls
Chat activity
Individual controls
Observations 1,920 1,920 1,920Size of cross-section 192 192 192
Notes: Robust standard errors in parenthesis*** Significant at the 1 percent level.** Significant at the 5 percent level.* Significant at the 10 percent level.Subject level controls: success in Stage 2, gender, age, profession,number of acquaintances in the session. Group level controls: pro-portion of correct Stage 2 guesses, proportion of women. Chatactivity: number of chat lines exchanged by the group in the IDconditions.Standard errors in parentheses.
42

Table C3: Tobit regression of endowment contributed (%) in Stage 3.
Endowment contributed (%) in Stage 3All conditions Unequal conditions
Baseline: UNEQUAL-NoID
EQUAL-NoID 4.798 2.470(4.709) (3.658)
UNEQ-ID -1.053 1.857(6.075) (4.518)
EQUAL-ID 9.064 0.368(5.669) (4.154)
Average beliefs 1.062***(0.0753)
Baseline: PoorNoIDRichNoID 11.23 6.784 -3.376
(7.354) (6.136) (5.181)PoorID 4.833 2.861 3.081
(7.243) (5.669) (4.539)RichID 10.69 11.07 2.339
(8.241) (6.775) (5.600)Beliefs about rich 0.416***
(0.0823)Beliefs about poor 0.692***
(0.112)
Endowment similaritySame-endowment beliefs 0.970***
(0.0819)Different-endowment beliefs 0.0718
(0.0695)
Constant 60.92*** -0.721 49.46*** -1.906 -10.25(10.61) (7.286) (11.84) (9.376) (7.664)
Group controls
Chat activity
Individual controls
Observations 360 360 192 192 192
Notes: Robust standard errors in parenthesis*** Significant at the 1 percent level.** Significant at the 5 percent level.* Significant at the 10 percent level.Subject level controls: success in Stage 2, gender, age, profession, number of acquaintancesin the session. Group level controls: proportion of correct Stage 2 guesses, proportion ofwomen. Chat activity: number of chat lines exchanged by the group in the ID conditions.Standard errors in parentheses.
43

Table C4: Tobit regression of beliefs by endowment similarity on subject typeindicators.
Seemingly unrelated regressionUNEQUAL cond.
By endowment size By endowment sizeand ID/NoID condition
Same end. Different end. Same end. Different end.beliefs beliefs beliefs beliefs
Baseline: poor
rich 12.30*** -9.870**(3.744) (3.888)
Baseline: PoorNoIDRichNoID 16.41*** -7.564
(5.460) (5.549)PoorID 2.188 1.202
(5.977) (7.228)RichID 10.45 -10.93
(6.414) (8.516)
Constant 60.97*** 54.14*** 59.39*** 53.25***(10.97) (10.18) (11.22) (10.38)
Group controls
Chat activity
Individual controls
Observations 192 192 192 192
Notes: Robust standard errors in parenthesis*** Significant at the 1 percent level.** Significant at the 5 percent level.* Significant at the 10 percent level.Subject level controls: success in Stage 2, gender, age, profession, number of acquain-tances in the session. Group level controls: proportion of correct Stage 2 guesses,proportion of women. Chat activity: number of chat lines exchanged by the groupin the ID conditions.Standard errors in parentheses.
44

45

C.2 Stage 4 contributions: beliefs according to endowment similarity
Table C5: UNEQUAL: Panel OLS regression of endowment contributed (%) inStage 4; beliefs according to endowment similarity.
Endowment contributed (%)Repeated game, UNEQUAL conditions
Baseline: Poor-NoIDRich-NoID -6.489* -9.050** -8.396** -7.803**
(3.464) (3.824) (3.911) (3.580)Poor-ID 8.731* 8.084* 8.057* 7.247*
(4.630) (4.546) (4.601) (4.159)Rich-ID -7.944* -8.369* -8.119* -8.891**
(4.208) (4.524) (4.472) (3.944)Period -1.541*** -1.541*** -1.755*** -1.752*** -1.749***
(0.249) (0.249) (0.273) (0.271) (0.272)Same-endowment beliefs 0.259*** 0.223*** -0.0986
(0.0712) (0.0743) (0.0854)Different-endowment beliefs 0.204*** 0.211*** 0.204***
(0.0653) (0.0671) (0.0573)Others’ previous contrib. 0.00835 0.0105 0.012
(0.0430) (0.0436) (0.042)Contribution in Stage 3 0.375***
(0.0737)
Interactions: same-endowment beliefsPoor-NoID 0.235
(0.205)Rich-NoID 0.378***
(0.069)Poor-ID 0.129
(0.117)Rich-ID 0.155
(0.116)
Interactions: different-endowment beliefsPoor-NoID 0.254*
(0.148)Rich-NoID -0.128
(0.087)Poor-ID 0.472***
(0.116)Rich-ID 0.129
(0.110)
Constant 57.49*** 31.81*** 35.59*** 36.14*** 30.67***(8.260) (7.687) (8.649) (8.015) (9.540)
Group controls
Chat activity
Individual controls
Observations 1,92 1,92 1,728 1,728 1,728Size of cross-section 192 192 192 192 192
Notes: Robust standard errors in parenthesis*** Significant at the 1 percent level.** Significant at the 5 percent level.* Significant at the 10 percent level.Subject level controls: success in Stage 2, gender, age, profession, number of acquaintances in the session.Group level controls: proportion of correct Stage 2 guesses, proportion of women. Chat activity: numberof chat lines exchanged by the group in the ID conditions.Robust standard errors, clustered at group level, in parentheses.
46

47

C.3 Split sample: first and last periods
Table C6: Split sample Panel OLS regressions of endowment contributed (%) inStage 4: first (columns 1 and 2) and last (columns 3 and 4) periods.
Endowment contributed (%), Stage 4All conditions UNEQUAL conditions
Periods 1-5 Periods 6-10 Periods 1-5 Periods 6-10
Baseline: UNEQUAL-NoID
EQUAL-NoID 2.691 3.530(3.318) (3.532)
UNEQUAL-ID -0.888 2.366(4.202) (3.258)
EQUAL-ID 1.270 1.318(3.688) (2.967)
Average beliefs 0.287*** 0.298***(0.0770) (0.0734)
Baseline: PoorNoIDRichNoID -11.48*** -8.612**
(3.268) (3.611)PoorID 8.048* 8.677*
(4.813) (4.548)RichID -12.92*** -7.089*
(4.863) (4.173)
Beliefs about rich 0.237*** 0.204***(0.0772) (0.0753)
Beliefs about poor -0.0807 -0.0664(0.0692) (0.0823)
Period -2.669*** -1.767*** -3.193*** -2.054***(0.470) (0.417) (0.692) (0.596)
Others’ previous contribution 0.0513 0.0184 0.0696 -0.0291(0.0453) (0.0433) (0.0682) (0.0646)
Constribution in Stage 3 0.335*** 0.217*** 0.397*** 0.225***(0.0639) (0.0596) (0.0771) (0.0715)
Group controls
Chat activity
Individual controls
Constant 18.64 25.05 21.52 38.48(6.710) (8.687) (9.165) (13.23)
Observations 1,440 1,800 768 960Number of ID 360 360 192 192
Notes: Robust standard errors in parenthesis*** Significant at the 1 percent level.** Significant at the 5 percent level.* Significant at the 10 percent level.Subject level controls: success in Stage 2, gender, age, profession, number of acquaintances in the session.Group level controls: proportion of correct Stage 2 guesses, proportion of women. Chat activity: number ofchat lines exchanged by the group in the ID conditions.Robust standard errors, clustered at group level, in parentheses.
48

C.4 Split sample: rich and poor subjects
Table C7: Split sample Panel OLS regressions of endowment contributed (%) inStage 4: poor subjects only.
UNEQUAL conditions, Poor subjects onlyEndowment contributed (%), Stage 4
Panel regression OLSRepeated game Stage 3
Baseline: PoorNoIDPoorID 15.99*** 16.11*** 14.61*** 1.957
(5.831) (5.902) (5.461) (4.591)
Period -1.702*** -1.877*** -1.905***(0.365) (0.410) (0.406)
Beliefs about rich 0.349*** 0.357*** 0.401*** -0.0565(0.111) (0.113) (0.0776) (0.0786)
Beliefs about poor 0.214** 0.179* -0.592** 1.011***(0.105) (0.107) (0.231) (0.0799)
Others’ previous contribution 0.0874 0.0681(0.0729) (0.0718)
Contribution in Stage 3 0.760***(0.205)
Constant 12.98 12.28 4.026 12.46(13.55) (14.99) (11.55) (8.616)
Group controls
Chat activity
Individual controls
Observations 960 864 864 96R-squared 0.770Number of ID 96 96 96
Notes: Robust standard errors in parenthesis*** Significant at the 1 percent level.** Significant at the 5 percent level.* Significant at the 10 percent level.Subject level controls: success in Stage 2, gender, age, profession, number of ac-quaintances in the session. Group level controls: proportion of correct Stage 2guesses, proportion of women. Chat activity: number of chat lines exchanged bythe group in the ID conditions.Robust standard errors, clustered at group level, in parentheses.
49

Table C8: Split sample Panel OLS regression of endowment contributed (%) inStage 4: rich subjects only.
UNEQUAL conditions, Rich subjects onlyEndowment contributed (%), Stage 4
Panel regression OLSRepeated game Stage 3
Baseline: RichNoIDRichID -3.790 -3.752 -4.489 3.252
(3.950) (4.240) (4.026) (6.478)
Period -1.380*** -1.609*** -1.600***(0.345) (0.382) (0.381)
Beliefs about rich 0.305*** 0.274*** 0.102 0.781***(0.0769) (0.0805) (0.109) (0.0970)
Beliefs about poor -0.0195 -0.0239 -0.0358 0.0526(0.0797) (0.0853) (0.0854) (0.118)
Others’ previous contribution -0.0500 -0.0437(0.0643) (0.0643)
Contribution in Stage 3 0.220***(0.0755)
Constant 31.70*** 39.08*** 40.61*** -8.570(10.32) (11.47) (11.04) (11.62)
Group controls
Chat activity
Individual controls
Observations 960 864 864 96R-squared 0.556Number of ID 96 96 96
Notes: Robust standard errors in parenthesis*** Significant at the 1 percent level.** Significant at the 5 percent level.* Significant at the 10 percent level.Subject level controls: success in Stage 2, gender, age, profession, number of ac-quaintances in the session. Group level controls: proportion of correct Stage 2guesses, proportion of women. Chat activity: number of chat lines exchanged bythe group in the ID conditions.Robust standard errors, clustered at group level, in parentheses.
50

C.5 Split sample: Cohesion reinforcement (ID) and no cohesion rein-forcement (NoID) conditions
Table C9: Split sample Panel OLS regressions of endowment contributed (%) inStage 4: UNEQUAL-NoID conditions only.
Split sample: UNEQUAL-NoID conditions onlyEndowment contributed (%), Stage 4
Baseline: Poor-NoIDRich-NoID -6.094* -6.902* -6.850* -9.469**
(3.582) (3.548) (3.726) (3.923)
Period -1.647*** -1.647*** -1.705*** -1.692***(0.360) (0.358) (0.360) (0.354)
Beliefs about rich 0.362*** 0.352*** 0.242***(0.0799) (0.0798) (0.0897)
beliefs about poor 0.122 0.0904 -0.0922(0.108) (0.116) (0.109)
Other’s previous contribution 0.122** 0.131***(0.0484) (0.0470)
Contribution in Stage 3 0.329***(0.102)
Constant 27.20*** 24.77*** 24.73***(4.979) (5.804) (5.371)
Group controls
Chat activity
Individual controls
Observations 960 960 864 864Number of ID 96 96 96 96
Notes: Robust standard errors in parenthesis*** Significant at the 1 percent level.** Significant at the 5 percent level.* Significant at the 10 percent level.Subject level controls: success in Stage 2, gender, age, profession, number of acquain-tances in the session. Group level controls: proportion of correct Stage 2 guesses,proportion of women. Chat activity: number of chat lines exchanged by the groupin the ID conditions.Robust standard errors, clustered at group level, in parentheses.
51

Table C10: Split sample Panel OLS regressions of endowment contributed (%) inStage 4: UNEQUAL-ID conditions only.
Split sample: UNEQUAL-ID conditions onlyEndowment contributed (%), Stage 4
Baseline: Poor-IDRich-ID -17.05*** -15.08*** -14.68*** -16.71***
(2.972) (3.089) (3.196) (3.018)
Period -1.435*** -1.435*** -1.792*** -1.791***(0.353) (0.351) (0.428) (0.428)
Beliefs about rich 0.334*** 0.322*** 0.235***(0.0756) (0.0792) (0.0689)
Beliefs about poor 0.116 0.0897 -0.0705(0.0832) (0.0843) (0.0872)
Others’ previous contribution -0.0940 -0.0933(0.0635) (0.0638)
Contribution in Stage 3 0.262***(0.0557)
Constant 51.84*** 36.00*** 44.01*** 44.94***(5.898) (7.282) (9.379) (8.661)
Group controls
Chat activity
Individual controls
Observations 960 960 864 864Number of ID 96 96 96 96
Notes: Robust standard errors in parenthesis*** Significant at the 1 percent level.** Significant at the 5 percent level.* Significant at the 10 percent level.Subject level controls: success in Stage 2, gender, age, profession, number of ac-quaintances in the session. Group level controls: proportion of correct Stage 2guesses, proportion of women. Chat activity: number of chat lines exchanged bythe group in the ID conditions.Robust standard errors, clustered at group level, in parentheses.
52
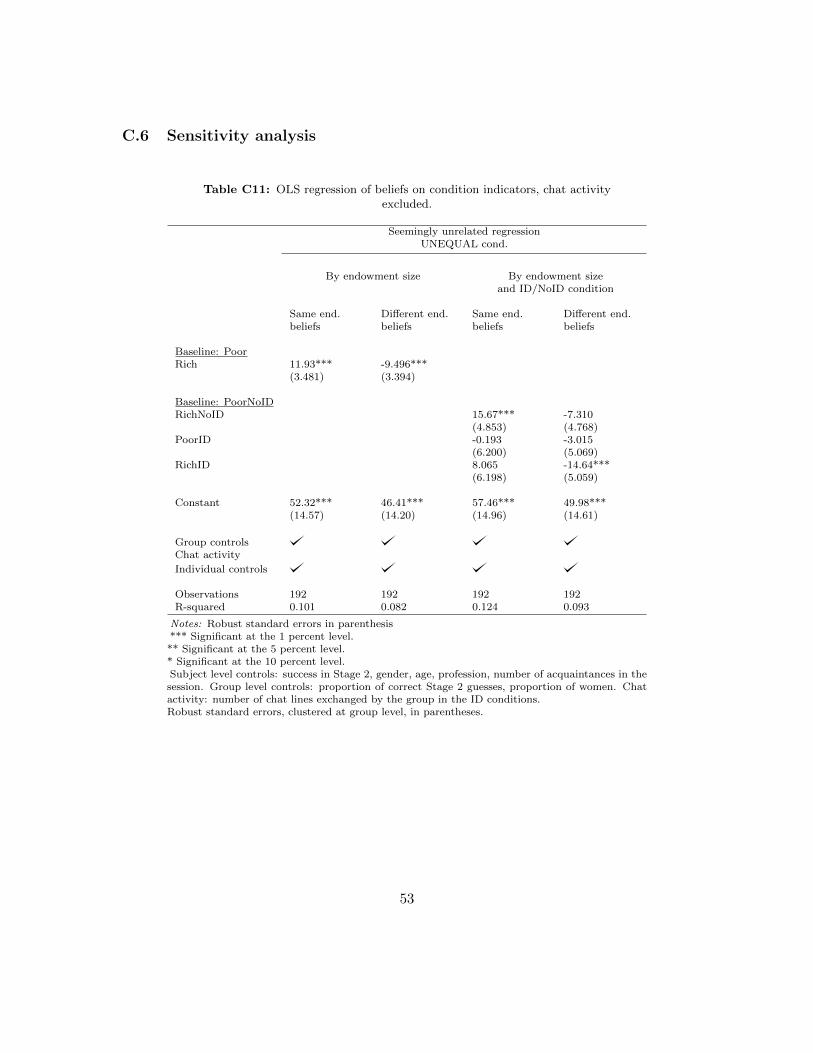
C.6 Sensitivity analysis
Table C11: OLS regression of beliefs on condition indicators, chat activityexcluded.
Seemingly unrelated regressionUNEQUAL cond.
By endowment size By endowment sizeand ID/NoID condition
Same end. Different end. Same end. Different end.beliefs beliefs beliefs beliefs
Baseline: PoorRich 11.93*** -9.496***
(3.481) (3.394)
Baseline: PoorNoIDRichNoID 15.67*** -7.310
(4.853) (4.768)PoorID -0.193 -3.015
(6.200) (5.069)RichID 8.065 -14.64***
(6.198) (5.059)
Constant 52.32*** 46.41*** 57.46*** 49.98***(14.57) (14.20) (14.96) (14.61)
Group controlsChat activity
Individual controls
Observations 192 192 192 192R-squared 0.101 0.082 0.124 0.093
Notes: Robust standard errors in parenthesis*** Significant at the 1 percent level.** Significant at the 5 percent level.* Significant at the 10 percent level.Subject level controls: success in Stage 2, gender, age, profession, number of acquaintances in thesession. Group level controls: proportion of correct Stage 2 guesses, proportion of women. Chatactivity: number of chat lines exchanged by the group in the ID conditions.Robust standard errors, clustered at group level, in parentheses.
53
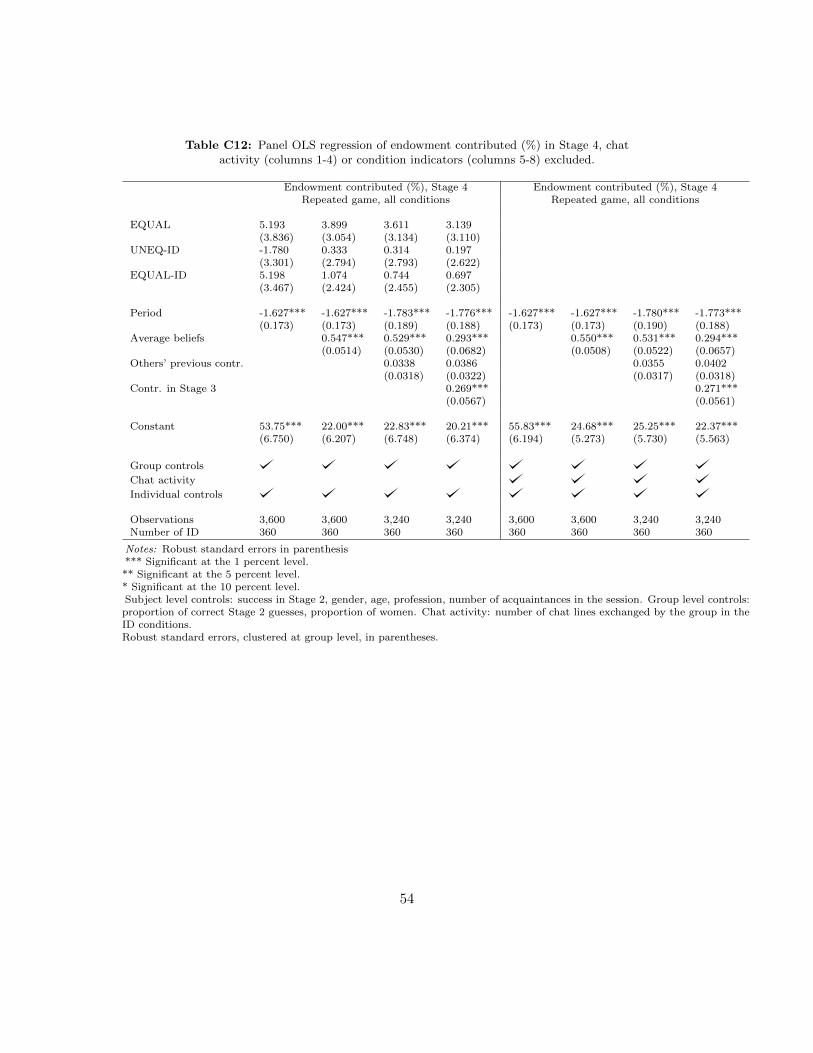
Table C12: Panel OLS regression of endowment contributed (%) in Stage 4, chatactivity (columns 1-4) or condition indicators (columns 5-8) excluded.
Endowment contributed (%), Stage 4 Endowment contributed (%), Stage 4Repeated game, all conditions Repeated game, all conditions
EQUAL 5.193 3.899 3.611 3.139(3.836) (3.054) (3.134) (3.110)
UNEQ-ID -1.780 0.333 0.314 0.197(3.301) (2.794) (2.793) (2.622)
EQUAL-ID 5.198 1.074 0.744 0.697(3.467) (2.424) (2.455) (2.305)
Period -1.627*** -1.627*** -1.783*** -1.776*** -1.627*** -1.627*** -1.780*** -1.773***(0.173) (0.173) (0.189) (0.188) (0.173) (0.173) (0.190) (0.188)
Average beliefs 0.547*** 0.529*** 0.293*** 0.550*** 0.531*** 0.294***(0.0514) (0.0530) (0.0682) (0.0508) (0.0522) (0.0657)
Others’ previous contr. 0.0338 0.0386 0.0355 0.0402(0.0318) (0.0322) (0.0317) (0.0318)
Contr. in Stage 3 0.269*** 0.271***(0.0567) (0.0561)
Constant 53.75*** 22.00*** 22.83*** 20.21*** 55.83*** 24.68*** 25.25*** 22.37***(6.750) (6.207) (6.748) (6.374) (6.194) (5.273) (5.730) (5.563)
Group controls
Chat activity
Individual controls
Observations 3,600 3,600 3,240 3,240 3,600 3,600 3,240 3,240Number of ID 360 360 360 360 360 360 360 360
Notes: Robust standard errors in parenthesis*** Significant at the 1 percent level.** Significant at the 5 percent level.* Significant at the 10 percent level.Subject level controls: success in Stage 2, gender, age, profession, number of acquaintances in the session. Group level controls:proportion of correct Stage 2 guesses, proportion of women. Chat activity: number of chat lines exchanged by the group in theID conditions.Robust standard errors, clustered at group level, in parentheses.
54

Table C13: UNEQUAL: Panel OLS regression of endowment contributed (%) inStage 4, chat activity (columns 1-4) or condition indicators (columns 5-8) excluded.
Endowment contributed (%), Stage 4 Endowment contributed (%), Stage 4Repeated game, UNEQUAL conditions Repeated game, UNEQUAL conditions
Baseline: PoorNoIDRichNoID -6.489* -7.837** -7.640** -9.860***
(3.464) (3.219) (3.223) (3.114)PoorID 8.731* 8.861** 8.875** 8.418**
(4.630) (4.450) (4.496) (4.041)RichID -7.944* -6.662 -6.765 -9.586**
(4.208) (4.238) (4.179) (3.869)
Period -1.541*** -1.541*** -1.759*** -1.754*** -1.541*** -1.541*** -1.775*** -1.774***(0.249) (0.249) (0.273) (0.270) (0.249) (0.249) (0.276) (0.274)
Beliefs about rich 0.330*** 0.323*** 0.221*** 0.343*** 0.336*** 0.259***(0.0638) (0.0652) (0.0693) (0.0645) (0.0657) (0.0714)
Beliefs about poor 0.118 0.0969 -0.0748 0.100 0.0784 -0.0620(0.0757) (0.0788) (0.0686) (0.0790) (0.0811) (0.0757)
Others’ previous contr. 0.00553 0.00911 -0.00472 -0.00452(0.0422) (0.0430) (0.0422) (0.0425)
Contr. in Stage 3 0.301*** 0.238***(0.0622) (0.0687)
Constant 57.49*** 26.35*** 29.83*** 27.70*** 56.82*** 24.78*** 28.90*** 26.58***(8.260) (9.012) (10.03) (9.007) (7.599) (8.564) (9.793) (9.079)
Group controls
Chat activity
Individual controls
Observations 1,920 1,920 1,728 1,728 1,920 1,920 1,728 1,728Number of ID 192 192 192 192 192 192 192 192
Notes: Robust standard errors in parenthesis*** Significant at the 1 percent level.** Significant at the 5 percent level.* Significant at the 10 percent level.Subject level controls: success in Stage 2, gender, age, profession, number of acquaintances in the session. Group level controls:proportion of correct Stage 2 guesses, proportion of women. Chat activity: number of chat lines exchanged by the group in theID conditions.Robust standard errors, clustered at group level, in parentheses.
55

Table C14: OLS regression of endowment contributed (%) in Stage 3, chat activity(columns 1-3) or condition indicators (columns 4-6) excluded.
Endowment contributed (%), Stage 3 Endowment contributed (%), Stage 3All cond. UNEQUAL cond. All cond. UNEQUAL cond.
Baseline: UNEQUAL-NoID
EQUAL-NoID 1.668(3.261)
UNEQ-ID 0.474(3.320)
EQUAL-ID 0.0926(3.067)
Average beliefs 0.876*** 0.876***(0.0553) (0.0531)
Baseline: PoorNoIDRichNoID 7.338 -1.594
(5.293) (4.160)PoorID -0.0184 0.361
(4.160) (3.433)RichID 7.761 0.227
(4.822) (3.982)
Beliefs about rich 0.337*** 0.324***(0.0778) (0.0775)
Beliefs about poor 0.573*** 0.590***(0.0961) (0.0901)
Endowment similaritySame-endowment beliefs 0.860*** 0.849***
(0.0607) (0.0582)Different-endowment beliefs 0.0226 0.0262
(0.0579) (0.0525)
Constant 8.691 5.533 -2.879 9.609* 9.728 -1.591(6.093) (8.409) (6.328) (5.301) (7.073) (5.699)
Group controls
Chat activity
Individual controls
Observations 360 192 192 360 192 192R-squared 0.479 0.501 0.631 0.479 0.483 0.630
Notes: Robust standard errors in parenthesis*** Significant at the 1 percent level.** Significant at the 5 percent level.* Significant at the 10 percent level.Subject level controls: success in Stage 2, gender, age, profession, number of acquaintances in the session. Grouplevel controls: proportion of correct Stage 2 guesses, proportion of women. Chat activity: number of chat linesexchanged by the group in the ID conditions.Robust standard errors, clustered at group level, in parentheses.
56

Table C15: Panel OLS regression of endowment contributed (%) in Stage 4,period variable excluded.
Endowment contributed (%), Stage 4 Endowment contributed (%), Stage 4Repeated game Repeated gameAll conditions UNEQUAL conditions
Baseline: UNEQUAL-NoID
EQUAL-NoID 3.116 2.637(2.890) (2.873)
UNEQUAL-ID 0.999 1.023(3.169) (2.965)
EQUAL-ID 0.653 0.728(2.784) (2.674)
Average beliefs 0.523*** 0.282***(0.0524) (0.0679)
Beliefs about rich 0.318*** 0.216***(0.0647) (0.0687)
Beliefs about poor 0.101 -0.0729(0.0793) (0.0689)
Others’ previous contrib. 0.135*** 0.138*** 0.108** 0.110**(0.0315) (0.0320) (0.0462) (0.0477)
Contribution in Stage 3 0.275*** 0.304***(0.0576) (0.0641)
Baseline: PoorNoID
RichNoID -7.834** -10.07***(3.348) (3.222)
PoorID 8.786** 8.327**(4.296) (3.870)
RichID -7.438* -10.28***(3.978) (3.754)
Constant 7.519 5.048 14.24 12.22(6.386) (5.976) (9.427) (8.467)
Group controls
Chat activity
Individual controls
Observations 3,240 3,240 1,728 1,728Number of ID 360 360 192 192
Notes: Robust standard errors in parenthesis*** Significant at the 1 percent level.** Significant at the 5 percent level.* Significant at the 10 percent level.Subject level controls: success in Stage 2, gender, age, profession, number of acquaintances in the session. Grouplevel controls: proportion of correct Stage 2 guesses, proportion of women. Chat activity: number of chat linesexchanged by the group in the ID conditions.Robust standard errors, clustered at group level, in parentheses.
57
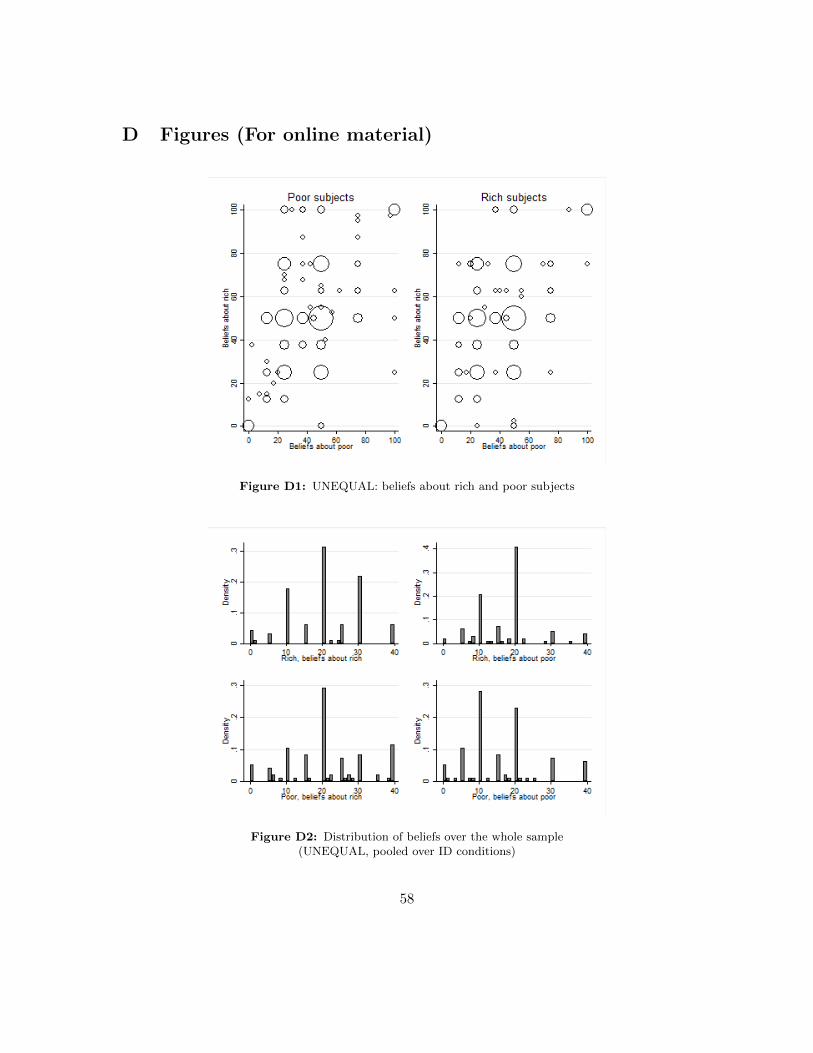
D Figures (For online material)
Figure D1: UNEQUAL: beliefs about rich and poor subjects
Figure D2: Distribution of beliefs over the whole sample(UNEQUAL, pooled over ID conditions)
58
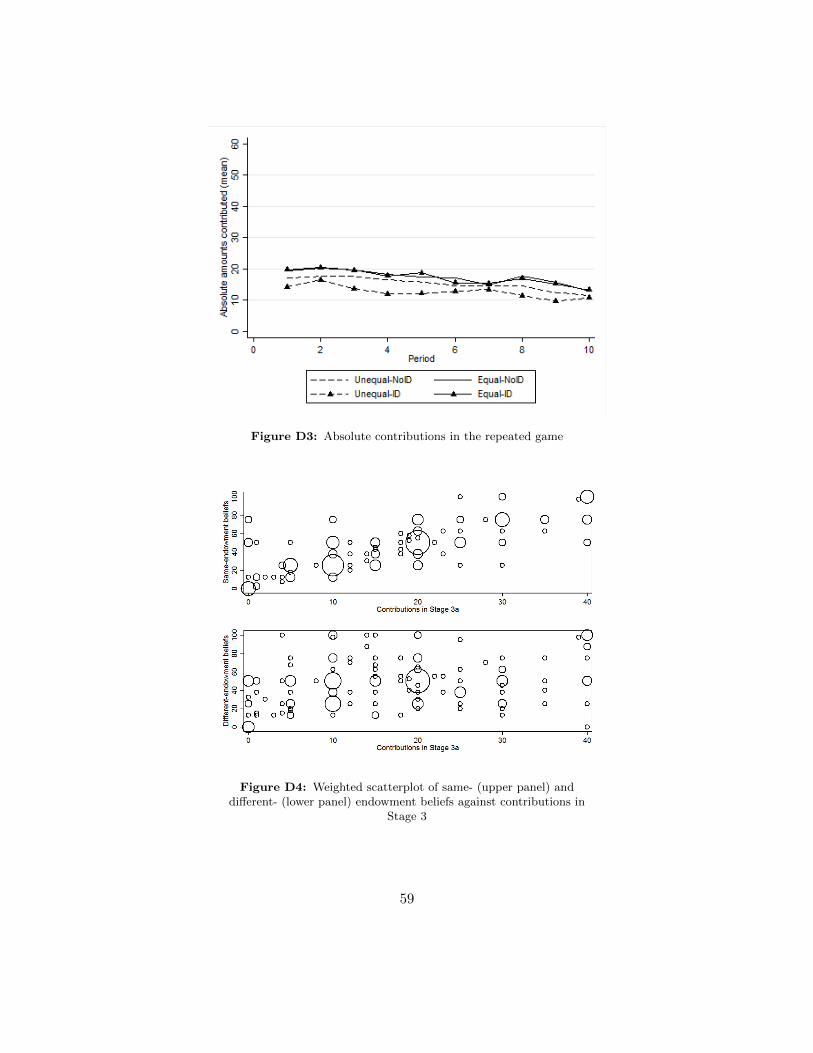
Figure D3: Absolute contributions in the repeated game
Figure D4: Weighted scatterplot of same- (upper panel) anddifferent- (lower panel) endowment beliefs against contributions in
Stage 3
59