doc url - 北海道大学 … of applied chemistry, graduate school of engineering, osaka prefecture...
TRANSCRIPT

Instructions for use
Title Synthesis of monodispersed silica nanoparticles with high concentration by the Stober process
Author(s) Tadanaga, Kiyoharu; Morita, Koji; Mori, Keisuke; Tatsumisago, Masahiro
Citation Journal of sol-gel science and technology, 68(2): 341-345
Issue Date 2013-11
Doc URL http://hdl.handle.net/2115/57359
Type article (author version)
Additional Information There are other files related to this item in HUSCAP. Check the above URL.
File Information silica particles paper final version 140305.pdf
Hokkaido University Collection of Scholarly and Academic Papers : HUSCAP

1
Synthesis of Monodispersed Silica Nanoparticles with High Concentration by the
Stöber Process
*Kiyoharu Tadanaga1, Koji Morita
1,2, Keisuke Mori
1, and Masahiro Tatsumisago
1
1Department of Applied Chemistry, Graduate School of Engineering,
Osaka Prefecture University, 1-1 Gakuen-cho, Naka-ku, Sakai, Osaka 599-8531, Japan
2Nippon Bee Chemical Co., Ltd.
2-14-1 Shodai-Ohtani Hirakata, Osaka 573-1153, Japan
Abstract
Silica nanoparticles with high concentration were prepared by the sol-gel process based
on the Stöber method using tetraethoxysilane (TEOS) as a starting material. It was
found that silica sol with about 4 wt% in concentration and with a diameter of about 10
nm was obtained by controlling the reaction conditions in the Stöber process. By
removing the solvent under a reduced pressure, the particle concentration was increased
up to 15 wt% without aggregation.
Keywords : the Stöber method, monodispersed particles, silica
*Corresponding author
(present address)
Kiyoharu Tadanaga
Faculty of Engineering, Hokkaido University
E-mail: [email protected]
Tel & Fax +81-11-706-6572

2
1. Introduction
Preparation of mono-disperse inorganic nanoparticles has attracted a considerable
attention because of their potential importance in technological applications in the fields
of optical devises, catalysts, filler for polymers, and so on. Among synthesis techniques
of particles, a liquid phase process, especially sol-gel process, is a superior one to
prepare monodispersed particles [1-5]. The so-called “Stöber method” is an excellent
process to prepare monodispersed silica particles using sol-gel process [6], and silica
particles with a diameter of about 100 nm to a few m are easily prepared by this
method [7].
Much smaller silica particles are required for some applications. For example, in a
hard-coating for polymer substrates, the coating layer should be transparent, and thus
the silica particles added to the coating must be smaller than a few tens of nanometer to
avoid scattering. However, the Stöber method is believed that the preparation of
uniform-sized silica nanospheres with a size of below 50 nm is rather difficult [8,9].
To obtain much smaller nano-particles, e.g., about 10 nm in diameter, preparation of
silica nanoparticles by modified Stöber method using basic amino acid such as L-lysine
[8 ,9] or by water in oil micro-emulsion process [10,11] have been reported. In the
industrial scale, colloidal silica with small diameter has been prepared using water glass

3
[12].
Those silica nanoparticles are usually prepared under highly diluted conditions.
However, for the use of those nanoparticles to the hard-coating for the polymer
substrates, high concentration of silica is preferred. In addition, the surface of the
commercial particles is covered with surfactants or dispersing agents. About the
surface of nanoparticles, the surface must be modified with some silane-coupling agents
to form covalent bonding with matrix of the hard-coatings, and thus, the nanoparticles
without surfactants or dispersing agent are preferable. There are plenty of studies on
the preparation of silica nanoparticles by the Stöber method. However, not so many
studies are reported on the preparation of high-concentration of silica nanoparticles
without using surfactants or dispersing agent.
In this study, monodispersed silica nanoparticles with a diameter of less than 20 nm
and with high SiO2 concentration (up to 15 wt%) were prepared by the sol-gel process
based on the Stöber method, by the control of the preparation conditions. Effects of
composition of starting materials on the size and distribution of silica particles were
examined. In addition, the solvent in the prepared sol was removed under a reduced
pressure to increase the concentration of silica. Effects of concentration process for
the size and distribution of silica nanoparticles were examined.
4
2. Experimental
2.1. Preparation of silica nano-particles
Silica particles were prepared through a process based on the Stöber method, using
tetraethoxysilane (TEOS) (Shin-Etsu Chemical, Japan) as a starting material. TEOS
was dissolved in ethanol (Wako Pure Chemical Industries, Japan). Separately,
ammonia water (25wt%) and ethanol were mixed. Then, two solutions were mixed,
and then the obtained sol was stirred for 24 h. The particles in the sols were collected
by centrifugation and dried in vacuo for 12 h. The mole ratios of TEOS : H2O (25
wt% NH4OHaq) : ethanol were (a) x : 126: 9 (1<x<15), (b) 5: y : 9 (63<y<126), and
(c) 5 : 79 : z (9 < z < 14).
To increase the concentration of silica, the solvent in the prepared sol was removed
under a reduced pressure using a rotatory evaporator at 55 ⁰C.
The concentration of SiO2 in the sol was determined from the weight of the
collected and heat-treated (at 1000⁰C) particles versus the total weight of the prepared
sol. The yield of the SiO2 was calculated from the weight of the collected and
heat-treated (at 1000⁰C) particles versus the theoretical weight of SiO2 obtained from
TEOS.

5
2.2. Materials characterization
A transmission electron microscope (TEM, JEOL JEM2010) was used for the
observation of shape and size of the particles. Size distribution of particles in the sol
was determined using a dynamic light scattering (DLS6000, Otsuka denshi). Thermal
properties of the obtained particles were determined using DTA-TG (Themo Plus
TG8120, Rigaku), with a heating rate of 10oC/min.
3. Results and discussion
3.1 Preparation of SiO2 particles with various molar ratios in the starting materials
Silica nanoparticles were prepared using the Stöber process and according to the
reference [11], where the molar ratio of TEOS : EtOH : H2O (25 wt% NH4OHaq) is 1 :
126 : 9. Figure 1 shows a TEM image of the nanoparticles obtained, and size
distribution of the nanoparticles determined by dynamic light scattering (DLS). From
the TEM image, the diameter of the primary particles is about 10 nm. The average
particle diameter in the sol and geometric standard deviation, determined by the DLS,
were 8.5 nm and 1.22, respectively. These results are in good agreement with the TEM
observation, and indicate the rather good monodispersity of the particles. In this

6
composition, the SiO2 concentration in the sol is less than 1%. Under such a dilute
condition, silica nanoparticles with a diameter of about 10 nm were obtained.
To increase the SiO2 concentration in the sol, the molar ratio of TEOS was
increased, according to the molar ratio series (a), where TEOS : EtOH : H2O (25 wt%
NH4OHaq) was x : 126: 9 (1 ≤ x ≤ 15). Figure 2 shows (a) average particle size and
geometric standard deviation and (b) particle concentration and yield, with changing
TEOS ration in the starting materials. With an increase in x (TEOS ratio) up to 10, the
concentration of SiO2 is increased, but the average particle size is less than 10 nm.
Concentration of SiO2 was about 3 wt% with x=10. When the x was larger than 10,
the water for the hydrolysis of TEOS was not enough. Thus, unreacted TEOS may
remain in the sol, and the concentration of SiO2 was leveling off with larger TEOS
content.
To increase the SiO2 concentration in the sol, the molar ratio of EtOH was
decreased, according to the molar ratio series (b), where TEOS : EtOH : H2O (25 wt%
NH4OHaq) was 5 : y : 9 (63 ≤ y ≤ 126). Figure 3 shows (a) the average particle size and
geometric standard deviation and (b) particle concentration and yield, with changing
EtOH ratio in the starting materials. With a decrease in y (EtOH ratio), the
concentration of the obtained SiO2 is increased, but the average particle size is increased.

7
With the smallest y in the series (b) (y=63, largest TEOS concentration), the
concentration of the obtained SiO2 was about 5% and the average particle size is about
18 nm.
To promote the hydrolysis and condensation reaction of TEOS, which should result
in the increase in the SiO2 concentration, the H2O molar ratio was increased. The sol
was prepared in the molar ratio series (c), where TEOS : EtOH : H2O (25 wt%
NH4OHaq) was 5 : 79 : z (9 ≤ z ≤ 14). Figure 4 shows (a) average particle size and
geometric standard deviation and (b) particle concentration and yield, with changing
H2O (25 wt% NH4OHaq) ratio in the starting materials. With an increase in z (H2O
ratio), the concentration of the obtained SiO2 is increased, but the average particle size
is largely increased up to about 60 nm.
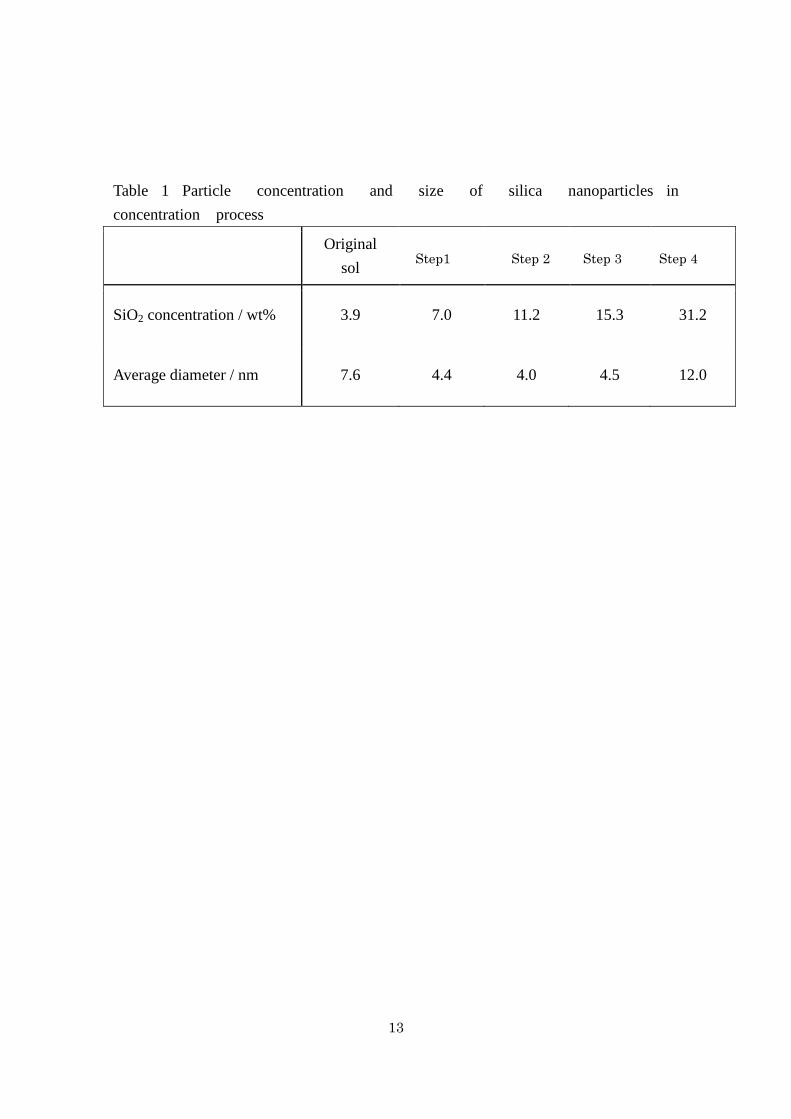
3.2 Increase of the SiO2 concentration by removal of solvent from the obtained sol
To increase the concentration of silica, the solvent in the prepared sol was removed
under a reduced pressure using a rotatory evaporator at 55⁰C. In this experiment, the sol
prepared with TEOS : EtOH : H2O (25 wt% NH4OHaq) = 5 : 79 : 9 was used, and initial
SiO2 concentration was about 4%. By controlling the heating time, the sols with SiO2
concentration of 7, 11, 15, and 31 were obtained. The Particle concentration and size of

8
silica nanoparticles are shown in Table 1. In the condensed sol with SiO2
concentration of 7, 11, and 15, the average particle size determined by DLS is less than
10 nm, and the sol was almost transparent. In addition, the sol was confirmed to be
stable for a few weeks. These results suggest that the particles are not aggregated
during concentration of the sol up to 15 wt%. The pH of the sol was changed from pH of
11 to pH of 7 with the removal of solvent, because NH3 is also removed with the solvent.
This change of pH (elimination of NH3 from the sol) must contribute to the stability of
the concentrated sol. However, when the sol was concentrated to 30 wt %, the particle
size is more than 10 nm, and the sol became translucent. This suggests that the
particles are highly aggregated during concentration of the sol. Figure 5 shows the
FE-SEM image of silica nanoparticles (a) before and (b) after the concentration to 15
wt% SiO2. The size of the primary particle is almost the same before and after the
concentration, and is less than about 20 nm. DLS results supported the FE-SEM
observation, where the average particle size was about 10 nm and the geometric
standard deviation was 1.2. The aggregated particles observed in the FE-SEM images
must be formed during centrifugation and drying for the FE-SEM observation.
It is found that silica sol with 4wt% SiO2 concentration and with an average
diameter of less than 10 nm can be obtained by the control of chemical composition in

9
the starting materials. By the combination of chemical composition control and
solvent evaporation, silica sol with SiO2 concentration of 15wt% and with an average
particle size of less than 10 nm. In this process, surfactant or dispersing agents were
not used. Thus, the surface of SiO2 particles in the sol must be easily modified with a
silane-coupling agent. In addition, the sol with such high concentration and with small
particle size is very attractive for the use of filler for the hard-coating.
4. Conclusions
Silica nanoparticles with high concentration were prepared by the Stöber
method using TEOS as a starting material. It was found that about 4 wt% of silica
nanoparticles with a diameter of about 10nm were obtained by controlling the reaction
conditions in the Stöber process. By removing solvent under a reduced pressure, the
particle concentration was increased up to 15 wt% without aggregation.

10
5. Reference
[1] Gellermann C, Storch W, Wolter H (1997) Synthesis and characterization of the
organic surface modifications of monodisperse colloidal silica. J. Sol-Gel Sci. Techol., 8
173-176.
[2] Van Cantfort O, Michaux B, Pirard R, Pirard JP, Lecloux AJ (1997) Synthesis and
characterization of monodisperse spherical zirconia particles. J. Sol-Gel Sci. Technol., 8,
207-211.
[3] Mine E, Hirose M, Kubo M, Kobayashi Y, Nagao D, Konno M (2006) Synthesis of
submicron-sized titania-coated silica particles with a sol-gel method and their
application to colloidal photonic crystals. J. Sol-Gel Sci. Technol., 38, 91-95.
[4] Kim KD, Kim HT(2002) Formation of silica nanoparticles by hydrolysis of TEOS
using a mixed semi-batch/batch method. J. Sol-Gel Sci. Technol., 25 183-189.
[5] Ishida H, Tadanaga K, Hayashi A, Tatsumisago M (2013) Synthesis of
monodispersed lithium silicate particles using the sol-gel method. J. Sol-Gel Sci.
Technol., 65, 41-45.
[6] Stöber W, Fink A, Bohn E (1968) Controlled growth of monodisperse silica spheres
in micron size range. J. Colloid Interface Sci., 26, 62-69.
[7] Nishimori H, Tatsumisago M, Minami T (1997) Growth Mechanism of Large

11
Monodispersed Silica Particles Prepared from Tetraethoxysilane in the Presence of
Sodium Dodecyl Sulfate. J. Sol-Gel Sci. Technol., 9, 25-31.
[8] Yokoi T, Sakamoto Y, Terasaki O, Kubota Y, Okubo T and Tatsumi T (2006) Periodic
arrangement of silica nanospheres assisted by amino acids. J. Am. Chem. Soc., 128,
13664-13665.
[9] Yokoi T, Wakabayashi J, Otsuka Y, Fan W, Iwama M, Watanabe R, Aramaki K,
Shimojima A, Tatsumi T, Okubo T (2009) Mechanism of Formation of Uniform-Sized
Silica Nanospheres Catalyzed by Basic Amino Acids. Chem. Mater., 21, 3719-3729.
[10] Arriagada FJ, Osseo-Asare K (1999) Synthesis of nanosize silica in a nonionic
water-in-oil microemulsion: Effects of the water/surfactant molar ratio and ammonia
concentration. J. Colloid Interface Sci., 221, 210-220.
[11] Naka Y, Komori Y, Yoshitake H (2010) One-pot synthesis of organo-functionalized
monodisperse silica particles in W/O microemulsion and the effect of functional groups
on addition into polystyrene. Colloids Surf. A, 361, 162-168.
[12] Masuda N, Ota S (2008) Silica sol and process for production thereof. World Patent
WO/2008/015943.

12
Figure captions
Figure 1 (a) TEM image of silica nanoparticles and (b) Size distribution of silica
nanoparticles determined by DLS. The molar ratio of TEOS : EtOH : H2O (25 wt%
NH4OHaq) is 1 : 126 : 9.
Figure 2 (a) Average particle size and geometric standard deviation and (b) particle
concentration and yield, with changing TEOS ration in the starting materials. The
molar ratio of TEOS : EtOH : H2O (25 wt% NH4OHaq) is x : 126: 9 (1 ≤ x ≤ 15).
Figure 3 (a) Average particle size and geometric standard deviation and (b) particle
concentration and yield, with changing EtOH ratio in the starting materials. The molar
ratio of TEOS : EtOH : H2O (25 wt% NH4OHaq) is 5 : y : 9 (63 ≤ y ≤ 126)
Figure 4 (a) Average particle size and geometric standard deviation and (b) particle
concentration and yield, with changing H2O (25 wt% NH4OHaq) ratio in the starting
materials. The molar ratio of TEOS : EtOH : H2O (25 wt% NH4OHaq) is 5 : 79 : z (9 ≤
z ≤ 14).
Figure 5 FE-SEM images of silica nanoparticles (a) before and (b) after the
concentration to15 wt% SiO2.
13
Table 1 Particle concentration and size of silica nanoparticles in
concentration process
Original
sol
SiO2 concentration / wt% 3.9 7.0 11.2 15.3 31.2
Average diameter / nm 7.6 4.4 4.0 4.5 12.0
Step1 Step 2 Step 3 Step 4

14
20 nm
Figure 1

15
0
5
10
15
20
25
0
0.5
1
1.5
2
0 2 4 6 8 10 12 14 16
Pa
rtic
le s
ize / n
m
Geo
metr
ic s
tan
dard
de
via
tio
n
TEOS molar ratio (x)
0
20
40
60
80
100
0
1
2
3
4
5
0 2 4 6 8 10 12 14 16
Yie
ld / %
Co
nce
ntr
ati
on
in
so
luti
on
/ %
TEOS molar ratio (x)
Figure 2

16
0
5
10
15
20
25
0
0.5
1
1.5
2
60 70 80 90 100 110 120 130
Pa
rtic
le s
ize / n
m
Geo
metr
ic s
tan
dard
de
via
tio
n
EtOH molar ratio (y)
0
20
40
60
80
100
0
1
2
3
4
5
60 70 80 90 100 110 120 130
Yie
ld / %
Co
nce
ntr
ati
on
in
so
luti
on
/ %
EtOH molar ratio (y)
Figure 3

17
0
20
40
60
80
100
0
0.5
1
1.5
2
8 9 10 11 12 13 14 15
Pa
rtic
le s
ize
/ n
m
Ge
om
etr
ic s
tan
dard
de
via
tio
n
H2O molar ratio (z)
0
20
40
60
80
100
0
1
2
3
4
5
8 9 10 11 12 13 14 15
Yie
ld / %
Co
nce
ntr
ati
on
in
so
luti
on
/ %
H2O molar ratio (z)
Figure 4

18
200 nm
(a)
200 nm
(b)
Figure 5