docket number: project title: southern california energy...
TRANSCRIPT

DOCKETED
Docket Number:
17-IEPR-11
Project Title: Southern California Energy Reliability
TN #: 217639
Document Title:
Aliso Canyon Risk Assessment Technical Report Summer 2017 Assessment
Description: Prepared by staff of the California Utilities Commission, California Energy Commission, the California Independent System Operator, the Los Angeles Department of Water and Power with input from Southern California Gas Company, May 19, 2017
Filer: Patty Paul
Organization: California Energy Commission
Submitter Role:
Commission Staff
Submission Date:
5/19/2017 10:48:02 AM
Docketed Date:
5/19/2017

1
Aliso Canyon Risk Assessment Technical Report Summer 2017 Assessment
Prepared by the Staff of the California Public Utilities Commission, California Energy Commission, the California Independent System Operator, the Los Angeles Department of
Water and Power, with input from Southern California Gas Company
May 19, 2017

2
Table of Contents EXECUTIVE SUMMARY ................................................................................................................................ 3
INTRODUCTION ........................................................................................................................................... 6
BACKGROUND ............................................................................................................................................. 7
SOCALGAS 2017 SUMMER CAPACITY .......................................................................................................... 7
Introduction............................................................................................................................................. 7
Summary of hydraulic findings ................................................................................................................ 7
Hydraulic Analysis.................................................................................................................................... 8
JOINT LADWP AND CALIFORNIA ISO IMPACT ANALYSIS AND RESULTS .................................................... 14
Introduction........................................................................................................................................... 14
Summary of Electric Findings ................................................................................................................ 15
Impact Assessment ................................................................................................................................ 17
Local Area Analysis ................................................................................................................................ 18
Ability to Re-supply Energy in the Event of Gas Curtailment ................................................................ 21
Gas Supplies Shortfall Based on Receipt Point and Transmission Utilization ....................................... 22
MITIGATION MEASURES ............................................................................................................................ 24

3
EXECUTIVE SUMMARY This technical report assesses the risks to energy reliability in the Greater Los Angeles and Southern California area during the coming summer months without the use of the Aliso Canyon natural gas storage facility and limited supplies of gas in the remaining Southern California Gas Company (SoCalGas) storage facilities. This assessment was developed by the Aliso Canyon Technical Assessment Group, which is composed of technical experts from the California Public Utilities Commission (CPUC), California Energy Commission (Energy Commission), the California Independent System Operator (California ISO), the Los Angeles Department of Water and Power (LADWP), with hydraulic modeling of the gas system from SoCalGas.
The 2017 Summer Assessment is based on a different type of analysis than what was conducted for the 2016 Summer Technical Assessment. The 2017 assessment calculates the system capacity of the SoCalGas/San Diego Gas & Electric (SDG&E) gas transmission system, based on peak hour(s) supportable demand and determines the ability for the electric balancing authorities to maintain power system reliability during a 1-in-10 year peak summer electric load. The power flow analysis conducted for the summer of 2017 reflects full availability of all transmission lines in service and following a power system contingency. The objective of the power flow case was to minimize the use of gas-fired generation by fully utilizing the transmission import capability into Southern California. Full transmission import utilization and minimum gas-fired generation does not reflect the actual experience that is based on economic and bilateral use patterns. In other words, actual experience during 1-in-10 year peak load conditions is that transmission utilization that is lower than full utilization and gas-fired generation is higher than the minimum generation level in the scenario. Peak summer economic operation, including the 1-in-10 year peak, would rely less on imports and use gas-fired generation assets to meet the electric load, thereby requiring increased gas quantities than the gas use outcome of the reliability study. Applying the peak gas capacity comparison with peak electric needs was a more direct approach that is consistent with the last year’s winter assessment.
In contrast, the 2016 Summer Technical Assessment studied four specific scenarios based on prior years’ actual conditions but did not represent a 1-in-10 year peak electric day. These scenarios were selected to understand the electric system conditions that created the most risk of gas curtailment at the time including a large mismatch between gas demands and flowing supplies. To reduce these risks, in 2016, the joint agency team developed an action plan that included changes to the gas balancing rules to encourage noncore customers to procure gas to meet their demand on a daily basis rather than relying on gas storage. The implementation of the action plan and a mild summer weather pattern helped to prevent significant electric generation curtailments as well as use of gas from Aliso Canyon during the summer months.
While differing in their analyses, both the 2016 and 2017 assessments rely on hydraulic modeling to determine likely outcomes under defined operating conditions. Hydraulic modeling provides the unique capability to identify the ability of a gas system to respond to peak hourly demand. This peak demand analysis is critical to evaluating the ability of the gas system to provide reliable service.

4
Analyses based on the addition of supply and system capacity over the period of a day do not consider the intraday demand variations that determine the system’s responsiveness.
The Summer 2017 Assessment finds that the California ISO and the LADWP’s ability to meet the 1-in-10-year peak summer electric load is dependent on the amount of SoCalGas/SDG&E’s system receipt point utilization and withdrawal capability from storage facilities other than Aliso Canyon. Peak summer electric load would most likely cover hours of a day, not a full 24-hour period. The assessment has determined that with the CPUC0F
1 directed storage supply rates of 1.47 billion cubic feet per day (Bcfd) from Honor Rancho, La Goleta and Playa del Rey storage facilities, the electric system 1-in-10 year summer peak load could be maintained at 90 percent receipt point utilization, assuming high use and availability of electric system transmission imports. To increase the total storage supply rates, the CPUC1F
2 directed SoCalGas to increase storage injections into the Honor Ranch, La Goleta and Playa del Rey storage fields to adequate inventory levels to maintain reliable delivery to both core and noncore customers during peak summer. In its response to the CPUC, SoCalGas indicated that it anticipated that the levels indicated by the directive for June 1 would be met.2F
3 As of the date of this report, those levels are in the process of being achieved and the CPUC is closely monitoring those efforts. Nonetheless, the electric load could still be at risk, if the electric system is not fully available, electric supplies are limited, or other outages affect the amount of gas delivered to the gas system. In such circumstances, gas supplies from Aliso Canyon would be necessary to reduce the shortfall to avoid interruption of electric service.
If combined core and noncore gas demand reaches or exceed the gas system capacity, SoCalGas has operational authority to curtail noncore customers to maintain gas system reliability. Several factors contribute to the volume of curtailment including actual daily gas demand, planned and unplanned outages to non-Aliso storage that reduce supply, and planned and unplanned pipeline outages that reduce receipt or delivery capacity. In addition, prolonged periods of high gas usage — for example during hot weather or following a power system contingency event when gas-fired electric generation usage is high and supplies imported into the SoCalGas/SDG&E service territories are limited – can further impact continuous gas service to noncore customer demand and increases the risk of gas curtailments and electrical service interruption.
For the summer of 2017, the 2016 Action Plan mitigation measures remain in place and, as demonstrated during the 2016 summer, reduce the receipt point vs. demand mismatch risk that was a concern last summer. The Summer 2017 Technical Assessment examines the overall gas demand that can be supported by the SoCalGas system during the upcoming summer. Increasing the total storage
1 CPUC directive: http://www.cpuc.ca.gov/uploadedFiles/CPUC_Public_Website/Content/News_Room/News_and_Updates/CPUCLettertoSoCalGasreStorageSafetyEnhancementPlan.pdf 2 http://www.cpuc.ca.gov/uploadedFiles/CPUC_Public_Website/Content/News_Room/News_and_Updates/5-8-17_Ltr%20to%20SoCal%20Gas%20re%20SoCalGas%20Summer%20Reliability%20and%20Storage%20Instructions_A1507014.pdf 3 Rodger Schwecke, SoCalGas letter to Timothy Sullivan, CPUC, March 30, 2017, p.2

5
supply rates has been a concern for summer 2017, so one new mitigation measure has been added to increase gas inventories at the other SoCalGas storage facilities.
As of May 1, 2017, the working gas inventory of Aliso Canyon is 14.8 billion cubic feet (Bcf). Depending on the ability to fully utilize the other storage facilities, gas stored in Aliso Canyon could be critical to reduce the risk of gas curtailments and electrical service interruption this summer. The following bullet points summarize this report for summer 2017.
The hydraulic analyses produced several findings:
• The maximum gas sendout that can be supported based on the inputs provided to SoCalGas without Aliso Canyon is 3.638 Bcfd. Of this total, 2.2 Bcfd is available to support electric generation. Achieving this maximum sendout requires 1) that no other transmission or storage facility outage occurs (beyond the current Line 3000 outage), 2) 100 percent utilization of receipt point capacity and 3) needed withdrawal capacity is available at the other three fields (which assumes those fields hold sufficient storage inventory to support that full withdrawal).
• Any loss of flowing supply from 100 percent of the current receipt point utilization will reduce sendout capacity on a one-to-one basis.
The electric analysis produced the following findings:
• Based on 3.373 Bcfd gas system capacity which represents 90 percent flowing pipeline supplies and maximum storage withdrawal rate capability of 1.470 Bcfd during peak hours excluding Aliso Canyon, the LADWP/California ISO joint 2017 power-flow study found that there was sufficient gas to meet the minimum electric reliability requirement. This assumes there is enough energy supply outside Southern California and sufficient electric transmission import capability into Southern California.
• As with last summer, during peak summer load conditions and historical electric transmission utilization patterns, incremental gas-fired generation may be required to meet electric reliability. If gas supply is insufficient to meet the increased gas demand, access to replacement energy may require emergency assistance from neighboring balancing authorities, and electric load shed in the Southern California region may be necessary.
• This analysis assesses the minimum generation needed to maintain reliability and minimize gas burns. However, this dispatch does not represent the least-cost dispatch for meeting 1-in-10 year peak summer load. Electric reliability is planned daily based on least-cost generation resources to meet load. Economic operation of the generation assets would require gas usage above the outcome of the reliability study. Using resources other than those that are most efficient and economic would result in increased energy dispatch costs and higher electricity prices to ratepayers.
• If transmission import capability decreases or demand response resources are limited, the electricity system needs more gas to avoid service interruptions. Should storage withdrawal or

6
flowing gas supplies also drop, the electricity system will not be able to get that gas and will be at risk.
The mitigation measures are discussed under separate cover.
INTRODUCTION This technical report presents the work of the Aliso Canyon Technical Assessment Group consisting of members of the CPUC, the Energy Commission, California ISO, and LADWP, with data from SoCalGas. This group focused on analyzing reliability for summer 2017, and providing the technical basis for the Aliso Canyon Action Plan. The action plan addresses natural gas and associated electricity reliability impacts due to the SS-25 well leak. The assessment analyzes the system capacity of the SoCalGas/SDG&E gas transmission system. The hydraulic analysis for the assessment was prepared by SoCalGas, using assumptions as directed by the CPUC. The CPUC Energy Division, the Energy Commission, California ISO, and the independent review team, which consist of experts from Los Alamos National Laboratory and Walker & Associates, reviewed the analysis and asked numerous questions to understand and evaluate the results. Given the uncertainty about operations at Aliso Canyon and recognizing the January 2016 order from the CPUC3F
4 to hold inventory at 15 Bcf to protect energy reliability, the analysis assumed no injection and no withdrawal from Aliso Canyon. Gas at Aliso Canyon is preserved for conditions when it is most needed, so it was held out of the analysis. The electrical analysis relies on the gas analysis while noting that independent review team will be reviewing the gas analysis. The ability of the gas system to supply enough gas to gas-fired resources to meet the 1-in-10 year peak summer day, was evaluated by the LADWP and California ISO balancing authorities4F
5 under the following conditions: 1) the ability for the electric system to meet minimum operating criteria to maintain system reliability during summer conditions, and following a power system contingency; 2) the ability of the electric system to replace lost energy due to gas curtailments from generation outside and energy imports into the SoCalGas/SDG&E service territories; and, 3) insufficient imports due to lack of available transmission or supply. Any outage or change that reduces the maximum gas system capacity below the 3.373 Bcfd which reflects 90 percent flowing supply will result in insufficient gas being available to meet peak electric demand.
In addition, the electric system is planned based on least-cost economic dispatch of gas-fired electric generation during unconstrained conditions to meet a 1-in-10 year peak day. Satisfying the goal of generating at least-cost would increase gas burn to well above the minimum gas burn requirements in
4 On January 21, 2016 CPUC Executive Director Timothy Sullivan directed SoCalGas to withdraw natural gas from Aliso Canyon down to an actual working gas inventory of 15 Bcf. 5 A balancing authority is responsible for maintaining the electricity balance within its region. A balancing authority has several ways to maintain the balance of supply and demand, from turning on or off generators to importing or exporting excess electricity to or from their neighbors.” (See http://www.tanc.us/chap6_picture.html.)

7
the power flow analysis. This means that costs to electricity ratepayers will be higher, when the system is re-dispatched, to address a gas constraint.
The hydraulic analysis was further reviewed by an independent review team made up from experts from Los Alamos National Laboratory and Walker & Associates. Their findings are in a separate report.
BACKGROUND This technical assessment focuses on the impact of the unavailability of the Aliso Canyon gas storage facility on the gas and electric system in the SoCalGas/SDG&E service territory during the summer of 2017.
The summer demand on the SoCalGas/SDG&E gas system is driven by noncore electric generation use and high electric load driven by hot weather. Although most of the reliability focus is on the Los Angeles Basin, reliability issues can occur anywhere in the SoCalGas/SDG&E service territories. The SoCalGas/SDG&E natural gas delivery system is an integrated network designed to utilize both pipeline receipts and storage supplies to meet the daily needs of core and noncore customers. In addition, storage is a critical source of noncore customer supply used to meet demand during multi-day heat waves and to manage peak hour demand throughout the day.
The analysis addresses the variables and circumstances specifically related to summer 2017.
SOCALGAS 2017 SUMMER CAPACITY Introduction SoCalGas performed a hydraulic analysis to determine the capacity of its transmission system to serve demand without supply from Aliso Canyon based on a high level of storage withdrawal capacity and 100 percent available flowing supplies. Conducting a mass balance review of the SoCalGas and SDG&E gas transmission system comparing available supply and demand can provide an initial assessment, but ultimately is insufficient. Such an analysis identifies a problem only if there is a large difference between supply and demand. It does not consider how the system responds to intra-day changes in demand and the resulting effect on system operating pressures. Hydraulic analyses take these dynamic demand patterns into consideration and use industry standard flow equations to calculate the resulting pressure changes throughout the pipeline network over simulated periods. The hydraulic analysis evaluated the ability of the SoCalGas system to provide reliable service during peak demand periods and to respond to dynamic operating conditions without Aliso Canyon.
Summary of hydraulic findings The hydraulic analysis produced the following findings:
• The maximum sendout that can be supported without Aliso Canyon is 3.638 Bcfd. Of this total, 2.2 Bcfd is available to support electric generation. Achieving this maximum sendout requires that no other transmission or storage facility outage occurs (beyond the current Line 3000

8
outage), and that all available pipeline supply receipt points and storage withdrawal facilities are operating at maximum levels.
• Any loss of pipeline flowing supply or storage withdrawal capacity from the assumed levels will reduce sendout capacity on a one-to-one basis.5F
6
Hydraulic Analysis SoCalGas has assessed the maximum capacity of the SoCalGas/SDG&E gas system for the upcoming summer season to be 3.638 Bcfd under a scenario with pipeline supplies operating at full receipt point capacity and using the storage withdrawal capacities, below, provided by the CPUC Energy Division.6F
7 The following inputs were used for the hydraulic simulation: Pipeline supply: 3185 million cubic feet per day (MMcfd)
• North Needles: 800 MMcfd • Kramer Junction: 550 MMcfd • Wheeler Ridge: 765 MMcfd • Blythe: 1010 MMcfd • California Producers: 60 MMcfd • Topock: 0 MMcfd (Line 3000 assumed out of service)
Storage supply maximum rates: 1470 MMcfd
• Honor Rancho: 840 MMcfd • La Goleta: 330 MMcfd • Playa del Rey: 300 MMcfd • Aliso Canyon: 0 MMcfd
Using these inputs, the hydraulic simulation software calculated a maximum system capacity of 3.638 Bcfd. For a hydraulic analysis to be considered successful, pressure must be maintained between minimum and maximum operating pressures, all facilities must operate within established capacities, and system linepack must be recovered. This criterion ensures that the simulation is repeatable, even though a higher level of demand may be supported if any one of these criteria is relaxed. Relaxing any of these parameters has operational and system integrity consequences. For example, violating the criteria to maintain minimum and maximum operating pressures at all times results in a risk to maintaining continuous service to customers and undesired release of gas or pipeline rupture, respectively. Relaxing the criteria to fully recover the system linepack presumes that the linepack will be recovered on the following day, which cannot be guaranteed, in which case system integrity and service to customers would be compromised.
6 The one-to-one assumption is based on historical hydraulic modeling results of the SoCalGas system. 7 Per email from Energy Division titled “Storage supply inputs for hydraulic modeling” dated April 17, 2017.

9
SoCalGas cannot forecast customer curtailment on its gas transmission system. Depending upon the level of demand, the level and location of delivered supply, and the availability of transmission assets, curtailment of customer demand can be avoided in one situation and be required in an otherwise similar situation. Specifically, if in real time, gas control observes rapid pressure drops, it may order gas curtailments to preserve system integrity even at system sendout levels lower than that found in this analysis. Gas control operations are naturally more conservative than the model would find and may call curtailments before the circumstances envisioned in the model occur. The results of this simulation are summarized in Table 1 below. While supply must equal demand for a simulation to be successful, it is incorrect to conclude that the sum of daily supplies should equal the system capacity. Such a conclusion ignores the dynamics that can only be captured in a hydraulic simulation, which calculates operating pressures and changes at multiple key points on the system as customer demand changes throughout the day. On a daily basis, the system can appear to be totally in balance while there are differences between supply and demand during various hours of the day. There are additional factors affecting SoCalGas’ ability to withdraw gas from storage and serve variable customer demand from a constant-rate of pipeline supplies. While maximum rates could be achieved during a peak hour period, the non-peak hours would not have enough demand to use all of the gas from Honor Rancho and all of the supply from Wheeler Ridge. Those Honor Rancho supplies compete for pipeline capacity with supply coming from Wheeler Ridge, so that both cannot operate at maximum at the same time for the entire day.7F
8 Under the input conditions above, with 100 percent of pipeline capacity at every receipt point and storage withdrawals, SoCalGas would need to inject to avoid over pressuring the system during off-peak hours. SoCalGas’ storage fields are physically incapable of switching rapidly between withdrawal and injection (depending on the field, it could take up to three hours to make the switch). Managing system pressures becomes very challenging under conditions with such tight operating margins.
8 This condition was also noted and discussed in last year’s Winter Assessment.

10
Table 1: Hydraulic Analysis Simulation
SoCalGas System Capacity, Summer 2017
DAY PEAK HOUR MMCFD MILLION CUBIC FEET PER HOUR (MMCFH) Pipeline 3,185 132.7 North Needles 800 33.3 Topock* 0 0.0 Kramer Junction 550 22.9 Ehrenberg 1,010 42.1 Otay Mesa 0 0.0 Wheeler Ridge 765 31.9 Kern River Station 0 0.0 CA production 60 2.5 Storage 468 61.3 Aliso Canyon 0 0.0 Honor Rancho 198 35.0 La Goleta 170 13.8 Playa del Rey 100 12.5 Demand 3,638 221.5 Core 808 33.7 Electric Generation 2,201 153.5 Noncore non-EG 629 34.3
*Zero receipts from the Topock receipt point due to the Line 3000 outage. Plots of supply and demand throughout the day and pressure on the northern system and in the Los Angeles Basin are shown in Figures 1 and 2. Figure 1 demonstrates the hourly differences between supply and demand, including storage withdrawal.
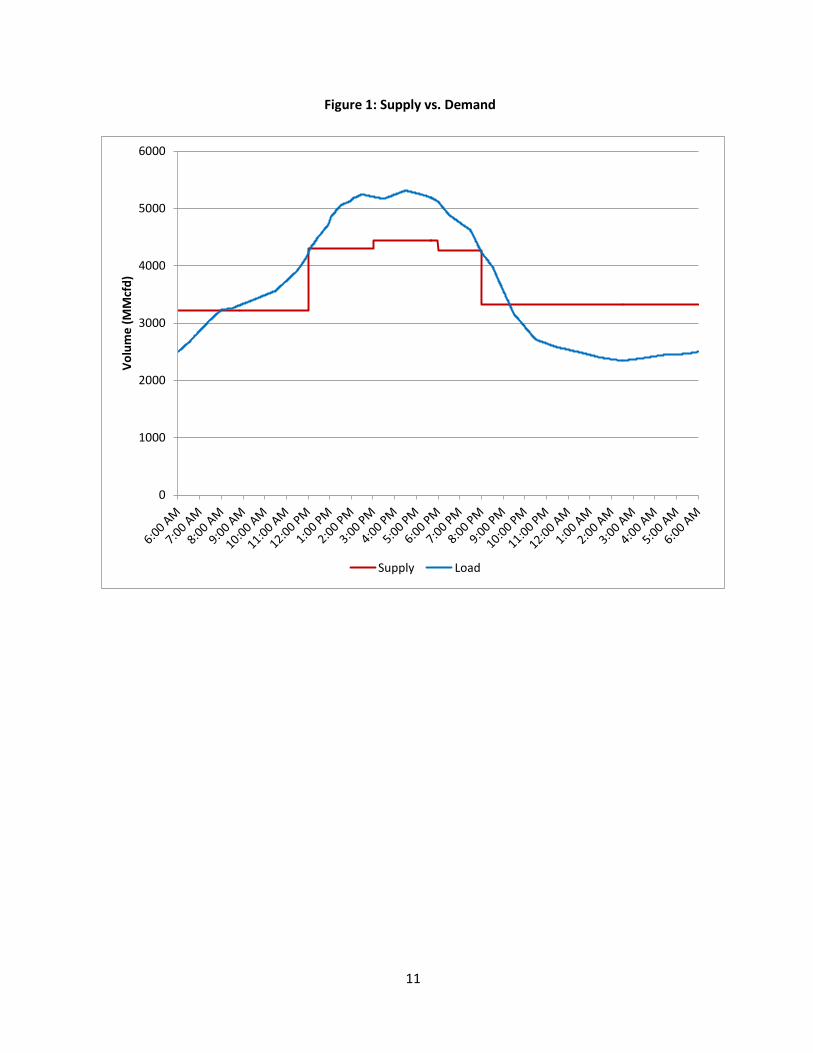
11
Figure 1: Supply vs. Demand
0
1000
2000
3000
4000
5000
6000
Volu
me
(MM
cfd)
Supply Load

12
Figure 2: Northern System and Los Angeles Basin Pressures
200
300
400
500
600
700
800
Pres
sure
(psi
g)
El Segundo Los Alamitos North System
13
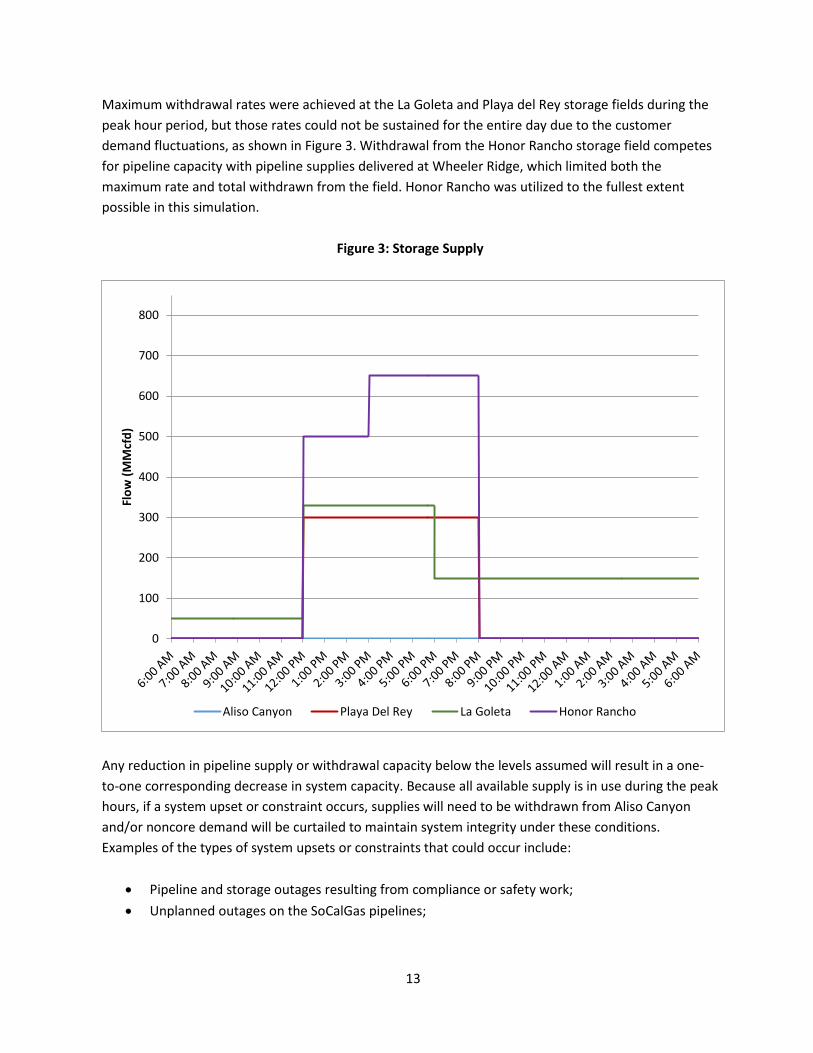
Maximum withdrawal rates were achieved at the La Goleta and Playa del Rey storage fields during the peak hour period, but those rates could not be sustained for the entire day due to the customer demand fluctuations, as shown in Figure 3. Withdrawal from the Honor Rancho storage field competes for pipeline capacity with pipeline supplies delivered at Wheeler Ridge, which limited both the maximum rate and total withdrawn from the field. Honor Rancho was utilized to the fullest extent possible in this simulation.
Figure 3: Storage Supply
Any reduction in pipeline supply or withdrawal capacity below the levels assumed will result in a one-to-one corresponding decrease in system capacity. Because all available supply is in use during the peak hours, if a system upset or constraint occurs, supplies will need to be withdrawn from Aliso Canyon and/or noncore demand will be curtailed to maintain system integrity under these conditions. Examples of the types of system upsets or constraints that could occur include:
• Pipeline and storage outages resulting from compliance or safety work; • Unplanned outages on the SoCalGas pipelines;
0
100
200
300
400
500
600
700
800
Flow
(MM
cfd)
Aliso Canyon Playa Del Rey La Goleta Honor Rancho

14
• Unplanned outages at the SoCalGas storage facilities, such as the loss of a dehydration unit or other gas processing equipment, or a pipeline facility failure within the storage field;
• Planned or unplanned outages on the upstream pipelines; or • Supply deliveries not at 100 percent of capacity due to customers/shippers balancing to the
lower bound of the balancing rules or a disruption somewhere in the supply chain. Based on the above, the 3.638 Bcfd system capacity for the summer operating season results in the ability to support a maximum system-wide electric generation demand of 2.2 Bcfd.
JOINT LADWP AND CALIFORNIA ISO IMPACT ANALYSIS AND RESULTS
Introduction Based on the SoCalGas system capacity findings of 3.638 Bcfd, which assume flowing supply receipts of 3.185 Bcfd and a storage withdrawal of 1.4 Bcfd, the LADWP and California ISO balancing authorities8F
9 performed a complementary joint assessment of the electric impacts based on the gas available to serve electric generation of 2.2 Bcfd. In addition, two sensitivity analyses were performed to determine the minimum level of gas necessary to avoid electric load interruption under summer electric condition with all transmission lines in service and following a power system contingency event impacting the Southern California region. These two sensitivity analyses show that 2.2 Bcfd of gas system capacity available for electric generation should be sufficient to support electric demand in all minimum requirement scenarios.
Under CPUC rules,9F
10 electric generators are considered noncore service and are the first gas customers called to reduce gas consumption. The more advance notice of such gas curtailments, the more time the electric system has to respond and reduce electric system impact. Short notice of gas curtailments reduces the options available to secure additional imports to replace the energy lost by the gas curtailment. Because most replacement energy will have to be imported into the area, the ability to respond to short-notice gas curtailments will be limited by the electric transmission capacity and electric supply available outside the area at the time of the curtailment.
As responsible balancing authority operators, the LADWP and California ISO develop and implement daily resource plans to ensure adequate resources to meet their projected demand, including contingency and operating reserves required to meet the North America Electric Reliability Corporation (NERC) reliability standard. These standards ensure sufficient resources are available to securely balance supply and demand under normal conditions and following a power system contingency.
9 The LADWP and California ISO balancing authorities include the municipal utilities of Anaheim, Riverside, Pasadena, Azusa, Banning, Colton, Vernon, Rancho Cucamonga, Corona, Moreno Valley, Burbank and Glendale. The balancing authorities will be referred to as the LADWP and California ISO throughout the electric analysis section of this document 10 CPUC Decision 16-07-008 adopted a new curtailment procedures settlement agreement on July 14, 2016.

15
The 2017 summer assessment focuses only on the electric reliability impact of gas constraints. There are also financial impacts of operating electric generation in non-efficient and non-economic ways to address supportable supplies and constraints on the SoCalGas/SDG&E service territories without Aliso Canyon. This assessment does not attempt to quantify those financial impacts.
Summary of Electric Findings • Based on 3.373 Bcfd gas system capacity which represents 90 percent flowing pipeline supplies
and maximum storage withdrawal rate capability of 1.470 Bcfd during peak hours excluding Aliso Canyon, the LADWP/California ISO joint 2017 power-flow study found that there was sufficient gas to meet the minimum electric reliability requirement. This assumes there is enough energy supply outside Southern California and sufficient electric transmission import capability into Southern California.
• As with last summer, during peak summer load conditions and historical electric transmission utilization patterns, incremental gas-fired generation may be required to meet electric reliability. If gas supply is insufficient to meet the increased gas demand, access to replacement energy may require emergency assistance from neighboring balancing authorities. Electric load shed in the Southern California region may also be necessary.
• This analysis assesses the minimum generation needed to maintain reliability and minimize gas burns. However, this dispatch does not represent the least-cost dispatch for meeting 1-in-10 year peak summer load. Electric reliability is planned daily based on least-cost generation resources to meet load. Economic operation of the generation assets would require gas usage above the outcome of the reliability study. Using resources other than those that are most efficient and economic would result in increased energy dispatch costs and higher electricity prices to ratepayers.
• As the transmission import limitation falls or demand response resources are limited, the electricity system needs more gas to avoid service interruptions. Should storage withdrawal or flowing gas supplies also drop, the electricity system will not be able to get that gas.
California ISO and LADWP regularly conduct reliability assessments based on the expected electrical system conditions for the operating period being analyzed. The focus here is for the 2017 summer operating season. These studies are performed using the applicable Western Electricity Coordinating Council (WECC) seasonal base case, modified as needed to simulate the conditions expected for this season. This includes all planned transmission and generation outages. These conditions are modeled in an off-line power flow program that runs a set of transmission and generation contingencies to determine minimum generation commitment necessary to maintain NERC reliability requirements10F
11 under normal summer load conditions and following a power system contingency event.
11 Minimum generation commitment and post contingency generation are key drivers for gas usage and are necessary to avoid post contingency load shed.

16
The summer power flow case was modeled to study the minimum generation required in the LADWP and California ISO systems to maintain electric system reliability. The fleet of resources that depend on gas supplied by SoCalGas inside the Los Angeles Basin and southern system was kept at the minimum levels possible while maintaining reliability of the electric system. Additional assumptions include maximizing the electric transmission capability for imports into the southern electric system while maintaining electric system reliability.
Multiple power flow case studies were developed for this assessment utilizing the WECC-Operational Study Subcommittee’s summer 2017 1-in-10 summer power flow case. The summer peak analysis assumes the following electric demand levels:
• Southern California Edison (SCE) = 23,381 megawatts (MW)
• SDG&E = 4,824 MW
• LADWP Balancing Area = 7,103 MW
As balancing authorities and transmission operators, the LADWP and California ISO are required to meet NERC Reliability Standards requirements. These include:
• The requirement for the balancing authority to carry and maintain a minimum amount of contingency reserve.
• The requirement for the balancing authority and transmission operator to meet unscheduled changes in system configuration and generation dispatch (at a minimum N-111F
12 contingency planning) in accordance with NERC, regional reliability organization, sub-regional, and local reliability requirements.
The LADWP and California ISO performed a joint assessment to determine the minimum generation requirements based on the expected summer peak load. This assessment included:
• A power flow analysis to ensure acceptable electric system performance under operating conditions with all transmission in service and following a power system contingency.
• An assumed normal transmission system configuration with all lines in service.
• The minimum generation levels to maintain local reliability, extrapolated to meet the load pattern.
• Maximized imports within the constraints of transmission and supply limitations in order to meet customer demand not met by minimum required generation levels within the SoCalGas service territory.
The summer reliability assessment focused on local transmission reliability, including the contingency reserve requirement necessary to immediately meet the greater of the loss of the most severe single contingency or about 6 percent of the hourly peak load. The assessment also included replacement
12 N-1 is the loss of any generator, transmission line, transformer, or shunt device.

17
reserve capacity that will need to be sourced and procured after the first hour of a power system contingency. While the quantity and location of the generation commitment may vary depending on load level, system topology, fuel costs and economics each day, experience and the summer 2017 seasonal assessment performed by the LADWP and California ISO show the need to have a minimum amount of generation commitment inside the Los Angeles, Orange County, and San Diego areas.
Figure 4 shows the minimum generation needed in both the LADWP and California ISO balancing authorities to meet peak summer conditions and to recover from a power system contingency. The generation need including qualified facilities is translated into a gas requirement of 1.75 Bcfd and 1.87 Bcfd, respectively. The generation pattern increases sharply during the eight-hour peak period due to the increase in gas burn needed to meet electric demand, as shown in the shaded area of the figure.
Figure 4: Minimum Electric Generation, Gas Requirements in MMcfd
Impact Assessment Minimum Energy Requirement from Gas Generation
An analysis was conducted to determine the minimum energy and capacity requirements for the LADWP and California ISO system within the SoCalGas service area under normal 1-in-10 year summer

18
peak operating conditions. Assuming all transmission lines are in service and all generation is available, during summer peak conditions, the minimum output of generation served by the SoCalGas/SDG&E service territories to meet the studied reliability criteria was 9,924 MW for the peak hour for the combined LADWP and California ISO area. A second analysis was conducted to determine the minimum electric energy and capacity requirements within the SoCalGas/SDG&E service area following a power system contingency event during 1-in-10 day summer operating conditions. The incremental gas generation requirement after the event from resources served by SoCalGas was up to 2,720 MW per hour to maintain electric reliability after the “worst case” power system contingency impacting Southern California.
Lastly, an analysis was conducted to determine the feasibility of procuring and delivering energy from outside the SoCalGas/SDG&E service territories into the Los Angeles Basin and southern system. The analysis evaluated the ability to provide replacement energy at three electric transmission capacity utilization levels (100 percent, 90 percent and 85 percent).
The minimum requirements discussed above also account for local transmission or distribution systems including local utilities that are embedded within the LADWP and California ISO balancing areas such as the cities of Riverside, Pasadena, Glendale, and Burbank.
Local Area Analysis The local area impacts for the LADWP and California ISO electric generation, shown in Table 2 and Table 3, are based on the minimum generation required to meet a 1-in-10 peak day with all transmission lines in service. Under these conditions, there would be in a combined gas burn of 858 MMcfh for the eight-hour peak period from 2 p.m. to 9 p.m. The following scenario was assessed:
• The electric generation impact at a 3.638 Bcfd gas system capacity with a maximum storage withdrawal rate of 1.470 Bcfd and flowing gas supplies at 100 percent pipeline capacity from all receipt points excluding Topock due to Line 3000 outage.
For this scenario, two additional sensitivity analyses were performed using actual gas burns for each day to determine if the gas supply necessary to meet electric generation and avoid electric load interruption could have been met under the supportable gas demand:
• The 2016 Southern California electric peak day was June 20, 2016. • A multiple transmission line contingency during the Blue Cut Fire on August 16, 2016. This
scenario represents a real time contingency during a normal summer load pattern. Additional gas supplies were required within the day to support electric reliability.
Two additional sensitivity analyses were performed for the 2017 1-in-10 summer load day power flow analysis under a scenario with all transmission lines fully available and following power system contingency event condition. Flowing gas supplies were studied at:
• 100 percent pipeline capacity and • 90 percent pipeline capacity.

19
The analysis begin with the 3.638 Bcfd gas capacity available for the summer 2017 condition, as shown in Table 2. The gas usage for core and noncore, non-electric generation users was subtracted from the total gas demand to arrive at the total available for electric generation. The daily electric generation burn was converted to an eight-hour period (from 2 p.m. to 9 p.m.) to reflect the gas burn required to meet summer peak demand. The supported gas demand during the eight hour period is shown in Row 5, which also includes a 1.47 peaking factor provided by SoCalGas.12F
13 The amount of gas required to support LADWP and California ISO electric generation was compared to amount of gas that SoCalGas can supply. The ability for the gas supply to meet the electric generation minimum gas requirements under summer operating conditions with all transmission lines in service is indicated in Row 9 while the amount needed following a power system contingency event that impacts Southern California is indicated in Row 12. A positive value indicates that enough gas can be delivered to support the minimum gas requirement necessary to meet local reliability for the combined LADWP and California ISO balancing areas. Therefore, a positive value in Rows 9 and 12 indicates that if a gas curtailment of electric generation load is called, the quantity of gas curtailment identified in the analysis is not expected to impact the ability to meet electric demand. However, the situation would result in an increased cost of serving electric load. If the minimum gas requirements cannot be met, as indicated by a negative value, electric demand response,13F
14 as shown in Row 14, was used at the maximum value to reduce the shortfall. The remaining curtailment, Row 16, will need to be addressed by withdrawing gas supply from Aliso Canyon; if available, reducing deliveries to other noncore customers; or reducing electric load. The analysis using the 3.638 Bcfd capacity indicates that in all minimum requirement scenarios the gas system capacity is sufficient to meet the peak electric demand in a 1-in-10 year summer peak scenarios14F
15. This result holds only if the gas system is operating at zero constraints beyond the current Line 3000 outage. In other words, any outage or change that reduces the maximum gas system capacity below the 3.373 Bcfd, which reflects 90 percent flowing supply, will result in insufficient gas being available to meet peak electric demand.
13 This factor reflects the observed delta between average hourly demand in a day versus the peak hour. 14 Demand response submitted to the California ISO for the Southern California area and the LADWP demand response historically attained. Availability of demand response is subject to notification time constraints. 15 The last scenario of gas demand supportable at 90 percent flowing gas supply is calculated by using the utilization table provided for winter by SoCalGas.

20
Table 2: Summary of Assessment of Electric Impact Under a 3.638 Bcfd Gas System Capacity
21
Ability to Re-Supply Energy in the Event of Gas Curtailment A reduction in available gas during a curtailment will require replacing the electric generation within the SoCalGas/SDG&E service territories with electric generation from non-curtailed resources outside the service area. The LADWP and California ISO will attempt to re-dispatch to other energy sources, but the options are limited to available imports or other uncommitted available gas resources. Other factors include transmission import capability energy availability and time. Re-supplying energy takes at least one to two hours.
Transmission Availability into the Greater Los Angeles, Orange County and San Diego Areas
The power flow analysis simulated total possible imports into Southern California of 17,148 MW. However, the highest transfer observed is 15,500 MW, which is 90 percent of the maximum simulated. Of this amount, 4,000 MW is expected to come from Northern California, 3,100 MW is expected to come from the Northwest, and the remainder is expected to come from Utah, Arizona, and Nevada.
If energy is already flowing prior to a gas curtailment, there will be limited capacity available to transport energy to absorb the curtailment.
Available Generation Outside the Area Served by SoCalGas
There are some gas-fired resources in Southern California that take gas service from pipelines other than those of SoCalGas/SDG&E. For example, the resources of the High Desert Power Plant can be used to mitigate curtailments to gas-fired resources in the SoCalGas/SDG&E service territories but may not serve to address local transmission constrained areas in the Los Angeles Basin and southern system. In addition and depending on weather conditions, solar, wind, and hydroelectric15F
16 resources in Southern California can also compensate for electric supply lost due to gas curtailment.
For the LADWP, some energy may be shifted from gas-fired generation to the Castaic Power Plant in real time. But energy from Castaic is limited by reservoir elevation, and Castaic cannot sustain maximum output for more than a few hours, particularly on successive days.
Table 3, shows the volume of import supply outside the SoCalGas region that would be necessary to replace electric generation in the event of gas curtailments. The analysis reviews three cases:
1) Imports of 17,148 MW – 100 percent transmission capacity utilization as reviewed in the 1-in-10 peak day power flow analysis
2) Imports of 15,500 MW – 90 percent transmission capacity utilization as observed as the historical transmission utilization maximum
3) Imports of 14,616 MW – 85 percent transmission capacity utilization as observed on the peak summer day in 2016.
16 Hydro resources are outside of the Los Angeles Basin therefore may not address local area transmission constraints.

22
The analysis starts with the forecasted 2017 summer load for the Southern California region. It then sums the maximum import capability; the maximum non-gas-fired generation capacity, such as hydro, solar, and wind; and the minimum gas-fired generation needed to meet local reliability requirements. The sum of the generation must equal the load to maintain the electric power system balance. Table 3 shows the analysis of imported energy into the Southern California region for three transmission utilization cases in Row 2. The combined LADWP and California ISO minimum gas-fired generation needed to meet reliability requirements is shown in Row 7. If the import utilization is insufficient, the required incremental gas need is indicated in Row 8. The incremental gas-fired generation energy required following a power system contingency event impacting Southern California is Row 10. The incremental gas demand is Row 11. The results show that as transmission utilization decreases, the need for gas-fired resources increases. If all re-supply options have been exhausted, additional gas will be required from other sources including Aliso Canyon or electric load shed may be required.
Table 3: Summary of Assessment of Electric Impact Based Transmission Utilization
Gas Supplies Shortfall Based on Receipt Point and Transmission Utilization Tables 4 and 5 are based on the electric impact analysis summarized in Tables 2 and 3. They summarize the gas supply shortfall on the 1-in-10 year peak summer day. An analysis was performed for four scenarios. The first two scenarios reviewed 100 percent flowing gas supply with 90 percent and 85 percent electric import transmission utilization, respectively. The second two scenarios reviewed 90 percent flowing gas supply with the same 90 percent and 85 percent electric import transmission utilization. Rows 1 and 2 indicate the needed gas supply that resulted from the analysis in Tables 2 and 3. The results in these two rows include the amount of additional gas supply needed following a power system contingency. To avoid double accounting the gas needed for a contingency, Row 3 is subtracted from the total need as shown in Row 4. Table 4 shows the gas receipt point and electric transmission utilization assessment under a 3.638 Bcfd maximum supportable gas demand. At 90 percent gas receipt point utilization and 85 percent transmission import utilization, the gas need shortfall is 110 MMcf for the eight-hour peak period. Withdrawal from Aliso Canyon or electric load shed would be required to address the gas shortfall. If there are multiple high electric load days, the same amount of gas would be needed for each day.

23
Table 4: Summary of Assessment of Gas Receipt Point and Electric Transmission Utilization Under a 3,638 MMcfd Supportable Gas Supply
Since gas system capacity is a function of storage withdrawal capability, a graph of this relationship and the ultimate impact on the electric system can be developed. As the storage withdrawal capability increases, the amount of supportable electric generation demand increases. If the supportable gas demand exceeds the minimum gas needed for electric generation to maintain reliability, there will be a surplus (positive value) of gas system capacity relative to minimum gas needed. If the storage withdrawal capability decreases, then the supportable electric generation demand will also decrease. If the supportable gas demand is insufficient to meet the minimum gas needed for electric generation to maintain reliability, there will be a shortfall (negative value) of gas system capacity relative to minimum gas needed. Thus, additional gas would be needed as described in the Table 4.
Different curves reflecting the relationship between storage withdrawal capability and gas capacity surpluses/shortfalls for electric generation demand across the eight peak hours can be developed for different transmission import capacity utilization levels and demand response availability of 90 percent assuming all other flowing gas supply parameters are held constant. As the electric imports falls or demand response resources are limited, the electricity system needs more gas to avoid service interruptions. If the storage withdrawal capability across the eight peak hours was reduced, the electricity system may not have sufficient gas to maintain electric reliability. Figure 5 illustrates these relationships.

24
Figure 5: Relationship Between Storage Withdrawal Capability Vs. Gas Capacity Surpluses/ Shortfall for Electric Generation Demand across Eight Peak Hours
Based on the gas system capacity level studied, the analysis indicates that the LADWP and California ISO can avoid interrupting firm electric customer load as long as enough energy resources are available and able to be imported into Southern California. This conclusion holds only if there are no additional outages on the electric and/or gas system beyond those assumed in the analysis. If flowing supply receipts and gas withdrawals from the other three fields are lower than assumed, then electrical generation resources are susceptible to gas curtailments. In that case, withdrawals from Aliso Canyon may be necessary. Furthermore, if there are insufficient electric energy supplies from sources outside the SoCalGas system the potential for electric load interruption exists.
MITIGATION MEASURES Mitigation measures that attempt to reduce the risk identified in the technical assessment are being reviewed and modified in the 2017 Aliso Summer Update.