doctor of philosophy - aston publications...
TRANSCRIPT

DOCTOR OF PHILOSOPHY
Catalytic intermediate pyrolysis of Bruneirice husk for bio-oil production
Muhammad Abu Bakar
2013
Aston University

Some pages of this thesis may have been removed for copyright restrictions.
If you have discovered material in AURA which is unlawful e.g. breaches copyright, (either
yours or that of a third party) or any other law, including but not limited to those relating to
patent, trademark, confidentiality, data protection, obscenity, defamation, libel, then please
read our Takedown Policy and contact the service immediately

1
CATALYTIC INTERMEDIATE PYROLYSIS OF BRUNEI RICE HUSK
FOR BIO-OIL PRODUCTION
MUHAMMAD SAIFULLAH ABU BAKAR
Doctor of Philosophy
ASTON UNIVERSITY
SEPTEMBER 2013
© Muhammad Saifullah Abu Bakar, 2013
Muhammad Saifullah Abu Bakar asserts his moral right to be identified as the author of this
thesis
The copy of this thesis has been supplied on condition that anyone who consults it is
understood to recognise that its copyright rests with its author and that no quotation from the
thesis and no information derived from it may be published without proper acknowledgement

2
Thesis Summary
Rice husks from Brunei were subjected via intermediate pyrolysis for bio-oil production. Two main objectives were set out for this study. The application of intermediate pyrolysis on Brunei rice husk for the production of bio-oil is the main objective of this experiment. Characterisation of the rice husks was inclusive as a pre-requisite step to assess the suitability as feedstock for production of liquid fuels. Following on from the characterisation results, a temperature of 450°C was established as the optimum temperature for the production of bio-oil. A homogenous bio-oil was obtained from the pyrolysis of dry rice husk, and the physicochemical properties and chemical compositions were analysed.
The second objective is the introduction of catalysts into the pyrolysis process which aims to improve the bio-oil quality, and maximise the desired liquid bio-oil properties. The incorporation of the catalysts was done via a fixed tube reactor into the pyrolysis system. Ceramic monoliths were used as the catalyst support, with montmorillonite clay as a binder to attach the catalysts onto the catalyst support. ZSM-5, Al-MCM-41, Al-MSU-F and Brunei rice husk ash (BRHA) together with its combination were adopted as catalysts. Proposed criterions dictated the selection of the best catalysts, subsequently leading to the optimisation process for bio-oil production. ZSM-5/Al-MCM-41 proved the most desirable catalyst, which increases the production of aromatics and phenols, decreased the organic acids and improved the physicochemical properties such as the pH, viscosity, density and H:C molar ratios. Variation in the ratio and positioning of both catalysts were the significant key factor for the catalyst optimisation study.
Keywords: Brunei rice husk, Intermediate pyrolysis, Bio-oil, Zeolites, Catalyst optimisation

3
“In the name of Allah,
The Most Beneficent, the Most Merciful,
All the praises and thanks be to Allah, the Lord of all creation,
The Most Beneficent, the Most Merciful,
The only owner and the only ruling judge of the day of recompense,
You alone we worship, and You alone we ask for help,
Guide us to the straight way, the way of those on whom You have bestowed Your grace,
Not the way of those who have earned Your anger, nor of those who went astray.”
- The Holy Quran (1:1-7)
“Verily, We have given you a manifest victory,
That Allah may forgive you your sins of the past and the future, and complete His favour on
you, and guide you on the straight path,
And that Allah may aid you with a mighty victory.”
- The Holy Quran (48:1-3)
TO MY BELOVED FAMILY AND FRIENDS

4
Acknowledgements
I would like to address my sincerest gratitude to Dr. James Titiloye for the endless moral
encouragement and motivational support you have given me. Your thoughtful guidance
during my journey along the completion of this thesis, and as a student will be remembered.
My dearest thanks also go to the Chemical Engineering and Applied Chemistry lecturers and
staffs, and both European Bioenergy Research Institute (EBRI) and Bio-Energy Research
Group (BERG) members. Under the guidance of leading scholars particularly Prof. Andreas
Hornung and Prof. Anthony Bridgwater, I believe that EBRI will keep on growing and extend
its reach towards a continuous breakthrough in the bioenergy field.
Financial support from the Brunei Government under the Ministry of Education is gratefully
acknowledged.
Special thanks to Asad, Yang, Miloud, Zsuzsa, Janat, Nuch, Kat and the rest of the current
and former colleagues in EBRI who have assisted me with the ups and downs of being a
research student. Not forgetting my beloved family and friends, especially my mum and dad
and those in Brunei for coping with my temporary absence from your daily lives.

5
TABLE OF CONTENTS
Thesis Summary………………………………………………………………………………..........2
Acknowledgement…………………………………………………………………………………….4
List of Tables……………………………………………………………………………………...…10
List of Figures……………………………………………………………………………………..…12
1 INTRODUCTION ......................................................................................................... 14
1.1 Background........................................................................................................... 14
1.2 Motivations and limitations for biofuels in Brunei Darussalam ............................... 15
1.3 Current and potential projects for alternative energy or waste utilisation ............... 16
1.4 Brunei Rice Husk .................................................................................................. 16
1.5 Research Objectives ............................................................................................. 17
1.6 Organisation of thesis ........................................................................................... 18
2 BIOMASS AND PYROLYSIS OF BIOMASS ............................................................... 19
2.1 Biomass ................................................................................................................ 19
2.2 Biomass chemical composition ............................................................................. 19
2.2.1 Cellulose ........................................................................................................ 19
2.2.2 Hemicellulose ................................................................................................ 19
2.2.3 Lignin ............................................................................................................. 20
2.2.4 Organic Extractives ........................................................................................ 20
2.2.5 Inorganic Matter ............................................................................................. 21
2.2.6 Water ............................................................................................................. 21
2.3 Biomass pyrolysis ................................................................................................. 21
2.3.1 Fast Pyrolysis ................................................................................................ 22
2.3.2 Slow Pyrolysis ................................................................................................ 22
2.3.3 Intermediate Pyrolysis .................................................................................... 22
2.3.3.1 HALOCLEAN® ....................................................................................... 22
2.3.3.2 Pyroformer .............................................................................................. 23
2.4 Factors affecting intermediate pyrolysis ................................................................ 25

6
2.4.1 Feedstock composition and preparation ......................................................... 25
2.4.2 Moisture content ............................................................................................ 25
2.4.3 Pyrolysis temperature .................................................................................... 26
2.5 Pyrolysis products ................................................................................................. 28
2.5.1 Liquid bio-oil .................................................................................................. 28
2.5.2 Solid biochar .................................................................................................. 28
2.5.3 Non-condensable gases ................................................................................ 28
2.6 Pyrolysis of biomass components ......................................................................... 29
2.6.1 Cellulose degradation mechanism ................................................................. 29
2.6.2 Hemicellulose degradation mechanism .......................................................... 30
2.6.3 Lignin degradation mechanism ...................................................................... 31
2.7 Pyrolysis studies of rice husk for bio-oil production ............................................... 31
3 CATALYTIC PYROLYSIS OF BIOMASS .................................................................... 34
3.1 Introduction ........................................................................................................... 34
3.2 Catalytic pyrolysis arrangement ............................................................................ 34
3.3 Catalyst types ....................................................................................................... 35
3.3.1 Zeolite catalysts ............................................................................................. 35
3.3.2 Zeolite-like catalysts ....................................................................................... 36
3.3.3 Metal Oxides .................................................................................................. 36
3.3.4 Natural catalysts ............................................................................................ 37
3.3.5 Aqueous metallic solution .............................................................................. 37
3.4 Catalyst’s attachment/accessory ........................................................................... 37
3.4.1 Catalyst support ............................................................................................. 37
3.4.2 Catalyst binder ............................................................................................... 38
3.5 Factors affecting catalytic pyrolysis ....................................................................... 38
3.5.1 Catalyst deactivation ...................................................................................... 38
3.5.2 Ratio of catalyst and biomass ........................................................................ 39
3.5.3 Catalyst bed temperature ............................................................................... 39
3.6 Catalyst regeneration ............................................................................................ 40
3.7 Catalytic pyrolysis of biomass ............................................................................... 40

7
3.7.1 Mechanisms for catalytic pyrolysis of biomass ............................................... 42
4 CHARACTERISATION METHODS OF BIOMASS AND BIO-OIL ............................... 45
4.1 Introduction ........................................................................................................... 45
4.2 Biomass preparation/processing ........................................................................... 45
4.3 Biomass characterisation methods ....................................................................... 45
4.3.1 Proximate Analysis ........................................................................................ 45
4.3.2 Elemental Analysis......................................................................................... 46
4.3.3 Ash/Inorganic Composition Analysis .............................................................. 46
4.3.4 Structural/Compositional Analysis .................................................................. 46
4.3.5 Heating/Calorific Value .................................................................................. 47
4.3.6 Thermogravimetric Analysis (TGA) and Derivative Thermogravimetric Analysis
(DTG) 48
4.4 Characterisation of bio-oil ..................................................................................... 49
4.4.1 Water Content ................................................................................................ 49
4.4.2 Acidity ............................................................................................................ 49
4.4.3 Viscosity ........................................................................................................ 50
4.4.4 Density........................................................................................................... 50
4.4.5 Elemental Analysis......................................................................................... 50
4.4.6 Heating/Calorific Value .................................................................................. 50
4.4.7 Gas Chromatography – Mass Spectrometry (GC-MS) ................................... 51
5 BIOMASS CHARACTERISATION RESULTS OF BRUNEI RICE HUSK .................... 52
5.1 Introduction ........................................................................................................... 52
5.2 Sieve analysis ....................................................................................................... 52
5.3 Biomass characterisation results ........................................................................... 53
5.3.1 Proximate and ultimate analysis..................................................................... 54
5.3.2 Compositional Analysis .................................................................................. 55
5.3.3 Heating Values .............................................................................................. 56
5.3.4 Ash composition analysis ............................................................................... 57

8
6 PYROLYSIS OF BRUNEI RICE HUSK ....................................................................... 61
6.1 Introduction ........................................................................................................... 61
6.2 Bench scale intermediate pyrolysis rig .................................................................. 61
6.2.1 Reaction conditions........................................................................................ 62
6.2.2 Mass balance and product yield ..................................................................... 64
6.2.3 Gas composition ............................................................................................ 64
6.3 Non-catalytic pyrolysis experimental results and discussion ................................. 65
6.3.1 Mass balance................................................................................................. 65
6.3.2 Characterisation of wet BRH bio-oil ............................................................... 67
6.3.2.1 Acidity, water content and HHV .............................................................. 67
6.3.2.2 GC-MS analysis ...................................................................................... 68
6.3.3 Characterisation of dry BRH bio-oil ................................................................ 73
6.3.3.1 Acidity and water content ........................................................................ 74
6.3.3.2 Viscosity and density .............................................................................. 74
6.3.3.3 Elemental analysis and HHV ................................................................... 74
6.3.3.4 GC-MS analysis ...................................................................................... 75
6.4 Summary .............................................................................................................. 78
7 CATALYTIC PYROLYSIS STUDIES ........................................................................... 79
7.1 Introduction ........................................................................................................... 79
7.2 Catalytic pyrolysis reactor setup and conditions .................................................... 79
7.3 Catalyst preparation .............................................................................................. 80
7.4 Catalytic pyrolysis experiments ............................................................................. 81
7.4.1 Mass balance summary ................................................................................. 82
7.4.2 Pyrolysis liquid bio-oil characterisation ........................................................... 83
7.4.2.1 Water content ......................................................................................... 83
7.4.2.2 Viscosity and Density .............................................................................. 84
7.4.2.3 Elemental analysis and heating values ................................................... 85
7.4.2.4 Acid number and pH ............................................................................... 87
7.4.2.5 GC-MS analysis ...................................................................................... 88
7.4.2.5.1 Effects of catalysts on selected chemicals ............................................ 97
7.4.2.5.2 Effect of catalysts on the chemical groups .......................................... 101
7.4.3 Regenerated catalysts studies ..................................................................... 105

9
7.4.4 General remarks .......................................................................................... 105
7.5 Evaluation procedures for the ‘best’ catalyst ....................................................... 106
7.6 Summary ............................................................................................................ 108
8 CATALYTIC OPTIMISATION EXPERIMENTS .......................................................... 109
8.1 Introduction ......................................................................................................... 109
8.2 Catalytic optimisation experiments ...................................................................... 109
8.2.1 Mass balance summary ............................................................................... 110
8.2.2 Bio-oil characterisation results ..................................................................... 111
8.2.2.1 Water content ....................................................................................... 111
8.2.2.2 Viscosity and Density ............................................................................ 111
8.2.2.3 Elemental analysis and heating values ................................................. 112
8.2.2.4 Acidity (pH) ........................................................................................... 114
8.2.2.5 GC-MS analysis .................................................................................... 115
8.2.2.5.1 ZSM-5 as the primary catalyst ............................................................ 117
8.2.2.5.2 Al-MCM-41 as the primary catalyst ..................................................... 120
8.3 General remarks ................................................................................................. 123
8.3.1 Catalytic effects as a primary or secondary catalyst ..................................... 123
8.4 Evaluation procedures ........................................................................................ 131
8.5 Summary ............................................................................................................ 132
9 CONCLUSION AND RECOMMENDATION ............................................................... 134
9.1 Conclusion .......................................................................................................... 134
9.2 Recommendation ................................................................................................ 135
REFERENCES.....................................................................................................................137
APPENDIX A – LIST OF PUBLICATIONS.........................................................................146
APPENDIX B – EXPERIMENTAL SET-UP SPECIFICATIONS..........................................147
APPENDIX C – MASS BALANCE SHEET.........................................................................148

10
LIST OF TABLES
Table 1-1. Properties of some of the local rice variety available in Brunei [15] .................... 17
Table 2-1. Comparison between the different processes of pyrolysis and yield of products
evolved [30] ........................................................................................................................ 21
Table 2-2. Process conditions for the highest rice husk bio-oil yield from literature ............. 32
Table 3-1. Yields of liquid from catalytic pyrolysis of rice husks ........................................... 41
Table 4-1. Calculation for cellulose, hemicellulose and lignin determination ........................ 47
Table 5-1. Sieve analysis results for BRH and AFRH .......................................................... 52
Table 5-2. Summary for the experimental (BRH and AFRH) and literature rice husk
characterisation data ........................................................................................................... 53
Table 5-3. Ash composition analysis of BRH as compared with literature values ................ 57
Table 5-4. TGA and DTG pyrolysis derived information of rice husks for the experimental
and literature values ............................................................................................................ 59
Table 6-1. Mass balance summary for non-catalytic runs .................................................... 65
Table 6-2. Chemical properties of bio-oil from the pyrolysis of wet BRH.............................. 68
Table 6-3. Selected chemicals and average peak area for the upper layer of wet-BRH bio-oil
........................................................................................................................................... 69
Table 6-4. Selected chemicals and and average peak area from the wet-BRH bottom layer71
Table 6-5. Comparison of the chemical groups between the peak areas for the top and
bottom wet-BRH bio-oil ....................................................................................................... 72
Table 6-6. Physicochemical properties of rice husk pyrolysis oil ......................................... 73
Table 6-7. Chemicals and average peak area for dry-BRH pyrolysis bio-oil ........................ 75
Table 6-8. Chemical groups and the peak areas for dry BRH bio-oil ................................... 77
Table 7-1. Mass balance for non-catalytic and catalytic pyrolysis experiments.................... 82
Table 7-2. Water content in catalytic pyrolysis bio-oil .......................................................... 84
Table 7-3. Viscosity and density for the non-catalytic and catalytic BRH bio-oil ................... 85
Table 7-4. Elemental analysis, molar ratio and higher heating value (HHV) for the non-
catalytic and catalytic BRH bio-oil ....................................................................................... 86
Table 7-5. pH and acid number for the non-catalytic and catalytic BRH bio-oil .................... 88
Table 7-6. Identified chemical compound in bio-oils from catalytic pyrolysis of Brunei rice
husks .................................................................................................................................. 89
Table 7-7. Peak area percentages of the various compounds detected from the catalytic
pyrolysis of Brunei rice husks bio-oils .................................................................................. 93
Table 7-8. Total peak areas of the chemical groups for the non-catalytic and catalytic
pyrolysis of Brunei rice husk bio-oil ................................................................................... 101

11
Table 7-9. The effect of the catalyst on the chemical groups in comparison to the non-
catalytic Brunei rice husk bio-oil ........................................................................................ 104
Table 7-10. Evaluation of the 'best' catalyst from the various criterions ............................. 107
Table 8-1. Mass balance for catalytic optimisation experiments ........................................ 110
Table 8-2. Water content for the optimisation experiments ................................................ 111
Table 8-3. Viscosity and Density for the optimisation experiments .................................... 112
Table 8-4. Elemental analysis, molar ratio and HHV values for the optimisation experiments
......................................................................................................................................... 113
Table 8-5. Acidity (pH) for the optimisation experiments ................................................... 114
Table 8-6. Peak area percentages of the various compounds detected from the optimisation
experiments ...................................................................................................................... 115
Table 8-7. Total peak areas of the chemical groups for the bio-oils from the catalytic
optimisation run ................................................................................................................. 129
Table 8-8. Changes in the peak area for chemical groups for the optimisation runs respective
to the non-catalytic run ...................................................................................................... 130
Table 8-9. Evaluation of the best catalyst optimisation run from the various proposed
criterions ........................................................................................................................... 132

12
LIST OF FIGURES
Figure 1-1. Structure of a rice grain [18] .............................................................................. 17
Figure 2-1. Structure of lignocellulosic biomass with cellulose, hemicellulose and lignin
represented [27]. ................................................................................................................. 20
Figure 2-2. Schematic setup of the HALOCLEAN® CHP plant [38] ..................................... 23
Figure 2-3. Schematic diagram of the pyroformer with the intermediate pyrolysis system [40]
........................................................................................................................................... 24
Figure 2-4. Thermal stability regimes for hemicellulose, lignin and cellulose [50] ................ 26
Figure 2-5. Pyrolysis degradation curves of hemicellulose, cellulose and lignin in TGA [51] 27
Figure 2-6. The global modified Broido-Shafizadeh model [61] ........................................... 30
Figure 2-7. Pyrolysis mechanism of hemicellulose [62] ....................................................... 30
Figure 2-8. Roles of pyrolysis intermediates in tar, gas and coke formation from guaiacols
and syringols [63]. ............................................................................................................... 31
Figure 3-1. Reaction pathway for glucose catalytic pyrolysis on ZSM-5 [133] ..................... 43
Figure 3-2. Mechanistic pathways of aromatic formation from lignin on ZSM-5 [61] –
reproduced from [134] ......................................................................................................... 44
Figure 5-1. Ungrounded (left) and ground (right) Brunei rice husks samples ....................... 52
Figure 5-2. Volatile content and HHV as a function of ash content ...................................... 57
Figure 5-3. TGA and DTG plots for BRH and AFRH............................................................ 58
Figure 6-1. A schematic diagram of the pyrolysis rig setup ................................................. 61
Figure 6-2. Temperature profiles for a typical BRH sample in the primary reactor ............... 64
Figure 6-3. Pyrolysis bio-oil from dry BRH feedstock (left) and wet BRH feedstock (right) .. 66
Figure 6-4. A typical chromatograph of wet-BRH upper layer .............................................. 69
Figure 6-5. Chromatograph of a typical wet-BRH bio-oil bottom layer ................................. 70
Figure 7-1. Schematic diagram of closed-coupled catalytic pyrolysis rig setup .................... 79
Figure 7-2. Empty monolith catalyst support (left), catalyst-filled monolith (middle) and coking
on the catalyst after pyrolysis experiment (right) ................................................................. 81
Figure 7-3. Molar ratio vs bio-oil water content .................................................................... 87
Figure 7-4. Effect of catalysts on selected anhydrosugars .................................................. 97
Figure 7-5. Effect of catalysts on selected phenols ............................................................. 99
Figure 7-6. Effect of catalysts on selected guaiacols ......................................................... 100
Figure 7-7. Effect of catalysts on aromatic hydrocarbons .................................................. 101
Figure 7-8. The global modified Broido-Shafizadeh model (adapted from [61]) ................. 102
Figure 7-9. Existence of quantified compounds from the pyrolysis of lignin monomers from
literature adapted from [170]. Reactions (a)[171] ,(b)[172] and (c) [173]............................ 103
Figure 8-1. H:C and O:C molar ratio vs. water content for the optimisation experiments ... 113
13
Figure 8-2. Aromatic hydrocarbon peak areas for ZSM-5 as a primary catalyst ................ 118
Figure 8-3. Organic acids peak areas for ZSM-5 as a primary catalyst ............................. 119
Figure 8-4. Phenols peak areas for ZSM-5 as a primary catalyst ...................................... 119
Figure 8-5. Selected chemical peak areas for ZSM-5 primary catalyst .............................. 120
Figure 8-6. Aromatic hydrocarbon peak areas for Al-MCM-41 as a primary catalyst ......... 121
Figure 8-7. Organic acids peak area for Al-MCM-41 as a primary catalyst ........................ 121
Figure 8-8. Selected phenols peak area for Al-MCM-41 as a primary catalyst .................. 122
Figure 8-9. Peak area of selected chemicals for Al-MCM-41 as a primary catalyst ........... 123
Figure 8-10. Individual aromatic hydrocarbon peak areas with respect to ZSM-5 .............. 124
Figure 8-11. Aromatic hydrocarbon and phenols peak area with respect to ZSM-5 catalyst
ratio ................................................................................................................................... 125
Figure 8-12. Organic acids peak areas with respect to Al-MCM-41 ................................... 125
Figure 8-13. pH and organic acid peak area vs. ratios of the Al-MCM-41 .......................... 126
Figure 8-14. Reaction chemistry for the catalytic pyrolysis of glucose with ZSM-5 [133] ... 127
Figure 8-15. Pathway for the aromatic formation from glucose over ZSM-5 ...................... 128
Figure 8-16. Peak areas for furans, aromatics and anhydrosugars for primary and secondary
ZSM-5 catalyst .................................................................................................................. 129
Figure 8-17. Total peak areas for the various chemical groups for the equal combination
catalyst ratio ...................................................................................................................... 131

14
1 INTRODUCTION
1.1 Background
The conversion of biomass into fuels and chemicals is taking a centre stage for most
economy with the ultimate aim of reducing dependence on fossil fuels and to increase the
potential of energy sources. For the process to be sustainable there must be sufficient
biomass available as feedstock in order to satisfy the demand of emerging bioenergy
industries. Several biomass feedstocks have been utilised in the past ranging from
agricultural wastes and residues to energy crops. Agricultural residues such as rice husks
are abundant in rice growing countries. During the production of rice, rice husks are
generated on site as a by-product in the milling factory. As rice is considered a staple food in
most developing countries including Brunei, the by-products are available in large quantity to
provide a source of alternative energy in the form of biofuel in addition to the current energy
sector [1]. The aspiration for a renewable energy mix and economic diversification away
from oil and gas will favour the encouragement of a new industry.
The production of biofuels from lignocellulosic materials can be achieved from biochemical
or thermochemical routes. The thermochemical route can produce a wider range of liquid
fuel compared to the biochemical route [2]. Thermochemical conversion of biomass is
therefore rapidly becoming an alternative source for renewable energy and fuel production
worldwide. The common factor amidst all biomass feedstock thermochemical processing is
the quality of the biofuel produced and the need to upgrade the fuel to meet standard
specifications for different applications.
Since this project is funded by the Brunei Government, the rice husks investigated were
selected from Brunei, based on availability, potential utilisation and together with ease of
access. This will be elaborated in the next few section of this chapter.

15
1.2 Motivations and limitations for biofuels in Brunei Darussalam
Brunei Darussalam aspires to excel in various national strategies towards the Vision 2035,
whereby one of the economic strategies is to “create new employment for our people and
expand business opportunities within Brunei Darussalam, through the promotion and
investment, foreign and domestic, both in downstream industries as well as in economic
clusters beyond the oil and gas industries” [3]. Although economic diversification efforts has
been geared towards non-reliant on oil and gas industries, this has not been entirely
successful over the last decade [4]. This however would be possible through expansion of
the non-oil and gas industries, such as from the bioenergy industries.
Biomass feedstock in Brunei consists mainly of agricultural and forestry waste. The land
area in Brunei may not be available for growing non-food or dedicated energy crops as
feedstock, due to the competition from the agriculture industry and the conservation efforts
towards protecting the natural forests.
Although Brunei has a small land area, it is trying to achieve its aim of food security in rice
production by growing high yielding variety of rice species. A target has been implemented
for the production of rice, which is to increase self-sufficiency from 3.12% in 2007 to 60% by
2015 [5]. With this boost, one can expect that the waste from the rice industry will
significantly increase in the near future.
One of the sub-goals of the Energy Department at the Prime Minister’s office is to “ensure
safe, secure, reliable and efficient supply and use of energy”. This upholds the need for
power generation from renewable sources, which accounts for at least 10% or 50 MW from
the total in the energy mix [6]. Energy sources in Brunei are well-established from the oil and
gas industries, but they are finite and non-recoverable. A study by a national think-tank,
Centre for Strategic and Policy Studies in 2010 revealed that with the current production
rate, Brunei has only 17 years and 30 years supply of crude oil and natural gas respectively
[7]. Therefore, more efforts are being applied to diversify the economy and energy away
from the fossil fuel industries.

16
1.3 Current and potential projects for alternative energy or waste utilisation
The realisation of the renewable energy mix has been studied and currently being proposed
for further implementation. At present, the only major alternative energy project at pilot or
industrial scale is a solar power feasibility study plant which aims to generate 1.2MW of
nominal output capacity [8] . A potential waste-to-energy facility is also being proposed to
generate 16-24 MW from landfill waste which will account to about 5-6% of the energy mix
[9].
By coupling the aims and goals from different ministries and departments, the rice industry
has a potential to generate a portion of renewable energy mix for Brunei. A study by Malik,
referred to biomass as the second most potential alternative energy source in Brunei after
solar energy [10].
To present date, the utilisation of biomass from lignocellulosic feedstock has not been done
at a pilot or industrial scale. A central rice milling factory is currently being installed at Wasan
rice mill centre in Brunei which will replace a 1 tonne/hour with a 3.5 tonnes/hour of milled-
rice production [11]. This will in effect more than triple the generation of waste rice husk from
the milling process. The idea of a bio-oil production on-site at a central rice milling factory
sounds promising, as it will reduce the cost of collection and transporting the waste
feedstock [12]. The concept of a biorefinery, which integrates biomass conversion processes
and equipment to produce fuel, power and value-added chemicals from biomass [13] is
therefore an attractive option for Brunei.
1.4 Brunei Rice Husk
Rice is one of the most important foods of the world, and is grown in over 100 countries. An
average lifespan of a rice plant is around 3 to 7 months depending on the climate and
variety. A modern variety matures up to 110 days, therefore can be planted multiple times in
the field [14]. Table 1-1 below shows the properties of some of the rice variety available in
Brunei. Since the rice husk is very much dependent on the yield of rice grain, it will be
important to understand the factors influencing the grain yield. Rice yield is significantly
influenced by the weather conditions, cultural management and nutrient supply.
Understanding their inter-relationships is a key to improvement in the rice yield.

17
Table 1-1. Properties of some of the local rice variety available in Brunei [15]
High Yielding Low Yielding
Variety Laila (IR67406-6-3-2-3) Pusu, Bario, Adan
Rice grain yield (t/ha) 5 - 6.8 1.5 - 2.5
Approximate rice husk yield (t/ha) 1 – 1.36 0.3 – 0.5
Rice husk from rice milling factory constitutes about 20% of the weight of the rice grains [16].
The chemical constituent are found to vary from sample to sample which may be due to the
different geographical composition, type of paddy, climatic variation, soil chemistry and
fertilisers used in the paddy growth [17]. Figure 1-1 shows the different parts of the rice
grain.
Figure 1-1. Structure of a rice grain [18]
1.5 Research Objectives
There are two primary objectives to this project. The application of intermediate pyrolysis on
Brunei Rice Husk for the production of bio-oil is the main objective of this experiment. Within
the scope of the objective is to characterise the feedstock and the liquid bio-oil product
generated.
Secondly, the introduction of catalysts into the pyrolysis process aims to improve the bio-oil
quality, and maximise the desired liquid bio-oil properties. The reduction of unfavourable
components and the increase in high-value chemicals are investigated. This aim is achieved
by introducing an alternative way to the catalyst incorporation into the pyrolysis system, and
the selection of the ‘best’ catalysts, leading to the optimisation of the process for bio-oil
production.

18
1.6 Organisation of thesis
The remainder of the chapters besides this one are explained as follows.
Chapter 2 deals with the literature review for the biomass feedstock and the pyrolysis of
biomass, particularly rice husks. Chapter 3 deals with the literature review for the catalytic
pyrolysis of rice husk.
Chapter 4 discusses the characterisation methods of the biomass and bio-oil used in the
thesis.
Chapter 5, 6, 7 and 8 are experimental results which include the analyses and discussions.
Chapter 5 discusses the biomass characterisation results of Brunei rice husks. The
experimental results from the pyrolysis of Brunei rice husks, together with the
characterisation results of the bio-oil envelop chapter 6. Chapter 7 highlights the catalytic
pyrolysis of Brunei rice husks with mainly zeolite catalysts. Chapter 8 focuses on the
catalytic optimisation experiments, based on the ‘best’ catalyst mixture from the
experimental results in chapter 7. Chapter 9 finishes with the conclusion and
recommendation for the thesis.

19
2 BIOMASS AND PYROLYSIS OF BIOMASS
2.1 Biomass
Biomass can be defined as the bio-degradable fraction of products, wastes and residues
from biological origin from agriculture or forestry and related industries [19]. Biomass from
dedicated energy crops such as switchgrass, poplar, willow and rapeseed, are defined as
plants grown specifically for applications other than for food or feed [20].
2.2 Biomass chemical composition
Biomass consists of mainly cellulose, hemicellulose and lignin as its core components. Other
components are made up of organic extractives, inorganic matter and water. Figure 2-1
shows the structure of lignocellulosic biomass with a representation of cellulose,
hemicellulose and lignin components.
2.2.1 Cellulose
Cellulose is a natural polymer represented by the formula (C6H10O5)n which consists of
thousands of glucose molecules. It is a long chain polymer with a high degree of
polymerisation (~10,000) and a large molecular weight (~500,000). It is highly crystalline,
water insoluble and resistant to depolymerisation. Cellulose is the primary structural
component of cell wall in biomass, and constitutes of approximately 50% of the cell wall
material. Cotton is almost pure cellulose, ranging up to 90% by weight [21-24].
2.2.2 Hemicellulose
Hemicellulose, another component in the cell wall has a random, amorphous structure with
little strength. They have a generic formula of (C5H8O4)n and usually carry 50-200
monomeric units and a few simple sugar residues [21]. It is a branched polymer of glucose
or xylose, substituted with arabinose, xylose, glactose, fucose, mannose, glucose or
glucuronic acid. The amorphous nature of hemicellulose means that it is easily hydrolysed in
dilute acid or base.

20
2.2.3 Lignin
Lignin is a complex, highly branched polymer of phenylpropanoid units and act as the
cementing agent for cellulose fibers holding adjacent cells together. The three basic
structural units of lignin includes hydroxyl phenyl (H-type), guaiacyl type (G-type) and
syringyl (S-type) [25]. Lignin consists of It accounts for 18-25% in hardwood, 25-35% in
softwood in dry weight, and 10-40% by weight in various herbaceous species, such as
corncobs, rice husks and straws [21]. Lignin is highly insoluble, although the complex can be
broken and lignin fraction separated by treatment in strong sulphuric acid [21, 26].
Figure 2-1. Structure of lignocellulosic biomass with cellulose, hemicellulose and lignin
represented [27].
2.2.4 Organic Extractives
Organic extractives from the biomass include fats, waxes, alkaloids, proteins, phenolics,
simple sugars, pectins, mucilages, gums, resins, terpenes, starches, glycosides, saponins
and essential oils. These extractives can be extracted with polar solvents (such as water,
methylene chloride, or alcohol) and non-polar solvents (such as toluene or hexane) [28].

21
2.2.5 Inorganic Matter
Biomass also contains mineral content that ends up in the pyrolysis ash [28]. The elemental
constituents present in biomass are potassium (K), calcium (Ca), silicon (Si), sodium (Na),
manganese (Mn), phosphorus (P), iron (Fe), magnesium (Mg), aluminium (Al), chromium
(Cr) and zinc (Zn).
2.2.6 Water
There are two types of moisture in the biomass, namely bound and unbound water. Water
that is adsorbed onto the hydroxyl groups of hemicellulose and cellulose molecules through
hydrogen bond is referred to as bound water. Unbound water occupy the voids present
within the biomass if the moisture content (including bound water) exceeds the fiber
saturation point [29]. Other factors such as humidity and temperature have an effect on the
biomass moisture. The hot and wet climate in Brunei would have a limited drying effect on
varying the moisture content of the biomass.
2.3 Biomass pyrolysis
Pyrolysis is the degradation or decomposition of biomass under oxygen-free or inert
conditions. Products evolved from pyrolysis are liquid bio-oil, solid char and non-
condensable gases. Pyrolysis generally can be classified into three; slow, intermediate and
fast pyrolysis. The difference between them depends on the vapour residence time, heating
rates, temperatures and the yield of the evolved product [30]. Table 2-1 below shows the
comparison between the different pyrolysis process and the product yields.
Table 2-1. Comparison between the different processes of pyrolysis and yield of products
evolved [30]
Types of pyrolysis Liquid (%) Char (%) Gas (%)
Fast pyrolysis
Moderate temperature (~500°C)
Short hot vapour residence time (~2s)
75
12
13
Intermediate pyrolysis
Moderate temperature (450-500°C)
Moderate hot vapour residence time (10-20s)
50
20
30
Slow pyrolysis
Low moderate temperatures
Long hot vapour residence time (300-1800s)
30
35
35

22
2.3.1 Fast Pyrolysis
Fast pyrolysis process gives high yields of bio-oil up to 80% by weight [31]. The fundamental
features of fast pyrolysis is that it has a very high heating and transfer rates; controlled
pyrolysis reaction temperature of around 500°C with a short vapour residence time typically
less than 2 seconds; and the rapid cooling of pyrolysis vapours to produce bio-oil. Different
fast pyrolysis reactor configurations are available namely ablative, auger, circulating fluidised
bed, entrained flow, fluidised bed, rotating cone, transported bed and vacuum moving bed
reactor [28, 32-35]. The various reactors have their own advantages and drawbacks and are
reviewed quite extensively in literatures. Fluidised beds are the most popular due to the ease
of operation and readily scale-up [31].
2.3.2 Slow Pyrolysis
Slow pyrolysis is a conventional pyrolysis process whereby the heating rate is kept slow at
approximately 0.1–1 °C s−1. The vapour residence time varies from 5 to 30 min which allows
the gas-phase products to continue to react with other products to form char [36]. Slow
pyrolysis has been carried out in fixed beds, multiple hearths and rotary kiln reactors [37].
Due to the poor and slow heat transfer, low liquid yields were obtained. Slow pyrolysis gives
an approximately equal yield of oils, char and gases.
2.3.3 Intermediate Pyrolysis
Intermediate pyrolysis is a relatively new technology working in contrast to the existing slow
and fast pyrolysis techniques. The reaction temperature for this process is typically around
450-500°C, with a vapour residence time of a few seconds. The solids residence time can
be varied accordingly. The reaction occurs under controlled heating rates, therefore avoiding
the tar formation. The feedstock can be in any form ranging from powders to chips. Example
of intermediate pyrolysis is the HALOCLEAN® process from Karlsruhe and Turin [38] and
the Pyroformer which was recently patented by Hornung and Apfelbacher at Aston
University [39].
2.3.3.1 HALOCLEAN®
Originally the HALOCLEAN® process (Figure 2-2) has been developed for the pyrolysis of
electronic scrap, but it can be used for organic materials such as biomass.

23
The principle underlying this process is the circulation of hot steel balls which can be fed into
the rotary kiln, together with the biomass via a double flap sluice. The rotary kiln is
electrically heated from the outside and the inside via the screw up to 600°C. A homogenous
temperature profile along the reactor is achieved by the intensive mixing process of the
biomass and the steel balls in the first zone of the reactor. The solid biomass residence time
is defined by the screw in the range of several minutes to hours. A side channel blower and
a preset negative control the pyrolysis vapour generated and define the vapour residence
time in the order of several seconds. A hot gas filtration system is placed after the reactor to
clean it from char particles before passing it to a condensation system, where the pyrolysis
liquid is collected. The remaining non-condensable gases and the pyrolysis liquid may be
burnt for combined heat and power (CHP) in a special diesel engine [38].
Figure 2-2. Schematic setup of the HALOCLEAN® CHP plant [38]
2.3.3.2 Pyroformer
The pyroformer comprises of a twin co-axial rotating screw, where the inner screw conveys
the feedstock passing through the reactor, and the outer screw transports the product char
backwards for recycling through the reactor for further reaction and heat exchange. The
pyroformer is designed to make full use of the contact time of the pyrolysis vapours and the
bio-char for further cracking of the high molecular weight organic products.

24
The pyroformer is able to process a maximum of 20 kg/h. The reactor is purged with nitrogen
and is heated up to a range of 300-450 °C depending on the type of feedstock supplied. The
feedstock residence time is estimated to be at a range of 7-10 min, but the vapour residence
time is around a few seconds. The pyrolysis vapour passes through the hot gas filter
candles, which are also heated to 450°C. A cold water shell and tube condenser cools the
vapours to form pyrolysis oil, while the non-condensable gases pass through an electrostatic
precipitator to either be collected or flared. A schematic diagram of the pyroformer is
illustrated in Figure 2-3.
The biomass feedstock that have been used on the pyroformer range from sewage sludge
and waste paper sludge [40, 41] to brewer’s spent grain [42]. The advantage of this “auger-
type” reactor compared to a fluidised bed is that they use lower volumes of carrier gas and
can obtain a sand free bio-char [43]. The pyroformer can achieve a sustainable biomass-to-
energy concept - the biothermal valorisation of biomass (BtVB) process which offers a
carbon negative system, and a closed loop multipurpose application in terms of fertilisers,
CO2, and heat production energy [44].
Figure 2-3. Schematic diagram of the pyroformer with the intermediate pyrolysis system
[40]; (1) Insulation jacket (2) Biomass feed system (3) Feed entry pipe (4) External heaters
(5) Internal screw (6) External screw (7) Electric motors (8) Heated vapour exit line
(9) Support stand (10) Char pot (11) Hot ceramic filtration unit (12) Shell and tube condenser
(13) Electrostatic precipitator (14) Pyrolysis oil collection pot (15) Gas flare unit

25
2.4 Factors affecting intermediate pyrolysis
2.4.1 Feedstock composition and preparation
Different biomass species will have varying composition of cellulose, hemicellulose and
lignin therefore affecting the pyrolysis product composition. Unusual biomass such as
sewage sludge may not have the same composition as biomass such as wood, husks and
straw.
High ash content in biomass will lead to high char content, but will decrease the liquid
organics yield in the product. Ash constituents such as K, Na and Ca acts as a catalyst for
the decomposition process and favour char formation [45]. The removal of these metals via
pretreatment may be useful to influence the pyrolysis reaction to produce chemical not
normally contained in the pyrolysis yield, or to increase the yield of a selected chemical or
groups of chemicals in the pyrolysis liquid [46].
The particle size of the biomass has an effect on the pyrolysis product yield. Shen et. al
studied the effects of particle size on the fast pyrolysis oil mallee woody biomass and found
that the increase in the average particle size of the biomass from 0.3 to 1.5 mm decreases
the yield of the liquid bio-oil [47]. Jalan and Srivastava studied the kinetic and heat transfer
effects on the pyrolysis of a single biomass cylindrical pellet and established that the relative
importance of heat transfer and secondary reaction increases as the temperature and
particle sizes are increased [48].
2.4.2 Moisture content
The moisture present in the biomass ends up as water in the pyrolysis liquid. Therefore, the
moisture in the biomass should be low to reduce the water in the bio-oil, in addition to the
formation of reaction water during pyrolysis. Westerhof et. al conducted a study on the
effects of moisture content on the pyrolysis of pine wood in a fluidised bed reactor and
concluded that an increase in the moisture content of the feedstock (between 0-20%), lead
to the increase in the char and gas yield, and the decrease in reaction water formation [49].
Therefore drying the feedstock to low moisture content would increase the organic fraction in
the pyrolysis liquid yield.

26
2.4.3 Pyrolysis temperature
As biomass contains mainly cellulose, hemicellulose and lignin as the major constituents,
their degradation temperature is vital to ensure that the materials are sufficiently converted
into the required products. Figure 2-4 shows a schematic overview of the different thermal
stability regimes of each of the main biomass fractions [50]. Five different stages of
degradation were shown; with hemicellulose, cellulose and lignin to degrade first and end in
that order.
Figure 2-4. Thermal stability regimes for hemicellulose, lignin and cellulose [50]
Another study was also done by Yang et al. [51], which measured the pyrolysis degradation
rate of the three major components of biomass. Figure 2-5 shows the mass loss and the
mass loss rate of the individual components with a function of temperature. Hemicellulose
showed a mass loss between 220-315°C, cellulose between 315-400°C, and lignin with a
wide temperature range of 160-900°C.

27
Figure 2-5. Pyrolysis degradation curves of hemicellulose, cellulose and lignin in TGA [51]
Typically, pyrolysis of biomass is carried out at a low to moderate temperature of 300-500°C.
A further increase in temperature will lead to a secondary cracking of the pyrolysis vapours
leading to a decrease the liquid organics and char yield and increase the gases yield [33].
Moreover, the increase in temperature from 400°C to 550°C results in higher polycyclic
aromatic hydrocarbon (PAH) formation, which may be harmful to health [52].
2.4.4 Residence time
Residence time can be defined as the vapour or solid residence time. Vapour residence time
is the time taken for the pyrolysis vapour to travel through the system prior to condensation.
Solid residence time can be defined as the time taken for the solids to be fully converted in
the reactor. Intermediate pyrolysis suggests that it has a moderate hot vapour residence
time, more than ~2s (fast pyrolysis) but less than ~300s (slow pyrolysis). A longer vapour
residence time results in the significant reduction of the organic yield from cracking reactions
[32].

28
2.5 Pyrolysis products
2.5.1 Liquid bio-oil
Bio-oils are dark brown, free-flowing organic liquids that are highly oxygenated, viscous,
corrosive, relatively unstable and chemically complex [53]. Pyrolysis liquids are formed by
rapidly and simultaneously depolymerising and fragmenting cellulose, hemicellulose and
lignin with a rapid increase in temperature [28]. The main components are 20-25% water, 5-
10% organic acids, 5-10% non-polar hydrocarbons, 5-10% anhydrosugars such as
levoglucosan, 25-30% pyrolytic lignin (comprising guaiacyl and syringyl based fragments
from the original lignin polymer) and other oxygenated compounds such as aldehydes,
ketones, phenols [54].
Liquid bio-oil contain two phases: an aqueous phase containing a wide variety of organo-
oxygen compounds of low molecular weight and a non aqueous phase containing insoluble
organics (mainly aromatics) of high molecular weight [54]. Ratio of acetic acid, methanol,
and acetone of aqueous phase were higher than those of non-aqueous phase.
The chemical and physical properties of fast pyrolysis bio-oil adversely affect their
combustion properties and result in difficulties in storage and handling [55]. The most critical
properties in the fuel specifications proposed by IEA Pyrolysis project and EU-funded
ALTENER II project include homogeneity, stability, heating value, pH, water, flash point,
solids, ash, viscosity and lubricity [56, 57] .
2.5.2 Solid biochar
Char or bio-char is the solid residue of pyrolysed biomass. Char contributes to secondary
cracking by catalysing secondary cracking in the vapour phase, to reduce the yield of bio-oil.
It can also increase the viscosity of the bio-oil during storage; therefore an efficient removal
of char is necessary to produce high-quality bio-oil [58]. Char contains elemental carbon,
along with hydrogen, together with various inorganic species [59].
2.5.3 Non-condensable gases
Non-condensable gases that are analysed from pyrolysis are carbon monoxide (CO), carbon
dioxide (CO2), hydrogen (H2), methane (CH4), and other hydrocarbons such as ethene
(C2H4), ethane (C2H6), propane (C3H8), propylene (C3H6), butane (C4H10), and butenes

29
(C4H8) [59]. The higher the reaction temperature leads to a high content of hydrocarbon
gases, therefore giving a higher heating value to the product gases [58]. Addition of catalyst
in the pyrolysis system also promotes the production of permanent gases [60].
2.6 Pyrolysis of biomass components
Pyrolysis studies on the components of biomass lead to an insight of the chemicals present
in the bio-oil which may be traced from the major degradation products or intermediates of
biomass. Alen et. al concluded in his study that the pyrolytic degradation of wood is
dominated mainly from the behaviour of its main fractions namely cellulose, hemi-cellulose
and lignin [61]. The pyrolysis of extractives was rarely mentioned, probably due to the lower
% present in biomass, but was found to cause phase separation in bio-oils from extractive-
rich wood [62]. Various mechanisms were proposed in literature for the three major biomass
components, particularly for cellulose and lignin.
2.6.1 Cellulose degradation mechanism
There are various mechanism proposed from the degradation of cellulose. The pyrolysis of
cellulose at a constant heating rate of 10°C/min occurs in the 315-400°C temperature zone
[51]. Majority of the proposed mechanism quoted anhydrosugars, mainly levoglucosan as
the major intermediate product. The proposed mechanism in Figure 2-6 shows that cellulose
is depolymerised into activated cellulose. A low reaction temperature will lead to the
formation of char, water and gases. A higher degradation temperature proceeds with two
competitive reactions from the cracking of glucosidic bond and the ring opening and
reforming reaction. The first reaction leads to the formation of levoglucosan and isomeric
compounds, and simultaneously the formation of furfural, acetols, organic acids, aldehydes,
ketones and heterocyclic compounds. The second reaction leads to the formation of gases
such as CO, CO2, CH4 and H2.

30
Figure 2-6. The global modified Broido-Shafizadeh model [63]
2.6.2 Hemicellulose degradation mechanism
The pyrolysis of hemicellulose at a constant heating rate of 10°C/min occurs in the 220-
315°C temperature zone, which is lower than cellulose degradation temperature [51].
Patwardhan et. al studied the product distribution from the pyrolysis of hemicellulose, and
suggested the mechanism in Figure 2-7 [64]. Primary products from hemicellulose
degradation are thought to produce hydroxyacetaldehyde, formic acids, acetic acids, furfural
and acetols.
Figure 2-7. Pyrolysis mechanism of hemicellulose [64]

31
2.6.3 Lignin degradation mechanism
Lignin, when pyrolysed at a constant heating rate of 10°C/min shows a weight loss at a wide
temperature zone of 160-900°C, and generates a high solid residue content [51]. The
degradation of lignin produces guaiacols and syringols as intermediate chemicals. Figure 2-8
shows the pathways of the intermediates in the formation of chemicals, gas and coke
proposed by Asmadi et. al [65]. Chemicals such as phenols, cresols, xylenols, catechols and
pyrogallols are formed from the degradation of lignin.
Figure 2-8. Roles of pyrolysis intermediates in tar, gas and coke formation from guaiacols
and syringols [65].
2.7 Pyrolysis studies of rice husk for bio-oil production
Pyrolysis of rice husk is extensively researched from literature, where various authors have
performed studies on the pyrolysis of rice husks, whether it is analytical [66-73], bench-scale
[53, 74-78] and pilot or industrial scale [79-81]. Analytical studies generally analyse the
vapour generated from the degradation of the biomass without the condensation of the
vapours into bio-oils, unlike for the bench-scale and pilot scale. Normally analytical studies
are done as a preliminary assessment prior to the utilisation in a larger scale. Analytical
pyrolysis of rice husk was carried out by various authors mostly by altering the heating rate
to obtain kinetic parameters for suitable model predictions for the degradation of rice husks.

32
Worasuwannarak et. al measured the gas formation rates evolved which were found to be
governed by the composition of the biomass [67].
Pyrolysis of rice husk have been carried out in a fluidised-bed, fixed-bed, rotary screw kiln
and spout-fluid reactor. The process conditions with respect to the maximum liquid yield from
literature can be found in Table 2-2. The most important process condition is temperature,
where the optimum temperature ranges were around 400-500°C; a further increase in the
temperature will decrease the liquid yield. Depending on the type of reactor, process
conditions such as feed rate, heating rate, condensation temperature, particle size, holding
time and the purge or fluidising gas were mentioned. Heo et. al studied the effects of product
gas on the pyrolysis yield, and found that it increases the liquid yield as compared to using
the fresh nitrogen gas as the fluidising medium [75].
Table 2-2. Process conditions for the highest rice husk bio-oil yield from literature
Heo et. al [75]
Tsai
et. al
[74]
Natarajan
et. al [76] Ji-lu [79]
Rogerro et. al
[80]
William and
Nugranad
[53]
Li et. al
[81]
Reactor type Fluidised Fixed Fixed Fluidised Rotary
screw kiln Fluidised Spout-fluid
Feed rate
90 – 150 g/h
11 - 21 g - 7.32 kg/h 86 kg/h 200 g/h 7 kg/h
Optimum
Temperature (°C)
400-450
>500 500 465 450 400 460
Heating rate (°C/min) - - >200 60 - - - -
Condensation
temperature -25 -25 < -10 - - - -10 -
Feed particle size (mm) - - < 0.5 1.18-1.80 - - 0.25-1.00 0.4-0.7
Holding time (min) - - > 2 - - - - -
Purge/Fluidising gas Nitrogen Product Nitrogen - Nitrogen Nitrogen Nitrogen Nitrogen
Purge gas flowrate 5 L/min 5 L/min 0.5-1.5
L/min - - - - -
Liquid yield (%) 50 60 >40 31.78 56 41 59 48
Tsai et. al [74] and Li et. al [81] studied the effects of particle size and concluded that mass
and heat transfer restrictions were significant for a larger particle size and decreases the bio-
oil yield. Natarajan et. al however suggested otherwise; a decrease in the particle size lead
to a decrease in the liquid yield, but pointed out that the effect was due to the difference in
the vapour residence time [76]. This was initially thought due to the difference in reactor
type, but Tsai et. al also studied using a fixed-bed reactor. Natarajan et. al did not mention
the effects of the bed height as studied by Phan et. al, whom addressed that a difference in
the bed height contributed to the changes in the fixed-bed reactor [82]. A higher bed-depth

33
corresponds to a lower freeboard volume, which in effect decreases the vapour residence
time and increases the liquid yield.
The advantage of fixed-bed over fluidised-bed reactors is the low usage of purge gas
flowrate as compared to the flowrate required to achieve the fluidisation of the bed material.
Although that said, this is also compensated with the lower yields obtained of about 30-40 %
for fixed-bed or rotary-screw kiln as compared to 50-60% yield for a fluidised bed.
2.8 Conclusion
Pyrolysis of biomass can either be fast, slow or intermediate depending on the temperature,
vapour residence time, heating rates and product yield. Pyrolysis products evolved are liquid
bio-oil, solid char and non-condensable gases. Intermediate pyrolysis of biomass is carried
out at a moderate temperature of 450-500°C, a vapour residence time of a few seconds and
a moderate heating rate. Product yields from intermediate pyrolysis will normally generate
50% liquid, 20% char and 30% gases. Since bio-oil is the key product, the pyrolysis
mechanism of biomass composition (cellulose, hemicellulose and lignin) may explain the
chemicals formation in the resulting bio-oil product. The pyrolysis of rice husk for bio-oil
production is widely available in literature, therefore providing essential information in terms
of the reactor types and various process conditions.

34
3 CATALYTIC PYROLYSIS OF BIOMASS
3.1 Introduction
Catalysts are defined as materials which accelerate chemical reactions without themselves
undergoing changes. The catalyst selection and evaluation are important for higher product
specificity and high yields of marketable products, since the products from this process are
complex. Most biomass however, contains natural salts that will influence the decomposition
products, which is reflected in the ash content. The catalytic effect, therefore, will become a
part of the simple degradation process since the salts are not readily removed.
The intended purposes of using catalysts are to [54] :
(1) Enhance the cracking reactions of the heavy molecules in pyrolysis products
resulting in the production of lighter and less viscous bio-oil
(2) Reduce the formation of carboxylic acids making bio-oils less corrosive
(3) Enhance the formation of more valuable products like hydrocarbons that can
increase the heating value of the bio-oil
Although using catalyst will enhance the bio-oil characteristics, compromises are expected
such as the reduction in the bio-oil organics yield and the increase in water content. A
reduction in valuable chemical components such as levoglucosan, i.e. an important
anhydrosugar will also decrease due to the catalytic depolymerisation of cellulose [83].
3.2 Catalytic pyrolysis arrangement
There are five possible configurations that can be applied to incorporate catalyst into a
pyrolysis system: (1) Addition or impregnation of catalyst into the biomass matrix, (2) co-
feeding biomass and catalyst, (3) use catalyst as a part or whole of the fluidizing bed, (4)
close coupled and in-bed catalysis, and (5) closed-coupled catalysis in a secondary reactor
[84].
The first configuration is the pretreatment of biomass via catalyst impregnation. Wet
impregnation method is done by mixing the biomass with a metallic aqueous solution for a
particular duration, and dried prior to usage as a feedstock for pyrolysis. This involves direct
impregnation of the catalyst into the biomass matrix prior to pyrolysis.

35
The second configuration involves co-feeding the biomass with the catalyst, which is added
together into the system before the experiment. A uniform distribution ratio of feed and
catalyst is essential to the process, so that the catalyst will not be entrained in the liquid
product. With these initial two configurations, it is difficult to recover the catalyst, as it will be
mixed together with the char.
Using the catalyst as a whole or part as the fluidizing medium is the easiest way to add the
catalyst in to the pyrolysis system. The drawback would be that the catalyst may be rapidly
deactivated by coking or deposition of char fines and condensed pyrolysis vapours.
The fourth configuration involves the catalyst being held in a cage at the freeboard as a fixed
or fluidized bed. This will lead to accumulation of char in the reactor, which will increase the
pressure drop in the system.
Incorporating a secondary reactor allows the catalyst to be heated independently from the
main pyrolysis reactor. For a fluidised bed reactor, the catalyst reactor may be coupled after
the cyclone to ensure that the chars are removed, thus reducing the catalyst deactivation.
3.3 Catalyst types
The various types of catalyst which can be applied for catalytic pyrolysis of biomass are
zeolites, zeolite-like mesoporous catalyst, metal oxides and selected natural catalysts and
aqueous metallic solution. Extensive review has been done on the types of catalysts used in
biomass pyrolysis for bio-oil production [85].
3.3.1 Zeolite catalysts
Zeolites are water-containing crystalline aluminosilicates of natural or synthetic origin with
highly ordered structures. They consist of SiO4 and AlO4- tetrahedral, which are interlinked
through common oxygen atoms to give a three-dimensional network through which long
channel runs [86]. Different types of zeolite have different structures or frameworks, which
results in their different properties and applications. The catalytic activities of zeolites are
related to their shape selectivity and acidity, and have various potential and advantages over
conventional catalysts.

36
Zeolite catalysts give higher value transport fuel product similar in content to gasoline (high
aromatic content) and also offer the possibility of deriving even higher value chemical
intermediates [53, 60] . In the temperature range of 350-450°C oxygenated compounds in
contact with zeolite catalysts have been found to undergo a group of reactions including
dehydration, decarboxylation, cracking, aromatization, alkylation, condensation, and
polymerization. The product from catalytic pyrolysis using zeolites always produced a two-
phase liquid (aqueous and organic) and gas, while coke deposits formed on the catalyst
surface [87]. The coke is mostly produced by dehydration of oxygenated organic compounds
containing high amounts of oxygen.
The main zeolite catalyst used for upgrading biomass pyrolysis oils has been the hydrogen
form of the zeolite, ZSM-5. The advantages of using a zeolite catalyst are that no H2 is
required, atmospheric processing reduces operating cost, and the temperatures are similar
to those for bio-oil production. The zeolite ZSM-5 catalysts have a strong acidity, high
activities and selectivity which convert the oxygenated oil to a hydrocarbon mixture in the C1
to C10 range [53].
Laboratory prepared ZSM-5 catalysts modified by substituting Al or hydrogen with different
metals (Co, Fe, Ni, Ce, Ga, Cu, and Na) has been experimented by French and Czernik.
The results were promising, although these catalysts were not fully characterised yet [87]. A
new type of multifunctional catalyst which incorporates cerium into HZSM-5 framework was
reported by Neumann and Hicks, which show high selectivities of chemicals [88]. Zeolites
may also be synthesized from fly ash, although this requires more research [89] .
3.3.2 Zeolite-like catalysts
Zeolite-like catalysts are crystalline micro- or mesoporous materials having zeolite-like
structure or layer structure [24]. Zeolite-like catalysts include MCM-41 [90-94], SBA-15 [91]
and MSU-S [95], TiO2 (rutile and anatase) and ZrO2/TiO2 [96], and Pd/SBA-15 [97].
3.3.3 Metal Oxides
Metal Oxides that have been used as catalysts in pyrolysis include zinc oxide (ZnO) [98],
Criterion-534 [99], DHC-32, HC-K 1.3Q [100], Cu/Al2O3 [101], Nano SnO2 [102] and
sulphated metal oxides of Ti, Zn and Sn [103].

37
3.3.4 Natural catalysts
The alkali metals that naturally occur in ash in many biomass species and some wastes
have a catalytic effect on all forms of thermochemical biomass conversion. Rice husk ash is
composed of 90-97% silica content, is used as a catalyst support and good synthesis
precursor for zeolites catalyst [89]. Rice husk silica can be synthesised into faujasite-type
and NaA-type zeolite [104], MCM-41[105] in addition of Fe [106] and Al [107] into the MCM-
41 template.
Fly ash, a solid residue obtained from coal, oil and biomass combustion composed of
various metal oxides and possesses higher thermal stability [89]. Another type of natural
catalysts that could be used for bio-oil upgrading is slate since it was found to improve the
bio-oil quality in terms of stability, initial viscosity and heating value with no significant loss in
the liquid yield [108].
3.3.5 Aqueous metallic solution
The aqueous metallic solutions are only applicable for the first configuration, i.e. wet
impregnation of catalyst into the biomass matrix. The aqueous medium that have been used
for this method are nitrates of Ni, Fe [109], Na, Mg, Ca, Zn, Fe(III), Cd and Pb [110].
Leaching with water removes large fractions of alkali metal eg: potassium and sodium, and
smaller fractions of sulphur and phosphorus [111], and may be replaced by the metal ions
present in the aqueous solution.
3.4 Catalyst’s attachment/accessory
Catalysts on its own may not be practical as they may migrate during usage. A support may
be used together with or without a binder to reinforce the catalyst. These attachments may
or may not be involved in the catalytic reactions.
3.4.1 Catalyst support
The main function of the catalyst support is to increase the surface area of the active
components. Typical catalyst support includes silica gel, aluminosilicates, activated carbon
and ceramics, presented in the form of pellets, granules, extrudates and rings [86].
Honeycomb-shaped monolithic are the most standard for environmental applications, which

38
has excellent ratio of pressure drop to geometric surface area, durability and mechanical
integrity, and can handle a large volumetric flow rates [112]. Antia and Govind demonstrated
in their work that low coking zeolites such as HZSM-5, are ideally suited to a monolithic
reactor configuration under gaseous conditions [113].
3.4.2 Catalyst binder
Catalyst binders are used to hold the catalysts in place onto a catalyst support. Binders such
as kaolin, bentonite and montmorillonite have been used. Bentonite and montmorillonite are
laminar and expandable clays with wet binding properties and are widely available around
the world. Their dispersability in aqueous suspension is the reason for the agglomeration
properties, in which the zeolite particles are surrounded by the by clay laminae, and when
the water is removed, a solid phase is achieved in which the zeolite particles are bound by
the clay [114]. It has been shown that the acidic forms of clays do not have binding
properties and that their sodium forms exhibit better properties [115]. The presence of binder
may enhance or inhibit the catalytic effect on the biomass pyrolysis vapours, depending on
the catalyst type. Canizares et. al studied the effects of various concentration of sodium
montmorillonite bound to zeolite over n-butane. Results show that no major changes were
seen in the product distribution for HZSM-5 compared to the large-pore zeolite such as
Mordenite, which shows a lower isomerisation and high disproportionation activity [116].
3.5 Factors affecting catalytic pyrolysis
3.5.1 Catalyst deactivation
All catalysts are subject to deactivation, i.e. a reduction in activity with time. The main
processes which can cause deactivation are coking, poisoning and sintering. The
deactivation of catalysts such as HZSM-5 may be reversible (coking) or irreversible (via the
dealuminating effect of the water in the reaction medium) [117].
Coking or fouling occurs when materials are deposited on the surface of the catalyst, thus
blocking the active sites. Coking can be minimised by using high heating rates of biomass
with catalyst, high catalyst to feed ratio and proper catalyst selection [118]. The extent of
deactivation may be determined by the amount of coke deposited on the catalyst. Aho et al.
measured the nature of the coke for various zeolites, in which the highest coking was found
with for zeolites with the largest pore size [119]. Another study by Jae et al. found that a

39
medium pore zeolites with moderate internal pore space and steric hindrance had the least
amount of coke and the highest aromatic yield [120]. The usage of a catalytic guard bed
such as dolomite may reduce deactivation due to coking, and the addition of dopants such
as lanthanum to catalyst may reduce carbon deposition [121].
Poisoning is caused by chemisorptions of compounds in the process stream, which block or
modify the active sites on the catalyst. Poisons may be eliminated by physical separation or
by chemical treatment. By removing the product at intermediate stages, or operating the
reactor at low conversion, catalyst poisoning may be reduced. The presence of sulphur is
particularly sensitive to nickel alumina catalyst, due to the strong adsorption on metals [122].
Sintering is caused by the growth of small crystals which makes up the catalyst or its
support, which decreases the surface area of the catalyst, resulting in an irreversible
reduction in catalyst sites. Sintering of metallic particles in metal-based catalyst and
dealumination of zeolite in the presence of water should be prevented. Sintering occurs
when the local temperature of the catalyst exceeds approximately one-third to one-half of its
melting temperature. Textural or structural promoters, which modify either the support or the
metallic phase to stabilize the metallic particles, are commonly employed in the development
of industrial catalysts [123].
3.5.2 Ratio of catalyst and biomass
A high catalyst-to-feed ratio improves the product yield by avoiding the undesired thermal
decomposition reactions in the homogenous phase [118]. A study by Ma et al. showed that
the increase in the catalyst ratio led to an increase in the liquid yield, whilst reducing the
solid yield. The increase in the catalyst loading led to an increase in the active species
conversion into liquid products, thus reducing the coke formation [124].
3.5.3 Catalyst bed temperature
The catalyst bed temperature for different catalyst varies accordingly. Williams and
Nugranad found that increasing the catalyst temperature bed of ZSM-5 from 450-600°C, the
yield of liquid bio-oil decreases and the gases increases. As for the composition of the liquid
bio-oil, the single-ring aromatic compounds, phenolics and oxygenated compounds were
decreased, and the increase in the PAH’s were observed [53].

40
3.6 Catalyst regeneration
The regeneration or disposal of deactivated heterogeneous catalysts depends on chemical,
economic and environmental factors [125]. Although regeneration and re-use of catalyst is
possible, the catalysts would have to be replaced in a long term. Since coking or fouling is
the most common factor for deactivation in catalytic pyrolysis of biomass, the removal of
coke on the surface of the catalyst sounds promising. Various authors mention regeneration
studies to remove coke deposits on spent zeolite catalysts from biomass pyrolysis by using
thermal treatment, i.e. combustion in air for a certain period of time [117, 119, 126, 127].
Chemical treatment by washing in acid or alkali on has been done on organic abatement
catalysts and platinum coated monolith catalyst for automotive purposes [128].
Regenerated catalysts may be determined by its surface area. Aho et al. found that for
zeolite catalysts, regeneration using a stepwise temperature treatment up to 450°C for 2 hr
was sufficient to remove coke without changing the initial structure [119]. A gradual decrease
of the regenerated catalyst activity was observed for prolonged and repeated upgrading-
regeneration cycle. Guo et al. found for HZSM-5 that the catalytic activity changes
moderately during the first three regeneration cycles, but deteriorates after the next three
regeneration cycles [129]. Vitolo et al mentioned that combustion of coke may have caused
dehydroxylation of the Bronsted acid sites, causing the loss of activity which were gradually
deactivated by the repeated regeneration treatment [126].
3.7 Catalytic pyrolysis of biomass
Catalytic pyrolysis of rice husks is limited from literature as compared to the non-catalytic
pyrolysis. In-situ upgrading of the rice husk pyrolysis vapour was done with various zeolites
and zeolite-like catalysts [53, 73, 130], metal oxides [77] and clays [81]. The pyrolysis effect
of the impregnation of salt metal and removal of ash on rice husk was also studied by
Raveendran et al. which found that the decrease in ash content in rice husk led to an
increase in the liquid yield and a decrease in the gases yield.[59]. Table 3-1 shows the yields
of bio-oil from the catalytic pyrolysis of rice husks from literature.

41
Table 3-1. Yields of liquid from catalytic pyrolysis of rice husks
Liquid Yields (%)
Authors Pyrolysis / Catalytic Temperature Organics Water Overall Williams and
Nugranad [53]
Non-catalytic 550 / 550
28.5 18 46.5
ZSM-5 3.8 18.4 22.2
Li et. al [81]
Non-catalytic 460
33.5 15 48.5
Red brick 27.8 17.2 45
Meesuk et. al [77]
Non-catalytic
650
- 20 46
Ni/Al2O3 - 30 27
Ni/LY - 26 34
Dolomite - 26 29
CoMo/Al2O3 - 37 25
Li et. al studied the effect of red brick as a fluidising material compared to quartz sand. The
overall liquid yield decreased, but the conversion of high MW compounds (substituted
phenols and sugars) into lower MW compounds (phenols, acids, carbonyl and furans)
increases. An increase in the heating value and the organics yield in the upper phase were
seen.
Williams and Nugranad studied the effects of zeolite ZSM-5 on the pyrolysis of rice husks
with a fluidised bed, coupled with a fixed-bed catalytic reactor. The yield of the organics in
the catalysed oil was drastically reduced, and so does the oxygen content. The increase in
the aromatic hydrocarbon and light phenols were significantly increased by ZSM-5.
Meesuk et. al studied the effects of various catalyst (Ni/Al2O3, Ni/LY, Dolomite and
CoMo/Al2O3) mixed with sand in a fluidised bed reactor. The catalytic bio-oils obtained were
analysed as a single homogenous phase. The overall liquid bio-oil yield was seen to
decrease and the water content increases for all the catalytic runs. The order of catalyst
performance under the same condition is CoMo/Al2O3 > Ni/LY > Ni/Al2O3 > dolomite >
sand. Lu et. al studied the catalytic pyrolysis of biomass using on five different catalysts
(HZSM-5, HY, ZrO2 & TiO2, SBA-15 and Al/SBA-15). No liquid yields were reported, but the
effects of the catalyst on the various chemical groups were listed but only for cotton straw.
Although the effects of catalyst were not analysed for rice husks, the chemicals quantified
from cotton straw were gathered into the chemical groups, which should provide an general
idea of the expected chemicals from the catalysts listed. Jeon et. al studied the effects of
mesoporous zeolites (Meso-MFI and Pt-Meso-MFI) on rice husks, in particular with the
changes in composition of the liquid products.

42
3.7.1 Mechanisms for catalytic pyrolysis of biomass
Whilst the study is limited for catalytic pyrolysis of rice husk, the usage of catalyst for
pyrolysis on other biomasses are however quite extensive. It is therefore analogous to say
that the rice husks are comparable with biomasses containing compositions of cellulose,
hemicellulose and lignin, especially those of the agricultural wastes. Therefore a general
mechanism, where available, particularly on the effects of selected catalysts on the pyrolysis
vapours of biomass will be addressed.
Zhou et. al studied the catalytic pyrolysis of cellulose with zeolites and found a reduction of
aldehydes, acids, esters with HZSM-5 having the effect on deoxygenation ability [131]. Al-
MCM-41 catalyst reduces the acetic acid production [132] and affects the production of
chemicals such as furfural, 5-methylfuraldehyde, 1,4:3,6-dianhydro-α-D-glucose and
levoglucosan [133]. A similar study also found that yields of light phenols, hydrocarbons and
polyaromatic hydrocarbons increased, and those of alcohols, aldehydes, heavy phenols, and
heavy compounds decreased [90].
Figure 3-1 shows the reaction pathway for glucose catalytic pyrolysis on zeolite ZSM-5
involving two steps, from the thermal decomposition of glucose and the formation of
aromatics. Carlson et. al identified two pathways from the rapid thermal decomposition of
glucose. At low temperatures, glucose is converted into small oxygenates; and at high
temperatures, into anhydrosugars. Aromatics are typically non-existent in non-catalytic
pyrolysis of sugars/cellulosic materials, and usually originate from lignin-based structures.
The formation of aromatics proceeds within the pore structure of ZSM-5 from the conversion
of furanics or light oxygenates, although the selectivity is correlated to the temperature and
catalyst ratio. Coke, which is formed from the intermediate products, has been identified to
be the main competing reactions towards the formation of aromatics. Polyaromatic
hydrocarbon formation may be reduced by decreasing the reaction time over the catalyst.

43
Figure 3-1. Reaction pathway for glucose catalytic pyrolysis on ZSM-5 [134]
Another mechanism available from literature is the aromatic formation on ZSM-5 from lignin.
Figure 3-2 is the mechanistic pathways of aromatic formation from lignin on ZSM-5, which
was reproduced by Ramirez-Corredores from the study of Mullen and Boateng [135].
The depolymerisation of lignin produces guaiacols and syringols, and simple phenols. Partial
deoxygenation of lignin aromatic units produces simple phenols, which is a potential source
of coke and catalyst deactivation on ZSM-5. The mechanism pathway from Figure 3-2
suggested sources for the formation of aromatics were derived from lignin oligomers which
undergoes oligomerisation and cyclisation.

44
Figure 3-2. Mechanistic pathways of aromatic formation from lignin on ZSM-5 [63] –
reproduced from [135]

45
4 CHARACTERISATION METHODS OF BIOMASS AND BIO-OIL
4.1 Introduction
In this research, Brunei rice husks (BRH) is used as biomass for the intermediate pyrolysis
study. This chapter introduces the characterisation methods for the biomass feedstock and
the resulting pyrolysis bio-oil.
4.2 Biomass preparation/processing
The rice husk was obtained from Brunei in a dry form before shipping into the UK. Prior to
characterisation, BRH was ground using a Fritsh blade grinder with a 4-mm sieve. The
samples were sieved and the particle size distribution determined. The standard practice for
the preparation of biomass prior to the analyses is according to the ASTM E1757-01
standard [136] ensuring uniformity throughout the analyses and experiments.
4.3 Biomass characterisation methods
The characterisation methods for biomass include proximate analysis, elemental/ultimate
analysis, ash/inorganic composition analysis, structural/compositional analysis,
heating/calorific value determination and thermogravimetric analysis and derivative
thermogravimetric analysis.
4.3.1 Proximate Analysis
The proximate analysis are performed according to the British and European standard test
method for measuring the moisture (BS EN 14774-3:2009), volatile (BS EN 15148:2009) and
ash contents of solid biofuels (BS EN 14775:2009) respectively [137-139]. Analyses were
done in triplicates and the average reported.
Moisture content is determined using a drying oven, where the temperature is held at 105°C
for at least 3 hours, with repeated measurements at interval until it achieves a constant
weight. Samples were cooled in a dessicator prior to weighing. Crucibles with about 1g of
samples each were analysed. The percentage weight loss after the final drying process can
be considered as the moisture content.

46
Volatile matter can be defined as the content released when heating the biomass at a
controlled conditions. About 1g of moisture-free biomass sample is placed in a ceramic
crucible enclosed with a lid and heated at 900°C for 7 minutes. The crucible was placed in a
dessicator and weighed when it cooled to room temperature. The percentage of volatile
matter can be calculated from the weight loss of the sample before and after heating.
Ash content is determined by heating the sample up from room temperature to 550°C for a
minimum of 3 hours or until all the carbon is eliminated. The residue remaining after the
process is classified as the ash content.
The fixed carbon value is obtained by percentage difference [140]. Fixed carbon can be
defined as the carbon remaining after heating in a prescribed manner to decompose
thermally unstable components and to distill volatiles [141] .
4.3.2 Elemental Analysis
The elemental analysis gives the composition of biomass in wt% of the main elements
carbon, hydrogen, nitrogen and sulphur (C, H, N and S). Oxygen was obtained by difference.
The ultimate analysis was carried out using a Carlo-Erba 440 elemental analyser by an
external company (MEDAC Ltd., Surrey, UK).
4.3.3 Ash/Inorganic Composition Analysis
The inorganic elements that are present in biomass were determined using an inductively
coupled plasma-optical emission spectrometer (ICP-OES) which was carried out externally
by MEDAC Ltd., Surrey. A semi-quantitative scan was done, and elements such as
potassium (K), calcium (Ca), phosphorous (P), magnesium (Mg), sodium (Na), copper (Cu)
and silicon (Si) are determined.
4.3.4 Structural/Compositional Analysis
The Fibercap equipment is used for this analysis based on the Van Soest method or the
‘food-processing industry’ methods for its determination [142-145]. The lignocellulosic
contents of the biomass, i.e. cellulose, hemicellulose and lignin are determined from the
Neutral Detergent Fibre (NDF), Acid Detergent Fibre (ADF) and the Acid Detergent Lignin
(ADL).

47
For the determination of NDF, 0.5g of biomass samples were placed in 6 dried fibercap
capsules and pre-extracted three times with 120 ml acetone to remove fat contents.
Pretreatment of the samples is required by soaking with 2 ml working amylase solution
(WAS) in 120 ml hot distilled water to remove undesirable starch. Samples were then
extracted in 350 ml neutral detergent solution in a Fibretec™ reflux system for 30 mins. After
the process has ended the samples were rinsed in hot boiling water three times, followed by
a series of similar de-starching and de-fatting process. Samples in the capsules were dried
for at least 5 hr at 105°C and then ashing was done at 600°C for 4 hr. The NDF was
calculated by the difference in the initial and final weight of the sample.
A similar NDF procedure was followed for the determination of ADF, except that 1g of the
biomass sample was put in the capsules, the de-starching process was removed, and an
acid detergent solution was used for the extraction reagent. The ashing step in this
procedure was omitted for the determination of ADL.
For ADL determination, the dried samples from the previous ADF procedure were
consecutively de-fatted, and then extracted with soaking in 72% sulphuric acid solution for 3
hrs. The samples were rinsed in hot boiling water until it is acid-free, followed by drying and
ashing procedure. The cellulose, hemi-cellulose and lignin contents can be calculated, and
shown in Table 4-1 below.
Table 4-1. Calculation for cellulose, hemicellulose and lignin determination
Composition (%) Calculations (ash and extractives-free basis)
Hemi-cellulose NDF - ADF
Cellulose ADF - ADL
Lignin ADL
4.3.5 Heating/Calorific Value
The higher heating value (HHV) is determined from a Parr 6100 bomb calorimeter following
the ASTM D5865 standard method [146], at a wet or as received basis. The principle behind
the bomb calorimeter is that it measures the heats of combustion of a sample in oxygen. A
known amount of sample placed in a crucible, positioned in a steel container ‘bomb’ was
burnt in excess oxygen. The heat given off is transferred to a jacket of a fixed volume of
water, and the temperature change (∆T) is measured. The effective heat capacity of the
bomb calorimeter (Q) can be obtained by calibrating with a substance (m) of a known heat of
combustion (c), such as benzoic acid with 25.43 MJ/kg at 25°C.

48
� = ��∆� (Equation 4-1)
The value of Q is therefore constant throughout, unless a different bomb is used. The value
of the effective heat capacity of the bomb is then substituted in equation 4-1 to find the
unknown heat of combustion for the biomass. The HHV of biomass takes into account the
latent heat of vaporisation of water in the combustion products, and assumes that water is in
the liquid state after combustion (inclusion of enthalpy change).
The biomass used here is in a wet basis, i.e. taking into account the moisture content. Most
values in literature quote values on dry basis, therefore we can use mathematical correlation
to consider the moisture content, and express it on a dry basis from equation 4-2 below
[147]. Note that the HHV (ar) and HHV (dry) stand for wet basis and dry or moisture-free
basis respectively.
��� =���� (1 −�������
���) (Equation 4-2)
The Lower Heating Value (LHV) can be calculated from correlation from equation 4-3 [147]
below.
���� =���� − 2.442 ∗ 8.936�/100 (Equation 4-3)
4.3.6 Thermogravimetric Analysis (TGA) and Derivative Thermogravimetric Analysis (DTG)
Thermogravimetric analysis (TGA) is a technique whereby the weight of a substance in an
environment heated or cooled at a controlled rate is recorded as a function of time or
temperature [148]. The derivative thermogravimetric analysis (DTG) is the curve obtained by
plotting the first derivative of TGA curve as a function of temperature. The DTG curve can
show the maximum or minimum, which is clearly shown for particular overlapping reactions
at a given temperature. The concept of TGA pyrolysis is to study of the decomposition
behaviour of biomass under an inert or pyrolytic condition. Essentially, the main information
that can be derived from TGA is the pyrolysis onset temperature range, weight loss
percentage and the char content, while DTG pyrolysis can illustrate the maximum weight
loss for different peak temperatures.

49
TGA for pyrolysis has been done in duplicates. An automated Perkin Elmer Pyris 1 TGA
thermogravimetric analyser was used, with a nitrogen flow of 20 ml/min at 20°C/min heating
rate, at up to 900°C. Biomass samples of 2-3 mg were put in a ceramic crucible on an
analyser tray. The machine picks the crucible up via a hook which acts as a weighing
balance, and is inserted in an enclosed furnace. The sample is then heated up according to
the programmed variables, where the weight loss from the thermal degradation is measured.
4.4 Characterisation of bio-oil
The main product produced from the pyrolysis of biomass is bio-oil. The major liquid
components yield includes water and organic compounds derived from the degradation of
cellulose, hemicellulose and lignin. Characterisation of bio-oil include the determination of
the water content, acidity, viscosity, density, elemental analysis, heating value and the gas
chromatography-mass spectrometry (GC-MS).
4.4.1 Water Content
The water content of the bio-oil was determined using a Mettler Toledo Karl Fisher V20
compact titrator based on ASTM D1744 [149]. Prior to analysis, the system is calibrated with
HPLC-grade water. Hydranal working medium K was used as the solvent and Hydranal
Composite 5K as the corresponding titrant. A known weight of the bio-oil is injected into the
enclosed titration beaker, and the weight is entered into the system. The result of the water
content in the bio oil is then displayed following after the titration is completed. The analyses
were done in triplicates and average reported.
4.4.2 Acidity
The acidity of bio-oil can be determined from the pH or the acid number. The pH was
obtained using the Sartorius basic meter PB-11. Before the experiment, the pH meter is
calibrated with liquid calibration standard pH of 4 and 7. The probe is then dipped into the
bio-oil, and analysis was repeated at least three times.
Acid number or Total Acid Number (TAN) was determined using a Mettler Toledo G20
titrator based on ASTM D644-04 with a solvent mixture of toluene, 2-isopropanol and water,
and potassium hydroxide solution (KOH) as the titrant. A known weight of bio-oil of less than
a gram was dissolved in the solvent mixture. The samples were automatically stirred

50
throughout the analysis to ensure uniform mixture of the titrant and solution. A potentiometer
measures the acidity by determining the end point. The results are displayed with units
representing the amount of KOH in milligrams that is required to neutralise the acids in 1g of
bio-oil.
4.4.3 Viscosity
Kinematic viscosity was measured according to the ASTM D445. A Cannon-Fenske Routine
glass capillary viscometer was filled with the bio-oil at 40°C. A fixed volume of oil was
passed through the capillary under gravity and the sample time travelling was recorded. The
kinematic viscosity can be calculated from the product of the viscometer calibration constant
and the measured time. The dynamic viscosity can also be obtained from the product of the
kinematic viscosity and the density of the bio-oil at 40°C.
4.4.4 Density
The density of the bio-oils was measured using a Mettler Toledo 30PX densitometer. The
principle behind it is that the device measures the light reflection from the liquid surface. The
liquid sample is injected into a measuring cell where the device will automatically produce a
reading.
4.4.5 Elemental Analysis
The elemental analysis for bio-oil is the same as section 4.3.2.
4.4.6 Heating/Calorific Value
The calorific value was calculated via correlations using data obtained from elemental
analysis derived by Channiwala and Parikh [150] from the equation 4-4 below:
���&�� = 0.3491' + 1.1783� + 0.1005+ − 0.1034, − 0.015- − 0.0211. (Equation 4-4)
However, there are assumptions that needed to be considered such as the value of A (ash
content) is assumed to be 0.5% by weight. The values of C, H, N, S and O can be correlated
from the elemental analysis. The HHV obtained takes into account the water content, and
therefore converted to dry basis using equation 4-2.

51
4.4.7 Gas Chromatography – Mass Spectrometry (GC-MS)
GC-MS analysis of bio-oil was conducted using a Hewlett Packard HP 5890 Series II Gas
Chromatograph with an Agilent auto sampler and coupled to an HP 5972 MS detector.
Helium is used as the carrier gas with a DB 1706 non-polar capillary column. The initial oven
temperature was 40°C and rising up to 290°C at a rate of 3°C/min. The injection temperature
was held at 310°C with a volume of 5µl. Identification of the GC-MS peaks is based on the
NIST mass spectra library. The dilution solvent used was HPLC ethanol and the dilution ratio
was 5:1 to bio-oil. The analysis was done in duplicates.

52
5 BIOMASS CHARACTERISATION RESULTS OF BRUNEI RICE HUSK
5.1 Introduction
This chapter focus on the results from the characterisation of Brunei rice husks. In
comparison to BRH, other type of rice husk species from West Africa (AFRH) was also
characterised. The method employed was from the procedures laid out from previous
Chapter 4 for the characterisation of biomass.
5.2 Sieve analysis
The rice husks samples were sieved to different particle size distribution (Table 5-1). For
thermochemical reaction, the particle size has an effect on the degradation condition. A
large particle size may cause secondary reactions which lead to the formation of char, and a
particle size too small may not be retained in the reaction zone and thus entrained
elsewhere [151]. Figure 5-1 shows the Brunei rice husk samples (as received) before and
after grounded.
Figure 5-1. Ungrounded (left) and ground (right) Brunei rice husks samples
Table 5-1. Sieve analysis results for BRH and AFRH
Content (wt%, as received basis)
Particle size (µm) BRH AFRH
>1000 24.93 16.64
850-1000 17.02 18.61
600-850 25.81 27.14
500-600 6.96 8.64
355-500 9.65 11.04
0-355 15.63 17.92
Total 100 100

53
5.3 Biomass characterisation results
The characterisation results from BRH and AFRH samples are given in Table 5-2 and
compared with the results of other rice husks values from literature.
Table 5-2. Summary for the experimental (BRH and AFRH) and literature rice husk
characterisation data
EXPERIMENTAL LITERATURES
Rice Husk species BRH AFRH Lemont [66]
Pa Potho [66]
ROK 16 [151]
Rice Hull [71]
Rice Husk [68]
PROXIMATE ANALYSIS (wt. %)
Moisture 8.43 7.88 9.08 10.16 10.44 1.50 6.73
Volatile Matter 68.25 58.22 66.40 67.60 70.20 61.00 61.23
Fixed Carbon 8.49 7.86 13.60 14.20 14.50 24.00 14.96
Ash 14.83 26.04 20.00 18.20 15.30 13.00 17.09
ELEMENTAL/ULTIMATE ANALYSIS (wt. %)
C 39.48 34.895 37.60 42.6 44.5 45.00 38.45
H 5.71 5.145 5.42 5.10 5.51 5.80 5.22
N 0.665 0.31 0.38 0.51 0.46 0.93 0.45
O 54.12a 59.01
a 33.20 33.60 35.20 48.00
a 49.15
a
S < 0.10 0.64 0.034 0.025 0.021 0.20 -
Cl 0.025 <0.01 0.01 0.13 0.031 - -
O:C molar ratio 1.03 1.27 0.66 0.59 0.59 0.80 0.96
H:C molar ratio 1.74 1.77 1.73 1.44 1.49 1.55 1.63
HEATING VALUES (MJ/kg)
HHV (dry basis) 17.34 14.05 15.90 15.98 18.31 - -
LHV (dry basis) 16.10 12.92 14.22 14.12 16.20 - -
COMPOSITIONAL/STRUCTURAL ANALYSIS (wt. %)
Cellulose 41.52 ± 0.45 37.34 ± 0.14 29.2 35.5 - - -
Hemicellulose 14.04 ± 0.53 10.07 ± 0.51 20.1 21.35 - - -
Lignin 33.67 ± 0.19 41.08 ± 0.18 30.7 24.95 - - -
Extractives 10.77 ± 0.37 11.5 ± 0.45 - - - - -
a by difference
As rice is grown throughout different parts of the world, the sample species or regional
effects may have an effect towards the characterisation values. Mansaray and Ghaly studied
the Lemont, Pa Potho and ROK 16 rice varieties. The rice husks were collected in a
polyethylene bag from their respective rice mills and transported to Halifax, Canada. The rice
husk samples were dried in an air-forced oven at 105°C for 24 hours to avoid deterioration

54
from moisture. Prior to analysis, other than the moisture content, the dried samples were
ground and sieved. Fine ground samples were used for biomass characterisation.
Lemont rice species was obtained from Broussard Rice Mills, Louisiana in USA. The
dehusking process was using rubber roller mills. Pa Potho and ROK 16 species were
obtained from West African Rice Research Station, Rokupr in Sierra Leone. The difference
between both of them was the processing methods. Pa Potho underwent a parboiling
process which involves saturating the rice grain in water and raising the temperature, before
dehusking using rubber roller mills. ROK 16 rice variety was dehusked using a large disc
sheller mills.
The rice variety studied by Teng et. al was labelled ‘rice hull’ and did not mentioned the
processing conditions. The authors also did not mention specifically the region where it was
grown, but pointed out that rice hull is a growing solid and waste disposal problem in the
Asian and Pacific region.
The rice species studied by Hu et. al was not mentioned but was obtained from China. The
sample labelled ‘rice husk’ by the author was meshed to small particles sizes with range
25µm to 1mm, with an average sizes of biomass close to 300µm. The meshing process was
done before the biomass was transported from China to Germany for analysis.
5.3.1 Proximate and ultimate analysis
BRH has a moisture content of 8.43 wt. % which is comparable to most rice husks literature
values, although some vary slightly due to different storage and environment conditions.
Conditions such as humidity do affect the analysis, since the biomass is hygroscopic in
nature. The value of 1.50 wt. % moisture content for one of the literature values suggests
that the biomass was dried prior to analysis. One crucial condition for pyrolysis process is
the amount of moisture content in the feedstock sample. The moisture content should be
minimised so that it does not add to the water content in the resulting liquid bio-oil.
The volatile content for BRH was found to be high with 68.25 %. This compares favourably
to other rice husk species such as ROK 16 and Pa Potho reported by Mansaray and Ghaly,
with a value of 70.2% and 67.60% respectively. Generally, a high volatile content for
biomass is favourable for pyrolysis process to indicate a high liquid yield production. As for
AFRH, the value for the volatile content of 58.22% is slightly low when compared with other
rice husk species.

55
The ash content for BRH and AFRH are 14.83% and 26.04% respectively. Although
comparable to values in literature, they are noticeably high. Typically rice husks species
have a higher ash content when compared to other biomass such as willow wood 1.9%
[110], wheat straw 4.89% and miscanthus 4.46% [152]. High ash content in the biomass is
known to affect the pyrolysis products in terms of lowering the liquid yield and increasing the
non-condensable gases due to their catalytic effects. The variation in methods of harvesting,
handling and storage techniques can contribute to the difference in the ash values. The ash
content may originate from the biomass itself, or from foreign materials e.g. soil, which is
collected along with the biomass. Considering that rice husk has high ash content compared
to other biomass, this will be a significant factor which will affect the pyrolysis yield.
The ultimate analysis of BRH indicate that it has 39.5 wt% C, 5.7 wt% H, 54.12 wt% O,
0.67% N and traces amounts of sulphur and chlorine. The values of N, S and Cl in rice
husks are minute, which accounts for less than 1% of their total compositions. The small
amount of nitrogen and sulphur indicates that the sample will produce less pollutant in the
form of NOx and SOx. The value for sulphur is higher in AFRH with 0.64% as compared to
BRH with < 0.10%. A possible explanation of this might be due to contamination of the
sample with soil or fertilisers which contain sulphur in the form of sulphates. The amounts of
Cl present also indicate a very minute amount of dioxin formation during combustion of the
biomass or their products.
The O:C and H:C molar ratios are calculated and compared accordingly. A higher HC molar
ratio and a lower OC molar ratio are favourable as fuels. Oxygen values which was obtained
by difference tends to be higher, leading to a higher O:C molar ratio. A comparison of the
OC ratio for the oxygen values calculated by difference may indicate that the values are
affected by the moisture content. The H:C molar values calculated from the literature ranges
from 1.44 to 1.73. The values obtained for BRH and AFRH were 1.74 and 1.77 respectively,
which were slightly higher than those in literatures.
5.3.2 Compositional Analysis
Majority of the composition from rice husks consists of cellulose and lignin. The
compositional or structural analysis of BRH shows that it has 41.52% cellulose, 14.04%
hemicelluloses and 33.67% lignin. AFRH shows that it has higher lignin % content, but a
lower cellulose and hemicelluloses % content by weight compared to BRH and is therefore
expected to generate more lignin-derived pyrolysis products.

56
Another method of obtaining the compositional values is using the ‘wood-industry’ method
which involves a different set of experimental procedures. The experimental values for BRH
and AFRH may not be comparable to the literature values due to the difference in
procedures, except for the lignin values which was determined using 72% sulphuric acid. A
study by Carrier et. al showed that the values for cellulose is comparable and that the
hemicellulose values were generally lower for the ‘food-industry’ method as compared to the
‘wood-industry’ method [145]. The lower hemicellulose values for BRH and AFRH as
compared to the values for Lemont and Pa Potho species illustrated the difference.
Pyrolysis products can be predicted from the thermal decomposition of the main three
components. Besides the formation of water, carbon dioxide and carbon monoxide, the
pyrolysis of cellulose and hemicellulose will generate hydrocarbons, aldehydes, ketones,
acids and alcohols; whereas the pyrolysis of lignin will generate mostly phenols and alcohols
[153].
5.3.3 Heating Values
The heating value determined experimentally from the bomb calorimeter is quite similar to
the values from literature. The higher heating value (HHV) on dry basis shows that BRH has
a heating value of 17.34 MJ/kg, compared to a value of 14.05 MJ/kg for AFRH. Lemont and
Pa Potho reported a lower value of 15.90 and 15.98 MJ/kg, which may suggest that higher
ash content in biomass corresponds to a reduction in their heating values. A study by Sheng
and Azevedo mentioned that the HHV decreases with an increase in the ash content, and
that a trend exists between the HHV and volatile content [154].
Values from Table 5-2 for the volatile content and the HHV were plotted as a function of ash
content and illustrated in Figure 5-2. Although volatile matter may not correlate with the
HHV, it is an indication of the presence of combustibles in the rice husks. The trend for rice
husks shows a decrease in both volatile matter and HHV with the increase in the ash
content, which is similar to the study by Sheng and Azevedo on biomass. This shows that
the ash content has a major effect on the energy content of biomass.

57
Figure 5-2. Volatile content and HHV as a function of ash content
5.3.4 Ash composition analysis
Ash composition analysis was done only for BRH. The ash composition shows that it has a
significant amount of potassium (K), calcium (Ca) and phosphorus (P). The relatively lower
content of potassium in BRH as compared to 1.20% in miscanthus and 0.57% in wheat
straw [152] is an added advantage, because a higher potassium amount can contribute to
slag formation in furnaces and due to a decrease in the ash melting point [155]. As for
phosphorus, the added presence may increase the char yield during pyrolytic decomposition
of biomass [156]. Table 5-3 shows the comparison of the ash composition analysis for BRH
compared with literature. Tsai et. al and Lu et. al measured the ash composition from rice
husk as received, but Mansaray and Ghaly measured the ash composition from rice husk
ash. It is as expected that silicon (Si) is very high in rice husk ash, but unusual that the Si
value for BRH is significantly very low as compared to the other rice husks literature values.
Table 5-3. Ash composition analysis of BRH compared to rice husks from literature
Values (ppm)
Element K Ca P Na Fe Si Mn Zn Cr Mg
BRH 2000 519 605 186 415 223 257 16 90 132
Tsai et. al [74] 1630 94 94 207 202 39000 - 24 - 699
Lu et. al [157] 3600 1600 300 - 55 68200 330 - - 510 Mansaray and Ghaly [151] 18000 3300 300 800 1600 970000 - 80 - 3000
68.25
58.22
17.34
14.05
0
5
10
15
20
25
30
35
40
0
10
20
30
40
50
60
70
80
10 15 20 25 30
HH
V (
MJ/
kg
)
Vo
lati
le c
on
ten
t (w
t. %
)
Ash content (wt. %)
Volatile Matter
HHV

58
Some amounts of sodium (Na), iron (Fe), manganese (Mn), chromium (Cr), magnesium (Mg)
and zinc (Zn) are also present in BRH. The absence of heavy metal elements such as
cadmium, lead or mercury suggests that the biomass and their products can be applied to
small-scale combustion systems, due to the strong impact on ash quality and particulate
emissions [155].
5.3.5 TGA and DTG
The thermochemical characterisation from the TGA and DTG can be seen in Figure 5-3
below. A comparison of the TGA and DTG derived information of rice husk from the
experiment and literature can be found in Table 5-4. The information include the pyrolysis
onset temperature range, weight loss and char yield at 500°C, heating rates and the peak
and shoulder peak temperatures for the maximum weight loss. Weight losses below 100°C
are considered to be the moisture in the sample. The pyrolysis onset temperature range for
BRH and AFRH can be seen to range from 200-550°C. The thermal degradation study for
both rice husks shows typical biomass degradation behaviour.
Figure 5-3. TGA and DTG plots for BRH and AFRH
0
5
10
15
20
25
30
35
40
0
10
20
30
40
50
60
70
80
90
100
0 200 400 600 800
We
igh
t lo
ss r
ate
(%
/min
)
We
igh
t (%
)
Temperature (°C)
TGA BRH
TGA AFRH
DTG BRH
DTG AFRH

59
Table 5-4. TGA and DTG pyrolysis derived information of rice husks for the experimental
and literature values
Experimental Literatures
BRH AFRH
Isa et. al
[72]
Worasuwannarak et. al
[67]
Mansaray and Ghaly
(Pa Potho) [66]
Teng et. al
[71]
Pyrolysis onset
temperature range (°C) 200-550 200-500 200-550 200-500 200-500 200-600
Weight loss at 500 °C
(%) 60 50 58 50 55 57
Heating rate (°C/min) 20 20 20 10 10 100
Peak temperature for
maximum weight loss
(°C) 380 390 340 340 348 390
Shoulder peak
temperature (°C) 340 320 300 300 312 330
Char yield at 500°C (%) 34 44 39 50 40 40
A weight loss is achieved at 60% for BRH, and 50% for AFRH at temperatures below 500°C,
which agree with the range of values from the literature. The TGA curves show that most of
the weight loss for both of the rice husks occurs between 280°C and 420°C, which indicate
essential indication for determining the optimum temperature required for pyrolysis reactions.
No significant weight loss can be seen after 600°C for both of the rice husks. The weight
loss % at the chosen temperature (500°C) indicates the char yield, i.e. residue at the
corresponding temperature. The char yield at 500°C for BRH and AFRH is 34 % and 44 %
respectively.
The DTG curve can indicate clearly the temperature where the maximum weight loss occurs.
Both rice husks has two major peaks at around 320-340°C and 380-390°C, but BRH has a
higher weight loss rate for the first shoulder peak compared to AFRH. The values from
literature also indicate two major peaks from rice husks which range from 340-390°C for the
main peak, and 300-330°C for the shoulder peak. The variation in the heating rate for most
of the literature values may shift the peak temperatures slightly.
The first shoulder peak can be associated with the thermal degradation of hemicellulose,
and the second peak is due to the decomposition of cellulose and lignin [66]. As lignin
degrades over a wide temperature range, it is difficult to distinguish between both of them.
Carrier et. al also concluded in their study and found correlations in the application of TGA
with the compositional analysis for obtaining the cellulose and hemicellulose values, but not
for lignin [145]. BRH has a higher content of hemicellulose than AFRH, therefore showed a
considerable higher weight loss rate for the first shoulder of the DTG peak. The second peak
occurs at 380°C for both samples, but a sharper peak is seen for AFRH compared to BRH.

60
5.4 Summary
Characterisation studies have been carried out for BRH, with AFRH as a comparison
according to the standard procedures, together with other rice husk species from literature.
TGA and DTG pyrolysis behaviour have also been studied. Results from the thermochemical
characterisation shows that BRH is suitable as a feedstock for the potential bio-oil production
using pyrolysis technology.

61
6 PYROLYSIS OF BRUNEI RICE HUSK
6.1 Introduction
This chapter describes the experimental setup and operation of the bench-scale
intermediate pyrolysis for BRH. The liquid bio-oil produced was characterised and analysed
based on the methods discussed from Chapter 4.
6.2 Bench scale intermediate pyrolysis rig
The rig is made up of two reactors connected in series with condensation train units as
shown in Figure 6-1. The primary reactor is made of quartz glass tube with an internal
diameter of 60 mm and height of 390 mm. The reactor head has three sockets for a
thermocouple, purge gas and a socket connecting the transition tube to the secondary
reactor. A thermocouple connected to a temperature controller runs through the middle of
the reactor. The purge gas N2 flows into the reactor, acting as a sweeping gas and is
controlled by a flowmeter. The primary reactor tube is heated via a furnace which has a
temperature controller unit, which relayed temperature information from the thermocouple.
The transition tube together with the reactor head is lagged to ensure a minimal
condensation of pyrolysis vapours from the primary reactor.
Figure 6-1. A schematic diagram of the pyrolysis rig setup

62
The secondary reactor is made up of an open tubular quartz glass tube with an internal
diameter of 25 mm and a length of 390 mm and is heated by a tube furnace. The secondary
reactor temperature is measured by a thermocouple connected to a handheld temperature
indicator. The secondary reactor is required to hold and support catalytic material used
during catalytic pyrolysis experiments. For non-catalytic pyrolysis experiments, the
secondary reactor act as a heated tube to transfer the pyrolysis vapours generated from the
primary reactor into the condensation trains. The secondary reactor flexibility ensures a
setup that compares non-catalytic and catalytic pyrolysis experiments.
The condensation trains consist of two condensers used for the collection of bio-oil. The first
condenser is a cold-finger condenser connected to an oil-pot, followed by a cold trap
condenser. The condensation medium for the indirect quenching of the pyrolysis vapours is
dry-ice and acetone mixtures, which cools it down to approximately -70 °C.
The non-condensable gases released were scrubbed with cooled isopropanol before
sending a stream of the gases to the sampling line and vented out. This ensures the removal
of excess condensable vapours and char fines before venting the rest of the gases out into
the fume cupboard. The extensive list of experimental set-up specifications for the
intermediate pyrolysis rig may be found in Appendix B.
6.2.1 Reaction conditions
BRH amounting to about 100 g of sample is subjected to pyrolysis in the primary reactor.
Prior to the pyrolysis run, BRH is weighed and placed into the primary quartz glass tube and
the feed bed height measured. The primary reactor head is inserted onto the quartz tube
along with the thermocouple, transition tube and the purge gas insert tube. A clamp is
attached at the neck of the joints to provide a tight grip and support the quartz tube. The
connection from the transition tube leads to the secondary reactor and the condensation
trains.
Nitrogen gas flow into the reactor was maintained at a flow rate of 50cm3/min to ensure a
constant vapour residence time. The stated flow rate was chosen based on the lowest
possible setting for the flowmeter, which is enough to purge the system. This was assured
by taking an injection of the gases prior to each pyrolysis run into the GC-TCD. The primary
reactor containing the BRH in the quartz glass tube was heated from 25°C to 450°C at a rate
of 25°C/min. The pyrolysis temperature of 450°C was selected based on the results obtained

63
from the TGA, which showed that it is sufficient to remove most of the volatile matter from
the biomass sample and the optimum temperature for onset pyrolysis of BRH. Since a
temperature of 450°C is used, the material for the reactor head is borosilicate glass which
can withstand a maximum temperature of 500°C, although a maximum temperature limit of
900°C may be achieved for the quartz glass tubes. The solid residence time is 30 min, which
accounts for the time taken for the biomass to be fully converted in the reactor, and relates
to the duration of the pyrolysis runs.
The vapour residence time is not calculated, and can be assumed in the order of seconds.
The value was not calculated, but several factors were identified which affect the vapour
residence time for a fixed-bed reactor, such as the amount of feed and the flowrate of the
purge gas. The amount of feed affects the bed height in the reactor or the freeboard volume,
which has a strong influence on properties of pyrolysis products but a small effect on product
yield [82]. The purge or sweeping gas affects the pace at which the pyrolysis vapour is
removed from the pyrolysis zone. Therefore these factors are ensured to be kept constant
throughout for the ground pyrolysis runs to eliminate the effects of vapour residence time on
the pyrolysis system.
Figure 6-2 shows the temperature profiles for a typical BRH sample in the reactor. The
programme temperature is the temperature profile applied to the primary pyrolysis reactor.
The sample temperature shows the actual temperature measured in the reactor. The
reaction peaks from ambient temperature to the maximum pyrolysis temperature at around
15 minutes. The sample was held at the maximum temperature for another 15 minutes. This
temperature profile is used for the pyrolysis experiments throughout this study.

64
Figure 6-2. Temperature profiles for a typical BRH sample in the primary reactor
6.2.2 Mass balance and product yield
The mass balance was done carefully throughout the experiment. The mass balance sheet
can be found in Appendix C. All the glassware apparatus were weighed before and after
each pyrolysis experiment. Prior to weighing, the glasswares were ensured to be cleaned
and dry. The liquid bio-oil and solid char yield can be obtained by difference before and after
pyrolysis. For a typical pyrolysis run, the primary and secondary reactor quartz tubes contain
the char, and the condensers and transition tube contain the bio-oils. The non-condensable
gases were obtained by difference and the gas composition normalised.
6.2.3 Gas composition
A gas injection is taken from the sampling line at a specific temperature to determine the
composition of the uncondensed gases using a gas chromatography-thermal conductivity
detector (GC-TCD). The gases analysed were generated after quenching the liquid fraction
of the bio-oil. The GC used was HP 5890 Series II Gas Chromatograph with a 60/80
Carboxen-1000, 15’ x 1/8” SS (2.1mm I.D) column. Helium is used as the carrier gas with a
flowrate of 30 ml/min, and the calibration gases is a mixture of permanent gases which
consists of hydrogen (H2), nitrogen (N2), methane (CH4), carbon monoxide (CO) and carbon
dioxide (CO2). A volume of 100µl was injected at a single run. The initial oven temperature
was held at 35°C for 5 minutes, and then ramped up to 225°C at a rate of 20°C/min.
0
50
100
150
200
250
300
350
400
450
500
0 10 20 30 40
Te
mp
era
ture
(°C
)
Time (min)
SAMPLE TEMPERATURE
(°C)
PROGRAMME
TEMPERATURE (°C)

65
6.3 Non-catalytic pyrolysis experimental results and discussion
This section discusses and examines the results for the non-catalytic runs for BRH, as well
as the characterisation of the pyrolysis bio-oil for wet and dry BRH sample respectively.
6.3.1 Mass balance
Pyrolysis experiments were done on BRH with wet (W), wet and ground (WG), and dry and
ground (DG) basis. Table 1 shows the mass balance summary for the non-catalytic pyrolysis
of BRH.
Table 6-1. Mass balance summary for non-catalytic runs
Run Name Units W WG DG
Particle size Um > 1000 355-850 355-850
Biomass moisture content wt % 9.46 8.55 1.18
Feed bed height cm 15 10 10
Nitrogen gas flow cm3/min 50 50 50
Pyrolysis temperature °C 450 450 450
Pyrolysis temperature heating rate °C/min 25 25 25
Average secondary bed temperature
°C 513 485 488
Product yield wt % ar basis
LIQUID 42.17 37.08 39.61
Bottom phase (organic phase) % of liquid 10.90 7.48 -
Upper phase (aqueous phase) % of liquid 89.10 92.33 -
CHAR 39.38 40.49 41.92
GASES 18.45 22.43 18.47
H2 - - -
CH4 1.27 1.48 2.06
CO 20.98 13.35 9.14
CO2 65.27 73.05 75.4
A liquid bio-oil yield of up to 40 wt. % was recorded for the non-catalytic experiments. The
pyrolysis conditions can therefore be classified as intermediate pyrolysis due to the
moderate temperature used (450°C) and yield comparable to the patented Haloclean
process [80]. A study by Tsai et al. which used a fixed-bed reactor on rice husk pyrolysis
also showed a liquid yield of about 40 wt. % for temperatures of 500 to 800°C [74].

66
The wet BRH sample, either ground or ungrounded show signs of phase separation into two
layers and separated via a simple decanting process. The liquid yield decreases and the gas
yield increases when the rice husks are ground i.e. smaller particle sizes, showing a similar
pattern with the study by Natarajan and Ganapathy [76]. This was due to the difference in
the bed height in the primary reactor, which was not addressed by the authors. The bed
height varies as to contain 100g of BRH sample, altering the freeboard volume which
affected the vapour residence time. A longer vapour residence time lead to more secondary
reactions, thus a higher gas yield for WG run compared to W run. Based on the analysis of
the liquid sample, about 11 wt. % of the total liquid is at the bottom phase. This value
decreased to 7.50 wt. % when the wet feedstock is ground. The demarcations of bio-oil
layers from wet samples were clearly seen as compared to the dry sample (Figure 6-3).
For the dry and ground BRH sample, the liquid does not appear to show any clear phase
separation. The dry sample produces a semi-homogenous bio-oil, which can be analysed as
a whole. It is therefore preferable to dry the feedstock beforehand to minimize the water
content in the bio-oil. An increase in the biomass moisture content (from 1.18% to 9.46 %)
resulted in the separation of both into organic and aqueous layers. This is in agreement with
Lehto et al [158], which stated that a two-phase product with a larger aqueous phase and
viscous oily phase may be produced if high-moist (> 10 wt%) feedstock is used. Essentially,
the dry feedstock samples are preferred due to the homogeneity of the liquid sample and
therefore a suitable representation to compare with other bio-oils from pyrolysis experiments.
Figure 6-3. Pyrolysis bio-oil from dry BRH feedstock (left) and wet BRH feedstock (right)

67
The mass balance for the char yield (40 wt. %) is consistent and comparable due to the
invariable pyrolysis conditions in the fixed-bed primary reactor. The char yield is quite high
due to the high ash content (14.83 %) in BRH, compared to other feedstocks, such as
brewer’s spent grain which has a char yield of 29% with an ash content of 4.50 % [42], and
beech trunkwood with 33.7 % char yield and an ash content of 7.40 % [159].
Apart from nitrogen, the gases analysed from the GC-TCD contained various concentrations
of methane, carbon monoxide and carbon dioxide. The composition of the gases was shown
to contain mostly carbon dioxide. A comparison between the ground samples compared to
the ungrounded sample show that there is an increase in the methane and carbon dioxide,
but a decrease in the carbon monoxide composition.
6.3.2 Characterisation of wet BRH bio-oil
The characterisation of bio-oil from the wet pyrolysis of BRH is discussed in this section.
Since the BRH pyrolysis bio-oils from the wet sample produced two layers, each layer were
characterised separately. Limitations on the sample size especially the bottom layer
restricted some of the characterisation to be performed.
6.3.2.1 Acidity, water content and HHV
Table 6-2 shows the chemical properties of bio-oil from the pyrolysis of BRH. The analysis of
the wet bio-oil sample (W) shows that the bottom layer is slightly less acidic than the top
layer. Values for the acid number for the top phase are around 39 mg KOH/g, and for the
bottom organic phase is around 25 mg KOH/g. The pH values also show a difference, with a
pH of 2.96 for the top aqueous phase, and 3.36 for the bottom phase. As for the ground and
wet bio-oil sample (WG), the pH for the top layer can be observed to be almost similar, but
the bottom layer to be more acidic. This was also observed by Li et. al, where the pyrolysis
of rice husk produced two layers, which the top layer has a pH of 2.89, and the less acidic
bottom layer with 3.81[81].

68
Table 6-2. Chemical properties of bio-oil from the pyrolysis of wet BRH
n/a: not available
The heating value using a bomb calorimeter can only be analysed from the bottom phase of
the bio-oil where most of the combustible organics are. A HHV of 24 MJ/kg is obtained from
the bottom phase of the wet sample. The upper phase for the bio-oil from the wet BRH is
non-combustible in the bomb calorimeter, which is due to the presence of high water
content.
The Karl-fisher titration shows that for the wet feedstocks for BRH, the top phase is above
70% water content, when compared to the bottom phase of roughly below 20% water
content. A study by Song et. al also confirms the high amount of water present in the upper
layer as compared to the bottom layer, when the bio-oil was separated by adding a salt
solution [160].
This shows that most of the organics are present in the bottom layer, proving that water is
not completely miscible with the bio-oil. The water content decreased for the ground and wet
bottom layer (WG) which showed that there is an increase in the organic content.
6.3.2.2 GC-MS analysis
The GC-MS analysis was done for both the upper and lower layer of WG pyrolysis bio-oil.
Figure 6-4 and Figure 6-5 shows the labelled chromatograph for wet-BRH upper and bottom
phase of BRH bio-oil. Table 6-3 and Table 6-4 show the corresponding selected chemicals
and average peak area for the wet-BRH upper and bottom phase of BRH bio-oil.
W WG
Phase Top Bottom Top Bottom
Acid number (mg KOH/g) 38.50 24.99 n/a n/a
pH 2.96 3.36 2.98 3.18
HHV - wet (MJ/kg) n/a 24.93 n/a n/a
Water content (%) 71.43 18.53 73.23 12.84

69
Figure 6-4. A typical chromatograph of wet-BRH upper layer
Table 6-3. Selected chemicals and average peak area for the upper layer of wet-BRH bio-oil
Peak RT Chemical name
Average
Peak Area (%)
Chemical
Formula RMM Chemical Group
1 6.802 Methyl acetate / Acetic acid, methyl ester 1.345 C3H6O2 74.08 Esters
2 8.654 3-Penten-2-one, (E)- 0.895 C5H8O 84.12 Ketones
3 9.194 1,1-diethoxy-ethane 4.265 C6H14O2 118.2 Misc. Oxygenates
4 9.286 Acetic Acid 14.225 C2H4O2 60.05 Organic acids
5 9.700 2,3-pentanedione 1.215 C5H8O2 100.12 Ketones
6 10.505
2-hydroxymethyl, cyclopropacarbonic acid-1,
methyl ester 2.49 - - Esters
7 12.344 1,1-diethoxypropane 1.975 C7H16O2 132.2 Misc. Oxygenates
8 13.322 a-butyl-cyclopropanemethanol 2.17 C8H16O 128.2 Alcohols
9 13.609 Propanoic acid 2.63 C3H6O2 74.08 Organic acids
10 14.563 Cyclopentanone 0.955 C5H8O 84.12 Ketones
11 14.747 1-hydroxy-2-butanone 3.155 C4H8O2 88.11 Ketones
12 16.633 2-furanol, tetrahydro-2-methyl- 0.705 C5H10O2 102.13 Alcohols
13 16.794 3-propoxy-1-propene 0.895 C6H12O 100.16 Misc. Oxygenates
14 17.829 Furfural 8.325 C5H4O2 96.09 Furans
15 20.163 2-furanmethanol 3.89 C5H6O2 98.10 Alcohols
16 20.887 2-methyl-2-cyclopenten-1-one 1.125 C6H8O 96.13 Ketones
17 21.657 2-Furyl Methyl Ketone 0.885 C6H6O2 110.11 Ketones
18 22.956 2-hexene-1-ol, acetate 1.10 C8H14O2 142.20 Misc. Oxygenates
19 23.646 2,5-diethoxytetrahydrofuran 1.205 C8H16O3 160.21 Misc. Oxygenates
20 23.761
1,2-cyclopentanedione AND
2-hydroxy-2-cyclopenten-1-one 3.055 C5H6O2 98.10 Ketones

70
21 25.175 5-Methylfurfural 0.68 C6H6O2 110.11 Furans
22 25.980 3-Methyl-2-Cyclopentenone 1.09 C6H8O 96.13 Ketones
23 26.337 2(5H)-Furanone 0.985 C4H4O2 84.07 Furans
24 26.463 Tetrahydro-2-furanmethanol 0.935 C5H10O2 102.13 Alcohols
25 29.062 3-methyl-1,2-yclopentanedione 4.5 C6H8O2 112.13 Ketones
26 30.579 Phenol 2.405 C6H6O 94.11 Phenols
27 31.626 Guaiacol 3.805 C7H8O2 124.14 Guaiacols
28 34.856 p-Cresol 0.79 C7H8O 108.14 Phenols
29 36.558 3-buten-2-ol 1.49 C4H8O 72.11 Alcohols
30 36.834 p-creosol 1.35 C8H10O2 138.17 Guaiacols
31 39.168 4-Ethylphenol 1.34 C8H10O 122.16 Phenols
32 40.927 4-Ethylguaiacol 0.65 C9H12O2 152.19 Guaiacols
33 42.111 1,4:3,6-dianhydro-α-d-glucopyranose 0.955 C6H8O4 144.13 Anhydrosugars
34 43.215 o-Coumaric acid 0.79 C9H8O3 164.16 Organic acids
35 49.918 Hydroquinone / 1,4-benzenediol 0.81 C6H6O2 110.11 Phenols
36 55.621
1-(4-hydroxy-3-methoxyphenyl)-2-propanone /
Vanillyl methyl ketone 0.525 C10H12O3 180.20 Guaiacols
37 59.059 Levoglucosan 1.20 C6H10O5 162.14 Anhydrosugars
Figure 6-5. Chromatograph of a typical wet-BRH bio-oil bottom layer

71
Table 6-4. Selected chemicals and and average peak area from the wet-BRH bottom layer
Peak RT Chemical name Average
Peak Area (%)
Chemical
Formula RMM Chemical Group
1 6.185 2-methylfuran / Sylvan 4.665 C5H6O 82.10 Furans
2 6.645 1,3-cyclohexadiene 0.86 C3H6O2 74.08 Esters
3 6.806 1-methyl-1,3-
cyclopentadiene 1.105 C4H8O2 88.11 Esters
4 8.507 2,5-Dimethylfuran 1.69 C6H8O 96.13 Furans
5 9.703 2,3-pentanedione 1.05 C5H8O2 100.12 Ketones
6 10.991 Toluene 3.07 C7H8 92.14 Aromatic
Hydrocarbon
7 15.682 m-Xylene 0.97 C8H10 106.17 Aromatic
Hydrocarbon
8 17.820 Furfural 6.34 C5H4O2 96.09 Furans
9 20.166 2-furanmethanol 1.41 C5H6O2 98.10 Alcohols
10 20.902 2-Cyclopenten-1-one, 2-
methyl- 1.225 C6H8O 96.13 Ketones
11 21.683 2-Furyl Methyl Ketone 0.985 C6H6O2 110.11 Ketones
12 23.753 1,2-cyclopentanedione 0.735 C5H6O2 98.10 Ketones
13 25.202 5-Methylfurfural 1.74 C6H6O2 110.11 Furans
14 25.995 3-Methyl-2-Cyclopentenone 0.985 C6H8O 96.13 Ketones
15 29.053
2-cyclopenten-1-one, 2-
hydroxy-3-methyl / Maple
Lactone
3.25 C6H8O2 112.13 Ketones
16 30.617 Phenol 4.535 C6H6O 94.11 Phenols
17 31.663 Guaiacol 8.08 C7H8O2 124.14 Guaiacols
18 33.158 2-Methylphenol 2.02 C7H8O 108.14 Phenols
19 33.664 3-Ethyl-2-hydroxy-2-
cyclopenten-1-one 0.83 C7H10O2 126.15 Ketones
20 34.906 p-cresol 2.65 C7H8O 108.14 Phenols
21 34.998 m-cresol 2.12 C7H8O 108.14 Phenols
22 36.860 p-creosol /
2-methoxy-p-cresol 4.51 C8H10O2 138.17 Guaiacols
23 37.297 2,4-Dimethylphenol 1.41 C8H10O 122.16 Phenols
24 39.217 4-Ethylphenol 8.965 C8H10O 122.16 Phenols
25 40.965 4-Ethylguaiacol 5.065 C9H12O2 152.19 Guaiacols
26 43.264
2-Propenoic acid, 3-(2-
hydroxyphenyl)-, (E)- /
o-Coumaric acid
4.715 C9H8O3 164.16 Organic acids
27 43.563
4-Ethenyl-2-methoxyphenol /
p-Vinylguaiacol /
2-Methoxy-4-vinylphenol
3.225 C9H10O2 150.18 Guaiacols
28 49.473 Isoeugenol 2.23 C10H12O2 164.20 Guaiacols

72
Table 6-5. Comparison of the chemical groups between the peak areas for the top and
bottom wet-BRH bio-oil
Chemical Groups Top (Peak Area, %) Bottom (Peak Area, %)
Aromatic Hydrocarbon 0.00 4.04
Organic Acids 17.65 4.715
Esters 3.84 1.965
Furans 9.99 14.435
Ketones 16.88 9.06
Alcohols 9.19 1.41
Phenols 5.35 21.70
Guaiacols 6.33 23.11
Anhydrosugars 2.16 0.00
Misc. Oxygenated 9.44 0.00
TOTAL 80.81 80.435
Table 6-5 shows the comparison between the chemical groups present from the top and
bottom bio-oil from a wet BRH sample. The analysis showed that the top aqueous layer
contained a high amount of organic acids, alcohols, ketones compared to the bottom organic
layer. Since the top layer has a high amount of water content, it is expected that polar
compounds that contain –OH group such as carboxylic acid and alcohol to be present here.
Anhydrosugars, such as levoglucosan and miscellaneous oxygenated compounds were only
found in the top layers, showing that they are water soluble compounds. The bottom layer
contains high amount of phenols and guaiacols. The result agrees with a study by Song et.
al and Li et. al which found that the upper layer contained acetic acids, alcohols and water-
soluble compounds, and the bottom layer contained high lignin-derived pyrolysis products
[81, 160].
The presence of high organic acid for the top layer explains the low pH value for the top
layer, eventhough the water content is high of up to 70%. The acidity is mostly due to the
presence of acetic acid by which showed a peak area of 14.2 % present from the top phase.
Although the separation of the wet-BRH bio-oil was carried out by a simple decanting
process, the results were comparable to a study by Chen et. al which achieved a separation
of rice husk bio-oil by adding salt solutions. The upper layer of the separated rice husk bio-oil
obtained by Chen et. al was found to contain 16.2% peak area of acetic acid [161].
As for the bottom layer, the chemical groups present were mostly aromatic hydrocarbon,
phenols and guaiacols. Although the bottom layer did not have as much organic acids
compared to the top layer, the pH was not far off above 3. This would suggest that the

73
acidity is derived from phenols and guaiacols which contain acidic functional groups
attached to them.
6.3.3 Characterisation of dry BRH bio-oil
Characterisation of dry BRH bio-oil is discussed in this section. BRH bio-oil characterisation
data is compared with values from other rice husk species in literature which can be seen in
Table 6-6. For the HHV and LHV for wet basis values, even though the experimental sample
is stated dry and ground, the bio-oil values obtained were considered to be wet basis due to
the inclusion of water in the sample.
Table 6-6. Physicochemical properties of rice husk pyrolysis oil
Physicochemical properties
Experimental Literature
DG bio-oil Ji-lu et. al
[79] Lu et. al
[157] Heo et. al
[75] Guo et. al
[162]
Acidity
Acid number (mg KOH/g) 55.54 - - - -
pH 3.00 2.80 3.20 - 3.36
Water content (%) 52.60 25.20 28.00 25.20 33.80
Kinematic Viscosity (cSt) @ 40°C 1.68 128 (20°C) 13.20 - 82.43
Density (kg/m3) @ 25°C 1065 1190 1140 - 1210
Ultimate analysis
C (%) 23.38 41.70 39.92 55.10 35.63
H (%) 10.39 7.70 8.15 7.20 7.00
N (%) 0.51 0.30 0.61 0.70 0.00
S (%) <0.10 0.20 0.30 - -
O (%) * 65.63 50.30 51.02 37.00 57.37
H:C molar ratio 5.33 2.22 2.45 1.57 2.36
O:C molar ratio 2.11 0.90 0.96 0.50 1.21
Higher Heating Value (HHV)
HHV - wet basis (MJ/kg) 13.61 ** 18.42 ** 16.50 23.88 ** 14.75 **
HHV - dry basis (MJ/kg) 28.71 ** 24.62 ** 25.34 ** 24.80 22.28 **
Lower Heating Value (LHV)
LHV - wet basis (MJ/kg) 11.34 ** 17.42 16.47 ** 22.31 ** 13.36
* By difference
** Calculated values

74
6.3.3.1 Acidity and water content
The dry bio-oil sample shows that it has a pH of 3. The acid number has a value of 55 mg
KOH/g, which is higher than either of the top and bottom layer of the wet samples. This is
likely due to the combination of acidic components which is present in previous both top and
bottom layers. The values were in agreement with the rice husk pyrolysis oils from literature
which showed to have a pH of around 2-3 [74, 79].
A value of 52.60 wt. % is obtained for the water content from the DG run. Rice husk pyrolysis
bio-oil literature values show lower water contents of 25 – 34%. This is due to the fast
pyrolysis nature for the literature values, as compared to the DG which was subjected to
intermediate pyrolysis. The nature of intermediate pyrolysis tend to produce water and
organics at a 50:50 basis in bio-oil liquid [30].
6.3.3.2 Viscosity and density
The density of BRH bio-oil is 1065 kg/m3 which is lower than the values from literature.
Oasmaa and Peacocke reported that density of pyrolysis liquid is a function of the water
content [163]. Since about 50% of the bio-oil is water, it would suggest that the density of
water of 998 kg/m3 [164] in BRH bio-oil has an effect on the density of the bio-oil.
The viscosity of the BRH-oil is low with 1.68 cSt, when compared to literature values for rice
husk pyrolysis oils. Viscosity is greatly influenced by the water content in the sample; as the
water content increases, the viscosity of the oil approaches the viscosity of water, as
suggested by Nolte and Liberatore [165].
6.3.3.3 Elemental analysis and HHV
Elemental analysis for dry-BRH bio-oil can be found in table 6-6. The carbon content of
22.38% for BRH bio-oil is lower compared to other rice husk bio-oils with 40-55%. The fact
that the bio-oil contained high water content might have had an influence on the values, due
to the higher hydrogen and oxygen contents compared to other rice husk values. The
sulphur content is insignificant, and a low nitrogen value of 0.51% was obtained.
The H:C and O:C molar ratios was calculated for DG bio-oil sample and the literature
samples. DG bio-oil molar ratios were found to be very high as compared to the literature

75
values, which were considered due to the high water content in the DG sample. A H:C molar
ratio of greater than 2 is possible and occurs frequently in pyrolysis oil when the ratio was
calculated with an as-received basis [166]. This can be seen for all the pyrolysis oil, except
for the values of Heo et al. which was calculated to be 1.57. The initial deduction was due to
the difference in the water content, but this was nullified due to similar water content with the
bio-oil samples of Ji-lu et al. Although the temperature for the reaction condition is similar,
this may be due to the difference in the thermochemical properties of rice husk which
showed a higher volatile content for Heo et. al. Another possible cause was due to the
difference in the purge gas and the condensation medium.
Since the heating values for the bio-oil for DG bio-oil was not able to be determined in the
bomb calorimeter, an alternative way to obtain the heating values is by using correlations
from the elemental analysis of the bio-oils which can be found in Chapter 4, equation 4-4.
The calculated HHV in wet basis was expected to be low with a value of 13.61 MJ/kg, as
compared to around 15-24 MJ/kg from literature. However, the calculated HHV value in dry
basis of 28.71 MJ/kg was calculated for the DG bio-oil. The values were comparable with the
literature.
6.3.3.4 GC-MS analysis
The GC-MS analysis was done for dry-BRH pyrolysis bio-oil. More than 100 peaks were
detected, but around 86 peaks were identified from GC-MS which can be seen in Table 6-7.
Table 6-7. Chemicals and average peak area for dry-BRH pyrolysis bio-oil
Peak RT Chemical Name
Peak Area
%
Chemical
Formula RMM Chemical Group
1 6.103 2-methylfuran / Sylvan 0.44 C5H6O 82.10 Furans
2 6.735
Methyl acetate /
Acetic acid, methyl ester 0.71 C3H6O2 74.08 Esters
3 7.023
Methyl propionate /
Propanoic acid, methyl ester 0.17 C4H8O2 88.11 Esters
4 7.448 Benzene 0.15 C6H6 78.11 Aromatic Hydrocarbon
5 8.414 2,5-Dimethylfuran 0.36 C6H8O 96.13 Furans
6 8.598 3-pentene-2-one, (E)- 0.59 C5H8O 84.12 Ketones
7 9.104 Acetic Acid 10.74 C2H4O2 60.05 Organic acids
8 9.621 2,3-pentanedione 0.59 C5H8O2 100.12 Ketones
9 10.323 Methyl urea 1.19 C2H6N2O 74.08
Nitrogen-containing
compounds
10 10.426 2-methoxytetrahydrofuran 0.42 C5H10O2 102.13 Furans
11 10.875 Toluene 0.70 C7H8 92.14 Aromatic Hydrocarbon
12 11.587 Pyridine 0.22 C5H5N 79.10
Nitrogen-containing
compounds
13 11.886
3-penten-2-one / Methyl propenyl
ketone 0.29 C5H8O 84.12 Ketones
14 13.462 Propanoic acid 1.32 C3H6O2 74.08 Organic acids
76
15 14.462 Cyclopentanone 0.52 C5H8O 84.12 Ketones
16 14.588 1-hydroxy-2-butanone 2.06 C4H8O2 88.11 Ketones
17 15.152 Ethylbenzene & p-xylene 0.18 C8H10 106.17 Aromatic Hydrocarbon
18 15.313 2,2-dimethyl-3-hexanol 0.19 C8H18O 130.23 Alcohols
19 15.543 m-Xylene 0.24 C8H10 106.17 Aromatic Hydrocarbon
20 16.462 2-furanol, tetrahydro-2-methyl- 0.28 C5H10O2 102.13 Alcohols
21 16.635 3-propoxy-1-propene 0.64 C6H12O 100.16 Misc. Oxygenates
22 17.026 2,5-furandione / Maleic Anhydride 0.21 C4H2O3 98.06 Furans
23 17.716 Furfural 6.54 C5H4O2 96.09 Furans
24 17.900 Tetrahydro-2,5-dimethoxyfuran 0.48 C6H12O3 132.16 Furans
25 20.027 2-furanmethanol 3.80 C5H6O2 98.10 Alcohols
26 20.360
1-(acetyloxy)-2-propanone /
Acetol acetate 0.58 C5H8O3 116.12 Misc. Oxygenates
27 20.601 2-ethylhexanal 0.61 C8H16O 128.21 Aldehydes
28 20.774 2-Cyclopenten-1-one, 2-methyl- 0.89 C6H8O 96.13 Ketones
29 21.544 2-Furyl Methyl Ketone 0.71 C6H6O2 110.11 Ketones
30 22.660 2-hexene-1-ol, acetate 0.23 C8H14O2 142.20 Misc. Oxygenates
31 23.614 1,2-cyclopentanedione 2.50 C5H6O2 98.10 Ketones
32 25.040
5-methyl-2-furancarboxaldehyde /
5-methylfurfural 0.76 C6H6O2 110.11 Furans
33 25.140 2,3-pentanedione / Acetyl acetone 0.61 C5H8O2 100.12 Ketones
34 25.292 2-butanone, 1-(acetyloxy)- 0.33 C6H10O3 130.14 Misc. Oxygenates
35 25.660 2,3-dimethyl-2-cyclopenten-1-one 0.24 C7H10O 110.16 Ketones
36 25.833 3-Methyl-2-Cyclopentenone 0.97 C6H8O 96.13 Ketones
37 26.189 2(5H)-Furanone 1.34 C4H4O2 84.07 Furans
38 26.327 Tetrahydro-2-furanmethanol 0.63 C5H10O2 102.13 Alcohols
39 26.994 5-hexen-2-one 0.36 C6H10O 98.14 Ketones
40 27.626 2,2-diethyl-3-methyl-oxazolidine 0.55 C8H17NO 143.23
Nitrogen-containing
compounds
41 28.684 3-methyl-2(5H)-Furanone 0.32 C5H6O2 98.10 Furans
42 28.914
3-methyl-1,2-cyclopentanedione AND
2-cyclopenten-1-one, 2-hydroxy-3-
methyl / Maple Lactone / Corylon 4.18 C6H8O2 112.13 Ketones
43 29.374 2,5-dihydro-3,5-dimethyl-2-furanone 0.44 C6H8O2 112.13 Furans
44 29.742
3,4-dimethyl-2-hydroxycyclopent-2-en-
1-one 0.18 C7H10O2 126.15 Ketones
45 30.443 Phenol 2.97 C6H6O 94.11 Phenols
46 31.490 Guaiacol 6.41 C7H8O2 124.14 Guaiacols
47 31.881 3-ethyl-2-cyclopenten-1-one 0.30 - - Ketones
48 32.984 2-Methylphenol / o-cresol 0.90 C7H8O 108.14 Phenols
49 33.134
Formic acid,2-propenyl ester /
Allyl formate 0.21 C4H6O2 86.09 Esters
50 33.490 3-ethyl-2-hydroxy-2-cyclopenten-1-one 0.77 C7H10O2 126.15 Ketones
51 33.674 Maltol / Larixic acid 0.44 C6H6O3 126.11 Organic acids
52 34.157 4-methyl-4-Hepten-3-one 0.20 C8H14O 126.20 Ketones
53 34.341 4-Methyl-5H-Furan-2-one 0.26 C5H6O2 98.10 Furans
54 34.720 p-cresol 1.58 C7H8O 108.14 Phenols
55 34.812 m-Cresol 0.91 C7H8O 108.14 Phenols
56 35.192 4-ethyl-1,3-benzenediol 0.46 C8H10O2 138.16 Phenols
57 35.629 3-methyl-4-hexen-2-one 0.23 C7H12O 112.17 Ketones
58 36.411 3-buten-2-ol 1.36 C4H8O 72.11 Alcohols
59 36.698 p-creosol / 2-methoxy-p-cresol 3.26 C8H10O2 138.17 Guaiacols
60 36.836 2-ethylphenol 0.32 C8H10O 122.16 Phenols
61 37.100 2,4-Dimethylphenol / 2,4-xylenol 0.71 C8H10O 122.16 Phenols
62 37.859
2-cyclopenten-1-one, 4-hydroxy-3-
methyl-2-(2-propenyl)- / Allethrolone 0.32 C9H12O2 152.19 Misc. Oxygenates
63 38.871
2,3-dimethylphenol / 2,3-xylenol OR
2,5-dimethylphenol / 2,5-xylenol 0.22 C8H10O 122.16 Phenols
64 39.020 4-Ethylphenol 2.78 C8H10O 122.16 Phenols
65 40.251 3,4-dimethylphenol / 3,4-Xylenol 0.20 C8H10O 122.16 Phenols
66 40.412 2-nonene-1-ol 0.27 C9H18O 142.24 Alcohols
67 40.550 1-cyclohexyl-2-buten-1-ol (c,t) 0.22 C10H18O 154.25 Alcohols

77
68 40.780 4-Ethylguaiacol 2.27 C9H12O2 152.19 Guaiacols
69 41.182 4-ethyl-2-methyl-phenol 0.25 C9H12O 136.19 Phenols
70 41.331
3,4-anhydro-d-galactosan OR
Anhydro-d-mannosan OR
2,3-anhydro-d-galactosan 0.45 C6H8O4 144.13 Anhydrosugars
71 41.952 1,4:3,6-dianhydro-α-d-glucopyranose 0.85 C6H8O4 144.13 Anhydrosugars
72 43.056
2-Propenoic acid, 3-(2-hydroxyphenyl)-
, (E)- /
o-Coumaric acid 3.58 C9H8O3 164.16 Organic acids
73 43.378
4-Ethenyl-2-methoxyphenol / p-
Vinylguaiacol / 2-Methoxy-4-
vinylphenol 2.54 C9H10O2 150.18 Guaiacols
74 44.551
4-allyl-2-methoxyphenol / Eugenol /
Caryophillic acid 0.35 C10H12O2 164.20 Guaiacols
75 44.723 2-methoxy-4-propylphenol / Cerulignol 0.44 C10H14O2 166.22 Phenols
76 45.080
5-oxotetrahydrofuran-2-carboxylic
acid, ethyl ester 0.44 C7H10O4 158.15 Misc. Oxygenates
77 45.689 2,6-Dimethoxyphenol / Syringol 1.18 C8H10O3 154.17 Syringols
78 49.276 Isoeugenol 1.53 C10H12O2 164.20 Guaiacols
79 49.748 Hydroquinone / 1,4-benzenediol 1.12 C6H6O2 110.11 Phenols
80 50.035 Isovanillin 0.49 C8H8O3 152.15 Guaiacols
81 51.610
2-methyl-1,4-benzenediol / 2,5-
toluenediol 0.28 C7H8O2 124.14 Phenols
82 53.473
1-(4-hydroxy-3-methoxyphenyl)-
ethanone / Acetovanillone 0.41 C9H10O3 166.17 Guaiacols
83 55.462
1-(4-hydroxy-3-methoxyphenyl)-2-
propanone / Guaiacylacetone /
Vanillyl methyl ketone 0.76 C10H12O3 180.20 Guaiacols
84 56.267 3,4-dihydrocoumarin-6-ol 0.33 - - Misc. Oxygenates
85 58.854 Levoglucosan 2.35 C6H10O5 162.14 Anhydrosugars
86 60.268
4-Allyl-2,6-dimethoxyphenol OR
Methoxyeugenol 0.24 C11H14O3 194.23 Syringols
Table 6-8. Chemical groups and the peak areas for dry BRH bio-oil
Table 6-7 shows a more thorough selection of chemicals detected from dry BRH bio-oil, with
syringols and nitrogen-containing compounds added into the chemical group list. These
Chemical Groups Peak Areas (%)
Aromatic Hydrocarbon 1.27
Organic Acids 16.06
Esters 1.08
Furans 11.55
Aldehydes 0.61
Ketones 16.14
Alcohols 6.74
Phenols 13.12
Guaiacols 18.00
Syringols 1.41
Anhydrosugars 3.65
Misc. Oxygenated 2.85
Nitrogen-containing compounds 1.96
TOTAL 94.41

78
chemical compounds are also detected in other pyrolysis bio-oils. Majority of the chemical
groups found in the bio-oil are organic acids, furans, ketones, phenols and guaiacols which
can be seen from Table 6-8.
The aromatic hydrocarbon detected consists of benzene, toluene and xylenes. The
aromatics present in the non-catalytic runs are most likely due to the presence of alkali
metals in the feedstock itself, which has a catalytic effect on its own during pyrolysis.
Toluene was detected with a peak area of 0.70 %, benzene with 0.15%, ethylbenzene or p-
xylene with 0.18% and m-xylene with 0.24 %. Polyaromatic hydrocarbons (PAH) were not
detected in the bio-oil, compared to other rice husk bio-oil from literature [53], which might be
due to their nature of fast pyrolysis conditions, i.e. short residence time and higher
temperatures.
Other notable chemicals present in the oils are acetic acid (10.74%), furfural (6.54%), phenol
(2.97%), guaiacol (6.41%) and levoglucosan (2.35%).
6.4 Summary
The separation of the bio-oil phases derived from the pyrolysis of wet BRH, gives the
advantage of reducing the acidity of the bio-oil by removing the upper layer. Although that
said, analysing the separate phases of the bio-oil restrict the essential characterisation
analyses such as viscosity and density due to the limited quantity available, especially the
bottom organic-rich phase. Therefore drying the feedstock lead to a single phase bio-oil
sample, and was chosen to be the ideal representative sample for comparison in the next
sequence of catalytic pyrolysis experiments. Characterisation of the bio-oil from dry-BRH
was done, and compared with the values from literature. From this point onwards, the dry
BRH bio-oil is referred to as non-catalytic BRH bio-oil.

79
7 CATALYTIC PYROLYSIS STUDIES
7.1 Introduction
This chapter discusses the results from the catalytic pyrolysis experiments of Brunei rice
husks. The experimental setup is a closed-coupled catalytic pyrolysis system which
upgrades the pyrolysis vapour directly in-situ after generation. Catalysts include commercial
catalysts (ZSM-5, Al-MCM-41 and Al-MSU-F) and a natural catalyst – Brunei rice husk ash
(BRHA), which was exploited due to the high ash content. These catalysts, bound onto a
ceramic monolith using montmorillonite clay were prepared. A total of 13 experiments were
executed, which includes the four main catalysts and the binder alone, two regenerated
catalysts (ZSM-5 and Al-MCM-41) and six mixtures of the catalysts stacked in series. The
mixtures of catalysts were denoted as ZSM-5/Al-MCM-41 or Al-MCM-41/BRHA, whereby the
first catalyst mentioned would be the first catalyst to contact the pyrolysis vapour. These
catalysts aim to produce bio-oil liquid with desirable qualities which would be judged from the
characterisation results of the bio-oils. Various criteria were proposed for the catalytic runs
which were deemed favourable for bio-oil, which includes a reduction in the acidity and
maximising the aromatic hydrocarbon contents and phenols content. The selected catalyst
run will be utilised for optimisation experiments in the next chapter.
7.2 Catalytic pyrolysis reactor setup and conditions
Figure 7-1. Schematic diagram of closed-coupled catalytic pyrolysis rig setup

80
The setup shown in Figure 7-1 and conditions for the catalytic pyrolysis was similar to the
non-catalytic reactor setup in Chapter 6.2, except that the secondary reactor contained the
catalyst materials. The catalyst is attached on a monolith ceramic using a binder.
Monoliths catalysts structure are used due to their excellent pressure drop to geometric
surface area compared to structures such as pellets and foams, therefore ideal for small
reactors [112]. Besides the advantage of low-pressure drop and uniform flow distribution, the
ease of scale-up is another benefit [113]. In this study, the monolith is only used as a
catalyst support and the catalysts are attached to the monolith using a binder, unlike other
studies in literatures where zeolites are formed in-situ and synthesised in the honeycomb
structure. Clay binders such as montmorillonite are used due to the wet binding properties
and their dispersability features in aqueous suspensions during mixing. The catalysts to
binder ratio should also be reasonably high, to prevent a drop in the toluene conversion,
which was studied by Uguina et al. [115]. Antia and Govind concluded that low-coking
zeolites such as ZSM-5 are ideally suited to monolithic reactor configuration under gaseous
conditions [113].
This particular reactor setup is a closed-coupled catalytic pyrolysis system which aims to
upgrade the bio-oil online directly after the pyrolysis vapours are formed from the primary
fixed-bed reactor. As mentioned in the previous chapter, the catalyst-filled monolith was
introduced into the secondary reactor.
7.3 Catalyst preparation
A ceramic monolith was cut into a cylindrical piece with a diameter of 18 mm and length 20
mm, which acts as a catalyst support. Four different catalysts are employed in these
experiments, namely ZSM-5, Al-MCM-41, Al-MSU-F and BRHA. Commercial catalysts used
in these experiments are ZSM-5 obtained from Acros Organics, while Al-MCM-41 and Al-
MSU-F were obtained from Sigma-Aldrich. Brunei rice husk ash (BRHA) was obtained by
ashing the rice husk at 550°C for 3 hours. A montmorillonite clay binder (K30) obtained from
Sigma-Aldrich is used to attach the catalysts onto the ceramic monolith catalyst support.
The catalysts were grounded and mixed with a montmorillonite clay binder at a ratio of 3:1,
and for BRHA a ratio of 2:1 was used. The catalyst and binder were stirred in HPLC grade
water at 60°C for 2 hrs, to ensure the catalyst was equally dispersed. The catalyst/binder
paste mixture was then coated onto the ceramic monolith support. The catalyst coated

81
monolith are then dried to remove moisture, and calcined at 550°C for at least 3 hrs. The
catalysts were kept in a dessicator throughout to prevent moisture build up. The catalyst
weight can be determined by subtracting the weight of the dry catalyst-filled monolith with
the weight of the empty dry monolith. The weight of the catalysts on the cordierite support is
less than 1g, resulting in a feed-to-catalyst ratio of about less than 100:1.
Regenerated catalysts were employed in the pyrolysis experiments. ZSM-5 and Al-MCM-41,
which have shown to be strong catalysts, were re-used after a regeneration procedure. The
coked catalysts were subjected to a temperature of 550°C for 3 hrs to remove the surface
coking, and put in a dessicator until prior to pyrolysis experiments. The catalysts were
utilised in the same manner as the fresh catalyst. Figure 7-2 below shows the empty
monolith catalyst support, the catalyst-filled monolith before the experiment and the catalyst
coking after the pyrolysis experiments.
Figure 7-2. Empty monolith catalyst support (left), catalyst-filled monolith (middle) and
coking on the catalyst after pyrolysis experiment (right)
7.4 Catalytic pyrolysis experiments
The procedure for the preparation of biomass was similar to Chapter 6. The moisture in the
biomass was measured using a Sartorius MA35 moisture analyser prior to pyrolysis to
ensure the biomass moisture was comparable. A total of 13 experiments were recorded: four
different catalysts and two regenerated catalysts (ZSM-5 and Al-MCM-41), the binder only,
and six combinations of the initial four catalysts. The effect of the binder towards the
pyrolysis vapour was studied in this experiment. The combinations of the four catalysts were
also studied, which involves stacking the monolith catalysts arrangement in series, and not
physically mixing the catalysts during the catalyst preparation. The amount of catalysts for
the multiple catalysts was adjusted similar to the amount present in a single monolith
catalyst.

82
7.4.1 Mass balance summary
The mass balance for the catalytic pyrolysis experiments can be seen in Table 7-1. The run
name, average catalyst bed temperature, product yield (wt. %) and gases composition were
noted. The closure for the mass balance was assumed to be 100%. The average catalytic
bed temperature was measured at a range of 490 to 540°C for the various catalytic runs.
Table 7-1. Mass balance for non-catalytic and catalytic pyrolysis experiments
Run Name Average catalytic bed
temperature (°C)
Product yield (wt. %) Gases composition (vol. %)
Liquid Char Gasesa CH4 CO CO2
No Catalyst 488 39.61 41.92 18.47 2.06 9.14 75.40
Binder 523 39.97 43.26 16.77 2.71 17.60 65.89
ZSM-5 499 38.29 42.27 19.44 2.86 3.38 83.19
Al-MCM-41 531 39.98 43.15 16.87 1.72 11.28 74.20
Al-MSU-F 535 39.59 43.31 17.1 1.49 7.03 78.80
BRHA 539 38.29 42.27 19.44 4.65 7.76 76.33
ZSM-5 Regen 529 39.47 43.12 17.41 1.26 8.94 77.24
Al-MCM-41 Regen 523 39.86 42.99 17.15 3.46 15.71 67.51
ZSM-5/Al-MSU-F 517 39.74 43.18 17.08 0.56 3.38 83.08
ZSM-5/Al-MCM-41 518 39.28 42.81 17.91 0.23 1.82 85.50
Al-MSU-F/BRHA 528 39.08 43.18 17.74 2.99 10.52 74.35
Al-MCM-41/Al-MSU-F 513 38.95 43.2 17.85 2.02 12.91 72.95
ZSM-5/BRHA 529 38.85 44.06 17.09 1.43 10.88 75.02
Al-MCM-41/BRHA 532 39.74 43.22 17.04 1.51 10.19 75.55 a by difference
The char yield is consistent due to the similar pyrolysis conditions in the fixed-bed reactor.
The char value was taken as the weight of the rice husk char remained in the primary reactor
and the amount of coke on the catalyst. The coke deposit on the char is calculated by
subtracting the final weight of the coked monolith catalyst with the initial weight of the
monolith catalysts. The amount of coke is very low as compared to the amount of BRH char,
but was included in the char yield nevertheless.
The yield for liquids is found to be analogous throughout, but the most decrease was seen
for ZSM-5 and BRHA in comparison with the non-catalytic run. The significant change that
can be observed is the increase in the gases yield for both of the runs. Most of the gas yield
for the catalytic runs decreased as compared to the non catalytic runs.
The volumetric composition of the gases is shown in Table 7-1. The composition of CO, CO2
and CH4 is seen to vary with the type of catalyst. Majority of the gases composition detected

83
was CO2. An increase in CO2 is seen to be more pronounced for the ZSM-5, regenerated
ZSM-5, ZSM-5/Al-MSU-F and ZSM-5/Al-MCM-41 runs. This can be attributed to the
decarboxylation and cracking effects of most catalyst on the pyrolysis vapours. The
suppressed value of CH4 composition for runs such as ZSM-5/Al-MCM-41 and ZSM-5/Al-
MSU-F may mean that at the peak temperature of 450°C, the decarboxylation process was
more distinct as compared to methane generation.
An increase in CO and a decrease in CO2 were detected for the binder, Al-MCM-41,
regenerated Al-MCM-41, Al-MSU-F/BRHA, Al-MCM-41/Al-MSU-F. This effect for Al-MCM-41
was also established by Antonakou et al. [92] and Iliopoulou et al. [93]. As for the binder, the
generation of CO2 is the lowest compared to the rest of the catalytic run which indicate less
activity.
7.4.2 Pyrolysis liquid bio-oil characterisation
The catalytic pyrolysis bio-oil were characterised in the same approach as the procedures in
Chapter 4 to compare with the non-catalytic pyrolysis runs. Water content, elemental
analysis, heating values (HHV), acidity (pH and acid number), viscosity, density and the
chemical composition using GC-MS were determined.
7.4.2.1 Water content
The water content is one of the essential analyses for assessing the bio-oil quality. The
water content measured here includes the reaction water from pyrolysis and the moisture
from biomass (1.50%). The drying time for the biomass was kept constant to minimise error
from additional or losses of water, as biomass is one of the key sources of water.
From Table 7-2, the range of water content produced from the pyrolysis runs are from
51.48% (Binder) up to 57.44% (ZSM-5/Al-MCM-41). The catalytic runs showed an increase
in the water content, except for the binder and regenerated Al-MCM-41 runs. These indicate
that the catalysts are involved in the formation of water through reactions such cracking and
dehydration.
Fresh catalytic BRH pyrolysis bio-oil does not show a phase separation, but will separate
into two layers if left for a few weeks in storage. The ageing effect however was not studied,
and only fresh bio-oil was used throughout these experiments.

84
Table 7-2. Water content in catalytic pyrolysis bio-oil
Run Name Water content (%)
No Catalyst 52.60 ± 0.51
Binder 51.48 ± 0.60
ZSM-5 55.56 ± 0.38
Al-MCM-41 54.66 ± 0.40
Al-MSU-F 54.64 ± 0.08
BRHA 55.43 ± 0.47
ZSM-5 Regen 53.16 ± 0.37
Al-MCM-41 Regen 52.35 ± 0.29
ZSM-5/Al-MSU-F 57.42 ± 0.11
ZSM-5/Al-MCM-41 57.44 ± 0.21
Al-MSU-F/BRHA 56.96 ± 0.35
Al-MCM-41/Al-MSU-F 55.15 ± 0.31
ZSM-5/BRHA 53.51 ± 0.45
Al-MCM-41/BRHA 52.71 ± 0.32
7.4.2.2 Viscosity and Density
The change in kinematic viscosity and density of bio-oil for the catalytic runs can be seen in
Table 7-3. As the viscosity of bio-oil is influenced by the water content in the sample, the
viscosity values are lower when compared with the rice husk pyrolysis bio-oil from
literatures. But a change in the values of the viscosity and density can be seen from the
various catalysts used for upgrading. All of the values except for ZSM-5/BRHA decrease the
viscosity in the bio-oil. The range of values obtained for the kinematic viscosity of the bio-oil
is seen to range from 1.49 (Al-MSU-F) to 1.68 (ZSM-5/BRHA).
A higher density value for bio-oil may mean that that the bio-oil contain more of the large
molecular compounds. With the aid of catalysts, it is hoped that the pyrolysis vapour will
break the heavy molecular compounds into smaller ones. It can be deduced that all the
catalyst reduced the density of the pyrolysis bio-oil. A study done by Cao et al. showed that
the density and viscosity of the bio-oil was reduced by MCM-41 and ZSM-5, but more so for
the former catalyst [167]. In this study, both catalysts have shown a reduction in the viscosity
and density of the bio-oil, but ZSM-5 was more pronounced compared to Al-MCM-41. A
similar trend was found also for the regenerated catalysts.
The regenerated ZSM-5 was found to have a value of 1.62 cSt and 1049 kg/m3, as
compared to the regenerated Al-MCM-41 with 1.65 cSt and 1050 kg/m3 for the viscosity and
density respectively. The viscosity value for the oil from fresh and regenerated Al-MCM-41

85
was similar, as compared to the fresh and regenerated ZSM-5 which showed an increase in
the viscosity from 1.55 to 1.62 cSt. This might be due to a less cracking activity of the higher
molecular compounds, which might suggest a decrease in the catalyst activity.
Table 7-3. Viscosity and density for the non-catalytic and catalytic BRH bio-oil
Run Name Kinematic Viscosity (cSt) Density (kg/m3) @ 25°C
No Catalyst 1.68 1065
Binder 1.66 1052
ZSM-5 1.55 1053
Al-MCM-41 1.65 1058
Al-MSU-F 1.49 1059
BRHA 1.57 1052
ZSM-5 Regen 1.62 1049
Al-MCM-41 Regen 1.65 1050
ZSM-5/Al-MSU-F 1.56 1053
ZSM-5/Al-MCM-41 1.53 1051
Al-MSU-F/BRHA 1.51 1049
Al-MCM-41/Al-MSU-F 1.67 1051
ZSM-5/BRHA 1.68 1053
Al-MCM-41/BRHA 1.63 1055
7.4.2.3 Elemental analysis and heating values
The elemental analysis, molar ratio and the HHV for the catalytic runs can be found in Table
7-4. From the elemental analysis, we can regard the sulphur values are low for BRH
pyrolysis bio-oil, therefore eliminating the risks of catalyst poisoning. The nitrogen values
were also low when compared to the other elements besides sulphur. All the run decreased
the nitrogen, which range from 0.11 wt. % to 0.49 wt. %.
As mentioned in Chapter 6, the carbon values are low as compared to the values in the
literature due to the difference in the pyrolysis type. Carbon values range from 19.99 wt. %
for ZSM-5 to 33.20 wt. % for ZSM-5/BRHA. Hydrogen values range from 9.15 wt. % for Al-
MCM-41/BRHA to 11.38 wt. % for ZSM-5.
The oxygen content is high when compared to other literature values due to the sample
analysed in this work included the total liquid fractions, i.e. fresh bio-oil sample. Most authors
compare the oxygen content of the bio-oil to explain the catalyst effectiveness of the
deoxygenation process. But, the values of oxygen from the elemental analyses are quite
indefinite, due to the inclusion of the oxygen value from the water present in the bio-oil from

86
the aqueous phase. Moreover, the water content varies with each catalyst, making it difficult
to compare. The oxygen content would therefore only be comparable if the bio-oil was
separated into the organic or aqueous phases.
Table 7-4. Elemental analysis, molar ratio and higher heating value (HHV) for the non-
catalytic and catalytic BRH bio-oil
Run Name
Ultimate Analysis (wt. %, dry basis) Molar ratio HHV (MJ/kg)
C H N S O OC HC Wet basis Dry basis
No Catalyst 23.38 10.39 0.51 <0.10 65.63 2.11 5.33 13.61 28.71
Binder 24.26 9.75 0.19 <0.10 65.82 2.04 4.82 13.13 27.07
ZSM-5 19.99 11.38 0.41 <0.10 68.13 2.56 6.83 13.33 30.01
Al-MCM-41 22.51 11.34 0.35 <0.10 65.71 2.19 6.05 14.41 31.79
Al-MSU-F 25.63 10.67 0.49 <0.10 63.12 1.85 5.00 14.98 33.02
BRHA 31.95 10.16 0.38 <0.10 57.42 1.35 3.82 17.17 38.53
ZSM-5 Regen 24.96 10.06 0.18 <0.10 64.81 1.95 4.83 13.85 29.57
Al-MCM-41 Regen 25.58 10.17 0.20 <0.10 64.06 1.88 4.77 14.28 29.96
ZSM-5/Al-MSU-F 23.62 9.65 0.10 <0.10 66.63 2.12 4.90 12.72 29.87
ZSM-5/Al-MCM-41 21.49 9.80 0.12 <0.10 68.60 2.39 5.47 11.94 28.05
Al-MSU-F/BRHA 22.55 9.72 0.11 <0.10 67.62 2.25 5.17 12.33 28.64
Al-MCM-41/Al-MSU-F 26.20 9.53 0.11 <0.10 64.16 1.84 4.36 13.73 30.61
ZSM-5/BRHA 33.20 9.16 0.21 <0.10 57.44 1.30 3.31 16.43 35.35
Al-MCM-41/BRHA 33.19 9.15 0.18 <0.10 57.49 1.30 3.31 16.41 34.71
Therefore, an alternative method of comparison using the OC and HC molar ratio would be
much more suitable in this case. A higher HC molar ratio and a lower OC ratio are
favourable for fuels. HC molar ratio is an important measure of fuel quality, so a lower
hydrogen contents in pyrolysis indicate a lower quality fuel oil and may require additional
upgrading [166]. The comparison of biofuels (such as pyrolysis oils) and fossil fuels (such as
coals) shows clearly the proportion of oxygen and hydrogen compared with carbon, reduces
the energy value of a fuel, due to the lower energy contained in carbon-oxygen and carbon-
hydrogen bonds, than in carbon-carbon bonds [168].
The values for HC and OC molar ratio are higher in this study as compared to literature
values, which is due to the inclusion of the hydrogen and oxygen values from water.
However, the values can be compared with each other due to the similar feedstock and
pyrolysis conditions, i.e. temperature and purge gas. A graph of HC and OC molar ratio
versus the water content is illustrated in Figure 7-3. As high HC ratio is favourable, we can
analyse which catalysts are ideal in this sense. It is interesting to note that the HC and OC
molar ratio values do not correlate with the water content. This may suggest that water in the
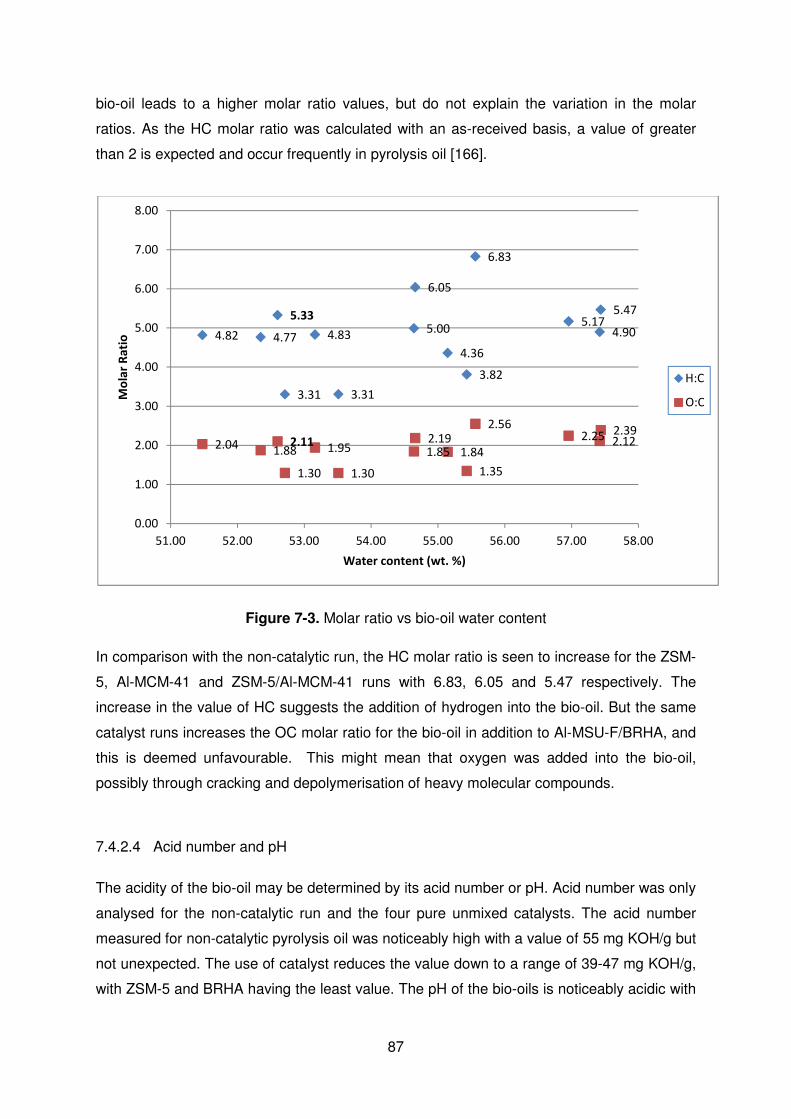
87
bio-oil leads to a higher molar ratio values, but do not explain the variation in the molar
ratios. As the HC molar ratio was calculated with an as-received basis, a value of greater
than 2 is expected and occur frequently in pyrolysis oil [166].
Figure 7-3. Molar ratio vs bio-oil water content
In comparison with the non-catalytic run, the HC molar ratio is seen to increase for the ZSM-
5, Al-MCM-41 and ZSM-5/Al-MCM-41 runs with 6.83, 6.05 and 5.47 respectively. The
increase in the value of HC suggests the addition of hydrogen into the bio-oil. But the same
catalyst runs increases the OC molar ratio for the bio-oil in addition to Al-MSU-F/BRHA, and
this is deemed unfavourable. This might mean that oxygen was added into the bio-oil,
possibly through cracking and depolymerisation of heavy molecular compounds.
7.4.2.4 Acid number and pH
The acidity of the bio-oil may be determined by its acid number or pH. Acid number was only
analysed for the non-catalytic run and the four pure unmixed catalysts. The acid number
measured for non-catalytic pyrolysis oil was noticeably high with a value of 55 mg KOH/g but
not unexpected. The use of catalyst reduces the value down to a range of 39-47 mg KOH/g,
with ZSM-5 and BRHA having the least value. The pH of the bio-oils is noticeably acidic with
5.33
4.82
6.83
6.05
5.00
3.82
4.834.77 4.90
5.475.17
4.36
3.313.31
2.112.04
2.562.191.85
1.35
1.951.882.122.392.25
1.84
1.301.30
0.00
1.00
2.00
3.00
4.00
5.00
6.00
7.00
8.00
51.00 52.00 53.00 54.00 55.00 56.00 57.00 58.00
Mo
lar
Ra
tio
Water content (wt. %)
H:C
O:C
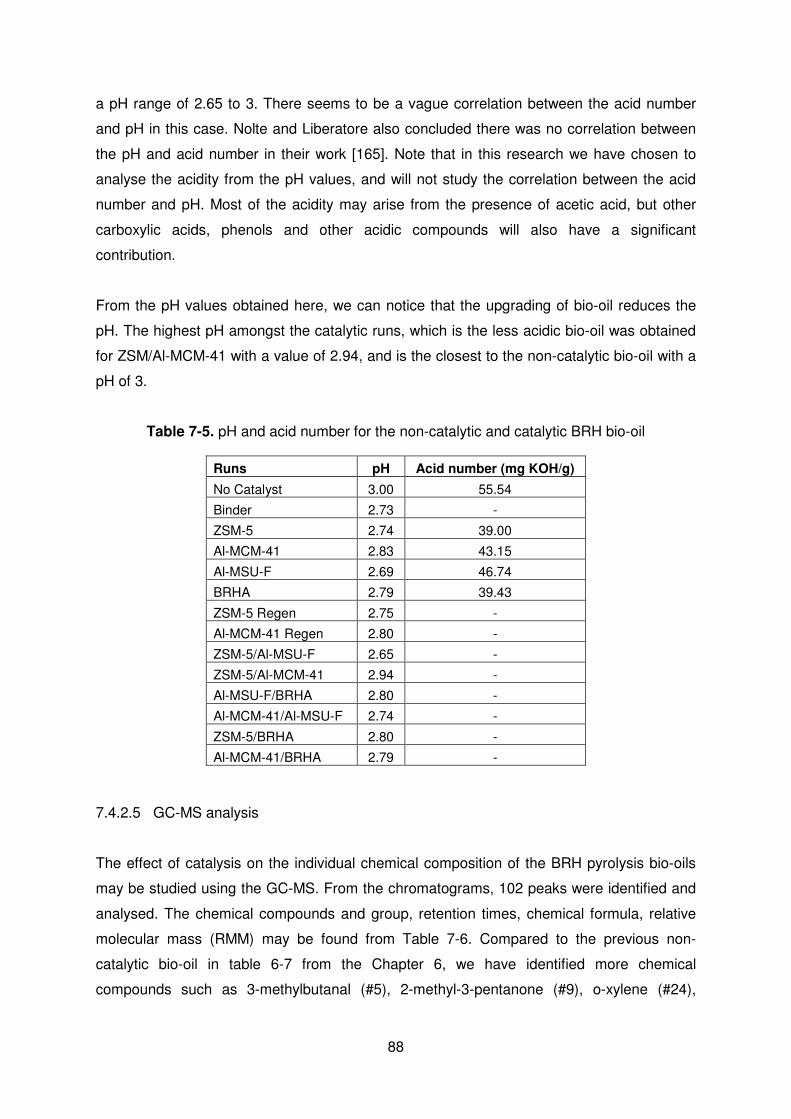
88
a pH range of 2.65 to 3. There seems to be a vague correlation between the acid number
and pH in this case. Nolte and Liberatore also concluded there was no correlation between
the pH and acid number in their work [165]. Note that in this research we have chosen to
analyse the acidity from the pH values, and will not study the correlation between the acid
number and pH. Most of the acidity may arise from the presence of acetic acid, but other
carboxylic acids, phenols and other acidic compounds will also have a significant
contribution.
From the pH values obtained here, we can notice that the upgrading of bio-oil reduces the
pH. The highest pH amongst the catalytic runs, which is the less acidic bio-oil was obtained
for ZSM/Al-MCM-41 with a value of 2.94, and is the closest to the non-catalytic bio-oil with a
pH of 3.
Table 7-5. pH and acid number for the non-catalytic and catalytic BRH bio-oil
Runs pH Acid number (mg KOH/g)
No Catalyst 3.00 55.54
Binder 2.73 -
ZSM-5 2.74 39.00
Al-MCM-41 2.83 43.15
Al-MSU-F 2.69 46.74
BRHA 2.79 39.43
ZSM-5 Regen 2.75 -
Al-MCM-41 Regen 2.80 -
ZSM-5/Al-MSU-F 2.65 -
ZSM-5/Al-MCM-41 2.94 -
Al-MSU-F/BRHA 2.80 -
Al-MCM-41/Al-MSU-F 2.74 -
ZSM-5/BRHA 2.80 -
Al-MCM-41/BRHA 2.79 -
7.4.2.5 GC-MS analysis
The effect of catalysis on the individual chemical composition of the BRH pyrolysis bio-oils
may be studied using the GC-MS. From the chromatograms, 102 peaks were identified and
analysed. The chemical compounds and group, retention times, chemical formula, relative
molecular mass (RMM) may be found from Table 7-6. Compared to the previous non-
catalytic bio-oil in table 6-7 from the Chapter 6, we have identified more chemical
compounds such as 3-methylbutanal (#5), 2-methyl-3-pentanone (#9), o-xylene (#24),

89
styrene (#26), cyclohexanone (#29), trimethylbenzenes (#35), 2-hydroxybenzaldehyde
(#47), trimethylphenols (#70), dimethoxytoluene (#73), 1-indanone (#81), 3-ethyl-5-
methylphenol (#82), trans-m-propenyl guaiacol (#89), 2,6-dimethoxybenzaldehyde (#90),
chavicol (#91), trimethoxytoluene (#96) and 6-methoxycoumaran-7-ol-3-one (#100). These
extra compounds may be present initially but undetectable in the non-catalytic BRH oil due
to their minute concentrations, or are evidently chemical products formed from the catalytic
reactions.
Table 7-6. Identified chemical compound in bio-oils from catalytic pyrolysis of Brunei rice
husks
Peak RT Chemical Name Chemical Formula RMM Chemical Group
1 6.103 2-methylfuran / Sylvan C5H6O 82.10 Furans
2 6.735 Methyl acetate / Acetic acid, methyl ester C3H6O2 74.08 Esters
3 7.023 Methyl propionate / Propanoic acid, methyl ester
C4H8O2 88.11 Esters
4 7.448 Benzene C6H6 78.11 Aromatic Hydrocarbon
5 7.933 3-methylbutanal C5H10O 86.13 Aldehydes (CF)
6 8.414 2,5-Dimethylfuran C6H8O 96.13 Furans
7 8.598 3-pentene-2-one, (E)- C5H8O 84.12 Ketones
8 9.104 Acetic Acid C2H4O2 60.05 Organic acids
9 9.621 3-pentanone, 2-methyl / Ethyl isopropyl ketone
C6H12O 100.12 Ketones (CF)
10 10.323 Methyl urea C2H6N2O 74.08 Nitrogen-containing compounds
11 10.426 2-methoxytetrahydrofuran C5H10O2 102.13 Furans
12 10.875 Toluene C7H8 92.14 Aromatic Hydrocarbon
13 11.587 Pyridine C5H5N 79.10 Nitrogen-containing compounds
14 11.886 3-penten-2-one / Methyl propenyl ketone C5H8O 84.12 Ketones
15 13.462 Propanoic acid C3H6O2 74.08 Organic acids
16 14.462 Cyclopentanone C5H8O 84.12 Ketones
17 14.588 1-hydroxy-2-butanone C4H8O2 88.11 Ketones
18 15.152 Ethylbenzene & p-xylene C8H10 106.17 Aromatic Hydrocarbon
19 15.313 2,2-dimethyl-3-hexanol C8H18O 130.23 Alcohols
20 15.543 m-Xylene C8H10 106.17 Aromatic Hydrocarbon
21 16.202 3-furaldehyde / 3-furfural C5H4O2 96.08 Furans
22 16.462 2-furanol, tetrahydro-2-methyl- C5H10O2 102.13 Alcohols

90
23 16.635 3-propoxy-1-propene C6H12O 100.16 Misc. Oxygenates
24 16.982 o-xylene C8H10 106.17 Aromatic Hydrocarbon (CF)
25 17.026 2,5-furandione / Maleic Anhydride C4H2O3 98.06 Furans
26 17.350 Styrene C8H8 104.15 Aromatic Hydrocarbon (CF)
27 17.716 Furfural C5H4O2 96.09 Furans
28 17.900 Tetrahydro-2,5-dimethoxyfuran C6H12O3 132.16 Furans
29 19.774 Cyclohexanone C6H10O 98.14 Ketones (CF)
30 20.027 2-furanmethanol C5H6O2 98.10 Alcohols
31 20.360 1-(acetyloxy)-2-propanone / Acetol acetate C5H8O3 116.12 Misc. Oxygenates
32 20.601 2-ethylhexanal C8H16O 128.21 Aldehydes
33 20.774 2-Cyclopenten-1-one, 2-methyl- C6H8O 96.13 Ketones
34 21.544 2-Furyl Methyl Ketone C6H6O2 110.11 Ketones
35 22.259 1,2,3-Trimethylbenzene / Hemellitol OR 1,3,5-trimethylbenzene / Mesitylene
C9H12 120.19 Aromatic Hydrocarbon (CF)
36 22.660 2-hexene-1-ol, acetate C8H14O2 142.20 Misc. Oxygenates
37 23.614 1,2-cyclopentanedione C5H6O2 98.10 Ketones
38 25.040 5-methyl-2-furancarboxaldehyde /
5-methylfurfural
C6H6O2 110.11 Furans
39 25.140 2,3-pentanedione / Acetyl propionyl C5H8O2 100.12 Ketones
40 25.292 2-butanone, 1-(acetyloxy)- C6H10O3 130.14 Misc. Oxygenates
41 25.660 2,3-dimethyl-2-cyclopenten-1-one C7H10O 110.16 Ketones
42 25.833 3-Methyl-2-Cyclopentenone C6H8O 96.13 Ketones
43 26.189 2(5H)-Furanone C4H4O2 84.07 Furans
44 26.327 Tetrahydro-2-furanmethanol C5H10O2 102.13 Alcohols
45 26.994 5-hexen-2-one C6H10O 98.14 Ketones
46 27.626 2,2-diethyl-3-methyl-oxazolidine C8H17NO 143.23 Nitrogen-containing compounds
47 28.353 2-hydroxybenzaldehyde C7H6O2 122.12 Aldehydes (CF)
48 28.684 3-methyl-2(5H)-Furanone C5H6O2 98.10 Furans
49 28.914 3-methyl-1,2-cyclopentanedione AND 2-cyclopenten-1-one, 2-hydroxy-3-methyl /
Maple Lactone / Corylon / Cycloten
C6H8O2 112.13 Ketones
50 29.374 2,5-dihydro-3,5-dimethyl-2-furanone C6H8O2 112.13 Furans
51 29.742 3,4-dimethyl-2-hydroxycyclopent-2-en-1-one C7H10O2 126.15 Ketones
52 30.443 Phenol C6H6O 94.11 Phenols
53 31.490 Guaiacol C7H8O2 124.14 Guaiacols
54 31.881 3-ethyl-2-cyclopenten-1-one - - Ketones

91
55 32.984 2-Methylphenol / o-cresol C7H8O 108.14 Phenols
56 33.134 Formic acid,2-propenyl ester / Allyl formate C4H6O2 86.09 Esters
57 33.490 3-ethyl-2-hydroxy-2-cyclopenten-1-one C7H10O2 126.15 Ketones
58 33.674 Maltol / Larixic acid C6H6O3 126.11 Organic acids
59 34.157 4-methyl-4-Hepten-3-one C8H14O 126.20 Ketones
60 34.341 4-Methyl-5H-Furan-2-one C5H6O2 98.10 Furans
61 34.720 p-cresol C7H8O 108.14 Phenols
62 34.812 m-Cresol C7H8O 108.14 Phenols
63 35.192 4-ethyl-1,3-benzenediol C8H10O2 138.16 Phenols
64 35.629 3-methyl-4-hexen-2-one C7H12O 112.17 Ketones
65 36.411 3-buten-2-ol C4H8O 72.11 Alcohols
66 36.698 p-creosol / 2-methoxy-p-cresol C8H10O2 138.17 Guaiacols
67 36.836 2-ethylphenol C8H10O 122.16 Phenols
68 37.100 2,4-Dimethylphenol / 2,4-xylenol C8H10O 122.16 Phenols
69 37.859 2-cyclopenten-1-one, 4-hydroxy-3-methyl-2-(2-propenyl)- / Allethrolone
C9H12O2 152.19 Misc. Oxygenates
70 38.125 2,4,6-trimethylphenol / Mesitol OR 3,4,5-trimethylphenol
C9H12O 136.19 Phenols (CF)
71 38.871 2,3 ; 2,4 ; 2,5-dimethylphenol / 2,3; 2,4; 2,5-xylenol
C8H10O 122.16 Phenols
72 39.020 4-Ethylphenol C8H10O 122.16 Phenols
73 39.861 3,4; 2,6-dimethoxytoluene C9H8O3 152.19 Misc. Oxygenates (CF)
74 40.251 3,4-dimethylphenol / 3,4-Xylenol C8H10O 122.16 Phenols
75 40.412 2-nonene-1-ol C9H18O 142.24 Alcohols
76 40.550 1-cyclohexyl-2-buten-1-ol (c,t) C10H18O 154.25 Alcohols
77 40.780 4-Ethylguaiacol C9H12O2 152.19 Guaiacols
78 41.182 4-ethyl-2-methyl-phenol C9H12O 136.19 Phenols
79 41.331 3,4-anhydro-d-galactosan OR Anhydro-d-mannosan OR 2,3-anhydro-d-galactosan
C6H8O4 144.13 Anhydrosugars
80 41.952 1,4:3,6-dianhydro-α-d-glucopyranose C6H8O4 144.13 Anhydrosugars
81 42.103 2,3-dihydro-1H-Inden-1-one / 1-Indanone C9H8O 132.16 Ketones (CF)
82 42.805 3-ethyl-5-methylphenol C9H12O 136.19 Phenols (CF)
83 43.056 2-Propenoic acid, 3-(2-hydroxyphenyl)-, (E)- / o-Coumaric acid
C9H8O 164.16 Organic acids
84 43.378 4-Ethenyl-2-methoxyphenol / p-Vinylguaiacol / 2-Methoxy-4-vinylphenol
C9H10O2 150.18 Guaiacols
85 44.551 4-allyl-2-methoxyphenol / Eugenol / Caryophillic acid
C10H12O2 164.20 Guaiacols
86 44.723 2-methoxy-4-propylphenol / Cerulignol C10H14O2 166.22 Phenols

92
87 45.080 5-oxotetrahydrofuran-2-carboxylic acid, ethyl ester
C7H10O4 158.15 Misc. Oxygenates
88 45.689 2,6-Dimethoxyphenol / Syringol C8H10O3 154.17 Syringols
89 47.001 Phenol, 2-methoxy-5-(1-propenyl)-,(E)- / Trans-m-Propenyl guaiacol
- - Guaiacols (CF)
90 47.461 2,6-dimethoxybenzaldehyde C9H10O3 166.17 Misc. Oxygenates (CF)
91 48.082 4-(2-propenyl)-phenol OR Chavicol C9H10O 134.18 Phenols (CF)
92 49.276 Isoeugenol C10H12O2 164.20 Guaiacols
93 49.748 Hydroquinone / 1,4-benzenediol C6H6O2 110.11 Phenols
94 50.035 Isovanillin C8H8O3 152.15 Guaiacols
95 51.610 2-methyl-1,4-benzenediol / 2,5-toluenediol C7H8O2 124.14 Phenols
96 52.819 1,2,3-trimethoxy-5-methylbenzene OR 3,4,5-trimethoxytoluene
- 182.22 Misc. Oxygenates (CF)
97 53.473 1-(4-hydroxy-3-methoxyphenyl)-ethanone / Acetovanillone
C9H10O3 166.17 Guaiacols
98 55.462 1-(4-hydroxy-3-methoxyphenyl)-2-propanone / Guaiacylacetone / Vanillyl methyl ketone
C10H12O3 180.20 Guaiacols
99 56.267 3,4-dihydrocoumarin-6-ol - - Misc. Oxygenates
100 56.820 6-methoxycoumaran-7-ol-3-one C9H8O4 180.16 Misc. Oxygenates (CF)
101 58.854 Levoglucosan C6H10O5 162.14 Anhydrosugars
102 60.268 4-Allyl-2,6-dimethoxyphenol OR Methoxyeugenol
C11H14O3 194.23 Syringols
The peak area percentages for the catalytic peaks can be seen in Table 7-7. The values
stated are an average of two chromatograms obtained. The catalytically formed compounds
were denoted with CF in parenthesis next to its chemical group.

93
Table 7-7. Peak area percentages of the various compounds detected from the catalytic pyrolysis of Brunei rice husks bio-oils
Peak #
No Cat Binder ZSM-5 Al-MCM-41 Al-MSU-F BRHA
Regen ZSM-5
Regen Al-MCM-41
ZSM-5/ Al-MSU-F
ZSM-5/ Al-MCM-41
Al-MSU-F/ BRHA
Al-MCM-41/ Al-MSU-F
ZSM-5/ BRHA
Al-MCM-41/ BRHA
1 0.47 0.46 0.62 1.00 0.47 0.33 0.65 0.90 0.53 1.23 1.35 0.55 1.20 1.09
2 0.75 0.80 0.97 0.92 0.83 0.92 0.98 0.90 0.93 1.09 1.09 0.81 0.90 0.75
3 0.17 0.18 0.15 0.17 0.18 0.21 0.20 0.11 0.22 0.19 0.24 0.15 0.18 0.20
4 0.16 0.16 0.18 0.00 0.13 0.17 0.16 0.10 0.11 0.15 0.15 0.15 0.20 0.14
5 0.00 0.00 0.13 0.00 0.13 0.15 0.13 0.11 0.00 0.14 0.18 0.15 0.09 0.13
6 0.38 0.37 0.40 0.39 0.34 0.32 0.67 0.41 0.34 0.45 0.55 0.30 0.44 0.39
7 0.62 0.63 0.72 0.67 0.75 0.73 0.70 0.57 0.91 0.78 0.92 0.53 0.69 0.55
8 11.37 12.31 10.36 9.17 10.78 11.32 10.27 8.99 11.13 9.72 10.94 10.54 9.52 9.34
9 0.63 0.63 0.61 0.71 0.59 0.65 0.66 0.56 0.66 0.56 0.64 0.42 0.48 0.46
10 1.26 2.18 1.40 1.56 1.38 1.44 1.37 1.45 1.67 1.76 2.03 1.60 1.64 1.65
11 0.44 0.00 0.51 0.49 0.61 0.65 0.00 0.00 0.00 0.00 0.00 0.00 0.00 0.00
12 0.74 0.72 1.12 0.70 0.77 0.71 1.10 0.78 0.74 1.12 1.15 0.63 0.84 0.68
13 0.23 0.24 0.00 0.24 0.14 0.24 0.10 0.07 0.29 0.21 0.23 0.22 0.22 0.11
14 0.30 0.29 0.34 0.31 0.32 0.33 0.28 0.30 0.42 0.31 0.33 0.28 0.30 0.23
15 1.39 1.87 1.52 1.48 1.88 1.85 1.17 1.35 2.45 1.66 1.78 1.47 1.64 1.57
16 0.55 0.65 0.60 0.52 0.69 0.65 0.59 0.59 0.80 0.54 0.76 0.51 0.58 0.56
17 2.18 2.02 1.81 1.77 1.94 2.18 1.45 1.62 2.31 1.88 2.03 1.68 1.70 1.79
18 0.19 0.18 0.23 0.16 0.20 0.16 0.24 0.19 0.18 0.24 0.26 0.15 0.19 0.16
19 0.20 0.34 0.16 0.26 0.19 0.25 0.25 0.26 0.24 0.31 0.35 0.16 0.22 0.22
20 0.25 0.24 0.47 0.24 0.28 0.27 0.34 0.29 0.31 0.42 0.37 0.24 0.28 0.25
21 0.00 0.00 0.00 0.30 0.00 0.00 0.00 0.00 0.00 0.00 0.17 0.33 0.32 0.33
22 0.29 0.26 0.23 0.26 0.26 0.31 0.19 0.21 0.28 0.23 0.27 0.21 0.22 0.17
23 0.67 0.62 0.43 0.53 0.46 0.60 0.44 0.50 0.54 0.40 0.60 0.37 0.49 0.51
24 0.00 0.00 0.25 0.30 0.21 0.20 0.33 0.31 0.33 0.31 0.24 0.19 0.31 0.00
25 0.22 0.05 0.00 0.00 0.00 0.00 0.00 0.00 0.22 0.00 0.39 0.23 0.00 0.54
26 0.00 0.00 0.16 0.11 0.13 0.12 0.11 0.07 0.16 0.15 0.17 0.14 0.15 0.19

94
27 6.92 7.88 7.71 7.20 7.43 7.28 7.03 7.05 8.50 7.73 8.34 6.68 6.32 6.33
28 0.50 0.57 0.31 0.00 0.57 0.54 0.29 0.25 0.64 0.25 0.19 0.25 0.26 0.28
29 0.00 0.00 0.00 0.00 0.16 0.11 0.00 0.17 0.16 0.00 0.13 0.11 0.12 0.18
30 4.03 4.14 3.45 3.53 3.41 4.04 3.01 2.97 3.85 2.88 3.65 2.79 3.24 2.97
31 0.61 0.77 0.68 0.60 0.67 0.68 0.52 0.55 0.75 0.67 0.71 0.53 0.54 0.54
32 0.64 0.61 0.51 0.58 0.60 0.69 0.41 0.44 0.68 0.49 0.52 0.31 0.46 0.49
33 0.94 1.01 1.07 1.10 1.14 1.09 1.11 1.14 1.45 1.18 1.14 0.95 0.96 1.03
34 0.75 0.80 0.85 0.84 0.85 0.89 0.76 0.79 1.02 0.83 0.95 0.77 0.79 0.74
35 0.00 0.08 0.21 0.14 0.15 0.00 0.15 0.17 0.20 0.18 0.22 0.19 0.21 0.24
36 0.24 0.24 0.24 0.22 0.22 0.22 0.20 0.20 0.26 0.23 0.23 0.24 0.23 0.16
37 2.65 2.49 2.16 2.41 2.64 2.74 1.95 1.96 2.72 2.40 2.52 2.39 2.46 2.51
38 0.81 0.86 0.87 0.96 0.97 0.93 0.94 1.00 1.07 0.86 0.96 0.90 0.90 0.90
39 0.65 0.30 0.00 0.57 0.53 0.62 0.00 0.33 0.00 0.00 0.61 0.58 0.50 0.45
40 0.35 0.35 0.33 0.35 0.36 0.38 0.32 0.00 0.42 0.30 0.34 0.33 0.29 0.30
41 0.25 0.23 0.29 0.29 0.27 0.29 0.16 0.27 0.33 0.29 0.27 0.27 0.23 0.15
42 1.03 0.93 1.04 0.99 0.96 0.98 0.84 0.93 1.10 1.28 1.32 1.15 1.23 1.00
43 1.42 1.21 1.04 1.03 1.01 1.07 0.89 0.94 1.36 0.99 0.96 1.00 0.78 1.31
44 0.67 0.69 0.62 0.75 0.80 0.58 0.63 0.61 1.06 0.66 0.76 0.63 0.63 0.70
45 0.38 0.32 0.29 0.31 0.34 0.29 0.29 0.30 0.41 0.37 0.33 0.30 0.28 0.31
46 0.58 0.38 0.48 0.45 0.48 0.40 0.50 0.55 0.40 0.31 0.38 0.58 0.45 0.53
47 0.00 0.00 0.18 0.13 0.17 0.15 0.07 0.00 0.16 0.16 0.16 0.29 0.20 0.12
48 0.33 0.23 0.35 0.36 0.33 0.34 0.27 0.28 0.32 0.32 0.30 0.36 0.30 0.27
49 4.43 4.25 3.87 4.04 4.08 4.35 3.84 3.93 4.47 3.91 0.74 3.93 4.01 3.61
50 0.47 0.46 0.45 0.49 0.47 0.48 0.43 0.45 0.51 0.42 0.44 0.45 0.43 0.40
51 0.19 0.22 0.21 0.26 0.26 0.24 0.23 0.22 0.29 0.24 0.27 0.64 0.41 0.28
52 3.15 3.29 4.09 3.02 2.97 3.24 3.25 3.45 3.21 3.58 3.28 3.21 3.31 2.70
53 6.78 7.26 5.78 6.77 6.96 6.37 7.82 7.67 6.71 6.28 6.19 6.06 5.64 6.21
54 0.31 0.21 0.35 0.34 0.24 0.37 0.31 0.33 0.36 0.29 0.32 0.32 0.30 0.24
55 0.95 1.15 1.73 1.05 1.02 1.05 1.20 1.36 1.54 1.28 1.08 1.12 1.17 0.86
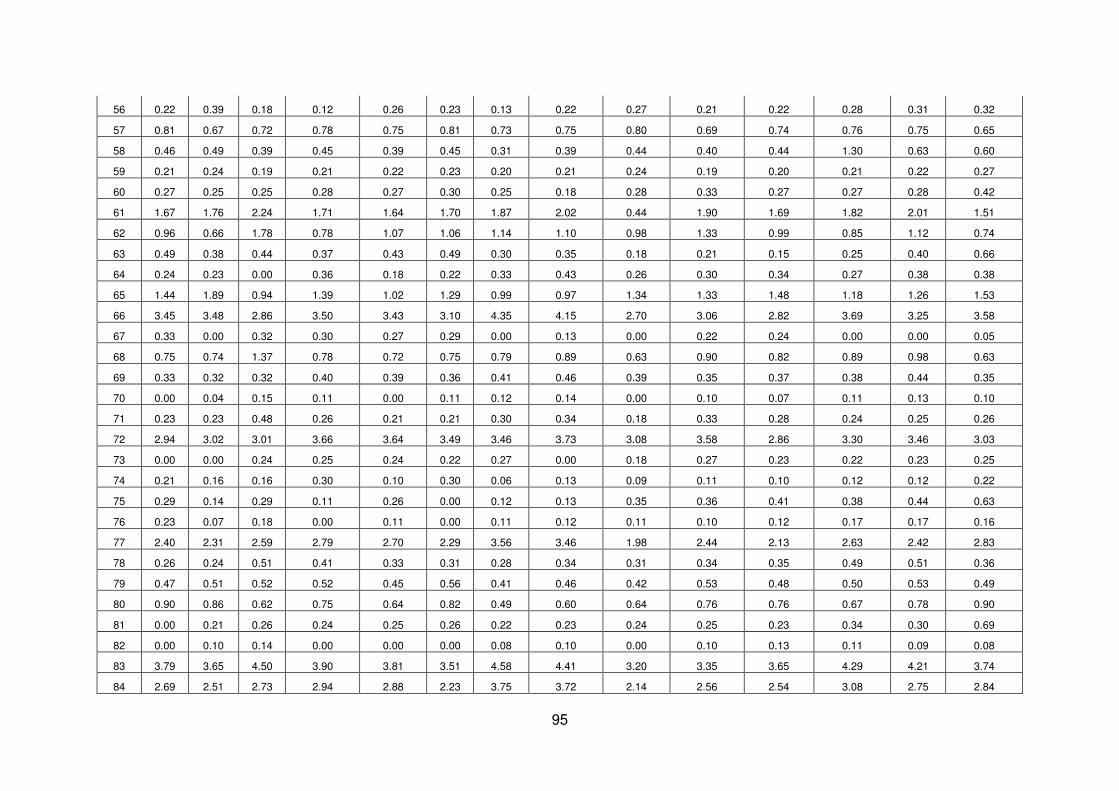
95
56 0.22 0.39 0.18 0.12 0.26 0.23 0.13 0.22 0.27 0.21 0.22 0.28 0.31 0.32
57 0.81 0.67 0.72 0.78 0.75 0.81 0.73 0.75 0.80 0.69 0.74 0.76 0.75 0.65
58 0.46 0.49 0.39 0.45 0.39 0.45 0.31 0.39 0.44 0.40 0.44 1.30 0.63 0.60
59 0.21 0.24 0.19 0.21 0.22 0.23 0.20 0.21 0.24 0.19 0.20 0.21 0.22 0.27
60 0.27 0.25 0.25 0.28 0.27 0.30 0.25 0.18 0.28 0.33 0.27 0.27 0.28 0.42
61 1.67 1.76 2.24 1.71 1.64 1.70 1.87 2.02 0.44 1.90 1.69 1.82 2.01 1.51
62 0.96 0.66 1.78 0.78 1.07 1.06 1.14 1.10 0.98 1.33 0.99 0.85 1.12 0.74
63 0.49 0.38 0.44 0.37 0.43 0.49 0.30 0.35 0.18 0.21 0.15 0.25 0.40 0.66
64 0.24 0.23 0.00 0.36 0.18 0.22 0.33 0.43 0.26 0.30 0.34 0.27 0.38 0.38
65 1.44 1.89 0.94 1.39 1.02 1.29 0.99 0.97 1.34 1.33 1.48 1.18 1.26 1.53
66 3.45 3.48 2.86 3.50 3.43 3.10 4.35 4.15 2.70 3.06 2.82 3.69 3.25 3.58
67 0.33 0.00 0.32 0.30 0.27 0.29 0.00 0.13 0.00 0.22 0.24 0.00 0.00 0.05
68 0.75 0.74 1.37 0.78 0.72 0.75 0.79 0.89 0.63 0.90 0.82 0.89 0.98 0.63
69 0.33 0.32 0.32 0.40 0.39 0.36 0.41 0.46 0.39 0.35 0.37 0.38 0.44 0.35
70 0.00 0.04 0.15 0.11 0.00 0.11 0.12 0.14 0.00 0.10 0.07 0.11 0.13 0.10
71 0.23 0.23 0.48 0.26 0.21 0.21 0.30 0.34 0.18 0.33 0.28 0.24 0.25 0.26
72 2.94 3.02 3.01 3.66 3.64 3.49 3.46 3.73 3.08 3.58 2.86 3.30 3.46 3.03
73 0.00 0.00 0.24 0.25 0.24 0.22 0.27 0.00 0.18 0.27 0.23 0.22 0.23 0.25
74 0.21 0.16 0.16 0.30 0.10 0.30 0.06 0.13 0.09 0.11 0.10 0.12 0.12 0.22
75 0.29 0.14 0.29 0.11 0.26 0.00 0.12 0.13 0.35 0.36 0.41 0.38 0.44 0.63
76 0.23 0.07 0.18 0.00 0.11 0.00 0.11 0.12 0.11 0.10 0.12 0.17 0.17 0.16
77 2.40 2.31 2.59 2.79 2.70 2.29 3.56 3.46 1.98 2.44 2.13 2.63 2.42 2.83
78 0.26 0.24 0.51 0.41 0.33 0.31 0.28 0.34 0.31 0.34 0.35 0.49 0.51 0.36
79 0.47 0.51 0.52 0.52 0.45 0.56 0.41 0.46 0.42 0.53 0.48 0.50 0.53 0.49
80 0.90 0.86 0.62 0.75 0.64 0.82 0.49 0.60 0.64 0.76 0.76 0.67 0.78 0.90
81 0.00 0.21 0.26 0.24 0.25 0.26 0.22 0.23 0.24 0.25 0.23 0.34 0.30 0.69
82 0.00 0.10 0.14 0.00 0.00 0.00 0.08 0.10 0.00 0.10 0.13 0.11 0.09 0.08
83 3.79 3.65 4.50 3.90 3.81 3.51 4.58 4.41 3.20 3.35 3.65 4.29 4.21 3.74
84 2.69 2.51 2.73 2.94 2.88 2.23 3.75 3.72 2.14 2.56 2.54 3.08 2.75 2.84

96
85 0.37 0.36 0.32 0.40 0.38 0.34 0.45 0.39 0.32 0.37 0.31 0.45 0.37 0.40
86 0.47 0.36 0.41 0.51 0.46 0.37 0.60 0.55 0.33 0.46 0.41 0.51 0.49 0.59
87 0.46 0.73 0.40 0.47 0.40 0.54 0.25 0.31 0.35 0.51 0.58 0.65 0.47 0.56
88 1.24 0.93 0.92 1.17 1.00 1.06 1.11 1.09 0.85 1.07 0.95 1.05 0.99 1.04
89 0.00 0.15 0.32 0.33 0.36 0.28 0.54 0.57 0.23 0.33 0.24 0.32 0.29 0.95
90 0.00 0.08 0.15 0.12 0.00 0.12 0.14 0.20 0.00 0.13 0.11 0.14 0.18 0.16
91 0.00 0.10 0.14 0.15 0.00 0.15 0.11 0.10 0.00 0.07 0.09 0.12 0.15 0.44
92 1.62 1.28 1.62 1.75 1.66 1.33 2.40 2.10 1.12 1.49 1.32 1.59 1.49 1.82
93 1.18 1.02 0.91 1.00 0.85 0.96 0.92 1.02 0.81 1.22 1.07 1.10 1.21 1.19
94 0.52 0.42 0.41 0.47 0.45 0.42 0.45 0.48 0.39 0.46 0.42 0.47 0.51 0.52
95 0.30 0.22 0.32 0.28 0.24 0.25 0.21 0.26 0.23 0.40 0.35 0.41 0.41 0.44
96 0.00 0.00 0.25 0.34 0.30 0.28 0.31 0.30 0.23 0.35 0.31 0.42 0.39 0.49
97 0.43 0.40 0.31 0.51 0.38 0.25 0.38 0.39 0.39 0.42 0.53 0.49 0.51 0.68
98 0.80 0.56 0.60 0.86 0.77 0.75 0.70 0.77 0.70 0.86 0.79 0.82 0.84 1.00
99 0.35 0.27 0.44 0.56 0.43 0.41 0.39 0.35 0.41 0.58 0.49 0.31 0.49 0.51
100 0.00 0.05 0.24 0.29 0.22 0.00 0.30 0.36 0.41 0.31 0.31 0.33 0.33 0.36
101 2.49 1.30 1.06 1.78 1.46 1.54 0.91 1.28 1.44 1.86 1.86 2.36 2.65 2.32
102 0.25 0.15 0.24 0.31 0.25 0.23 0.39 0.37 0.21 0.31 0.26 0.37 0.37 0.42
100.01 100.00 100.00 100.00 100.00 100.00 100.00 100.00 100.00 100.00 100.00 100.00 100.00 100.00

97
7.4.2.5.1 Effects of catalysts on selected chemicals
The effects of catalysts on selected chemicals were analysed. As there are more than 100
peaks detected from GC-MS, it would be tedious to analyse each peaks individually.
Chemicals such as toluene (#12), acetic acid (#8), furfural (#27), phenol (#52), o-, p- and m-
cresols (#55, #61 and #62), 4-ethylphenol (#72), guaiacol (#53), levoglucosan (#101),
syringol (#88) are analysed individually.
Levoglucosan (#101) is one of the major products from the degradation of cellulose, besides
water, char, CO and CO2. All of the catalysts with the exception of ZSM-5/BRHA, reduce the
amount of levoglucosan present, but ZSM-5 and its regenerated form shows the most
reduction overall. This work confirms previous studies that showed levoglucosan is
decreased or eliminated when subjected to catalytic cracking [73, 90].
Figure 7-4. Effect of catalysts on selected anhydrosugars
Secondary degradation reactions by the catalysts help in the formation of other
anhydrosugars and furans, such as furfural [169]. Furfural (#27) is produced from the
pyrolysis of cellulose and hemicellulose [170]. The production of furfural is increased for
most of the catalyst compared to the non-catalytic run, except for Al-MCM-41/Al-MSU-F,
ZSM-5/BRHA and Al-MCM-41/BRHA. The highest increase for furfural was from ZSM-5/Al-
MSU-F with 8.50 % peak area.
A study conducted by Adam et al. shows that Al-MCM-41 catalysts promote the furfural and
furan production from pyrolysis of biomass [90]. The peak area for 2-methylfuran (#1)
0.00
0.50
1.00
1.50
2.00
2.50
3.00
Levoglucosan
1,4:3,6-dianhydro-α-d-
glucopyranose

98
increases two-fold for Al-MCM-41 and only reduced slightly for the regenerated form, but is
still higher than the other single catalysts. As for the multiple catalyst, the combination of Al-
MCM-41/Al-MSU-F halved the production of 2-methylfuran compared to Al-MCM-41 alone.
But the combination of Al-MSU-F/BRHA showed the highest peak area and positive synergy
as compared to their individual run independently, followed by the combination of ZSM-5/Al-
MCM-41, ZSM-5/BRHA and Al-MCM-41/BRHA.
Acetic acid (#8) has the highest peak area amongst the other chemical compound identified
in the bio-oil. Acetic acid is mainly generated from the degradation of hemicellulose and
partly from lignin. The peak area of acetic acid is mostly reduced with Al-MCM-41 catalyst,
and BRHA catalyst having almost no effect on the reduction of acetic acid when compared to
the non-catalytic run. This agrees with the study from Samolada et al., who reported a
reduction in acetic acid content in bio-oil on using fresh Al-MCM-41 catalyst in a fixed bed
reactor [132]. Adam et al. also reported that Al-MCM-41 increased the acetic acid production
for fast pyrolysis, but observed a decreased for catalytic pyrolysis with a lower heating rate
[90]. This result is in agreement with this study, as the heating rate in this work is moderate.
The main chemical reaction in the transformation of biomass to phenols starts with the
dehydration of –OH groups in the alkyl chain of the lignin phenylpropane basic unit followed
by the cleavage of the inter-aromatic bonds, of which the β-O-4 aryl ether bond is the most
frequent linkage [171]. Liu et. al mentioned that the β-O-4 linkage is the most important and
most abundant substructure in lignin, probably accounting for 50% of the linkages [25].
A study conducted by Liu et al. found that phenol is mainly produced from the pyrolysis of
the H-type lignin, besides cresols and 4-ethylphenol [25]. In this study, the highest peak area
for phenol (#52) was obtained for ZSM-5 with 4.09%, followed by ZSM-5/Al-MCM-41 with
3.58%. The regenerated ZSM-5 showed a significant reduction to 3.25%. As for regenerated
Al-MCM-41, the peak appears to increase compared to the fresh one, from 3.02 to 3.45%.
The significant reduction was obtained for Al-MCM-41/BRHA, which decreased the phenol
production to 2.70%.
Cresols in Figure 7-5 include o-, p- and m-cresols (#55, #61 and #62). ZSM-5 appears to
increase the production of cresols significantly compared to the rest of the other catalysts.
The regenerated form of ZSM-5 however does not generate much cresols with a peak area
of 4.21%, as compared with the fresh one with 5.75%. The opposite is true for Al-MCM-41,
by which the regenerated form increases more cresols than the fresh one. For 4-ethylphenol

99
(#72), Al-MCM-41 and its regenerated form increases the most with 3.66% and 3.73% peak
area.
Figure 7-5. Effect of catalysts on selected phenols
Liu et. al conducted a study on the pyrolysis of the G-type lignin models which produce
guaiacol and p-vinylguaiacol as the main products [25]. The chemicals were also detected
for BRH pyrolysis oil. Aside from that, p-creosol was also a significant chemical detected.
Guaiacol (#53) is decreased by ZSM-5 and BRHA, and the combination of both catalysts. As
for p-creosol (#66), the peak area was also decreased by ZSM-5 and BRHA, and for
combined catalyst ZSM-5/Al-MSU-F and Al-MSU-F/BRHA. But for both chemicals, an
increase in peak area for both the regenerated catalyst ZSM-5 and Al-MCM-41 was
significant.
0.00
1.00
2.00
3.00
4.00
5.00
6.00
7.00
Cresols
Phenol
4-ethylphenol

100
Figure 7-6. Effect of catalysts on selected guaiacols
2,6-dimethoxyphenol (#88) and methoxyeugenol (#102) are the only compounds detected
from the S-type lignin. For 2,6-dimethoxyphenol, all the catalysts show a reduction in the
peak area.
Aromatic hydrocarbons are formed from a series of dehydration, decarbonylation,
decarboxylation, isomerisation, oligomerisation and dehydrogenation in the zeolite catalysts
[118]. The effect of catalysts on aromatic hydrocarbons is shown in Figure 7-7. Toluene
(#12) and xylenes – which is comprised of p-xylene or ethylbenzene (#18), m-xylene (#20)
and o-xylene (#24) was seen to be the most affected by ZSM-5, regenerated ZSM-5, ZSM-
5/Al-MCM-41 and Al-MSU-F/BRHA with an increase in the peak areas compared to other
catalysts.
Other aromatic hydrocarbon compound such as benzene (#4) was not detected in the non-
catalytic bio-oil, but is present in all the catalytic runs except for Al-MCM-41. Catalytically
formed aromatic hydrocarbons can be seen, with the formation of styrene (#26) and
trimethylbenzene (#35). Styrene production was apparent in all the catalytic runs except for
the binder and the non-catalytic run. Apart from the non-catalytic run, trimethylbenzene was
present for all the catalytic run except for BRHA. Polyaromatic hydrocarbon compounds
were not detected in the rice husk bio-oil.
0.00
1.00
2.00
3.00
4.00
5.00
6.00
7.00
8.00
Guaiacol
p-vinylguaiacol
p-creosol

101
Figure 7-7. Effect of catalysts on aromatic hydrocarbons
7.4.2.5.2 Effect of catalysts on the chemical groups
An overall sense on the effect of catalysts on BRH bio-oils may be analysed clearly based
on the chemical groups. The individual chemicals peak area were categorised in their
respective chemical groups, namely aromatic hydrocarbons (ARH), organic acids (OA),
esters (EST), furans (FUR), aldehydes (ALD), ketones (KET), alcohols (ALC), phenols
(PHE), guaiacols (GU), syringols (SYR), anhydrosugars (ANH), miscellaneous oxygenated
compounds (MISC) and nitrogen-containing compounds (NCC). The total peak areas of the
chemical groups for the non-catalytic and catalytic pyrolysis of Brunei rice husk bio-oil may
be found in Table 7-8.
Table 7-8. Total peak areas of the chemical groups for the non-catalytic and catalytic
pyrolysis of Brunei rice husk bio-oil
CHEMICAL GROUPS
Peak Areas (%) ARH OA EST FUR ALD KET ALC PHE GU SYR ANH MISC NCC
No catalyst 1.34 17.01 1.14 12.23 0.64 17.10 7.14 13.89 19.07 1.49 3.86 3.02 2.07
Binder 1.37 18.32 1.36 12.33 0.61 16.32 7.51 13.48 18.73 1.09 2.67 3.44 2.79
ZSM-5 2.63 16.76 1.30 12.51 0.82 15.39 5.88 18.19 17.55 1.16 2.20 3.72 1.88
Al-MCM-41 1.64 15.00 1.22 12.48 0.71 16.72 6.31 14.69 20.32 1.47 3.05 4.12 2.26
Al-MSU-F 1.86 16.86 1.27 12.47 0.90 17.17 6.06 13.95 19.97 1.25 2.54 3.70 2.00
BRHA 1.62 17.13 1.36 12.25 0.99 18.01 6.48 14.72 17.37 1.29 2.92 3.80 2.08
0.00
0.20
0.40
0.60
0.80
1.00
1.20P
ea
k A
rea
(%
)
Benzene
Toluene
Xylenes
Styrene

102
Regen ZSM-5 2.43 16.34 1.31 11.42 0.61 14.67 5.30 14.68 24.41 1.49 1.81 3.54 1.97 Regen Al-MCM-41 1.92 15.14 1.23 11.45 0.55 15.62 5.27 16.02 23.69 1.46 2.35 3.23 2.07 ZSM-5/ Al-MSU-F 2.03 17.22 1.42 13.78 0.83 18.94 7.23 12.00 16.69 1.06 2.50 3.94 2.36 ZSM-5/ Al-MCM-41 2.57 15.13 1.48 12.59 0.79 16.28 5.87 16.12 18.26 1.38 3.15 4.11 2.28 Al-MSU-F/ BRHA 2.56 16.80 1.55 13.91 0.86 14.78 7.03 13.97 17.30 1.21 3.09 4.30 2.64 Al-MCM-41/ Al-MSU-F 1.68 17.60 1.23 11.32 0.75 16.39 5.53 14.64 19.60 1.42 3.53 3.91 2.40 ZSM-5/ BRHA 2.17 16.01 1.39 11.23 0.75 16.67 6.18 15.82 18.06 1.37 3.96 4.08 2.31 Al-MCM-41/ BRHA 1.65 15.25 1.27 12.27 0.74 16.09 6.39 13.86 20.81 1.45 3.72 4.20 2.30
From Table 7-8, we can analyse that the dominating chemical groups in the BRH bio-oil are
organic acids, furans, ketones, phenols and guaiacols. This was expected, as majority of the
BRH contains cellulose and lignin. Numerous model pathways were proposed for cellulose
pyrolysis from literature, and one of them is the Broido-Shafizadeh model (Figure 7-9) which
shows the formation of ketones, organic acids and furans from the secondary reactions of
levoglucosan (anhydrosugars).
Figure 7-8. The global modified Broido-Shafizadeh model (adapted from [63])
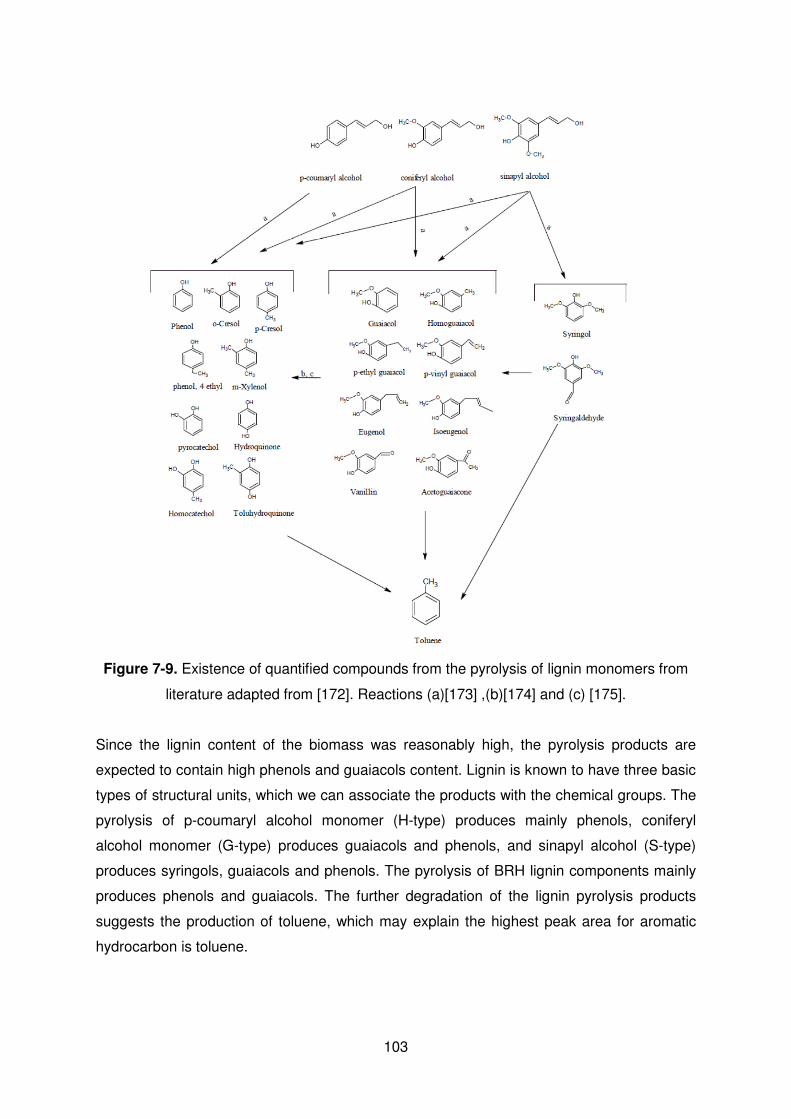
103
Figure 7-9. Existence of quantified compounds from the pyrolysis of lignin monomers from
literature adapted from [172]. Reactions (a)[173] ,(b)[174] and (c) [175].
Since the lignin content of the biomass was reasonably high, the pyrolysis products are
expected to contain high phenols and guaiacols content. Lignin is known to have three basic
types of structural units, which we can associate the products with the chemical groups. The
pyrolysis of p-coumaryl alcohol monomer (H-type) produces mainly phenols, coniferyl
alcohol monomer (G-type) produces guaiacols and phenols, and sinapyl alcohol (S-type)
produces syringols, guaiacols and phenols. The pyrolysis of BRH lignin components mainly
produces phenols and guaiacols. The further degradation of the lignin pyrolysis products
suggests the production of toluene, which may explain the highest peak area for aromatic
hydrocarbon is toluene.

104
A closer inspection of the effect of catalysts in comparison to the non-catalytic run on the
chemical group may be found in Table 7-9. The change in the peak areas is obtained by
subtracting the peak areas from the catalytic runs with the non-catalytic runs. From this table
we can evaluate the changes in the catalytic runs with respect to their chemical groups as
compared to the non-catalytic run.
Table 7-9. The effect of the catalyst on the chemical groups in comparison to the non-
catalytic Brunei rice husk bio-oil
Peak areas (%)
Chemical Groups
ARH OA EST FUR ALD KET ALC PHE GU SYR ANH MISC NCC
No catalyst 0 0 0 0 0 0 0 0 0 0 0 0 0
Binder 0.03 1.31 0.22 0.10 -0.03 -0.78 0.37 -0.42 -0.34 -0.41 -1.19 0.42 0.72
ZSM-5 1.29 -0.25 0.17 0.28 0.18 -1.71 -1.26 4.30 -1.51 -0.34 -1.66 0.70 -0.19
Al-MCM-41 0.30 -2.01 0.08 0.25 0.07 -0.38 -0.83 0.80 1.25 -0.02 -0.81 1.10 0.19
Al-MSU-F 0.52 -0.15 0.13 0.24 0.26 0.07 -1.08 0.06 0.90 -0.24 -1.32 0.68 -0.08
BRHA 0.28 0.12 0.22 0.02 0.35 0.91 -0.66 0.82 -1.70 -0.20 -0.95 0.78 0.01 Regen ZSM-5 1.09 -0.67 0.17 -0.81 -0.03 -2.42 -1.84 0.79 5.35 0.00 -2.05 0.53 -0.10 Regen Al-MCM-41 0.58 -1.88 0.09 -0.78 -0.09 -1.47 -1.87 2.12 4.62 -0.03 -1.51 0.21 0.00 ZSM-5/ Al-MSU-F 0.69 0.20 0.28 1.55 0.19 1.84 0.09 -1.89 -2.38 -0.43 -1.36 0.92 0.29 ZSM-5/ Al-MCM-41 1.23 -1.88 0.34 0.36 0.15 -0.82 -1.27 2.23 -0.81 -0.11 -0.72 1.09 0.21 Al-MSU-F/ BRHA 1.22 -0.21 0.41 1.68 0.22 -2.31 -0.11 0.08 -1.77 -0.28 -0.77 1.28 0.56 Al-MCM-41/ Al-MSU-F 0.34 0.59 0.09 -0.91 0.10 -0.71 -1.61 0.74 0.53 -0.07 -0.33 0.89 0.33 ZSM-5/ BRHA 0.83 -1.01 0.26 -1.00 0.11 -0.43 -0.96 1.93 -1.00 -0.13 0.10 1.06 0.24 Al-MCM-41/ BRHA 0.31 -1.76 0.13 0.04 0.09 -1.01 -0.75 -0.03 1.74 -0.04 -0.15 1.18 0.23
The catalyst with most activity can be seen for ZSM-5, due to the changes in the peak areas
for the various chemical groups. ZSM-5 is effective for the production of aromatic
hydrocarbon and phenols, and the reduction in the peak areas for ketones, alcohols and
anhydrosugars.
The binder shows the least deviation compared to the rest of the catalytic runs, which
showed that the binder did not take much part on the upgrading of the pyrolysis vapours.
Although that said, the run with binder generates more organic acids mainly acetic acid,
making the bio-oil more acidic.
The formation of aromatic hydrocarbons is mainly from the degradation of lignin compounds.
The production of aromatic hydrocarbons was slightly higher for Al-MSU-F (1.86%) than Al-

105
MCM-41 (1.64%), which was attributed to the absence of benzene from the peak
chromatograph for Al-MCM-41. This was proven from a previous study by Pattiya et al. using
cassava rhizome as the pyrolysis feedstock which showed an increase in the aromatic
hydrocarbon production particularly benzene and xylenes for Al-MSU-F than Al-MCM-41
[176].
7.4.3 Regenerated catalysts studies
This section discusses the effects of the regenerated catalysts on the chemical group. ZSM-
5 regenerated catalysts can be seen to produce more guaiacol compounds with 24.41% as
compared to the fresh ZSM-5 with 17.55%. The production of phenolics was compromised
with a significant decrease from 18.19% to 14.68%. Since guaiacols and phenolics were
formed from the pyrolysis of lignin, we can infer that based on the schematic diagram
proposed from Figure 7-9, reactions (a) proceeds as normal and the selectivity towards
guaiacol compounds were more, and that reactions (b) and (c) were restricted towards the
formation of phenol. However, the ability for the production of aromatic hydrocarbons is
retained, although slightly lower than the fresh ZSM-5.
As for the regenerated Al-MCM-41 catalysts, the reduction in the organic acid compounds is
still retained, although slightly lower than the fresh one. A further decrease of ketones,
alcohols and anhydrosugars, and an increase of phenolics and guaiacols chemical group
can be seen. This was similar the ZSM-5 regenerated catalysts, although more phenolics
was formed, but the increase in aromatic hydrocarbons was not as significant.
7.4.4 General remarks
The multiple stacked catalysts showed a very interesting synergistic effect for some, when
compared with the individual catalytic traits. Some catalysts such as Al-MSU-F/BRHA exhibit
a positive amplified effect when combined, compared to their individual respective ability. It
is interesting to note that the interaction between Al-MSU-F/BRHA does produce a high
amount of aromatics with a peak area of 2.56%, as compared to the peak areas for their
individual runs (1.86% and 1.62% respectively). The increase in the hydrocarbon content
was attributed to the increase in toluene and xylenes, almost similar to the peak areas
obtained from ZSM-5 alone. The combination of both also generated furans, and showed a
significant reduction in ketones and guaiacols. This synergy effect is not studied further in
this research.

106
The synergy between ZSM-5/Al-MSU-F showed a significant increase in the ketone
chemical group. ZSM-5 alone reduces the ketones, and Al-MSU-F increases the ketone
formation slightly. Most of the catalyst show a reduction in the alcohol chemical group in the
bio-oil except for the binder alone and ZSM-5/Al-MSU-F. The highest reduction for the single
catalysts was for ZSM-5 and both the regenerated ZSM-5 and Al-MCM-41 catalysts.
The interesting feature of the ZSM-5/Al-MCM-41 catalyst is that it adopts the desired
properties from its individual single runs, i.e. increase in aromatics and phenols, and the
decrease in the organic acids. The commercial catalysts showed a significant reduction of
ketones, with ZSM-5 having the most reduction. BRHA on the other hand shows no variation
in the amount of ketones.
7.5 Evaluation procedures for the ‘best’ catalyst
Various different criteria were proposed for the favourable quality of the bio-oil. The top three
catalytic runs, aside from the non-catalytic run were chosen from each criterion. The chosen
catalyst receiving the most tallies from the criteria will be selected for the optimisation
experiments. The first three criteria were obtained from the GC-MS peak areas. The
increase in the aromatic hydrocarbon peak and phenols peak areas would mean the
production of high-value chemicals. The reduction in organic acids and the increase in pH
favour the usage of bio-oils, making them less corrosive. The increase in the heating value
and a reduction in the water content of the bio-oil are useful for energy purposes. A lower
viscosity bio-oil indicates the ability of the catalysts to crack the heavy molecules from the
pyrolysis vapours.
1. Increase in aromatic hydrocarbon
2. Reduction in the organic acid
3. Increase in phenols
4. Increase in pH (lower acidity)
5. Increase in the HHV
6. Lower water content
7. Lower viscosity
8. Lower density
9. High HC molar ratio
10. Low OC molar ratio

107
Table 7-10. Evaluation of the 'best' catalyst from the various criterions
Catalytic runs Criterions
1 2 3 4 5 6 7 8 9 10
Binder X
ZSM-5 X X X
Al-MCM-41 X X X
Al-MSU-F X
BRHA X X
Regen ZSM-5 X
Regen Al-MCM-41 X X X X X
ZSM-5/Al-MSU-F
ZSM-5/Al-MCM-41 X X X X X X
Al-MSU-F/BRHA X X X X
Al-MCM-41/Al-MSU-F
ZSM-5/BRHA X X X
Al-MCM-41/BRHA X X X
The combination of ZSM-5 and Al-MCM-41 shows that they are superior as compared to the
other catalysts on certain aspects. Individually, ZSM-5 is as expected to be a very active
catalyst. Al-MCM-41 is merited being the only catalyst by itself showing a strong reduction in
the organic acids in the liquid bio-oil, including in its regenerated form. The arrangement of
both the catalysts show a reduction in the acidity of the bio-oil, which can be reflected from
both criteria 2 and 4. Due to similar values obtained for criteria 4 (increase in pH), five of the
catalytic runs were selected.
ZSM-5/Al-MCM-41 however lacks the ability to lower the water content, increase the HHV
and lowering the OC molar ratio. Due to their active catalytic nature, they contain the highest
the water content value. This has an effect on the wet-HHV of the bio-oil, as it was the
lowest for all the catalytic runs. The OC molar ratio was also high, owing to the fact that
more wt. % oxygen was determined for the bio-oils, possibly from the cracking and
depolymerisation mechanism.
Regen Al-MCM-41 surprisingly exhibits a better catalyst as compared to the fresh one.
Some catalytic runs showed an exceptional behaviour, such as Al-MSU-F/BRHA for
increasing the aromatics production, when neither possesses the quality when each acting
independently. BRHA, ZSM-5/BRHA and Al-MCM-41/BRHA also can be merited for
increasing the heating values. Although the synergies between both various catalysts were
interesting, the other favoured qualities were however lacking.

108
7.6 Summary
The catalytic pyrolysis experiments shows that the catalysts employed in these experiments
were able to upgrade the bio-oil to some extent. Although the ratio of catalyst to biomass
was low, changes were seen in the bio-oil especially towards the peak areas from GC-MS.
ZSM-5, Al-MCM-41, Al-MSU-F and BRHA, collectively with their combinations show various
changes towards the bio-oil characterisation results. The regenerated catalysts lost some of
the initial catalytic properties, but still maintain its ability to reduce the higher molecular
compounds. ZSM-5/Al-MCM-41 catalysts were shown to meet most of the criteria from the
evaluation procedures. The combinations of both the catalysts lead to a synergy in which the
functions of both of the individual catalysts are adopted and intact, unlike some of the
combined catalysts. ZSM-5/Al-MCM-41 catalytic run was evaluated the favoured catalysts
and is selected for the next phase of optimisation experiments.

109
8 CATALYTIC OPTIMISATION EXPERIMENTS
8.1 Introduction
The combination of the two catalysts in series for ZSM-5 and Al-MCM-41 was favoured from
Chapter 7 and selected for the optimisation experiments. The optimisation experiments
essentially involve altering the ratio of the catalysts into steps of 25%, 50% and 75% and
substituting the remaining percentages with the secondary catalyst totalling up to 100%. A
run involving the physical mixing of both catalysts for 50% ratio was also included. Catalyst
preparation is similar to the procedures from Chapter 7, but the catalyst ratio was adjusted
according to the weight of the catalyst and keeping the binder ratio constant.
Characterisation of the bio-oils was carried out, and the investigation of both ZSM-5 and Al-
MCM-41 as a primary catalyst was analysed and evaluated. Criterions for the selection of
favourable bio-oil qualities were adapted from Chapter 7 and evaluated to determine the
most suitable optimisation run. Ultimately, the selected optimisation run would conclude the
best ratio for the combination of ZSM-5 and Al-MCM-41.
8.2 Catalytic optimisation experiments
The catalytic optimisation experiments involving pyrolysis of BRH using both ZSM-5 and Al-
MCM-41 catalysts stacked in series, with different catalyst ratio between them. In this
experiment also, the catalyst arrangement or positioning, i.e. ZSM-5 then Al-MCM-41 and Al-
MCM-41 then ZSM-5 is investigated. The effect of physically mixing ZSM-5 and Al-MCM-41
was also examined for the 50% ratio. The ratio involves altering the amount of catalysts in
the monolith. The concept of a guard catalyst bed which was mentioned by Sutton et al.
[121] and Pattiya et al. [24] is applicable in this sense that the primary catalyst protects the
secondary catalyst from deactivation.
Catalyst preparation was similar to Chapter 7, although the coating of catalyst was reduced
on the monolith for the catalyst with a lower percentage ratio. The catalyst preparation for
the physically mixed catalyst was done by mixing a 1.5: 1.5: 1 ratio of ZSM-5, Al-MCM-41
and montmorillonite binder respectively. A total of 7 experiments were recorded with the
inclusion of the ZSM-5/Al-MCM-41 results from chapter 7 and stated as ZSM 50%: MCM
50%. The catalyst combination that is mentioned first would be the primary catalyst and
followed by the second, as the secondary catalyst. For result comparison purposes where
ZSM-5 is mentioned, it is stated as ZSM 100% and Al-MCM-41 stated MCM 100%.

110
8.2.1 Mass balance summary
The mass balance for the catalytic pyrolysis optimisation experiments can be seen in Table
8-1. The run name, average catalyst bed temperature, product yields (wt. %) and gases
composition were noted. The average catalytic bed temperature was measured at a range of
500 to 540°C for the various catalytic optimisation runs.
Table 8-1. Mass balance for catalytic optimisation experiments
Run Name
Average catalytic bed temperature
(°C)
Product yield (wt. %)
Gases composition (wt. %)
Liquid Char Gases a CH4 CO CO2
ZSM 75%: MCM 25% 529 40.07 42.26 17.66 4.01 18.39 65.00
ZSM 50%: MCM 50% 518 39.28 42.81 17.91 0.23 1.82 85.50
ZSM 25%: MCM 75% 538 40.88 43.06 16.06 3.77 17.39 65.48
Mixtures 521 40.03 42.78 17.19 5.43 26.06 55.91
MCM 75%: ZSM 25% 513 39.48 42.06 18.45 2.73 17.76 66.29
MCM 50%: ZSM 50% 525 40.14 41.90 17.96 4.03 26.26 57.51
MCM 25%: ZSM 75% 518 40.40 42.47 17.14 2.15 12.87 72.04 a by difference
The char yield is deemed consistent due to the invariable pyrolysis conditions in the fixed-
bed reactor. The liquid yield was almost analogous throughout, and the lowest was obtained
for ZSM 50%: MCM 50% with 39.28 wt. %.
The yield for gases was obtained by difference. For ZSM-5 as a primary catalyst, the yield
of gases have a tendency to decrease for runs with the introduction of Al-MCM-41 due to the
lower gas yield obtained from the Al-MCM-41 100% run (16.87 wt. %). This trend was the
opposite for Al-MCM-41 as a primary catalyst, as ZSM 100% run (19.44 wt. %) increases the
gases yield.
The CO2 yield was the highest for ZSM 50%: MCM 50% with 85.50 wt. %, and the lowest
was obtained for the physically mixed catalyst with 55.91 wt. %. A lower generation of CO2
may indicate a less activity as compared to the other runs. However, for Al-MCM-41 as a
primary catalyst, it was expected that the value of CO was higher due to the decarbonylation
effect.

111
8.2.2 Bio-oil characterisation results
Bio-oil characterisation results for water content, viscosity, density, elemental analysis,
heating values (HHV), acidity (pH) and the chemical composition using GC-MS were
analysed and discussed.
8.2.2.1 Water content
Table 8-2 shows the water contents from the optimisation experiments. The water content
ranges from 51.60% (ZSM 25%: MCM 75%) to 57.44% (ZSM 50%: MCM 50%).
Table 8-2. Water content for the optimisation experiments
Catalyst runs Water content (%)
ZSM 75%: MCM 25% 52.20 ± 0.09
ZSM 50%: MCM 50% 57.44 ± 0.21
ZSM 25%: MCM 75% 51.60 ± 0.02
Mixtures 52.79 ± 0.42
MCM 75%: ZSM 25% 52.07 ± 0.33
MCM 50%: ZSM 50% 54.80 ± 0.27
MCM 25%: ZSM 75% 54.65 ± 0.30
Lower water content may indicate a lesser activity; as the lowest value from the optimisation
is almost similar with the value obtained from the binder run. The runs with 25% catalyst
indicate lower water contents except for the MCM 25%: ZSM 75% with 54.65%. This may
indicate that primary Al-MCM-41 as guard bed increased the water content, thus more
activity as compared to primary ZSM-5 with the similar ratio. As for the rest of the 25%
catalyst, this might signify that the catalysts are deactivated quickly and affected the activity
of the catalyst. The exceptional behaviour for MCM 25%: ZSM 75% indicate that Al-MCM-41
as a primary catalyst may have protected the secondary catalyst ZSM-5 in order for it to
function.
8.2.2.2 Viscosity and Density
The viscosity for the optimisation experiments ranges from 1.46 cSt for the MCM 50%: ZSM
50% to 1.70 cSt for the ZSM 25%: MCM 75% run. In general, the values of viscosity for
ZSM-5 as a primary catalyst are much higher than Al-MCM-41 as a primary catalyst with the
similar ratio. Table 8-3 shows the viscosity and density for the bio-oils from the optimisation
experiments.

112
Table 8-3. Viscosity and Density for the optimisation experiments
Kinematic Viscosity (cSt) Density (kg/m3) @ 25°C
ZSM 75%: MCM 25% 1.65 1058
ZSM 50%: MCM 50% 1.53 1051
ZSM 25%: MCM 75% 1.70 1056
Mixtures 1.68 1053
MCM 75%: ZSM 25% 1.56 1052
MCM 50%: ZSM 50% 1.46 1049
MCM 25%: ZSM 75% 1.56 1049
The density for the optimisation runs ranges from 1049 to 1058 kg/m3. For ZSM-5 as a
primary catalyst, the lowest was obtained for ZSM 50%: MCM 50% with 1051 kg/m3 as
compared to two runs from primary Al-MCM-41 catalyst for the 50% and 25% ratio with 1049
kg/m3. The density obtained from ZSM 100% run (1053 kg/m3) was lower than MCM 100%
(1058 kg/m3) suggesting that ZSM-5 was a much stronger catalyst. But the result propose
otherwise and were however much higher in general as compared to Al-MCM-41 as a
primary catalyst. This occurrence explains that the primary catalyst is subjected to carbon
deposition or coking faster than the secondary catalyst.
It is interesting to see that the lowest density was obtained when Al-MCM-41 was the
primary catalyst. This illustrates that Al-MCM-41 has acted as a guard bed to crack the
heavy compounds prior to the pyrolysis vapour coming in contact with a stronger secondary
catalyst ZSM-5, thus further cracking the vapours.
8.2.2.3 Elemental analysis and heating values
The elemental analysis, molar ratio and the HHV values for the optimisation experiments
may be seen in Table 8-4. The carbon values for the optimisation experiments range from
21.49 to 26.67 wt. %. The values of oxygen were high, ranging from 63.35 to 68.60 wt. %.
HHV in a wet basis from correlation of the elemental analysis show that the values range
from 11.94 to 14.41 MJ/kg. Upon conversion to HHV in dry basis i.e. the exclusion of water
content, the value increases to a range from 27.66 to 31.79 MJ/kg.
A van krevelan diagram can distinguish the effects of the catalysts in altering the values for
H:C and O:C by plotting the H:C as a function of O:C. But, since the water contents differ for
the bio-oils, the values are not comparable due to the inclusion of hydrogen and oxygen wt.
% value in water. Therefore a graph of the molar ratios as a function of water content was
plotted for the optimisation runs, which can be found in Figure 8-1.
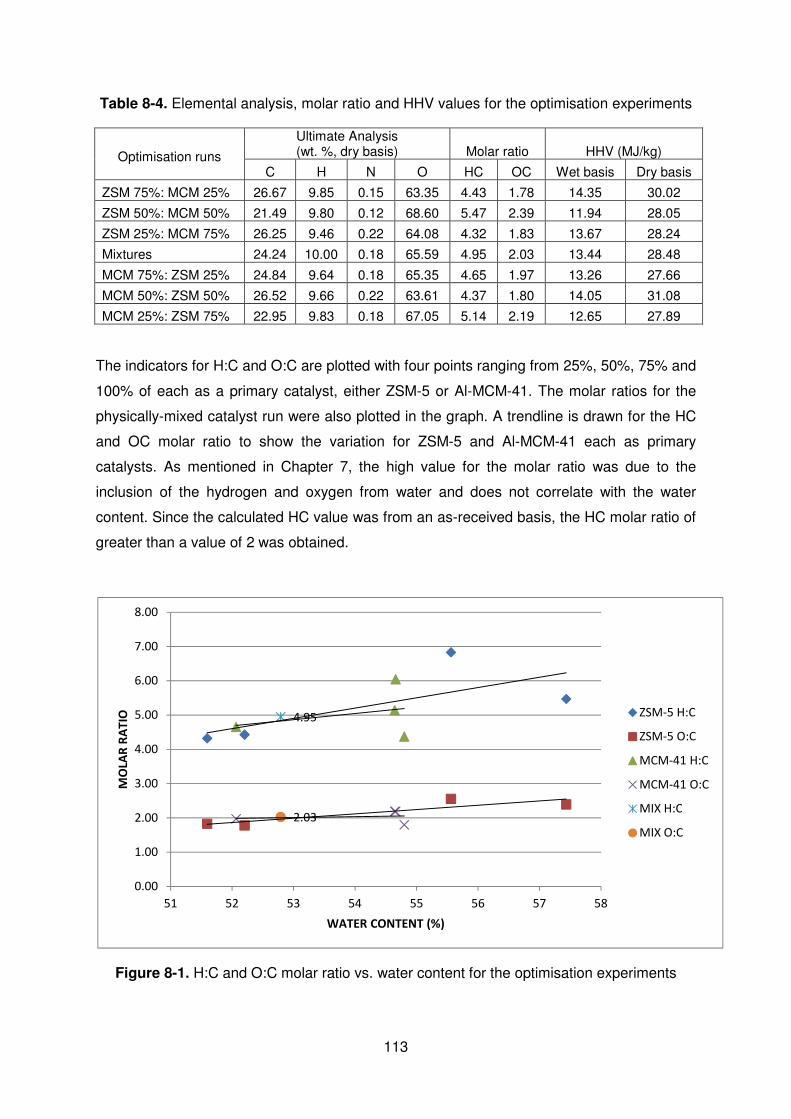
113
Table 8-4. Elemental analysis, molar ratio and HHV values for the optimisation experiments
Optimisation runs
Ultimate Analysis (wt. %, dry basis) Molar ratio HHV (MJ/kg)
C H N O HC OC Wet basis Dry basis
ZSM 75%: MCM 25% 26.67 9.85 0.15 63.35 4.43 1.78 14.35 30.02
ZSM 50%: MCM 50% 21.49 9.80 0.12 68.60 5.47 2.39 11.94 28.05
ZSM 25%: MCM 75% 26.25 9.46 0.22 64.08 4.32 1.83 13.67 28.24
Mixtures 24.24 10.00 0.18 65.59 4.95 2.03 13.44 28.48
MCM 75%: ZSM 25% 24.84 9.64 0.18 65.35 4.65 1.97 13.26 27.66
MCM 50%: ZSM 50% 26.52 9.66 0.22 63.61 4.37 1.80 14.05 31.08
MCM 25%: ZSM 75% 22.95 9.83 0.18 67.05 5.14 2.19 12.65 27.89
The indicators for H:C and O:C are plotted with four points ranging from 25%, 50%, 75% and
100% of each as a primary catalyst, either ZSM-5 or Al-MCM-41. The molar ratios for the
physically-mixed catalyst run were also plotted in the graph. A trendline is drawn for the HC
and OC molar ratio to show the variation for ZSM-5 and Al-MCM-41 each as primary
catalysts. As mentioned in Chapter 7, the high value for the molar ratio was due to the
inclusion of the hydrogen and oxygen from water and does not correlate with the water
content. Since the calculated HC value was from an as-received basis, the HC molar ratio of
greater than a value of 2 was obtained.
Figure 8-1. H:C and O:C molar ratio vs. water content for the optimisation experiments
4.95
2.03
0.00
1.00
2.00
3.00
4.00
5.00
6.00
7.00
8.00
51 52 53 54 55 56 57 58
MO
LAR
RA
TIO
WATER CONTENT (%)
ZSM-5 H:C
ZSM-5 O:C
MCM-41 H:C
MCM-41 O:C
MIX H:C
MIX O:C

114
ZSM-5 as a primary catalyst can be seen to increase the HC molar ratio more as compared
to Al-MCM-41 due to the steeper gradient. This shows that the water content was also
increased. All the plots for Al-MCM-41 as a primary catalyst however show that they do not
increase the water content as much as ZSM-5 100% and ZSM 50%: MCM 50%.
ZSM-5 also tends to increase the OC molar ratio which can be seen from a steeper gradient
of the OC trendline. However, a higher OC molar ratio is unfavourable for the bio-oil. The HC
and OC molar ratio for the physically mixed catalysts can be seen to position itself at the
intersection between where the lines for ZSM-5 and Al-MCM-41 meet.
8.2.2.4 Acidity (pH)
The acidity of the bio-oil subject to the optimisation experiments range from 2.65 to 2.95.
Table 8-5 shows the pH values for the optimisation runs. The highest pH was obtained for
MCM 75%: ZSM 25% with 2.95 and was followed closely by ZSM 50%: MCM 50% with 2.94.
The pH for the physically-mixed catalysts fared the lowest with a value of 2.65, showing the
ineffectiveness in reducing acidity in the bio-oil.
From a rough inspection of the pH values, it appears that it is much better to subject Al-
MCM-41 as a primary catalyst than the secondary catalyst due to the tendency of the pH
values to be higher. However, a high pH value was also obtained from a similar catalyst ratio
(ZSM 50%: MCM 50%) if Al-MCM-41 is to be placed as a secondary catalyst. It can
therefore be concluded from the trend, that the catalyst combination with a similar ratio has
significantly improved the pH value.
Table 8-5. Acidity (pH) for the optimisation experiments
Catalytic optimisation runs pH
ZSM 75%: MCM 25% 2.68
ZSM 50%: MCM 50% 2.94
ZSM 25%: MCM 75% 2.76
Mixtures 2.65
MCM 75%: ZSM 25% 2.95
MCM 50%: ZSM 50% 2.80
MCM 25%: ZSM 75% 2.85

115
8.2.2.5 GC-MS analysis
The chemical peaks features a total of 102 chemicals detected and identified from the GC-
MS. The chemical compounds and group, retention time, chemical formula and relative
molecular mass may be found in Table 7-6 in Chapter 7. In Table 8-6, the peak area
percentages with the respective peak numbers for the various chemicals from the
optimisation experiments is listed.
Table 8-6. Peak area percentages of the various compounds detected from the optimisation
experiments
Peak #
ZSM 25%: MCM 75%
ZSM 50%: MCM 50%
ZSM 75%: MCM 25%
Mixtures
MCM 25%: ZSM 75%
MCM 50%: ZSM 50%
MCM 75%: ZSM 25%
1 0.00 1.23 0.72 0.26 0.73 0.80 0.52
2 0.63 1.09 0.75 0.87 0.92 1.18 1.01
3 0.07 0.19 0.17 0.17 0.20 0.20 0.18
4 0.08 0.15 0.08 0.12 0.13 0.13 0.12
5 0.08 0.14 0.13 0.08 0.08 0.13 0.11
6 0.12 0.45 0.31 0.29 0.41 0.46 0.38
7 0.42 0.78 0.62 0.61 0.75 0.80 0.69
8 10.01 9.72 9.09 12.87 11.06 13.10 12.66
9 0.46 0.56 0.54 0.63 0.63 0.71 0.65
10 1.75 1.76 2.24 2.42 2.21 2.26 2.55
11 0.00 0.00 0.00 0.00 0.00 0.00 0.00
12 0.24 1.12 0.51 0.65 0.79 0.94 0.79
13 0.05 0.21 0.07 0.09 0.09 0.10 0.08
14 0.25 0.31 0.29 0.32 0.32 0.39 0.34
15 1.54 1.66 1.51 1.97 1.54 2.09 2.02
16 0.53 0.54 0.56 0.65 0.56 0.74 0.67
17 1.78 1.88 1.96 2.16 1.88 1.99 2.06
18 0.09 0.24 0.12 0.18 0.18 0.23 0.17
19 0.31 0.31 0.32 0.32 0.09 0.42 0.27
20 0.13 0.42 0.19 0.25 0.32 0.31 0.30
21 0.42 0.00 0.36 0.44 0.39 0.18 0.44
22 0.25 0.23 0.24 0.26 0.22 0.25 0.25
23 0.61 0.40 0.67 0.59 0.38 0.66 0.63
24 0.27 0.31 0.28 0.30 0.20 0.38 0.32
25 0.04 0.00 0.00 0.32 0.00 0.08 0.00
26 0.00 0.15 0.06 0.07 0.07 0.08 0.06
27 6.75 7.73 7.01 7.64 8.42 8.69 7.98
28 0.50 0.25 0.33 0.52 0.41 0.42 0.70
29 0.44 0.00 0.31 0.21 0.34 0.24 0.25
30 2.90 2.88 3.21 3.38 3.11 3.02 3.03
31 0.54 0.67 0.57 0.67 0.68 0.65 0.80
32 0.48 0.49 0.59 0.50 0.51 0.51 0.56

116
33 1.05 1.18 1.00 1.15 1.21 1.34 1.08
34 0.72 0.83 0.73 0.77 0.81 0.83 0.74
35 0.12 0.18 0.17 0.13 0.15 0.17 0.13
36 0.20 0.23 0.21 0.23 0.23 0.24 0.20
37 2.37 2.40 2.96 2.41 2.37 2.36 2.75
38 0.84 0.86 0.81 0.78 0.93 0.86 0.77
39 0.61 0.00 0.00 0.68 0.44 0.00 0.30
40 0.35 0.30 0.32 0.36 0.31 0.32 0.23
41 0.22 0.29 0.23 0.24 0.25 0.24 0.22
42 0.90 1.28 0.91 0.87 0.88 0.88 0.82
43 1.18 0.99 1.39 1.21 1.12 1.02 1.14
44 0.61 0.66 0.57 0.66 0.45 0.72 0.60
45 0.36 0.37 0.39 0.32 0.35 0.31 0.24
46 0.59 0.31 0.53 0.49 0.31 0.39 0.34
47 0.09 0.16 0.06 0.10 0.05 0.08 0.12
48 0.29 0.32 0.30 0.28 0.28 0.28 0.29
49 4.25 3.91 4.30 4.15 4.12 4.09 4.04
50 0.44 0.42 0.42 0.44 0.41 0.44 0.40
51 0.28 0.24 0.27 0.38 0.28 0.40 0.21
52 2.94 3.58 2.87 3.25 3.41 3.60 3.40
53 8.22 6.28 7.47 7.28 7.48 6.72 7.27
54 0.31 0.29 0.27 0.23 0.27 0.24 0.20
55 0.88 1.28 0.93 1.09 1.16 1.24 1.19
56 0.26 0.21 0.26 0.33 0.26 0.27 0.36
57 0.78 0.69 0.77 0.69 0.66 0.63 0.63
58 0.40 0.40 0.39 0.36 0.35 0.42 0.40
59 0.19 0.19 0.17 0.23 0.27 0.20 0.20
60 0.25 0.33 0.22 0.27 0.28 0.13 0.26
61 1.57 1.90 1.54 1.68 1.73 1.82 1.71
62 0.91 1.33 1.09 0.86 0.95 1.20 0.98
63 0.38 0.21 0.24 0.26 0.38 0.18 0.23
64 0.25 0.30 0.27 0.27 0.29 0.31 0.28
65 1.40 1.33 1.24 1.28 1.60 1.20 1.31
66 4.50 3.06 4.01 3.54 3.66 3.15 3.54
67 0.26 0.22 0.22 0.69 0.72 0.80 0.74
68 0.55 0.90 0.57 0.11 0.14 0.12 0.13
69 0.40 0.35 0.39 0.31 0.37 0.30 0.31
70 0.13 0.10 0.08 0.08 0.11 0.09 0.09
71 0.23 0.33 0.22 0.23 0.24 0.26 0.27
72 3.16 3.58 3.22 2.63 3.13 2.87 2.68
73 0.26 0.27 0.23 0.18 0.20 0.16 0.19
74 0.17 0.11 0.08 0.09 0.08 0.10 0.10
75 0.17 0.36 0.18 0.07 0.13 0.11 0.10
76 0.09 0.10 0.09 0.11 0.13 0.11 0.11
77 3.45 2.44 2.93 2.31 2.57 2.07 2.32

117
78 0.20 0.34 0.22 0.19 0.24 0.23 0.20
79 0.47 0.53 0.49 0.53 0.44 0.43 0.48
80 0.63 0.76 0.67 0.73 0.73 0.70 0.74
81 0.28 0.25 0.22 0.24 0.19 0.19 0.20
82 0.16 0.10 0.00 0.07 0.05 0.06 0.00
83 3.77 3.35 4.23 3.52 3.34 3.45 3.41
84 3.44 2.56 3.49 2.72 2.42 2.44 2.58
85 0.41 0.37 0.39 0.26 0.27 0.25 0.26
86 0.57 0.46 0.54 0.40 0.41 0.35 0.38
87 0.35 0.51 0.41 0.43 0.55 0.44 0.32
88 1.33 1.07 1.30 0.97 1.03 0.82 0.97
89 0.56 0.33 0.49 0.44 0.44 0.30 0.68
90 0.12 0.13 0.12 0.08 0.11 0.08 0.09
91 0.10 0.07 0.12 0.10 0.09 0.09 0.08
92 2.12 1.49 1.79 1.47 1.33 1.20 1.28
93 1.22 1.22 1.18 0.93 1.09 0.90 0.97
94 0.55 0.46 0.51 0.43 0.50 0.37 0.48
95 0.19 0.40 0.33 0.27 0.37 0.25 0.26
96 0.36 0.35 0.32 0.18 0.21 0.13 0.20
97 0.44 0.42 0.40 0.28 0.41 0.30 0.29
98 0.95 0.86 0.85 0.56 0.64 0.46 0.58
99 0.22 0.58 0.37 0.17 0.30 0.24 0.20
100 0.26 0.31 0.23 0.10 0.14 0.10 0.11
101 1.49 1.86 1.64 0.90 1.40 0.71 0.87
102 0.43 0.31 0.36 0.14 0.19 0.10 0.16
TOTAL 100.00 100.00 100.00 100.00 100.00 100.00 100.00
The discussion for the GC-MS will be divided into two sections: ZSM-5 and Al-MCM-41 as
the primary catalyst and vice versa. The effects of the individual catalysts ZSM-5 100% and
Al-MCM-41 100% on the pyrolysis vapours were included in the graph plots as a
comparison. Individual chemicals of from aromatic hydrocarbons, phenols, organic acids and
a selection of the major chemicals were examined.
8.2.2.5.1 ZSM-5 as the primary catalyst
This section discusses the changes in the chemical peak areas with respect to the ratio for
primary ZSM-5 catalyst. Figure 8-2 shows the aromatic hydrocarbon peak areas with respect
to the ZSM-5 ratio. Toluene and xylenes were the highest aromatics detected and were seen
to compete in certain ratios. The production of toluene and xylene was hindered when the
ratio of the catalysts was 25% for either ZSM-5 (ZSM 25: MCM 75) or for Al-MCM-41 (ZSM
75: MCM 25), and was suspected due to catalyst deactivation. One might suggest that the

118
coke/char may have deteriorated the aromatic hydrocarbon values. But based on a previous
study by Pattiya on the catalytic pyrolysis of biomass with char, the peak areas for toluene
and xylenes did not changed [24]. Therefore this can only mean the occurrence of catalyst
deactivation, and excluded the effects of char on both the chemical peak areas.
Figure 8-2. Aromatic hydrocarbon peak areas for ZSM-5 as a primary catalyst
The reduction in peak areas for toluene and xylenes was much greater for 25% ZSM-5 than
25% Al-MCM-41. This was expected due to the higher increase in aromatic hydrocarbon for
ZSM-5 100% than Al-MCM-41 100%. The synergy for the 50% ratio can be seen to be
almost identical to the catalytic run with ZSM 100% for the production of aromatic
hydrocarbons. The total peak areas for aromatic hydrocarbons show that the changes are
dominated by the varying values from toluene and xylenes.
The highest organic acid peak area was obtained for acetic acids, amongst others such as
propanoic acid and o-coumaric acid. It was seen that for propanoic acid, there was no effect
of increasing the ZSM-5 content. As for the acetic acid, the peak area seems to have shown
a slight increase from 0 to 25%, decreasing from 25 to 75%, and an increase from 75 to
100% ratio content. The total organic acid is seen to be dominated by the peak areas from
acetic acid. The individual and total organic acid peak areas for ZSM-5 primary catalyst can
be seen in Figure 8-3.
0.00
0.50
1.00
1.50
2.00
2.50
3.00
ZSM 0: MCM
100
ZSM 25: MCM
75
ZSM 50: MCM
50
ZSM 75: MCM
25
ZSM 100:
MCM 0
Pe
ak
Are
a (
%)
Benzene
Toluene
Xylenes
Styrene
Total Aromatic
Hydrocarbon

119
Figure 8-3. Organic acids peak areas for ZSM-5 as a primary catalyst
Figure 8-4. Phenols peak areas for ZSM-5 as a primary catalyst
Figure 8-4 shows the phenols peak areas for primary ZSM-5 ratios. The trend for phenol and
cresols is that the peak area increases as the ratio of ZSM-5 increases. A reverse trend was
shown for 4-ethylphenol instead. Cresol peak areas show the closest resemblance to the
overall phenol peak area trend.
0.00
2.00
4.00
6.00
8.00
10.00
12.00
14.00
16.00
18.00
ZSM 0: MCM
100
ZSM 25:
MCM 75
ZSM 50:
MCM 50
ZSM 75:
MCM 25
ZSM 100:
MCM 0
Pe
ak
Are
a (
%)
Acetic acid
Propanoic acid
o-coumaric acid
Overall organic
acid
0.00
2.00
4.00
6.00
8.00
10.00
12.00
14.00
16.00
18.00
20.00
ZSM 0: MCM
100
ZSM 25: MCM
75
ZSM 50: MCM
50
ZSM 75: MCM
25
ZSM 100:
MCM 0
Pe
ak
Are
a (
%)
Phenol
Cresols
4-ethylphenol
Total Phenols

120
Other notable chemicals such furfural, guaiacol, levoglucosan, 2-furanmethanol and 3-
methyl-1,2-cyclopentanedione can be found in Figure 8-5. The guaiacol and furfural ‘zigzag’
trend shows that it significantly affected by the catalyst deactivation. As the ratio of ZSM-5
increases, the guaiacol and levoglucosan peak area tends to decrease, and increases for
furfural. The trend for 2-furan methanol shows that pure catalysts increased the peak area
compared to the combined catalysts.
Figure 8-5. Selected chemical peak areas for ZSM-5 primary catalyst
8.2.2.5.2 Al-MCM-41 as the primary catalyst
This section discusses the changes in the chemical peak areas with respect to the ratio for
primary Al-MCM-41 catalyst. The aromatic hydrocarbon peak area for Al-MCM-41 as a
primary catalyst is illustrated in Figure 8-6. The peak area for overall aromatic hydrocarbon
generally decreases as the ratio of Al-MCM-41 increases. The low aromatic hydrocarbon
ratio of Al-MCM-41 at 25% may indicate a deactivation in the catalyst. The decrease is
generally stable for the peak area for aromatic hydrocarbon from 50% to 100% Al-MCM-41.
0.00
1.00
2.00
3.00
4.00
5.00
6.00
7.00
8.00
9.00
ZSM 0: MCM
100
ZSM 25:
MCM 75
ZSM 50:
MCM 50
ZSM 75:
MCM 25
ZSM 100:
MCM 0
Pe
ak
Are
a (
%)
Furfural
Guaiacol
Levoglucosan
2-furanmethanol
3-methyl-1,2-
cyclopentanedione

121
Figure 8-6. Aromatic hydrocarbon peak areas for Al-MCM-41 as a primary catalyst
Figure 8-7. Organic acids peak area for Al-MCM-41 as a primary catalyst
The peak area for the organic acids for primary Al-MCM-41 catalyst is shown in Figure 8-7.
The trend showed an increased in the organic acids peak area showing that Al-MCM-41 as a
primary catalyst is deactivated easily and lost its main catalytic function. The increase in the
peak area was seen from 25 to 75% ratio, with the maximum at 50% ratio. The peak area
gradually decreases from 75% to 100% Al-MCM-41.
0.00
0.50
1.00
1.50
2.00
2.50
3.00
MCM 0: ZSM
100
MCM 25: ZSM
75
MCM 50:ZSM
50
MCM 75: ZSM
25
MCM 100:
ZSM 0
Pe
ak
Are
a (
%)
Benzene
Toluene
Xylenes
Styrene
Total Aromatic
Hydrocarbon
0.00
2.00
4.00
6.00
8.00
10.00
12.00
14.00
16.00
18.00
20.00
MCM 0: ZSM
100
MCM 25: ZSM
75
MCM 50:ZSM
50
MCM 75: ZSM
25
MCM 100:
ZSM 0
Pe
ak
Are
a (
%)
Acetic acid
Propanoic acid
o-coumaric acid
Total organic acids

122
The phenol peak area is shown to decrease with the increase in the Al-MCM-41 ratio as a
catalyst (Figure 8-8). A sharp decrease can be seen from 0% to 25% Al-MCM-41, then fairly
constant towards the 100% Al-MCM-41 value. This shows that the secondary catalyst ZSM-
5 has a very high influence on the total phenol increase. However, an increase in the Al-
MCM-41 ratio increases the value of 4-ethylphenol.
Figure 8-8. Selected phenols peak area for Al-MCM-41 as a primary catalyst
Figure 8-9 shows various chemicals as a function of the ratio increase for Al-MCM-41 as a
primary catalyst. Furfural showed a steady increase from a ratio of 0% to 50% and then
gradually decreasing towards the 100% ratio. This confirmed that the equal catalyst ratio
combination with Al-MCM-41 as the primary catalyst favoured the production of furfural.
Guaiacol value increases from 0% to 25%, and then gradually decreasing towards 100%
ratio. The selected ketone 3-methyl-1,2-cyclopentanedione and alcohol 2-furanmethanol is
seen to be fairly stable showing no effect towards the increase in the Al-MCM-41 ratio.
Levoglucosan peak area was the lowest for the 50% value, and tends to increase the peak
area towards 100% Al-MCM-41.
0.00
2.00
4.00
6.00
8.00
10.00
12.00
14.00
16.00
18.00
20.00
MCM 0: ZSM
100
MCM 25: ZSM
75
MCM 50:ZSM
50
MCM 75: ZSM
25
MCM 100:
ZSM 0
Pe
ak
Are
a (
%)
Phenol
Cresols
4-ethylphenol
Total phenols

123
Figure 8-9. Peak area of selected chemicals for Al-MCM-41 as a primary catalyst
8.3 General remarks
8.3.1 Catalytic effects as a primary or secondary catalyst
Being the primary catalyst essentially means that it indirectly acts as a guard bed whilst
performing its ability as a catalyst. There are differences in the peak areas for the various
chemicals on where the catalysts are positioned. For aromatic hydrocarbons and phenols
comparison, it seems sensible to portray the data with respect to ZSM-5 due to the
production effectiveness of aromatic hydrocarbon and phenols by ZSM-5. As for the organic
acids, the data is represented with respect to Al-MCM-41, due to the inhibiting nature of Al-
MCM-41 on the organic acids. For example, if ZSM-5 is stated the primary catalyst, then by
default the secondary catalyst is Al-MCM-41. This also applies to the ratio of the catalysts; if
ZSM-5 25% is stated, then the ratio for Al-MCM-41 is 75%.
The production of aromatics for the 50% ZSM-5 primary results was almost similar to the
100% ZSM-5. But when it is switched as a secondary catalyst, the production of toluene was
seen to decrease. However, the positioning of ZSM-5 as a primary catalyst hampered the
production of aromatic hydrocarbon for the 25% and 75% ratio. Regardless of the higher or
lower ratio catalyst, the production of aromatic hydrocarbon is less than with ZSM-5 50%
ratio. Figure 8-10 shows the individual aromatic hydrocarbons with respect to ZSM-5 for the
various ratio and position.
0.00
1.00
2.00
3.00
4.00
5.00
6.00
7.00
8.00
9.00
10.00
MCM 0: ZSM
100
MCM 25: ZSM
75
MCM 50:ZSM
50
MCM 75: ZSM
25
MCM 100:
ZSM 0
Pe
ak
Are
a (
%)
Furfural
Guaiacol
3-methyl-1,2-
cyclopentanedione
2-furanmethanol
Levoglucosan

124
Figure 8-10. Individual aromatic hydrocarbon peak areas with respect to ZSM-5
It may be that as a catalyst deactivated, other undesirable reactions will proceed, and in this
case lead to the suppression of hydrocarbon production. Coke formation is known to be a
major competing reaction to aromatic production, indicating parallel pathways [63].
Therefore, a sign of catalyst deactivation can be sensed from the reduction of aromatic
hydrocarbon formation. As the reactions are in series, it will be inevitable that the pyrolysis
vapours will pass through whichever catalyst that is deactivated first.
By subjecting ZSM-5 as a primary catalyst, a reduction in the aromatic peak area can
already be seen when compared to placing it as a secondary catalyst (Figure 8-11). The
reduction in the 25% may be associated with ZSM-5 deactivation and for the 75% with Al-
MCM-41 deactivation, as it is much more significant with the former than the latter. However
for the equal ratio of both catalysts (50:50), a high aromatic hydrocarbon peak area was
obtained almost similar to ZSM 100%. It can therefore be suggested that an imbalance in the
ratio affects the catalyst activity, i.e. a lower catalyst ratio will deactivate much faster. As for
secondary ZSM-5 catalyst, the increase in catalyst ratio is much stable due to the presence
of Al-MCM-41 guard bed.
As for the phenols, it appears that it is better to subject ZSM-5 as a primary catalyst, due to
the tendency to increase the phenols especially with the identical ratio. Although for
secondary ZSM-5, the production of phenol with the combined ratio is much more stable.
0.00
0.20
0.40
0.60
0.80
1.00
1.20
ZSM 1st
(25%)
ZSM
2nd
(25%)
ZSM 1st
(50%)
ZSM
2nd
(50%)
ZSM 1st
(75%)
ZSM
2nd
(75%)
ZSM
(100%)
Pe
ak
Are
a (
%)
Benzene
Toluene
Xylenes
Styrene

125
Figure 8-11. Aromatic hydrocarbon and phenols peak area with respect to ZSM-5 catalyst
ratio
The individual organic acids show that majority of the changes are due to acetic acid peak
area. Organic acids tend to decrease when Al-MCM-41 is positioned as a secondary catalyst
as compared to the primary catalyst. Figure 8-12 shows the peak area for the individual
organic acids for both primary and secondary Al-MCM-41.
Figure 8-12. Organic acids peak areas with respect to Al-MCM-41
0.00
2.00
4.00
6.00
8.00
10.00
12.00
14.00
16.00
18.00
20.00
0% 25% 50% 75% 100%
Pe
ak
Are
as
(%)
ZSM-5 catalyst ratio
Aromatics (ZSM-5 primary)
Aromatics (ZSM-5 secondary)
Aromatics (Mixtures)
Phenols (ZSM-5 primary)
Phenols (ZSM-5 secondary)
Phenols (Mixture)
0.00
2.00
4.00
6.00
8.00
10.00
12.00
14.00
MCM
1st
(25%)
MCM
2nd
(25%)
MCM
1st
(50%)
MCM
2nd
(50%)
MCM
1st
(75%)
MCM
2nd
(75%)
MCM
(100%)
Pe
ak
Are
a (
%)
Acetic acid
Propanoic acid
o-coumaric acid

126
A closer view may also be observed from the graph (Figure 8-13) of the organic acids peak
area and pH with respect to the ratio of Al-MCM-41. The pH and organic acids can be seen
to correlate; as the organic acid peak area increased, the pH value of the bio-oil decreases
although a difference in value is seen for the various arrangements even if it is for the same
ratio.
Figure 8-13. pH and organic acid peak area vs. ratios of the Al-MCM-41
The general rule for the pH value is that if the value increases, it means that the acidity is
decreased. The trendline for the pH values for both primary and secondary Al-MCM-41 was
drawn. It was shown to increase the pH which concluded that an increase in the Al-MCM-41
ratio increases the pH. As the acidity of the bio-oil is very likely due to the organic acids in
the bio-oil, it would be suitable to discuss the peak areas of the organic acids from the
aspect for the various ratios of Al-MCM-41 catalyst.
By examining Figure 8-13, we notice that Al-MCM-41 as a primary catalyst is not as effective
in reducing the organic acids compared to Al-MCM-41 as a secondary catalyst. By placing
Al-MCM-41 as a primary catalyst, it acts as a guard bed and loses its function to reduce the
organic acid peak area. This is an indication that Al-MCM-41 deactivates easily as compared
to ZSM-5 which is analysed from the high organic acid peak area from primary Al-MCM-41
compared to any of the ratios from secondary Al-MCM-41.
18.72
2.65
2.50
2.70
2.90
3.10
3.30
3.50
3.70
3.90
10.00
11.00
12.00
13.00
14.00
15.00
16.00
17.00
18.00
19.00
20.00
0% 25% 50% 75% 100%
pH
va
lue
Pe
ak
Are
as
(%)
Ratio of Al-MCM-41
Organic acid (Al-MCM-
41 primary)
Organic acid (Al-MCM-
41 secondary)
Organic acid (Mixture)
pH (Mixtures)
pH (Al-MCM-41
primary)
pH (Al-MCM-41
secondary)

127
The gradient from 25% to 50% ratio for the primary Al-MCM-41 catalyst is much steeper as
compared to the secondary catalyst run. The increase in the Al-MCM-41 ratio should show a
decrease in the organic acid peak area, which is seen from both primary and secondary Al-
MCM-41 for ratios from 50% to 100%. Therefore, the sharp gradient for the primary Al-MCM-
41 is attributed to the catalyst deactivation.
One might also suggest that after the pyrolysis vapours pass through primary Al-MCM-41, it
is subjected to further cracking by ZSM-5 which may increase the amount of organic acids in
the bio-oil. But in effect, the run for ZSM-5 100% only reached a peak area of 16.76%, which
was surpassed by MCM 50% with a value of 19.07%. Therefore it can be concluded that Al-
MCM-41 catalyst deactivation is a major limiting factor towards the reduction of the organic
acids if it were placed as a primary catalyst.
As for the physically-mixed catalyst, it can be deduced that it has almost a similar trait as Al-
MCM-41 primary, and does not reduce the organic acid peak area as much as the
introduction of Al-MCM-41 as a secondary catalyst.
Figure 8-14. Reaction chemistry for the catalytic pyrolysis of glucose with ZSM-5 [134]

128
A model proposed by Carlson et al. from the pyrolysis of glucose with HZSM-5 [134],
showed a competition between dehydration and the fragmentation reaction for the formation
of anhydrosugars and aromatics (Figure 8-14). Previous study by Carlson et. al showed that
similar aromatic selectivity and yields were obtained for both glucose and cellulose [118]. It
is therefore relevant to make a comparison, since majority of the structural component in
BRH contains cellulose.
Figure 8-15. Pathway for the aromatic formation from glucose over ZSM-5
The graph for ZSM-5 as a secondary catalyst demonstrates the ideal pattern for these
model, indicating the competition between both aromatics and anhydrosugars chemical
groups. For the graph of ZSM-5 as primary catalyst, the pattern was shifted showing a
similarity in the graphs for furans and aromatics although different in peak areas. As the
primary position is susceptible to catalyst deactivation as compared to the secondary
position, this due to the coke formation on the ZSM-5 catalyst.

129
Figure 8-16. Peak areas for furans, aromatics and anhydrosugars for primary and
secondary ZSM-5 catalyst
The peak areas for furans and aromatics were observed to be generally lower for primary
ZSM-5 compared to secondary ZSM-5. This can be seen from the decrease in both peaks
for 25% and 75% ZSM-5 ratio percentages. Therefore, the similarity in the patterns is likely
due to the competition of both the furans and aromatics, with the formation of coke. A
simplistic pathway can also be seen in Figure 8-15.
The individual chemicals peak area were categorised in their respective chemical groups to
get an overall sense on the effect of the catalyst combination and ratio. The total peak areas
of the chemical groups for the bio-oils from the catalytic optimisation runs may be found in
Table 8-7.
Table 8-7. Total peak areas of the chemical groups for the bio-oils from the catalytic
optimisation run
ARH OA EST FUR ALD KET ALC PHE GU SYR ANH MISC NCC
ZSM 75%: MCM 25% 1.42 15.21 1.18 11.88 0.78 16.78 5.85 13.43 22.33 1.66 2.80 3.84 2.84 ZSM 50%: MCM 50% 2.57 15.13 1.48 12.59 0.79 16.28 5.87 16.12 18.26 1.38 3.15 4.11 2.28 ZSM 25%: MCM 75% 0.94 15.72 0.97 10.85 0.66 16.45 5.74 13.63 24.63 1.76 2.59 3.67 2.39
Mixtures 1.70 18.72 1.36 12.45 0.68 17.19 6.08 12.94 19.29 1.11 2.16 3.30 3.01 MCM 75%: ZSM 25% 1.90 18.49 1.55 12.87 0.79 16.57 5.68 13.41 19.26 1.13 2.09 3.30 2.97 MCM 50%: ZSM 50% 2.23 19.07 1.66 13.36 0.71 16.91 5.83 14.15 17.25 0.92 1.84 3.32 2.76 MCM 25%: ZSM 75% 1.83 16.28 1.38 13.40 0.64 16.87 5.74 14.28 19.73 1.21 2.57 3.47 2.60
0.00
2.00
4.00
6.00
8.00
10.00
12.00
14.00
0% 25% 50% 75% 100%
Pe
ak
Are
a (
%)
ZSM-5 ratio
Aromatics ZSM-5 Primary
Furans ZSM-5 Primary
Anhydrosugars ZSM-5
primary
Aromatics ZSM-5 secondary
Furans ZSM-5 secondary
Anhdrosugars ZSM-5
secondary

130
A closer inspection for the changes in the chemical group peak area respective to the non-
catalytic run can be found in Table 8-8. It is ideal to compare them collectively, rather than
from individual chemicals.
Table 8-8. Changes in the peak area for chemical groups for the optimisation runs
respective to the non-catalytic run
ARH OA EST FUR ALD KET ALC PHE GU SYR ANH MISC NCC
ZSM 75%: MCM 25% 0.08 -1.80 0.04 -0.35 0.14 -0.31 -1.29 -0.46 3.26 0.16 -1.06 0.83 0.77 ZSM 50%: MCM 50% 1.23 -1.88 0.34 0.36 0.15 -0.82 -1.27 2.23 -0.81 -0.11 -0.72 1.09 0.21 ZSM 25%: MCM 75% -0.40 -1.30 -0.17 -1.38 0.01 -0.64 -1.40 -0.26 5.57 0.26 -1.27 0.66 0.32
Mixtures 0.36 1.71 0.22 0.22 0.04 0.09 -1.06 -0.96 0.22 -0.38 -1.70 0.28 0.94 MCM 75%: ZSM 25% 0.56 1.48 0.41 0.64 0.15 -0.53 -1.46 -0.48 0.19 -0.37 -1.78 0.28 0.90 MCM 50%: ZSM 50% 0.89 2.05 0.52 1.13 0.07 -0.19 -1.31 0.26 -1.82 -0.57 -2.02 0.30 0.69 MCM 25%: ZSM 75% 0.49 -0.73 0.24 1.17 0.00 -0.23 -1.40 0.39 0.66 -0.28 -1.29 0.45 0.53
A comparison of the catalyst combination in series and physically-mixed catalyst in equal
ratio (50%:50%) with respect to their chemical groups can be found in Figure 8-17. An
overall sense can be deduced that the catalyst positioned in-series with ZSM-5 as a primary
catalyst is the most favourable amongst the other two configuration, as it increases the
aromatic hydrocarbon and phenols and reducing the organic acids the most. Al-MCM-41 as
a primary catalyst loses its ability to reduce the organic acids as compared to being a
secondary catalyst. The organic acid peak area for the Al-MCM-41 as a primary catalyst was
almost similar to the physically-mixed catalyst. The physically-mixed catalyst can be seen to
increase the amount of guaiacols and ketones. The overall effectiveness of catalyst can be
concluded that the ZSM-5 primary > Al-MCM-41 primary > Physically-mixed catalyst.

131
Figure 8-17. Total peak areas for the various chemical groups for the equal combination
catalyst ratio
8.4 Evaluation procedures
The criterions proposed were similar to Chapter 7 and is listed below. The criteria were to
evaluate which of the optimisation catalytic run was the most effective and indirectly
determine a better catalyst guard bed. The leading optimisation run essentially would mean
that the catalytic functions during the upgrading of the pyrolysis vapours are intact, and does
not lose its ability to function.
1. Increase in aromatic hydrocarbon
2. Reduction in the organic acid
3. Increase in phenols
4. Increase in pH (lower acidity)
5. Increase in the HHV
6. Lower water content
7. Lower viscosity
8. Lower density
9. High HC molar ratio
10. Low OC molar ratio
0.00
2.00
4.00
6.00
8.00
10.00
12.00
14.00
16.00
18.00
20.00
ARH OA EST FUR ALD KET ALC PHE GUA SYR ANH MISC NCC
Pe
ak
Are
a (
%)
ZSM 50%:MCM 50%
MCM 50%: ZSM 50%
Mixtures

132
Table 8-9. Evaluation of the best catalyst optimisation run from the various proposed
criterions
Catalyst optimisation run
Criterions
1 2 3 4 5 6 7 8 9 10
ZSM 25%: MCM 75% X X X
ZSM 50%: MCM 50% X X X X X X X X
ZSM 75%: MCM 25% X X X X
Mixtures X X
MCM 25%:ZSM 75% X X X X
MCM 50%: ZSM 50% X X X X X X
MCM 75%: ZSM 25% X X X X
Based on the evaluation criteria in Table 8-9, the best catalyst ratio was found for ZSM 50%:
MCM 50%. ZSM-5 as a primary catalyst and catalytic guard bed was better as compared to
Al-MCM-41 due to the ability to maintain ZSM-5 for the production of aromatic hydrocarbon
and phenols, and protecting the function of Al-MCM-41 for organic acid reduction. The
second best was for the similar ratio of 50%, but Al-MCM-41 as the primary catalyst. It may
well be that it reduces the density of the bio-oil the most, but catalytic functions such as the
crucial reduction in the organic acid were impeded, together with other criteria such as
increasing the HHV and the H: C molar ratio.
The primary catalyst was prone to catalyst deactivation through coking on the catalyst
surface compared to the secondary catalyst. This was proven from the reduction in the
respective catalytic functions. However, these catalysts may be regenerated via combustion
of the coke, as proven from Chapter 7 for ZSM-5 and Al-MCM-41. The evaluation concluded
that the synergy of the catalysts has a positive effect when the catalysts are of a similar ratio.
The physically-mixed catalyst is considered the least effective amongst the optimisation run.
8.5 Summary
The catalytic optimisation experiments showed that the combination of both catalysts ZSM-5
and Al-MCM-41 in different ratios and position demonstrated a difference in the upgrading
qualities. Catalysts which are positioned as a primary catalyst and having a lower ratio tends
to deactivate faster through coking. The synergies between catalysts with 25% ratio content
were not favourable for most cases. We can conclude that the ratios and positioning
between both catalysts are a critical key factor. From the evaluation procedures, it is found
that the superior catalyst combination was using ZSM-5 as a primary catalyst and Al-MCM-

133
41 as the secondary catalyst with a ratio of 50% (ZSM 50%: MCM 50%). The effective
catalyst optimisation runs may be arranged in the order of ZSM 50%: MCM 50% > MCM
50%: ZSM 50% > ZSM 75%: MCM 25%; MCM 25%: ZSM 75%; MCM 75%: ZSM 25% >
ZSM 25%: MCM 75% > Mixtures.

134
9 CONCLUSION AND RECOMMENDATION
9.1 Conclusion
Rice Husks from Brunei (BRH) was used as a feedstock for bio-oil production by non-
catalytic and catalytic intermediate pyrolysis experiments. BRH was compared in terms of
biomass characterisation with another species of rice husk from West Africa (AFRH). Both of
the rice husks show a high ash content and comparable to other rice husk species from
other regions.
The pyrolysis of dry and wet-BRH was carried out in a bench-scale pyrolysis rig with a 100g
capacity. Dry-BRH pyrolysis produced bio-oil with a single layer and wet-BRH bio-oil was
shown to separate into two distinct layers of the organic and aqueous phase. Both phases of
the wet BRH bio-oil and the single phase dry-BRH were characterised. Although the
separation wet-BRH achieved a desirable quality in terms of acidity reduction, dry-BRH
pyrolysis bio-oil was chosen due to the homogeneity and the available quantity for the
essential characterisation procedures. The bio-oil was found to contain high water content,
Analysis from GC-MS found that majority of the chemical groups in the bio-oil contained
organic acids, furans, ketones, phenols and guaiacols.
The introduction of catalyst into the system upgraded the rice husk bio-oil. Although the
catalyst-to-biomass ratio was low of about 1:100, the catalysts employed in these
experiments were able to upgrade the bio-oil to some extent from the changes detected in
the properties of the pyrolysis bio-oil, especially from the GC-MS analysis. ZSM-5, Al-MCM-
41, Al-MSU-F and BRHA, collectively with their combinations show various changes towards
the bio-oil characterisation results. The regenerated catalysts lost some of the initial catalytic
properties, but still retain its catalytic ability. The combination of ZSM-5 and Al-MCM-41
catalyst in series was the favourable which met most of the criteria from the evaluation
procedures. The combinations of both the catalysts lead to a positive synergy in which the
functions of both of the individual catalysts are preserved, i.e. ZSM-5 for increasing the
aromatics and phenols, and Al-MCM-41 for decreasing the organic acids content.
The optimisation of the process was the next step, by altering the ratio and position of ZSM-
5 and Al-MCM-41. Results showed that the combination of both catalysts ZSM-5 and Al-
MCM-41 in different ratios and position demonstrated a difference in the upgrading qualities
and established the ratios and positioning between both catalysts are a significant key factor.
Catalysts which are positioned as a primary catalyst and having a lower ratio tends to

135
deactivate faster through coking. The synergies between catalysts with 25% ratio content
were not favourable in most cases. From the evaluation procedures, it is found that the
superior catalyst combination was using ZSM-5 as a primary catalyst and Al-MCM-41 as the
secondary catalyst with both with a ratio of 50%. The effective catalyst optimisation runs may
be arranged in the order of ZSM 50%: MCM 50% > MCM 50%: ZSM 50% > ZSM 75%: MCM
25%; MCM 25%: ZSM 75%; MCM 75%: ZSM 25% > ZSM 25%: MCM 75% > Mixtures.
Studies in literature focus mainly towards the fast pyrolysis of rice husk but not for
intermediate pyrolysis. The utilisation of rice husks from Brunei, particularly for bio-oil
production has never been done before. Characterisation of the BRH leads to the suitability
of the feedstock for biofuel generation, particularly towards bio-oil from pyrolysis. This could
be proven useful for Brunei, in terms of diversifying the economy away from fossil fuels.
The uniqueness of this research lies from the combination of both catalysts ZSM-5 and Al-
MCM-41, and altering their ratios. Both of these existing commercial zeolite catalysts have
been used extensively, but not combined in any form as of yet for bio-oil upgrading. This
study also hope to further increase the influx of research on the usage of catalysts
combination which has the property of ‘either/or’ scenarios, such as using ZSM-5 which
increases the hydrocarbon and phenols, and Al-MCM-41 which decreases the organic acids.
9.2 Recommendation
In the current catalytic pyrolysis setup, problems were encountered by increasing the purge
gas flow rate more than 50 cm3/min, such as the build-up of pressure in the system during
the pyrolysis at maximum temperature (450°C). This could lead to a leakage in the primary
reactor especially the joint between the quartz tube and the reactor head, which would
disrupt the experiment. Therefore it is recommended in future experiments, a steel reactor
may be used, or a bigger bore diameter for the secondary reactor. The current secondary
reactor furnace only allows a maximum of 30 mm external diameter size tube.
Another possible study is the extent of coking, which was not able to be measured, i.e. the
time when the catalysts are deactivated. This has been known to affect the composition of
the gases, especially the difference in the amount before and after catalyst deactivation. An
online continuous gas chromatograph will be useful in this case to know the concentration of
gases.

136
The catalyst to biomass ratio was about 1:100 in this study. For future study, the catalyst
amount may be increased. In this study, the amount of feed used is about 100g, which
generated about 40g of bio-oil. The restriction is that if we reduce the feed amount to counter
the catalyst to biomass ratio, there will not be ample bio-oil collected from this reactor for
analysis requiring a larger amount such as viscosity and density. Adding a guard bed (e.g.
dolomite) before the catalysts may also help to prolong the life of the zeolite catalysts.
Other pyrolysis by-products, i.e. the bio-char and the non-condensable gases may be
investigated thoroughly to get a general idea of the pyrolysis process as a whole. But the
limitation to this study is aimed at mainly to investigate the upgrading ability of the catalysts
for the production of bio-oil.
As the bench-scale research has been proven successful, the utilisation of the rice husks on
a pilot scale investigation using the pyroformer is considered for future work. This will require
a large amount of rice husks shipped from Brunei, since the pyroformer has a maximum
throughput of 20kg/hr. A catalytic reactor bed with the appropriate capacity for upgrading will
also need to be designed and coupled to the pyroformer.

137
REFERENCES 1. Lawrey, R.N., An economist’s perspective on economic diversification in Brunei
Darussalam. CSPS Strategy and Policy Journal, 2010. 1: p. 13-28. 2. Sims, R.E.H., Mabee, W., Saddler, J.N., Taylor, M., An overview of second
generation biofuel technologies. Bioresource Technology, 2010. 101(6): p. 1570-1580.
3. The Brunei Economic Development Board, The Prime Minister’s Office. Brunei's National Vision. Available from: http://www.bedb.com.bn/why_wawasan2035.html.
4. Bhaskaran, M., Economic diversification Brunei Darussalam. CSPS Strategy and Policy Journal, 2010. 1: p. 1-12.
5. Department of Agriculture and Agrifood, Ministry of Industry and Primary Resources. Towards self-sufficiency in rice production Brunei Darussalam. Available from: www.agriculture.gov.bn
6. Energy Department, Prime Minister’s Office (2012) Goal 2 - Ensure safe, secure, reliable and efficient supply and use of energy. Available from: http://www.energy.gov.bn/About%20Us/Pages/Goal-2.aspx
7. Masli, U., Brunei told: 'Be ready for the renewable energy revolution', in The Brunei Times. 2010, The Brunei Times: Bandar Seri Begawan.
8. Tenaga Suria Brunei, Photovoltaic power generation demonstration project in Brunei Darussalam. Available from: http://www.tsb.gov.bn/.
9. Energy Department, Prime Minister’s Office, Waste-to-Energy (WtE). 2012; Available from: http://energy.gov.bn/info/Pages/Renewable-Energy.aspx.
10. Malik, A.Q., Assessment of the potential of renewables for Brunei Darussalam. Renewable and Sustainable Energy Reviews, 2011. 15(1): p. 427-437.
11. Thien, R., New Wasan plant to boost rice production, in The Brunei Times. 2013, The Brunei Times: Bandar Seri Begawan.
12. Centi, G., Lanzafame, P., Perathoner, S., Analysis of the alternative routes in the catalytic transformation of lignocellulosic materials. Catalysis Today, 2011. 167(1): p. 14-30.
13. Demirbas, A., Biorefineries: Current activities and future developments. Energy Conversion and Management, 2009. 50(11): p. 2782-2801.
14. International Rice Research Institute, (2009) Growth stages of a rice plant. Available at: http://www.knowledgebank.irri.org/extension/index.php/growthstages
15. Department of Agriculture and Agrifood, Ministry of Industry and Primary Resources. (2009) Beras Laila. Available at: http://www.agriculture.gov.bn
16. Agricultural Engineering Unit, International Rice Research Institute (IRRI). Rice Milling. Available at: http://www.knowledgebank.irri.org/ericeproduction/PDF_&_Docs/Teaching_Manual_Rice_Milling.pdf
17. Chandrasekhar, S., Pramada, P.N., Praveen, L., Effect of organic acid treatment on the properties of rice husk silica. Journal of Materials Science, 2005. 40(24): p. 6535-6544.
18. Rice Grain. Available at: http://www.aboutrice.com/ricedetail.htm 19. Directive 2009/28/EC of the European Parliament and of the Council of 23 April
2009. The promotion of the use of energy from renewable sources, in Official Journal of the European Union L140/16. 2009.
20. Brown, R.C., Biorenewable resources: engineering new products from agriculture. 2003, Iowa: Blackwell.
21. Yaman, S., Pyrolysis of biomass to produce fuels and chemical feedstocks. Energy Conversion and Management, 2004. 45(5): p. 651-671.
22. Mosier, N., Wyman, C., Dale, B., Elander, R., Lee, Y.Y., Holtzapple, M., Ladisch, M., Features of promising technologies for pretreatment of lignocellulosic biomass. Bioresource Technology, 2005. 96(6): p. 673-686.

138
23. Wei, G.-Y., Gao, W., Jin, I.I.H., Yoo, S.-Y., Lee., J.-H., Chung, C.-H., Lee, J.-W., Pretreatment and saccharification of rice hulls for the production of fermentable sugars. Biotechnology and Bioprocess Engineering, 2009. 14(6): p. 828-834.
24. Pattiya, A., Catalytic pyrolysis of agricultural residues for bio-oil production. 2007, PhD Thesis, Aston University: Birmingham.
25. Jiang-Yan Liu, S.-B.W., Rui Lou, Chemical structure and pyrolysis response of β-o-4 lignin model polymer. Bioresources, 2011. 6: p. 1079-1093.
26. Basu, P., Biomass Characteristics, in Biomass Gasification and Pyrolysis: Practical Design and Theory. 2010, Elsevier: Oxford. p. 27-62.
27. Alonso, D.M., Wettstein, S.G., Dumesic, J.A., Bimetallic catalysts for upgrading of biomass to fuels and chemicals. Chemical Society Reviews, 2012. 41(24): p. 8075-8098.
28. Mohan, D., Pittman, C.U., Steele, P.H., Pyrolysis of Wood/Biomass for Bio-oil: A Critical Review. Energy & Fuels, 2006. 20(3): p. 848-889.
29. Murzin, D.Y., Chemical Engineering for Renewables Conversion. 2012: Elsevier Science.
30. Bridgwater, A.V., Review of fast pyrolysis of biomass and product upgrading. Biomass & Bioenergy, 2012. 38: p. 68-94.
31. A. V. Bridgwater, e.a., Fast Pyrolysis of Biomass: A Handbook. 1999: CPL Scientific Publishing Services Limited.
32. Bridgwater, A.V., and Peacocke, G.V.C., Fast pyrolysis processes for biomass. Renewable and Sustainable Energy Reviews, 2000. 4(1): p. 1-73.
33. Bridgwater, A.V., Renewable fuels and chemicals by thermal processing of biomass. Chemical Engineering Journal, 2003. 91(2–3): p. 87-102.
34. Meier, D., and Faix, O., State of the art of applied fast pyrolysis of lignocellulosic materials — a review. Bioresource Technology, 1999. 68(1): p. 71-77.
35. Scott, D.S., Majerski, P., Piskorz, J., Radlein, D., A second look at fast pyrolysis of biomass—the RTI process. Journal of Analytical and Applied Pyrolysis, 1999. 51(1–2): p. 23-37.
36. Bahng, M.-K., Mukarakate, C., Robichaud, D.J., Nimlos, M.R., Current technologies for analysis of biomass thermochemical processing: A review. Analytica Chimica Acta, 2009. 651(2): p. 117-138.
37. Williams, P.T., and Besler, S., The influence of temperature and heating rate on the slow pyrolysis of biomass. Renewable Energy, 1996. 7(3): p. 233-250.
38. Mai, R.L., H.; Seifert, H., Hot gas filtration and haloclean pyrolysis process operation experience and scale-up, in 7th International Symposium on Gas Cleaning at High Temperatures (GCHT-7). 2008: Newcastle, Australia.
39. Hornung, A., Apfelbacher, A., Thermal treatment of biomass. 2009: United Kingdom. GB2460156.
40. Yang, Y., Brammer, J. G., Ouadi, M., Samanya, J., Hornung, A., Xu, H. M., Li, Y., Characterisation of waste derived intermediate pyrolysis oils for use as diesel engine fuels. Fuel, 2013. 103(0): p. 247-257.
41. Hossain, A.K., Ouadi, M., Siddiqui, S. U., Yang, Y., Brammer, J., Hornung, A., Kay M., Davies, P. A., Experimental investigation of performance, emission and combustion characteristics of an indirect injection multi-cylinder CI engine fuelled by blends of de-inking sludge pyrolysis oil with biodiesel. Fuel, 2013. 105(0): p. 135-142.
42. Mahmood, A.S.N., Brammer, J.G., Hornung, A., Steele, A., Poulston, S., The intermediate pyrolysis and catalytic steam reforming of Brewers spent grain. Journal of Analytical and Applied Pyrolysis, 103: p. 328-342.
43. Liaw, S.-S., Wang, Z., Ndegwa, P., Frear, C., Ha, S., Li C.-Z., Garcia-Perez, M., Effect of pyrolysis temperature on the yield and properties of bio-oils obtained from the auger pyrolysis of Douglas Fir wood. Journal of Analytical and Applied Pyrolysis, 2012. 93(0): p. 52-62.

139
44. Hornung, A., Apfelbacher, A., Sagi, S., Intermediate Pyrolysis: A sustainable biomass-to-energy concept - Biothermal valorisation of biomass (BtVB) process. Journal of Scientific and Industrial Research, 2011. 70: p. 664-667.
45. Thy, P., Jenkins, B. M., Lesher, C. E., Grundvig, S., Compositional constraints on slag formation and potassium volatilization from rice straw blended wood fuel. Fuel Processing Technology, 2006. 87(5): p. 383-408.
46. Hague, R.A., The pre-treatment and pyrolysis of biomass for the production of liquid fuels and speciality chemicals. 1998, Ph.D Thesis, Aston University: Birmingham.
47. Shen, J., Wang, X.-S., Garcia-Perez, M., Mourant, D., Rhodes, M. J., Li, C.-Z., Effects of particle size on the fast pyrolysis of oil mallee woody biomass. Fuel, 2009. 88(10): p. 1810-1817.
48. Jalan, R.K. and Srivastava, V.K., Studies on pyrolysis of a single biomass cylindrical pellet—kinetic and heat transfer effects. Energy Conversion and Management, 1999. 40(5): p. 467-494.
49. Westerhof, R.J.M., Kuipers, N. J. M., Kersten, S. R. A., van Swaaij, W. P. M., Controlling the Water Content of Biomass Fast Pyrolysis Oil. Industrial & Engineering Chemistry Research, 2007. 46(26): p. 9238-9247.
50. Koukios, E., Progress in thermochemical, solid-state refining of biomass - from research to commercialization. 2 ed. Advances in thermochemical biomass conversion, ed. A. Bridgwater. 1993.
51. Yang, H., Yan, R., Chen, H., Lee, D.H., Zheng, C., Characteristics of hemicellulose, cellulose and lignin pyrolysis. Fuel, 2007. 86(12–13): p. 1781-1788.
52. Horne, P.A., and Williams, P.T., Influence of temperature on the products from the flash pyrolysis of biomass. Fuel, 1996. 75(9): p. 1051-1059.
53. Williams, P.T., and Nugranad, N., Comparison of products from the pyrolysis and catalytic pyrolysis of rice husks. Energy, 2000. 25(6): p. 493-513.
54. Balat, M., Balat, M., Kırtay, E., Balat, H., Main routes for the thermo-conversion of biomass into fuels and chemicals. Part 1: Pyrolysis systems. Energy Conversion and Management, 2009. 50(12): p. 3147-3157.
55. Zheng, J.-L., and Kong, Y.-P., Spray combustion properties of fast pyrolysis bio-oil produced from rice husk. Energy Conversion and Management, 2010. 51(1): p. 182-188.
56. Oasmaa, A., Peacocke, C., Gust, S., Meier, D., McLellan, R., Norms and Standards for Pyrolysis Liquids. End-User Requirements and Specifications. Energy & Fuels, 2005. 19(5): p. 2155-2163.
57. Diebold, J., Milne, T., Czernik, S., Oasmaa, A., Bridgwater, A., Cuevas, A. Gust, S., Huffman, F., Piskorz, J., Developments in Thermochemical Biomass Conversion, A.V. Bridgwater and D.G.B. Boocock, Editor. 1997, Blackie Academic and Professional: London. p. 433-447.
58. Lee, K.-H., Kang, B.-S., Park, Y.-K., Kim, J.-S., Influence of Reaction Temperature, Pretreatment, and a Char Removal System on the Production of Bio-oil from Rice Straw by Fast Pyrolysis, Using a Fluidized Bed. Energy & Fuels, 2005. 19(5): p. 2179-2184.
59. Raveendran, K., Ganesh, A., Khilar, K.C., Influence of mineral matter on biomass pyrolysis characteristics. Fuel, 1995. 74(12): p. 1812-1822.
60. Bridgwater, A.V., Catalysis in Thermal Biomass Conversion. Applied Catalysis a-General, 1994. 116(1-2): p. 5-47.
61. Alén, R., Kuoppala, E., Oesch, P., Formation of the main degradation compound groups from wood and its components during pyrolysis. Journal of Analytical and Applied Pyrolysis, 1996. 36(2): p. 137-148.
62. Oasmaa, A., Kuoppala, E., Gust, S., Solantausta, Y., Fast Pyrolysis of Forestry Residue. 1. Effect of Extractives on Phase Separation of Pyrolysis Liquids. Energy & Fuels, 2002. 17(1): p. 1-12.
63. Ramirez-Corredores, M.M., Chapter 6 - Pathways and Mechanisms of Fast Pyrolysis: Impact on Catalyst Research, in The Role of Catalysis for the Sustainable Production

140
of Bio-fuels and Bio-chemicals, T. Kostas, et al., Editors. 2013, Elsevier: Amsterdam. p. 161-216.
64. Patwardhan, P.R., Brown, R.C., Shanks, B.H., Product Distribution from the Fast Pyrolysis of Hemicellulose. ChemSusChem, 2011. 4(5): p. 636-643.
65. Asmadi, M., Kawamoto, H., Saka, S., Thermal reactivities of catechols/pyrogallols and cresols/xylenols as lignin pyrolysis intermediates. Journal of Analytical and Applied Pyrolysis, 2011. 92(1): p. 76-87.
66. Mansaray, K.G., and Ghaly, A.E., Thermal degradation of rice husks in nitrogen atmosphere. Bioresource Technology, 1998. 65(1–2): p. 13-20.
67. Worasuwannarak, N., Sonobe, T., Tanthapanichakoon, W., Pyrolysis behaviors of rice straw, rice husk, and corncob by TG-MS technique. Journal of Analytical and Applied Pyrolysis, 2007. 78(2): p. 265-271.
68. Hu, S., Jess, A., Xu, M., Kinetic study of Chinese biomass slow pyrolysis: Comparison of different kinetic models. Fuel, 2007. 86(17–18): p. 2778-2788.
69. Vlaev, L.T., Markovska, I.G., Lyubchev, L.A., Non-isothermal kinetics of pyrolysis of rice husk. Thermochimica Acta, 2003. 406(1–2): p. 1-7.
70. Chiang, W., Fang, H., Wu, C., Chang, C., Chang, Y., Shie, J., Pyrolysis Kinetics of Rice Husk in Different Oxygen Concentrations. Journal of Environmental Engineering, 2008. 134(4): p. 316-325.
71. Teng, H., Lin, H.-C., Ho, J.-A., Thermogravimetric Analysis on Global Mass Loss Kinetics of Rice Hull Pyrolysis. Industrial & Engineering Chemistry Research, 1997. 36(9): p. 3974-3977.
72. Isa, K.M., Daud, S., Hamidin, N., Ismail, K., Saad, S.A., Kasim, F.H., Thermogravimetric analysis and the optimisation of bio-oil yield from fixed-bed pyrolysis of rice husk using response surface methodology (RSM). Industrial Crops and Products, 2011. 33(2): p. 481-487.
73. Lu, Q., Zhu, X.F., Li, W.Z., Zhang, Y., Chen, D.Y., On-line catalytic upgrading of biomass fast pyrolysis products. Chinese Science Bulletin, 2009. 54(11): p. 1941-1948.
74. Tsai, W.T., Lee, M.K., Chang, Y.M., Fast pyrolysis of rice husk: Product yields and compositions. Bioresource Technology, 2007. 98(1): p. 22-28.
75. Heo, H.S., Park, H. J., Dong, J.-I., Park, S.H., Kim, S., Suh, D.J., Suh, Y.-W., Kim S.-S., Park, Y.-K, Fast pyrolysis of rice husk under different reaction conditions. Journal of Industrial and Engineering Chemistry, 2010. 16(1): p. 27-31.
76. Natarajan, E., Ganapathy Sundaram, E., Pyrolysis of rice husk in a fixed bed reactor. World Academy of Science, Engineering and Technology, 2009. 56: p. 504-508.
77. Meesuk, S., Cao, J.-P., Sato, K., Ogawa, Y., Takarada, T., Fast Pyrolysis of Rice Husk in a Fluidized Bed: Effects of the Gas Atmosphere and Catalyst on Bio-oil with a Relatively Low Content of Oxygen. Energy & Fuels, 2011. 25(9): p. 4113-4121.
78. Chen, T., Wu, C., Liu, R., Fei, W., Liu, S., Effect of hot vapor filtration on the characterization of bio-oil from rice husks with fast pyrolysis in a fluidized-bed reactor. Bioresource Technology, 2011. 102(10): p. 6178-6185.
79. Ji-lu, Z., Bio-oil from fast pyrolysis of rice husk: Yields and related properties and improvement of the pyrolysis system. Journal of Analytical and Applied Pyrolysis, 2007. 80(1): p. 30-35.
80. Roggero, C.M., Tumiatti, V., Scova, A., De Leo, C., Binello, A., Cravotto, G., Characterization of Oils from Haloclean (R) Pyrolysis of Biomasses. Energy Sources Part a-Recovery Utilization and Environmental Effects, 2011. 33(5): p. 467-476.
81. Li, R., Zhong, Z.-P., Jin, B.-S., Jiang, X.-X., Wang, C.-H., Zheng, A.-J., Influence of reaction conditions and red brick on fast pyrolysis of rice residue (husk and straw) in a spout-fluid bed. The Canadian Journal of Chemical Engineering, 2012. 90(5): p. 1202-1211.
82. Phan, A.N., Sharafi, V., Swithenbank, J., Effect of bed depth on characterisation of slow pyrolysis products. Fuel, 2009. 88(8): p. 1383-1387.
83. Wild, P.d., Biomass pyrolysis for chemicals, 2011. Ph.D, University of Groningen.
141
84. Salter, E.H., Catalytic Pyrolysis of Biomass for improved liquid fuel quality. 2001, Aston University: Birmingham.
85. Kaiqi, S., Shuangxi, S., Qiang, H., Xuwen, L., Lan, J., Ya, L., Review of catalytic pyrolysis of biomass for bio-oil. in International Conference on Materials for Renewable Energy & Environment (ICMREE), 2011.
86. Hagen, J., Industrial Catalysis a practical approach. 2006: Weinheim: Wiley-VCH. 87. French, R. and Czernik, S., Catalytic pyrolysis of biomass for biofuels production.
Fuel Processing Technology, 2010. 91(1): p. 25-32. 88. Neumann, G.T., and Hicks, J.C., Novel Hierarchical Cerium-Incorporated MFI Zeolite
Catalysts for the Catalytic Fast Pyrolysis of Lignocellulosic Biomass. ACS Catalysis, 2012. 2(4): p. 642-646.
89. Wang, S., Application of Solid Ash Based Catalysts in Heterogeneous Catalysis. Environmental Science & Technology, 2008. 42(19): p. 7055-7063.
90. Adam, J., Blazsó, M., Mészáros, E., Stöcker, M., Nilsen, M.H., Bouzga, A., Hustad, J.E., Grønli, M., Øye, G., Pyrolysis of biomass in the presence of Al-MCM-41 type catalysts. Fuel, 2005. 84(12–13): p. 1494-1502.
91. Adam, J., Antonakou, E., Lappas, A., Stöcker, M., Nilsen, M.H., Bouzga, A., Hustad, J. E., Øye, G., In situ catalytic upgrading of biomass derived fast pyrolysis vapours in a fixed bed reactor using mesoporous materials. Microporous and Mesoporous Materials, 2006. 96(1–3): p. 93-101.
92. Antonakou, E., Lappas, A., Nilsen, M.H., Bouzga, A., Stöcker, M., Evaluation of various types of Al-MCM-41 materials as catalysts in biomass pyrolysis for the production of bio-fuels and chemicals. Fuel, 2006. 85(14–15): p. 2202-2212.
93. Iliopoulou, E.F., Antonakou, E.V., Karakoulia, S.A., Vasalos, I.A., Lappas, A.A., Triantafyllidis, K. S., Catalytic conversion of biomass pyrolysis products by mesoporous materials: Effect of steam stability and acidity of Al-MCM-41 catalysts. Chemical Engineering Journal, 2007. 134(1–3): p. 51-57.
94. Nilsen, M.H., Antonakou, E., Bouzga, A., Lappas, A., Mathisen, K., Stöcker, M. Investigation of the effect of metal sites in Me–Al-MCM-41 (Me = Fe, Cu, Zn) on the catalytic behavior during the pyrolysis of wooden based biomass. Microporous and Mesoporous Materials, 2007. 105(1–2): p. 189-203.
95. Triantafyllidis, K.S., Iliopoulou, E.F., Antonakou, E.V., Lappas, A.A., Wang, H., Pinnavaia, T.J., Hydrothermally stable mesoporous aluminosilicates (MSU-S) assembled from zeolite seeds as catalysts for biomass pyrolysis. Microporous and Mesoporous Materials, 2007. 99(1–2): p. 132-139.
96. Lu, Q., Zhang, Y., Tang, Z., Li, W.-z., Zhu, X.-f., Catalytic upgrading of biomass fast pyrolysis vapors with titania and zirconia/titania based catalysts. Fuel, 2010. 89(8): p. 2096-2103.
97. Lu, Q., Tang, Z., Zhang, Y., Zhu, X.-f., Catalytic Upgrading of Biomass Fast Pyrolysis Vapors with Pd/SBA-15 Catalysts. Industrial & Engineering Chemistry Research, 2010. 49(6): p. 2573-2580.
98. Nokkosmäki, M.I., Kuoppala, E.T., Leppämäki, E.A., Krause, A.O.I., Catalytic conversion of biomass pyrolysis vapours with zinc oxide. Journal of Analytical and Applied Pyrolysis, 2000. 55(1): p. 119-131.
99. Ateş, F., Pütün, A.E., Pütün, E., Fixed bed pyrolysis of Euphorbia rigida with different catalysts. Energy Conversion and Management, 2005. 46(3): p. 421-432.
100. Ateş, F., Pütün, A.E., Pütün, E., Pyrolysis of two different biomass samples in a fixed-bed reactor combined with two different catalysts. Fuel, 2006. 85(12–13): p. 1851-1859.
101. Chattopadhyay, J., Kim, C., Kim, R., Pak, D., Thermogravimetric study on pyrolysis of biomass with Cu/Al2O3 catalysts. Journal of Industrial and Engineering Chemistry, 2009. 15(1): p. 72-76.
102. Gökdai, Z., Sınağ, A., Yumak, T., Comparison of the catalytic efficiency of synthesized nano tin oxide particles and various catalysts for the pyrolysis of hazelnut shell. Biomass and Bioenergy, 2010. 34(3): p. 402-410.

142
103. Lu, Q., Xiong, W.-M., Li, W.-Z., Guo Q.-X., Zhu, X.-F., Catalytic pyrolysis of cellulose with sulfated metal oxides: A promising method for obtaining high yield of light furan compounds. Bioresource Technology, 2009. 100(20): p. 4871-4876.
104. Yusof, A., Nizam, N., Rashid, N., Hydrothermal conversion of rice husk ash to faujasite-types and NaA-type of zeolites. Journal of Porous Materials, 2010. 17(1): p. 39-47.
105. Ketcome, N., Grisdanurak, N., Chiarakorn, S., Silylated rice husk MCM-41 and its binary adsorption of water–toluene mixture. Journal of Porous Materials, 2009. 16(1): p. 41-46.
106. Wantala, K., Sthiannopkao, S., Srinameb, B.-o., Grisdanurak, N., Kim, K., Synthesis and characterization of Fe-MCM-41 from rice husk silica by hydrothermal technique for arsenate adsorption. Environmental Geochemistry and Health, 2010. 32(4): p. 261-266.
107. Chumee, J., Grisdanurak, N., Neramittagapong, S., Wittayakun, J., Characterization of AlMCM-41 synthesized with rice husk silica and utilization as supports for platinumiron catalysts. Brazilian Journal of Chemical Engineering, 2009. 26: p. 367-373.
108. Scholze, B., Long-term Stability, Catalytic Upgrading, and Application of Pyrolysis Oils - Improving the Properties of a Potential Substitute for Fossil Fuels. 2002, PhD Thesis, Universität Hamburg: Hamburg.
109. Bru, K., Blin, J., Julbe, A., Volle, G., Pyrolysis of metal impregnated biomass: An innovative catalytic way to produce gas fuel. Journal of Analytical and Applied Pyrolysis, 2007. 78(2): p. 291-300.
110. Mayer, Z.A., Apfelbacher, A., Hornung, A., A comparative study on the pyrolysis of metal- and ash-enriched wood and the combustion properties of the gained char. Journal of Analytical and Applied Pyrolysis, 2012. 96(0): p. 196-202.
111. Dayton, D.C., Jenkins, B.M., Turn, S.Q., Bakker, R.R., Williams, R.B., Belle-Oudry, D., Hill, L.M., Release of Inorganic Constituents from Leached Biomass during Thermal Conversion. Energy & Fuels, 1999. 13(4): p. 860-870.
112. Boger, T., Heibel, A.K., Sorensen, C.M., Monolithic Catalysts for the Chemical Industry. Industrial & Engineering Chemistry Research, 2004. 43(16): p. 4602-4611.
113. Antia, J.E., Govind, R., Applications of binderless zeolite-coated monolithic reactors. Applied Catalysis A: General, 1995. 131(1): p. 107-120.
114. Dorado, F., Romero, R., Cañizares, P., Influence of Clay Binders on the Performance of Pd/HZSM-5 Catalysts for the Hydroisomerization of n-Butane. Industrial & Engineering Chemistry Research, 2001. 40(16): p. 3428-3434.
115. Uguina, M.A., Sotelo, J.L., Serrano, D.P., Toluene disproportionation over ZSM-5 zeolite: Effects of crystal size, silicon-to-aluminum ratio, activation method and pelletization. Applied Catalysis, 1991. 76(2): p. 183-198.
116. Cañizares, P., Durán, A., Dorado, F., Carmona, M., The role of sodium montmorillonite on bounded zeolite-type catalysts. Applied Clay Science, 2000. 16(5–6): p. 273-287.
117. Gayubo, A.G., Aguayo, A.T., Atutxa, A., Prieto, R., Bilbao, J., Deactivation of a HZSM-5 Zeolite Catalyst in the Transformation of the Aqueous Fraction of Biomass Pyrolysis Oil into Hydrocarbons. Energy & Fuels, 2004. 18(6): p. 1640-1647.
118. Carlson, T.R., Tompsett, G.A., Conner, W.C., Huber, G.W., Aromatic Production from Catalytic Fast Pyrolysis of Biomass-Derived Feedstocks. Topics in Catalysis, 2009. 52(3): p. 241-252.
119. Aho, A., Kumar, N., Eränen, K., Salmi, T., Hupa, M., Murzin, D.Y., Catalytic pyrolysis of woody biomass in a fluidized bed reactor: Influence of the zeolite structure. Fuel, 2008. 87(12): p. 2493-2501.
120. Jae, J., Tompsett, G.A., Foster, A.J., Hammond, K.D., Auerbach, S.M., Lobo R.F., Huber, G.W., Investigation into the shape selectivity of zeolite catalysts for biomass conversion. Journal of Catalysis, 2011. 279(2): p. 257-268.

143
121. Sutton, D., Kelleher, B., Ross, J.R.H., Review of literature on catalysts for biomass gasification. Fuel Processing Technology, 2001. 73(3): p. 155-173.
122. Chen, I., and Shiue, D.W., Resistivity to sulfur poisoning of nickel-alumina catalysts. Industrial & Engineering Chemistry Research, 1988. 27(8): p. 1391-1396.
123. Contreras, J.L., and Fuentes, G.A., Sintering of Supported Metal Catalysts, in Sintering - Methods and Products, D.V. Shatokha, Editor. 2012.
124. Ma, Z., Troussard, E., van Bokhoven, J.A., Controlling the selectivity to chemicals from lignin via catalytic fast pyrolysis. Applied Catalysis A: General, 2012. 423–424(0): p. 130-136.
125. Trimm, D.L., The regeneration or disposal of deactivated heterogeneous catalysts. Applied Catalysis A: General, 2001. 212(1–2): p. 153-160.
126. Vitolo, S., Bresci, B., Seggiani, M., Gallo, M.G., Catalytic upgrading of pyrolytic oils over HZSM-5 zeolite: behaviour of the catalyst when used in repeated upgrading–regenerating cycles. Fuel, 2001. 80(1): p. 17-26.
127. Bozi, J. and Blazso, M., Catalytic modification of pyrolysis products of nitrogen-containing polymers over Y zeolites. Green Chemistry, 2009. 11(10): p. 1638-1645.
128. Heck, R.M., Farrauto, R.J., Catalytic Air Pollution Control, Commercial Technology. 1994, Van Nostrand Reinhold: New York. p. 156-158.
129. Guo, X., Zheng, Y., Zhang, B., Chen, J., Analysis of coke precursor on catalyst and study on regeneration of catalyst in upgrading of bio-oil. Biomass and Bioenergy, 2009. 33(10): p. 1469-1473.
130. Jeon, M.-J., Kim, S.-S., Jeon, J.-K., Park, S.H., Kim, J.M., Sohn, J.M., Lee S.-H., Park, Y.-K., Catalytic pyrolysis of waste rice husk over mesoporous materials. Nanoscale Research Letters, 2012. 7(1): p. 18.
131. Yan, Z., Shurong, W., Xiujuan, G., Mengxiang, F., Zhongyang, L., Catalytic pyrolysis of cellulose with zeolites. in Sustainable Technologies (WCST), 2011 World Congress on. 2011.
132. Samolada, M.C., Papafotica, A., Vasalos, I.A., Catalyst Evaluation for Catalytic Biomass Pyrolysis. Energy & Fuels, 2000. 14(6): p. 1161-1167.
133. Torri, C., Lesci, I.G., Fabbri, D., Analytical study on the pyrolytic behaviour of cellulose in the presence of MCM-41 mesoporous materials. Journal of Analytical and Applied Pyrolysis, 2009. 85(1–2): p. 192-196.
134. Carlson, T.R., Jae, J., Lin, Y.-C., Tompsett, G.A., Huber, G.W., Catalytic fast pyrolysis of glucose with HZSM-5: The combined homogeneous and heterogeneous reactions. Journal of Catalysis, 2010. 270(1): p. 110-124.
135. Mullen, C.A. and Boateng, A.A., Catalytic pyrolysis-GC/MS of lignin from several sources. Fuel Processing Technology, 2010. 91(11): p. 1446-1458.
136. American Society for Testing and Materials International, ASTM E1757-01 Standard Practice for Preparation of Biomass for Compositional Analysis. 2007, ASTM: United States.
137. British Standard Institution, BS EN 14774-3:2009 Solid biofuels – Determination of moisture content – Oven dry method – Part 3: Moisture in general analysis sample: London.
138. British Standard Institution, BS EN 15148:2009 Solid biofuels – Determination of the content of volatile matter: London.
139. British Standard Institution, BS EN 14775:2009 Solid biofuels – Determination of the ash content: London.
140. American Society for Testing and Materials International, A.D.-. Standard test methods for proximate analysis of coal and coke by macro thermogravimetric analysis, ASTM International, Editor.
141. Biomass Research and Development, Glossary, 2010. Accessed: 17/01/2013; Available from: http://www.usbiomassboard.gov/related_information/glossary.html.
142. Foss Analytical AB, Determination of amylase treated Neutral Detergent Fibre using the Fibertec system according to AOAC 2002:04/ISO 16472:2005. 2003.
144
143. Foss Analytical AB, Determination of Acid Detergent Fibre (ADF) and Acid Detergent Lignin (ADL) using Fibercap™ 2021/2023. 2003.
144. Du, L., Yu, P., Rossnagel, B.G., Christensen, D.A., McKinnon, J.J., Physicochemical Characteristics, Hydroxycinnamic Acids (Ferulic Acid, p-Coumaric Acid) and Their Ratio, and in Situ Biodegradability: Comparison of Genotypic Differences among Six Barley Varieties. Journal of Agricultural and Food Chemistry, 2009. 57(11): p. 4777-4783.
145. Carrier, M., Loppinet-Serani, A., Denux, D., Lasnier, J.-M., Ham-Pichavant, F., Cansell, F., Aymonier, C., Thermogravimetric analysis as a new method to determine the lignocellulosic composition of biomass. Biomass and Bioenergy, 2011. 35(1): p. 298-307.
146. ASTM International, ASTM D5865 Standard Test Method for Gross Calorific Value of Coal and Coke. 2007, ASTM International: United States.
147. Phyllis. Database for biomass and waste. 2012; Available from: http://www.ecn.nl/phyllis/defs.asp.
148. Keattch, C.J., and Dollimore, D., An Introduction to Thermogravimetry. 2nd ed. 1975: Heydon & Son Ltd.
149. ASTM International, ASTM Standard D1744, Standard Test Method for Determination of Water in Liquid Petroleum Products by Karl Fisher Reagent. 1992: West Conshohocken, PA.
150. Channiwala, S.A. and Parikh, P.P., A unified correlation for estimating HHV of solid, liquid and gaseous fuels. Fuel, 2002. 81(8): p. 1051-1063.
151. Mansaray, K.G. and Ghaly, A.E., Physical and Thermochemical Properties of Rice Husk. Energy Sources, 1997. 19(9): p. 989-1004.
152. Greenhalf, C.E., Nowakowski, D.J., Harms, A.B., Titiloye, J.O., Bridgwater, A.V., A comparative study of straw, perennial grasses and hardwoods in terms of fast pyrolysis products. Fuel, 2013. 108(0): p. 216-230.
153. Liu, Q., Wang, S., Wang, K., Luo, Z., Cen, K., Pyrolysis of wood species based on the compositional analysis. Korean Journal of Chemical Engineering, 2009. 26(2): p. 548-553.
154. Sheng, C., and Azevedo, J.L.T., Estimating the higher heating value of biomass fuels from basic analysis data. Biomass and Bioenergy, 2005. 28(5): p. 499-507.
155. Obernberger, I., and Thek, G., Physical characterisation and chemical composition of densified biomass fuels with regard to their combustion behaviour. Biomass and Bioenergy, 2004. 27(6): p. 653-669.
156. Nowakowski, D.J., Woodbridge, C.R., Jones, J.M., Phosphorus catalysis in the pyrolysis behaviour of biomass. Journal of Analytical and Applied Pyrolysis, 2008. 83(2): p. 197-204.
157. Lu, Q., Yang, X.-l., Zhu, X.-f., Analysis on chemical and physical properties of bio-oil pyrolyzed from rice husk. Journal of Analytical and Applied Pyrolysis, 2008. 82(2): p. 191-198.
158. J. Lehto, A.O., Solantausta, Y., Kyto, M., Chiaramonti, D., Fuel oil quality and combustion of fast pyrolysis bio-oils, in VTT Technology 87. 2013. p. 79.
159. Demirbas, A., Determination of calorific values of bio-chars and pyro-oils from pyrolysis of beech trunkbarks. Journal of Analytical and Applied Pyrolysis, 2004. 72(2): p. 215-219.
160. Song, Q.-H., Nie, J.-Q., Ren, M.-G., Guo, Q.-X., Effective Phase Separation of Biomass Pyrolysis Oils by Adding Aqueous Salt Solutions. Energy & Fuels, 2009. 23(6): p. 3307-3312.
161. Chen, H.-W., Song, Q.-H., Liao, B., Guo, Q.-X., Further Separation, Characterization, and Upgrading for Upper and Bottom Layers from Phase Separation of Biomass Pyrolysis Oils. Energy & Fuels, 2011. 25(10): p. 4655-4661.
162. Guo, X., Wang, S., Wang, Q., Guo, Z., Luo, Z., Properties of Bio-oil from Fast Pyrolysis of Rice Husk. Chinese Journal of Chemical Engineering, 2011. 19(1): p. 116-121.

145
163. A. Oasmaa, Leppamaki, E., Koponen, P., Levander, J., Tapola, E., Physical characterisation of biomass-based pyrolysis liquids, Application of standard fuel oil analyses. 1997.
164. Green, D.W, and Perry, R.H., Perry's Chemical Engineers' Handbook. 6th ed. 1984: McGraw-Hill.
165. Nolte, M.W. and Liberatore, M.W., Viscosity of Biomass Pyrolysis Oils from Various Feedstocks. Energy & Fuels, 2010. 24: p. 6601-6608.
166. Bunting, B., Boyd, A., Pyrolysis oil properties and chemistry related to process and upgrade conditions for pipeline shipment. 2012, Oak Ridge National Laboratory.
167. Cao, Q., Jin, L.e., Bao, W., Lv, Y., Investigations into the characteristics of oils produced from co-pyrolysis of biomass and tire. Fuel Processing Technology, 2009. 90(3): p. 337-342.
168. McKendry, P., Energy production from biomass (part 1): overview of biomass. Bioresource Technology, 2002. 83(1): p. 37-46.
169. Lin, Y.-C., Cho, J., Tompsett, G.A., Westmoreland, P.R., Huber, G.W., Kinetics and Mechanism of Cellulose Pyrolysis. The Journal of Physical Chemistry C, 2009. 113(46): p. 20097-20107.
170. de Wild, P., H. Reith, and E. Heeres, Biomass pyrolysis for chemicals. Biofuels, 2011. 2(2): p. 185-208.
171. Amen-Chen, C., Pakdel, H., Roy, C., Production of monomeric phenols by thermochemical conversion of biomass: a review. Bioresource Technology, 2001. 79(3): p. 277-299.
172. Thangalazhy-Gopakumar, S., Adhikari, S., Gupta, R.B., Fernando, S.D., Influence of Pyrolysis Operating Conditions on Bio-Oil Components: A Microscale Study in a Pyroprobe. Energy & Fuels, 2011. 25(3): p. 1191-1199.
173. Britt, P.F., BuchananIII, A.C., Matineau, D.R., (1999) Flash Vacuum Pyrolysis of Lignin Model Compounds: Reaction Pathways of Aromatic Methoxy Groups.
174. Hwang, B.-h., and Obst, J.R., Basic Studies on the Pyrolysis of Lignin Compounds. in Proceedings of the International Conference on Forest products. Better Utilization of Wood for Human, Earth and Future. 2003. Daejeon, KOREA.: Korean Society of Wood Science and Technology, International Association of Wood Products Societies.
175. Demirbaş, A., Mechanisms of liquefaction and pyrolysis reactions of biomass. Energy Conversion and Management, 2000. 41(6): p. 633-646.
176. Pattiya, A., Titiloye, J.O., Bridgwater, A.V., Fast pyrolysis of cassava rhizome in the presence of catalysts. Journal of Analytical and Applied Pyrolysis, 2008. 81(1): p. 72-79.

146
APPENDIX A – LIST OF PUBLICATIONS
Publication made during the course of this study is listed below.
1. M.S. Abu Bakar, J.O. Titiloye. Thermochemical properties of Brunei rice husks and
suitability for thermal conversion via pyrolysis process. Brunei Darussalam Journal of
Technology and Commerce, 6 (2012).
2. M.S. Abu Bakar, J.O. Titiloye. Catalytic pyrolysis of rice husks for bio-oil production.
Journal of Analytical and Applied Pyrolysis 103 (2013), p. 362-368.
http://dx.doi.org/10.1016/j.jaap.2012.09.005
3. M.S. Abu Bakar, J.O. Titiloye, T.E. Odetoye. Catalytic pyrolysis of rice husk, jatropha
curcas and parinari polyandra with ZSM-5. Sustainable Future Energy 2012 and 10th SEE
Forum, Bandar Seri Begawan, Brunei Darussalam, 2012: A-28.
4. T.E Odetoye, K.R. Onifade, M.S. Abu Bakar, J.O. Titiloye. Thermochemical
characterisation of Parinari polyandra Benth fruit shell. Industrial Crops and Products, 44
(2013), p. 62-66.
5. J.O. Titiloye, M.S. Abu Bakar, T.E. Odetoye. Thermochemical characterisation of
Agricultural Wastes from West Africa. Industrial Crops and Products, 47 (2013), p. 199-203.
6. T.E Odetoye, K.R. Onifade, M.S. Abu Bakar, J.O. Titiloye. Pyrolysis of Parinari
polyandra Benth fruit shell for bio-oil production (In progress)
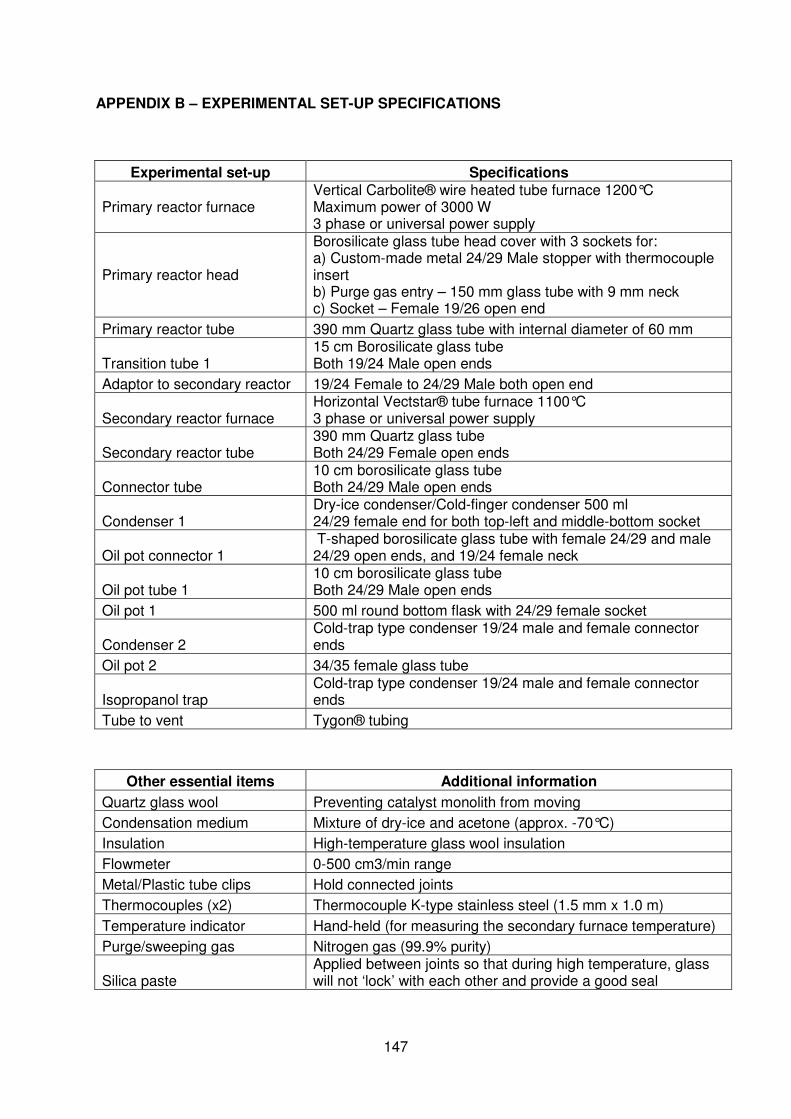
147
APPENDIX B – EXPERIMENTAL SET-UP SPECIFICATIONS
Experimental set-up Specifications
Primary reactor furnace
Vertical Carbolite® wire heated tube furnace 1200°C Maximum power of 3000 W 3 phase or universal power supply
Primary reactor head
Borosilicate glass tube head cover with 3 sockets for: a) Custom-made metal 24/29 Male stopper with thermocouple insert b) Purge gas entry – 150 mm glass tube with 9 mm neck c) Socket – Female 19/26 open end
Primary reactor tube 390 mm Quartz glass tube with internal diameter of 60 mm
Transition tube 1 15 cm Borosilicate glass tube Both 19/24 Male open ends
Adaptor to secondary reactor 19/24 Female to 24/29 Male both open end
Secondary reactor furnace Horizontal Vectstar® tube furnace 1100°C 3 phase or universal power supply
Secondary reactor tube 390 mm Quartz glass tube Both 24/29 Female open ends
Connector tube 10 cm borosilicate glass tube Both 24/29 Male open ends
Condenser 1 Dry-ice condenser/Cold-finger condenser 500 ml 24/29 female end for both top-left and middle-bottom socket
Oil pot connector 1 T-shaped borosilicate glass tube with female 24/29 and male 24/29 open ends, and 19/24 female neck
Oil pot tube 1 10 cm borosilicate glass tube Both 24/29 Male open ends
Oil pot 1 500 ml round bottom flask with 24/29 female socket
Condenser 2 Cold-trap type condenser 19/24 male and female connector ends
Oil pot 2 34/35 female glass tube
Isopropanol trap Cold-trap type condenser 19/24 male and female connector ends
Tube to vent Tygon® tubing
Other essential items Additional information
Quartz glass wool Preventing catalyst monolith from moving
Condensation medium Mixture of dry-ice and acetone (approx. -70°C)
Insulation High-temperature glass wool insulation
Flowmeter 0-500 cm3/min range
Metal/Plastic tube clips Hold connected joints
Thermocouples (x2) Thermocouple K-type stainless steel (1.5 mm x 1.0 m)
Temperature indicator Hand-held (for measuring the secondary furnace temperature)
Purge/sweeping gas Nitrogen gas (99.9% purity)
Silica paste Applied between joints so that during high temperature, glass will not ‘lock’ with each other and provide a good seal

148
APPENDIX C – MASS BALANCE SHEET