document-level machine translation quality...
TRANSCRIPT
Document-Level Machine TranslationQuality Estimation
A Thesis submitted to the University of Sheffield for the degree of Doctor ofPhilosophy in the Faculty of Engineering
by
Carolina Scarton
Department of Computer Science
University of Sheffield
September 2016


Acknowledgements
I would like to acknowledge the EXPERT project (EXPlointing Empirical appRoaches toTranslation - Marie Curie FP7 ITN n. 317471) for the financial support, the opportunity tonetworking with the brightest minds in the Machine Translation area and for supporting andencouraging internships.
Special thanks must go to my supervisor, Lucia Specia, for her guidance and friendshipthroughout the last three years. Lucia is always kind and positive, which makes the differenceduring the “dark periods” of the PhD life. She also gave me unconditional support fromcorrecting my English writing mistakes to discussing crucial research ideas, without whichthis PhD would not be possible. It has been an amazing opportunity to work with her and herteam in Sheffield.
Special thanks to Rob Gaizauskas and Eleni Vasilaki, that were members of my PhDpanel committee, for their extremely helpful advice at the early stages of my research. I amalso thankful to my PhD examiners, Marco Turchi and Mark Stevenson, for making the vivaprocess a fruitful chat that resulted in the improvement of this thesis.
Many thanks to Constantin Orasan for the hard work done in organising the EXPERTproject, and to all senior and early stage researches involved in this project, mainly to Josefvan Genabith, from Saarland University in Germany, and Manuel Herraz and Alex Helle,from Pangeanic in Spain, for supervising me during my secondments. Special thanks mustgo to Liling, Rohit, José Manuel, Marcos, Mihaela, Peggy, Stefania, Karin, Andrea, Katrin,Ashraf, Katja and Jörg from Saarland University for the collaboration and friendship duringmy time in Saarbrücken, and to Varvara, Hannah, Hoang and Carla, EXPERT early stage andexperienced researches that I had the opportunity to interact with in Sheffield.
I am also very thankful to my Master’s supervisor Sandra Maria Aluísio and to MagaliSanches Duran, from the University of São Paulo, for all the support and collaboration alongall these years. I would also like to thank all teachers from the Professora Alva Fabri Mirandaand Colégio Técnico Industrial schools and lectures from the University of São Paulo thatplayed an important role in my education.
ii
Many thanks to my colleagues in the Natural Language Processing group for making thework environment very pleasant. Especially to Fred, Kashif, Daniel, Gustavo, Roland, Karin,David, Andreas and Ahmet for all the conversations about research and non-related topics,all the coffee breaks and all after-work drinks.
Many thanks to my friends Kim, Wilker, Marialaura, Miguel, Victor, Teo, Tiago, Clau-dia, Jorge, Angela, Raluca, Marta, Umberto, Eletta, Carol and Fer for making part of myunforgettable time outside Brazil. I would also like to thank my jiu-jitsu team at The 5 RingsGrappling Academy (The Forge), especially my coaches John, Gregg and Paulinho. Specialthanks must also go to Lara, João, Iara, Raquel, Camila, Diego, Shimizu, Bigão, Tiago,Boulos, Vilma, Luiz, Bete, Silvana, Célio and Eduardo, my Brazilian friends that, apart fromthe distance, were always there for me.
Many many thanks to my future husband, Brett, for all the patience, support and love. Iwould also like to thank Natalie, Michael, Cyril and Gisselle (Brett’s family) for acceptingme as part of their family, which helps a lot when I am homesick. Special thanks must go tomy parents Luis and Lourdes and my brother Daniel for all the love, for believing in me andfor supporting me in pursuing my dreams even though it kept us apart. Many thanks also toRita, Sidnei, Sofia, Pedro, Vó Dalva, Vó Maria, Natalia, Carlos, Inês, Paulo and Lucas (myfamily) for all the support and love during these three years. Finally, very special thanks tomy beloved granddad Antonio for everything that I have learnt from him and for his loveduring the time he was here with us.

Abstract
Assessing Machine Translation (MT) quality at document level is a challenge as metrics needto account for many linguistic phenomena on different levels. Large units of text encompassdifferent linguistic phenomena and, as a consequence, a machine translated document canhave different problems. It is hard for humans to evaluate documents regarding document-wide phenomena (e.g. coherence) as they get easily distracted by problems at other levels(e.g. grammar). Although standard automatic evaluation metrics (e.g. BLEU) are oftenused for this purpose, they focus on n-grams matches and often disregard document-wideinformation. Therefore, although such metrics are useful to compare different MT systems,they may not reflect nuances of quality in individual documents.
Machine translated documents can also be evaluated according to the task they willbe used for. Methods based on measuring the distance between machine translations andpost-edited machine translations are widely used for task-based purposes. Another task-basedmethod is to use reading comprehension questions about the machine translated document,as a proxy of the document quality. Quality Estimation (QE) is an evaluation approach thatattempts to predict MT outputs quality, using trained Machine Learning (ML) models. Thismethod is robust because it can consider any type of quality assessment for building theQE models. Thus far, for document-level QE, BLEU-style metrics were used as qualitylabels, leading to unreliable predictions, as document information is neglected. Challengesof document-level QE encompass the choice of adequate labels for the task, the use ofappropriate features for the task and the study of appropriate ML models.
In this thesis we focus on feature engineering, the design of quality labels and the useof ML methods for document-level QE. Our new features can be classified as document-wide (use shallow document information), discourse-aware (use information about discoursestructures) and consensus-based (use other machine translations as pseudo-references). Newlabels are proposed in order to overcome the lack of reliable labels for document-levelQE. Two different approaches are proposed: one aimed at MT for assimilation with a lowrequirement, and another aimed at MT for dissemination with a high quality requirement.The assimilation labels use reading comprehension questions as a proxy of document quality.

iv
The dissemination approach uses a two-stage post-editing method to derive the quality labels.Different ML techniques are also explored for the document-level QE task, including theappropriate use of regression or classification and the study of kernel combination to deal withfeatures of different nature (e.g. handcrafted features versus consensus features). We showthat, in general, QE models predicting our new labels and using our discourse-aware featuresare more successful than models predicting automatic evaluation metrics. Regarding MLtechniques, no conclusions could be drawn, given that different models performed similarlythroughout the different experiments.

Table of contents
List of figures ix
List of tables xiii
List of Acronyms xv
1 Introduction 11.1 Aims and Objectives . . . . . . . . . . . . . . . . . . . . . . . . . . . . . 6
1.2 Contributions . . . . . . . . . . . . . . . . . . . . . . . . . . . . . . . . . 7
1.3 Published Material . . . . . . . . . . . . . . . . . . . . . . . . . . . . . . 9
1.4 Structure of the Thesis . . . . . . . . . . . . . . . . . . . . . . . . . . . . 10
2 Machine Translation Evaluation 132.1 Manual Evaluation . . . . . . . . . . . . . . . . . . . . . . . . . . . . . . 14
2.2 Automatic Evaluation Metrics . . . . . . . . . . . . . . . . . . . . . . . . 16
2.3 Task-based Evaluation . . . . . . . . . . . . . . . . . . . . . . . . . . . . 20
2.3.1 Post-editing Effort . . . . . . . . . . . . . . . . . . . . . . . . . . 21
2.3.2 End-user-based Evaluation . . . . . . . . . . . . . . . . . . . . . . 24
2.4 Quality Estimation . . . . . . . . . . . . . . . . . . . . . . . . . . . . . . 28
2.4.1 Introduction . . . . . . . . . . . . . . . . . . . . . . . . . . . . . . 28
2.4.2 Document-level Prediction . . . . . . . . . . . . . . . . . . . . . . 31
2.4.3 Previous Work on Linguistic Features for QE . . . . . . . . . . . . 35
2.4.4 QUEST++: a Toolkit for QE . . . . . . . . . . . . . . . . . . . . . 38
2.5 Discussion . . . . . . . . . . . . . . . . . . . . . . . . . . . . . . . . . . . 39
3 Discourse Processing 413.1 Discourse Processing Background . . . . . . . . . . . . . . . . . . . . . . 42
3.2 Large Units of Discourse and Topics . . . . . . . . . . . . . . . . . . . . . 43

vi Table of contents
3.2.1 Topic Modelling . . . . . . . . . . . . . . . . . . . . . . . . . . . 44
3.2.2 Word Embeddings . . . . . . . . . . . . . . . . . . . . . . . . . . 46
3.2.3 Lexical Cohesion . . . . . . . . . . . . . . . . . . . . . . . . . . . 47
3.3 Coreference Resolution . . . . . . . . . . . . . . . . . . . . . . . . . . . . 50
3.3.1 Anaphora Resolution . . . . . . . . . . . . . . . . . . . . . . . . . 51
3.3.2 Local Coherence . . . . . . . . . . . . . . . . . . . . . . . . . . . 53
3.4 Small Units of Discourse . . . . . . . . . . . . . . . . . . . . . . . . . . . 55
3.4.1 Discourse connectives . . . . . . . . . . . . . . . . . . . . . . . . 55
3.4.2 RST . . . . . . . . . . . . . . . . . . . . . . . . . . . . . . . . . . 58
3.5 Discussion . . . . . . . . . . . . . . . . . . . . . . . . . . . . . . . . . . . 61
4 Document-level QE: Feature Engineering 634.1 Document-aware Features . . . . . . . . . . . . . . . . . . . . . . . . . . 65
4.2 Discourse-aware Features . . . . . . . . . . . . . . . . . . . . . . . . . . . 67
4.2.1 Large Units of Discourse and Topics . . . . . . . . . . . . . . . . . 68
4.2.2 Coreference Resolution . . . . . . . . . . . . . . . . . . . . . . . . 72
4.2.3 Small Units of Discourse . . . . . . . . . . . . . . . . . . . . . . . 73
4.3 Word Embeddings Features . . . . . . . . . . . . . . . . . . . . . . . . . . 75
4.4 Consensus Features . . . . . . . . . . . . . . . . . . . . . . . . . . . . . . 75
4.5 Feature Analysis . . . . . . . . . . . . . . . . . . . . . . . . . . . . . . . 76
4.6 Discussion . . . . . . . . . . . . . . . . . . . . . . . . . . . . . . . . . . . 83
5 Document-level QE: Prediction 855.1 Experimental Settings . . . . . . . . . . . . . . . . . . . . . . . . . . . . . 86
5.2 Experiments with a Large Corpus: FAPESP Data . . . . . . . . . . . . . . 89
5.2.1 MT System-specific Models . . . . . . . . . . . . . . . . . . . . . 90
5.2.2 MT Multiple-systems Models . . . . . . . . . . . . . . . . . . . . 93
5.3 Experiments with Multiple Language Pairs: WMT Data . . . . . . . . . . . 95
5.4 Experiments with HTER: LIG corpus . . . . . . . . . . . . . . . . . . . . 104
5.5 Problems with Automatic Metrics as Labels for Document-level QE . . . . 105
5.6 Discussion . . . . . . . . . . . . . . . . . . . . . . . . . . . . . . . . . . . 110
6 New Quality Labels for Document-level QE 1156.1 Preliminary Experiments . . . . . . . . . . . . . . . . . . . . . . . . . . . 116
6.1.1 Experimental Settings . . . . . . . . . . . . . . . . . . . . . . . . 116
6.1.2 Human Assessments: Cohesion and Coherence . . . . . . . . . . . 118

Table of contents vii
6.1.3 Two-stage Post-editing . . . . . . . . . . . . . . . . . . . . . . . . 1196.2 Dissemination: Two-stage Post-editing . . . . . . . . . . . . . . . . . . . . 1236.3 Assimilation Labels: Reading Comprehension Tests . . . . . . . . . . . . . 131
6.3.1 Experiments with CREG-mt-eval Corpus . . . . . . . . . . . . . . 1326.3.2 Experiments with the MCtest-mt-eval Corpus . . . . . . . . . . . . 142
6.4 Discussion . . . . . . . . . . . . . . . . . . . . . . . . . . . . . . . . . . . 147
7 Conclusions 1497.1 Future Work . . . . . . . . . . . . . . . . . . . . . . . . . . . . . . . . . . 151
A QUEST++ features 153
B Guidelines for quality annotation of MT outputs at paragraph level: discourseerrors 161B.1 Presentation . . . . . . . . . . . . . . . . . . . . . . . . . . . . . . . . . . 161B.2 Definitions . . . . . . . . . . . . . . . . . . . . . . . . . . . . . . . . . . . 161B.3 Examples . . . . . . . . . . . . . . . . . . . . . . . . . . . . . . . . . . . 162
B.3.1 Coherence . . . . . . . . . . . . . . . . . . . . . . . . . . . . . . 162B.3.2 Cohesion . . . . . . . . . . . . . . . . . . . . . . . . . . . . . . . 164
B.4 Task description . . . . . . . . . . . . . . . . . . . . . . . . . . . . . . . . 166
References 169

List of figures
2.1 General framework of Quality Estimation: training stage . . . . . . . . . . 31
2.2 General framework of Quality Estimation: predicting quality of unseen data 32
2.3 QUEST++ framework structure . . . . . . . . . . . . . . . . . . . . . . . . 39
3.1 Example of RST relation between two EDUs. . . . . . . . . . . . . . . . . 59
4.1 Pearson’s r correlation between target features and HTER values on the LIGcorpus. . . . . . . . . . . . . . . . . . . . . . . . . . . . . . . . . . . . . . 79
4.2 Spearman’s ρ correlation between target features and HTER values on theLIG corpus. . . . . . . . . . . . . . . . . . . . . . . . . . . . . . . . . . . 79
4.3 Pearson’s r correlation between target features and HTER values on theTrace corpus. . . . . . . . . . . . . . . . . . . . . . . . . . . . . . . . . . 80
4.4 Spearman’s ρ correlation between target features and HTER values on theTrace corpus. . . . . . . . . . . . . . . . . . . . . . . . . . . . . . . . . . 81
4.5 Total number of pronouns and number of incorrectly translated pronouns forthe top five documents in the LIG corpus. . . . . . . . . . . . . . . . . . . 82
4.6 Number of connectives in the MT and PE versions of the top five documentsin the LIG corpus. . . . . . . . . . . . . . . . . . . . . . . . . . . . . . . . 83
4.7 HTER values versus percentage of incorrectly translated pronouns in a ran-dom sample of 30 documents from the LIG corpus. . . . . . . . . . . . . . 84
5.1 Performance gains in terms of MAE of the QE models for MOSES documents. 92
5.2 Performance gains in terms of MAE of the QE models for SYSTRANdocuments. . . . . . . . . . . . . . . . . . . . . . . . . . . . . . . . . . . 93
5.3 Performance gains in terms of MAE of the QE models for MIXED documents. 94
5.4 Performance gains in terms of MAE of the QE models for WMT EN-DEdocuments. . . . . . . . . . . . . . . . . . . . . . . . . . . . . . . . . . . 97
x List of figures
5.5 Performance gains in terms of MAE of the QE models for WMT EN-ESdocuments. . . . . . . . . . . . . . . . . . . . . . . . . . . . . . . . . . . 98
5.6 Performance gains in terms of MAE of the QE models for WMT EN-FRdocuments. . . . . . . . . . . . . . . . . . . . . . . . . . . . . . . . . . . 99
5.7 Performance gains in terms of MAE of the QE models for WMT DE-ENdocuments. . . . . . . . . . . . . . . . . . . . . . . . . . . . . . . . . . . 101
5.8 Performance gain in terms of MAE of the QE models for WMT ES-ENdocuments. . . . . . . . . . . . . . . . . . . . . . . . . . . . . . . . . . . 102
5.9 Performance gains in terms of MAE of the QE models for WMT FR-ENdocuments. . . . . . . . . . . . . . . . . . . . . . . . . . . . . . . . . . . 103
5.10 Performance gains in terms of MAE of the QE models for LIG documents. 105
5.11 Data distribution of true and predicted values of the best systems predictingBLEU, TER and METEOR for MIXED scenario in the FAPESP dataset. . . 110
5.12 Data distribution of true and predicted values of the best systems predictingBLEU, TER and METEOR for EN-DE in the WMT dataset. . . . . . . . . 111
5.13 Data distribution of true and predicted values of the best systems predictingBLEU, TER and METEOR for DE-EN in the WMT dataset. . . . . . . . . 111
5.14 Data distribution of true and predicted values of the best systems predictingBLEU, TER, METEOR and HTER for LIG dataset. . . . . . . . . . . . . . 112
6.1 HTER between PE1 and PE2 for each of the seven paragraphs in each set. . 121
6.2 Performance gains in terms of MAE of the QE models predicting BLEU,TER and METEOR. . . . . . . . . . . . . . . . . . . . . . . . . . . . . . . 128
6.3 Performance gains in terms of MAE of the QE models predicting the newdissemination labels. . . . . . . . . . . . . . . . . . . . . . . . . . . . . . 129
6.4 Data distribution of true and predicted values of the best systems predictingBLEU, TER and METEOR. . . . . . . . . . . . . . . . . . . . . . . . . . 130
6.5 Data distribution of true and predicted values of the best systems predictingDISS-HTER, DISS-LC-W2, DISS-LC-P and DISS-LC-M. . . . . . . . . . 131
6.6 Performance gains in terms of MAE of the models predicting the new RC-CREG labels and the automatic metrics in the reference corpus. . . . . . . . 142
6.7 Distribution of correct answers in original and machine translated documentsin the MCtest corpus. . . . . . . . . . . . . . . . . . . . . . . . . . . . . . 143
6.8 Confusion matrix of the best models for the classification task on MCtestwith three classes. . . . . . . . . . . . . . . . . . . . . . . . . . . . . . . . 145
List of figures xi
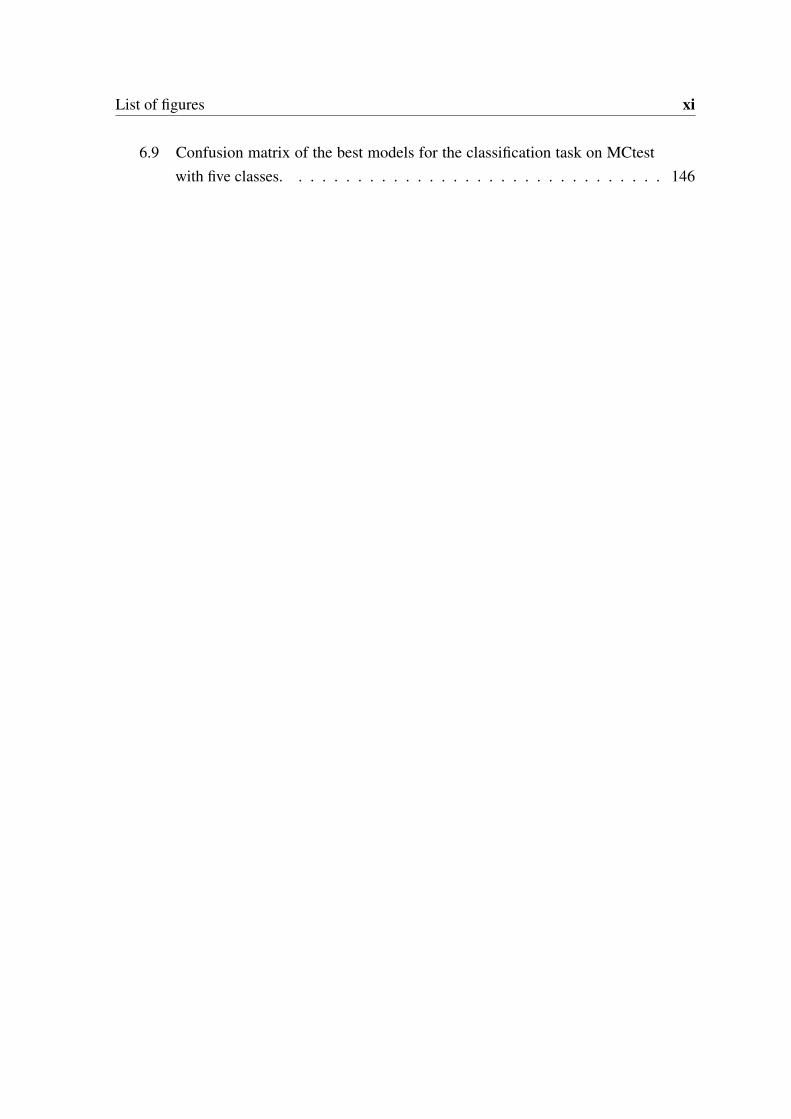
6.9 Confusion matrix of the best models for the classification task on MCtestwith five classes. . . . . . . . . . . . . . . . . . . . . . . . . . . . . . . . 146


List of tables
5.1 Thresholds on Pearson’s r correlation coefficients used in our experiments. . 88
5.2 Results for MOSES system in terms of Pearson’s r correlation. . . . . . . . 91
5.3 Results for SYSTRAN system in terms of Pearson’s r correlation. . . . . . 92
5.4 Results for MIXED in terms of Pearson’s r correlation. . . . . . . . . . . . 94
5.5 Overall performance, in terms of BLEU, of MT systems submitted to WMTshared tasks . . . . . . . . . . . . . . . . . . . . . . . . . . . . . . . . . . 95
5.6 Results for WMT EN-DE in terms of Pearson’s r correlation. . . . . . . . . 96
5.7 Results for WMT EN-ES in terms of Pearson’s r correlation. . . . . . . . . 98
5.8 Results for WMT EN-FR in terms of Pearson’s r correlation. . . . . . . . . 99
5.9 Results for WMT DE-EN in terms of Pearson’s r correlation. . . . . . . . . 100
5.10 Results for WMT ES-EN in terms of Pearson’s r correlation. . . . . . . . . 101
5.11 Results for WMT FR-EN in terms of Pearson’s r correlation. . . . . . . . . 102
5.12 Results for LIG in terms of Pearson’s r correlation. . . . . . . . . . . . . . 105
5.13 Statistic dispersion and central tendency metrics for the FAPESP dataset. . . 108
5.14 Statistic dispersion and central tendency metrics for the WMT dataset. . . . 109
5.15 Statistic dispersion and central tendency metrics for the LIG dataset. . . . . 109
6.1 WMT paragraph-level corpus statistics. . . . . . . . . . . . . . . . . . . . 117
6.2 Fleiss inter-annotator agreement for the SUBJ task. . . . . . . . . . . . . . 119
6.3 Spearman’s ρ rank correlation for the SUBJ task. . . . . . . . . . . . . . . 119
6.4 Averaged HTER values and Spearman’s ρ rank correlation for PE1 againstMT and PE1 against PE2. . . . . . . . . . . . . . . . . . . . . . . . . . . . 121
6.5 Example of changes from PE1 to PE2. . . . . . . . . . . . . . . . . . . . . 122
6.6 Counts on types of changes made from PE1 to PE2. . . . . . . . . . . . . . 123
6.7 Results of different models predicting BLEU, TER and METEOR in termsof Pearson r correlation. . . . . . . . . . . . . . . . . . . . . . . . . . . . 127
xiv List of tables
6.8 Results of different models predicting our new labels for dissemination interms of Pearson r correlation. . . . . . . . . . . . . . . . . . . . . . . . . 127
6.9 Statistic dispersion and central tendency metrics for all metrics and newlabels derived from the two-stage post-editing method. . . . . . . . . . . . 130
6.10 Number of documents, average number of words and questions per documentin CREG-mt-eval and MCtest-mt-eval corpora. . . . . . . . . . . . . . . . 132
6.11 Example of a document in the CREG corpus and its machine translation . . 1336.12 Question grades, marks and frequency of the marks in CREG-mt-eval. . . . 1356.13 Test takers agreement per set. . . . . . . . . . . . . . . . . . . . . . . . . . 1366.14 Number of words per set. . . . . . . . . . . . . . . . . . . . . . . . . . . . 1366.15 Test takers Fleiss’ Kappa agreement per document. . . . . . . . . . . . . . 1376.16 Average inter-annotator agreement, overall quality (in terms of BLEU) and
overall test takers performance per system. . . . . . . . . . . . . . . . . . . 1386.17 Types of question and their frequency in CREG-mt-eval. . . . . . . . . . . 1386.18 Statistic dispersion and central tendency metrics for RC-CREG-P and RC-
CREG-M. . . . . . . . . . . . . . . . . . . . . . . . . . . . . . . . . . . . 1406.19 Results in terms of Pearson r correlation of the models predicting the new
RC-CREG labels and BLEU, TER and METEOR in the reference corpus. . 1416.20 Results for the models performing a classification task on MCtest with three
classes. . . . . . . . . . . . . . . . . . . . . . . . . . . . . . . . . . . . . 1456.21 Results for the models performing a classification task on MCtest with five
classes. . . . . . . . . . . . . . . . . . . . . . . . . . . . . . . . . . . . . 146

List of Acronyms
ACT Accuracy of Connective Translation
AS Automatic Summarization
BLEU BiLingual Evaluation Understudy
BP Brevity Penalty
CBOW Continuous Bag-of-Words
CCG Combinatory Categorical Grammar
CE Confidence Estimation
CREG Corpus of Reading Comprehension Exercises in German
CSLM Continuous Space Language Model
DLPT Defence Language Proficiency Test
EDU Elementary Discourse Unit
GP Gaussian Process
GTM General Text Matcher
HTER Human-targeted Translation Edit Rate
LC Lexical Cohesion
LDA Latent Dirichlet Allocation
LM Language Model
LSA Latent Semantic Analysis

xvi List of Acronyms
LSI Latent Semantic Indexing
LSTM Long Short-Term Memory
MAE Mean Absolute Error
METEOR Metric for Evaluation of Translation with Explicit ORdering
ML Machine Learning
MT Machine Translation
NIST National Institute of Standards and Technology
NLP Natural Language Processing
NP Noun Phrase
PCFG Probabilistic Context-Free Grammar
PDTB Penn Discourse Treebank
PE Post-Editing
PEA Post-Editing Action
POS part-of-speech
QE Quality Estimation
RA Readability Assessment
RBMT Rule-based MT
ROUGE Recall-Oriented Understudy for Gisting Evaluation
RST Rhetorical Structure Theory
RTM Referential Translation Machines
SCFG Synchronous Context-Free Grammar
SMT Statistical Machine Translation
SRL Semantic Role Labelling

List of Acronyms xvii
SVD Singular Vector Decomposition
SVM Support Vector Machines
SVR Support Vector Regression
TER Translation Error Rate
TF-IDF Term Frequency - Inverse Document frequency
TOEFL Test of English as a Foreign Language
TOEIC Test Of English for International Communication
TM Translation Memory
TS Text Simplification
WMT Conference on Machine Translation
WSD Word Sense Disambiguation

Chapter 1
Introduction
A major challenge in Natural Language Processing (NLP) is to find ways to evaluatelanguage output tasks such as Machine Translation (MT), Automatic Summarization (AS)and Text Simplification (TS). Although the nature of these tasks is different, they are relatedin the sense that a “target” text is produced given an input “source” text. Evaluation metricsfor these tasks should be able to measure quality with respect to different aspects (e.g.fluency and adequacy) and should be scalable across different systems and datasets. Humanevaluation is the most desirable approach, but it presents several drawbacks. Firstly, humanevaluation is not immune to biases where humans would give scores based on their perceptionof automatic systems, for example. Secondly, this kind of evaluation is time-consuming,expensive and not available for on-demand cases (such as applications targeting directly theend-user). Finally, for some cases, humans can get confused and bored during the evaluationprocess, which makes it unreliable. Therefore, a significant amount of work has targetedmeasuring quality of language output tasks without direct human intervention.
In the MT area, the focus of this thesis, machine translated texts are mainly used in twoscenarios: dissemination and assimilation (Nirenburg, 1993). The dissemination scenarioconcerns machine translated texts with the purpose of publication. An example is a newsagency that may want to make their online English content available for readers of otherlanguages. For that, the quality requirements are high and the final version of the translationis often edited and revised by humans.
MT can also be used for information assimilation. For example, scientists around theworld may wish to know the latest findings by the scientific community in Brazil about theZica virus by machine translating Portuguese articles. In this case, the quality of the machinetranslated documents does not need to be perfect, as long as the text is understandable and themeaning of the source is preserved. More recently, with the broad availability and use of the

2 Introduction
internet and social media, there is a third scenario, where the aim is communication. In thiscase, users apply MT technologies with the purposes of exchanging information, chatting,dating, ordering goods from foreign countries, among others. As with the assimilationscenario, the quality requirements are low: only the most important information needs to beunderstandable.
Therefore, a reliable evaluation framework should ideally take into account the purposeof the translation, the targeted audience and the type of the documents, among other as-pects. Human evaluation would be the most desirable, although it has several problems,as mentioned before, and, therefore, automatic evaluation metrics have been proposed toovercome the issues with human evaluation. The BiLingual Evaluation Understudy (BLEU)(Papineni et al., 2002), the Translation Error Rate (TER) (Snover et al., 2006) and the Metricfor Evaluation of Translation with Explicit ORdering (METEOR) (Banerjee and Lavie, 2005)are widely used automatic evaluation metrics for MT. These metrics compare the outputs ofMT systems with human reference translations. BLEU is a precision-oriented corpus-basedmetric that compares n-grams (typically n = 1..4) from reference texts against n-grams in theMT output, measuring how close the output of a system is to one or more references. TERmeasures the minimum number of edits required to transform the MT output into the closestreference texts at sentence level. METEOR scores MT outputs by aligning their words withwords in a reference. The alignments can be done by exact, stem, synonym and paraphrasematchings at sentence level.
One limitation of these automatic metrics is that if the MT output is considerably differentfrom the references, it does not really mean that it is a bad output. Another problem is thathuman effort is still needed to produce the references. Also, the matching or alignmentmethods are simplistic. For example, all errors are considered equally important (e.g. awrong comma is as important a wrong main verb in a sentence) and it is generally notpossible (or cumbersome) to customise the metrics for different purposes. Finally, and moreimportantly, these metrics cannot be applied in cases where the output of the system is to beused directly by end-users. For example, a user reading the output of Google Translate1 for agiven news text cannot count on a reference for that translated text.
Alternatively, the output of an MT system can be evaluated based on its applications.For example, post-editing can be used as a proxy to evaluate the effort of correcting amachine translation (Plitt and Masselot, 2010; Blain et al., 2011; O’Brien, 2011; Specia et al.,2011; Koponen et al., 2012). Therefore, human interaction is needed to correct the machinetranslation in order to achieve the same meaning as the source and ensure the fluency and
1https://translate.google.com/
3
style of the translation. Human-targeted Translation Edit Rate (HTER) (Snover et al., 2006)is a metric that indirectly evaluates the effort needed to post-edit a sentence. It is calculated byapplying TER between the machine translation and the post-edited machine translation (i.e.,it replace the human reference with the post-edited version). The post-editing approaches forevaluation are normally linked to the use of MT dissemination purposes, where the quality tobe delivered needs to be high.
Another task-based approach is the evaluation of machine translated documents usingreading comprehension questions. The hypothesis behind this approach is that if humans areable to answer questions about a machine translated document, the document is consideredas good, if not, the document is considered as bad (Tomita et al., 1993; Fuji, 1999; Fuji et al.,2001; Jones et al., 2005b,a; Berka, Cerný, and Bojar, 2011). This approach is often used toevaluate MT for the assimilation purpose, where an understandable version of the documentis enough.
A more recent form of MT evaluation is referred to as Quality Estimation (QE). QEapproaches aim to predict the quality of MT systems without using references. Features (thatmay or may not be related to the MT system that produced the translations) are extractedfrom source and target texts (Blatz et al., 2004; Specia et al., 2009a; Bojar et al., 2013, 2014,2015, 2016b). The only requirement is data points with quality scores (e.g. HTER or evenBLEU-style metrics) to train supervised Machine Learning (ML) models in order to predictthe quality of unseen data. The advantage of these approaches is that they only need humanintervention in order to produce enough data points to build the ML model for QE and,therefore, unseen data does not need to be manually annotated. QE systems predict scoresthat reflect how good a translation is for a given scenario and, therefore, can be considered atask-oriented evaluation approach. For example, HTER scores are widely used as qualitylabels for QE systems at sentence level, providing a measure of post-editing effort. A user ofa QE system predicting HTER could decide whether to post-edit or translate sentences fromscratch based on the scores predicted for each sentence.
So far, QE has been largely explored for word and sentence levels, with little work ondocument-level QE. Sentence-level QE (Specia et al., 2009a,b; Specia and Farzindar, 2010;Felice and Specia, 2012; Shah, Cohn, and Specia, 2013; Shah et al., 2015a) is the mostexplored of the three levels, with direct applications on the translation industry workflow.Word-level QE (Blatz et al., 2004; Ueffing and Ney, 2005; Luong, 2014) aims to give aquality score for each word in the translation. Its application include spotting errors, wheresystems could inform users about the quality of individual words. Both sentence and wordlevels have been continously explored at the Conference on Machine Translation (WMT),

4 Introduction
through QE shared tasks. Document-level QE (Soricut and Echihabi, 2010; Scarton andSpecia, 2014a; Scarton, 2015; Scarton et al., 2015) aims to predict a single score for entiredocuments, which has proven to be a hard task even for humans (Scarton et al., 2015).
In this thesis we focus on document-level QE because it has been less explored thanother levels, it is useful for a number of applications and it has several challenges commonlyfound in other NLP tasks (e.g. AS).
Document-level QE can be used to evaluate machine translations of entire documents thatneed to be used “as is”, without post-editing (assimilation case). A scenario would be qualityassessment of machine translated user generated content in e-services that deal with buyersfrom all around the world. For example, an English speaking user searching for a hotel inGreece might be interested in the reviews of other people that stayed in this hotel. However,the majority of the reviews are in Greek and, therefore, machine translating the reviews isthe only option for the user who does not speak Greek. In this scenario, the user might beinterested in the overall quality of the machine translated review that he/she is reading, inorder to decide if he/she can trust it or not. An evaluation of quality per sentence is not useful,because the user is interested in the full document (review). In a similar case, e-servicesproviders could also be interested in using MT to translate reviews from a language intoanother when they are starting to offer a product in a new country. Quality assessment ofentire reviews is needed in order to select which reviews will be understood by the users andthus can be published.
Another application is to estimate the cost of post-editing machine translated documents(dissemination case). It is common for translation companies to hire freelance translatorsto perform translation tasks. Frequently, due to cost issues or disclosure agreements, thetranslators only receive a set of shuffled sentence for post-editing. Then, after receivingthe post-editions, an in-house translator needs to revise the entire document, and correctdocument-wide problems. Such a complex scenario makes it difficult to clearly estimatethe cost of a translation service.Therefore, a document-level cost estimation that takes intoaccount the costs of the work performed by the freelancer (at sentence level) and the revisionwork would be useful for the translation industry.
We address the following challenges faced by QE for MT at document level:
Features Designing and identifying the best features for building the QE models is achallenge in QE. For document-level, the state-of-the-art features are based on pseudo-references (Soricut and Echihabi, 2010; Soricut, Bach, and Wang, 2012; Soricut and Narsale,2012; Shah, Cohn, and Specia, 2013). Pseudo-references are translations produced by MT

5
systems other than the system we want to predict the quality of. They are used as “artificial”references to evaluate the output of the MT system of interest via traditional automaticevaluation metrics (e.g. BLEU). However, such features usually cannot be extracted inreal-world scenarios since they make certain assumptions about the MT systems used toproduce the pseudo-references (such as quality) that are often unavailable. Therefore, thedesign and evaluation of new features is needed. Another challenge in feature engineering fordocument-level QE is the use of linguistic information that goes beyond words or sentences.Discourse is a type of linguistic information that often manifests itself document-wide. Sincethe state-of-the-art MT systems translate documents at sentence-level, disregarding discourseinformation, it is expected that the outputs of these systems will contain discourse problems.Because of that, recently there have been initiatives to include discourse information inMT (Marcu, Carlson, and Watanabe, 2000; Carpuat, 2009; LeNagard and Koehn, 2010;Zhengxian, Yu, and Guodong, 2010; Meyer and Popescu-Belis, 2012; Ture, Oard, and Resnik,2012; Ben et al., 2013; Hardmeier, 2014), MT evaluation (Giménez and Màrquez, 2009;Giménez et al., 2010; Meyer et al., 2012; Wong and Kit, 2012; Guzmán et al., 2014) and alsoin QE at sentence level (Rubino et al., 2013). However, thus far there are no contribution ondocument-level QE that explores document-wide or discourse-aware features and effectiveways of combining such features along with more shallow information.
Quality labels Another challenge in document-level QE is devising a quality score topredict. Previous research has used automatic evaluation metrics as quality labels fordocument-level QE (Soricut and Echihabi, 2010; Soricut, Bach, and Wang, 2012; Soricut andNarsale, 2012). However, our hypothesis is that traditional metrics, developed to evaluateoutputs of different MT systems of the same source text, do not capture differences amongmachine translations of different documents, because they only capture generic errors that,although are useful for system-level evaluation, are not distinctive in terms of individualdocument quality (n-grams matching and word alignments, for example). This is even moreproblematic if the documents are translated by the same or similar MT system(s). Thisleads to low variation between the document quality scores and, therefore, all documentscores are close to the average quality of the dataset. Another problem is that automaticevaluation metrics do not account for document-wide and discourse-aware problems, they arelimited to superficial information about n-grams. Finally, automatic evaluation metrics arenot targeted at a purpose and cannot be directly interpreted as an absolute quality indicatorby the end-user (e.g. what does a BLEU score of 0.6 mean?). Therefore, new quality labelsneed to be investigated in order to further develop the area of document-level QE.

6 Introduction
ML models Investigating and developing ML models for QE is highly dependent onthe task and on the quality labels provided. For instance, labels following a continuousdistribution are more suitable to be used with regression models, whilst labels that follow adiscrete distribution are more likely to be approached with classification models. Moreover,features of different nature (e.g. word embeddings versus handcrafted) may need to be treateddifferently inside the ML model. Therefore, different ML approaches need to be investigatedin order to develop reliable studies in QE.
1.1 Aims and Objectives
The aims and objectives of this thesis are:
1. Investigate novel shallow and deep information sources and ways of combining thesesources for the task of document-level QE. More specifically:
(a) Sentence-level information and ways of aggregating it for document-wide ap-proaches.
(b) Latent variable models (e.g. Latent Semantic Analysis (LSA) (Landauer, Foltz,and Laham, 1998)) for modelling (shallow) discourse-aware features;
(c) Linguistic theories (e.g. Rhetorical Structure Theory (RST) (Mann and Thomp-son, 1987)) and tools available for modelling (deep) discourse-aware features;
(d) Consensus of MT systems as features for document-level QE;
(e) Word embeddings as features for document-level QE;
2. Devise reliable quality labels for the task of document-level QE. More specifically:
(a) Devise and acquire human-targeted task-oriented labels for assimilation purposesusing a method based on reading comprehension tests for data collection andlinear combination approaches for devising the labels;
(b) Devise and acquire human-targeted task-oriented labels for dissemination pur-poses using a method based on two-stage post-editing for data collection andlinear combination approaches for devising the labels;
(c) Understand how the documents are distinguished by the label and whether or notthey capture discourse-aware phenomena.
1.2 Contributions 7
3. Investigate appropriate ML models and techniques for QE at document-level. Morespecifically:
(a) Explore different approaches for modelling document-level QE: multiclass andordinal classification and non-linear and bayesian regression;
(b) Investigate kernel combination approaches as a way of dealing of the peculiaritiesof features of different nature.
1.2 Contributions
This thesis introduces the following main contributions:
• A new method for document-level evaluation for dissemination purposes called two-stage post-editing. This method consists in post-editing sentences in two steps: firstlysentences are post-edited in isolation, without the influence of document context. Theidea is to solve all sentence-level issues. After this stage, the post-edited sentences areput into document context and the same post-editor is asked to perform any remainingchanges.2 These two stages aim to isolate document-aware problems and provide aresource for a more reliable document evaluation;
• New approaches for devising quality labels for document-level QE from the two-stagepost-editing method, aiming to penalise documents with more document-aware issues;
• Two new methods for devising quality labels for document-level QE from readingcomprehension tests (dissemination scenario), one evaluating documents by using openquestions and another with multiple choice questions. In the first case, the documentscores follows a continuous distribution, given that the open questions are markedfollowing a continuous scale. Moreover, the question marks are linearly combined andweighted by the number of questions per document. In the second case, the multiplechoice questions produces a discrete distribution, where there is an ordinal relationbetween the scores;
• Design and analysis of new feature sets for document-level QE. The new feature setsfocus on different information types: document-aware (sentence-level information
2It is important to have the same translator to perform both steps in order to avoid changes related totranslation style.

8 Introduction
aggregated at document-level), discourse-aware (document-wide discourse informa-tion) and consensus (pseudo-reference-based). Features are analysed in terms of theircorrelation with quality scores and their effectiveness in building document-level QEmodels;
• Annotated corpora:
– FAPESP corpus with documents machine translated by three different MT sys-tems from English into Brazilian Portuguese (2,823 documents);
– WMT corpus organised by documents for English into German, Spanish andFrench (and vice-versa) with the purpose of document-level QE (474 documentsfor each language pair);
– WMT paragraph-level corpus for the paragraph-level QE shared task organisedin WMT15 (1,215 paragraphs);
– A two-stage post-editing corpus that is a sample of WMT corpus in which thetwo-stage post-editing method was applied (208 documents);
– CREG-mt-eval corpus, based on the CREG corpus (Ott, Ziai, and Meurers, 2012),this corpus was translated by three different MT systems with an extra versionwith mixed sentences (one from each MT systems) and human translations forsome documents as references (215 documents);
– MCtest-mt-eval, based on the MCtest corpus (Richardson, Burges, and Renshaw,2013), with backward translation from English into German and back into English(660 documents).
• An extension of the QUEST++ framework for document-level QE. The document-levelmodule of QUEST++ was developed based on the existing sentence-level structures. Adocument is considered a group of sentences and thus, 69 sentence-level features wereadapted for document level. Moreover, nine new discourse features were also addedinto the framework;
• The organisation of WMT15 paragraph-level QE shared task and WMT16 document-level QE shared task. In the WMT15, the task consisted in predicting METEOR scoresof paragraphs. The data used were taken from the WMT13 translation shared task. InWMT16, the task was predicting the quality of entire documents. Quality scores weredevised from the two-stage post-editing method. The documents were selected fromWMT08, 09, 10, 11, 12 and 13 translation shared tasks.

1.3 Published Material 9
1.3 Published Material
Some parts of this thesis were published in the following:
• Carolina Scarton, Daniel Beck, Kashif Shah, Karin Sim Smith and Lucia Specia(2016): Word embeddings and discourse information for Quality Estimation. Inthe Proceedings of the First Conference on Statistical Machine Translation, Berlin,Germany, pp. 831-837.
• Ondrej Bojar, Rajen Chatterjee, Christian Federmann, Yvette Graham, Barry Haddow,Matthias Huck, Antonio Jimeno Yepes, Philipp Koehn, Varvara Logacheva, ChristofMonz, Matteo Negri, Aurelie Neveol, Mariana Neves, Martin Popel, Matt Post, RaphaelRubino, Carolina Scarton, Lucia Specia, Marco Turchi, Karin Verspoor and MarcosZampieri (2016): Findings of the 2016 Conference on Machine Translation. Inthe Proceedings of the First Conference on Statistical Machine Translation, Berlin,Germany, pp. 131-198.
• Carolina Scarton and Lucia Specia (2016): A Reading Comprehension Corpus forMachine Translation Evaluation. In the Proceedings of the Tenth International Con-ference on Language Resources and Evaluation (LREC 2016), Portorož, Slovenia, pp.3652-3658.
• Carolina Scarton and Lucia Specia (2015): A quantitative analysis of discourse phe-nomena in machine translation. Discours - Revue de linguistique, psycholinguistiqueet informatique, number 16.
• Ondrej Bojar, Rajen Chatterjee, Christian Federmann, Barry Haddow, Matthias Huck,Chris Hokamp, Philipp Koehn, Varvara Logacheva, Christof Monz, Matteo Negri,Matt Post, Carolina Scarton, Lucia Specia and Marco Turchi (2015): Findings of the2015 Workshop on Statistical Machine Translation. In the Proceedings of the TenthWorkshop on Statistical Machine Translation, Lisbon, Portugal, pp. 1-46.
• Carolina Scarton, Liling Tan and Lucia Specia (2015): USHEF and USAAR-USHEFparticipation in the WMT15 QE shared task. In the Proceedings of the Tenth Workshopon Statistical Machine Translation, Lisbon, Portugal, pp. 336-341.
• Lucia Specia, Gustavo Henrique Paetzold and Carolina Scarton (2015): Multi-levelTranslation Quality Prediction with QuEst++. In the Proceedings of ACL-IJCNLP2015 System Demonstrations, Beijing, China, pp. 110-120.

10 Introduction
• Carolina Scarton (2015): Discourse and Document-level Information for EvaluatingLanguage Output Tasks. In the Proceedings of NAACL-HLT 2015 Student ResearchWorkshop (SRW), Denver, CO, pp. 118-125.
• Carolina Scarton, Marcos Zampieri, Mihaela Vela, Josef van Genabith and Lucia Specia(2015): Searching for Context: a Study on Document-Level Labels for TranslationQuality Estimation. In the Proceedings of the 18th Annual Conference of the EuropeanAssociation for Machine Translation (EAMT 2015), Antalya, Turkey, pp. 121-128.
• Carolina Scarton and Lucia Specia (2014): Document-level translation quality esti-mation: exploring discourse and pseudo-references. In the Proceedings of the 17thAnnual Conference of the European Association for Machine Translation (EAMT2014), Dubrovnik, Croatia, pp. 101-108.
• Carolina Scarton and Lucia Specia (2014): Exploring Consensus in Machine Transla-tion for Quality Estimation. In the Proceedings of the Ninth Workshop on StatisticalMachine Translation (WMT 2014) - in conjunction with ACL 2014, Baltimore-MD,pp. 342-347.
Two tutorials (products of this thesis) were also given and one tutorial is being prepared:
• QUEST++ tutorial preparation and presentation at Alicante University, Alicante, Spain- 24/01/2016;3
• QUEST++ tutorial preparation and presentation at the International Conference onthe Computational Processing of the Portuguese Language (PROPOR 2016), Tomar,Portugal - 13/07/2016;4
• QUEST++ tutorial preparation to be presented at the 26th International Conference onComputational Linguistics (COLING 2016), Osaka, Japan - 11/12/2016.5
1.4 Structure of the Thesis
In Chapter 2 we present a literature review of MT evaluation. Different kinds of evaluationapproaches are discussed including manual evaluation, reference-based evaluation and human-targeted evaluation. This chapter also contains the detailed description of the QE task,
3http://staffwww.dcs.shef.ac.uk/people/C.Scarton/resources.html4http://propor2016.di.fc.ul.pt/?page_id=7055http://coling2016.anlp.jp/tutorials/T4/

1.4 Structure of the Thesis 11
including a discussion about all levels of prediction (word, sentence and document). Featuresfor QE are also discussed, focusing on work that used linguistic information for QE at wordand sentence levels.
Chapter 3 contains the literature review about discourse research for MT. We use ataxonomy of discourse (Stede, 2011) and categorise the research papers following it. Adiscussion of how each level is related to this thesis is presented in the end of each section.
Chapter 4 presents the document-level features used in this thesis. We separate thefeatures in three classes: document-aware, discourse-aware and consensus features. In theend of this chapter we present a preliminary analysis of the correlation of discourse featureswith HTER.
In Chapter 5 we show our first experiments with document-level QE. BLEU, TER,METEOR and HTER are used as quality labels for document-level prediction. Three differentdatasets are used: FAPESP (English-Brazilian Portuguese), WMT (English into German,Spanish and French and vice-versa) and LIG (French into English). Finally, we discussthe results and evaluate the usefulness of automatic evaluation metrics as quality labels fordocument-level QE.
Chapter 6 presents our new labels, proposed in order to better evaluate documents forthe task of document-level QE. Two approaches are introduced: one based on readingcomprehension questions and another on a two-stage post-editing method. We then analysethe results achieved by the new labels by comparing them with automatic evaluation metricsresults and discuss their effectiveness.
Finally, in Chapter 7 we summarise the thesis and provide a discussion of future directionsfor document-level QE research.


Chapter 2
Machine Translation Evaluation
Assessing the quality of documents is a challenge for many NLP tasks, starting from thequestion of defining quality. MT quality assessment is a subjective task that depends onvarious factors, including the purpose of the translation: what the text will be used for and bywhom. Traditional MT evaluation uses generic metrics of error/correctness, focusing on thefact that machine translation sentences are likely to contain errors (Koehn, 2010). This kindof evaluation is useful for system comparisons and ranking of systems, but does not providemeaningful information on quality for the end-user.
As discussed in Chapter 1, automatically translated texts are mainly used in two scenarios:dissemination and assimilation (Nirenburg, 1993). The dissemination scenario concerns ma-chine translated texts with the purpose of publication and, therefore, the quality requirementsare high. For assimilation, the quality requirements are less strict: just the main informationneeds to be understandable.
In this chapter we describe the main evaluation approaches employed in MT. Section2.1 presents human evaluation of machine translated texts. The settings evaluate sentencesaccording to fluency and adequacy scores or rank MT systems.
Section 2.2 presents the use of automatic metrics for MT evaluation. Such automaticmetrics, usually performed at sentence or corpus level, are reference-based: quality scoresare acquired by evaluating similarities between the machine translated texts and humanreferences. BLEU, METEOR and TER are the widely used metrics of this kind and areusually also employed for tuning MT systems.
In Section 2.3, task-based approaches for MT evaluation are discussed. Such approachesare useful if the purpose of the MT output goes beyond system evaluation and system tuning.Post-editing, the task of changing the MT output in order to achieve fluent and adequatetranslations, is used with the purposes of reducing costs of the translation process. For
14 Machine Translation Evaluation
example, a metric that evaluates the cost of post-editing a sentence (or a document) is usefulto inform users about the indirect quality of the machine translation. Another task-basedapproach uses reading comprehension tests about the machine translated documents. In thiscase, the purpose is to evaluate whether or not the machine translation is comprehensible. Aquality score can be devised by counting the correct answers that a human scored for eachdocument. Finally, eye tracking techniques have also been explored to assess MT quality fortask-based approaches.
In Section 2.4 we present QE: a kind of evaluation that focuses on predicting the qualityof unseen data, by using models trained with data points labelled for quality. The generalframework for QE is also presented, showing the modules for feature extraction from sourceand target texts and machine learning. QE is widely explored at sentence and word levels,with a considerable amount of work done in terms of feature engineering and ML research.Here, we focus on document-level QE, which is the main topic of this thesis. The creation offully automated solutions that provide machine translated content directly to the end useris an example of the utility of document-level QE. Previous work on QE for sentence andword levels using linguistic features is also discussed in order to provide some backgroundfor our study on discourse information in Chapter 4. Finally, this section also includes thedescription of QUEST++, a tool with feature extraction and ML modules for QE, and ourcontribution for the document-level QE module.
In the remainder of this thesis we use the terms “target” or “target text” as a synonym of“MT output”. The terms “source” or “source text” will refer to the input text given to the MTsystem.
2.1 Manual Evaluation
Manually evaluating NLP tasks is probably the most intuitive way of assessment that onecan think of. In MT, evaluating by hand whether or not a translation is good is an approachfor quality evaluation. Such evaluations can be performed by bilingual evaluators (who canjudge if the target preserves the source information) and monolingual evaluators (that needa reference translation in order to assess the machine translation). Traditionally, humansevaluate MT output at sentence level, although they may benefit from the full document inorder to assess discourse problems (Koehn, 2010).
Human translation evaluation is a difficult task, since different translators can havedifferent views on the same translation and, therefore, have different translation preferences.Manually evaluating machine translations is also problematic: humans can be biased by their

2.1 Manual Evaluation 15
own preferences and, in consequence, the judgements variation between annotators is usuallyhigh. Moreover, different subjects can have different expectations about what the purpose ofthe translation is and, even if the guidelines are clear whether the purpose is dissemination orassimilation, these concepts are vague and humans will probably disagree in their evaluation.Finally, human evaluation is costly, time-consuming and, therefore, cannot be performed inreal-time scenarios (e.g. gisting).
A kind of manual evaluation that has been largely employed in MT area assesses fluency
and adequacy (Koehn, 2010). Humans judgments of fluency check if a translation is fluent inthe target language, i. e. if it uses the correct grammar and idiomatic choices, disregarding itsmeaning. On the other hand, human judgements of adequacy check if a translation preservesthe same meaning as the source (or reference(s)) (Snover et al., 2009). Both fluency andadequacy are often evaluated at sentence level in a 1 to 5 scale (1 being worst and 5 the best)(Koehn and Monz, 2006; Callison-Burch et al., 2007).
Although the concepts of fluency and adequacy can be considered easy to interpret,assessing them is not trivial. Humans have different perspectives of such concepts and,therefore, the scores from different evaluators can show high variation. Especially foradequacy, humans are capable of filling in the missing information without noticing problemswith the machine translation (Koehn, 2010). Moreover, Fomicheva and Specia (2016) arguethat, for human evaluation scenarios using reference translations only, annotators are heavilybiased by the structure of the reference(s), giving bad scores for machine translations thathighly differ from the reference(s), even though the meaning is preserved.
Another widely used human evaluation technique is to rank machine translation systems.For each source sentence, a fixed number of machine translations from different MT systems(normally five) are shown to the annotators and they are asked to rank the machine translationsin a fixed scale, usually from 1 (best) to 5 (worst). Therefore, the ranking task encompassesthe comparison of the machine translated sentences among themselves and against the sourcesentence (in some cases, a human reference of the sentence under evaluation can also beavailable). Ties are allowed, given that different MT systems can output the same or verysimilar machine translations. Ideally, the same set of sentences is evaluated by more thanone annotator so that agreement scores can be computed. Koehn (2010) claims that this kindof evaluation is more consistent than the fluency/adequacy scores. This type of evaluationis the official evaluation of the MT shared tasks of WMT since 2008 (Callison-Burch et al.,2008, 2009, 2010, 2011, 2012; Bojar et al., 2013, 2014, 2015, 2016b).
Both fluency/adequacy scores and ranking cannot be directly extended to document level.Judging documents directly is unfeasible to humans, since documents encompass different
16 Machine Translation Evaluation
problems on different levels. Averaging sentence-level scores in order to have a documentlevel scores is probably the most intuitive way. However, as we discuss later in Chapter 6,averaged sentence-level scores are not reliable in expressing document quality.
2.2 Automatic Evaluation Metrics
In order to overcome the shortcomings of manual evaluation (such as time and costs), auto-matic evaluation metrics have been proposed over the years. Such metrics automaticallyassess machine translations by comparing them to one or more human translations (calledreference translations). Although this approach still requires human interaction, it is muchless time-consuming and expensive, since it requires texts to be translated by humans onlyonce and the same documents can be used to evaluate different MT systems.
Similarly to other NLP tasks, MT can also be evaluated by using precision, recall andf-measure. Precision is calculated as the ratio between the number of correct word matches(between target and reference) divided by the length of the target. Recall is the ratio betweenthe number of correct word matches and the length of the reference. F-measure is theharmonic mean between the two metrics. Such metrics do not consider word order andthey can be easily misleading. Short machine translations are more likely to show higherprecision while recall can be maximised by having more repeated correct words on themachine translation than on the reference.
Therefore, more sophisticated metrics have been proposed in order to overcome the issueswith precision and recall. BLEU, TER and METEOR are examples of widely used metricsfor MT evaluation, although several other metrics have been proposed over the years. WMTannually organises a shared task on MT evaluation since 2008 (Callison-Burch et al., 2008,2009, 2010, 2011, 2012; Machácek and Bojar, 2013, 2014; Stanojevic et al., 2015; Bojaret al., 2016a).
Such automatic evaluation metrics are at sentence level. By aggregating sentence-levelscores, a corpus level evaluation is achieved, the corpus being the test corpus (that canbe composed of random disconnected sentences). For MT (mainly Statistical MachineTranslation (SMT)) the context of the sentences is not important, given that the translationis performed sentence-by-sentence, disregarding context. Consequently, the traditional MTevaluation used to evaluate MT systems usually also deals with corpus made of randomsentences. Therefore, automatic evaluation metrics are designed for system evaluation andcomparison mainly and not for absolute quality assessment of translations. Finally, it is

2.2 Automatic Evaluation Metrics 17
common to refer to this kind of evaluation performed by such metrics as segment-level andsystem-level evaluation.
Although recent advances include the use of discourse information (Joty et al., 2014)and sophisticated Long Short-Term Memory (LSTM)-based approaches (Gupta, Orasan, andvan Genabith, 2015) for MT evaluation, there is no approach that addresses document-levelassessment apart from aggregating sentence-level scores. The reasons for this are: (i) themajority of MT systems (mainly traditional SMT systems) perform translation sentence-by-sentence and, therefore, sentence-level evaluation is still important in this scenario; (ii) theaggregation of sentence-level scores lead to a system-level evaluation, mainly because theentire corpus can be composed by random sentences, and (iii) the evaluation of such metricsis done against manual evaluation (ranking) which is also done at sentence level.
Additionally, the traditional assessment procedure to evaluate automatic metrics per-formance relies on human rankings (Stanojevic et al., 2015). Humans are asked to ranksentences translated by different MT systems. These rankings are then used to evaluate theautomatic metrics, by correlation scores (such as Pearson r). As such, metrics are designedand often optimised to compare different systems.
In this section we present BLEU, TER and METEOR in detail, since these metrics arevery popular, perform reasonably well and are used in the experiments presented in thisthesis.
BLEU
BiLingual Evaluation Understudy (BLEU) is the most widely used metric for MT evaluation.This metric, proposed by Papineni et al. (2002), is a precision-oriented metric that alsotakes recall into account (penalising target sentences which are shorter than the references).It was designed to be used with more than one reference, although it is also possible tobe used for cases where only one reference is available. Despite the fact that sentence-level approximations are also usually performed for evaluation at segment level, BLEU is acorpus-based metric that uses information from the entire corpus.
The precision in BLEU is a modified n-gram precision where, for each target n-gram,it is computed the maximum number of times that this n-gram appear in any of the referencetranslation sentences. The total count of each candidate n-gram is then clipped by itsmaximum counts in the reference corpus. After that, the clipped values are summed and

18 Machine Translation Evaluation
divided by the total number of candidate n-grams in the entire corpus. Equation 2.1 showshow modified n-gram precision is calculated for the entire corpus.
pn =
∑C∈{Candidates}
∑n-gram∈C
Countclip(n-gram)
∑C′∈{Candidates}
∑n-gram’∈C′
Count(n-gram’)(2.1)
Although Equation 2.1 already penalises long candidate sentences, short sentencescould wrongly maximise the precision. The solution proposed in BLEU was to multiplythe Equation 2.1 by a factor called Brevity Penalty (BP) that is expected to be 1.0 if thecandidate’s sentence length is higher than all reference sentence length. BP is calculated forthe entire corpus (Equation 2.2). First the closest values for matching reference and candidatesentences are summed for all sentences (r). Then, r/c is used in a decaying exponentialequation (c being the total length of the candidate corpus).
BP =
1 if c > r
e1−r/c if c ≤ r(2.2)
Equation 2.3 shows the final BLEU equation (where N is the n-gram order and wn = 1/N).Traditional BLEU uses N = 4 (4-gram).
BLEU = BP · exp
(N
∑n=1
wn log pn
)(2.3)
Since BLEU is a precision-oriented metric, values range from 0 to 100, being 0 the worstand 100 the best.
METEOR
The Metric for Evaluation of Translation with Explicit ORdering (METEOR) was designedin order to overcome BLEU’s weaknesses, such as the lack of an explicit recall component,the use of n-grams with high order, the lack of explicit word matches and not providinga reliable sentence-level score (Banerjee and Lavie, 2005). METEOR computes explicitunigram alignments between words from target and reference translations. For cases withmore than one reference, the reference that leads to the best final METEOR score is chosen.
In order to compare target and reference sentences, METEOR establishes alignmentsamong the words. Each word in the target sentence must be aligned to zero or only one wordin the reference. Such alignments are acquired in two stages. In the first stage, all possible

2.2 Automatic Evaluation Metrics 19
word-level alignments are retrieved by an external module. Such module can consider thefollowing steps: “exact match” (where the word in the target should be exactly the sameas in the reference), “stem match” (where stems are matched instead of words), “synonymmatch” (where words in the target can be matched to their synonyms in the reference) and“paraphrase match” (where entire phrases are matched, if they are defined as paraphrases in anexternal resource provided) (Denkowski and Lavie, 2014). Each step is applied in isolationand the order that they are applied matters. For example, if “exact match” is applied first andthe word “dog” in the target was aligned to an exact match in the reference, this word willnot be aligned again in the “stem match”, even though other alignments are possible.
In the second stage, the word alignments are selected according to the position of thewords in both target and reference. In fact, what is expected from this stage is to penalisetarget sentences that show word ordering far from the expected in the reference. METEOR,then, accounts for the number of alignment crosses between the words and select the set ofalignments that shows less crosses.
With the selected word alignments, the METEOR score is generated using a harmonicmean (Fmean between precision and recall scores) (Equation 2.4). Precision (P) is the numberof unigram alignments between target and reference divided by the number of words in thetarget and recall (R) is the number of alignments between target and reference divided by thenumber of words in the reference.
Fmean =P ·R
α ·P+(1−α) ·R(2.4)
Finally, a penalty factor is added in order to take into account n-gram alignments. Thenumber of alignments between chunks of words (n-grams) is divided by the number of wordalignments, as shown in Equation 2.5.
Penalty = γ ·(
chm
)β
(2.5)
The final METEOR score is defined by Equation 2.6. Parameters γ , β and α can beoptimised to maximise correlation with human ranks.1
METEOR = (1−Penalty) ·Fmean (2.6)
1In the recent versions of METEOR other parameters can be optimised in order to calculate weightedprecision and recall and take into account differences between content and function words.

20 Machine Translation Evaluation
METEOR is an f-measure-oriented metric and its values range from 0 to 100, wherehigher values mean better performance.
TER
Translation Error Rate (TER) (Snover et al., 2006) is a metric for MT evaluation thatcalculates the minimum number of edits needed to transform the target into one of thereferences. It was designed to be a more intuitive score when compared to BLEU andMETEOR.
The minimum number of edits is computed only between the target and the referencethat requires less edits to be achieved. Such modifications (edits) can be insertion, deletion,substitution or shifts (when words change position into the sentence). Punctuations are alsoconsidered as words and the metric is often case-sensitive. The different type of edits aretreated with equal costs. The minimum number of edits is then divided by the average lengthof the references (all references are included in the average) (Equation 2.7).
TER =minimum # of edits
average # of reference words(2.7)
Since it is not computationally possible to calculate the optimal edit-distance withshifts (such problem is NP-Complete), TER uses approximations calculated in two steps.Firstly, dynamic programming is used to compute the number of insertions, deletions andsubstitutions. The set of shifts that most reduces the number of insertions, deletions andsubstitutions is obtained by using greedy search. Secondly, a minimum edit distance is usedto calculate the remaining edit distance (the optimal is achieved by dynamic programming).
TER is an error-based metric, with values ranging from 0 to 100, where higher valueslead to worse results.
2.3 Task-based Evaluation
As mentioned before, manual and automatic evaluation metrics are mainly designed to assesssystem performance in comparison to other systems. However, the purpose of MT can bedifferent: one can be interested in whether or not a machine translation output “is goodenough” for a given task. MT can be used for improving translation productivity and gisting,for example. In both cases, a task-oriented evaluation is more informative than scores relatedto number of errors in sentences according to human references.

2.3 Task-based Evaluation 21
In this section, we present two different task-oriented approaches for MT evaluation.Cost or effort of post-editing is useful when MT is being used in the translation workflowand the translation quality is required to be high (therefore, it is a scenario of dissemination)(Section 2.3.1). The use of Reading Comprehension tests aim to evaluate whether a machinetranslated text can be understandable even though it presents errors (assimilation) (Section2.3.2).
2.3.1 Post-editing Effort
Post-editing is the task of checking and, when necessary, correcting machine translations.Such corrections are performed by humans2 and the hypothesis is that correcting a machinetranslated text is faster than translating it from scratch. Globalisation and the need forinformation in different languages as fast as possible gave a higher importance for translationsolutions that goes beyond the traditional human translation workflow. Consequently, there isa need to make the translation process faster and more accurate (Dillinger, 2014). Post-editingof machine translations is one approach associated to the use of MT for dissemination.
However, as expected, it is not always the case that correcting a machine translationis quicker than translating it from scratch. Some sentences have such low quality that thetask of reading it, trying to understand it and correcting it is more time-consuming thantranslating it from scratch. Therefore, estimating post-editing effort to support the translatorwork in automatic ways (e.g. informing the translator whether or not it is worth post-editinga sentence) can be an informative metric in the translation process.
According to Krings (2001), post-editing effort has three dimensions: temporal, cognitiveand technical. The temporal dimension is the most straightforward of the three. It is the directmeasurement of the time spent by the post-editor to transform the MT output into a goodquality post-edited version. Although cognitive aspects are directly related to temporal effort,they cannot be fully captured directly. Cognitive aspects encompass linguistic phenomenaand style patterns; and their measurements can only be done by using indirect means of effortassessment (e.g. keystrokes pauses). For example, a simple change in a verb tense requiremuch less cognitive effort than resolving an anaphora. Finally, the technical dimensioninvolves the practical transformations performed in order to achieve the post-edited version.Such transformations can be insertion, deletion, shift or a combination of all of them. Itis worth noting that the technical dimension focuses on the different operations without
2Although initiatives to automate post-editing already exists (Bojar et al., 2015), here we only refer tohuman post-editing.

22 Machine Translation Evaluation
accounting for the complexity of such operations as a function of linguistic properties of thetext as it is done in the cognitive dimension.
As previously mentioned, the most intuitive and direct measure of post-editing effort ispost-editing time. The time taken to post-edit can be used as a proxy for quality: segmentsthat take longer to be post-edited are considered worse than segments that can be quicklycorrected. Koponen et al. (2012) argue that post-editing time is the most effective way ofmeasuring cognitive aspects of the post-editing task and relating them to the quality of themachine translations. Plitt and Masselot (2010) use post-editing time (more specifically,words per hour) to measure the productivity gain of post-editing machine translated text in areal scenario of translation workflow, instead of performing translation from scratch. Thewords per hour metric shows high variation among different annotators, although post-editingis consistently less time-consuming than translation from scratch. The authors also show thatMT reduces keyboard time (time that the translator spent typing) by 70% and pause time(time that translator spent thinking, reading and searching for references) by 30%. Althoughpost-editing time seems to be a good metric of post-editing effort, it can be inaccurate anddifficult to achieve. Firstly, the post-editing time is a very noisy metric, since the translatorscan get distracted or take breaks while translating a sentence. Secondly, a high variationamong different translators’ post-editing time is expected, given that translators have differenttyping skills, translation experience and proficiency with the post-editing tool, among otheraspects. In addition, post-editing time can encompass reading time, correction time andrevision time, although the relationship among these factors is unclear.
Perceived post-editing effort is an alternative way of evaluating post-editing effort andit can capture cognitive aspects of post-editing. In this evaluation approach, humans areasked to give a score for the machine translated sentences according to a likert scale (Speciaet al., 2011). This type of scores can be given with or without actual post-editing and theyrepresent the humans belief on how difficult it would be (or it was) to fix the given machinetranslated sentences. In the first edition of WMT QE shared task in 2012 (Callison-Burchet al., 2012), the likert scale varied from 1 to 5, where:
• 1 - The MT output is incomprehensible, with little or no information transferredaccurately. It cannot be edited, needs to be translated from scratch.
• 2 - About 50% to 70% of the MT output needs to be edited. It requires a significantediting effort in order to reach publishable level.
• 3 - About 25% to 50% of the MT output needs to be edited. It contains different errorsand mistranslations that need to be corrected.
2.3 Task-based Evaluation 23
• 4 - About 10% to 25% of the MT output needs to be edited. It is generally clear andintelligible.
• 5 - The MT output is perfectly clear and intelligible. It is not necessarily a perfecttranslation, but requires little to no editing.
Alternatively, cognitive aspects of post-editing can be measured via eye-tracking. Eye-tracking techniques can measure fixation time (for how long the post-editor fixates on the text)or saccade time (movement of eyes). O’Brien (2011) measures fixation time and correlates itwith General Text Matcher (GTM) (a similarity metric between the target and the referencesentences based on precision, recall and f -measure) (Turian, Shen, and Melamed, 2003).Fixation time shows correlation with GTM scores: low GTM scores shows high fixationtime. In addition, post-editing pauses (extracted from keystroke logs) can also be viewed asan indirect measure of cognitive effort (Lacruz, Denkowski, and Lavie, 2014). Long pausesare associated with segments that demand more cognitive post-editing effort.
Blain et al. (2011) define Post-Editing Action (PEA) as a post-editing effort metric basedon linguistic information. The difference from “mechanical” edits (e.g. insertion, deletion,substitution) is that PEA is related to linguistic changes. Instead of simple word edits, PEAhas a “logical” aspect that aggregates several “mechanical” edits together, based on the typeof change. For example, if changing a noun in a sentence would mean changing the genderof an adjective in the same sentence, PEA would count only one change (the noun) while“mechanical” edits would take into account both changes (noun and adjective). In order toautomatically identify the PEAs, Blain et al. (2011) use TER as proxy for for edit distance.The authors claim that informing users with PEAs information would help in cases wherethe MT quality is already high and the task is to perform light reviews.
In general, although cognitive effort is an important dimension of the post-editing process,its measurement is usually expensive and unreliable. Perceived post-editing effort can behighly influenced by differences in the view of annotators and how accepting of MT theyare. Eye-tracking techniques and post-editing pauses are not immune to cases where thepost-editor is not focused on the task and start to digress (a similar problem is presented inmeasuring post-editing time). On the other hand, linguistic-based approaches are expensive tobe performed manually and require accurate NLP tools in order to be performed automaticallyand are, therefore, highly language-dependent.
Finally, post-editing effort can also be evaluated indirectly, by using a metric that takesinto account edit operations (technical effort). HTER is an example of such metrics. Pro-posed by Snover et al. (2006), in HTER post-edited machine translation are compared to the

24 Machine Translation Evaluation
original machine translation, by using TER. HTER then computes the minimum number ofedits to transform the machine translation into the post-edited version. Although HTER isless time-consuming, it is still not a clear evaluation of post-editing effort to inform humantranslators. A human post-editor would probably focus on performing the task as fast aspossible, instead of minimising the number of edits (Koehn, 2010). However, HTER is stillwidely used as an indirect measurement of post-edit effort (Bojar et al., 2013, 2014, 2015,2016b).
Recent work has discussed the use of target-side fuzzy match scores in order to evaluateMT outputs (Parra Escartín and Arcedillo, 2015). Traditional Translation Memory (TM)fuzzy match scores are similarity scores between the sentence to be translated and the TMentries, ranging from 0% (no similar sentence was found in the TM) to 100% (an exactsentence was found in the TM). The translation industry normally operates discounts in costsaccording to the fuzzy match scores. The target-side fuzzy match scores aim to provide asimilar metric for MT outputs. Parra Escartín and Arcedillo (2015) calculates such scores bycomparing the machine translated sentences with their post-edited versions. Their resultsshow that target-side fuzzy match scores show high Pearson’s r correlation with BLEU andTER. Moreover, the authors claim that fuzzy match scores are more intuitive and widelyused in the industry, which makes them easier to be assimilated by professional translatorsthan automatic evaluation metrics widely used in academia.
2.3.2 End-user-based Evaluation
In contrast to post-editing cost, the aim of end-user-based approaches is to evaluate howreliable a machine translation is for the end-user. Such evaluation methodology is related toMT for assimilation purposes: the end-user needs to comprehend the machine translationand it can be achieved without perfect quality.
Reading Comprehension Tests
Reading comprehension tests can be used to evaluate MT in a scenario where the aim is todecide whether or not the machine translated text is comprehensible and encodes the mainsource information correctly. Such tests are given to humans and the correctness of theanswers is used as the quality scores. Although this approach can be biased by the knowledgeof the test taker, it is a fast and easy task to perform.
The usefulness of reading comprehension tests for MT evaluation has been addressedin previous work. Tomita et al. (1993) use Test of English as a Foreign Language (TOEFL)

2.3 Task-based Evaluation 25
reading comprehension tests to evaluate English into Japanese machine translations. Textswere machine translated by three different MT systems, the questions were manually trans-lated and native speakers of Japanese answered the questions. Results show that readingcomprehension tests are able to distinguish the quality of the three MT systems. Fuji (1999)uses reading comprehension tests for an official examination of English as a second language,designed especially for Japanese native speakers. The author focuses on evaluating sevenMT outputs, regarding their quality. Reading comprehension tests are used to evaluate the“informativeness” of the MT outputs, but the results only show significant differences amongtwo systems. Therefore, the majority of the MT systems are not distinguished in termsof “informativeness”. Fuji et al. (2001) evaluate the “usefulness” of MT by using Test OfEnglish for International Communication (TOEIC) reading comprehension tests. Again, thelanguage pair was English-Japanese, but in this work the machine translated version wasevaluated by native speakers in two scenarios: (i) only the machine translated version wasshown and (ii) the source was also shown. Scenario (ii) showed better results than (i) fornative speakers with low proficiency in English, for which the TOEIC scores improved andthe time spent answering the questions decreased.
Later, Jones et al. (2005b) use the Defence Language Proficiency Test (DLPT) structureto evaluate the readability of Arabic-English MT texts. Their results show that subjects areslower at answering questions on the machine translated documents and that their accuracyis also inferior compared to human translated documents. Jones et al. (2005a) also useDLPT-style questions, aiming to find which level of Arabic reading comprehension a nativespeaker of English could achieve by reading a machine translated document. Their resultsshow that MT texts lead to an intermediate level of performance by English native speakers.
More recently, Berka, Cerný, and Bojar (2011) use a quiz-based approach for MTevaluation. They collected a set of texts in English, created yes/no questions in Czech aboutthese texts and machine translated the English texts by using four different MT systems.The texts consist of small paragraphs (one to three sentences) from various domains (news,directions descriptions, meeting and quizzes). Their results show that outputs produced bydifferent MT systems lead to different accuracy in the annotators’ answers.
Scarton and Specia (2016) present a corpus for reading comprehension evaluation of MTsystems. Such corpus was created from the Corpus of Reading Comprehension Exercisesin German (CREG) (Ott, Ziai, and Meurers, 2012), by machine translating the Germandocuments into English. The reading comprehension questions were also machine translatedand then post-edited by a professional translator. Fluent native speakers of English were

26 Machine Translation Evaluation
then asked to answer the reading comprehension questions about the machine translateddocuments. More details about the use of this corpus in this thesis are presented in Chapter 6.
Eye Tracking and Task-based Questionnaires
Eye tracking techniques can also be applied in a scenario of evaluation for disseminationpurposes. Doherty and O’Brien (2009) evaluate machine translated sentences by using eyetracking while native speakers of the target language (French) read the sentences. Results ofgaze time, fixation count and average fixation duration are compared with a manual analysisof the sentences (sentences were previously classified as “good” or “bad”). ModerateSpearman’s ρ correlation ranks are found between the manual analysis and gaze time andfixation count, meaning that long gaze times and high number of fixation counts correlatewith “bad” sentences while “good” sentences lead to short gaze times and low number offixation counts. Doherty, O’Brien, and Carl (2010) extend the work of Doherty and O’Brien(2009) and compare the eye tracking measurements with BLEU scores at sentence level. Theauthors find a trend where “bad” sentences present long gaze times, high number of fixationcounts and low BLEU scores, whilst “good” sentences present short gaze times, low numberof fixation and higher BLEU scores.
Stymne et al. (2012) combine eye tracking and error analysis in order to evaluate thequality of three different MT systems and a human translation from English into Swedish.Reading comprehension questions and likert scales for fluency, comprehension, confidenceof correct answers and estimated errors are also used in the evaluation performed by nativespeakers of Swedish. Moderate Pearson’s r correlation is shown between eye tracking gazetime and fixation time and the other measurements, although it does not happen among allMT systems.
Doherty and O’Brien (2014) use eye tracking and post-task questionnaires to evaluate theusability of machine translated texts in helping users to perform a task (use of a file storageservice). The original instructions were in English, while translations were provided forFrench, German, Spanish and Japanese. Results show that the original English documentsrequire significative less cognitive effort (in terms of total task time, fixation counts andaverage fixation time) than the Japanese documents. The other languages do not showsignificative results when compared to English. Castilho et al. (2014) also use eye trackingand post-task questionnaires, although their aim is to evaluate whether or not post-editingincreases the usability of machine translated technical instructions performed by end-users.The language pair was English - Brazilian Portuguese and the users were asked to performsome tasks using a security software for personal computers. Post-edited versions appear

2.3 Task-based Evaluation 27
to be significantly more usable than machine translations. Castilho and O’Brien (2016)follow the work of Castilho et al. (2014) and also evaluate the usability of post-editingfor English-German instructions in how to use a spreadsheet application. No significantdifference is shown between machine translated documents and post-edited documents, interms of cognitive effort measured by eye tracking. However, users needed less time toperform the tasks with the post-edited versions and showed more satisfaction with this kindof text than with machine translated versions.
Klerke et al. (2015) evaluate the performance of humans in solving puzzles by using theoriginal source version (English), a simplified version of the source, a human translationof the original source into Danish and machine translations of the original and simplifiedsource into Danish. They use eye-tracking, time, comprehension and comparison tests togather information about the difficulty of the task. They also compare their measurementswith BLEU and task performance. Humans showed comparable performance for both humantranslations and simplified versions of the source. This indicates that simplified versions ofthe source help as much as human translations. The machine translated versions of simplifiedtexts improve reading processing over the original text and the machine translation of theoriginal text, although the performance of the participants was better when using the originalsource documents rather the machine translations. It seemed that simplifying documentsbefore machine translating it can produce better results than machine translating the original.In terms of eye-tracking measurements: (i) humans spent more time on machine translatedversions (either simplified or not) than on original documents; (ii) fixations were higher formachine translated versions and lower for human translations; and (iii) more regressions(from a word read to a previous point in the text) were observed in machine translatedversions. BLEU does not show correlations with task efficiency, while time and fixationsmetrics show significant Pearson’s r correlation scores.
Finally, Sajjad et al. (2016) propose the use of eye tracking measurements to predictthe perceived quality of machine translated sentences from English into Spanish. Theyselected the best and worst machine translations of 60 sentences from the WMT12 evaluationshared task data. Although this work is not directly related to the use of eye tracking fortask-based approaches, it shows some important advances in the use of eye tracking for MTevaluation purposes. Eye-tracking measurements refer to reading processing: progression(jumps forward) and regression (jumps backwards) along the words in the sentence, jumpdistances, jumps between machine translation and reference, fixation time and lexicalisedinformation of words being read. The authors build regression models using the eye-trackingmeasurements as features. They show that eye-tracking measurements from the target and

28 Machine Translation Evaluation
lexicalised features are the best in predicting the ranks. Moreover, when combined withBLEU, such eye-tracking measurements show higher Kendall’s tau correlation with humanranks than BLEU alone.
2.4 Quality Estimation
This section revisits the concepts of QE and presents related work that was the basis for theresearch reported herein. In Section 2.4.1 the background and early work are presented anddiscussed. Section 2.4.2 contains state-of-the-art work on document-level QE. Section 2.4.3presents a literature review of previous work focusing on linguistic features for QE. Thissection is included because we explore discourse-level linguistic information, and therefore,work on the use of linguistic features for QE is important for this thesis. Section 2.4.4presents a state-of-the-art toolkit for QE, highlighting our contributions to it during thedevelopment of this research. Finally, Section 2.5 summarises the content of this chapter.
2.4.1 Introduction
The task of QE consists in predicting the quality of the outputs of MT systems without theuse of reference translations. Work in QE began in the early 2000s and the focus was onConfidence Estimation (CE) of words (Gandrabur and Foster, 2003; Ueffing, Macherey, andNey, 2003; Blatz et al., 2004; Ueffing and Ney, 2005; Ueffing, 2006; Ueffing and Ney, 2007)and sentences (Akiba et al., 2004; Blatz et al., 2004; Quirk, 2004).
CE can be viewed as a sub area of QE that focuses on estimating the confidence ofa system in translating a word, a phrase or a sentence. According to Blatz et al. (2004),two main approaches were said to be possible for CE. Either the CE system is completelyconnected to the MT system (using the probabilities derived from the system as the confidenceprobabilities) or it is independent (using features of words/sentences, with the best featuresstill related to the MT system under evaluation - e.g. from n-best lists). On the other hand,QE refers to a broader scenario in which it is possible to predict the quality of MT systemsoutputs, disregarding the systems themselves. Therefore, QE encompasses all strategies:
(i) CE approaches, focusing on the use of features dependent on MT systems;
(ii) approaches that only use features from words, sentences or documents (disregardingthe MT systems information);
(iii) a combination of both.

2.4 Quality Estimation 29
It is worth mentioning that features that are not dependent on the MT system can makeuse of external resources (e.g. Language Models (LMs)). These features are important forcases where the system is unknown or there is no information available about its internalproperties. An example is the use of QE for gisting in which the MT system is a black-boxfor the end users. However, it is worth emphasising that the use of MT systems informationcan be valuable in cases where it is available and, therefore, a model built following (iii) canbe more effective.
More recent work on QE explores features that are dependent and independent from MTsystems to predict the quality of words or sentences (Specia et al., 2009a,b; He et al., 2010;Specia and Farzindar, 2010; Specia et al., 2011). Different language pairs have been exploredand a variety of quality labels were considered (e.g. BLEU-style metrics, HTER scores,likert scores). Regression has also been established as the best supervised ML techniqueto build prediction models for the task of sentence-level QE. The preference for regressionoccurred as a result of the focus on fitting a model to continuous labels (e.g. HTER) or anordinal value (e.g. likert scores).
Shared tasks on QE have been organised since 2012, as part of the WMT (Callison-Burchet al., 2012; Bojar et al., 2013, 2014, 2015, 2016b). Word and sentence-level QE have beenexplored with a variety of data, quality labels and ML approaches. The latest two editions ofWMT also included subtasks on paragraph and document-level predictions.
Granularity Levels of QE
Sentence-level QE is the most popular variety of the prediction and feature extraction levels.One of the reasons for this is the direct applicability in the industry, e.g., distinguishingsegments to be post-edited from the ones that would take more time to post-edit than totranslate from scratch (Specia et al., 2011). Moreover, it is more natural for humans to givea quality score for sentences (such as likert scores) and also to post-edit sentences ratherthan words or entire documents. This task is often addressed as a regression problem, withdifferent algorithms explored (e.g. Support Vector Machines (SVM) (Cortes and Vapnik,1995), Gaussian Process (GP) (Rasmussen and Williams, 2006)) and a rich range of featuresemployed, including linguistically motivated ones.
In word-level QE (Blatz et al., 2004; Luong, 2014; Ueffing and Ney, 2005) each wordreceives a label that represents its quality. This level of prediction is useful, for example, tohighlight errors in a post-editing/revision workflow. The word-level QE subtask at the WMThas been organised annually since 2013 and received more attention during the WMT15edition, in which participants could outperform the baseline system. Classification is used

30 Machine Translation Evaluation
to categorise words into “GOOD” or “BAD” classes (although multi-class problems havealso been explored in the WMT12 and WMT13 shared tasks). More recently, research onphrase-level QE is emerging (Logacheva and Specia, 2015; Blain, Logacheva, and Specia,2016). For this task, groups of consecutive words (phrases) are labelled according to theirquality. In WMT16 a first version of this task was organised where phrases were extractedfrom word-level annotations. Summarising, a group of consecutive words was considereda phrase if all words share the same quality label (“GOOD” or “BAD”). Therefore, thephrase-level QE task was also modelled as binary classification.
Document-level QE (Soricut and Echihabi, 2010; Scarton and Specia, 2014a; Scarton,2015), the focus of this thesis, is the least explored of the three levels. An example of theusefulness of document-level QE is gisting, mainly when the end-user does not know thesource language (more details are presented in Section 2.4.2). In theWMT15, we made thefirst effort towards a document-level QE, by organising a subtask in paragraph-level featuresand predictions. Only a few teams submitted systems for the task and METEOR was usedas quality label. Therefore, only a few conclusions could be drawn from the first editionof this subtask (presented in Section 2.4.2). Winning submissions addressed the task as aregression problem, using similar techniques to sentence-level QE. In the latest edition ofWMT (2016), we organised a document-level QE task, that used document-aware qualitylabels for prediction (the labels were extracted from a two-stage post-editing method). Again,only a few teams submitted systems and the winning submissions explored GP models, witha kernel combination of handcrafted and word embeddings features (more details about thequality label used are presented in Chapter 6).
General Framework for QE
The general framework for QE is illustrated in Figures 2.1 and 2.2. In Figure 2.1, labelledwords, sentences or documents from the source and the target languages are used as inputsfor extracting features. Information from the MT system can be also used to extract featuresfor QE. These features can be simple counts (e.g. length of sentences in the source or targettexts), explore linguistic information (e.g. percentage of nouns in the source or target texts);or include data from the MT system (e.g. an n-best list used to build a LM and computen-gram log-probabilities of target words). The features extracted are then used as the input totrain a QE model. This training phase can use supervised ML techniques, such as regression.In this case, a training set with quality labels is provided. These quality labels are the scoresthat the QE model will learn to predict. The quality labels can be likert scores, HTER, BLEU,

2.4 Quality Estimation 31
to cite some widely used examples. The ML algorithm can vary, where Support VectorMachines (SVM) and Gaussian Process (GP) are some examples.
Target(training data)
Source(training data)
Feature Extractor
MT system(when available)
Features(training)
QE model training
QualityLabels
QE model
Fig. 2.1 General framework of Quality Estimation: training stage
Figure 2.2 illustrates how unseen data is labelled by a QE model. Features are extractedfrom the unseen data in the same way they were extracted from the training data. Theextracted features are then given to the QE model trained previously. Based on what themodel learned from the training data, it will predict scores for the unseen data.
2.4.2 Document-level Prediction
Assessing quality beyond sentence-level is important for different scenarios:
• gisting - mainly when the end user does not understand the source language;
• completely automatic solutions (e.g.: automatic translation of news, automatic transla-tion of reviews, etc.).
Document-level QE is a challenging task mainly because of three reasons. Firstly, it isnot as straightforward to assess documents as it is to assess sentences or words. Humans

32 Machine Translation Evaluation
Target(training data)
Source(training data)
Feature Extractor
MT system(when available)
Features(unseen data)
QE model
Predictions
Fig. 2.2 General framework of Quality Estimation: predicting quality of unseen data
are able to give quality scores (such as adequacy and fluency scores, varying from 1 to 5)for words and even sentences, but not for documents (Scarton et al., 2015). Classifyinglarge units of texts into fixed scores at document level is difficult because small problemsat sentence and word level interfere in the human judgements. Secondly, there is very littleparallel data with document markups available. Whilst thousands of sentences and wordscan be found easily, documents are limited. Finally, as a less studied level, adequate featuresstill need to be explored for document-level QE.
Regarding document-level labels, previous work use BLEU-style metrics as quality labelsfor prediction (Soricut and Echihabi, 2010; Scarton and Specia, 2014a; Scarton, 2015; Bojaret al., 2015). The problem with these metrics is that they were not developed for documentassessment in absolute terms, hence they are more useful for system comparisons. As aresult, different documents machine translated by the same MT system tend to be scoredsimilarly, even though they can actually have different quality. Moreover, it is also notideal to consider the simple aggregation of sentence-level scores as the document score.Sentences can have different relevance to the document. Sentences that are more importantfor the document understanding are more problematic if incorrectly translated than sentencesthat play a less important role in the document (Turchi, Steinberger, and Specia, 2012).Additionally, sentences can score very badly when tested in isolation, although they can beconsidered acceptable when put in the document context.

2.4 Quality Estimation 33
In terms of data, as mentioned before, the majority of MT systems translate documentssentence by sentence, disregarding document information. Therefore, for practical reasons,the majority of the parallel corpora available for MT does not have document markups. Suchcorpora are collections of random sentences, making their use impossible for document-level approaches. Moreover, available parallel corpora with document-level mark-ups havehundreds of documents, while to train a model for QE it would be preferable to have moredata points.
Several features have been proposed for QE at sentence-level. Many of them can bedirectly adapted for document-level (e.g. the number of words in source and target sentencescan be extended to number of words in source and target documents). However, otherfeatures that better explore the document as a whole or discourse-related phenomena canbe more informative. An issue in this case is the lack of reliable NLP tools for extractingdiscourse information. Although there have been recent advances in this area for English,other languages are still not covered. Therefore, features for QE that address discourse arelimited to source or target language only and when translating from or into English. Initiativesto learn discourse relations without supervision (or at least to learn relations beyond sentenceboundaries) are promising, as they are language independent. In Section 2.4.3, we presentwork addressing linguistic features for QE, showing the motivation for using discourseinformation based on the improvements achieved by using linguistic information for wordand sentence-level QE.
Previous Work on Document-level QE
Apart from our own work that we present in this thesis, only a few other studies addressdocument-level QE. Soricut and Echihabi (2010) explore document-level QE prediction torank documents translated by a given MT system, predicting BLEU scores. Features includetext-based, language model-based, pseudo-reference-based, example-based and training-data-based. Pseudo-reference features are BLEU scores based on pseudo-references from anoff-the-shelf MT system, for both the target and the source languages. The authors discussthe importance of the pseudo-references being generated by MT system(s) which are asdifferent as possible from the MT system of interest, and preferably of much better quality.This should ensure that string similarity features (like BLEU) indicate more than simpleconsensus between two similar MT systems, which would produce the same (possibly badquality) translations. While promising results are reported for ranking of translations fordifferent source documents, the results for predicting absolute scores proved inconclusive.For two out of four domains, the prediction model only slightly improves over a baseline
34 Machine Translation Evaluation
where the average BLEU score of the training documents is assigned to all test documents.In other words, most documents have similar BLEU scores, and therefore the training meanis a hard baseline to beat.
Soricut and Narsale (2012) also consider document-level prediction for ranking, propos-ing the aggregation of sentence-level features for document-level BLEU prediction. Theauthors claim that pseudo-reference features (based on BLEU) are the most powerful in theframework.
Scarton and Specia (2014a) explore discourse features (based on LSA cohesion) andpseudo-references for document-level QE. Although the pseudo-reference features were thebest among the baseline and discourse features, LSA features also showed improvementsover the baseline. Scarton and Specia (2015) study the impact of discourse phenomena inmachine translation, by measuring the correlation between discourse features and HTERscores (more details on this work are presented in Chapters 4 and 5). Scarton et al. (2015)discuss the use of automatic evaluation metrics as quality labels for QE and propose a newhuman-targeted method of post-editing, focusing on isolating document-level issues frommore fine-grained issues (see Chapter 6). Scarton and Specia (2016) present a new corpuswith reading comprehension scores, annotated by humans, also aiming at new document-levellabels (see Chapter 6).
Two teams participated at the WMT15 document-level QE task. Scarton, Tan, andSpecia (2015) describe two systems. The first system uses QUEST++ features and discourseinformation (from discourse parsers and LSA - see Chapter 4) and a feature selection approachbased on Random Forests and backward feature selection. The second system performsan exhaustive search on the official baseline features.3 This system achieved performancesimilar to the first one, by only using three features out of the 17 baseline features. Thesystem of Biçici, Liu, and Way (2015) applies Referential Translation Machines (RTM)for document-level QE, performing as well as the top system. RTMs (Biçici, 2013; Biçiciand Way, 2014) explore features such as distributional similarity, the closeness betweentest instances to the training data, and the presence of acts of translation. The authors usedSupport Vector Regression (SVR) to train the models with feature selection.
At WMT16 two teams participated in the shared task of document-level QE. Scartonet al. (2016) describe two different approaches. The first uses word embeddings as featuresfor building a QE model using GPs. Baseline features are combined with word embeddingsby using different kernels into the GP model. The second system uses discourse informationcombined with baseline features for building SVR models for document-level QE. Besides
3This system was a joint work with Liling Tan from Saarland University, Saarbrücken, Germany.

2.4 Quality Estimation 35
the discourse features proposed by Scarton, Tan, and Specia (2015), the authors also usefeatures from a entity graph-based model (Sim Smith, Aziz, and Specia, 2016a) to measurethe coherence of the source and target documents (see Chapters 4 and 5 for more detailsabout these systems). The second team use RTMs as previously used by Biçici, Liu, andWay (2015) (Biçici, 2016).
2.4.3 Previous Work on Linguistic Features for QE
Linguistic Features for QE at Word Level
Xiong, Zhang, and Li (2010) use linguistic features (combined with MT system-basedfeatures) for error detection in Chinese-English translations. They cover lexical (combinationof words and part-of-speech tags) and syntactic features (whether or not a word was ignoredby the Link Grammar parser, because the parser could not interpret it). They consider thetask as a binary classification problem (a given word is correct or not). The result of thecombination of linguistic features with system-based features outperforms the baseline andthe results of only using lexical or syntactic features outperform the results of only using MTsystem-based features.
Bach, Huang, and Al-Onaizan (2011) also apply word-level quality estimation integratinglinguistic features from a part-of-speech tagger. Features are calculated at word level,although they extend the model to sentence-level. Like Xiong, Zhang, and Li (2010), Bach,Huang, and Al-Onaizan (2011) address the task as a classification problem. The use of part-of-speech features in the source segment led to the best result. Later Luong (2014) proposesnew syntactic features for word-level QE and combined them with features proposed inprevious work. The new syntactic features are also extracted from the Link Grammar parser,such as the constituent label of the words and the word depth in the syntactic tree. However,the authors do not report on the impact of the new syntactic features separately.
Martins et al. (2016) use syntactic features, combined with unigram and bigram featuresfor building the winning system for the word-level QE shared task at WMT16. The syntacticfeatures were extracted by using the TurboParser (Martins, Almeida, and Smith, 2013).Such features encompass information about dependency relations and syntactic head oftarget words. The authors show that syntactic features lead to improvements over the use ofunigrams and bigrams features.
In summary, for word-level QE, state-of-the-art systems use linguistic information asfeatures for the task. Features that use syntactic knowledge have shown promising results.Document-wide information, however, has never been explored mainly due to dataset con-
36 Machine Translation Evaluation
straints (the datasets for word-level QE tasks are usually composed of randomised sentences).Therefore, there is also room for using the findings of this thesis for word-level QE.
Syntactic Features for QE
Specia et al. (2011) predict the adequacy of Arabic-English translations at sentence level,using a classification approach (predicting likert scores) and a regression approach (predictingMETEOR). They group the features used in four classes: (i) source complexity features (e.g.average source word length); (ii) target fluency features (e.g. target language model); (iii)adequacy features (e.g ratio of percentage of nouns in the source and target sentences); and(iv) confidence features (e.g. SMT model score). Linguistic features are used for the firstthree categories and cover different linguistic levels. An example of syntactic features is theabsolute difference between the depth of the syntactic trees of the source and target sentences.They do not evaluate directly the impact of only using linguistic features, however, 6 out of12 adequacy features contained linguistic information.
Avramidis et al. (2011) consider syntactic features for ranking German-English SMTsystems. The syntactic information is generated using a Probabilistic Context-Free Grammar(PCFG) parser on the target and source sentences. The best results are obtained whensyntactic features are used. Similarly, Almaghout and Specia (2013) use CombinatoryCategorical Grammar (CCG) in order to extract features for QE. They apply these featuresto the output of French-English and Arabic-English systems. The CCG features outperformthe PCFG features of Avramidis et al. (2011) when no other features are included.
Hardmeier (2011) and Hardmeier, Nivre, and Tiedemann (2012) apply syntactic treekernels (Moschitti, 2006) to QE at sentence level for English-Spanish and English-Swedishmachine translations. The syntactic information is encoded into the model as tree kernels,which measure the similarity of sub-syntactic trees. The use of tree kernels leads to improve-ments over a strong baseline. Beck et al. (2015) also explore syntactic tree kernels to QE forFrench-English and English-Spanish language pairs. Although the focus of the paper is inhyperparameter optimisation via Bayesian methods (in this case, GP), the authors report onimprovements for QE over the method studied by Hardmeier (2011).
Kozlova, Shmatova, and Frolov (2016) explore morphosyntactic, LM-based, pseudo-reference and baseline features in order to build the best system for sentence-level QE atWMT16. The syntactic features were extracted by a dependency parser. Syntactic featuresfrom source and target sentences are: tree width, maximum tree depth, average depth of thetree and proportion of internal nodes of the tree. Source sentence only syntactic featuresare: number of relative clause and number of attributive clauses. Information from POS-tags

2.4 Quality Estimation 37
were also extracted for source and target sentences. Although the winning system was acombination of syntactic features and all other features, the authors show that the combinationof baseline and syntactic features outperform the baseline system. However, when performingfeature selection, only one out of ten features is syntactic. Finally, Sagemo and Stymne (2016)also explore syntactic features for the sentence-level shared task at WMT16. Their syntacticfeatures are similar to the one used in Avramidis et al. (2011), encompassing informationextracted from a PCFG parser. Baseline results outperform by the combination of baselinefeatures and syntactic information.
The use of syntactic features outperforms strong baselines for the task of sentence-levelQE. In fact, it is expected that syntactic information should play an important role in sentence-level evaluation, since several problems with the output of MT systems are at the grammaticallevel. Systems built with syntactic knowledge still perform best in shared task competitions.
Semantic Features for QE
Pighin and Màrquez (2011) use Semantic Role Labelling (SRL) to rank English-SpanishSMT outputs. They automatically annotated the SRLs in the source side and project theminto the target side, by using the word alignments of the SMT system. The evaluation isdone by considering the human assessments available for the WMT13 2007-2010 corporaand the dataset described in Specia and Farzindar (2010). They train the model in Europarldata, therefore, they separate the data into in-domain data (Europarl) and out-of-domain data(news). The results of using SRL features are better than the baseline for the in-domain data.Some results of out-of-domain data are comparable to in-domain data when SRL featuresare applied. Specia et al. (2011) also explore semantic features, such as the difference inthe number of person/location/organization named entities in source and target sentences.As mentioned before, the authors do not present an analysis of the linguistic features used,although 50% of the best adequacy features were linguistic features.
It is still not clear what the contribution of semantic knowledge for sentence-level QE is.For sentence-level semantics (such as SRL) the lack of reliable resources is problematic forachieving competitive results.
Analysis of the Impact of Linguistic Features in QE
Felice and Specia (2012) introduce several linguistic features for English-Spanish QE. Theycover three linguistic levels: lexical (e.g. percentage of nouns in the sentence), syntactic(e.g. width and depth of constituency trees) and semantic (e.g. number of named entities).
38 Machine Translation Evaluation
Although the combination of linguistic features does not improve the results, an analysis ofthe contribution of features shows that linguistic features appeared among the top five. Theapplication of a feature selection method result in a set 37 features, out of which 15 werelinguistic. This selected set leads to improved results.
In general, previous work on linguistic features for sentence-level QE explore mainlylexical and syntanctic features. Results are promising for the majority of the scenarios,although it is clear that more work needs to be done in the case of semantic features. As forword-level, document-wide information has not been explored so far for sentence-level QE.Again, constraints on datasets are the main reason for such a lack of studies.
2.4.4 QUEST++: a Toolkit for QE
Toolkits for feature extraction and creation of QE models are available. The most widelyis QUEST++4 (Specia, Paetzold, and Scarton, 2015). QUEST++ is the newest version ofQUEST (Specia et al., 2013), with support for word, sentence and document-level featureextraction and prediction. It has two main modules:
• Feature Extractor module: extracts several features from source and target texts andalso from MT systems (when available). This module is implemented in Java;
• Machine Learning module: provides wrappers to scikit-learn5 ML algorithmsfor training and applying QE models. This module is programmed in Python.
For sentence and document-level QE, 17 features are commonly used as a baseline6,including as of final baseline at the WMT shared tasks. These are basic features thatcount punctuation marks, tokens and n-grams, compute target and source language modelperplexities and the number of possible translations per word in the source text.
Figure 2.3 shows the QUEST++ structure with the two modules. Our contribution is atthe document-level feature extraction (part highlighted in Figure 2.3). The input files aresequences of paths to source and target documents. These documents are then processedindividually. Since some features are an aggregation of feature values for sentences, thedocument itself is stored as a set of sentences.
We have implemented 78 features that encompass basic counts, LM probabilities, syntac-tic information and lexical cohesion (see Appendix A). The same algorithms used to train
4http://www.quest.dcs.shef.ac.uk5http://scikit-learn.org/stable/6http://www.quest.dcs.shef.ac.uk/quest_files/features_blackbox_baseline_17

2.5 Discussion 39
sentence-level QE models are used to train document-level models, therefore no changeswere made in this module for document level.
Word-LevelFeature Extractor
Raw file
Paths file
Sentence
Paragraph
Document
Sentence-LevelFeature Extractor
Paragraph-LevelFeature Extractor
Document-LevelFeature Extractor
f11,f12,...,f1m...
fn1,fn2,...,fnm
Regressors, Classifiersand Feature Selection
(sentence- ordocument-level)
(Python interface)
CRF(word-level)
(C++ interface)
Sentence-level model
Document-level model
Word-level model
Feature Processing Module
Java interface
m - number of featuresn - number of t, num-
ber of t or number of T
Basic classes Machine learning interface
Pipeline
Pipeline
Fig. 2.3 QUEST++ framework structure
ASIYA7 (Giménez and Màrquez, 2010) is an alternative framework for feature extractionat sentence and document level. ASIYA contains 24 features that can be extracted forsentence or document levels, whilst QUEST++ has 69 features that can be used for bothgranularity levels. Moreover, QUEST++ implements 9 features that are only document-level.Finally, QUEST++ also makes available a ML pipeline for training QE systems at documentlevel. Marmot8 and WCE-LIG9 (Servan et al., 2011) are alternatives for word-level featureextraction and prediction. Qualitative10 (Avramidis, 2016) is an alternative for sentence-levelQE.
2.5 Discussion
In this chapter we presented the evaluation techniques used in MT. Although human eval-uation (Section 2.1) is considered the most reliable type of MT assessment, this type ofevaluation is time-consuming and impractical for gisting also, depending on the type of
7http://asiya.cs.upc.edu/8http://qe-team.github.io/marmot/9https://github.com/besacier/WCE-LIG
10https://github.com/lefterav/qualitative

40 Machine Translation Evaluation
evaluation, the variation between human assessments can be an issue for the reliability of theevaluation.
Automatic metrics for MT evaluation have been proposed to overcome some of the issuesof human evaluation (Section 2.2). These metrics are considerably faster to compute andare useful for comparing different MT systems. Nevertheless, automatic metrics also havedrawbacks such as the need of human references, low intuitiveness and the difficulty ofadapting them for use in translation workflows.
Task-based approaches for MT evaluation are an alternative that are more intuitive thanautomatic evaluation metrics (Section 2.3). Such an evaluation type aims to assess MTconsidering the purpose it will be used for. For example, if the purpose is to improve theproductivity of human translation workflows, post-editing effort information of machinetranslated texts can inform the translators about the quality of the MT they will be translating.Similarly, if the purpose is gisting, reading comprehension questions about the machinetranslated document can be helpful in indirectly assessing the quality of the MT. Suchapproaches are promising since they take into account the practical purpose of MT.
QE of MT uses annotated data points in order to train ML models (Section 2.4). Thequality annotation can be any of the previous types, including human evaluation, automaticmetrics or task-based approaches. However, identifying the right quality label to be used fortraining the QE models is an open challenge.
Document-level QE is a level much less explored than sentence and word-level QE. Forscenarios such as gisting, document-level QE is desirable. Therefore, studying such a level isnecessary in the QE field.
Linguistic features have been shown promising results for QE at word and sentencelevels, improving over baseline results in the majority of the cases. However, the extractionof such features is not straightforward and the use of tools and language-dependent resourcesare needed. Moreover, no previous work has explored discourse features for QE. Finally,although document-level QE can benefit from syntactic and semantic features, document-wide linguistic information (such as discourse) has not yet been explored.
In the next chapter, we present a literature review on discourse processing in NLPfocusing on work done for MT and MT evaluation. We also show the relation between eachlevel of discourse processing and the features for document-level QE proposed by us inChapter 4.

Chapter 3
Discourse Processing
Discourse Processing is an NLP area that aims to define the connections among textual partsthat form a document. AS, TS and Readability Assessment (RA) are some examples of NLPtasks where discourse processing has already been applied. In MT, there have also beeninitiatives to integrate discourse information into different parts of the MT framework.
As mentioned before, traditional MT systems translate texts sentence-by-sentence disre-garding document-wide information. This is the norm in SMT, where the core technique fordecoding (dynamic programming) assumes sentence independence. An exception is Docent(Hardmeier, 2012), a document-level decoder for SMT approaches, based in local search toimprove over a draft translation of the entire document. For each search state, Docent hasaccess to the complete translation of the document. Small modifications are made in thesearch state aiming for a better translation. Although decoding is not the focus of this thesis,it is worth mentioning that Docent enables the use of discourse information into the decodingphase of SMT.
In this chapter, we define the discourse phenomena that are explored in this thesis(Section 3.1), as well as the work related to the use of discourse information for improvingMT systems and for MT evaluation. We follow the definitions of Stede (2011) of cohesionand coherence and also the division of discourse phenomena in three levels: “large units ofdiscourse and topics”, “coreference resolution” and “small units of discourse”. Althoughdiscourse processing encompasses a broad range of phenomena, an exhaustive review of allof them is out of the scope of this thesis. We cover only theories and techniques applied inthe experiments we have performed.
Section 3.2 presents the theory behind “large units of discourse and topics”, focusingon topic modelling, word embeddings and lexical cohesion. Such approaches consider the

42 Discourse Processing
document as a whole and refer to the cohesion of the document. Related work on using suchtechniques for MT is also discussed.
Section 3.3 shows the concept of “coreference resolution” that refers to the coherence ofthe document. Anaphora resolution and local coherence are the topics discussed and relatedwork for MT is also shown.
Finally, in Section 3.4, “small units of discourse” is discussed, including discourse con-nectives and RST studies. These discourse units are responsible for the logical connectionsbetween parts of the text that form a coherent document. MT related work is also presented.
The reason we present work on the use of discourse to improve MT (instead of onlyshowing work on evaluation and QE of MT) is that this work gave us important backgroundfor developing our discourse features (presented in Chapter 4). This literature review is notexhaustive and has the purpose of posing a discussion about the challenges faced in exploringdiscourse in MT.
3.1 Discourse Processing Background
A group of sentences generated by one or more people in order to share information is calleda discourse (Ramsay, 2004). Each sentence in a discourse needs to be interpreted in thecontexts of all sentences involved. Discourses can be from different sizes and, in somecases, the links are established among discourses and not among sentences (e.g. paragraphs,chapters, etc). According to Ramsay (2004), whether the discourse is a text produced byonly one author or it is a dialogue among several speakers does not impact the processingof the information conveyed. In both scenarios, both reader and writer (speaker and hearer)need to share the same beliefs and previous background in order to establish an effectivecommunication.
There are two well-know concepts related to discourse: coherence and cohesion. Accord-ing to Stede (2011), a text is coherent if it is well written around a topic and each sentenceis interpreted based on the other sentences. In order to build a coherent text, sentences areconnected by coreferences (e.g. connectives, anaphora) or by implicit relations given bysemantics and pragmatics. Cohesion is related to local discourse information. Different fromcoherence, where the text should be interpreted in order to find coherent relations, cohesioncan be identified in the surface of the text, without a deep understanding of the text. We caninterpret cohesion as the explicit signs of coherence (e.g. connectives, lexical chains).

3.2 Large Units of Discourse and Topics 43
To explain the diferences between cohesion and coherence, consider examples (i), (ii)and (iii).1
(i) “My favourite colour is blue. I like it because it is calming and it relaxes me. I oftengo outside in the summer and lie on the grass and look into the clear sky when I amstressed. For this reason, I’d have to say my favourite colour is blue.”
(ii) “My favourite colour is blue. Blue sports cars go very fast. Driving in this way isdangerous and can cause many car crashes. I had a car accident once and broke myleg. I was very sad because I had to miss a holiday in Europe because of the injury.”
(iii) “My favourite colour is blue. I’m calm and relaxed. In the summer I lie on the grassand look up.”
Example (i) is coherent because the sentences make sense together (the person likes blue,because it is calm and relaxing). It is also cohesive, since the connections (highlighted) aremade.
On the other hand, Example (ii) is a cohesive paragraph with no coherence. Thisparagraphs uses many cohesion devices and the sentences are well connected. However, theparagraph makes no sense: it contains a number of sentences describing different thingsconnected together.
Finally, we could also find a coherent paragraph with no cohesion as in Example (iii). Asin the first example, this paragraph shows a statement, a cause and an example, although itis more difficult to infer this logical meaning without the cohesive devices. However, onecan still make logical connections mentally in order to understanding this paragraph. On theother hand, this paragraph is not cohesive since there are no connection among the sentences.
3.2 Large Units of Discourse and Topics
Large units of discourse and topics refer to genre. Documents from different genre canpresent different structure and word usage. For instance, scientific documents are differentfrom news and literature. The differences are not only related to content, but also to how theinformation is structured and presented. Paragraphs in different positions of the documentsplay different roles. In scientific papers, for example, the introduction section is usuallyorganised with the first paragraphs presenting background information and motivation and
1These examples were extracted from: http://gordonscruton.blogspot.ca/2011/08/what-is-cohesion-coherence-cambridge.html.
44 Discourse Processing
the last paragraphs summarise the work being presented. In contrast, news documents oftenpresent the background information as the last paragraph.
In addition, the genre will define the style of writing, which is directly related to lexicalchoices. For instance, news documents from a popular newspaper are not expected to use thesame formal level that law agreements present. Humans adapt their writing style accordingto the genre expected.
Finally, lexical consistency can also be viewed as a phenomenon at this level. The art ofkeeping a document consistent in terms of word usage is associated to the topics presented ina document. For example, if a document addresses the Zika virus topic, it is very unlikelythat information about football will appear.
3.2.1 Topic Modelling
Topic modelling refers to the group of algorithms that aim to identify topics in one or moredocuments and organise the information retrieved based on such topics (Blei, 2012). A topiccan be seen as a theme that is explored on a document. Therefore, words such as “dogs” and“cat” are expected to correlate with the topic “pets”, while they are not expected to correlatewith the topic “golf war”. Topics can be extracted using word frequency, Term Frequency -Inverse Document frequency (TF-IDF) and word probabilities as features for topic modelling,among others.
Latent Semantic Analysis (LSA) is a widely known topic modelling method (Landauer,Foltz, and Laham, 1998). This method is based on Singular Vector Decomposition (SVD)for dimensionality reduction. In SVD, a given matrix X can be decomposed into the productof three other matrices:
X =WSPT (3.1)
where W describes the original row entities as vectors of derived orthogonal factor values (aunary matrix with the left singular-vectors); S is a diagonal matrix containing scaling values(the singular values of X) and P (PT is the transpose of P) is the same as W but for columns(a unary matrix with right singular-vectors). When these three matrices are multiplied, theexact X matrix is recovered. The dimensionality reduction consists in reconstructing the X
matrix by only using the highest values of the diagonal matrix S. A dimensionality reductionof order 2 will consider only the two highest values of S, while a dimensionality reduction oforder 3 will consider only the three highest values and so on.
In LSA, the X matrix can be formed by words×sentences, words×documents, sentences×documents, etc. In the case of words× sentence, each cell contains the frequency of a given

3.2 Large Units of Discourse and Topics 45
word in a given sentence. Usually, before applying SVD in LSA, the X matrix is transformedwherefore each cell encapsulates information about a word’s importance in a sentence and aword’s importance in the domain in general. Landauer, Foltz, and Laham (1998) suggest theuse of a TF-IDF transformation in order to achieve this goal.
Latent Dirichlet Allocation (LDA) is another method for topic modelling that considera document as random mixtures of topics (Blei, Ng, and Jordan, 2003). It is a probabilisticmodel that assumes that the topic distribution have a Dirichlet prior.
For each document d in a corpus D, LDA assumes the following process:
1. Choose N ∼ Poisson(ξ ) - (N is chosen from a Poisson distribution)
2. Choose θ ∼ Dir(α) - (θ is chosen from a Dirichlet distribution)
3. For each of the N words wn:
(a) Choose a topic zn ∼ Multinomial(θ )
(b) Choose a word wn from p(wn|zn,β ), a multinomial probability conditioned onthe topic zn
where N is the number of words in d, zn is the nth topic for the word wn, θ is the topicdistribution for d and α and β are the parameters of the Dirichlet prior related to the topicdistribution per document and the word distribution per topic, respectively.
Related Work on MT
Zhao and Zing (2008) propose a bilingual latent variable approach to model cohesion in SMTfor English-Chinese. Such approach extracts monolingual topic-specific word frequenciesand lexical mappings from the parallel data. A bilingual topic model is used to define theprobabilities of candidate translations in the decoding phase. The use of this approachoutperformed a baseline in terms of BLEU.
Zhengxian, Yu, and Guodong (2010) explore LDA for Chinese-English SMT by extract-ing the LDA topics on the English side and including these topics as features in the decodingphase. Compared to a baseline, the authors found an improvement in terms of BLEU whenusing the topical information. Eidelman, Boyd-Graber, and Resnik (2012) also explore LDAfor Chinese-English SMT decoding. They extract LDA topics using two approaches: (i)source text viewed as a document (global version) and (ii) sentence viewed as document(local version) (covering cases where no document mark-up is available). In the test setwith document mark-ups, the decoder, using both global and local versions as features,outperforms a baseline in terms of BLEU.

46 Discourse Processing
Related Work on MT Evaluation and QE
Rubino et al. (2013) explore a LDA approach to create topic models in two different ways forQE at sentence level. First, the authors concatenate both sides of a large bilingual corpus atsentence level. Sentences of source and target language are treated as a single bag of wordsto generate a single topic model. Therefore, the topic model built contains the vocabulary ofboth languages. Second, they explore a polylingual model in which two monolingual topicmodels are built for each language. Features are extracted based on the distance betweensource and target languages at sentence level by using metrics such as Euclidean distanceand the topic models generated. They experiment with Arabic-English, English-French andEnglish-Spanish machine translations and report improved results by using topic models.
Scarton and Specia (2014a) use LSA information for extracting features for QE atdocument level, showing promising results. David (2015) also explores a latent semanticapproach by using bilingual Latent Semantic Indexing (LSI) vectors for sentence-level QE.The author concatenate source and target sentences and built a bilingual vector with wordfrequency. After applying TF-IDF and dimensionality reduction, the vectors are used tocompute similarities between source and target sentences in the test set. His system wassubmitted to WMT15 and was one of the winners of the competition.
In this thesis we focus on using LSA as a metric of local cohesion (Scarton and Specia,2014a). We also extend the work of Rubino et al. (2013) and use LDA topics as features fordocument-level QE (Chapter 4).
3.2.2 Word Embeddings
A widely used framework, called word2vec (Mikolov et al., 2013a), is computationally moreefficient than previous approaches on neural network language models. Such neural modelshave been used in order to extract word representations and proved better than LSA andLDA models for some tasks (Mikolov et al., 2013b). This framework encompasses twoapproaches: Continuous Bag-of-Words (CBOW) model and Continuous Skip-gram model.CBOW aggregates information from words in context in order to predict a given word. Thecontext is usually composed by previous and posterior words (this context is often calledwindow). The Skip-gram model, on the other hand, uses the information of a single wordin order to predict words in a given context. The idea behind this model is to find a goodword representation that is able to define good predictions for its context (Mikolov, Le, andSutskever, 2013).
3.2 Large Units of Discourse and Topics 47
Although word embeddings are not directly related to topic modelling approaches, theypresent an alternative semantic representation of words. Our assumption is that when wordembeddings are combined at document level, they are able to encode information about thelexical cohesion of documents (Scarton et al., 2016).
Related Work on MT
Martínez-Garcia, Bonet, and Màrquez (2015) extend the work of Martínez-Garcia et al.(2014) and implement monolingual and bilingual word vector models into Docent. Wordvectors are acquired from a large corpus using CBOW. Although their results do not showimprovements over a SMT baseline, the use of word vector models improved over a Docentbaseline.
Related Work on MT Evaluation and QE
Shah et al. (2015b) explore vectors extracted from a Continuous Space Language Model(CSLM) as features for sentence-level QE. CSLM implements a deep neural networkarchitecture, with more layers than models like CBOW and skip-gram. Results show onlyslight improvements over a baseline when such features are used. In the same work, theauthors present results of the use of CBOW vectors as features for word-level QE. Theytrained monolingual vectors and also a bilingual approach based on the work of Mikolov, Le,and Sutskever (2013). Results show that the use of bilingual vectors lead to better results(when compared to the use of monolingual data alone), although it did not outperform astrong baseline system. Finally, Shah et al. (2015a) explore CSLM for sentence-level QE inseveral datasets showing that the use of such features outperform the baseline in all datasets.
In this thesis we experiment with word2vec representations for document-level QE, byaggregating word vectors for the entire document (Chapter 4).
3.2.3 Lexical Cohesion
Lexical cohesion is a phenomenon of discourse related to reiteration and collocation (Hallidayand Hasan, 1976). Reiteration happens when lexical items are repeated in order to keep thedocument cohesive. Synonyms, near-synonyms or superordinates can also be used to ensurelexical variety, without losing cohesion. For example Halliday and Hasan (1976, p. 278):
(iv) “There was a large mushroom growing near her, about the same height as herself; and,when she had looked under it, it occurred to her that she might as well look and see

48 Discourse Processing
what was on the top of it. She stretched herself up on tiptoe, and peeped over the edgeof the mushroom, ...”
(v) “Accordingly... I took leave, and turned to the ascent of the peak. The climb isperfectly easy...”
(vi) “Then quickly rose Sir Bedivere, and ran,And leaping down the ridges lightly, plung’dAmong the bulrush beds, and clutch’d the swordAnd lightly wheel’d and threw it. The grand brandMade light’nings in the splendour of the moon...”
(vii) “Henry’s bought himself a new Jaguar. He practically lives in the car.”
In Example (iv) the word mushroom is repeated in order to make the cohesive connection.In Example (v) ascent and climb are synonyms. An example of near-synonym is presentedin (vi) with sword and brand. Finally, Example (vii) shows a case where a superordinate isused to make the reference: car, a more general lexical item, is used to refer back to Jaguar.
Collocations is the lexical cohesion form where lexical items are correlated because theyfrequently occur together. They are relations between lexical items that are not as strong asthe relations presented by items in reiteration. Instead, these relations are defined by wordmeaning (e.g. antonyms - like and hate), ordered series (e.g. week days), unordered lexicalsets (e.g. co-hyponyms - chair and table, both hyponyms of furniture). In summary, detectingcollocations is a more challenging lexical cohesion phenomenon than reiteration, since therelations between the lexical items are weaker and, sometimes, very hard to automaticallyidentify.
Related Work on MT
Carpuat (2009) explores the “one translation per discourse” hypothesis, based on the “onesense per discourse” hypothesis of the Word Sense Disambiguation (WSD) area (Gale,Church, and Yarowsky, 1992). This hypothesis says that each discourse should have the sametranslation within the entire document, in order to preserve consistency. She experiments withFrench-English human and machine translated texts and, in both cases, the lexical choicesare considerably consistent. However, when comparing the machine translations with thereference translations, the majority of the cases where the references were consistent and themachine translations not, are, in fact, errors of the MT system. Therefore, the author proposesa post-processing stage to enforce “one translation per discourse” in the SMT outputs that

3.2 Large Units of Discourse and Topics 49
achieves slight improvements in BLEU, METEOR and National Institute of Standards andTechnology (NIST) metrics. Ture, Oard, and Resnik (2012) also explore “one translation perdiscourse” hypothesis for Arabic-English and Chinese-English texts. They use a hierarchicalphrase-based MT system based on Synchronous Context-Free Grammar (SCFG), whichallows them to use the grammar rules for identifying the phrases that appear repeatedly in thesource documents. The authors, then, use a forced decoding in order to implement the “onetranslation per discourse” hypothesis into the MT system. In forced decoding, the decoderuses rules from the SCFG learned from the translation pairs in order to find the derivationsthat transform the source sentence into the target sentence. Their approach outperforms abaseline systems (in terms of BLEU).
Carpuat and Simard (2012) make a detailed evaluation of lexical consistency in SMTfor French-English, English-French and Chinese-English language pairs, using data fromdifferent sources and sizes. The authors found that SMT is as consistent in lexical choices asmanually translated texts. In addition, the smallest dataset used presents higher consistencythan its larger version (for Chinese-English), which can be explained by the size of thevocabulary being more restricted in a small corpus, favouring consistency. Although SMTcan be generally consistent, the authors also show that the inconsistencies found in machinetranslated texts are more strongly correlated to MT errors than the inconsistencies found inhuman translated texts.
Xiao et al. (2011) explore lexical consistency to improve SMT at document level forChinese-English. Ambiguous words are identified by their translations in the target language(if a word presents more than one translation in the target corpus it is considered ambiguous)and a set of translations candidates (C(w)) for each word (w) is defined. The authorsemploy two approaches: (i) post-editing: if t is a translations of the word w, but t does notappear in C(w), t is replaced by a translation in C(w) that guarantees consistency within thedocument; and (ii) re-decoding: in the first stage, the translation table is filtered eliminatingany translation t that does not appear in C(w) and then, on the second stage, the sourcesentences are decoded again using the filtered translation table. Their systems improveover the baseline by choosing the right translation for ambiguous words, in terms of errorreduction. In terms of BLEU, only the re-decoding version outperforms the baseline.
Xiong, Ben, and Liu (2011) use lexical cohesion for document-level SMT in Chinese-English, by proposing three models to capture lexical cohesion: (i) direct rewards - rewardshypotheses that present lexical cohesion devices; (ii) conditional probabilities - decides theappropriateness of either using a hypothesis with a lexical cohesion or not, based on theprobability of occurrence of a lexical cohesion device y, given the previous lexical cohesion
50 Discourse Processing
device x; and (iii) mutual information triggers - includes mutual information consideringthat x triggers y and, therefore, the chance of y occurring given x is the same as x triggeringy. They integrate the information of three models as features in the decoding phase and,therefore, the documents are first translated at sentence-level and the discourse informationis added later on. All models improve over the baseline (in terms of BLEU) with the mutualinformation triggers being the best model. Ben et al. (2013) explore a bilingual lexicalcohesion trigger model that also considers lexical cohesion devices in the source side. Theirresults are better than the baseline in terms of BLEU.
Related Work on MT Evaluation and QE
Wong and Kit (2012) use lexical cohesion metrics for MT evaluation at document level. Theauthors consider the repetition of words and stems for reiteration and the use of synonyms,near-synonyms and superordinate for collocations. The integration of these metrics withthe traditional BLEU, TER and METEOR are also studied. Results are compared withhuman assessments using Pearson’s r correlation. The highest correlation is acquired whenMETEOR and the discourse features are combined.
Scarton and Specia (2014a) follow Wong and Kit (2012) and explore lexical cohesionfor document-level QE of machine translated texts in English-Portuguese, English-Spanishand Spanish-English. Results show slight improvements over a baseline (Chapter 4). Finally,Gong, Zhang, and Zhou (2015) combine topic models and lexical cohesion with BLEU andMETEOR for two datasets of Chinese-English machine translations. Results show that thecombination of BLEU or METEOR with topic models or with lexical cohesion yield highercorrelation scores with human judgements than the traditional metrics alone.
In this thesis we explore lexical cohesion following (Scarton and Specia, 2014a), consid-ering word and stem repetitions as features for document-level QE (Chapter 4).
3.3 Coreference Resolution
Coreference occurs through coherence realisation (Hobbs, 1979). As mentioned before,coherence encompasses an overlap of information among different discourses in a givendocument. In order to understand coreference, we need to introduce the concept of referringexpressions.
Referring expressions refer to objects that were previously introduced in the discourseor are introduced for further discussion (Ramsay, 2004). They can also make reference to

3.3 Coreference Resolution 51
some world knowledge that both reader and writer share (Stede, 2011). Coreference is, then,the phenomenon where different referring expressions refer to the same object. For exampleStede (2011, p. 40):
(viii) “A man named Lionel Gaedi went to the Port-au-Prince morgue in search of his brother,Josef, but was unable to find his body among the piles of corpses that had been leftthere.”
The underlined expressions in Example (viii) are referring expressions that have coref-erences. Josef refers to his brother, while his refers to A man named Lionel Gaedi. Thehis (in his body) refers to Josef and his brother. The referring expression there refers to the
Port-au-Prince morgue.
Anaphors, pronouns, definite and indefinite noun phrases (NP) are examples of referringexpressions. Resolving a coreference means to make explicit the connections among referringexpressions that point to the same object (e.g. finding the NP that a pronominal anaphorrefers to).
3.3.1 Anaphora Resolution
Referring expressions that point back to expressions already presented in the text are calledanaphora. An anaphor is the referring expression that refers to an antecedent (anotherreferring expression that was mentioned previously). For example Mitkov (2004, p. 267):
(ix) “Sophia Loren says she will always be grateful to Bono. The actress revealed that theU2 singer helped her calm down during a thunderstorm while travelling on a plane.”
All the underlined expressions in Example (ix) refers to the same entity (Sophia Loren)forming a coreferential chain. There are different types of anaphora: pronominal, lexical,verb, adverb and zero. In this thesis, we explore the pronominal anaphora that are realisedby personal, possessive, reflexive, demonstrative or relative pronouns. This is the mostcommon type of anaphora and can be identified by NLP tools with more confidence thanother anaphora types.
Anaphora resolution is the task in NLP that aims to identify the antecedent of a givenanaphor. Although it can be simple to humans, this task poses several challenges for automaticprocessing. Firstly, anaphors need to be correctly identified. This means that anaphoricpronouns, NP, verbs and adverbs need to be separated from non-anaphoric terms. Secondly,
52 Discourse Processing
the candidates for antecedents need to be selected. Finally, each anaphor is resolved accordingto the candidate list.
Finding the right antecedents among all the candidates can be a very difficult for anautomatic system, which makes the task of anaphora resolution very problematic. Forexample, in the sentence “The soldiers shot at the women and they fell.” Mitkov (2004,p. 272), it is not easy to resolve the anaphor they. For humans, it can be trivial since it isexpected that after getting shot the women fell. However, this involves world knowledge,which automatic approaches do not have access to.
A popular way of building systems for automatic anaphora resolution rely on the use ofcorpora annotated with coreference chains and ML approaches.2
Related Work on MT
LeNagard and Koehn (2010) explore anaphora resolution techniques applied to English-French SMT. The framework consists in: (i) identifying the pronouns in the source side;(ii) applying techniques of anaphora resolution to find the noun phrases that resolved eachanaphoric pronoun; (iii) finding the word or noun phrase aligned to this noun phrase inthe target language; (iv) identifying the gender of the word in the target language and; (v)annotating the gender in the source pronoun. Therefore, nothing is changed in the SMTsystem, it is only trained with annotated data. No improvements in terms of BLEU arefound and the authors claim that the low performance of the anaphora resolution systems hasimpacted their results. Guillou (2012) follows the same framework of LeNagard and Koehn(2010), but for English-Czech. In her work, the pronouns are annotated with gender, numberand animacy information. However, again, no improvements are found against a baselinesystem. Recently, Novák, Oele, and van Noord (2015) explore coreference resolution systemsfor improving a syntax-based MT system. Their approach also includes the use of rulesthat choose which pronoun in the target has antecendent anaphoric information. Resultsfor English-Dutch and English-Czech show slight improvements in terms of BLEU over abaseline.
Hardmeier and Federico (2010) explore pronominal anaphora resolution for English-German translations, also using an anaphora resolution system to annotate the pronouns andtheir antecedents. However, the information from the anaphora resolution system is fed intothe decoder in order to take the antecedent of a given pronoun into account for its translation.No significant improvement in terms of BLEU is found. However, when evaluating theprecision and recall of pronoun translations, their system outperforms the baseline.
2More details about work on anaphora resolution can be found in Mitkov (2004) and Stede (2011).
3.3 Coreference Resolution 53
Hardmeier (2014) also explores pronominal anaphora resolution for MT, but in a morespecialised way. Firstly, a neural-network-based model to predict cross-lingual pronounsis built. This model performs pronoun resolution and pronoun labelling in one step. Animportant feature of this neural network is that it only uses parallel corpora without relyingon tools for anaphora resolution. This information about pronouns is then included into adocument-level decoder (also described in Hardmeier (2014)). This approach improves overthe baseline in terms of BLEU in one of their test sets (English-French).
Machine translation of pronouns has been addressed as a translation shared task. The firstwas organised in 2015 (Hardmeier et al., 2015) having six participating systems. Althoughthe systems did not outperform the baseline in terms of BLEU-style metrics, they showedbetter results when metrics that take into account pronoun translations were used.
In this thesis we only address pronominal anaphora by counting the number of personalpronouns in the documents and use this as features for document-level QE (Scarton andSpecia, 2015) (Chapter 4).
3.3.2 Local Coherence
Entity-based Local Coherence (Barzilay and Lapata, 2005) is a model of coherence basedon the Centering Theory (Grosz, Joshi, and Weinstein, 1995). This theory assumes that atext segment that encompasses information about a single discourse entity (coreferent NounPhrases (NPs)) is more likely to be coherent than a segment with information about severaldiscourse entities. It also defines the concept of focus: the most important discourse entityin a sentence; and transition: how the focus is passed from a sentence into another. Thesyntactic realisation of the focus is also discussed: such entities are often found as subject orobject and are often referred by the use of anaphors.
In the method proposed by Barzilay and Lapata (2005) the text is represented as amatrix where the columns contain the discourse entities and the rows correspond to thesentences. The cell contains information about the syntactic realisation of the discourseentities in the sentences. In order to create the grid, the coreferent entities need to be clusteredand then coreference resolution systems are applied. By using this model, the coherenceof texts is assessed based on how likely the transitions that the entities have in adjacentsentences are, while represented as rows in the matrix.
Guinaudeau and Strube (2013) propose a graph-based method for local coherence bysimplifying the method of Barzilay and Lapata (2005). Their method is based on a bipartitegraph which avoids data sparsity and is a more robust way of coherence representation that

54 Discourse Processing
can efficiently model relations between non-adjacent sentences. All nouns are consideredas discourse entities and the graph maps the connections among the sentences where theentities appear. Coherence is then derived from the number of shared edges in the graph.Guinaudeau and Strube (2013) achieve similar results to Barzilay and Lapata (2005).
A model for local coherence based on syntactic patterns was proposed by Louis andNenkova (2012). This model assumes that local coherence can be defined by syntacticpatterns between adjacent sentences. They also propose an approach for global coherencethat assumes sentences with similar syntactic realisation have similar communicative goal.
Sim Smith, Aziz, and Specia (2016a) developed a tool (Cohere) that extracts a coherencescore for documents, by using the models from Barzilay and Lapata (2005), Louis andNenkova (2012) and Guinaudeau and Strube (2013). They also propose a new method forlocal coherence based on Louis and Nenkova (2012)’s model and IBM-1 alignments, thatconsiders the alignments between adjacent sentences as a latent variable.
Related Work on MT
Sim Smith, Aziz, and Specia (2016b) explore the models implemented in Cohere (SimSmith, Aziz, and Specia, 2016b) to evaluate the coherence of machine translated documents,considering German-English, French-English and Russian-English language pairs. Theirhypothesis was that machine translated documents would show worse coherence scores thanreference documents. The IBM-1 and the graph-based models show the best results sincethey scored machine translated documents worse than reference translations.
Related Work on QE of MT
Scarton et al. (2016) use Cohere to extract coherence features for document-level QE,building a system submission for the WMT16 QE shared task. The graph based approach ofGuinaudeau and Strube (2013) was used to extract coherence scores for source and targetdocuments. Such features were combined with our discourse features presented in Chapter 4.The best model in the test set uses coherence information from source and target.
In this thesis although we have explored coherence scores for document-level QE in Scar-ton et al. (2016), such approach did not show improvements over other methods implementedby us (such as the ones presented in Chapter 6). Therefore, given the poor results obtainedcompared to other features and the complexity of running Cohere for languages other thanEnglish, we decided to not include these features in the experiments presented in this thesis.

3.4 Small Units of Discourse 55
3.4 Small Units of Discourse
According to Stede (2011), small units of discourse are responsible for the logical componentthat makes a document coherent. Coherence relations connect text spans together insidea document, according to semantic or pragmatic factors. Such relations can be explicit orimplicit. For example:
(x) “John took a train from Paris to Istanbul, but he never arrived.” Stede (2011, p. 79)
(xi) “John took a train from Paris to Istanbul. He has family there.” Stede (2011, p. 84)
Whilst in Example (x) the discourse connective but is explicitly connecting the two textsegments (and establishing a contradictory relation between them), the connection betweenthe two sentences in Example (xi) is not marked. We can infer a causal relation between thesentences in Example (xi), which is that John did something because he had reasons for that,although there is nothing explicitly defining this causal relation.
Discourse connectives play an important role in the task of identifying discourse relations.They explicitly define why two segments of texts are connected.
Regarding discourse relations themselves, RST (Mann and Thompson, 1987) is a linguis-tic theory that has been widely used to describe such relations, not only in linguistic studiesbut also in computational linguistics, in order to build discourse parsers (more details aboutRST are presented in Section 3.4.2).
A crucial concept in RST is the definition of Elementary Discourse Units (EDUs). EDUsare the text segments connected by discourse relations. The task of automatically identifyingEDUs is challenging on itself, since EDUs need to be understood in order to define whichcoherence relation connects them. Moreover, these discourse relations can or cannot beexplicitly marked (as shown in Examples (x) and (xi)).
3.4.1 Discourse connectives
Discourse connectives are composed by one (e.g. therefore) or more words (e.g. even
though) that can only be disambiguated by the use of semantics and pragmatics. They belongto a closed-class of words and they are used to connect sentences or EDUs in a logical way.Example (xi) shows the word but working as a discourse connective, connecting two EDUsJohn took a train from Paris to Istanbul and he never arrived. The relation between the twoEDUs is a contradiction: the second EDUs is contradicting the first one.

56 Discourse Processing
Therefore, discourse connectives can be classified by the type of the relation that theyestablish (but could be classified as a Contradiction connective or, in a more coarse classifi-cation as a Comparison connective). Exhaustive lists of connectives have been built, withconnectives being classified in fine-grained or coarse classes. Nevertheless, connectives canbe ambiguous and belong to different classes (or even be used in non-discourse relations).Examples (xii) and (xiii) show cases where the connective since is used in two differentsenses. In Example (xii), since is classified as a Temporal connective, while in Example(xiii), it is classified as Contingency.3
(xii) “They have not spoken to each other since they saw each other last fall.”
(xiii) “I assumed you were not coming since you never replied to the invitation.”
On the other hand, Examples (xiv) and (xv) show the word and being used as a connectiveand as a non-discourse marker. While in Example (xiv) and is classified as Expansion, inExample (xv) and does not establish any discourse relation.
(xiv) “John likes to run marathons, and ran 10 last year alone.”
(xv) “My favorite colors are blue and green.”
An important resource containing information about discourse connectives is the PennDiscourse Treebank (PDTB) (Prasad et al., 2008), a corpus annotated with discourse relations.In this corpus, discourse relations are annotated as both explicit and implicit. When a relationis identified, the arguments of the discourse relations (EDUs) are also annotated, followingthe PropBank annotation style (e.g. Arg1, Arg2, etc.) (Palmer, Gildea, and Kingsbury, 2005).
A system aiming to automatically identify and classify discourse connectives should beable to distinguish between discourse connectives and non-discourse markers and correctlyclassify the discourse connectives. The Discourse Connectives Tagger developed by Pitler andNenkova (2009) is an example of such a type of system that classifies discourse connectives inExpansion, Contingency, Comparison or Temporal. Non-discourse markers are also identified.The authors used the PDTB discourse annotations in order to train a maximum entropyclassifier that aims to distinguish discourse connectives from non-discourse connectivesand classify discourse connectives in one of the four classes mentioned previously. Asfeatures, Pitler and Nenkova (2009) explore syntactic information along with the string ofthe connectives. For the task of distinguishing discourse connectives from non-discourse
3Examples (xii), (xiii), (xiv) and (xv) are extracted from http://www.cis.upenn.edu/~nlp/software/discourse.html.

3.4 Small Units of Discourse 57
connectives they achieve 96.26% of accuracy, whilst for the sense classification task resultsshow 94.15% of accuracy.
Related Work on MT
Meyer et al. (2011) train a classifier for connectives on the PDTB in order to improvemachine translations for English-French. The connectives are classified into six classes:Temporal, Cause, Condition, Contrast, Concession and Expansion. Ambiguous connectivesare classified in multiple classes directly into the training data. In this way, the MT systemlearns translated rules from the annotated version of the corpus with connectives, which leadsto a slight improvement in BLEU over a baseline.
Meyer and Popescu-Belis (2012) propose three different ways of dealing with connectivesfor English-French machine translation. The first approach changes the MT system phrase-table by adding information about manual labelled connectives into it. The second usesmanually annotated connectives and train a SMT system over the annotated data. Finally,the third approach considers automatically annotated connectives to train a SMT over theannotated data (the connectives classifiers are trained on the PDTB). They evaluate thedifferent approaches in terms of BLEU and also in terms of connectives changes (numberof connectives that are correctly, incorrectly or not translated). The modified phrase-tableexperiments show the best results for the percentage of connectives changed correctly. Interms of BLEU, no major improvement is achieved in any of the experiments.
Meyer et al. (2012) also explore the problem of discourse connectives translation forEnglish-French. The discourse connective classifier only targets seven ambiguous connec-tives, because it is expected that MT systems would fail in cases of ambiguity. They integratethese labelled connectives into a hierarchical and a phrase-based SMT systems in two ways.Similarly to Meyer and Popescu-Belis (2012), their first approach includes information aboutdiscourse connectives into the phrase table. The second approach translates the annotateddata directly. For evaluation, they use BLEU and a new metric called Accuracy of ConnectiveTranslation (ACT). ACT compares the candidate translations of a connective with the humanreference (retrieved from a dictionary). The phrase-based version of the discourse augmentedfactored translation approach shows the best results for both BLEU and ACT.
Li, Carpuat, and Nenkova (2014) study connectives in order to improve MT for Chinese-English and Arabic-English. Firstly, they examine the cases where a single sentence in thesource side is manually translated into more than one sentence in the target side. Chinese-English shows many cases in which sentences were translated from one to many, becausefinding the sentence (or even word) boundaries in Chinese is not trivial. Besides that, there is
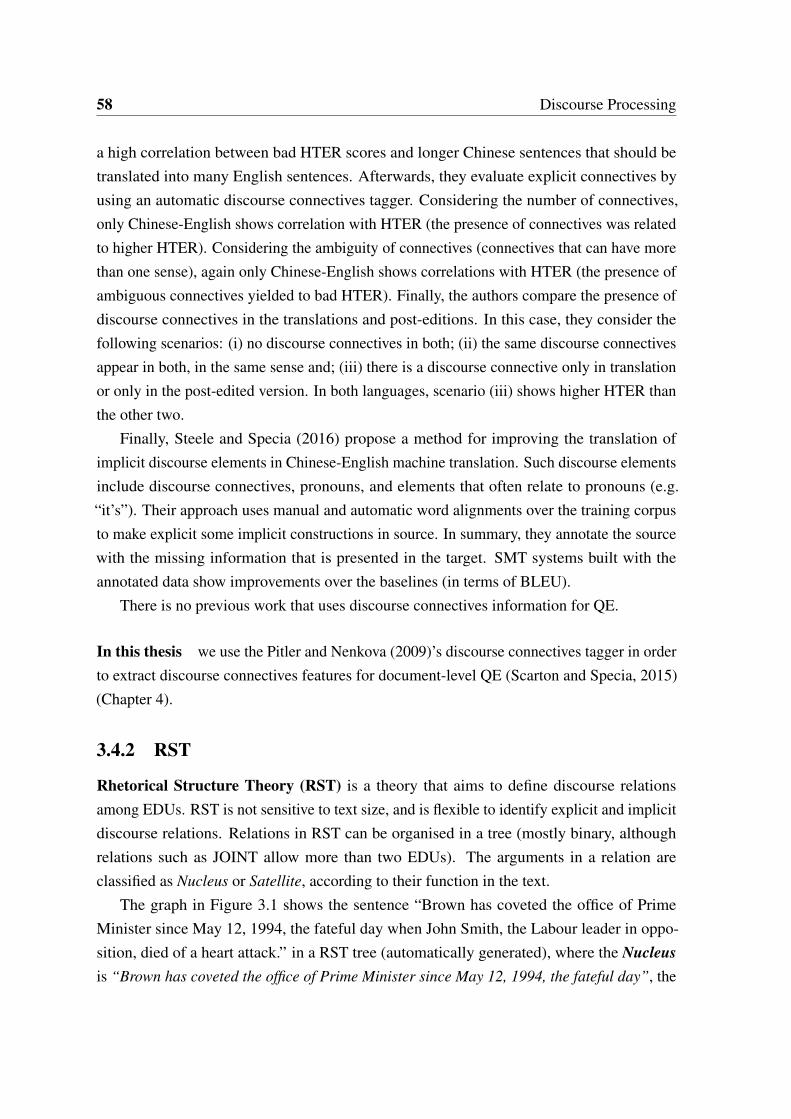
58 Discourse Processing
a high correlation between bad HTER scores and longer Chinese sentences that should betranslated into many English sentences. Afterwards, they evaluate explicit connectives byusing an automatic discourse connectives tagger. Considering the number of connectives,only Chinese-English shows correlation with HTER (the presence of connectives was relatedto higher HTER). Considering the ambiguity of connectives (connectives that can have morethan one sense), again only Chinese-English shows correlations with HTER (the presence ofambiguous connectives yielded to bad HTER). Finally, the authors compare the presence ofdiscourse connectives in the translations and post-editions. In this case, they consider thefollowing scenarios: (i) no discourse connectives in both; (ii) the same discourse connectivesappear in both, in the same sense and; (iii) there is a discourse connective only in translationor only in the post-edited version. In both languages, scenario (iii) shows higher HTER thanthe other two.
Finally, Steele and Specia (2016) propose a method for improving the translation ofimplicit discourse elements in Chinese-English machine translation. Such discourse elementsinclude discourse connectives, pronouns, and elements that often relate to pronouns (e.g.“it’s”). Their approach uses manual and automatic word alignments over the training corpusto make explicit some implicit constructions in source. In summary, they annotate the sourcewith the missing information that is presented in the target. SMT systems built with theannotated data show improvements over the baselines (in terms of BLEU).
There is no previous work that uses discourse connectives information for QE.
In this thesis we use the Pitler and Nenkova (2009)’s discourse connectives tagger in orderto extract discourse connectives features for document-level QE (Scarton and Specia, 2015)(Chapter 4).
3.4.2 RST
Rhetorical Structure Theory (RST) is a theory that aims to define discourse relationsamong EDUs. RST is not sensitive to text size, and is flexible to identify explicit and implicitdiscourse relations. Relations in RST can be organised in a tree (mostly binary, althoughrelations such as JOINT allow more than two EDUs). The arguments in a relation areclassified as Nucleus or Satellite, according to their function in the text.
The graph in Figure 3.1 shows the sentence “Brown has coveted the office of PrimeMinister since May 12, 1994, the fateful day when John Smith, the Labour leader in oppo-sition, died of a heart attack.” in a RST tree (automatically generated), where the Nucleusis “Brown has coveted the office of Prime Minister since May 12, 1994, the fateful day”, the

3.4 Small Units of Discourse 59
Satellite is “when John Smith, the Labour leader in opposition, died of a heart attack.” andthe relation between them is ELABORATION.
ELABORATION
Brown has covetedthe office of PrimeMinister since May12, 1994, the fate-ful day
when John Smith,the Labour leaderin opposition, diedof a heart attack.
Fig. 3.1 Example of RST relation between two EDUs.
Given its feature of tree organisation, RST has been used by different purposes in NLP.Joty et al. (2013) developed an RST parser that extracts EDUs and provides the RST trees atsentence and document levels. The first step in this parser is to segment sentences into EDUsthat later will be connected by the discourse relations. The EDUs are identified by using theSPADE tool (Soricut and Marcu, 2003) and the Charniak’s syntactic parser (Charniak, 2000).
The second step consists in establishing inter-sentential and intra-sentential relations.Firstly, RST subtrees are built at sentence level in order to identify the intra-sententialrelations. Then, the parser builds the inter-sentential relations by connecting the subtreesfor each sentence into a single RST tree. Both approaches (inter and intra) are composedby two modules: parsing model and parsing algorithm. Inter-sentential and intra-sententialcases have different parsing models, whilst they share the same parsing algorithm. Theparsing models are responsible for assigning a probability to every candidate RST treeand are implemented using Conditional Random Fields (CRFs). On the other hand, theparsing algorithm chooses the RST tree most likely to fit a given scenario and is implementedas a probabilistic CKY-like bottom-up algorithm. Joty et al. (2013)’s parser significantlyoutperforms previous work in terms of f -score.
Related Work on MT
Marcu, Carlson, and Watanabe (2000) use RST to evaluate the feasibility of building adiscourse-structure transfer model towards a Discourse-Based MT system. The frameworkproposed in their work is divided in three parts: (i) discourse parser - to apply in the sourcetexts; (ii) discourse-structure transfer model - to rewrite the structures in the source texts
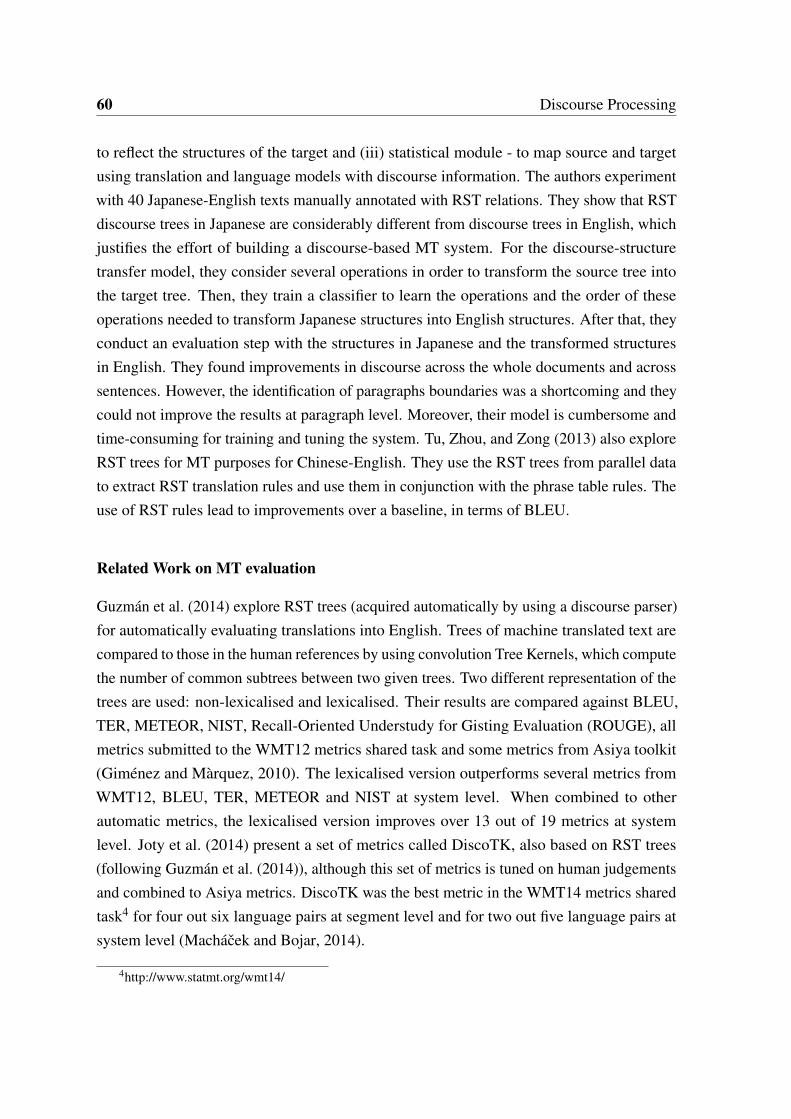
60 Discourse Processing
to reflect the structures of the target and (iii) statistical module - to map source and targetusing translation and language models with discourse information. The authors experimentwith 40 Japanese-English texts manually annotated with RST relations. They show that RSTdiscourse trees in Japanese are considerably different from discourse trees in English, whichjustifies the effort of building a discourse-based MT system. For the discourse-structuretransfer model, they consider several operations in order to transform the source tree intothe target tree. Then, they train a classifier to learn the operations and the order of theseoperations needed to transform Japanese structures into English structures. After that, theyconduct an evaluation step with the structures in Japanese and the transformed structuresin English. They found improvements in discourse across the whole documents and acrosssentences. However, the identification of paragraphs boundaries was a shortcoming and theycould not improve the results at paragraph level. Moreover, their model is cumbersome andtime-consuming for training and tuning the system. Tu, Zhou, and Zong (2013) also exploreRST trees for MT purposes for Chinese-English. They use the RST trees from parallel datato extract RST translation rules and use them in conjunction with the phrase table rules. Theuse of RST rules lead to improvements over a baseline, in terms of BLEU.
Related Work on MT evaluation
Guzmán et al. (2014) explore RST trees (acquired automatically by using a discourse parser)for automatically evaluating translations into English. Trees of machine translated text arecompared to those in the human references by using convolution Tree Kernels, which computethe number of common subtrees between two given trees. Two different representation of thetrees are used: non-lexicalised and lexicalised. Their results are compared against BLEU,TER, METEOR, NIST, Recall-Oriented Understudy for Gisting Evaluation (ROUGE), allmetrics submitted to the WMT12 metrics shared task and some metrics from Asiya toolkit(Giménez and Màrquez, 2010). The lexicalised version outperforms several metrics fromWMT12, BLEU, TER, METEOR and NIST at system level. When combined to otherautomatic metrics, the lexicalised version improves over 13 out of 19 metrics at systemlevel. Joty et al. (2014) present a set of metrics called DiscoTK, also based on RST trees(following Guzmán et al. (2014)), although this set of metrics is tuned on human judgementsand combined to Asiya metrics. DiscoTK was the best metric in the WMT14 metrics sharedtask4 for four out six language pairs at segment level and for two out five language pairs atsystem level (Machácek and Bojar, 2014).
4http://www.statmt.org/wmt14/

3.5 Discussion 61
Similar to discourse connectives, there is no previous work that uses RST informationfor QE.
In this thesis we use Joty et al. (2013)’s RST parser and extract different features fordocument-level QE (Scarton and Specia, 2015) (Chapter 4).
3.5 Discussion
In this chapter, we discussed the definitions on discourse that are important for our thesisalong with a discussion about related work on MT, MT evaluation and QE using discourse.We followed Stede (2011) in terms of discourse definitions and the organisation of discourseprocessing in three levels: large units of discourse and topics, coreference resolution andsmall units of discourse (Section 3.1). Such structure allowed us to keep the definitionscoherent and to keep consistency along the entire thesis (the features presented in Chapter 4are also organised based on this structure).
The related work on MT, MT evaluation and QE was also presented following Stede’sclassification. Regarding large units of discourse and topics, a considerable amount of workhas been done in both topic modelling and lexical cohesion aiming to improve MT (Section3.2). However, it is still unclear how to use such information for improving MT systemswithout losing in performance. Moreover, in terms of evaluation, very little has been done.
In the discussion about coreference resolution (Section 3.3), we found that the majorityof work done focused on anaphora resolution. In fact, almost all work done with the Docentdecoder aimed to improve the translation of anaphora. Nevertheless, the impact of suchapproaches is still not completely understood and further evaluation (perhaps beyond BLEU)still needs to be performed. In terms of MT evaluation, there is a lack of studies, which isan open ground for future investigations. Much less work has been done regarding localcoherence.
As we showed in the discussion about small units of discourse (Section 3.4), a consid-erable amount of work has been done in discourse connectives. However, such approacheshave the same problems as the ones that address anaphora: the impact they have on MTquality it is still not understood. The use of RST was also explored by work in MT and MTevaluation, although it has several practical issues, such as the need for manually annotateddata or RST parsers.
We can conclude that, although there are already initiatives that include discourse infor-mation in MT and MT evaluation, there are many open issues that still need to be explored.
62 Discourse Processing
With recent advances in NLP, more resources and tools to process discourse are being de-veloped and, therefore, more work addressing this topic in the context of MT is expected tobe done. Moreover, with initiatives such as Docent, the inclusion of discourse informationinto SMT systems is more reliable, because changing the decoder may not cover the sametype of context that Docent can handle. Finally, it is important to mention that the evaluationof such discourse-aware approaches need to go beyond traditional automatic evaluationmetrics in order to make a fair evaluation. In fact, related work on the use of discourseinformation for MT presented within this chapter show none or marginal improvementsover baseline systems according to BLEU. This does not necessarily mean that such newapproaches are not better than the baseline, but that the inadequate evaluation may be beingperformed. BLEU (and the majority of the automatic evaluation metrics) does not accountfor discourse and changes on discourse units (sometimes sutil) will not be taken into account.Therefore, a more reliable evaluation framework needs to be developed in order to evaluatediscourse-aware MT approaches.
In the next chapter we present our work on feature engineering for document-levelQE. We propose an adaptation of the sentence-level features (presented in Chapter 2) fordocument-level QE. We also describe how we explore the discourse information presentedin this chapter as features for document-level QE.

Chapter 4
Document-level QE: FeatureEngineering
As mentioned in Chapter 1, feature engineering is one of the main challenges in QE.1
Finding the best way of using the information from source and target documents, togetherwith external resources, is one of the bases for building a well performing QE system. In thischapter we present our study on feature engineering for document-level QE.
QE features can be classified in four classes (Specia et al., 2011). Complexity featuresuse information from the source texts in order to capture the difficulty in translating it.Such features can use shallow information (e.g. number of tokens in the source text) orsophisticated linguistic information (e.g. probability of a syntactic parse tree being generatedfor the source text). Conversely, fluency features use only target information and assess howfluent a given target text is. Fluency features can also use shallow (e.g. number of tokens inthe target text) or deep linguistic information (e.g. probability of a syntactic parse tree beinggenerated for the target text). Therefore, complexity and fluency features can be extractedusing similar approaches. Confidence features use information from the MT system usedto produce the translations (usually a SMT system). This kind of features attempt to capturehow confident a system is in producing a given translation. Finally, adequacy features useinformation from both source and target texts. The aim of these features is to assess whetheror not the translation preserves the meaning and structure of the source. Adequacy featuresinclude simple ratios between source and target counts (e.g. ratio of number of tokens
1Parts of this chapter were previously published in peer-reviewed journal and conferences: Scarton andSpecia (2015), Scarton (2015), Scarton, Tan, and Specia (2015), Scarton and Specia (2014a) and Scarton andSpecia (2014b).

64 Document-level QE: Feature Engineering
between source and target) and complex information from alignments of named entities,syntactic structures, among others.
In this thesis, we focus on complexity, fluency and adequacy features. Since we considerthe translation process as a black-box and we mix different types of translation systems,including commercial and non-commercial versions, we do not have access to informationabout the systems used. Our adequacy features are shallow ratios between source andtarget, since there are no resources available in various source and target languages for moresophisticated features. Finally, the majority of our features are complexity features, giventhat deep linguistic features are only applied for English as the source language because ofthe lack of reliable resources and tools for languages other than English and the difficultyof running such resources/tools on target texts. Target texts contain many ungrammaticalstructures that cannot be reliably processed by traditional NLP tools, generating errors ornoisy annotations. Manually correcting such errors is unfeasible and it would result inartificial data.
Our features can be divided in document-wide features and discourse-aware features.Document-aware features can be simple counts at document level or aggregation of sentence-level information. Discourse-aware features use some kind of discourse information.
Moreover, we also experiment with pseudo-reference features. Pseudo-references aretranslations produced by one or more external MT systems, which are different from theone producing the translations we want to predict the quality for. Such systems are usedas references against which the output of the MT system of interest can be compared usingstring similarity metrics, such as the automatic evaluation metrics for MT. For QE, suchfeatures have been explored by Soricut and Echihabi (2010) and Scarton and Specia (2014a).In both cases, pseudo-reference features lead to better QE models.
Ideally, the quality of the MT system being used to produce pseudo-references needs tobe known (and this system should usually be better than the MT system under evaluation).However, in most cases, such information is not available. In Scarton and Specia (2014b),we propose a consensus approach, where several MT systems are considered as pseudo-references. The hypothesis is that if several MT systems share the same information, thisinformation is likely to be correct. Therefore, knowing the quality of the MT systems isnot a requirement. The approach employed in our pseudo-reference features follows thisconsensus approach.
Finally, we also explore word embeddings as features for our QE models. The assumptionis that word embeddings are able to capture cohesion information, derived from the semantic

4.1 Document-aware Features 65
information encoded by word embeddings. By aggregating the word vectors into a documentvector we expect to extract information about word choices and lexical consistency.
In Section 4.1, we present document-wide features, which include features with shallowlinguistic information such as type/token ratio, number of sentences, among others. Themajority of such features are adaptations of sentence-level features that have been provenuseful for QE at sentence level. All features of this kind are implemented in the QUEST++framework. Section 4.2 presents the discourse-aware features used in this thesis. Suchfeatures contains discourse information from all different levels of discourse processingdiscussed in Chapter 3 and are the main contribution of this thesis in terms of features.Section 4.3 presents the word embeddings features for document-level QE. Section 4.4presents pseudo-reference and consensus-based features. In Section 4.5, we present ananalysis of our discourse-aware features, correlating them with HTER. A comparison withbaseline shallow features is also described.
4.1 Document-aware Features
Document-aware features cover document information that does not involve discourse pro-cessing. Such information can be simple counts (e.g. number of sentences, number oftokens) or complex calculations at sentence level which are aggregated at document level(e.g. LM perplexity, probabilities from a syntactic parser). In this thesis we use a large set ofdocument-aware features that we implemented and made available in the QUEST++ toolkit.These features are adaptations of sentence-level features to document-level QE.
The widely used 17 baseline features for sentence-level QE were also adapted for doc-ument level. Such features were used in both editions of the WMT QE (2015 and 2016)shared tasks in document-level QE in order to build baseline QE models (Bojar et al., 2015,2016b). The 17 baseline features are:
1. number of tokens in the target document;
2. LM probability of target document;
3. type/token ratio (number of occurrences of the target word within the target hypothesis,averaged for all words in the hypothesis);
4. number of punctuation marks in target document;
5. number of tokens in the source document;

66 Document-level QE: Feature Engineering
6. average source token length;
7. LM probability of source document;
8. average number of translations per source word in the document (threshold: prob>0.2);
9. average number of translations per source word in the document (threshold: prob>0.01) weighted by the inverse frequency of each word in the source corpus;
10. percentage of unigrams in quartile 1 of frequency in a corpus of the source language;
11. percentage of unigrams in quartile 4 of frequency in a corpus of the source language;
12. percentage of bigrams in quartile 1 of frequency in a corpus of the source language;
13. percentage of bigrams in quartile 4 of frequency in a corpus of the source language;
14. percentage of trigrams in quartile 1 of frequency in a corpus of the source language;
15. percentage of trigrams in quartile 4 of frequency in a corpus of the source language;
16. percentage of unigrams in the source document seen in a corpus (SMT training corpus);
17. number of punctuation marks in source document.
These baseline features are aggregated by summing or averaging their values for theentire document. Features number 1, 4, 5 and 17 are summed, which is the same of extractingthem directly for the entire document. All other features were averaged. Some features, suchas Feature 1, could be directly extracted for the entire document, without needing to makesentence splits. However, since such features were already implemented into QUEST++ forsentence level, we made use of the existing implementation in order to keep the code modular.On the other hand, features like numbers 2 and 7 could not be implemented for the entiredocument. In the specific case of LM features, the values would be so small that would ledto underflow. Therefore, we kept the implementation of LM features at sentence level andaveraged the values for all sentences within the document.
Although averaging over sentence level scores is a simplistic approach, mainly becausesuch an averaged score could be biased by outliers, in practice the majority of the baselinefeatures extracted for our data do not show outliers. The only averaged features more sensitiveto outliers are 2, 7, 8 and 9, which are features that could not be extracted for the entiredocument for the reasons given in the previous paragraph.

4.2 Discourse-aware Features 67
The majority of the baseline features are complexity features. Features numbers 1, 2, 3and 4 are the only fluency features. Although there are no adequacy features in the baseline,the other features available in QUEST++ contains several adequacy features (e.g. absolutedifference between number tokens in source and target, normalised by source length).
An exhaustive list of document-aware features with their descriptions is given in AppendixA. Examples of these features are:
• Complexity features:
– average number of translations per source word in the document (threshold: prob>0.01/0.05/0.1/0.2/0.5);
– average word frequency: on average, the number of times each type (unigram) ina source document appears n times in the corpus (divided by frequency quartiles);
– LM perplexity of the source document (with and without end of sentence marker).
• Fluency features:
– percentage of content words in the source document;
– average of PCFG parse log likelihood of source sentence;
– LM perplexity of the target document (with and without end of sentence marker).
• Adequacy features:
– absolute difference between the number of tokens in the source document and thenumber of tokens in the target document, normalised by source document length;
– ratio of the number of nouns in the source document and the number of nouns inthe target document.
4.2 Discourse-aware Features
Discourse-aware features use discourse information from source and/or target documentsfor the task of QE. The intuition behind the use of such features comes from the fact thatdiscourse is a phenomena that happens beyond sentence level. Therefore, document-level QEmodels should also explore discourse information. In addition, traditional MT systems fail inproviding translations that take into account document-aware information, since documentsare translated sentence-by-sentence and, therefore, we expect issues of this type in the MT

68 Document-level QE: Feature Engineering
systems outputs. The main challenge in extracting discourse-aware features is to find reliablesources of discourse information. Although human annotated data would probably be thebest resource, it is not available for a large amount of data and it is domain dependant.
As it is done for other levels of QE, the way to overcome the lack of discourse-annotateddata that could be used for document-level QE was to use automatic tools. As mentionedin Chapter 3, discourse parsers and taggers have been made available over the years. As aconsequence, the features that we present in this section make use of different tools in orderto extract discourse-aware information. We present the features that we implemented bygrouping them considering the classification proposed by Stede (2011) which we described inChapter 3. It is worth noting that the majority of the discourse-aware features are complexityfeatures (with the exception of lexical cohesion, LSA and LDA). The reason for this isthat the resources and tools used are available only for English and they assume correctdocuments as input. Therefore, such features are extracted only when English is used as thesource language.
4.2.1 Large Units of Discourse and Topics
As discussed in Chapter 3, lexical cohesion and topic modelling are aspects of large units ofdiscourse and our features cover both.
Lexical Cohesion
As defined in Chapter 3, Lexical Cohesion (LC) is related to word repetition (reiteration) andcollocation. Regarding the evaluation of documents, this aspect of discourse was exploredas features for Readability Assessment (Graesser et al., 2004) and reference-based MTevaluation (Wong and Kit, 2012). Following this work, we propose the first set of featuresfor QE using LC.
These features are based in word repetition only, since repetitions are language indepen-dent and can be used for both source and target texts. Synonyms and other types of semanticrelations require resources like WordNet (Fellbaum, 1998) that are not available for mostlanguages. Besides that, the coverage of these kinds of resource vary across languages, and itcould influence the reliability of the features.
Therefore, our features are counts of word, lemma or noun repetitions across a document:
• Average word repetition: for each content word, we count its frequency in all sen-tences of the document. Then, we sum the repetition counts and divide it by the totalnumber of content words in the document (Equation 4.1, where wi is the ith word in a

4.2 Discourse-aware Features 69
document, N is the total number of content words in a document and f req is a functionthat outputs the frequency of wi in a document). This is computed for the source andtarget documents, resulting in two features: one for source and another for target.
∑Ni=1 f req(wi)
N(4.1)
• Average lemma repetition: the same as above, but the words are first lemmatised(two features).
• Average noun repetition: the same as word repetition, but only nouns are taken (twofeatures).
• Ratio: ratio of source and target word, lemma or noun repetition (three features).
A document that presents high scores for repetition is expected to have high lexicalcohesion (at least in terms of lexical cohesion). The features presented above are implementedinto the QUEST++ toolkit. The lemma and part-of-speech (POS) tags (needed to identifycontent words) were extracted by using the TreeTagger2 tool (Schmid, 1994).
Topic Modelling
For discourse information achieved via topic modelling, we propose two sets of features.The first one accounts to the internal cohesion of the documents by building a LSA matrixfor each document and considering the matrix of words × sentences. Features are extractedby measuring the similarity between the sentences (columns of the matrix). The second setof features is based on the work of polylingual LDA for QE at sentence level (Rubino et al.,2013). The features are divergence scores between the polylingual distribution of source andtarget documents.
LSA cohesion The LSA method (presented in Chapter 3) aims to capture the topic of textsbased on the words that these texts contain. It is a robust method where texts can be fulldocuments, paragraphs or sentences. The matrix X (Equation 3.1) is, then, built with words×documents, words× paragraphs, words× sentences, etc. In the case of words× sentence
(which we use in our experiments), each cell contains the frequency of a given word in agiven sentence.
2http://www.cis.uni-muenchen.de/~schmid/tools/TreeTagger/

70 Document-level QE: Feature Engineering
LSA was originally designed to be used with large corpora of multiple documents (topicmodelling). In our case, since we were interested in measuring coherence within documents,we computed LSA for each individual document through a matrix of words× sentences inthe document.
We computed LSA using a package for Python,3 which takes word stems and sentencesto build the matrix X . We modified a few things to make it more appropriate for our purposes.The main modification refers to the TF-IDF transformation. This transformation is madeto smooth the values of the high frequency words, in order to keep all words normalisedaccording to their frequency in a given corpus. However, in our case the salience of wordsin sentences was important and therefore this transformation was removed. The followingfeatures for QE are extracted as follows:
• LSA cohesion - adjacent sentences - Spearman correlation: for each sentencein a document, we compute the Spearman’s ρ correlation coefficient between itsword vector and the word vectors of its adjacent neighbours (sentences which appearimmediately before and after the given sentence). For sentences with two neighbours(most cases), we average the correlation values. After that, we average the values forall sentences in the document in order to have a single figure for the entire document.
• LSA cohesion - adjacent sentences - Cosine distance: the same as above, but apply-ing cosine distance instead of Spearman’s ρ correlation.
• LSA cohesion - all sentences - Spearman correlation: for each sentence in a doc-ument, we calculate the Spearman’s ρ correlation coefficient of the word vectorsbetween a given sentence and all the others. Again we average the values for allsentences in the document.
• LSA cohesion - all sentences - Cosine distance: the same as above, but applyingcosine distance instead of Spearman’s ρ correlation.
Higher correlation scores are expected to correspond to higher text cohesion, since thecorrelation among word vectors of sentences in a document is related to how closely relatedthe words appear in the document (Graesser et al., 2004). Example (xvi), therefore shouldpresent higher LSA scores than Example (xvii), because the sentences in the former arerelated to a single topic (a “pleasant day”), whilst the sentences in the latter do not refer tothe same topic.4
3https://github.com/josephwilk/semanticpy4Examples are extracted from Coh-Metrix Documentation: http://cohmetrix.com/.

4.2 Discourse-aware Features 71
(xvi) “The field was full of lush, green grass. The horses grazed peacefully. The youngchildren played with kites. The women occasionally looked up, but only occasionally.A warm summer breeze blew and everyone, for once, was almost happy.”
(xvii) ‘The field was full of lush, green grass. An elephant is a large animal. No-oneappreciates being lied to. What are we going to have for dinner tonight?”
As opposed to lexical cohesion features, LSA features are able to find correlations amongdifferent words, which are not repetitions and may not even be synonyms, but are still related(as given by co-occurrence patterns).
Polylingual LDA We adapt the work of Rubino et al. (2013) on polylingual LDA forsentence-level QE in order to use it for document-level QE. In Rubino et al. (2013), thepolylingual method consists in extracting aligned monolingual topic models. Therefore,source and target sentences are processed separately and are aligned afterwards.
In the case of document-level QE, instead of building a topic model for each sentence,we extract a topic model for each document. The topic models are extracted using MALLETtoolkit5 and the LDA features are computed inside QUEST++ toolkit. An intermediate script(developed by Rubino et al. (2013)) is used to make the topic models readable by QUEST++.In QUEST++, two features are computed:
• Kullback-Leibler (KL) divergence between a source document and a target documenttopic distribution;
• Jensen-Shannon (JS) divergence between a source document and a target documenttopic distribution.
Both KL and JS divergence scores are based on probabilistic uncertainty and do notrequire the probability distributions to be represented in Euclidean space (Rubino et al.,2013). Considering a vector si representing the topic model probability distribution of asource document, a vector ti representing the topic model probability distribution of a targetdocument and n being the number of dimensions of the topics,6 the KL divergence score isdefined by Equation 4.2.
KL(s, t) =n
∑i=1
si logsi
ti(4.2)
5http://mallet.cs.umass.edu6By default, QUEST++ considers 50-dimension vectors

72 Document-level QE: Feature Engineering
JS is a symmetric version of KL, calculated according to Equations 4.3.
JS(s, t) =12(
n
∑i=1
si log2si
si + ti+
n
∑i=1
ti log2ti
si + ti) (4.3)
The features extracted from the polylingual LDA are expected to be a good indicatorof adequacy at document level. They are able to capture whether or not source and targetaligned documents are similar in terms of the topics they address.
4.2.2 Coreference Resolution
Regarding coreference resolution (explained in Chapter 3), two main discourse processingapproaches are employed: anaphora resolution and local coherence models. Our featuresattempt to count anaphora only.7
Anaphora
We count the number of personal pronouns in a document and use this as a feature for QE.Pronominal anaphora are expected to be a problem for MT systems since they performtranslation disregarding document-aware information. If pronouns like they, he or it, forexample, appear in a document, one expects that there will be an antecedent that resolvesthem, which may or may not be done by the MT system. Moreover, when translating intomorphologically richer languages, pronouns like they and it should have an explicit gender(the same gender as the antecedent).
Therefore, the presence of pronouns can make the document more complex in MT. Thisfeature is thus related to text complexity and is expected to work better when applied in thesource side. It is worth mentioning that a more reliable approach would be to compare sourceand target pronouns (e.g. calculating the ratio between the number of pronouns in source andtarget documents). However, there is a lack of reliable tools for languages other than English.
In our implementation we used the output of Charniak’s parser for pronoun identification.Such parser was also used in the pre-processing step of the features presented in Section 4.2.3and, therefore, its results were also used for our pronoun feature. Pronouns were identifiedby looking at the tag “PRP” of the Charniak’s parser .8
7As explained in Chapter 3, local coherence models were studied in a joint work with Karin Sim Smith,although no improvement were found. Please refer to Scarton et al. (2016) for results.
8Since Charniak’s parser is only available for the English language, this feature can only be extracted forEnglish.

4.2 Discourse-aware Features 73
4.2.3 Small Units of Discourse
Discourse connectives, EDUs and RST relations are classified as small units of discourse.We propose several features that account for the three phenomena.
Discourse Connectives
Discourse connectives can be seen as the “glue” that ties sentences together in a logical way(as presented in Chapter 3). The simple presence of connectives can be already seen as a signof coherence in a document. Our features count the number of discourse connectives in adocument.
Connectives are identified by using the Discourse Connectives Tagger from Pitler andNenkova (2009).9,10 This tagger tags connectives in one of the four classes: Expansion,Contingency, Comparison and Temporal. Non-discourse connectives are also tagged asnon-discourse. The features extracted by this information are:
• Total number of connectives (including non-discourse connectives);
• Number of Expansion connectives;
• Number of Contingency connectives;
• Number of Comparison connectives;
• Number of Temporal connectives;
• Number of Non-discourse connectives.
As with the pronominal anaphora feature, these features can be seen as complexityfeatures. Discourse connectives can be ambiguous (such as “then”) which can make thetranslation process harder.
EDUs
As presented in Chapter 3, EDUs are the minimum units of text that assume some discourserole. For example, in RST, the discourse annotations are made at the EDUs level. In thefollowing example, we can see several clauses breaks marked by EDU_BREAK:
9The Charniak’s syntactic parser is used to pre-process the data.10In our implementation, these features can only be extracted for English language.

74 Document-level QE: Feature Engineering
(xviii) “However , EDU_BREAK despite the economic success , EDU_BREAK it hasbecome increasingly clear EDU_BREAK that Blair was over .”
EDU breaks are marked using the Discourse Segmenter module of the Discourse Parserdeveloped by Joty et al. (2013). This module uses the outputs of the Charniak’s parser andthe EDUBREAK module of the SPADE tool (Soricut and Marcu, 2003) in order to breaksentences into EDUs. Our feature counts the number of breaks in the entire document and itis a complexity feature. Documents with a high number of EDU breaks may be composed bycomplex structures that are harder to translate.11
RST
As explained in Chapter 3, RST is theory that associates small units (EDUs) accordingto discourse relations. Each small unit receives a discourse role and the document (orsentence) is represented as a discourse tree. An example of a RST ELABORATION relationis presented in Chapter 3 (Figure 3.1). Our features using RST information are:
• number of Nucleus relations;
• number of Satellite relations;
• height of the RST tree;
• number of subtrees in the RST tree.
RST relations are also extracted by using Joty’s parser.12 This parser is able to annotateRST trees at sentence and document levels. At document level, the trees go from the smallestunits (EDUs) to sentences and paragraphs, until they reach the full document. At sentencelevel, the trees model intra-sentence discourse relations.
Our features use the document-level tree from Joty’s parser and are complexity features.Our assumption is that a higher number of Nucleus and Satellite relations refer to the useof too many discourse units and, therefore, leads to a complex document. Moreover, if thenumber of subtrees and the height of the tree are also high, they can also be a sign of acomplex document.
11Given the language requirements of the tools used, our feature can only be used for English.12Given the requirements of Joty’s parser, these features are only implemented for the English language.
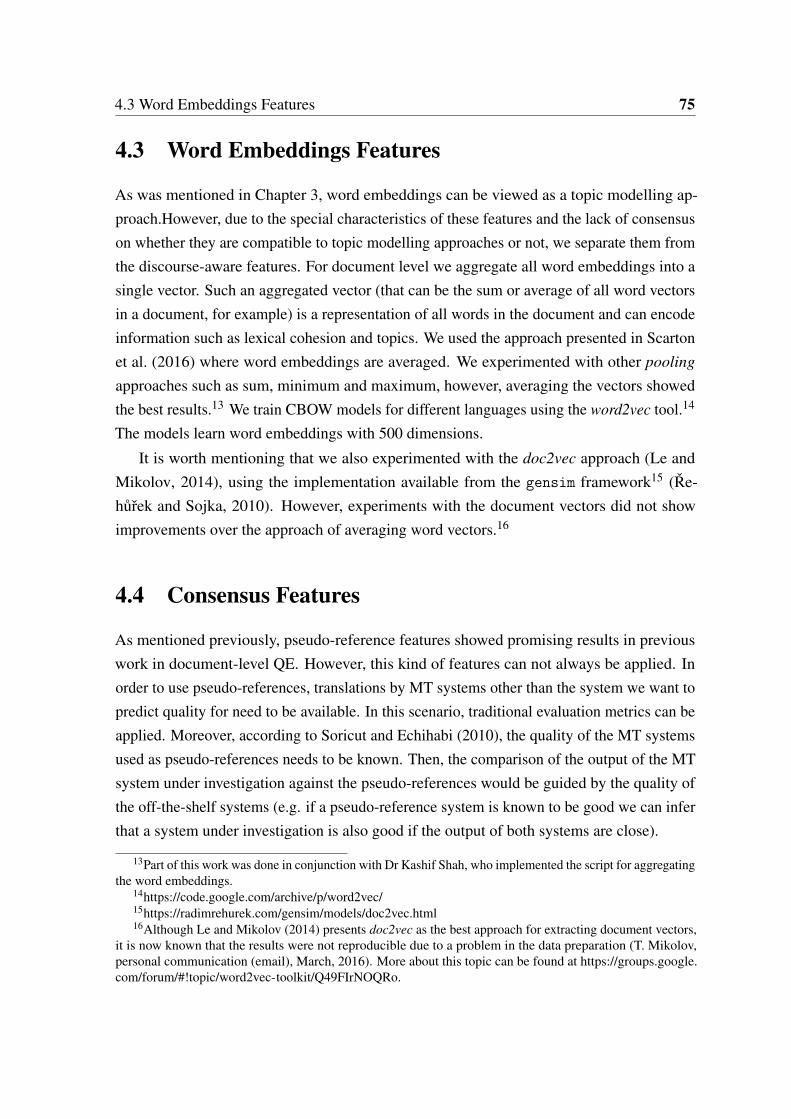
4.3 Word Embeddings Features 75
4.3 Word Embeddings Features
As was mentioned in Chapter 3, word embeddings can be viewed as a topic modelling ap-proach.However, due to the special characteristics of these features and the lack of consensuson whether they are compatible to topic modelling approaches or not, we separate them fromthe discourse-aware features. For document level we aggregate all word embeddings into asingle vector. Such an aggregated vector (that can be the sum or average of all word vectorsin a document, for example) is a representation of all words in the document and can encodeinformation such as lexical cohesion and topics. We used the approach presented in Scartonet al. (2016) where word embeddings are averaged. We experimented with other pooling
approaches such as sum, minimum and maximum, however, averaging the vectors showedthe best results.13 We train CBOW models for different languages using the word2vec tool.14
The models learn word embeddings with 500 dimensions.
It is worth mentioning that we also experimented with the doc2vec approach (Le andMikolov, 2014), using the implementation available from the gensim framework15 (Re-hurek and Sojka, 2010). However, experiments with the document vectors did not showimprovements over the approach of averaging word vectors.16
4.4 Consensus Features
As mentioned previously, pseudo-reference features showed promising results in previouswork in document-level QE. However, this kind of features can not always be applied. Inorder to use pseudo-references, translations by MT systems other than the system we want topredict quality for need to be available. In this scenario, traditional evaluation metrics can beapplied. Moreover, according to Soricut and Echihabi (2010), the quality of the MT systemsused as pseudo-references needs to be known. Then, the comparison of the output of the MTsystem under investigation against the pseudo-references would be guided by the quality ofthe off-the-shelf systems (e.g. if a pseudo-reference system is known to be good we can inferthat a system under investigation is also good if the output of both systems are close).
13Part of this work was done in conjunction with Dr Kashif Shah, who implemented the script for aggregatingthe word embeddings.
14https://code.google.com/archive/p/word2vec/15https://radimrehurek.com/gensim/models/doc2vec.html16Although Le and Mikolov (2014) presents doc2vec as the best approach for extracting document vectors,
it is now known that the results were not reproducible due to a problem in the data preparation (T. Mikolov,personal communication (email), March, 2016). More about this topic can be found at https://groups.google.com/forum/#!topic/word2vec-toolkit/Q49FIrNOQRo.

76 Document-level QE: Feature Engineering
In Scarton and Specia (2014b), we propose an approach where several MT systems areconsidered and BLEU, TER, METEOR and two extra syntactic metrics from Asiya toolkit17
Giménez and Màrquez (2010) are used as pseudo-reference metrics. The authors assumptionis that if several MT systems show the same translation, there is a higher chance that thistranslation is right. Therefore, the quality of the MT systems does not need to be known. Theautomatic metrics were calculated at sentence level and used as features for sentence-levelQE. Results in the 2014 WMT QE shared task were promising.
In this thesis we present results by using pseudo-references and in a consensus-basedapproach as used by Scarton and Specia (2014b). It is worth mentioning that this approachwas only applied when translations from different MT systems were available. Consensusfeatures can be viewed as a kind of fluency features, given that they compare the target withdifferent MT outputs in the target language, aiming to find a consensus between them.
4.5 Feature Analysis
In our work published in Scarton and Specia (2015), we performed an analysis of a represen-tative set of discourse-aware features by correlating them with HTER and comparing suchresults with the correlation of the 17 baseline features for document-level QE and HTER. Ourpurpose was to find whether or not discourse-aware features would be useful for predictingdocument-level quality. We report these experiments in this thesis since they show an usefulanalysis of our discourse features. In this study we also explored discourse features forEnglish as the target language. We did not keep this kind of feature because of the problemsencountered in pre-processing the data with NLP tools. Some translated structures needed tobe manually changed in order to apply the tools, which proved to be very time-consuming.Correcting translated structures is also not ideal for the QE task, since the evaluation of MTsystem outputs should not require humans correcting the translation. Therefore, we did notuse discourse features for the target language in the experiments presented in Chapters 5 and6.
We used two corpora with machine translations and post-editions: the LIG (Potet et al.,2012) and Trace corpora (Wisniewski et al., 2013). LIG contains 10,881 French-English(FR-EN) machine-translated sentences (and their post-editions) from several editions ofWMT translation shared tasks (news documents). The document boundaries were recoveredand the HTER was calculated at document level.18 119 documents were analysed. Trace
17http://nlp.lsi.upc.edu/asiya/18We are thankful to Karin Smith for generating the document mark-ups.
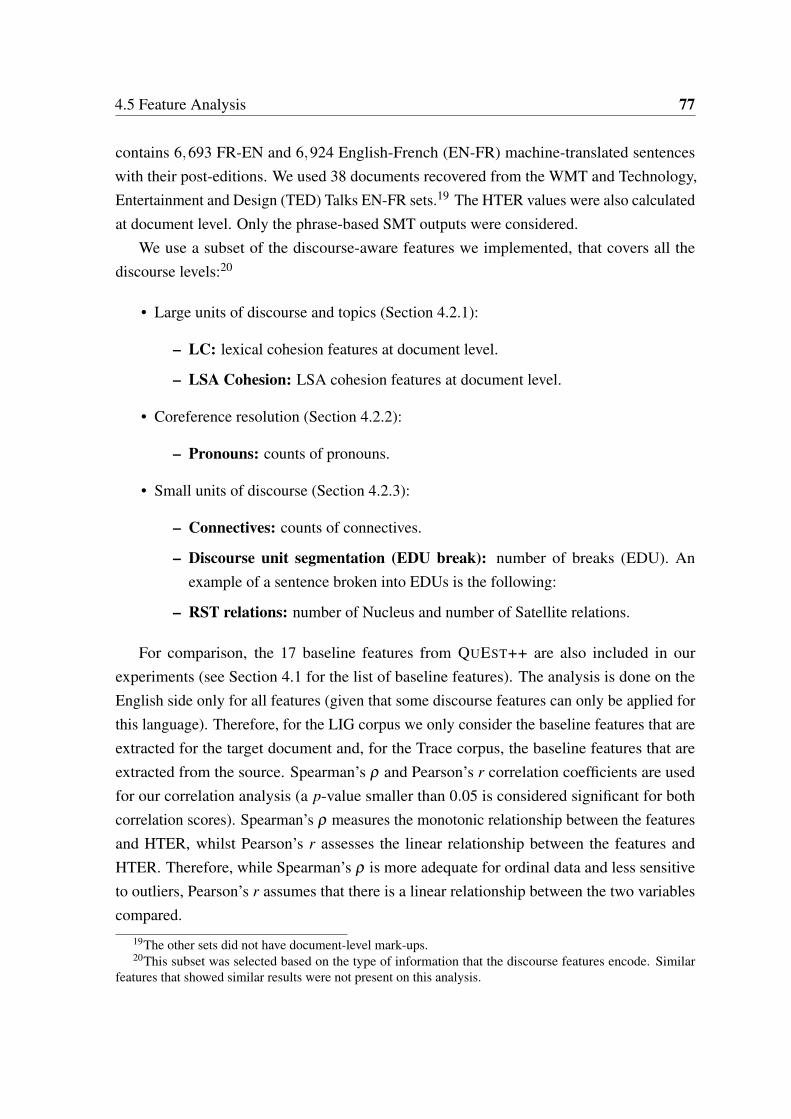
4.5 Feature Analysis 77
contains 6,693 FR-EN and 6,924 English-French (EN-FR) machine-translated sentenceswith their post-editions. We used 38 documents recovered from the WMT and Technology,Entertainment and Design (TED) Talks EN-FR sets.19 The HTER values were also calculatedat document level. Only the phrase-based SMT outputs were considered.
We use a subset of the discourse-aware features we implemented, that covers all thediscourse levels:20
• Large units of discourse and topics (Section 4.2.1):
– LC: lexical cohesion features at document level.
– LSA Cohesion: LSA cohesion features at document level.
• Coreference resolution (Section 4.2.2):
– Pronouns: counts of pronouns.
• Small units of discourse (Section 4.2.3):
– Connectives: counts of connectives.
– Discourse unit segmentation (EDU break): number of breaks (EDU). Anexample of a sentence broken into EDUs is the following:
– RST relations: number of Nucleus and number of Satellite relations.
For comparison, the 17 baseline features from QUEST++ are also included in ourexperiments (see Section 4.1 for the list of baseline features). The analysis is done on theEnglish side only for all features (given that some discourse features can only be applied forthis language). Therefore, for the LIG corpus we only consider the baseline features that areextracted for the target document and, for the Trace corpus, the baseline features that areextracted from the source. Spearman’s ρ and Pearson’s r correlation coefficients are usedfor our correlation analysis (a p-value smaller than 0.05 is considered significant for bothcorrelation scores). Spearman’s ρ measures the monotonic relationship between the featuresand HTER, whilst Pearson’s r assesses the linear relationship between the features andHTER. Therefore, while Spearman’s ρ is more adequate for ordinal data and less sensitiveto outliers, Pearson’s r assumes that there is a linear relationship between the two variablescompared.
19The other sets did not have document-level mark-ups.20This subset was selected based on the type of information that the discourse features encode. Similar
features that showed similar results were not present on this analysis.
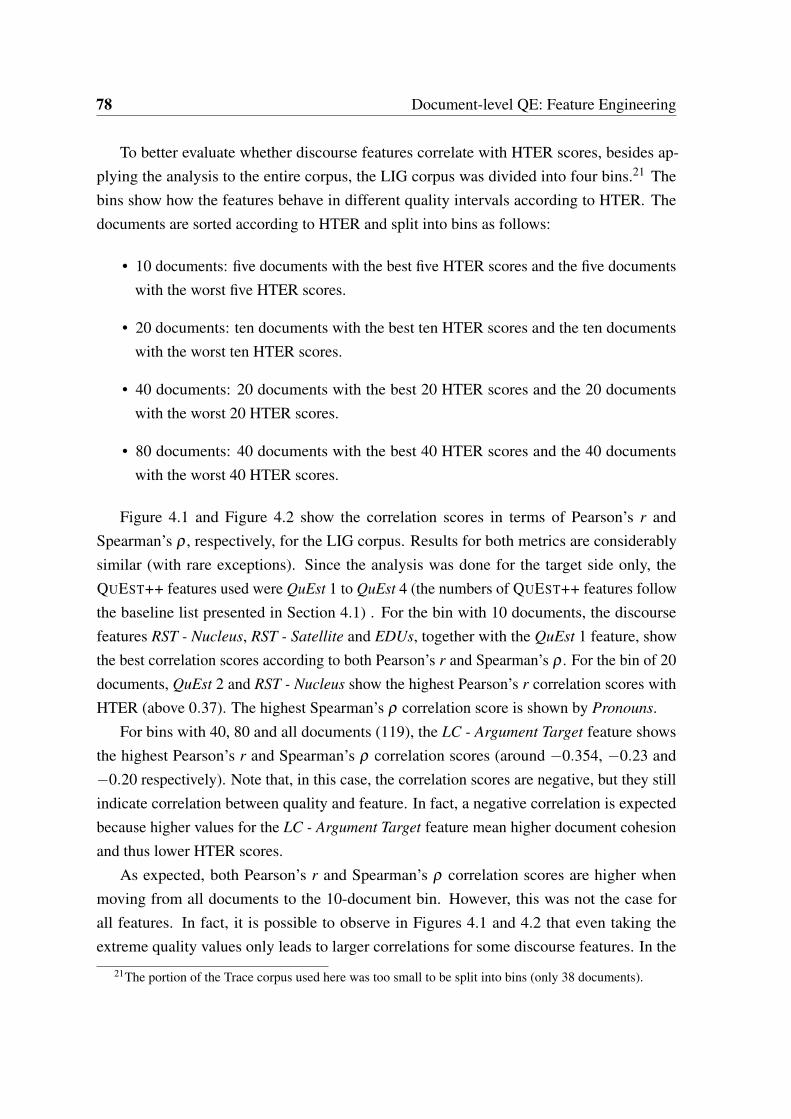
78 Document-level QE: Feature Engineering
To better evaluate whether discourse features correlate with HTER scores, besides ap-plying the analysis to the entire corpus, the LIG corpus was divided into four bins.21 Thebins show how the features behave in different quality intervals according to HTER. Thedocuments are sorted according to HTER and split into bins as follows:
• 10 documents: five documents with the best five HTER scores and the five documentswith the worst five HTER scores.
• 20 documents: ten documents with the best ten HTER scores and the ten documentswith the worst ten HTER scores.
• 40 documents: 20 documents with the best 20 HTER scores and the 20 documentswith the worst 20 HTER scores.
• 80 documents: 40 documents with the best 40 HTER scores and the 40 documentswith the worst 40 HTER scores.
Figure 4.1 and Figure 4.2 show the correlation scores in terms of Pearson’s r andSpearman’s ρ , respectively, for the LIG corpus. Results for both metrics are considerablysimilar (with rare exceptions). Since the analysis was done for the target side only, theQUEST++ features used were QuEst 1 to QuEst 4 (the numbers of QUEST++ features followthe baseline list presented in Section 4.1) . For the bin with 10 documents, the discoursefeatures RST - Nucleus, RST - Satellite and EDUs, together with the QuEst 1 feature, showthe best correlation scores according to both Pearson’s r and Spearman’s ρ . For the bin of 20documents, QuEst 2 and RST - Nucleus show the highest Pearson’s r correlation scores withHTER (above 0.37). The highest Spearman’s ρ correlation score is shown by Pronouns.
For bins with 40, 80 and all documents (119), the LC - Argument Target feature showsthe highest Pearson’s r and Spearman’s ρ correlation scores (around −0.354, −0.23 and−0.20 respectively). Note that, in this case, the correlation scores are negative, but they stillindicate correlation between quality and feature. In fact, a negative correlation is expectedbecause higher values for the LC - Argument Target feature mean higher document cohesionand thus lower HTER scores.
As expected, both Pearson’s r and Spearman’s ρ correlation scores are higher whenmoving from all documents to the 10-document bin. However, this was not the case forall features. In fact, it is possible to observe in Figures 4.1 and 4.2 that even taking theextreme quality values only leads to larger correlations for some discourse features. In the
21The portion of the Trace corpus used here was too small to be split into bins (only 38 documents).
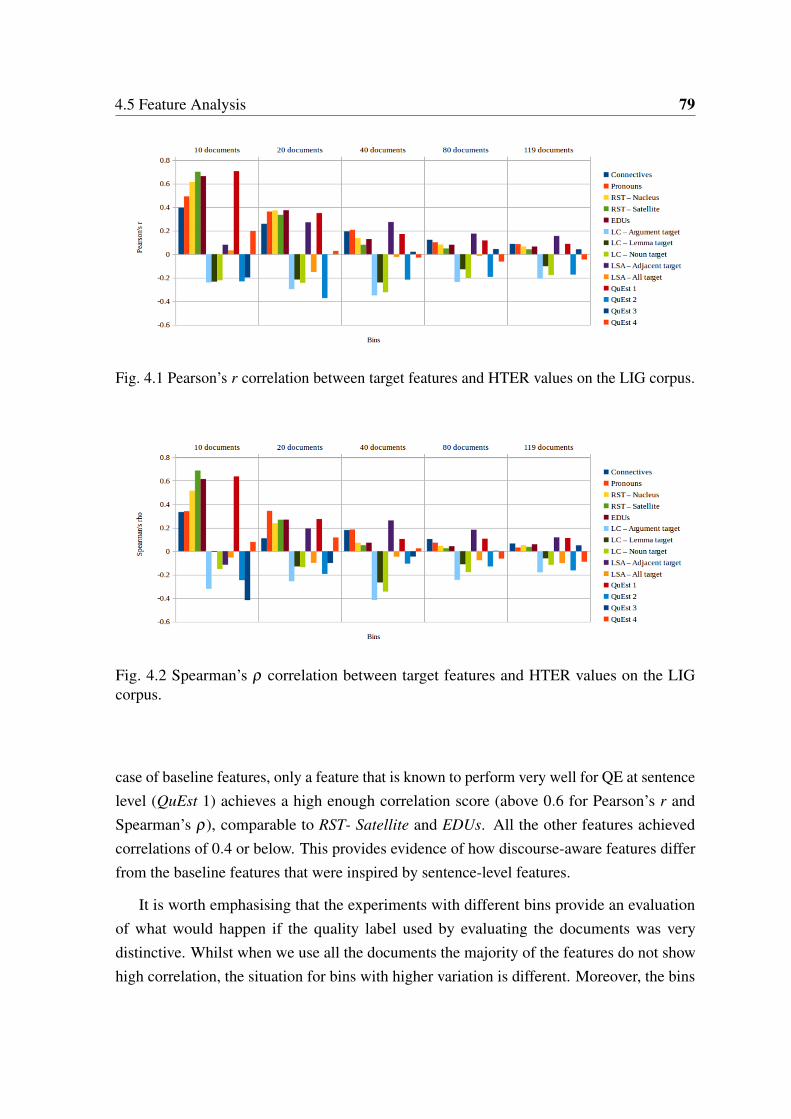
4.5 Feature Analysis 79
Fig. 4.1 Pearson’s r correlation between target features and HTER values on the LIG corpus.
Fig. 4.2 Spearman’s ρ correlation between target features and HTER values on the LIGcorpus.
case of baseline features, only a feature that is known to perform very well for QE at sentencelevel (QuEst 1) achieves a high enough correlation score (above 0.6 for Pearson’s r andSpearman’s ρ), comparable to RST- Satellite and EDUs. All the other features achievedcorrelations of 0.4 or below. This provides evidence of how discourse-aware features differfrom the baseline features that were inspired by sentence-level features.
It is worth emphasising that the experiments with different bins provide an evaluationof what would happen if the quality label used by evaluating the documents was verydistinctive. Whilst when we use all the documents the majority of the features do not showhigh correlation, the situation for bins with higher variation is different. Moreover, the bins

80 Document-level QE: Feature Engineering
also show the tails of the HTER distribution. Perhaps a system that aims to improve theprediction for outliers could benefit from such features.
Results for EN-FR documents from the Trace corpus (entire corpus, no bins) are shownin Figure 4.3 (Pearson’s r correlation) and Figure 4.4 (Spearman’s ρ correlation). Again,the results for both metrics are considerably similar (with some rare exceptions). In thiscase, the analysis was done in the source side only, and the QUEST++ features used wereQuEst 5 to QuEst 17. For the analysis of English as source, the best feature is QuEst 5 withcorrelation scores below −0.4 for Pearson’s r and below −0.5 for Spearman’s ρ , followedby LC - Argument source (with almost 0.4 points for both correlation metrics). However, alldiscourse features showed correlations of above 0.2 or below −0.2 (with both Pearson’s r
and Spearman’s ρ), higher than most QUEST++ features.
Fig. 4.3 Pearson’s r correlation between target features and HTER values on the Trace corpus.
In order to better understand some of the discourse phenomena and the reasons behindtheir correlation with HTER, we conducted an analysis with the following features: numberof pronouns, number of connectives and number of EDU breaks for the 10-document bin ofthe LIG corpus. Although these features do not correspond to all the best features identifiedin the previous section, they are the ones that are feasible to analyse manually or semi-automatically. The pronoun count achieved 0.34 points of Spearman’s ρ correlation and0.5 of Pearson’s r correlation, but the p-values were higher than 0.05. This means that thecorrelation could be by chance. Pronouns were therefore analysed manually. Example (xvi)shows a case of problems with pronouns found in the LIG corpus, where MT is the machinetranslation and Post-Editing (PE) its post-edited version. In this example, there is a changein the pronoun “it” in the MT output, corrected to “he” in the post-edition.

4.5 Feature Analysis 81
Fig. 4.4 Spearman’s ρ correlation between target features and HTER values on the Tracecorpus.
(xvi) MT: “Obviously, Gordon Brown wants to succeed Tony Blair as British prime minister.[...] Indeed, it has to renege on Blair’s legacy, which, at least means promise to leaveBritain for the Iraq war.”PE: “Obviously, Gordon Brown wants to succeed Tony Blair as British Prime Minister.[...] Indeed, he absolutely has to disavow Blair’s legacy, which at least means promisingto get Great Britain out of the Iraq war.”
Example (xvii) presents a case where the pronoun “it” is removed in the post-editedversion.
(xvii) MT: “It is the problem that it is the most urgent need to address: but for now, none ofthe main political parties has dared to touch it.”PE: “This is a problem that must be addressed immediately, but for now, none of themajor political parties has dared to touch it.”
Since the correlation between the number of pronouns against HTER was positive, thefive documents with the highest HTER were manually evaluated looking for pronouns thatwere corrected from the MT version to the PE version. Figure 4.5 shows the total number ofpronouns against the number of incorrect pronouns for the five documents. The number ofincorrect pronouns is quite small compared to the total number of pronouns (proportionally,23%, 10%, 16%, 33% and 34%, respectively in the five documents). This indicates that thehigh correlation showed between the number of pronouns and HTER was by chance in thiscorpus. However, it could also be an indication that the presence of pronouns led to sentences

82 Document-level QE: Feature Engineering
that were more complicated and therefore more difficult to translate correctly (even if thepronouns themselves were correctly translated).
Fig. 4.5 Total number of pronouns and number of incorrectly translated pronouns for the topfive documents in the LIG corpus.
Connectives were analysed in terms of numbers of connectives in the MT and PE versionsand also the number per class, considering the classification in Pitler and Nenkova (2009):Expansion, Contingency, Comparison, Temporal and non-discourse. As in the case ofpronouns, connectives showed a positive correlation with HTER (0.4 Pearson’s r and 0.33Spearman’s ρ) and the p-values were also higher than 0.05. Figure 4.6 shows the number ofconnectives in the top five documents. As we can see, there is a change in the distribution ofclasses of connectives from the MT version to the PE version, i.e. the number of connectivesin a given class changes from MT to PE. However, only document 4 showed significantchanges. Therefore, it appears that the correlation between the number of connectives andHTER is by chance in this corpus.
In the case of EDUs, the p-values for the Pearson’s r and Spearman’s ρ correlation scoresfor the 10-document bin were below 0.05, meaning that the correlation is not by chance.Moreover, there we observed a change from the number of EDUs in the MT to the numberof EDUs in the PE version. Therefore, we can infer that EDU breaks had an impact on thechanges made to correct the documents, and thus on the MT quality of such documents.

4.6 Discussion 83
Fig. 4.6 Number of connectives in the MT and PE versions of the top five documents in theLIG corpus.
To avoid the bias of the top five documents, an additional analysis was done with30 documents randomly selected from the 119 documents in the LIG corpus. We wereinterested in evaluating the impact of the same phenomena (number of pronouns, numberof connectives and number of EDU breaks), but in a more general scenario. Figure 4.7shows the percentage of incorrectly translated pronouns versus HTER figures. Although thedistribution of percentages of incorrectly translated pronouns is different from the HTERdistribution, the correlation between number of pronouns and HTER was quite high: 0.45 forPearson’s r (p-value = 0.01) and 0.31 for Spearman’s ρ (p-value = 0.1). Therefore, we canconclude that there is a positive correlation between HTER scores and number of pronounsin this sample, and that it is not by chance.
For number of connectives, the correlation found was also high and significant: Pearson’sr value of 0.52 (p-value = 0.0) and Spearman’s ρ value of 0.48 (p-value = 0.0). The samewas found for EDU breaks: the correlation found was 0.38 of Pearson’s r (p-value = 0.04)and 0.44 of Spearman’s ρ (p-value = 0.01). This means that the correlation between HTERvalues and number of EDU breaks is also not by chance.
4.6 Discussion
In this chapter we presented the different types of features used in our experiments withdocument-level QE. The document-aware features were an important extension for theQUEST++ tool (Section 4.1), although our main contribution was the proposal and develop-

84 Document-level QE: Feature Engineering
Fig. 4.7 HTER values versus percentage of incorrectly translated pronouns in a randomsample of 30 documents from the LIG corpus.
ment of discourse-aware features, some of which were also included in QUEST++ (Section4.2). Even though pseudo-reference features were also implemented, in the next chapters wefocus on using consensus features (Section 4.4). Despite the fact that pseudo-reference-basedfeatures are considered to be a state-of-the-art resource for document-level QE, they are notcompletely reliable. Firstly, they work under the assumption that the pseudo-references havehigh quality. Secondly, they are not applicable for real-world scenarios, where MT outputsother than the output being evaluated are scarce. Consensus features have the same drawbacksand, therefore, they should be avoided in real-world scenarios. All features presented in thischapter are used to built the QE models presented in Chapters 5 and 6.
Discourse features appear to correlate with HTER scores and this correlation is oftenhigher than the correlation presented by the basic, baseline QE features at document level(Section 4.5). Although HTER may not be the most reliable quality label for the task ofQE (as we discuss in the next chapter), the correlation of discourse-aware features withtask-based scores is promising. Therefore, we can conclude that discourse-aware featurescan be used as a source of information for QE at document level.
In the next chapter, we present our experiments with the features proposed in this chapterand using BLEU-style metrics as quality labels. We show results for three different datasetsthat include EN-PT, EN-DE, EN-ES, EN-FR, DE-EN, ES-EN and FR-EN language pairs.

Chapter 5
Document-level QE: Prediction
In this chapter we present and discuss document-level prediction using traditional MTautomatic evaluation metrics (e.g. BLEU) as quality labels.1 MT automatic evaluationmetrics (as discussed in Chapter 2) have been widely used given that they require much lesseffort than manual evaluation and provide robust evaluation when the task is to comparedifferent MT systems. For this reason, early work on document-level QE used such metricsas quality labels (Soricut and Echihabi, 2010; Scarton and Specia, 2014a). We extendsuch previous work and explore discourse information as features for document-level QE.Since BLEU-style metrics vary between 0 and 1 in a continuous scale, QE is addressed as aregression problem.
Section 5.1 describes the experimental settings common to all experiments performedin this chapter. Such settings include the feature sets used, the ML techniques used anda discussion about the evaluation metrics employed. Section 5.2 presents the document-level QE experiments with the FAPESP corpus, exploring single and multiple MT systems.BLEU, TER and METEOR are used as quality labels for the task. We consider two type ofexperiments: (i) with single systems, where all documents were translated by the same MTsystem and; (ii) with multiple MT systems explores the idea that documents are not translatedby the same MT system. In Section 5.3, experiments document-level QE with differentlanguages and mixed systems are presented. The data used is a selection of documentsfrom WMT data for EN-DE, EN-ES, EN-FR, DE-EN, ES-EN and FR-EN. BLEU, TER andMETEOR are also used as quality labels for the task. Section 5.4 presents our document-level QE experiments with the LIG corpus (FR-EN language pair) that also contains HTER
1Parts of this chapter have been previously published in peer-reviewed conferences: Scarton and Specia(2014a), Scarton et al. (2015), Scarton, Tan, and Specia (2015), Scarton and Specia (2016) and Scarton et al.(2016).

86 Document-level QE: Prediction
labels. Finally, Section 5.5 presents a discussion about the data distribution of the automaticevaluation metrics in all datasets.
5.1 Experimental Settings
Features
We conducted experiments using all the features described in Chapter 4 in all scenarios wherethey were available. As presented in Chapter 4, Most of the discourse-aware features areonly available for the English language and, given the limitation of resources and tools, wereonly applied for English as the source language. We avoid applying NLP tools to machinetranslated documents, given that such tools assume well-formed documents as inputs.
Features are divided in different groups, following the classification presented on Chapter4:
• QUEST++ baseline features (called hereafter QUEST-17): 17 QUEST++ baselinefeatures (the same baseline features used for the WMT document-level shared task(Bojar et al., 2015, 2016b));
• Document-aware features (called hereafter QUEST-ALL): all QUEST++ features,apart from LC and LDA features;
• Language independent discourse-aware features (called hereafter SHALLOW): lan-guage independent discourse features include LSA, LC and LDA features;
• Word embeddings (called hereafter WE): word embeddings features for source andtarget documents. Although we classify such features as discourse-aware, they werenot combined with SHALLOW features given their high dimensionality: they wouldprobably obfuscate the use of the other SHALLOW features;
• Language dependent discourse-aware features (called hereafter DEEP): languagedependent discourse features are pronouns, connectives and EDUs counts and RSTtree information;
• Consensus features (called hereafter CONSENSUS): BLEU, TER and METEOR areused as consensus features. For each dataset a different number of pseudo-referencesystems were available;
• All features (called hereafter ALL): a combination of all features.

5.1 Experimental Settings 87
Features are usually combined with the baseline features and cases where they are usedalone are specified defined and justified.
ML models
We use two ML methods to build the regression models for document-level QE. Bothmethods are at the state-of-the-art of sentence-level QE and our work on document-level QEfocuses on these methods.
SVM is a non-probabilistic model for supervised ML classification and regression. SVMis widely used in supervised ML problems, achieving good performance, particularly forapplications where the number of features is considerably higher than the number of instances(Rogers and Girolami, 2012). Non-linear models can be built by using robust kernels. Kernelstransform the data in order to make it classifiable by the linear model and, consequently,more easily modelled. We use the SVR algorithm available in the scikit-learn toolkitwith RBF kernel and hyper-parameters (C, γ and ε) optimised via grid search.
GP is a probabilistic non-parametric model for supervised ML. GP generalises the Gaus-sian probability distribution, by dealing with the properties of a function instead of takinginto account all the values the function outputs. Therefore, GP is a robust method andis computationally traceable (Rasmussen and Williams, 2006). This model has becomemore popular along the years among the NLP community. With GP models we also ex-plore kernel combinations of features of different types. Our hypothesis is that featuresextracted from very distinct resources or using different techniques may benefit from theuse of specific kernels for them. Therefore, we split features in three handcrafted (documentand discourse-aware features), word embeddings and pseudo-references. Each of these sets,when combined in a single model, are addressed in different kernels by the GP models. Weuse the GPy toolkit2 with RatQuad kernels and the optimisation of hyperparameters is doneby maximising the model likelihood on the full training data.3
Evaluation
In the majority of previous work considering QE as a regression task, Mean AbsoluteError (MAE) has been used as the evaluation metric (Callison-Burch et al., 2012; Bojar
2https://sheffieldml.github.io/GPy/3We also experimented with Matern32, RBF and Exponential for GP. In our experiments, RatQuad showed
consistently the best results.

88 Document-level QE: Prediction
et al., 2013, 2014, 2015). However, as Graham (2015) points out, MAE is not reliableto evaluate QE tasks, because it is highly sensitive to variance. This means that, if thepredictions of a given QE model show high variance, it will lead to a high MAE, even thoughthe distribution of the predictions follows the true labels distribution. Graham (2015) showsthat such problem is very salient in datasets for QE at sentence level, which could mean thatthey are also extended to document-level QE, given that the two tasks are addressed similarly.In order to solve the issue, Graham (2015) suggests the use of the Pearson’s r correlationcoefficient as a metric of QE system evaluation.
Therefore, in the experiments with QE as a regression problem, we use Pearson’s r asthe main evaluation metric. MAE is still used as secondary metric since information aboutthe variance of the data is also important. We believe that both metrics should be used inconjunction in order to reliably evaluate QE tasks.
Pearson’s r correlation coefficients varies between −1 and 1, where −1 is the maximumvalue of negative correlation, whilst 1 is the maximum value of positive correlation. There isno consensus on a threshold on the r coefficient that defines when a correlation should beconsidered weak, moderate or strong. For the purposes of our experiments we considered thethresholds in Table 5.1.4
r Correlation type−1.0 to −0.5 and 0.5 to 1.0 strong correlation−0.5 to −0.3 and 0.3 to 0.5 moderate correlation−0.3 to −0.1 and 0.1 to 0.3 weak correlation
−0.1 to 0.1 no correlationTable 5.1 Thresholds on Pearson’s r correlation coefficients used in our experiments.
Pearson’s r calculation also provide a p-value, indicating whether or not the correlationis statistically significant. We assume p-value < 0.05 indicates statistical significance (95%of confidence).
MAE is calculated using Equation 5.1 where H(si) is the predicted score, V (si) is thetrue score and N is the number of data points in the test set.
MAE =∑
ni=1 |H(si)−V (si)|
N(5.1)
Finally, when comparing two different systems, we apply Williams’s significance test(as discussed by Graham (2015)) with significant values having p-value < 0.05. Therefore
4Explorable.com (May 2, 2009). Statistical Correlation. Retrieved Jul 05, 2016 from Explorable.com:https://explorable.com/statistical-correlation.

5.2 Experiments with a Large Corpus: FAPESP Data 89
everytime that we compare two different QE systems and state that one system showedsignificant higher correlation than the other system, we will be referring to the use of thistest.
Baselines
Two baselines are used, depending on the evaluation metric set for a given experiment. Thefirst baseline (MEAN) uses the mean value of all labels in the training set as the predictedvalue of all test set instances. This is a strong baseline because of the tendency showed by thedocument-level data where all values are close to the mean value (see Section 5.5). However,MEAN cannot be used to evaluate Pearson’s r results, since its variance will always bezero. MEAN is then used to evaluate the documents in terms of performance gain or errorreduction. Equation 5.2 shows how we calculated this performance gain, where MAEmean isthe value of the MAE for the mean baseline and MAEprediction is the MAE of the QE modelunder investigation.
gain =MAEmean −MAEprediction
MAEmean∗100 (5.2)
Therefore, we use a random baseline (RANDOM) to compare the results of Pearson’s r
correlation coefficients. In this baseline, for each test set instance, a label from the trainingset is randomly selected to be the label of the test instance.
An alternative baseline could be the mean of sentence-level predictions. However, wecould not train sentence-level QE systems for all language pairs using a reliable quality label(such as HTER). Therefore, we decided not to include such a baseline.
5.2 Experiments with a Large Corpus: FAPESP Data
The first experiments aim at document-level QE focusing on building QE models for English(EN) into Brazilian Portuguese (BP) MT.5 Following (Soricut and Echihabi, 2010), weconsidered BLEU-style metrics as quality labels. Document-aware, discourse-aware andpseudo-references and are applied.
Corpus FAPESP contains 2,823 English-Brazilian Portuguese (EN-BP) documents ex-tracted from a scientific Brazilian news journal (FAPESP)6 (Aziz and Specia, 2011). Each
5This is an extension of our work in Scarton and Specia (2014a)6http://revistapesquisa.fapesp.br

90 Document-level QE: Prediction
article covers one particular scientific news topic. The corpus was randomly divided into60% (1,694 documents) for training a baseline MOSES7 statistical phrase-based MT system(Koehn et al., 2007) (with 20 documents as development set); and 40% (1,128 documents) fortesting the SMT system, which generated translations for QE training (60%: 677 documents)and test (40%: 451 documents). In addition, two external MT systems were used to translatethe test set: SYSTRAN8 – a rule-based system – and Google Translate ( GOOGLE)9 (thelatter is used as pseudo-reference for the other MT systems given that its overall BLEU scorewas better than that of the others).
Features In the experiments reported in this section we used the following feature sets:QUEST-17, QUEST-ALL, QUEST-17+SHALLOW, QUEST-ALL+SHALLOW, QUEST-17+WE, QUEST-17+PSEUDO and ALL. Although English is the source language, thedocuments of this corpus had several special tags and were considerably large, which madethe use of the discourse parser infeasible.
Quality labels The automatic metrics selected for quality labelling and prediction areBLEU, TER and METEOR. The Asiya toolkit was used to calculate all metrics.
Method Two sets of experiments were conducted. First (Section 5.2.1), we consider theoutputs of the FAPESP corpus of MOSES and SYSTRAN separately, using as trainingand test sets the output of each system individually, with GOOGLE translations as pseudo-reference for the other two systems. In this case, the quality of GOOGLE is known to bebetter than that of MOSES and SYSTRAN (for the purposes of this experiment, the GOOGLEpseudo-reference features - BLEU, TER and METEOR - are called PSEUDO). The secondset of experiments (Section 5.2.2) considers, for the FAPESP corpus, the combination of theoutput of all systems (MIXED), and we use the concept of consensus: for each system theother two are used as pseudo-references. SVR and GP are used to generate the QE models.
5.2.1 MT System-specific Models
The results for the prediction of BLEU, TER and METEOR for MOSES using SVR and GPmodels (in terms of Pearson’s r) are shown in Table 5.2, whilst results for SYSTRAN areshown in Table 5.3.
7http://www.statmt.org/moses/?n=moses.baseline8http://www.systransoft.com/9https://translate.google.co.uk

5.2 Experiments with a Large Corpus: FAPESP Data 91
The best results in terms of Pearson’s r correlation for MOSES and SYSTRAN wereobtained with pseudo-references and SVR models for all labels (BLEU, TER and METEOR).For MOSES, the use of QUEST-ALL features showed significant improvement over QUEST-17 in all cases, whilst for SYSTRAN only three cases showed improvements: SVR predictingTER and GP predicting TER and METEOR. For SYSTRAN, ALL feature set showedsignificant improvements over QUEST-17 when predicting TER and METEOR using GP,while for MOSES GP models with the ALL feature set showed significant improvements overQUEST-17. Although GP models used different kernels for the different types of features,the best result with pseudo-references were achieved with SVR. On the other hand, kernelcombination seems to help when using ALL features, since GP models built with one kernelfor representing QUEST-ALL+SHALLOW, one for WE and one for PSEUDO performsbetter than the SVR model with only one kernel. The use of SHALLOW and WE featuresdid not improve over QUEST-17 in both cases. The baseline results are considerably high inboth MOSES and SYSTRAN experiments and this may explain why the addition of morefeatures does not necessarily improve the results. Finally, all predicted values performedbetter than the RANDOM baseline.
BLEU TER METEORSVR GP SVR GP SVR GP
QUEST-17 0.690 0.688 0.625 0.607 0.667 0.666QUEST-ALL 0.725 0.717 0.687 0.657 0.714 0.699QUEST-17+SHALLOW 0.607 0.564 0.564 0.496 0.609 0.547QUEST-ALL+SHALLOW 0.684 0.662 0.640 0.602 0.677 0.649QUEST-17+WE 0.517 0.664 0.463 0.599 0.516 0.641QUEST-17+PSEUDO 0.857 0.848 0.806 0.786 0.846 0.832ALL 0.686 0.842 0.623 0.780 0.687 0.820RANDOM 0.004* 0.025* 0.013*
Table 5.2 Results for MOSES system in terms of Pearson’s r correlation. * indicates resultsthat did not show significant Pearson’s r correlation with p-value < 0.05. The best systemsare highlighted in bold (William’s significance test with p-value < 0.05).
In terms of performance gains (Equation 5.2), Figures 5.1 and 5.2 show the results forMOSES and SYSTRAN considering SVR and GP models and all feature sets combination.QE systems built with QUEST-17+PSEUDO showed the best performance gain varyingbetween 35% and 50%. The performance of PSEUDO features can be explained by thequality of the pseudo-reference employed. GOOGLE showed +0.09 BLEU points whencompared to MOSES and +0.18 BLEU points when compared to SYSTRAN. Therefore,GOOGLE is a more reliable system and the pseudo-reference-based features are competitive.
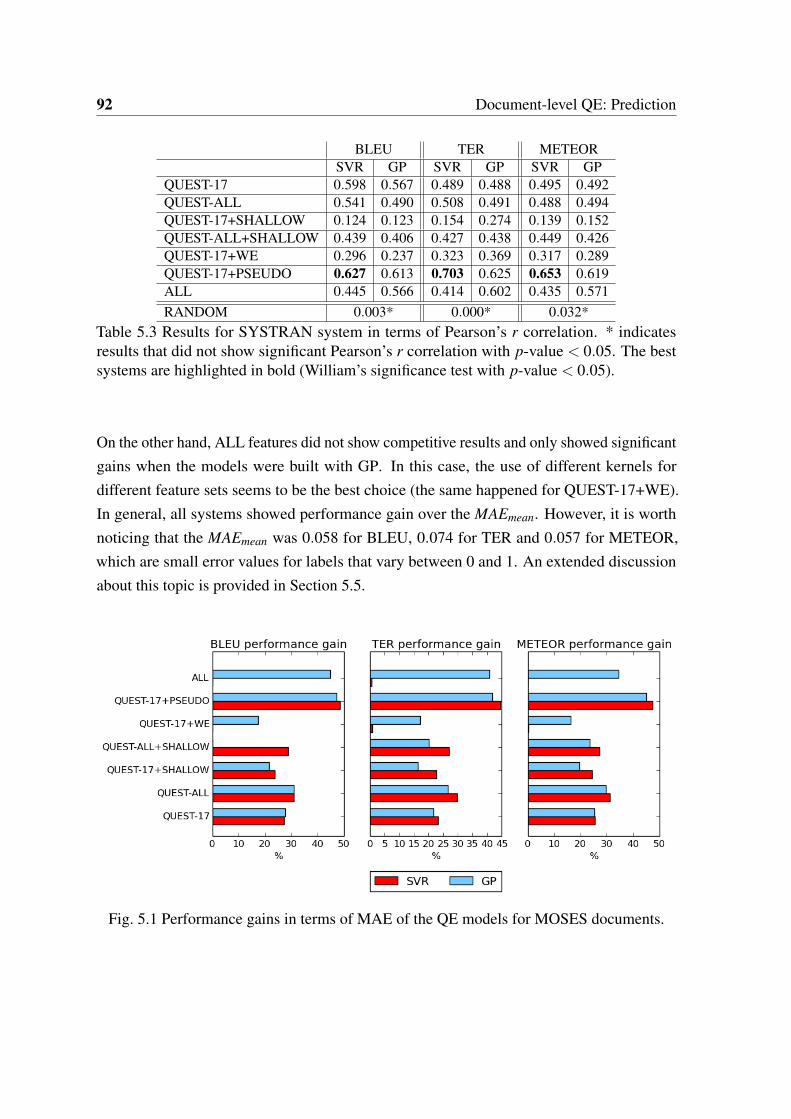
92 Document-level QE: Prediction
BLEU TER METEORSVR GP SVR GP SVR GP
QUEST-17 0.598 0.567 0.489 0.488 0.495 0.492QUEST-ALL 0.541 0.490 0.508 0.491 0.488 0.494QUEST-17+SHALLOW 0.124 0.123 0.154 0.274 0.139 0.152QUEST-ALL+SHALLOW 0.439 0.406 0.427 0.438 0.449 0.426QUEST-17+WE 0.296 0.237 0.323 0.369 0.317 0.289QUEST-17+PSEUDO 0.627 0.613 0.703 0.625 0.653 0.619ALL 0.445 0.566 0.414 0.602 0.435 0.571RANDOM 0.003* 0.000* 0.032*
Table 5.3 Results for SYSTRAN system in terms of Pearson’s r correlation. * indicatesresults that did not show significant Pearson’s r correlation with p-value < 0.05. The bestsystems are highlighted in bold (William’s significance test with p-value < 0.05).
On the other hand, ALL features did not show competitive results and only showed significantgains when the models were built with GP. In this case, the use of different kernels fordifferent feature sets seems to be the best choice (the same happened for QUEST-17+WE).In general, all systems showed performance gain over the MAEmean. However, it is worthnoticing that the MAEmean was 0.058 for BLEU, 0.074 for TER and 0.057 for METEOR,which are small error values for labels that vary between 0 and 1. An extended discussionabout this topic is provided in Section 5.5.
Fig. 5.1 Performance gains in terms of MAE of the QE models for MOSES documents.
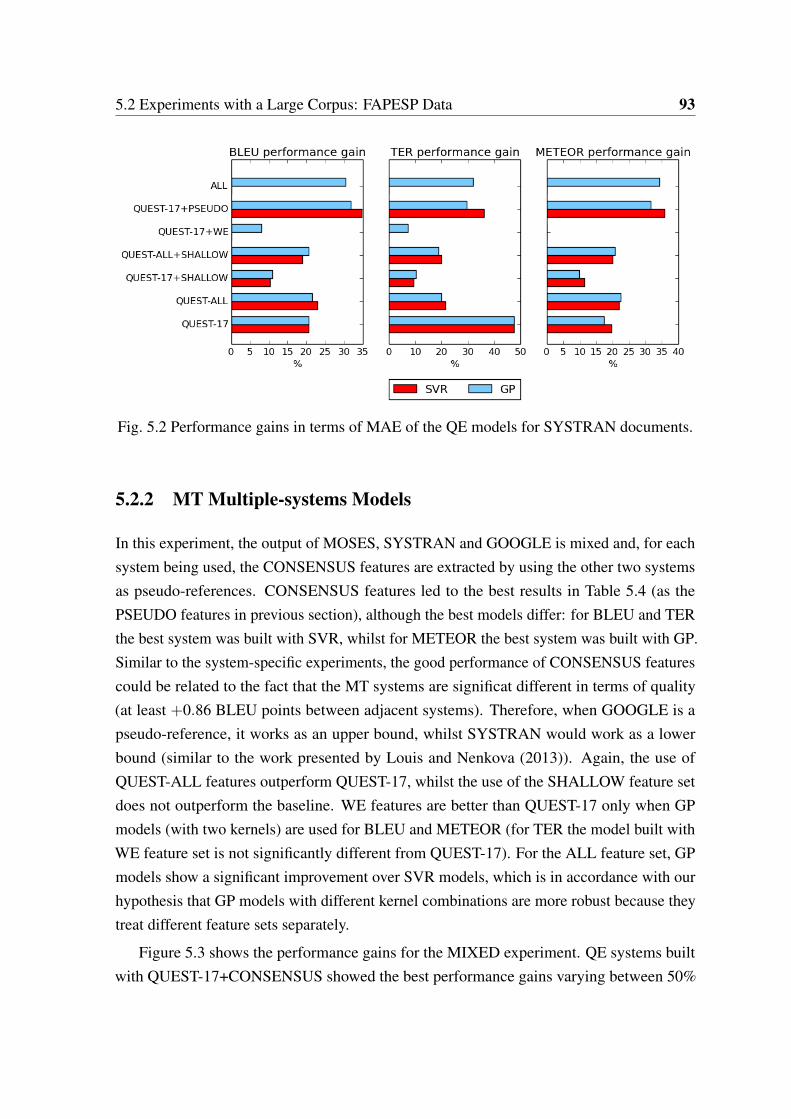
5.2 Experiments with a Large Corpus: FAPESP Data 93
Fig. 5.2 Performance gains in terms of MAE of the QE models for SYSTRAN documents.
5.2.2 MT Multiple-systems Models
In this experiment, the output of MOSES, SYSTRAN and GOOGLE is mixed and, for eachsystem being used, the CONSENSUS features are extracted by using the other two systemsas pseudo-references. CONSENSUS features led to the best results in Table 5.4 (as thePSEUDO features in previous section), although the best models differ: for BLEU and TERthe best system was built with SVR, whilst for METEOR the best system was built with GP.Similar to the system-specific experiments, the good performance of CONSENSUS featurescould be related to the fact that the MT systems are significat different in terms of quality(at least +0.86 BLEU points between adjacent systems). Therefore, when GOOGLE is apseudo-reference, it works as an upper bound, whilst SYSTRAN would work as a lowerbound (similar to the work presented by Louis and Nenkova (2013)). Again, the use ofQUEST-ALL features outperform QUEST-17, whilst the use of the SHALLOW feature setdoes not outperform the baseline. WE features are better than QUEST-17 only when GPmodels (with two kernels) are used for BLEU and METEOR (for TER the model built withWE feature set is not significantly different from QUEST-17). For the ALL feature set, GPmodels show a significant improvement over SVR models, which is in accordance with ourhypothesis that GP models with different kernel combinations are more robust because theytreat different feature sets separately.
Figure 5.3 shows the performance gains for the MIXED experiment. QE systems builtwith QUEST-17+CONSENSUS showed the best performance gains varying between 50%

94 Document-level QE: Prediction
BLEU TER METEORSVR GP SVR GP SVR GP
QUEST-17 0.565 0.621 0.559 0.566 0.565 0.598QUEST-ALL 0.620 0.660 0.598 0.594 0.623 0.661QUEST-17+SHALLOW 0.486 0.539 0.437 0.440 0.460 0.516QUEST-ALL+SHALLOW 0.572 0.599 0.546 0.484 0.577 0.538QUEST-17+WE 0.443 0.635 0.423 0.572 0.414 0.622QUEST-17+CONSENSUS 0.912 0.911 0.855 0.847 0.885 0.890ALL 0.678 0.903 0.614 0.835 0.661 0.882RANDOM 0.009* 0.100* 0.011*
Table 5.4 Results for MIXED in terms of Pearson’s r correlation. * indicates results thatdid not show significant Pearson’s r correlation with p-value < 0.05. The best systems arehighlighted in bold (William’s significance test with p-value < 0.05).
and 70% over the MAEmean baseline, agreeing with the results showed for Pearson’s r
correlation. ALL features also showed good results in terms of performance gains whenGP models were considered. Again, the use of different kernels for different feature setsappears to be important when dealing with different types of features (mainly WE, whereQUEST-17+WE only showed performance gains for models built with GP). In general, allsystems showed performance gains with respect to MAEmean.
Fig. 5.3 Performance gains in terms of MAE of the QE models for MIXED documents.

5.3 Experiments with Multiple Language Pairs: WMT Data 95
5.3 Experiments with Multiple Language Pairs: WMT Data
In this section we extend the work done for the FAPESP corpus to several languages. Thetranslations come from different MT systems and, therefore, the settings are comparable tothose in the MIXED scenario.
Corpus Our WMT corpus contains 474 news documents in six language pairs (EN-DE,EN-ES, EN-FR, DE-EN, ES-EN and FR-EN) from the WMT translation shared task corporafrom editions 2008 to 2013 (Callison-Burch et al., 2008, 2009, 2010, 2011, 2012; Bojaret al., 2013). The corpus was randomly divided into 70% (332 documents) and 30% (142documents) for training and testing of the QE models. For each source document in thecollections, a translation from the set of participating MT systems was randomly selected.Therefore, documents have translations from different MT systems. The participating MTsystems for the translation shared task include SMT, Rule-based MT (RBMT) and hybridsystems (Table 5.5 shows the overall performance of the participating systems per year - interms of BLEU).
MIN MAX MEANEN-DE 0.10 0.21 0.15EN-ES 0.15 0.34 0.26EN-FR 0.13 0.32 0.24DE-EN 0.07 0.30 0.20ES-EN 0.16 0.35 0.27FR-EN 0.14 0.33 0.26
Table 5.5 Overall performance, in terms of BLEU, of MT systems submitted to WMT sharedtasks from EN into DE, ES and FR and from these languages into EN (values are calculatedover all systems submitted for the WMT editions between 2008 and 2013).
Features In the experiments reported in this section we use the following feature sets:QUEST-17, QUEST-ALL, QUEST-17+SHALLOW, QUEST-ALL+SHALLOW, QUEST-17+WE, QUEST-17+CONSENSUS and ALL for all language pairs. CONSENSUS featuresare extracted using, for each translation from a given MT system, the other systems aspseudo-references. For translations from English, QUEST-17+DEEP is also explored.
Quality labels The automatic metrics selected for quality labelling and prediction areBLEU, TER and METEOR. The Asiya toolkit was used to calculate these metrics.

96 Document-level QE: Prediction
Method SVR and GP are used to generate the QE models.
EN-DE Differently from the FAPESP corpus, the majority of the QE models built did notshow significant correlation against the true labels. In fact, only models with QUEST-17+WE,QUEST-17+CONSENSUS and ALL show significant correlation scores. In the WE case,all results show strong correlation (Pearson’s r > 0.5), while in the CONSENSUS case, tworesults show strong correlation, three show moderate correlation (Pearson’s 0.3 < r < 0.5)and one shows weak correlation (Pearson’s 0.1 < r < 0.3). ALL feature set shows strongcorrelation scores for all models and, when using GP with different kernels for different typesof features, they achieve the best correlation scores. In all cases using more than one kernel forGP (QUEST-17+WE, QUEST-17+CONSENSUS, ALL), GP models outperforms their SVRcounterparts (the only exception are the models predicting METEOR with QUEST-17+WEfeature set).
BLEU TER METEORSVR GP SVR GP SVR GP
QUEST-17 0.191* 0.162* 0.047* 0.105* 0.024* 0.076*QUEST-ALL 0.074* 0.010* 0.115* 0.006* 0.006* 0.048*QUEST-17+SHALLOW 0.052* 0.005* 0.069* 0.061* 0.000* 0.064*QUEST-ALL+SHALLOW 0.072* 0.014* 0.021* 0.018* 0.046* 0.027*QUEST-17+DEEP 0.015* 0.024* 0.018* 0.034* 0.005* 0.020*QUEST-ALL+DEEP 0.030* 0.021* 0.010* 0.042* 0.025* 0.060*QUEST-ALL+SHALLOW+DEEP 0.051* 0.010* 0.003* 0.028* 0.016* 0.027*QUEST-17+WE 0.512 0.526 0.519 0.522 0.725 0.622QUEST-17+CONSENSUS 0.389 0.531 0.324 0.446 0.256 0.728ALL 0.534 0.666 0.531 0.614 0.730 0.795RANDOM 0.263 0.155* 0.034*
Table 5.6 Results for WMT EN-DE in terms of Pearson’s r correlation. * indicates resultsthat did not show significant Pearson’s r correlation with p-value < 0.05. The best systemsare highlighted in bold (William’s significance test with p-value < 0.05).
Regarding performance gains, Figure 5.4 shows that the best models showed improve-ments between 25% and 30% (being the best results achieved with ALL features and GPmodels for all labels). Discourse features (both SHALLOW and DEEP) show no improve-ments or only marginal improvements. It is worth mentioning that the MT systems for thislanguage pair showed very low performance (in average, 0.15 of BLEU - Table 5.5), whichmay impact the peformance of the QE systems (a more detailed analysis over the data isprovided in Section 5.5).

5.3 Experiments with Multiple Language Pairs: WMT Data 97
Fig. 5.4 Performance gains in terms of MAE of the QE models for WMT EN-DE documents.
EN-ES In contrast to EN-DE, Table 5.7 shows that all systems achieved significant Pear-son’s r correlations scores (apart from RANDOM). However, results for QUEST-17, QUEST-ALL, QUEST-17+SHALLOW, QUEST-ALL+SHALLOW, and QUEST-17+DEEP showweak correlation scores (Pearson’s r < 0.3). The only exception is QUEST-ALL with aGP model predicting METEOR that shows 0.337 of Pearson’s r correlation (a moderatecorrelation). The highest Pearson’s r scores are obtained by the models built with QUEST-17+WE (with GP) and ALL (with both GP and SVR) feature sets for all metrics (according toWilliam’s test these systems do not show significant difference). For the WE feature set, themodels with GP and two kernels outperformed the versions with SVR and one kernel. Thesame did not happened for CONSENSUS features, where the GP models did not outperformthe SVR models (in fact, there is no significant differences between GP and SVR models inthis case).
For EN-ES (Figure 5.5), the best results for performance gains were below 25% (the bestsystems being the ones with WE features and the GP model). Systems built with SHALLOWand DEEP features showed marginal performance gains, below 10%. The MT systemssubmitted show one of the highest averaged performances (0.26 averaged BLEU - Table 5.5).However, in terms of performance gain, the values are not far from the EN-DE case wherethe MT systems showed much lower performance.
EN-FR Similarly to EN-DE, the QUEST-17, QUEST-ALL, QUEST-17+SHALLOW,QUEST-ALL+SHALLOW, and QUEST-17+DEEP results did not show significant Pearson’s

98 Document-level QE: Prediction
BLEU TER METEORSVR GP SVR GP SVR GP
QUEST-17 0.204 0.181 0.258 0.226 0.240 0.206QUEST-ALL 0.212 0.290 0.275 0.380 0.243 0.337QUEST-17+SHALLOW 0.245 0.187 0.258 0.244 0.268 0.212QUEST-ALL+SHALLOW 0.161 0.270 0.105 0.102 0.207 0.319QUEST-17+DEEP 0.201 0.218 0.265 0.229 0.252 0.238QUEST-ALL+DEEP 0.238 0.286 0.282 0.377 0.263 0.334QUEST-ALL+SHALLOW+DEEP 0.202 0.274 0.239 0.362 0.236 0.326QUEST-17+WE 0.495 0.511 0.528 0.551 0.549 0.559QUEST-17+CONSENSUS 0.316 0.296 0.340 0.341 0.272 0.260ALL 0.508 0.509 0.532 0.555 0.552 0.558RANDOM 0.090* 0.019* 0.043*
Table 5.7 Results for WMT EN-ES in terms of Pearson’s r correlation. * indicates resultsthat did not show significant Pearson’s r correlation with p-value < 0.05. The best systemsare highlighted in bold (William’s significance test with p-value < 0.05).
Fig. 5.5 Performance gains in terms of MAE of the QE models for WMT EN-ES documents.
r correlation against true labels (Table 5.8). The highest correlation scores for this languagepair were found by using ALL features, with strong significant correlation for SVR models.WE and CONSENSUS combined with QUEST-17 also achieved strong correlation scoresfor some cases. Differently from EN-DE, the use of multiple kernels in the GP models didnot outperform the SVR versions with a single kernel.
Figure 5.6 shows the performance gains for the models predicting BLEU, TER andMETEOR for EN-FR language pair. The best gains, achieved by ALL features models, arebelow 18%. Discourse-aware features did not achieve significant improvements (all below

5.3 Experiments with Multiple Language Pairs: WMT Data 99
BLEU TER METEORSVR GP SVR GP SVR GP
QUEST-17 0.084* 0.012* 0.094* 0.037∗ 0.135* 0.098*QUEST-ALL 0.009* 0.040* 0.066* 0.024* 0.003* 0.023*QUEST-17+SHALLOW 0.048* 0.037* 0.061* 0.075* 0.108* 0.095*QUEST-ALL+SHALLOW 0.008* 0.034* 0.046* 0.000* 0.021* 0.015*QUEST-17+DEEP 0.111* 0.028* 0.055* 0.091* 0.074* 0.079*QUEST-ALL+DEEP 0.008* 0.034* 0.046* 0.000* 0.021* 0.015*QUEST-ALL+SHALLOW+DEEP 0.039* 0.016* 0.075* 0.035* 0.006* 0.016*QUEST-17+WE 0.507 0.451 0.495 0.480 0.627 0.594QUEST-17+CONSENSUS 0.431 0.269 0.352 0.283 0.541 0.458ALL 0.531 0.430 0.526 0.475 0.651 0.585RANDOM 0.091* 0.031* 0.117*
Table 5.8 Results for WMT EN-FR in terms of Pearson’s r correlation. * indicates resultsthat did not show significant Pearson’s r correlation with p-value < 0.05. The best systemsare highlighted in bold (William’s significance test with p-value < 0.05).
2% of gains). Although the MT systems for this language pair showed high performance(0.24 of averaged BLEU - Table 5.5), results for both performance gain and Pearson’s r
correlation are not better than for EN-DE.
Fig. 5.6 Performance gains in terms of MAE of the QE models for WMT EN-FR documents.
DE-EN Table 5.9 shows that a significant Pearson’s r correlation was found for all modelsin this language pair. The highest correlation scores were achieved by the model with theALL feature set and SVR for BLEU, the ALL feature set and both ML models for TER and

100 Document-level QE: Prediction
the ALL and QUEST-17+WE feature sets with SVR for METEOR. For BLEU and TERthe best results feature a strong correlation, whilst for METEOR the correlation is moderate.The use of different kernels in the GP models did not offer consistent improvements over theSVR models.
BLEU TER METEORSVR GP SVR GP SVR GP
QUEST-17 0.224 0.252 0.221 0.259 0.206 0.237QUEST-ALL 0.250 0.285 0.354 0.397 0.307 0.313QUEST-17+SHALLOW 0.328 0.372 0.224 0.293 0.289 0.367QUEST-ALL+SHALLOW 0.280 0.331 0.376 0.392 0.352 0.323QUEST-17+WE 0.483 0.473 0.563 0.553 0.462 0.483QUEST-17+CONSENSUS 0.257 0.259 0.385 0.438 0.277 0.185ALL 0.508 0.446 0.624 0.630 0.491 0.360RANDOM 0.022 0.033* 0.142*
Table 5.9 Results for WMT DE-EN in terms of Pearson’s r correlation. * indicates resultsthat did not show significant Pearson’s r correlation with p-value < 0.05. The best systemsare highlighted in bold (William’s significance test with p-value < 0.05).
Figure 5.7 shows the results in terms of performance gains for DE-EN. The best gainswere lower than 20% for BLEU and METEOR and lower 30% for TER and were achieved bymodels built with the ALL feature set and SVR. The overall quality of DE-EN MT systemswas low (0.20 of averaged BLEU - Table 5.5) when compared to other language pairs. It isimportant noticing that, for this language pair, the best systems in terms of performance gainare built with different ML models for different labels (for BLEU and TER, the best modelwas built with GP, whilst for METEOR the best model was built with SVR).
ES-EN Apart from the two systems using the baseline features along with SVR models forpredicting BLEU and TER, all other cases led to significant Pearson’s r correlation scores(Table 5.10). The highest correlation scores were achieved with the use of ALL feature set,with no significant difference between GP and SVR models. For ALL feature set models,correlation scores for BLEU and METEOR are moderate, whilst correlation scores for TERare strong. The use of different kernels in the GP models for QUEST-17+CONSENSUSshows improvements over the SVR models only when predicting TER and METEOR. Nosignificant improvements were shown by GP models over SVR models with the QUEST+WEfeature set.
Regarding performance gains, Figure 5.8 shows that the best gains (for models built withALL features) have performance gains of up to 16% for all automatic metrics. Discourse
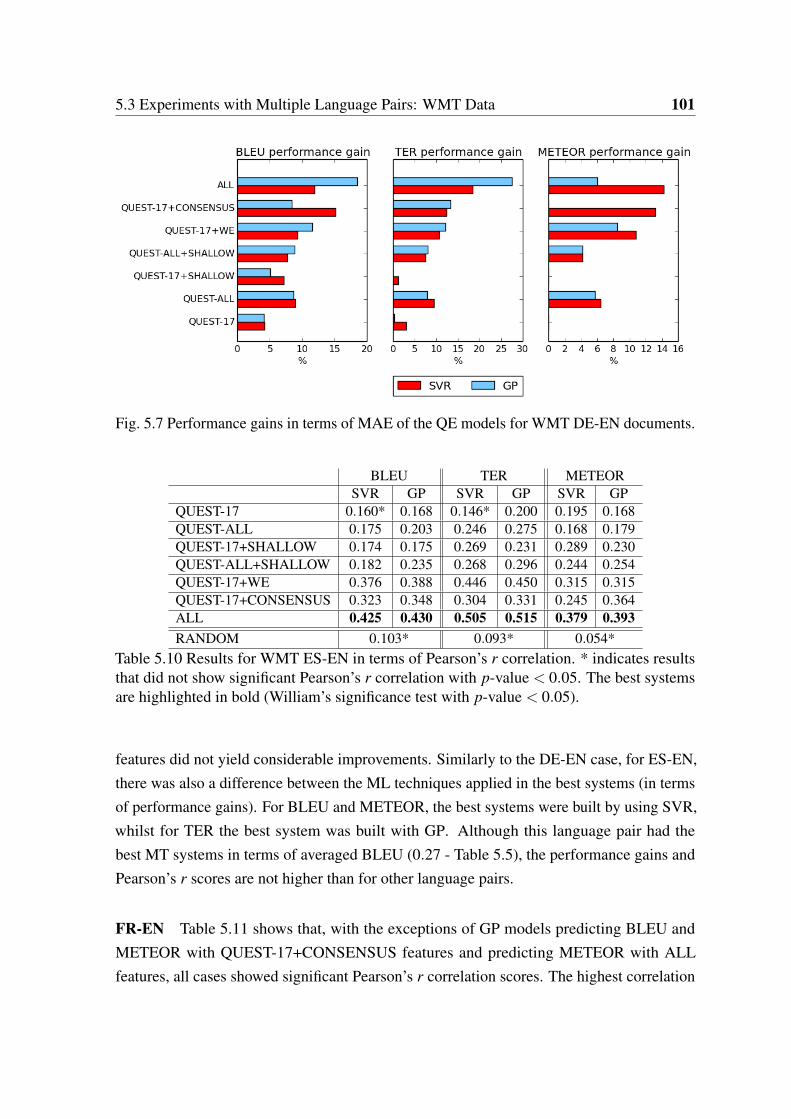
5.3 Experiments with Multiple Language Pairs: WMT Data 101
Fig. 5.7 Performance gains in terms of MAE of the QE models for WMT DE-EN documents.
BLEU TER METEORSVR GP SVR GP SVR GP
QUEST-17 0.160* 0.168 0.146* 0.200 0.195 0.168QUEST-ALL 0.175 0.203 0.246 0.275 0.168 0.179QUEST-17+SHALLOW 0.174 0.175 0.269 0.231 0.289 0.230QUEST-ALL+SHALLOW 0.182 0.235 0.268 0.296 0.244 0.254QUEST-17+WE 0.376 0.388 0.446 0.450 0.315 0.315QUEST-17+CONSENSUS 0.323 0.348 0.304 0.331 0.245 0.364ALL 0.425 0.430 0.505 0.515 0.379 0.393RANDOM 0.103* 0.093* 0.054*
Table 5.10 Results for WMT ES-EN in terms of Pearson’s r correlation. * indicates resultsthat did not show significant Pearson’s r correlation with p-value < 0.05. The best systemsare highlighted in bold (William’s significance test with p-value < 0.05).
features did not yield considerable improvements. Similarly to the DE-EN case, for ES-EN,there was also a difference between the ML techniques applied in the best systems (in termsof performance gains). For BLEU and METEOR, the best systems were built by using SVR,whilst for TER the best system was built with GP. Although this language pair had thebest MT systems in terms of averaged BLEU (0.27 - Table 5.5), the performance gains andPearson’s r scores are not higher than for other language pairs.
FR-EN Table 5.11 shows that, with the exceptions of GP models predicting BLEU andMETEOR with QUEST-17+CONSENSUS features and predicting METEOR with ALLfeatures, all cases showed significant Pearson’s r correlation scores. The highest correlation
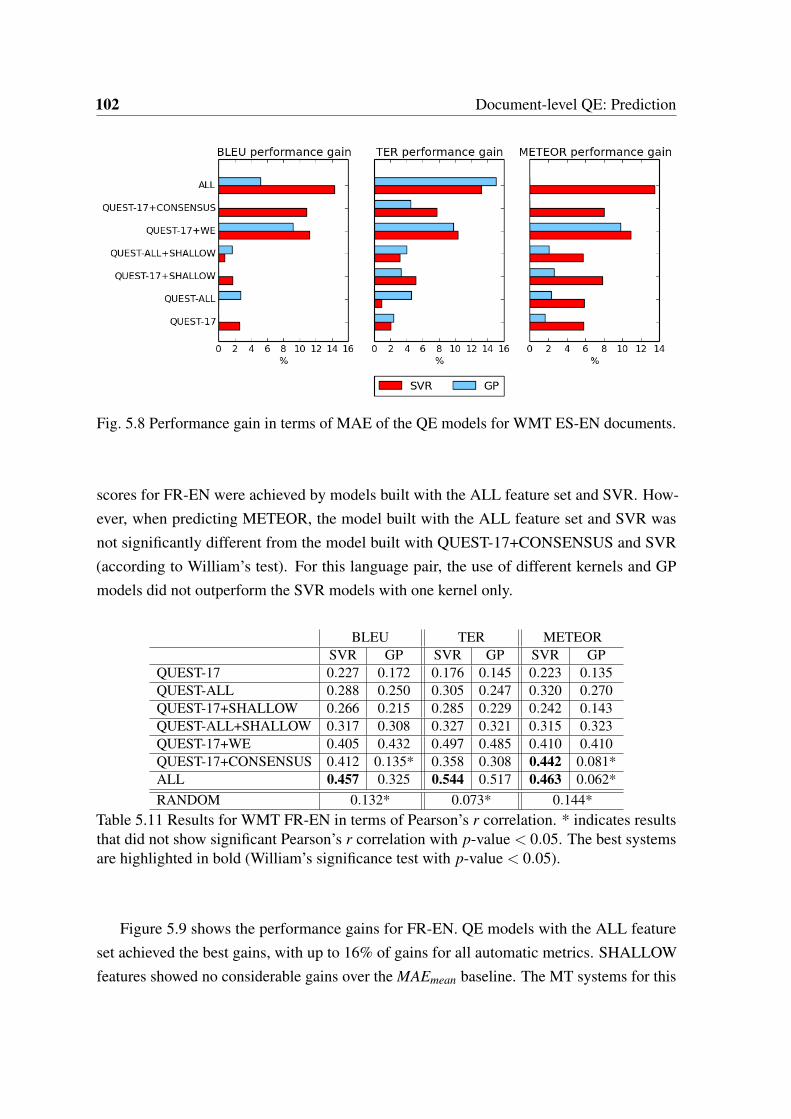
102 Document-level QE: Prediction
Fig. 5.8 Performance gain in terms of MAE of the QE models for WMT ES-EN documents.
scores for FR-EN were achieved by models built with the ALL feature set and SVR. How-ever, when predicting METEOR, the model built with the ALL feature set and SVR wasnot significantly different from the model built with QUEST-17+CONSENSUS and SVR(according to William’s test). For this language pair, the use of different kernels and GPmodels did not outperform the SVR models with one kernel only.
BLEU TER METEORSVR GP SVR GP SVR GP
QUEST-17 0.227 0.172 0.176 0.145 0.223 0.135QUEST-ALL 0.288 0.250 0.305 0.247 0.320 0.270QUEST-17+SHALLOW 0.266 0.215 0.285 0.229 0.242 0.143QUEST-ALL+SHALLOW 0.317 0.308 0.327 0.321 0.315 0.323QUEST-17+WE 0.405 0.432 0.497 0.485 0.410 0.410QUEST-17+CONSENSUS 0.412 0.135* 0.358 0.308 0.442 0.081*ALL 0.457 0.325 0.544 0.517 0.463 0.062*RANDOM 0.132* 0.073* 0.144*
Table 5.11 Results for WMT FR-EN in terms of Pearson’s r correlation. * indicates resultsthat did not show significant Pearson’s r correlation with p-value < 0.05. The best systemsare highlighted in bold (William’s significance test with p-value < 0.05).
Figure 5.9 shows the performance gains for FR-EN. QE models with the ALL featureset achieved the best gains, with up to 16% of gains for all automatic metrics. SHALLOWfeatures showed no considerable gains over the MAEmean baseline. The MT systems for this

5.3 Experiments with Multiple Language Pairs: WMT Data 103
language pair also showed high performance (0.26 of averaged BLEU - Table 5.5), whencompared to EN-DE and DE-EN for example.
Fig. 5.9 Performance gains in terms of MAE of the QE models for WMT FR-EN documents.
Summary for all language pairs The results show a high variation among the differentlanguage pairs. For the majority of language pairs, the best results were achieved with theuse of ALL features, although the best ML approach varied across different settings. Also,for the majority of the cases, the use of CONSENSUS or WE features improved over theQUEST-17 models. Discourse-aware features (SHALLOW and DEEP feature sets) did notshow significant improvements over QUEST-17 models for the majority of the cases inall language pairs. Finally, the use of different kernels and GP did not improve over theSVR counterpart (with only one kernel) for all the language pairs. The best QE systemspredicting the different quality labels (BLEU, TER and METEOR) were very similar foreach language pair, in terms of Pearson’s r correlation scores. For example, for EN-DE, thebest systems were built with ALL features and GP for all labels. A similar behaviour wasfound by the systems for EN-ES, EN-FR and ES-EN. For DE-EN and FR-EN there are somesmall differences, but the best systems are always very similar among the different labels.There is also no correlation between the performance of the MT systems (Table 5.5) and theresults for QE. As we mentioned during the presentation of the results per language pair, theoverall quality of the MT systems did not lead to better performance on the QE models.

104 Document-level QE: Prediction
5.4 Experiments with HTER: LIG corpus
In this section, we experiment with the HTER metric as a measure of document quality andcompare its results with BLEU, TER and METEOR.
Corpus The corpus used is the LIG corpus (Potet et al., 2012) presented in Chapter 4. Forthe experiments of this section, we use an extended version of the corpus with 361 FR-ENdocuments. We use 70% of the documents for training the QE systems and 30% for test.
Features For this corpus, there were no pseudo-references available and, as a consequence,CONSENSUS features were not used. Although pseudo-references could be generated byusing off-the-shelf online MT systems (such as Google Translate), we avoid this approachfor this corpus because it is expected that this data is already in the database of such systems,which would give us a reference translation and not a machine translation. DEEP featuresare also not used since English is the target language. Therefore, the feature sets used are:QUEST-17, QUEST-ALL, QUEST-17+SHALLOW, QUEST-ALL+SHALLOW, QUEST-17-WE and ALL.
Quality labels The automatic metrics selected for quality labelling and prediction areHTER, BLEU, TER and METEOR. The Asiya toolkit was used to calculate all metrics.
Method SVR and GP are used to generate the QE models.
Results Table 5.12 shows the results for the LIG corpus. Apart from two models predictingHTER with GP and QUEST-17 and GP and QUEST-17+WE, all Pearson’s r correlationscores are significant. The highest correlation scores for predicting BLEU were achievedby the ALL feature set and SVR model. For predicting TER, the two models with theALL feature set showed the highest correlation scores. Finally, for predicting METEOR thehighest correlation score was achieved using ALL features and a GP model. The predictionof HTER caused several systems to perform very similarly. Finally, the use of differentkernels and GP models (for QUEST-17+WE and QUEST-17+ALL) did not outperform theSVR counterparts with only one kernel for all feature sets.
Figure 5.10 shows the performance gains for experiments with the LIG corpus. Bestresults differ among the features, but no system achieved performance gains higher than20% (gains are even smaller for BLEU and TER). SHALLOW features showed performancegains comparable to those of the best models.

5.5 Problems with Automatic Metrics as Labels for Document-level QE 105
BLEU TER METEOR HTERSVR GP SVR GP SVR GP SVR GP
QUEST-17 0.239 0.211 0.211 0.229 0.468 0.471 0.386 0.174*QUEST-ALL 0.297 0.363 0.307 0.321 0.506 0.523 0.357 0.215QUEST-17+SHALLOW 0.336 0.306 0.308 0.300 0.522 0.516 0.369 0.259QUEST-ALL+SHALLOW 0.297 0.383 0.314 0.346 0.510 0.539 0.372 0.272QUEST-17+WE 0.423 0.389 0.401 0.372 0.573 0.565 0.366 0.149*ALL 0.436 0.391 0.411 0.402 0.583 0.597 0.377 0.249RANDOM 0.009* 0.100* 0.011* 0.071*
Table 5.12 Results for LIG in terms of Pearson’s r correlation. * indicates results that didnot show significant Pearson’s r correlation with p-value < 0.05. The best systems arehighlighted in bold (William’s significance test with p-value < 0.05).
Fig. 5.10 Performance gains in terms of MAE of the QE models for LIG documents.
5.5 Problems with Automatic Metrics as Labels for Document-level QE
In the previous sections we presented several experiments for document-level QE, varyingfeature types, ML approaches and datasets. However, the quality labels used were traditionalautomatic evaluation metrics (BLEU, TER and METEOR) or standard human-targetedmetrics (HTER). Although some of our models showed moderate or strong correlationscores with true labels according to Pearson’s r and some models produced considerableperformance gains, we need to examine the data closely in order to understand such results.It’s known that BLEU-style metrics fail to provide a fair evaluation of MT system outputsthat differ from the human reference (Callison-Burch, Osborne, and Koehn, 2006). Inaddition, such metrics are designed for system-level evaluation (i.e. for comparing different

106 Document-level QE: Prediction
MT systems on the same data) and, therefore, they also fail in scoring single documents,according to document-level issues.
One result that supports our hypothesis is the fact that discourse-aware features didnot outperform the baseline. In fact, for some language pairs in the WMT experiments,document-aware features could not even achieve the baseline score. Discourse informationis expected to be impacted by machine translation and, therefore, discourse features shouldshow promising results.10
We conducted an analysis over all datasets and found that the majority of BLEU, TER,METEOR and even HTER values are concentrated on a small range of the data. Therefore,all documents are treated as having similar quality. This assumption is also supported by thefact that all MAEmean were below 0.1 in our experiments. This means that using a predictorthat assigns the mean value of the training set as the predicted value for all entries in the testset already solves the prediction problem with considerably low error. Finally, the reasonwhy the models trained in the previous section show good performance for predicting theautomatic metrics (in terms of Pearson’s r correlation) may be because the predictions, aswell as the true labels, are clustered around a small area.
The data was analysed in terms of statistical dispersion and central tendency, by comput-ing mean, standard deviation (STDEV), median and interquartile range (IQR). In order tosupport the results, we also present the maximum and minimum values as well as the valuesof the first (Q1) and third (Q3) quartiles.
Mean is a central tendency metric that is calculated by totaling all elements in the sampleand dividing it by the total number of elements (Equation 5.3 - where N is the number ofelements in the sample). Since it is a simple sum of all values, it is not robust to outliers,meaning that outliers may have a significant impact on the mean. STDEV is the square rootof the variance, a statistical dispersion metric that measures how far the elements are from themean. Since this metric is based on the mean value, it is also not robust to outliers (Equation5.4).
x =1N
N
∑i=1
xi (5.3)
σ =
√1N
N
∑i=1
(xi − x)2 (5.4)
10Assuming our discourse features are accurate representations of discourse information.

5.5 Problems with Automatic Metrics as Labels for Document-level QE 107
Median is another central tendency metric and is defined by the central element in thesample (Equation 5.5). The sample is put in ascending order before computing the median.
median =n−1
2thelement (5.5)
When the sample has an even number of elements, the median is defined as the average ofthe two central values. This metric is less sensitive to outliers and, therefore, it is considerrobust.
IQR is a statistical dispersion metric that consists of the difference between the third andfirst quartiles (Equation 5.6). Quartiles are the three points able to divide the dataset in equalgroups, each containing a quarter of the data. The first quartile (Q1) is the point that dividesthe 25% smallest values from the rest of the data. The second quartile corresponds to thepoint that divides the data in two equal sized groups (50%) and it corresponds to the medianvalue. Finally, all data points with a value higher than the third quartile (Q3) correspondto 25% of the data with the highest values. IQR shows the interval where 50% of the dataappear.
IQR = Q3 −Q1 (5.6)
FAPESP Table 5.13 shows the statistics of the three scenarios in the FAPESP corpus,for all quality labels (BLEU, TER and METEOR). All automatic evaluation metrics showreasonable STDEV in relation to the mean (the ratio between STDEV and mean is around0.200). However, the results given by IQR show much lower dispersion. IQR showeddistances smaller than 0.130 for MOSES and SYSTRAN and smaller than 0.150 for MIXED,meaning that 50% of the data appear in a small interval. For this dataset, it is importantto note that by mixing different MT systems in the same dataset (MIXED), the dispersionmetrics presented higher values. However, they are not far from the cases with only one MTsystem. Perhaps BLEU-style metrics are not evaluating the documents in the way needed forthem to distinguish between different documents.
WMT Table 5.14 shows the statistical metrics for all language pairs of the WMT dataset.For all language pairs, STDEV shows considerable data variation. However, IQR values weresmall. For WMT EN-DE, IQR were 0.079, 0.153 and 0.094 for BLEU, TER and METEORrespectively. This means that 50% of the data points are located on a small interval. ForEN-ES, the IQR values are slightly higher than for EN-DE in each metric, with the highest

108 Document-level QE: Prediction
MOSESMIN MAX MEAN STDEV Q1 MEDIAN Q3 IQR
BLEU 0.005 0.589 0.361 0.075 0.316 0.364 0.416 0.100TER 0.265 1.000 0.497 0.098 0.427 0.481 0.549 0.123METEOR 0.060 0.726 0.541 0.074 0.499 0.548 0.592 0.093SYSTRAN
MIN MAX MEAN STDEV Q1 MEDIAN Q3 IQRBLEU 0.007 0.831 0.275 0.058 0.237 0.279 0.313 0.076TER 0.107 1.000 0.557 0.090 0.496 0.539 0.608 0.113METEOR 0.054 0.891 0.480 0.066 0.440 0.488 0.524 0.084MIXED
MIN MAX MEAN STDEV Q1 MEDIAN Q3 IQRBLEU 0.004 0.687 0.364 0.104 0.287 0.353 0.441 0.153TER 0.201 1.000 0.483 0.118 0.396 0.480 0.553 0.157METEOR 0.055 0.806 0.552 0.118 0.488 0.546 0.624 0.136
Table 5.13 Statistic dispersion and central tendency metrics for the FAPESP dataset.
being 0.201 for TER. However, 0.201 is still a low variation. The other language pairspresent a similar behaviour for IQR. The highest IQR value overall is of 0.220 for TER forEN-FR. In general, TER obtains the highest values of IQR and STDEV.
LIG For the LIG dataset, the difference between the minimum and maximum values areconsiderably smaller for BLEU and METEOR than for TER and HTER. On the other hand,the results are similar with all automatic metrics in terms of IQR, achieving a low dispersion.The highest scores where for TER with 0.138 of IQR, although this is still a sign of lowvariation.
We also analyse the distributions of the training and test sets. For all corpora, languagepairs and quality labels, the training and test data follow the same distribution, according tothe Kolmogorov-Smirnov test.11 In addition, the data distribution for all scenarios does notfollow the normal distribution (also according to the Kolmogorov-Smirnov test). Therefore,since there are no differences between the distributions of training and test sets and the datadistribution does not follow the normal distribution for all cases, there is no evidence of theimpact of these factors into the QE approaches.
In order to further validate our assumptions regarding the variation in the data, we alsoplot the distribution of the true values and predicted values for some scenarios. The predictedvalues are from the best systems presented in the previous sections. When two systems havethe same performance (for example, HTER prediction in the LIG dataset) one of the systemswere selected randomly. In this section, we only present the best results for the FAPESP
11The null hypothesis that the two samples are drawn from the same distribution was not rejected withp-value > 0.05.
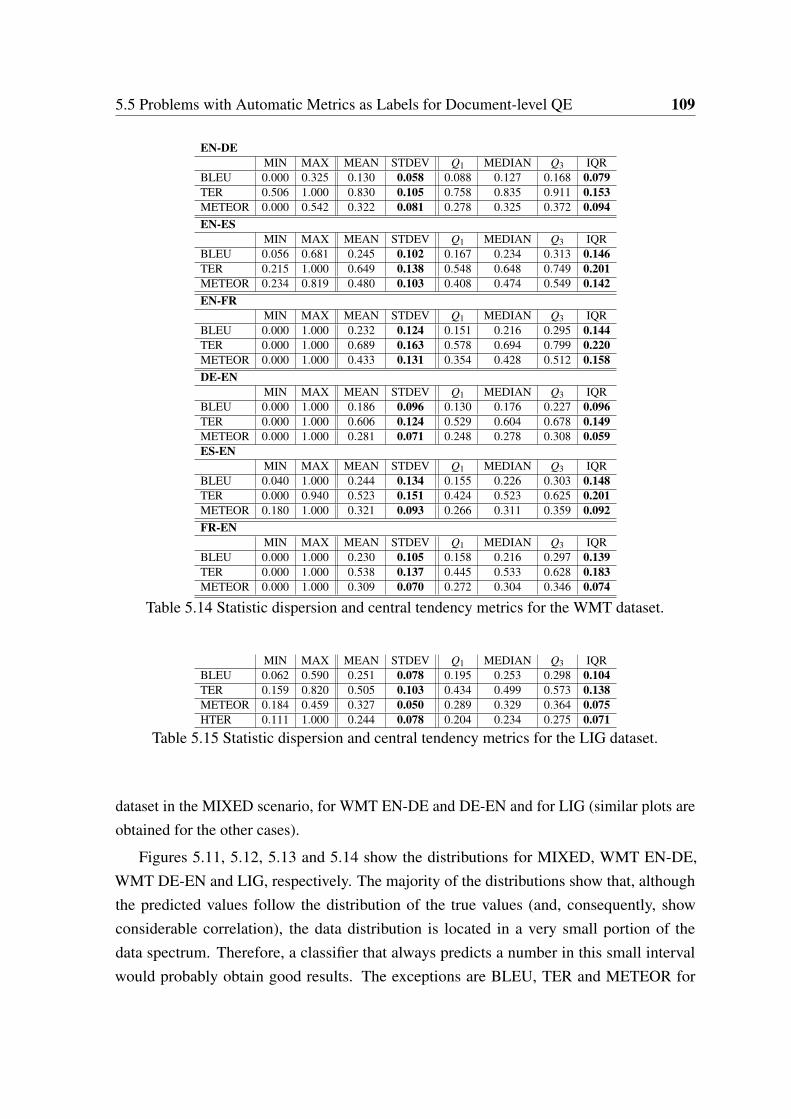
5.5 Problems with Automatic Metrics as Labels for Document-level QE 109
EN-DEMIN MAX MEAN STDEV Q1 MEDIAN Q3 IQR
BLEU 0.000 0.325 0.130 0.058 0.088 0.127 0.168 0.079TER 0.506 1.000 0.830 0.105 0.758 0.835 0.911 0.153METEOR 0.000 0.542 0.322 0.081 0.278 0.325 0.372 0.094EN-ES
MIN MAX MEAN STDEV Q1 MEDIAN Q3 IQRBLEU 0.056 0.681 0.245 0.102 0.167 0.234 0.313 0.146TER 0.215 1.000 0.649 0.138 0.548 0.648 0.749 0.201METEOR 0.234 0.819 0.480 0.103 0.408 0.474 0.549 0.142EN-FR
MIN MAX MEAN STDEV Q1 MEDIAN Q3 IQRBLEU 0.000 1.000 0.232 0.124 0.151 0.216 0.295 0.144TER 0.000 1.000 0.689 0.163 0.578 0.694 0.799 0.220METEOR 0.000 1.000 0.433 0.131 0.354 0.428 0.512 0.158DE-EN
MIN MAX MEAN STDEV Q1 MEDIAN Q3 IQRBLEU 0.000 1.000 0.186 0.096 0.130 0.176 0.227 0.096TER 0.000 1.000 0.606 0.124 0.529 0.604 0.678 0.149METEOR 0.000 1.000 0.281 0.071 0.248 0.278 0.308 0.059ES-EN
MIN MAX MEAN STDEV Q1 MEDIAN Q3 IQRBLEU 0.040 1.000 0.244 0.134 0.155 0.226 0.303 0.148TER 0.000 0.940 0.523 0.151 0.424 0.523 0.625 0.201METEOR 0.180 1.000 0.321 0.093 0.266 0.311 0.359 0.092FR-EN
MIN MAX MEAN STDEV Q1 MEDIAN Q3 IQRBLEU 0.000 1.000 0.230 0.105 0.158 0.216 0.297 0.139TER 0.000 1.000 0.538 0.137 0.445 0.533 0.628 0.183METEOR 0.000 1.000 0.309 0.070 0.272 0.304 0.346 0.074
Table 5.14 Statistic dispersion and central tendency metrics for the WMT dataset.
MIN MAX MEAN STDEV Q1 MEDIAN Q3 IQRBLEU 0.062 0.590 0.251 0.078 0.195 0.253 0.298 0.104TER 0.159 0.820 0.505 0.103 0.434 0.499 0.573 0.138METEOR 0.184 0.459 0.327 0.050 0.289 0.329 0.364 0.075HTER 0.111 1.000 0.244 0.078 0.204 0.234 0.275 0.071
Table 5.15 Statistic dispersion and central tendency metrics for the LIG dataset.
dataset in the MIXED scenario, for WMT EN-DE and DE-EN and for LIG (similar plots areobtained for the other cases).
Figures 5.11, 5.12, 5.13 and 5.14 show the distributions for MIXED, WMT EN-DE,WMT DE-EN and LIG, respectively. The majority of the distributions show that, althoughthe predicted values follow the distribution of the true values (and, consequently, showconsiderable correlation), the data distribution is located in a very small portion of thedata spectrum. Therefore, a classifier that always predicts a number in this small intervalwould probably obtain good results. The exceptions are BLEU, TER and METEOR for

110 Document-level QE: Prediction
MIXED in Figure 5.11 and TER for WMT DE-EN (Figure 5.13), which show a considerablywider spread. There is no clear correlation between the performance of the QE systemsand the variation of the data. The FAPESP case showed the best QE systems in terms ofPearson’s r correlation, whilst also presented the highest variation. On the other hand, theperformance of the best QE systems for the WMT DE-EN data predicting TER is not farfrom the performance of the best systems predicting BLEU and METEOR, even thoughthe TER distribution has more variation than the distributions for BLEU and METEOR.Therefore, since the data variation of the automatic evaluation metrics is considerablydifferent in different datasets, we conclude that such metrics are problematic. Based on theseobservations, it is unclear whether or not the automatic evaluation metrics explored hereincan be reliably used as quality labels for predicting document-level quality.
Fig. 5.11 Data distribution of true and predicted values of the best systems predicting BLEU,TER and METEOR for MIXED scenario in the FAPESP dataset.
5.6 Discussion
In this chapter, we presented several experiments with different datasets for document-levelQE, exploring the features introduced in Chapter 4. The quality labels used were BLEU,TER and METEOR for all datasets except LIG, for which we also including the HTERmetric. In general, for all quality labels, the addition of discourse-aware features (featuresets DEEP and SHALLOW) did not improve over the baseline systems built with only theQUEST-17 feature set.

5.6 Discussion 111
Fig. 5.12 Data distribution of true and predicted values of the best systems predicting BLEU,TER and METEOR for EN-DE in the WMT dataset.
Fig. 5.13 Data distribution of true and predicted values of the best systems predicting BLEU,TER and METEOR for DE-EN in the WMT dataset.
For the FAPESP dataset (Section 5.2), the use of PSEUDO or CONSENSUS featuresets achieved the best results, which are similar to the current state-of-the-art results fordocument-level QE presented in Chapter 2. However, as mentioned in Chapter 4, pseudo-reference-based features are not available in realistic scenarios and therefore we consider themerit of these results not to be impressive as those of other feature sets. SVR models wereconsistently better than GP models in this dataset, although the same cannot be observed inthe results obtained over the WMT dataset.

112 Document-level QE: Prediction
Fig. 5.14 Data distribution of true and predicted values of the best systems predicting BLEU,TER, METEOR and HTER for LIG dataset.
For the WMT dataset, the combination of all features (in feature set ALL) led to the bestresults in the majority of the cases (Section 5.3). The best ML technique varied across thedifferent language pairs and, therefore, we cannot conclude on what are the best techniquesfor the task and recommend that both algorithms are tested for each dataset. SVR modelsare, in general, faster to train and test than GP models, although the difference in time (orperformance) was not very salient.
For the LIG dataset, models built with the ALL feature set showed the best results forBLEU, TER and METEOR (Section 5.4). The best ML technique varied among the differentlabels: SVR was the best for BLEU, GP was the best for METEOR and both had similarperformance for TER. For HTER almost all models built with SVR did not differ significantly(the only exception was the model built with QUEST-ALL features). The variance in theresults over different datasets do not allow us to generalise which configuration is the mosteffective for the task. However, such differences can be a result of the use of automaticmetrics as quality labels. We believe that such metrics are not reliable for the task and thiscould explain why there is no consensus across the different datasets.
Finally, in Section 5.5 we show the variation in the data distribution of all automaticmetrics in all datasets. The scores obtained for IQR are small across all scenarios evaluated,meaning that a large part of the data points are located in a small interval. STDEV showedconsiderably high variation, which together with the IQR results highlight outliers in thedata. However, the distribution of some datasets showed a considerably wide range where thescores are distributed (such as the MIXED in FAPESP dataset - Figure 5.11). On the otherhand, for other datasets, this range of the data is very small (for example, HTER for the LIGdataset - Figure 5.14). Therefore, it is not clear how reliable are such automatic evaluation

5.6 Discussion 113
metrics for the assessment of documents, since their distributions varied a lot across differentdatasets. Moreover, it would be expected that QE models showed better results in termsof Pearson’s r correlation and performance gains for datasets with low variance, since theprediction task would be easier for the models. However, the dataset with best correlationscores and performance gains is the one with the highest data variation (FAPESP). In addition,the performance of the QE systems varied a lot for different datasets with similar low variancein the data distribution (for examples, BLEU, TER and METEOR for EN-DE and DE-EN inthe WMT dataset). Therefore, there might be factors other than data variation that impact theperformance of the QE models. Since the features are compatible across different datasetsand language pairs, our hypothesis is that the labels are not ideal for the task.
In the next chapter we propose and experiment with new task-based document-awarequality labels. Models are trained with configuration similar to those of the models built inthis chapter and the feature sets used are the same (apart from when we approach QE as aclassification task). Whenever it is possible we also compare the models built for predictingour new labels with models built for predicting BLEU-style metrics.


Chapter 6
New Quality Labels for Document-levelQE
As discussed in Chapter 2, defining “quality” is vital for the success of the evaluation ofNLP tasks.1 In MT, the notion of quality can vary considerably depending on the audienceand the purposes of the translation. Although traditional evaluation metrics (e.g. BLEU)can be considered useful for system comparisons and system evaluations, they appear notto be reliable for document-level assessment (Chapter 5). Such metrics operate at eithersentence or corpus level and they do not take into account document-wide problems (such asdiscourse).
The experiments presented in Chapter 5 show that there is a lack of reliable quality labelsfor document-level QE, which could be used to train QE models or to compare automaticmetrics against. In this Chapter we introduce novel quality labels specifically designed fordocument-level QE, which we believe to be more reliable for the QE task. Two different typesof quality labels are presented: one for dissemination purposes and another for assimilation.
Section 6.1 shows the first experiment done towards new quality labels for document-levelQE. We experiment with direct human assessments of cohesion and coherence and introducea new method of two-stage post-editing.
Section 6.2 presents our large-scale experiments with the two-stage post-editing method,aiming to devise quality labels for dissemination purposes. Two new labels are devised bycombining edit distance scores of the post-editing tasks and compared with BLEU, TER andMETEOR as quality labels.
1Parts of this chapter were previously published in peer-reviewed conferences: Scarton et al. (2015),Scarton, Tan, and Specia (2015), Scarton and Specia (2016) and Scarton et al. (2016).

116 New Quality Labels for Document-level QE
In Section 6.3 we introduce new quality labels derived from reading comprehension testsfor assimilation purposes. The marks for the reading comprehension tests are converted intoquality scores in two ways: (i) for open questions we use continuous marking scores and(ii) for multiple choice questions we use discrete marking scores. Therefore, the problem isaddressed either as regression (for continuous scores) or as classification (for discrete scores).
6.1 Preliminary Experiments
The first experiments done towards devising labels for document-level QE were conducted atparagraph level. We considered paragraphs as small documents since they usually addressa single topic and the sentences are connected coherently. In other words, paragraphs arelong enough to encompass certain document-level information and short enough to makeexperiments and analyses feasible. We ran two experiments at paragraph level: humanassessment of cohesion and coherence (called hereafter SUBJ) and two-stage post-editing(called here after PE1, first post-editing, and PE2, second post-editing).
6.1.1 Experimental Settings
Data
The datasets were extracted from the test set of the EN-DE WMT13 MT shared task. EN-DEwas chosen given the availability of in-house annotators for this language pair. Outputs of theUEDIN SMT system were chosen as this was the highest performing participating systemfor this language pair (Bojar et al., 2013). For the SUBJ experiment, 102 paragraphs wererandomly selected from the FULL CORPUS (Table 6.1).
For PE1 and PE2, only source (English) paragraphs with 3-8 sentences were selected(filter S-NUMBER) to ensure that there was enough information beyond sentence-level tobe evaluated and make the task feasible for the annotators. These paragraphs were furtherfiltered to discard those without cohesive devices. Cohesive devices are linguistic unitsthat play a role in establishing cohesion between clauses, sentences or paragraphs (Hallidayand Hasan, 1976). Pronouns and discourse connectives are examples of such devices. Alist of pronouns and the connectives from Pitler and Nenkova (2009) was used. Finally,paragraphs were ranked according to the number of cohesive devices they contain and thetop 200 paragraphs were selected (filter C-DEV). Table 6.1 shows the statistics of the initialcorpus and the resulting selection after each filter.

6.1 Preliminary Experiments 117
Number of Number ofParagraphs Cohesive devices
FULL CORPUS 1,215 6,488S-NUMBER 394 3,329C-DEV 200 2,338
Table 6.1 WMT paragraph-level corpus statistics.
For the PE1 experiment, the paragraphs in C-DEV were randomised. Then, sets contain-ing seven paragraphs each were created. For each set, the sentences of its paragraphs werealso randomised in order to prevent annotators from having access to wider context whenpost-editing. The guidelines made it clear to annotators that the sentences they were givenwere not related, not necessarily part of the same document, and that therefore they shouldnot try to find any relationships among them. For PE2, sentences that had already beenpost-edited were put together in their original paragraphs and presented to the annotators asa complete paragraph. In PE2, the annotators post-edited the same sentences that they hadalready post-edited in PE1.
Annotators
The annotators for both experiments were students of “Translation Studies” courses (TS)in Saarland University, Saarbrücken, Germany. All students were familiar with concepts ofMT and with post-editing tools. They were divided into two groups: (i) 25 Undergraduate
students (B.A.), who are native speakers of German; and (ii) 29 Master students (M.A.), themajority of whom are native speakers of German. Non-native speakers had at least sevenyears of German language studies. B.A. and M.A. students have on average 10 years ofEnglish language studies. Only the B.A. group did the SUBJ experiment. PE1 and PE2 weredone by all groups.
PE1 and PE2 were done using three CAT tools: PET (Aziz, Sousa, and Specia, 2012),Matecat (Federico et al., 2014) and memoQ.2 These tools operate in very similar ways interms of their post-editing functionalities, and therefore the use of multiple tools was onlymeant to make the experiment more interesting for students and did not affect the results.SUBJ was done without the help of tools.
For PE1, the only guideline provided was that the annotators should perform correctionsin the MT output without focusing on style. They should only focus in making the textfluent and coherent with the source document. For PE2, we asked the annotators to make
2https://www.memoq.com/

118 New Quality Labels for Document-level QE
any remaining corrections that were necessary for keeping the coherence with the sourcedocument.
6.1.2 Human Assessments: Cohesion and Coherence
Our first attempt to access quality beyond sentence level was to explicitly guide annotatorsto consider discourse, where the notion of “discourse” covers various linguistic phenomenaobserved across discourse units. Discourse units can be clauses (intra-sentence), sentencesor paragraphs. Consequently, the SUBJ experiment consists in assessing the quality ofparagraphs in terms of cohesion and coherence. We define cohesion as the linguistic marks(cohesive devices) that connect clauses, sentences or paragraphs together; coherence captureswhether clauses, sentences or paragraphs are connected in a logical way, i.e. whether theymake sense together (Stede, 2011). In order to assess these two phenomena, we propose a4-point scale that is similar to the human assessment scale for fluency and adequacy. Forcoherence:
1. Completely coherent;
2. Mostly coherent;
3. Little coherent;
4. Incoherent.
For cohesion:
1. Flawless;
2. Good;
3. Disfluent;
4. Incomprehensible.
Six sets with 17 paragraphs each were randomly selected from the 102 paragraphs andgiven to the 25 annotators from the B.A. group (each annotator evaluated one set). The taskwas to assess the paragraphs in terms of cohesion and coherence, using the scale given. Theannotators could also rely on the source paragraphs (the guidelines of this experiment arepresented in Appendix B)

6.1 Preliminary Experiments 119
The agreement for the task in terms of Fleiss-Kappa3 and Spearman’s ρ rank correlationare given in Tables 6.2 and 6.3, respectively. The number of annotators per set is differentbecause some of them did not complete the task.
Set 1 Set 2 Set 3 Set 4 Set 5 Set 6Annotators 3 3 4 7 6 2Coherence 0.05 0.00 0.06 0.06 0.06 0.35Cohesion 0.13 0.37 0.14 0.05 0.05 0.13
Table 6.2 Fleiss inter-annotator agreement for the SUBJ task.
Set 1 Set 2 Set 3 Set 4 Set 5 Set 6Annotators 3 3 4 7 6 2Coherence 0.07 0.05 0.16 0.16 0.28 0.58Cohesion 0.38 0.43 0.28 0.09 0.38 0.12
Table 6.3 Spearman’s ρ rank correlation for the SUBJ task.
The Fleiss-Kappa agreement is low for all the sets, but cohesion on Set 3 is an exception(although the correlation is still below 0.5). A low agreement in terms of Spearman’s ρ rankcorrelation was found for coherence (ranging from 0.05 to 0.28, having 0.58 as an outlier).For cohesion, half of the sets show moderate correlation whilst the other half show weakor no correlation for Spearman’s ρ (using the same classification presented in Table 5.1from Chapter 5 for Pearson’s r). These can be sign that cohesion is easier to be assessedthan coherence. However, these concepts are naturally very abstract, even for humans,offering substantial room for subjective interpretations. In addition, the existence of (oftenmany) errors in the MT output can hinder the understanding of the text altogether, renderingjudgements on any specific quality dimension difficult to make.
6.1.3 Two-stage Post-editing
In order to overcome the issues of direct human evaluation, we propose a new method that wecall two-stage post-editing (Scarton et al., 2015). Such a method is based on a human-targetedtask-based approach that indirectly evaluates machine translated documents by using humanpost-editing.
3This metric is an extension of the Kappa metric allowing agreement calculations over more than twoannotators.
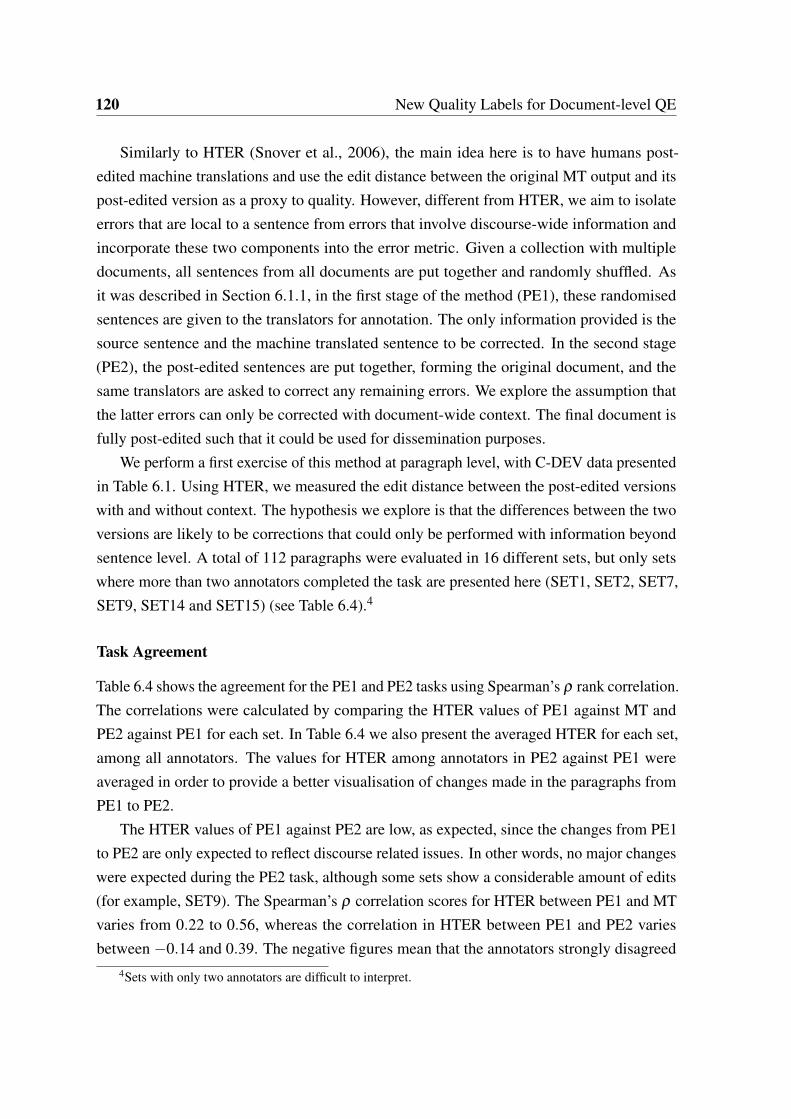
120 New Quality Labels for Document-level QE
Similarly to HTER (Snover et al., 2006), the main idea here is to have humans post-edited machine translations and use the edit distance between the original MT output and itspost-edited version as a proxy to quality. However, different from HTER, we aim to isolateerrors that are local to a sentence from errors that involve discourse-wide information andincorporate these two components into the error metric. Given a collection with multipledocuments, all sentences from all documents are put together and randomly shuffled. Asit was described in Section 6.1.1, in the first stage of the method (PE1), these randomisedsentences are given to the translators for annotation. The only information provided is thesource sentence and the machine translated sentence to be corrected. In the second stage(PE2), the post-edited sentences are put together, forming the original document, and thesame translators are asked to correct any remaining errors. We explore the assumption thatthe latter errors can only be corrected with document-wide context. The final document isfully post-edited such that it could be used for dissemination purposes.
We perform a first exercise of this method at paragraph level, with C-DEV data presentedin Table 6.1. Using HTER, we measured the edit distance between the post-edited versionswith and without context. The hypothesis we explore is that the differences between the twoversions are likely to be corrections that could only be performed with information beyondsentence level. A total of 112 paragraphs were evaluated in 16 different sets, but only setswhere more than two annotators completed the task are presented here (SET1, SET2, SET7,SET9, SET14 and SET15) (see Table 6.4).4
Task Agreement
Table 6.4 shows the agreement for the PE1 and PE2 tasks using Spearman’s ρ rank correlation.The correlations were calculated by comparing the HTER values of PE1 against MT andPE2 against PE1 for each set. In Table 6.4 we also present the averaged HTER for each set,among all annotators. The values for HTER among annotators in PE2 against PE1 wereaveraged in order to provide a better visualisation of changes made in the paragraphs fromPE1 to PE2.
The HTER values of PE1 against PE2 are low, as expected, since the changes from PE1to PE2 are only expected to reflect discourse related issues. In other words, no major changeswere expected during the PE2 task, although some sets show a considerable amount of edits(for example, SET9). The Spearman’s ρ correlation scores for HTER between PE1 and MTvaries from 0.22 to 0.56, whereas the correlation in HTER between PE1 and PE2 variesbetween −0.14 and 0.39. The negative figures mean that the annotators strongly disagreed
4Sets with only two annotators are difficult to interpret.

6.1 Preliminary Experiments 121
SET1 SET2 SET5 SET6 SET9 SET10 SET14 SET15 SET16Annotators 3 3 3 4 4 3 3 3 3PE1 x MT - averaged HTER 0.63 0.57 0.22 0.32 0.28 0.18 0.30 0.24 0.18PE1 x PE2 - averaged HTER 0.05 0.07 0.05 0.03 0.10 0.06 0.09 0.07 0.05PE1 x MT - Spearman 0.52 0.50 0.52 0.56 0.37 0.41 0.71 0.22 0.46PE2 x PE1 - Spearman 0.38 0.39 −0.03 −0.14 0.25 0.15 0.14 0.18 −0.02
Table 6.4 Averaged HTER values and Spearman’s ρ rank correlation for PE1 against MTand PE1 against PE2.
regarding the changes made from PE1 to PE2. This can be related to stylistic choices madeby the annotators (see Section 6.1.3).
Issues Beyond Sentence Level
Figure 6.1 shows the results for individual paragraphs in all sets. The majority of theparagraphs were edited in the second round of post-editions. This clearly indicates thatinformation beyond sentence-level can be helpful to further improve the output of MTsystems. Between 0% and 19% of the words have changed from PE1 to PE2 depending onthe paragraph and the annotators (in average, 7% of the words were edited).
SET1 SET2 SET5 SET6 SET9 SET10 SET14 SET15 SET16
Sets of paragraphs
0.0
0.1
0.2
0.3
0.4
0.5
0.6
0.7
0.8
HT
ER
diffe
rence
Paragraphs
7
6
5
4
3
2
1
Fig. 6.1 HTER between PE1 and PE2 for each of the seven paragraphs in each set.
An example of changes from PE1 to PE2 related to discourse phenomena is shown inTable 6.5. In this example, two changes were performed. The first is related to the substitutionof the sentence “Das ist falsch” - literal translation of “This is wrong” - by “Das ist nicht
gut”, which fits better into the context, because it gives the sense of “This is not good”.

122 New Quality Labels for Document-level QE
The other change makes the information more explicit. The annotator decided to changefrom “Hier ist diese Schicht ist dünn” - literal translation of “Here, this layer is thin” - to
“Hier ist die Anzahl solcher Menschen gering”, a translation that better fits the context of theparagraph: “Here, the number of such people is low”.
PE1: - St. Petersburg bietet nicht viel kulturelles Angebot, Moskau hat viel mehr Kultur, es hat eine Grundlage.Es ist schwer für die Kunst, sich in unserem Umfeld durchzusetzen.Wir brauchen das kulturelle Fundament, aber wir haben jetzt mehr Schriftsteller als Leser.Das ist falsch.In Europa gibt es viele neugierige Menschen, die auf Kunstausstellungen, Konzerte gehen.Hier ist diese Schicht ist dünn.PE2: - St. Petersburg bietet nicht viel kulturelles Angebot, Moskau hat viel mehr Kultur, es hat eine Grundlage.Es ist schwer für die Kunst, sich in unserem Umfeld durchzusetzen.Wir brauchen das kulturelle Fundament, aber wir haben jetzt mehr Schriftsteller als Leser.Das ist nicht gut.In Europa gibt es viele neugierige Menschen, die auf Kunstausstellungen, Konzerte gehen.Hier ist die Anzahl solcher Menschen gering.SRC: - St. Petersburg is not a cultural capital, Moscow has much more culture, there is bedrock there.It’s hard for art to grow on our rocks.We need cultural bedrock, but we now have more writers than readers.This is wrong.In Europe, there are many curious people, who go to art exhibits, concerts.Here, this layer is thin.
Table 6.5 Example of changes from PE1 to PE2.
Manual Analysis
In order to better understand the changes made by the annotators from PE1 to PE2 and alsobetter explain the negative values in Table 6.4, we manually inspected the post-edited data.This analysis was done by senior translators who were not involved in the actual post-editingexperiments. They counted modifications performed and categorised them into three classes:
Discourse/context changes: changes related to discourse phenomena, which could only bemade by having the entire paragraph.
Stylistic changes: changes related to translator’s stylistic or preferential choices. Thesechanges can be associated with the paragraph context, although they are not strictlynecessary under our post-editing guidelines.
Other changes: changes that could have been made without the paragraph context (PE1),but were only performed during PE2.

6.2 Dissemination: Two-stage Post-editing 123
The results are shown in Table 6.6. Although annotators were asked not to make unneces-sary changes (stylistic), some of them made changes of this type (especially annotators 2 and3 from sets 5 and 6, respectively). These sets are also the ones that show negative values inTable 6.4. Since stylistic changes do not follow a pattern and are related to the backgroundand preferences of the translator, the high number of this type of change for these sets maybe the reason for the negative correlation figures. In the case of SET6, annotator 2 alsoperformed several changes classified as “other changes”. This may have also led to negativecorrelation values. However, the reasons behind the negative values in SET16 could includeother phenomena, since overall the variation in the changes performed is low.
SET1 SET2 SET5 SET6 SET9 SET10 SET14 SET15 SET16Annotators 1 2 3 1 2 3 1 2 3 1 2 3 4 1 2 3 4 1 2 3 1 2 3 1 2 3 1 2 3Discourse/context 2 3 1 0 6 2 2 1 0 2 2 0 0 1 7 1 0 4 0 0 1 0 1 2 1 2 0 1 1Stylistic 2 0 1 1 0 1 3 11 0 0 3 9 3 5 10 1 3 1 2 2 6 0 0 3 3 2 2 1 3Other 1 2 4 0 2 2 2 2 6 0 6 0 1 2 0 4 2 1 0 2 2 0 1 1 2 1 1 1 0Total errors 5 5 6 1 8 5 7 14 6 2 11 9 4 8 17 6 5 6 2 4 9 0 2 6 6 5 3 3 4
Table 6.6 Counts on types of changes made from PE1 to PE2.
In the next section (Section 6.2) we show our large scale experiments with the two-stagepost-editing method. We also rely on professional post-editors, with more experience thanthe annotators used in the preliminary study presented here. Moreover, we controlled thepost-editions by monitoring the annotators during the annotation task.
6.2 Dissemination: Two-stage Post-editing
The two-stage post-editing method used in this section is an extension of the experimentsdone in Section 6.1.3 for a different language pair (EN-ES instead of EN-DE), full documents(instead of paragraphs), more data and relying on professional translators. For our newexperiment, 208 documents were selected from the EN-ES WMT translation shared taskcorpora (2008-2013 editions), with an average of 302.88 words per document and 15.76sentences per document. These documents are a subset of the WMT EN-ES dataset usedin Chapter 5, therefore, the machine translations come from different MT systems. Theselection was made such that it ensures that shortest documents in the collection are featuredfirst, for practical reasons (time and cost of post-editing) as well as so that more documentscould be annotated.
The documents were post-edited by two professional translators (half the documentseach), who were hired to work full time for two weeks in the project. The post-editingguidelines were similar to the ones presented in Section 6.1.1, although the environment

124 New Quality Labels for Document-level QE
in this experiment was more controlled. Firstly, the post-editors performed a training task,in order to solve any questions about the two-stage post-editing method and to make themfamiliar with the post-editing tool (PET). Secondly, the post-editors worked on site with usand they gave us daily reports on the task development.5
Deriving Quality Labels
We evaluate four variants of edit-distance-based quality labels, called hereafter: DISS-HTER,DISS-LC-P, DISS-LC-M and DISS-LC-W2. For DISS-HTER, we used the standard HTERscores between PE2 and MT. In this case, the quality label gives the same importance to alledits that are made in the document, i.e, word, sentence and document-level problems aregiven the same weight. Although DISS-HTER is calculated simply as the HTER betweena machine translated document and its post-edited version, the way the post-editing wasdone makes it different from the standard HTER measure. The two-stage post-editingmethod emphasises document-level problems by ensuring that the translator concentrates ondocument-wide issues during the second stage of post-editing. Therefore, DISS-HTER isexpected to be more informative in terms of document-level issues than a traditional HTERcalculated against a corpus post-edited without following the two-stage post-editing method(such as the LIG corpus, presented in Section 5.4).
For the other labels, we combine the HTER score between PE1 and MT (PE1×MT ) withthe HTER between PE2 and PE1 (PE2 ×PE1). This label aims to penalise documents withhigher differences between PE1 and PE2, in other words, documents with more document-level problems. Labels penalising document-aware issues are expected to lead to betterprediction models that reflect actual document-level quality.
In order to generate such a label, we use a linear combination of PE1×MT and PE2×PE1
(Equation 6.1), where w2 and w1 are empirically defined:
f = w1 ·PE1 ×MT +w2 ·PE2 ×PE1, (6.1)
For DISS-LC-P and DISS-LC-M, since the scale of PE1 ×MT is different from PE2 ×PE1, given that PE2 ×PE1 has much smaller values, we first normalised both distributions inorder to make all values range between 0.0 and 1.0. The normalisation was done by applyingEquation 6.2, where D is the set of labels, x is the data point to be normalised, x′ is thenormalised value, xmin is the minimum value of D and xmax is the maximum value of D.
x′ =x− xmin
xmax − xmin,∀x ∈ D (6.2)
5This work was done during my secondment at Pangeanic in Valencia, Spain http://www.pangeanic.com.
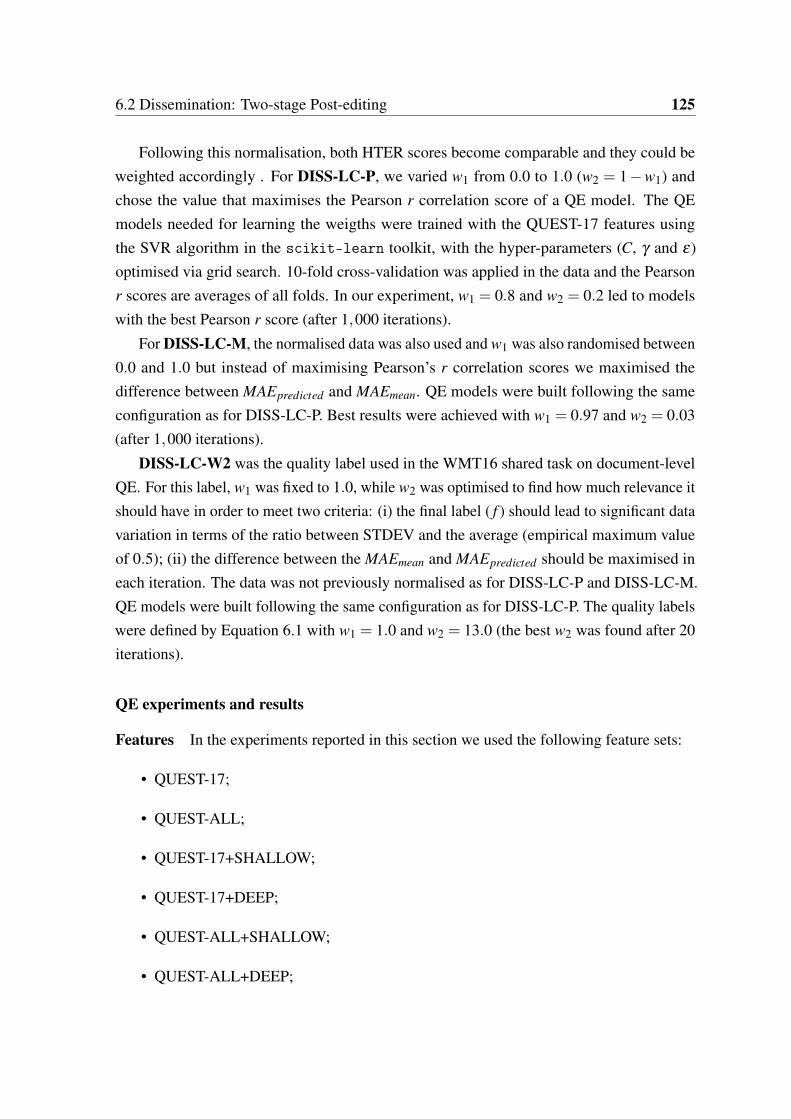
6.2 Dissemination: Two-stage Post-editing 125
Following this normalisation, both HTER scores become comparable and they could beweighted accordingly . For DISS-LC-P, we varied w1 from 0.0 to 1.0 (w2 = 1−w1) andchose the value that maximises the Pearson r correlation score of a QE model. The QEmodels needed for learning the weigths were trained with the QUEST-17 features usingthe SVR algorithm in the scikit-learn toolkit, with the hyper-parameters (C, γ and ε)optimised via grid search. 10-fold cross-validation was applied in the data and the Pearsonr scores are averages of all folds. In our experiment, w1 = 0.8 and w2 = 0.2 led to modelswith the best Pearson r score (after 1,000 iterations).
For DISS-LC-M, the normalised data was also used and w1 was also randomised between0.0 and 1.0 but instead of maximising Pearson’s r correlation scores we maximised thedifference between MAEpredicted and MAEmean. QE models were built following the sameconfiguration as for DISS-LC-P. Best results were achieved with w1 = 0.97 and w2 = 0.03(after 1,000 iterations).
DISS-LC-W2 was the quality label used in the WMT16 shared task on document-levelQE. For this label, w1 was fixed to 1.0, while w2 was optimised to find how much relevance itshould have in order to meet two criteria: (i) the final label ( f ) should lead to significant datavariation in terms of the ratio between STDEV and the average (empirical maximum valueof 0.5); (ii) the difference between the MAEmean and MAEpredicted should be maximised ineach iteration. The data was not previously normalised as for DISS-LC-P and DISS-LC-M.QE models were built following the same configuration as for DISS-LC-P. The quality labelswere defined by Equation 6.1 with w1 = 1.0 and w2 = 13.0 (the best w2 was found after 20iterations).
QE experiments and results
Features In the experiments reported in this section we used the following feature sets:
• QUEST-17;
• QUEST-ALL;
• QUEST-17+SHALLOW;
• QUEST-17+DEEP;
• QUEST-ALL+SHALLOW;
• QUEST-ALL+DEEP;

126 New Quality Labels for Document-level QE
• QUEST-ALL+SHALLOW+DEEP;
• QUEST-17+WE;
• QUEST-17-CONSENSUS;
• ALL.
Method SVR and GP are used to generate the QE models. It is worth mentioning thatSVR models were also used to optimise some of the new labels. Therefore, the labels can bebiased towards this model. GP models aim to alleviate such impact, since it uses a completelydifferent learning approach. For building the SVR models, we use the algorithm available inthe scikit-learn toolkit with RBF kernel and hyper-parameters (C, γ and ε) optimised viagrid search. For building the GP models, we use the GPy toolkit6 with RatQuad kernels andthe optimisation of hyperparameters done by maximising the model likelihood on the fulltraining data
We followed the same split for training and test sets used in the document-level QEshared task on WMT16, where 146 documents were used for training the QE models and62 for test. Table 6.7 shows the Pearson’s r correlation scores for the models predictingeither BLEU, TER or METEOR. Models predicting these metrics did not show significantPearson’s r correlation for the majority of the scenarios. The highest correlation scores forsuch models were a moderate correlation achieved when the WE feature set is used withSVR models, although for TER the model built with QUEST-ALL+SHALLOW+DEEP andSVR was not significant different from the model built with the WE feature set and SVR.
Table 6.8 show the Pearson’s r correlation scores for the models predicting our newlabels. All models predicting the new labels show significant Pearson’s r correlation scores(with some exceptions when CONSENSUS features are used), with some scores falling intothe strong correlation band. For DISS-HTER, the highest correlation scores were shownby the models built with QUEST-ALL+DEEP and GP, QUEST-ALL and GP, and QUEST-ALL+SHALLOW and SVR (no statistically significant difference was found between themodels). Therefore, it seems that document-aware features are the most effective for thislabel. For DISS-LC-W2, the best models were built with QUEST-ALL and GP and ALL andGP. As for DISS-HTER, the document-aware features seem to be the most effective. ForDISS-LC-P, the highest correlation was achieved by the models built with QUEST-ALL andGP, QUEST-ALL+DEEP and GP, and QUEST-17+WE and SVR. For this label document-aware features also seems to be creating the best models. Finally, for DISS-LC-M, all the best
6https://sheffieldml.github.io/GPy/
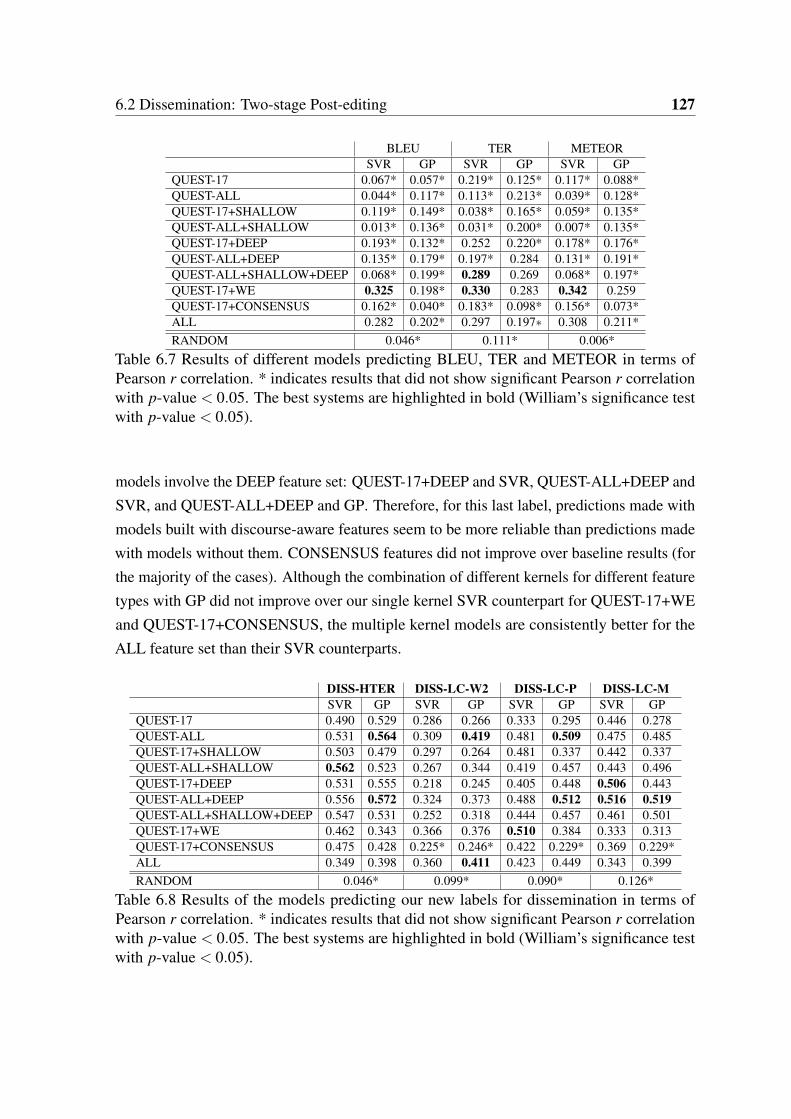
6.2 Dissemination: Two-stage Post-editing 127
BLEU TER METEORSVR GP SVR GP SVR GP
QUEST-17 0.067* 0.057* 0.219* 0.125* 0.117* 0.088*QUEST-ALL 0.044* 0.117* 0.113* 0.213* 0.039* 0.128*QUEST-17+SHALLOW 0.119* 0.149* 0.038* 0.165* 0.059* 0.135*QUEST-ALL+SHALLOW 0.013* 0.136* 0.031* 0.200* 0.007* 0.135*QUEST-17+DEEP 0.193* 0.132* 0.252 0.220* 0.178* 0.176*QUEST-ALL+DEEP 0.135* 0.179* 0.197* 0.284 0.131* 0.191*QUEST-ALL+SHALLOW+DEEP 0.068* 0.199* 0.289 0.269 0.068* 0.197*QUEST-17+WE 0.325 0.198* 0.330 0.283 0.342 0.259QUEST-17+CONSENSUS 0.162* 0.040* 0.183* 0.098* 0.156* 0.073*ALL 0.282 0.202* 0.297 0.197∗ 0.308 0.211*RANDOM 0.046* 0.111* 0.006*
Table 6.7 Results of different models predicting BLEU, TER and METEOR in terms ofPearson r correlation. * indicates results that did not show significant Pearson r correlationwith p-value < 0.05. The best systems are highlighted in bold (William’s significance testwith p-value < 0.05).
models involve the DEEP feature set: QUEST-17+DEEP and SVR, QUEST-ALL+DEEP andSVR, and QUEST-ALL+DEEP and GP. Therefore, for this last label, predictions made withmodels built with discourse-aware features seem to be more reliable than predictions madewith models without them. CONSENSUS features did not improve over baseline results (forthe majority of the cases). Although the combination of different kernels for different featuretypes with GP did not improve over our single kernel SVR counterpart for QUEST-17+WEand QUEST-17+CONSENSUS, the multiple kernel models are consistently better for theALL feature set than their SVR counterparts.
DISS-HTER DISS-LC-W2 DISS-LC-P DISS-LC-MSVR GP SVR GP SVR GP SVR GP
QUEST-17 0.490 0.529 0.286 0.266 0.333 0.295 0.446 0.278QUEST-ALL 0.531 0.564 0.309 0.419 0.481 0.509 0.475 0.485QUEST-17+SHALLOW 0.503 0.479 0.297 0.264 0.481 0.337 0.442 0.337QUEST-ALL+SHALLOW 0.562 0.523 0.267 0.344 0.419 0.457 0.443 0.496QUEST-17+DEEP 0.531 0.555 0.218 0.245 0.405 0.448 0.506 0.443QUEST-ALL+DEEP 0.556 0.572 0.324 0.373 0.488 0.512 0.516 0.519QUEST-ALL+SHALLOW+DEEP 0.547 0.531 0.252 0.318 0.444 0.457 0.461 0.501QUEST-17+WE 0.462 0.343 0.366 0.376 0.510 0.384 0.333 0.313QUEST-17+CONSENSUS 0.475 0.428 0.225* 0.246* 0.422 0.229* 0.369 0.229*ALL 0.349 0.398 0.360 0.411 0.423 0.449 0.343 0.399RANDOM 0.046* 0.099* 0.090* 0.126*
Table 6.8 Results of the models predicting our new labels for dissemination in terms ofPearson r correlation. * indicates results that did not show significant Pearson r correlationwith p-value < 0.05. The best systems are highlighted in bold (William’s significance testwith p-value < 0.05).

128 New Quality Labels for Document-level QE
Figure 6.2 shows results in terms of performance gains for models predicting BLEU,TER and METEOR. Models built with QUEST-17+WE with GP were the best for BLEUand METEOR, whilst the model with QUEST-ALL+SHALLOW+DEEP and GP was thebest for TER. However, all gains are below 10% for all metrics.
Fig. 6.2 Performance gains in terms of MAE of the QE models predicting BLEU, TER andMETEOR.
Figure 6.3 shows the results of performance gains (in terms of MAE for the new dis-semination labels). For DISS-HTER, the best models are built with SVR and the QUEST-ALL+SHALLOW+DEEP and QUEST-ALL feature sets. For DISS-LC-W2, the highestgains were achieved by the SVR model built with the QUEST+ALL features. The highestgains for DISS-LC-P is shown by both models using the QUEST-17+SHALLOW featureset. Finally, for DISS-LC-M, the best model was built with GP and the QUEST-ALL+DEEPfeature set. All the highest performance gains were over 12% (the highest gain was achievedfor HTER predictions - around 20% of performance gain).
The models built for the new labels show higher correlation scores and higher performancegains than the models predicting automatic metrics. In addition, the best models for ournew labels are built with document and discourse-aware features, whilst the best modelspredicting BLEU-style metrics use WE features (with the exception of TER where the bestmodel uses SHALLOW and DEEP features). Since our hypothesis is that our document anddiscourse-aware features should be a better representation from the documents than the otherfeature sets, we conclude that our new labels are more reliable in distinguishing documentsaccording to document-level problems.
6.2 Dissemination: Two-stage Post-editing 129
Fig. 6.3 Performance gains in terms of MAE of the QE models predicting the new dissemi-nation labels.
Data Analysis
Table 6.9 shows the statistic dispersion and central tendency metrics for BLEU, TER,METEOR, DISS-HTER, DISS-LC-P and DISS-LC-M. Despite our efforts in maximis-ing the variation of the data, the new labels do not show more variation than traditionalautomatic metrics. Moreover, the values for DISS-LC-W2 are not directly comparable to theother new labels and evaluation metrics, since the scale of the data is different. Looking atDISS-LC-W2 in isolation, the dispersion metrics do not show high variation on the data.
In Figures 6.4 and 6.5 we show the plots of the test set distributions along with thepredictions made by the best systems for BLEU, TER and METEOR and our new quality

130 New Quality Labels for Document-level QE
MIN MAX MEAN STDEV Q1 MEDIAN Q3 IQRBLEU 0.060 0.681 0.233 0.103 0.159 0.219 0.295 0.135TER 0.215 1.000 0.661 0.137 0.574 0.656 0.743 0.170METEOR 0.234 0.819 0.468 0.101 0.395 0.462 0.530 0.135DISS-HTER 0.171 0.645 0.381 0.091 0.317 0.370 0.434 0.116DISS-LC-P 0.043 0.814 0.249 0.107 0.181 0.235 0.293 0.113DISS-LC-M 0.006 0.975 0.252 0.120 0.178 0.231 0.301 0.123DISS-LC-W2 0.180 2.706 0.895 0.457 0.602 0.765 1.081 0.479
Table 6.9 Statistic dispersion and central tendency metrics for all metrics and new labelsderived from the two-stage post-editing method. Values in bold highlight the statisticdispersion metrics.
labels. For BLEU and METEOR, the data points are concentrated in a small range andthe predictions fall in an even smaller range. TER is slightly more spreadout. However,for the new labels, the data points are also concentrated in a small range of the data. Thiscan be explained by the fact that the new labels are derived from HTER, that also showslow data variation. Even DISS-LC-W2, that assumes a higher data spectrum has its datapoints concentrated in a small portion of such spectrum. Perhaps this kind of document-levelevaluation (based on HTER) will always show low variation among documents. However, aswe previously presented, predictions made by models using our discourse-aware featurescould better predict our new labels than automatic evaluation metrics.
Fig. 6.4 Data distribution of true and predicted values of the best systems predicting BLEU,TER and METEOR.

6.3 Assimilation Labels: Reading Comprehension Tests 131
Fig. 6.5 Data distribution of true and predicted values of the best systems predicting DISS-HTER, DISS-LC-W2, DISS-LC-P and DISS-LC-M.
6.3 Assimilation Labels: Reading Comprehension Tests
One way to assess machine translated documents is by asking questions about these doc-uments to humans. Reading comprehension questions aim at evaluating to what extent ahuman understands a given text. For that, the text does not need to be perfectly written, butits meaning must be understandable. Assuming that a group of fully literate speakers of agiven language are able to answer questions regarding a given document, success or failurein the answers can be used to assess the quality of documents themselves. In MT evaluation,machine translated documents can be indirectly assessed by asking humans to answer readingcomprehension questions about these documents (Jones et al., 2005b,a; Berka, Cerný, andBojar, 2011).
Reading comprehension questions can vary in form and complexity. Day and Park (2005)classify questions according to two dimensions: question forms and type of comprehension.Question forms define the kind of answer a question require (e.g. yes/no, multiple choice,wh-question). The type of comprehension is related to the effort required by the test takerin order to answer a question. Questions are then classified as “literal”, “reorganization”,“inference”, “prediction”, “evaluation” or “personal response”.
Our experiments focus on two different corpora with reading comprehension questions:CREG and MCtest. CREG (Ott, Ziai, and Meurers, 2012) is a reading comprehension corpusfor second language learners of German created with the aim of building and evaluatingsystems that automatically correct answers to questions. The texts were selected and thequestions manually created by experts in the area of second language learner proficiencyassessment. The corpus includes open questions that can be classified as “literal”, “reorgani-

132 New Quality Labels for Document-level QE
zation” or “inference” (Section 6.3.1). We use CREG-mt-eval, a version of CREG that wemachine translated (Scarton and Specia, 2016). In this corpus, the questions are open andhave different levels of complexity. Quality labels are derived by combining the marking ofthe questions answered by volunteers and information about question complexity. QE is thenmodelled as a regression task, as the quality scores per document vary following a continuousdistribution. MCtest7 (Richardson, Burges, and Renshaw, 2013) is a reading comprehensioncorpus built for benchmarking question answering systems. It contains multiple choicequestions about English documents (Section 6.3.2). The quality labels are thus discrete andQE is approached as a classification task (we call our versions of MCtest, MCtest-mt-eval).
Statistics about the two corpora are summarised in Table 6.10.
Documents Words per document Questions per documentCREG-mt-eval 108 372.38 8.79MCtest-mt-eval 660 208 4
Table 6.10 Number of documents, average number of words and questions per document inCREG-mt-eval and MCtest-mt-eval corpora.
6.3.1 Experiments with CREG-mt-eval Corpus
The CREG-mt-eval corpus contains 108 source (German) documents from CREG withdifferent domains, including literature, news, job adverts, and others (on average 372.38words and 32.52 sentences per document). These original documents were translated intoEnglish using four MT systems: an in-house MOSES system (Koehn et al., 2007), GoogleTranslate8, Bing9 and SYSTRAN.10 Additionally, the corpus contains a version of eachdocument with one sentence translated by each MT system (called ‘mixed’). Finally, weincluded professional human translations of a subset of 36 documents as a control group tocheck whether or not the reading comprehension questions are adequate for the task.
An example of a document and its questions is presented in Table 6.11. A machinetranslation (Google) and a human translation are also presented in this table. It is possible toobserve that, with only the MT output and/or only English knowledge, is very difficult (orimpossible) to answer questions 2, 3 and 4.
The reading comprehension questions from CREG were translated by a professionaltranslator. Questionnaires were generated with six translated documents (and their questions)
7http://research.microsoft.com/en-us/um/redmond/projects/mctest/8http://translate.google.co.uk/9https://www.bing.com/translator/
10http://www.systransoft.com/

6.3 Assimilation Labels: Reading Comprehension Tests 133
Original:Objektbeschreibung einer 15-jährigen WohneinheitAm Ende der Straße umgeben von Einfamilienhäusern erreichen Sie Ihr neues Heim.Von der Eingangstür treten Sie in den oberen Bereich dieser wunderbaren Wohneinheit,die die Eigentümer sehr sorgfältig und mit Liebe zum Detail removiert haben.Im Erdgeschoss befinden sich ein Bad mit Tageslicht, Gäste WC, die Küche und einäußerst geräumiges Wohn/Esszimmer mit faszinierendem Blick auf den gepflegten Garten.Die Treppe hinunter sind ein weiteres Bad mit Dusche - bisher noch nicht benutzt -sowie zwei gleich große Räume, beide mit Blick auf den herrlichen Garten und dasangrenzende Waldgebiet.Die Zimmer in diesem Bereich sind in hochwertigem Laminat ausgelegt.Wenn Sie verkehrsgünstig wohnen möchten und gleichzeitig eine familiäre Umgebungschätzen, ist diese Wohnung für Sie richtig.Questions:1- Für wen ist diese Wohnung ideal?2- Ist die Wohnung in einem Neubau oder einem Altbau?3- Nennen Sie zwei Zimmer im Erdgeschoss.4- Wo ist die Wohnung?5- Wie viele Zimmer gibt es im Keller?MT (Google):Description a 15-year residential unitAt the end of the street surrounded by family houses you reach your new home.From the front door you enter into the upper region of this wonderful residential unit whoremo four very carefully and with attention to detail the owners.Downstairs there is a bathroom with daylight, guest toilet, kitchen and an extremely spaciousliving / dining room with a fascinating view are the landscaped garden.The stairs are a further bathroom with shower - not yet used - and two equally sized rooms,both overlooking the beautiful garden and the adjacent forest.The rooms in this area are designed in high-quality laminate.If you want to stay conveniently and simultaneously appreciate a family environment, thisapartment is right for you.Questions:1- For whom is this apartment ideal?2- Is the apartment in a new building or an old building?3- Name two rooms on the ground floor.4- Where is the apartment?5- How many rooms are in the basement?Human Translation:Property description for a 15-year-old residential unitYour new home is at the end of the street surrounded by single-family homes.When you enter the front door, you find yourself on the upper floor of this wonderful propertywhich the owners have carefully renovated and decorated with much attention to detail.The ground floor has a bathroom with natural light, a guest toilet, the kitchen and a spaciousliving/dining room with a fascinating view of the beautiful garden.Downstairs you will find an additional bathroom with shower (that has not yet been used) andtwo equally large bedrooms overlooking the wonderful garden.The downstairs rooms have high-quality laminate flooring.If you want to enjoy the benefits of a convenient location with a suburbian flair, thisproperty is perfect for you.
Table 6.11 Example of a document in the CREG corpus and its machine translation

134 New Quality Labels for Document-level QE
each. Fluent speakers of English were then asked to answer sets with at least three questionsabout each document. Two versions of the questionnaires were build. The first had thesix translated documents ordered as follows: MOSES, Google, Bing, SYSTRAN, ‘mixed’and human. The second had the six translated documents ordered as: ‘mixed’, SYSTRAN,human, MOSES, Bing and Google. These two versions aim to maximise the number ofdifferent translations in the dataset. Questions about 216 documents (including 36 translatedby a professional translator) were answered by test takers. It is worth noting that this setincludes repetition of source documents, annotated by different users, but no repetitionof target documents (i.e. they were translated by different systems). The questionnaireswere answered using an online form by staff members and students from the University ofSheffield, UK.
The guidelines were similar to those used in reading comprehension tests: we asked thetest takers to answer the questions using only the document provided. The original document(in German) was not given, therefore, test takers were not required to know German, butrather to speak fluent English. They were paid per questionnaire (set) and they were not ableto evaluate the same set twice to prevent them from seeing the same document translated bya different system. Five sets were selected to be annotated five times, each time by a differenttest takers, so that agreement between them could be calculated.
Question Classification
As previously mentioned, the reading comprehension questions are open questions, andthus any answer could be provided by the test takers. Another important detail is thatthese questions have different levels of complexity, meaning that some questions requiremore effort to be answered. Since our aim is to generate quality labels from the answers,information about the questions’ complexity level is important. We therefore manuallyclassified the questions using the classes introduced by Meurers, Ott, and Kopp (2011),focusing on comprehension types (Day and Park, 2005).
Comprehension types: in order to identify the type of comprehension that a questionencodes, one needs to read the text and identify the answer. The types of comprehension ofthe questions in CREG-mt-eval are:
• Literal questions: can be answered directly from the text. They refer to explicitknowledge, such as facts, dates, location, names.

6.3 Assimilation Labels: Reading Comprehension Tests 135
• Reorganisation questions: are also based on literal text understanding, but the testtaker needs to combine information from different parts of the text to answer thesequestions.
• Inference questions: cannot be answered only with explicit information from the textand involve combining literal information with world knowledge.
Question Marking
The most important aspect in the process of generating our document-level quality label isthe correctness of the questions. In order to mark the answers to the questions, we follow thework of Ott, Ziai, and Meurers (2012), where the answers’ classes, based on the gold-standard(target) answer(s), are the following. For each of these classes, we assigned numeric marks(in brackets):
• Correct answer: the answer is a paraphrase of the target or an acceptable answer forthe question (score = 1.0).
• Extra concept: incorrect extra concepts are added to the answer (score = 0.75).
• Missing concept: important concepts of the answer are missing (score = 0.5).
• Blend: mix of extra concepts and missing concepts (score = 0.25).
• Non-answers: the answer is completely incorrect (not related to the target answer)(score = 0.0).
Table 6.12 shows the relative frequency of each marking category.
Grade Mark Frequency (%)Correct 1.00 64.48Extra concept 0.75 51.80Missing concept 0.50 10.47Blend 0.25 59.20Non-answer 0.00 13.95
Table 6.12 Question grades, marks and frequency of the marks in CREG-mt-eval.

136 New Quality Labels for Document-level QE
Test takers agreement
The agreement was calculated by using the Fleiss’ Kappa metric. Alternatively, Spearman’sρ correlation coefficient was also calculated as the average between the ρ figure betweeneach pair of test takers. Table 6.13 show results for Fleiss’ Kappa and Spearman’s ρ for thefive sets.
Scenario 1 Scenario 2Fleiss’ Kappa Spearman’s ρ Fleiss’ Kappa Spearman’s ρ
SET1 0.461 0.318 0.490 0.334SET2 0.269 0.187 0.245 0.102SET3 0.324 0.283 0.193 0.099SET4 0.581 0.577 0.342 0.203SET5 0.328 0.274 0.211 0.110
Table 6.13 Test takers agreement per set.
All sets except SET3 from Scenario 2 show fair or moderate agreement according toFleiss’ Kappa. Spearman’s ρ values are directly proportional to Fleiss. The best agreementis found in SET4 from Scenario 1 (0.581 for Fleiss’ Kappa and 0.577 for Spearman’s ρ) andthe worst in SET3 (0.269 and 0.187 for Fleiss’ Kappa and Spearman’s ρ , respectively).
We conducted further analyses on the data in an attempt to identify why some setsachieved worse results than others. Firstly, we hypothesised that sets with lower agreementfigures could contain more difficult questions or, in other words, more questions classifiedas ‘reorganisation’ and ‘inference’. However, this hypothesis proved false, since SET3(Scenario 2) only has literal questions and SET4 (Scenario 1) has a uniform mix of all typesof questions.
We also computed the correlation between the number of words in a set and its Fleiss’Kappa agreement. Table 6.14 shows the number of words and sentences per set. Thecorrelation as calculated by Spearman’s ρ was −0.60, indicating that when the number ofwords increases, the agreement decreases. However, it is worth noticing that SET3 fromScenario 2, which showed the worst agreement, is not the largest set in terms of words.
Scenario 1 Scenario 2Number of words Number of words
SET1 2221 2230SET2 3110 3152SET3 2390 2391SET4 2090 3937SET5 2286 2343
Table 6.14 Number of words per set.

6.3 Assimilation Labels: Reading Comprehension Tests 137
Table 6.15 shows Fleiss’ Kappa values per document in all sets. Some documents showvery low or no agreement, indicating that humans had problems answering questions forthose documents. Although it would be expected that test takers should perform better whenanswering questions on human translated documents, such documents present low agreementin the majority of the sets (values in bold in Table 6.15).
Scenario 1 Scenario 2SET1 SET2 SET3 SET4 SET5 SET1 SET2 SET3 SET4 SET5
doc 1 0.242 1.000 0.492 0.447 0.541 0.321 −0.071 0.048 0.333 −0.034doc 2 0.301 0.275 0.200 0.207 0.327 0.363 0.176 0.021 0.476 −0.046doc 3 0.644 0.528 0.253 0.254 0.182 0.492 0.242 0.317 0.764 0.135doc 4 0.373 0.107 0.113 0.185 0.231 0.452 0.083 0.294 0.156 0.083doc 5 0.321 −0.010 0.527 0.663 0.063 0.803 0.312 0.439 0.015 0.182doc 6 0.500 0.000 0.040 0.000 0.044 0.417 0.299 0.044 −0.046 0.638
Table 6.15 Test takers Fleiss’ Kappa agreement per document. It is worth noticing thatdocument 1 (doc 1) in SET1 is different from doc 1 in SET2, doc 1 in SET3 and so on.Values in bold highlight values for human translation.
Table 6.16 shows the average agreement per system, considering all machine translateddocuments (12 documents per system in total). This table also shows the quality of the MTsystems in terms of BLEU and the average performance of the test takers in answering thequestions for each system. MOSES is the system that obtained the highest agreement onaverage, followed by Bing. Although SYSTRAN shows the worse inter-annotator agreementand the worse BLEU score, there seems to be no correlation between system quality andagreement among annotators. For instance, the human translations only achieved 0.211 ofagreement, whilst the best agreement score was 0.316. Therefore, since human translationshowed lower agreement among annotators than MOSES, Bing and Google, we hypothesisethat the inter-annotator agreement values is not only attributed to the system’s quality. Instead,the agreements among annotators might be defined by other factors, such as motivation ofannotators, genre of documents, order in which the document appear in the questionnaire,among others.
In addition, the performance of the test takers in answering the questions does not seem tocorrelate with the system performance or with the inter-annotator agreements. As expected,the human translations showed the averaged score of 0.801, followed by SYSTRAN, Mixed,Google, Bing and MOSES. Perhaps the high agreement for MOSES can be explained by thelowest score in performance: the test takers may have had the same problems while answeringquestions for MOSES. However, the low agreement showed by human translations can notbe explained following the same argument, since the performance for human translations
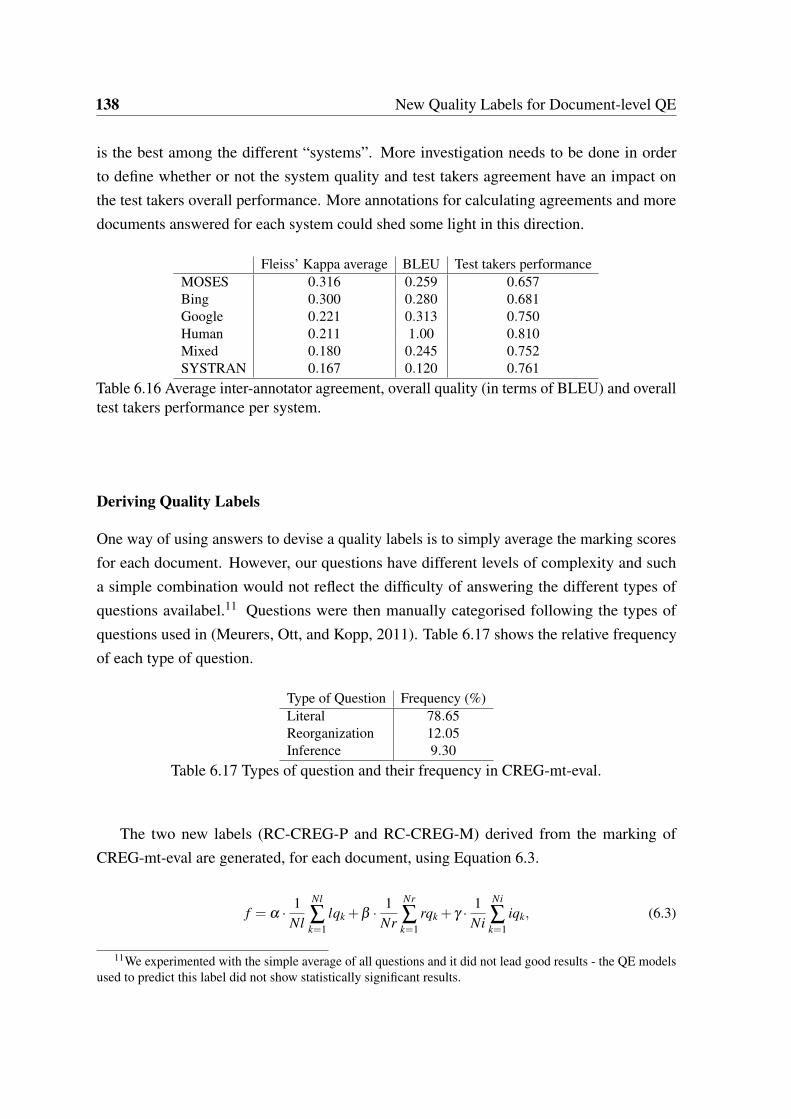
138 New Quality Labels for Document-level QE
is the best among the different “systems”. More investigation needs to be done in orderto define whether or not the system quality and test takers agreement have an impact onthe test takers overall performance. More annotations for calculating agreements and moredocuments answered for each system could shed some light in this direction.
Fleiss’ Kappa average BLEU Test takers performanceMOSES 0.316 0.259 0.657Bing 0.300 0.280 0.681Google 0.221 0.313 0.750Human 0.211 1.00 0.810Mixed 0.180 0.245 0.752SYSTRAN 0.167 0.120 0.761
Table 6.16 Average inter-annotator agreement, overall quality (in terms of BLEU) and overalltest takers performance per system.
Deriving Quality Labels
One way of using answers to devise a quality labels is to simply average the marking scoresfor each document. However, our questions have different levels of complexity and sucha simple combination would not reflect the difficulty of answering the different types ofquestions availabel.11 Questions were then manually categorised following the types ofquestions used in (Meurers, Ott, and Kopp, 2011). Table 6.17 shows the relative frequencyof each type of question.
Type of Question Frequency (%)Literal 78.65Reorganization 12.05Inference 9.30
Table 6.17 Types of question and their frequency in CREG-mt-eval.
The two new labels (RC-CREG-P and RC-CREG-M) derived from the marking ofCREG-mt-eval are generated, for each document, using Equation 6.3.
f = α · 1Nl
Nl
∑k=1
lqk +β · 1Nr
Nr
∑k=1
rqk + γ · 1Ni
Ni
∑k=1
iqk, (6.3)
11We experimented with the simple average of all questions and it did not lead good results - the QE modelsused to predict this label did not show statistically significant results.

6.3 Assimilation Labels: Reading Comprehension Tests 139
where Nl, Nr and Ni are the number of “literal”, “reorganization” and “inference” questions,respectively, lqk, rqk and iqk are real values between 0 and 1, according to the mark ofquestion k, and α , β and γ are weights for the different types of questions.
The weights α , β and γ were optimised following two different approaches. For RC-CREG-P, we use random search (Bergstra and Bengio, 2012), aiming at maximising thePearson r correlation between the QE model and the final true labels. At each iteration, α waschosen randomly, from the range [0.0,1.0). Another random value φ was chosen randomly(also from the range [0.0,1.0)) in order to define β as (1−α) ·φ and γ as (1−α) ·(1−φ). AQE model was trained at each iteration and the Pearson r correlation values were computed.The QE models were trained with QUEST++ baseline features at document level (Specia,Paetzold, and Scarton, 2015). The QE models were trained with the SVR algorithm in thescikit-learn toolkit, with the hyper-parameters (C, γ and ε) optimised via grid search.10-fold cross-validation was applied and the Pearson r scores were the average of all folds.After 1,000 iterations, the weights found were α = 0.614, β = 0.370 and γ = 0.016.
For RC-CREG-M, we use random search and aim to maximise the difference betweenMAEnaive and MAEpredicted . Similarly to the first approach, at each iteration, α was chosenrandomly, from the range [0.0,1.0). Another random value φ was chosen randomly (alsofrom the range [0.0,1.0)) in order to define β as (1−α) ·φ and γ as (1−α) · (1−φ). A QEmodel, trained with the same configuration for RC-CREG-P, was trained at each iteration andthe difference between MAEnaive and MAEpredicted was computed. After 1,000 iterations,the weights found were α = 0.105, β = 0.619 and γ = 0.276.
In RC-CREG-P, the highest weight was given for literal questions (α parameter), whilstin RC-CREG-M, the highest weight was given to reorganization questions (β parameter).Therefore, for RC-CREG-P, simple questions are more problematic: if the test taker couldnot answer these questions properly, the document will be more heavily penalised. On theother hand, for RC-CREG-M, questions with an intermediate difficulty are more problematic.Moreover, for this label, inference questions are also weighted higher than literal questions(the parameter γ is higher than α). This means that in RC-CREG-M, difficult questions aremore important in generating the label than literal questions.
Table 6.18 shows the statistic dispersion and central tendency metrics for RC-CREG-Pand RC-CREG-M. Values for IQR are slightly higher than the values shown for BLEU,TER and METEOR in Section 5.5 and the values for the dissemination labels (Table 6.9).However, this is a completely different task and data and, therefore, it is not possible tocompare these results in a fair manner.

140 New Quality Labels for Document-level QE
MIN MAX MEAN STDEV Q1 MEDIAN Q3 IQRRC-CREG-P 0.167 0.833 0.571 0.155 0.459 0.583 0.685 0.226RC-CREG-M 0.167 0.833 0.542 0.165 0.442 0.541 0.667 0.225
Table 6.18 Statistic dispersion and central tendency metrics for RC-CREG-P and RC-CREG-M.
QE Experiments and Results
Features In the experiments reported in this section we used the following feature sets:QUEST-17, QUEST-ALL, QUEST-17+SHALLOW, QUEST-ALL+SHALLOW, QUEST-17+WE and ALL. CONSENSUS features were not used in this experiment since the humantranslations were also mixed into the data set and we only have 36 human translated docu-ments. DEEP features were also not available since the source language is German.
Method SVR and GP are used to generate the QE models. As for the dissemination labels,SVR models were also used to optimise some of the new labels. We expect to alleviate thisbias by showing experiments with GP models as well as SVR models. Therefore, we cancompare the results and understand the bias (if it exists).
We compare the models trained to predict RC-CREG-P and RC-CREG-M against thosetrained on automatic MT evaluation metrics as labels. Ideally, in order to show that our newlabel is more reliable than automatic metrics, human translated data would need to be usedas reference for the automatic metrics. However, as mentioned before, only 36 documentsfrom the CREG-mt-eval corpus are human translated. In order to build models for BLEU,TER and METEOR for comparison purposes, we sample data from a different corpus withthe same language pair.
This corpus was extracted from the WMT 2008-2013 translation shared task corpora forDE-EN, and totals 474 documents (the same data used in Section 5.3). Although the datasetsare different, our hypothesis is that they are comparable, given that the CREG-mt-eval corpusalso contains news data.
We perform 10-fold cross-validation with both CREG-mt-eval and WMT corpora. Cross-validation was preferred over dividing the corpus into training and test sets, because thisway we can study both corpora without the need of extra data manipulation. Moreover,CREG-mt-eval has a small number of documents, which could lead to overfiting. Resultsin terms of Pearson r correlation are shown in Table 6.19 (correlation scores are averagedover the 10-fold cross-validation iterations). Both RC-CREG labels achieved the highestcorrelation scores with models built using QUEST-17 and GP when compared to BLEU-style

6.3 Assimilation Labels: Reading Comprehension Tests 141
metrics. However, the use of SHALLOW features did not appear to help in predicting the newlabels. QUEST-17+WE features, on the other hand, obtained higher correlation scores, beingthe best for RC-CREG-P. Although models built with the ALL feature set predicting BLEU,TER, METEOR showed higher correlation scores than the best models for our new labels,such results cannot be interpreted as a drawback of our labels. The new labels proposedfocus on a different task and use different data than the one used for predicting the automaticevaluation metrics.
BLEU TER METEOR RC-CREG-P RC-CREG-MSVR GP SVR GP SVR GP SVR GP SVR GP
QUEST-17 0.254 0.266 0.253 0.286 0.286 0.237 0.209 0.342 0.267 0.343QUEST-ALL 0.360 0.367 0.422 0.408 0.340 0.358 0.160 0.350 0.202 0.385QUEST-17+SHALLOW 0.283 0.333 0.281 0.346 0.341 0.321 0.279 0.307 0.118 0.247QUEST-ALL+SHALLOW 0.385 0.387 0.437 0.435 0.433 0.381 0.239 0.318 0.243 0.344QUEST-17+WE 0.447 0.449 0.561 0.566 0.295 0.376 0.476 0.455 0.304 0.378ALL 0.490 0.493 0.613 0.639 0.507 0.507 0.288 0.352 0.301 0.380
Table 6.19 Results in terms of Pearson r correlation of the models predicting the new RC-CREG labels and BLEU, TER and METEOR in the reference corpus. * indicates results thatdid not show significant Pearson r correlation with p-value < 0.05. The best systems arehighlighted in bold (William’s significance test with p-value < 0.05).
Figure 6.6 shows the performance gain of predicting BLEU, TER, METEOR, RC-CREG-P and RC-CREG-M. Although automatic evaluation metrics produced higher performancegains, the new labels also consistently yielded performance gains when QUEST-17, QUEST-ALL, WE and ALL features are used. For SHALLOW features, only small gains wereachieved.
Finally, it is worth remembering that the WMT and CREG-mt-eval datasets are differentand the results were just put together in order for us to have a reference for automaticevaluation metrics. Therefore, the results over WMT data should not be taken as an irrefutableevidence that such labels are better than ours. In fact, since our data suffers from high variance,we could argue that our labels are more reliable in distinguishing between documents. Insummary, the use of marking from open questions as quality labels for QE of MT stillneeds further investigation. In terms of quality assessment, reading comprehension testsare reliable because they reflect the understanding and usefulness of a document for theend-users. However, the best way of devising labels for QE is still an open question.
Another issue with this corpus in particular is that the questions were developed forgeneral purpose evaluation of the original documents. In this case, one side effect is thatthe parts of the documents needed to answer such questions may not be affected by themachine translation, which could mean that a very bad machine translation could still be
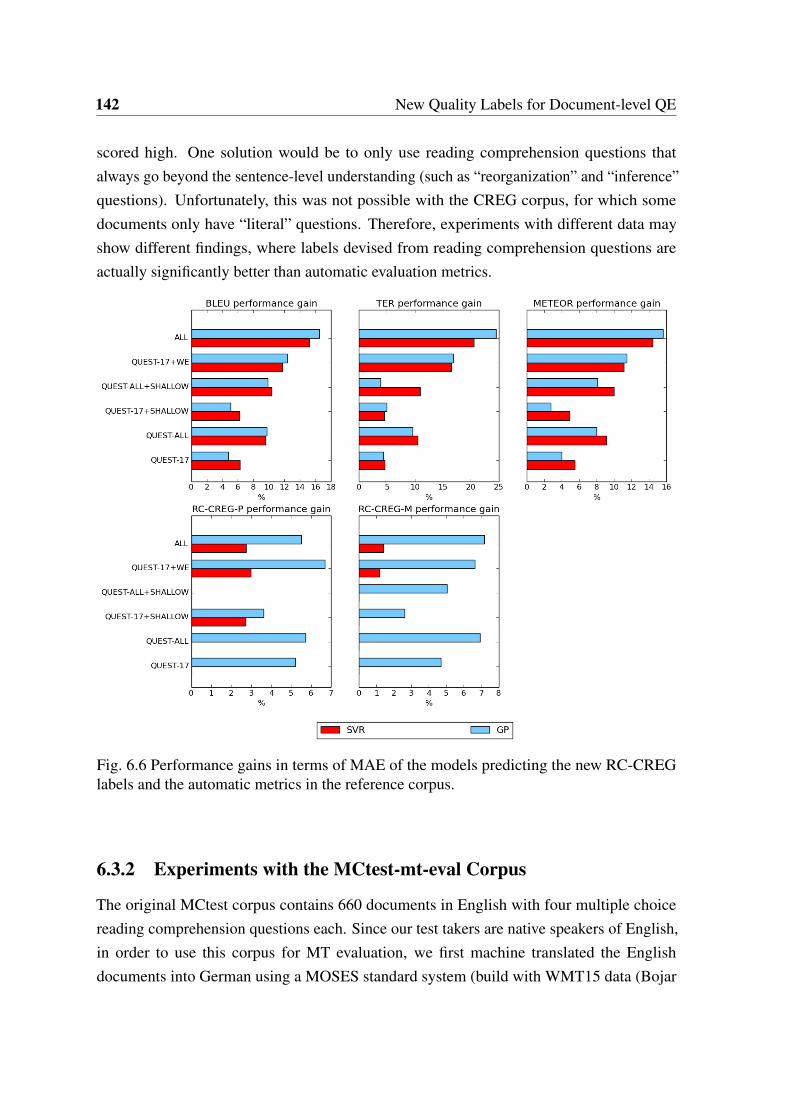
142 New Quality Labels for Document-level QE
scored high. One solution would be to only use reading comprehension questions thatalways go beyond the sentence-level understanding (such as “reorganization” and “inference”questions). Unfortunately, this was not possible with the CREG corpus, for which somedocuments only have “literal” questions. Therefore, experiments with different data mayshow different findings, where labels devised from reading comprehension questions areactually significantly better than automatic evaluation metrics.
Fig. 6.6 Performance gains in terms of MAE of the models predicting the new RC-CREGlabels and the automatic metrics in the reference corpus.
6.3.2 Experiments with the MCtest-mt-eval Corpus
The original MCtest corpus contains 660 documents in English with four multiple choicereading comprehension questions each. Since our test takers are native speakers of English,in order to use this corpus for MT evaluation, we first machine translated the Englishdocuments into German using a MOSES standard system (build with WMT15 data (Bojar

6.3 Assimilation Labels: Reading Comprehension Tests 143
et al., 2015)), and then machine translated the German documents back into English. For theback translation we used a different MT system (BING translator) in order to maximise thechances of introducing translation errors of different types.
Questionnaires were built and test takers answered questions about one machine translateddocument and one (different) original document. Original documents were given to testtakers as a control group. Since all questions are of the multiple choice type, the markingwas done automatically and each answer was either marked as correct (1 mark) or incorrect(0 marks) (the processed MCtest corpus is called MCtest-mt-eval).
Deriving Quality Labels
The marks for a document vary between 0 (no questions answered correctly) and 4 (4questions answered correctly). Given that all questions are considered equally complex inthis corpus, no weights on questions were necessary. Figure 6.7(a) shows the distribution ofcorrect answers in original documents versus machine translated documents. As expected,for original documents there is a higher frequency of documents with all questions answeredcorrectly (4 marks) than for machine translated documents: 84% of original documents haveall questions correctly answered, while only 52% of machine translated documents have allquestions answered correctly.
Fig. 6.7 Distribution of correct answers in original and machine translated documents in theMCtest corpus.
These marks are used directly as quality labels (this label is referred to hereafter asRC-MCtest). However, since there are only a few documents scoring 0 or 1, we combinedthese two classes with class 2. Therefore, we propose an approach with three options of
144 New Quality Labels for Document-level QE
marking: 0, 1 and 2. The distribution of original and machine translated documents usingthese three classes is shown in Figure 6.7(b).
QE Experiments and Results
Features In the experiments reported in this section we used the following feature sets:QUEST-17, QUEST-ALL, QUEST-17+SHALLOW, QUEST-ALL+SHALLOW, QUEST-17+DEEP, QUEST-ALL+DEEP, QUEST-ALL+SHALLOW+DEEP, QUEST-17+WE andALL. CONSENSUS features were not used in this experiment since we did not have manyof the machine translations necessary. DEEP features were calculated by using the originaldocuments in English.
Method Since the quality labels follow a discrete distribution, we addressed the prob-lem as a classification task, instead of using regression. Two classification models wereused: Random Forest and Ordinal Logistic. We use the Random Forest algorithm fromscikit-learn and an Ordinal Logistic model from the mord toolkit12 (Pedregosa-Izquierdo,2015). Random Forests treat the problem as a multiclass classification task where the classesdo not follow any order, while the Ordinal Logistic model is able to take the order of theclasses into account. The Ordinal Logistic implementation follows the model proposed in(Rennie and Srebro, 2005). Since the labels have an order, ordinal classification is expectedto be the most suitable approach.13
Data Here we used the official training, development and test set provided in the originalcorpus, with the development and training sets concatenated. The final training set has 450documents, while the test set has 210 documents.
Baseline As a baseline, we use the majority class (MC) classifier (all test instances areclassified as having the majority class in the training set).
Evaluation Precision, recall and F-measure are used to evaluate the performance of theQE models.
Table 6.20 shows the results, in terms of precision (P), recall (R) and F-measure (F),for the MCtest classification task using the three classes structure. Best results in terms of
12http://pythonhosted.org/mord/13Although we also experimented with SVM classifiers (using the implementation from scikit-learn),
they were outperformed by Random Forests and, therefore, we did not report their results.
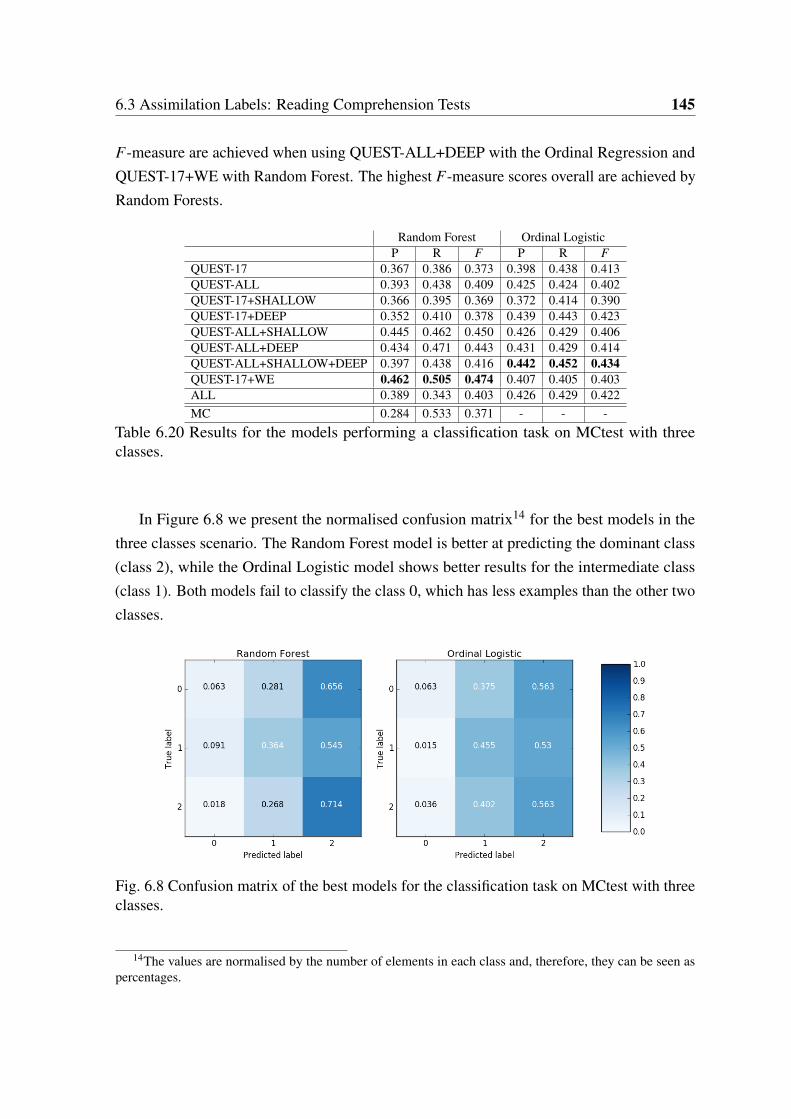
6.3 Assimilation Labels: Reading Comprehension Tests 145
F-measure are achieved when using QUEST-ALL+DEEP with the Ordinal Regression andQUEST-17+WE with Random Forest. The highest F-measure scores overall are achieved byRandom Forests.
Random Forest Ordinal LogisticP R F P R F
QUEST-17 0.367 0.386 0.373 0.398 0.438 0.413QUEST-ALL 0.393 0.438 0.409 0.425 0.424 0.402QUEST-17+SHALLOW 0.366 0.395 0.369 0.372 0.414 0.390QUEST-17+DEEP 0.352 0.410 0.378 0.439 0.443 0.423QUEST-ALL+SHALLOW 0.445 0.462 0.450 0.426 0.429 0.406QUEST-ALL+DEEP 0.434 0.471 0.443 0.431 0.429 0.414QUEST-ALL+SHALLOW+DEEP 0.397 0.438 0.416 0.442 0.452 0.434QUEST-17+WE 0.462 0.505 0.474 0.407 0.405 0.403ALL 0.389 0.343 0.403 0.426 0.429 0.422MC 0.284 0.533 0.371 - - -
Table 6.20 Results for the models performing a classification task on MCtest with threeclasses.
In Figure 6.8 we present the normalised confusion matrix14 for the best models in thethree classes scenario. The Random Forest model is better at predicting the dominant class(class 2), while the Ordinal Logistic model shows better results for the intermediate class(class 1). Both models fail to classify the class 0, which has less examples than the other twoclasses.
Fig. 6.8 Confusion matrix of the best models for the classification task on MCtest with threeclasses.
14The values are normalised by the number of elements in each class and, therefore, they can be seen aspercentages.

146 New Quality Labels for Document-level QE
Table 6.21 shows the results for the classification task using five classes. The best resultoverall is achieved by the model built with Random Forests and QUEST-ALL+DEEP featureset. The best result for Ordinal Logistic was achieved when using the ALL feature set.
Five classesRandom Forest Ordinal Logistic
P R F P R FQUEST-17 0.379 0.414 0.394 0.395 0.443 0.415QUEST-ALL 0.360 0.400 0.371 0.368 0.410 0.385QUEST-17+SHALLOW 0.433 0.452 0.442 0.403 0.443 0.417QUEST-17+DEEP 0.403 0.462 0.422 0.398 0.433 0.410QUEST-ALL+SHALLOW 0.437 0.476 0.447 0.375 0.424 0.397QUEST-ALL+DEEP 0.467 0.524 0.487 0.392 0.438 0.412QUEST-ALL+SHALLOW+DEEP 0.433 0.462 0.442 0.390 0.429 0.371QUEST-17+WE 0.365 0.433 0.396 0.413 0.410 0.411ALL 0.443 0.467 0.440 0.433 0.429 0.428MC 0.284 0.533 0.371 - - -
Table 6.21 Results for the models performing a classification task on MCtest with five classes.
Figure 6.9 shows the normalised confusion matrix for the best models in the five classesscenario. Both models predict the dominant class (4) for the majority of the instances andfail to predict the correct labels for all instances in classes 0 and 1. The Ordinal Logisticmodel shows more variation in predicting the labels than the Random Forest model.
Fig. 6.9 Confusion matrix of the best models for the classification task on MCtest with fiveclasses.
Using the original (untranslated) documents in the control group mentioned previously,the majority class would result in an F-measure of 0.764. This value is considerably higherthan 0.487 or 0.474, which were found for the machine translated dataset (using five and

6.4 Discussion 147
three classes respectively), indicating that the errors in our machine translated them madedocuments much more difficult to comprehend.
6.4 Discussion
In this chapter we presented our contribution in creating new quality labels for document-level QE. Our new labels are task-oriented and human-targeted and aim to assess documentsmore reliably than traditional MT evaluation metrics.
Section 6.1 featured our first experiments towards new quality labels for document-level QE. We showed that direct human assessments in terms of cohesion and coherenceat document level did not lead to a reliable evaluation. For the majority of the sets, theagreement scores were very low, specially when assessing coherence. Humans were notable to isolate document-level problems and, therefore, the evaluation was unreliable. Thetwo-stage post-editing method was also introduced in this section, with analyses on inter-annotator agreement and types of changes performed. This method showed promising results,with high agreement in the first stage of post-editing. The low agreement in the secondstage is likely to be caused by the differences in the number of stylistic changes revealedby our manual analysis. Experiments in a controlled environment, performed by experttranslators and with guidelines requesting minimal stylistic changes were expected to showmore reliable results. We conclude that the new two-stage post-editing method is more viableand cost-effective than the direct human assessments.
In Section 6.2 we presented our large-scale experiments with the two-stage post-editingmethod aiming at dissemination purposes and compared the new labels with BLEU, TER andMETEOR. Although our new quality labels did not achieve significantly higher data variance,models built with discourse-aware features for predicting such labels showed significantbetter performance than models built with baseline features. Whilst the automatic metricsdid not produce reliable models (in terms of Pearson’s r correlation) for the majority ofthe cases, the models built for the new labels consistently obtained significant Pearson’s r
correlation scores. Moreover, models built with discourse-aware features performed bestfor our new labels, but not for the automatic metrics. Therefore, using document-aware anddiscourse-aware features we were able to build reliable models for predicting our new labels.This is an evidence that our new labels are able to capture the document-wide issues that areaddressed by our new features.
Section 6.3 presented our experiments for assimilation purposes using reading com-prehension tests scores as a proxy for document quality. Two corpora were used and the

148 New Quality Labels for Document-level QE
problem was approached as a classification (for multiple choice questions - MCtest) and aregression (for open questions - RC-CREG). For the RC-CREG labels, our regression modelsdid not show higher correlation scores than models built for a reference corpus predictingBLEU, TER or METEOR. However a direct comparison between the two datasets is notpossible, since the datasets are considerably different. Models predicting RC-CREG builtwith document-wide information showed moderate correlation with true labels. In addition,RC-CREG labels showed higher data variation than automatic evaluation metrics and, there-fore, we can say that documents can be more easily distinguished with this label. This meansthat the new labels are also capturing some document-aware information. For MCtest labels,the best results were achieved by models built with document and discourse-aware features.Approaching the problem as a three-class task seemed to be the most reliable approach,given the labels distribution, although the best model (in terms of F-measure) was builtfor the five class scenario. Finally, the original and machine translated versions in MCtestwere assessed according to their reading comprehension scores. We proved that machinetranslated documents are more difficult to comprehended than original documents. Thus,results showed that discourse-aware features perform well in this scenario. This means thatMT is likely to be compromising the integrity of discourse structures necessary for documentcomprehension.
In summary, this chapter confirmed our hypothesis that task-based document-orientedevaluations of machine translated documents tend to be more reliable than automatic evalua-tion metrics. Models built with document and discourse-aware features were only competitivewhen predicting the new task-based labels proposed in this thesis. Moreover, task-basedevaluation methods are more desired over general evaluation metrics because they provide areliable assessment of the machine translated documents in terms of usefulness.

Chapter 7
Conclusions
This thesis presented our contributions for document-level QE in terms of feature engineering,quality labels and prediction models. Our literature review revealed a scarcity in previouswork on document-level QE (Chapter 2). We also showed that recent work has focused onlinguistic features for QE and promising results have been achieved for word and sentence-level tasks. Moreover, the literature review also evidenced the lack of studies in task-basedassessments aimed at document-level QE. Task-based assessments are easy to interpret anddesirable in order to evaluate MT output for a given purpose.
In our literature review we also discussed the use of document-aware information inMT, focusing on the use of discourse information (Chapter 3). Previous work on the use ofdiscourse for improving MT, MT evaluation and QE motivated our discourse-aware featuresfor document-level QE. Although such studies did not show substantial improvements overbaselines, it is important to note the evaluation methodology used. The majority of work onMT is evaluated in terms of BLEU-style metrics, therefore, small but important changes indiscourse may not be reflected in this type of evaluation. The study and application of newdiscourse-aware methods for MT are a challenge yet to be faced.
We introduced a new set of document and discourse-aware features designed for document-level QE (Chapter 4). Document-aware features encompass simple counts and aggregation ofsentence-level features. Discourse-aware features use document-wide discourse information.We analysed the correlation of our new features and HTER, showing that discourse-awarefeatures show correlation scores higher than the majority of document-aware features usedas baselines. In our feature analysis we also show the potential of extracting discourse-awarefeatures from the target documents, although the resources with discourse information arelimited in this case. Finally, we also introduce the concept of consensus features basedon pseudo-references. The consensus hypothesis is that if several MT systems output the

150 Conclusions
same translation, it is likely that such translation is correct. Although pseudo-references and,consequently, consensus achieved good results in previous work, such features should beused with caution. Pseudo-references are an unreliable and unavailable in realistic scenariosand, therefore, should be avoided.
Our new features were exhaustively explored in different datasets with different languagepairs and machine translations (Chapter 5). We built document-level QE models with BLEU,TER and METEOR as quality labels for all datasets, with the LIG dataset also includingHTER as quality labels. The performance of the QE models varied a lot across differentdatasets and language pairs. In fact, it was not possible to conclusively decide on whichare the best ML techniques and feature sets. We also presented a discussion about the useof automatic evaluation metrics as quality labels for the document-level QE task. We showthat there is no consensus on the data variation (for some datasets this variation was low,whilst for others it was considerably high). Therefore, it seems that automatic metrics are notreliable in assessing individual documents.
Finally, we proposed new methods for acquiring and devising new task-based document-aware quality labels for document-level QE (Chapter 6). Our first set of labels aimed toevaluate MT for dissemination purposes and used a two-stage post-editing method. Suchmethod focused on isolating document-level problems from issues at other levels. New labelswere devised through a linear combination of the different stages in post-editing. We showedthat models built with discourse-aware features performed better when predicting the newlabels when compared with predictions for BLEU, TER and METEOR. However, the datavariation of the new labels was as low as the automatic evaluation metrics. Our hypothesis isthat the new labels follow the data variation of HTER, given that they are derived from it,although they are able to assess documents in terms of document and discourse-aware issues.
The second set of labels we proposed were based on reading comprehension tests,focusing on MT for assimilation purposes. Reading comprehension tests about machinetranslated documents were answered by fluent speakers of the target language. The newlabels were devised from the test markings. For RC-CREG, since the questions wereopen, the marking followed a continuous scale and, for MC-test, since the questions weremultiple choice, the marking was done using a discrete scale. We approached RC-CREGas a regression task and MC-test as a classification task. Models predicting RC-CREGlabels did not obtain high correlation scores and, moreover, such scores were not higherthan the models predicting BLEU, TER or METEOR for a reference corpus. However, thedifferences between the two corpora may have benefited the reference corpus and, therefore,they are not directly comparable. Moreover, RC-CREG labels showed a high data variation,

7.1 Future Work 151
which may be a sign that documents were distinctly assessed. For MC-test, models usingdiscourse-aware features show good performance overall.
Our study on different ML techniques also did not show a clear tendency. Both SVRand GP achieved good results, which were highly dependent on the dataset used. Moreover,using different kernels for different sets of features did not achieve significant improvementsover using a single kernel. Therefore, the contributions on this matter are unclear and moreanalysis needs to be done.
Despite our efforts, there are still open questions to be addressed for document-levelQE. This is quite a new area of study and much more still needs to be done in terms of dataanalysis, features, labels and ML techniques. However, we expect that the findings providedin thesis will be used as a foundation for future work.
Document-level QE seems to be a viable task, although it is still unclear how to reliablyassess documents. Given the low data variation presented by automatic evaluation metricsand our labels, perhaps the focus of document-level QE should be different. Instead offocusing on predicting the quality of an entire machine translated document directly, the taskcould focus on stages after some corrections or predictions were already performed. Forexample, document-level QE could be applied over a post-edited document, to guaranteethat consistency and discourse are preserved. In this case, fine-grained problems would bealready solved, making the domain of document-level QE more restricted.
Finally, a lesson learnt from this thesis is that quality labels should be deeply investigatedand new alternatives should always be considered. The majority of the work in the QE area(for all levels) assumes that some quality labels (e.g. HTER) are ideal and base their results(in terms of feature engineering and/or ML model design) on the performance of models overthese labels. However, more work investigating what such labels are capturing and whetheror not they are adequate for a given task is still needed.
7.1 Future Work
Future work in document-level QE includes research on data acquisition, quality labels,feature engineering, ML, improving MT with QE and applying QE for task other than MT.
• Data variety: Data is known to be a problem for QE tasks. Since there is a need oflabelled data, it is very difficult to acquire such data in large quantities and with thedesired quality. Moreover, it is also known that QE models may differ for differentdomains. Therefore, there is an urgent need in acquiring data for document-level QEin order for us progress in this field.

152 Conclusions
• Quality labels: Although we introduce a first attempt in devising new task-baseddocument-aware quality labels, this task is still a challenge. More studies in this topicare needed in order for us to clearly point out the best way of assessing documentsfor QE. For example, post-editing time could be a next quality label to be exploredfor the task. Another directions would be to explore the fact that sentences havedifferent degrees of relevance inside a document. Therefore, the document qualitycould encompass the quality of sentences and their relevance. The hypothesis is that ifsentences that are not very relevant for the understanding of the document show lowerquality, this is less critical than a sentence with high relevance that has low quality.
• Feature engineering: With the acquisition of new data and new quality labels, morework on feature engineering will be needed. New data will bring new peculiaritiesto be explored that may be not addressed by the current features. Moreover, if largedatasets are available with reliable quality labels, studies can be conducted in order toidentify state-of-the-art features for the task. Features related to relevance of sentencescan also be explored for scenarios where relevance is taken into account.
• Deep learning approaches: With the advent of new deep learning techniques that areable to extract information beyond words and sentences (e.g. Kenter, Borisov, andRijke (2016)), QE at document level may evolve. Potentially the feature engineeringstep will no longer be needed and the focus will be on neural network architecturesand their ability to learn different types of labels.
• ML models: Although the majority of work on QE uses previously developed and well-known ML techniques (e.g. SVM), there is a lack of studies on ML techniques speciallydesigned and or modified for QE. There is no study of this kind for document-level QE.Another interesting topic is multi-level prediction, which could be approached in twoways: (i) using the predictions of fine-grained levels as features for document-levelQE (e.g. Specia, Paetzold, and Scarton (2015)) or; (ii) using hierarchical modelsthat consider the document as combination of fine-grained structures (e.g. Lin et al.(2015)).
• Other NLP tasks: The research presented in this thesis focused exclusively indocument-level QE for MT. However, other NLP tasks could also benefit from ourfindings. For example, it is also a challenge to evaluate the results of Automatic Sum-marization and Text Simplification tasks, and QE approaches might be also interestingfor them. Mainly for AS, where it important is to evaluate the entire document.
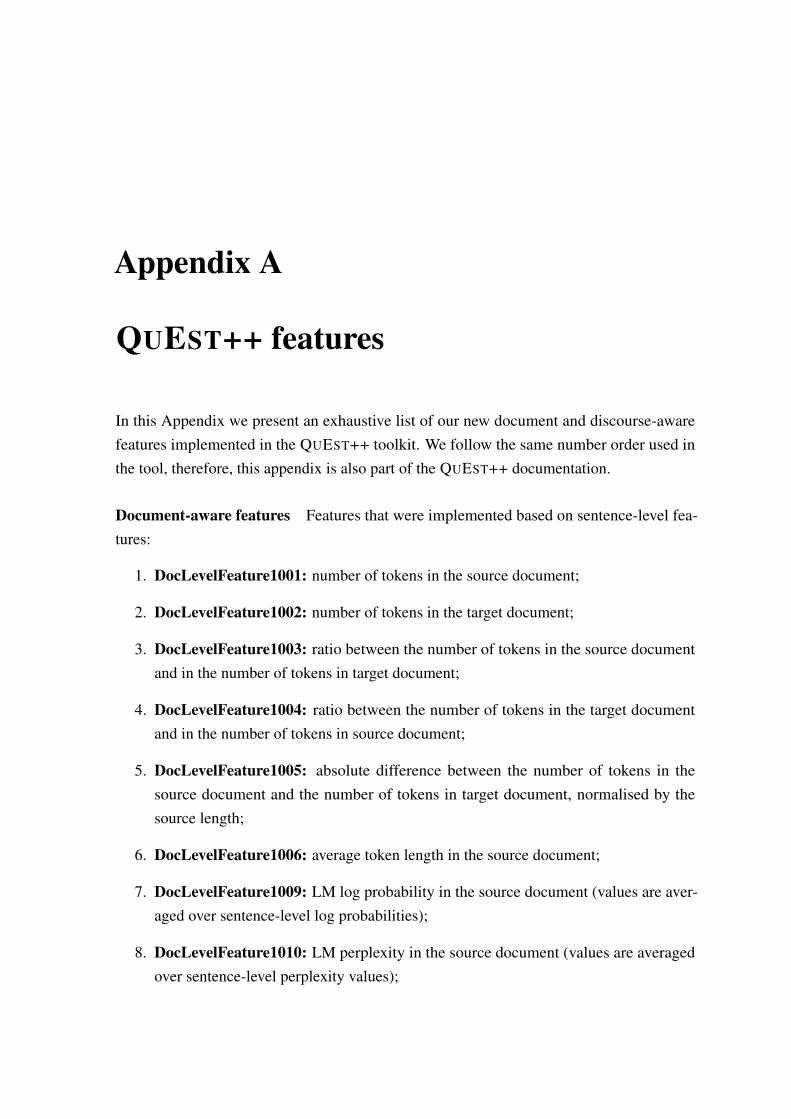
Appendix A
QUEST++ features
In this Appendix we present an exhaustive list of our new document and discourse-awarefeatures implemented in the QUEST++ toolkit. We follow the same number order used inthe tool, therefore, this appendix is also part of the QUEST++ documentation.
Document-aware features Features that were implemented based on sentence-level fea-tures:
1. DocLevelFeature1001: number of tokens in the source document;
2. DocLevelFeature1002: number of tokens in the target document;
3. DocLevelFeature1003: ratio between the number of tokens in the source documentand in the number of tokens in target document;
4. DocLevelFeature1004: ratio between the number of tokens in the target documentand in the number of tokens in source document;
5. DocLevelFeature1005: absolute difference between the number of tokens in thesource document and the number of tokens in target document, normalised by thesource length;
6. DocLevelFeature1006: average token length in the source document;
7. DocLevelFeature1009: LM log probability in the source document (values are aver-aged over sentence-level log probabilities);
8. DocLevelFeature1010: LM perplexity in the source document (values are averagedover sentence-level perplexity values);

154 QUEST++ features
9. DocLevelFeature1011: LM perplexity in the source document without end of sen-tence markers (values are averaged over sentence-level perplexity values);
10. DocLevelFeature1012: LM log probability in the target document (values are aver-aged over sentence-level log probabilities);
11. DocLevelFeature1013: LM perplexity in the target document (values are averagedover sentence-level perplexity values);
12. DocLevelFeature1014: LM perplexity in the target document without end of sentencemarkers (values are averaged over sentence-level perplexity values);
13. DocLevelFeature1015: Type/token ration for the target document;
14. DocLevelFeature1016: average number of translations per source word in the sourcedocument (threshold in Giza: prob > 0.01);
15. DocLevelFeature1018: average number of translations per source word in the sourcedocument (threshold in Giza: prob > 0.05);
16. DocLevelFeature1020: average number of translations per source word in the sourcedocument (threshold in Giza: prob > 0.10);
17. DocLevelFeature1022: average number of translations per source word in the sourcedocument (threshold in Giza: prob > 0.20);
18. DocLevelFeature1024: average number of translations per source word in the sourcedocument (threshold in Giza: prob > 0.50);
19. DocLevelFeature1026: average number of translations per source word in the sourcedocument (threshold in Giza: prob > 0.01) weighted by the frequency of each word inthe source corpus;
20. DocLevelFeature1028: average number of translations per source word in the sourcedocument (threshold in Giza: prob > 0.05) weighted by the frequency of each word inthe source corpus;
21. DocLevelFeature1030: average number of translations per source word in the sourcedocument (threshold in Giza: prob > 0.10) weighted by the frequency of each word inthe source corpus;

155
22. DocLevelFeature1032: average number of translations per source word in the sourcedocument (threshold in Giza: prob > 0.20) weighted by the frequency of each word inthe source corpus;
23. DocLevelFeature1034: average number of translations per source word in the sourcedocument (threshold in Giza: prob > 0.50) weighted by the frequency of each word inthe source corpus;
24. DocLevelFeature1036: average number of translations per source word in the sourcedocument (threshold in Giza: prob > 0.01) weighted by the inverse of the frequencyof each word in the source corpus;
25. DocLevelFeature1038: average number of translations per source word in the sourcedocument (threshold in Giza: prob > 0.05) weighted by the inverse of the frequencyof each word in the source corpus;
26. DocLevelFeature1040: average number of translations per source word in the sourcedocument (threshold in Giza: prob > 0.10) weighted by the inverse of the frequencyof each word in the source corpus;
27. DocLevelFeature1042: average number of translations per source word in the sourcedocument (threshold in Giza: prob > 0.20) weighted by the inverse of the frequencyof each word in the source corpus;
28. DocLevelFeature1044: average number of translations per source word in the sourcedocument (threshold in Giza: prob > 0.50) weighted by the inverse of the frequencyof each word in the source corpus;
29. DocLevelFeature1046: average unigram frequency in 1st quartile of frequency in thecorpus of the source document;
30. DocLevelFeature1047: average unigram frequency in 2nd quartile of frequency inthe corpus of the source document;
31. DocLevelFeature1048: average unigram frequency in 3rd quartile of frequency in thecorpus of the source document;
32. DocLevelFeature1049: average unigram frequency in 4th quartile of frequency in thecorpus of the source document;

156 QUEST++ features
33. DocLevelFeature1050: average bigram frequency in 1st quartile of frequency in thecorpus of the source document;
34. DocLevelFeature1051: average bigram frequency in 2nd quartile of frequency in thecorpus of the source document;
35. DocLevelFeature1052: average bigram frequency in 3rd quartile of frequency in thecorpus of the source document;
36. DocLevelFeature1053: average bigram frequency in 4th quartile of frequency in thecorpus of the source document;
37. DocLevelFeature1054: average trigram frequency in 1st quartile of frequency in thecorpus of the source document;
38. DocLevelFeature1055: average trigram frequency in 2nd quartile of frequency in thecorpus of the source document;
39. DocLevelFeature1056: average trigram frequency in 3rd quartile of frequency in thecorpus of the source document;
40. DocLevelFeature1057: average trigram frequency in 4th quartile of frequency in thecorpus of the source document;
41. DocLevelFeature1058: percentage of distinct unigrams seen in the corpus source (inall quartiles);
42. DocLevelFeature1059: percentage of distinct bigrams seen in the corpus source (inall quartiles);
43. DocLevelFeature1060: percentage of distinct trigrams seen in the corpus source (inall quartiles);
44. DocLevelFeature1061: average word frequency of the source document;
45. DocLevelFeature1074: percentage of punctuation marks in source document;
46. DocLevelFeature1075: percentage of punctuation marks in target document;
47. DocLevelFeature1083: percentage of content words in the target document;
48. DocLevelFeature1084: percentage of content words in the source document;

157
49. DocLevelFeature1085: ratio of the percentage of content words in the source docu-ment and the percentage of content words in the target documents;
50. DocLevelFeature1086: LM log probability of POS of the target document (values areaveraged over sentence-level log probabilities values);
51. DocLevelFeature1087: LM perplexity of POS of the target document (values areaveraged over sentence-level perplexity values);
52. DocLevelFeature1088: percentage of nouns in the source document;
53. DocLevelFeature1089: percentage of verbs in the source document;
54. DocLevelFeature1090: percentage of nouns in the target document;
55. DocLevelFeature1091: percentage of verbs in the target document;
56. DocLevelFeature1092: ratio of the percentage of nouns in the source document andthe percentage of nouns in target document;
57. DocLevelFeature1093: ratio of the percentage of verbs in the source document andthe percentage of nouns in target document;
58. DocLevelFeature1300: the Kullback-Leibler divergence between a source documentand a target document topic distribution;
59. DocLevelFeature1301: the Jensen-Shannon divergence between a source documentand a target document topic distribution;
60. DocLevelFeature9300: PCFG parse log likelihood of source documents (values areaveraged over sentence-level values);
61. DocLevelFeature9301: average of the PCFG confidence of all possible parse trees inn-best list for the source document (values are averaged over sentence-level values);
62. DocLevelFeature9302: PCFG confidence of best parse tree for the source document(values are averaged over sentence-level values);
63. DocLevelFeature9303: number of possible PCFG parse trees for the source document(values are averaged over sentence-level values);

158 QUEST++ features
64. DocLevelFeature9304: PCFG parse log likelihood of target documents (values areaveraged over sentence-level values);
65. DocLevelFeature9305: average of the PCFG confidence of all possible parse trees inn-best list for the target document (values are averaged over sentence-level values);
66. DocLevelFeature9306: PCFG confidence of best parse tree for the target document(values are averaged over sentence-level values);
67. DocLevelFeature9307: number of possible PCFG parse trees for the target document(values are averaged over sentence-level values);
68. DocLevelFeature9800: number of sentences in the source document;
69. DocLevelFeature9801: number of sentences in the target document;
Discourse-aware features Features that explore word repetition:
1. DocLevelFeature9988: content word repetition in the target document: the numberof words that repeat are normalised by the total number of content words;
2. DocLevelFeature9989: content word lemma repetition in the target document: thenumber of lemmas that repeat are normalised by the total number of content words;
3. DocLevelFeature9990: content word repetition in the source document: the numberof words that repeat are normalised by the total number of content words;
4. DocLevelFeature9991: content word lemma repetition in the source document: thenumber of lemmas that repeat are normalised by the total number of content words;
5. DocLevelFeature9992: ratio of content word repetition between the target and sourcedocuments;
6. DocLevelFeature9993: ratio of content word lemma repetition between the target andsource documents;
7. DocLevelFeature9994: noun repetition in the target document: the number of wordsthat repeat are normalised by the total number of content words;
8. DocLevelFeature9995: noun repetition in the source document: the number of lem-mas that repeat are normalised by the total number of content words;

159
9. DocLevelFeature9996: ratio of noun repetition between the target and source docu-ments;

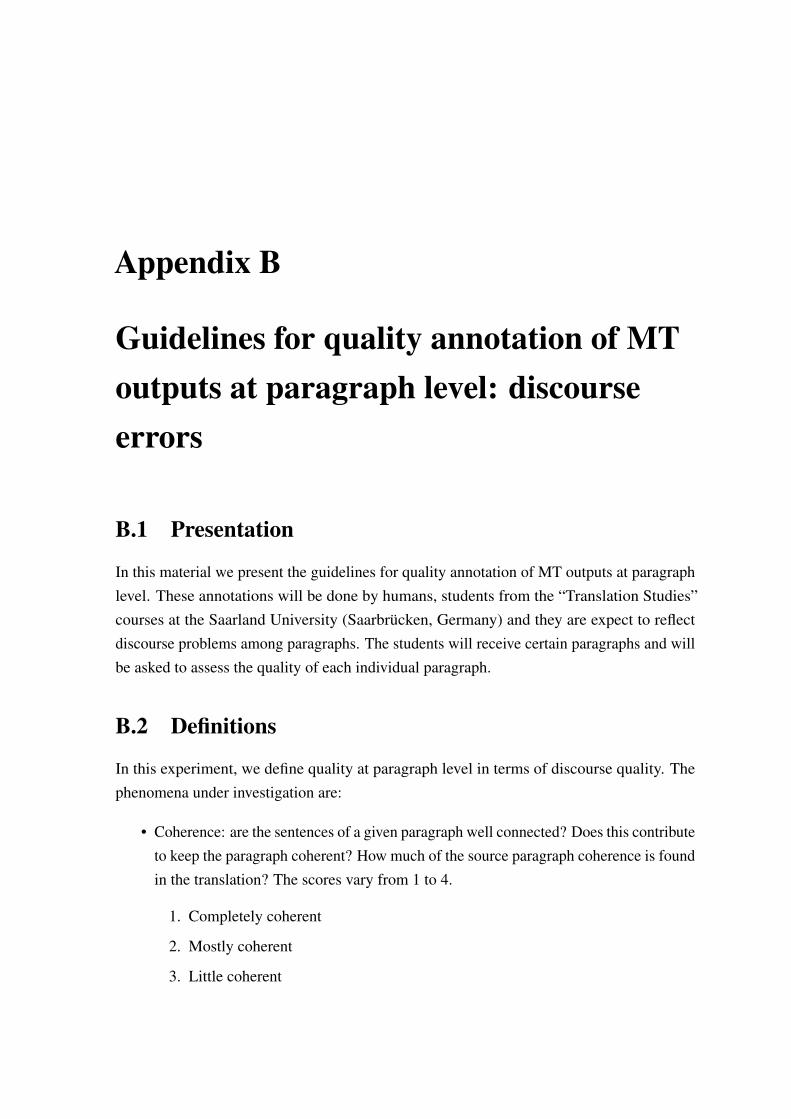
Appendix B
Guidelines for quality annotation of MToutputs at paragraph level: discourseerrors
B.1 Presentation
In this material we present the guidelines for quality annotation of MT outputs at paragraphlevel. These annotations will be done by humans, students from the “Translation Studies”courses at the Saarland University (Saarbrücken, Germany) and they are expect to reflectdiscourse problems among paragraphs. The students will receive certain paragraphs and willbe asked to assess the quality of each individual paragraph.
B.2 Definitions
In this experiment, we define quality at paragraph level in terms of discourse quality. Thephenomena under investigation are:
• Coherence: are the sentences of a given paragraph well connected? Does this contributeto keep the paragraph coherent? How much of the source paragraph coherence is foundin the translation? The scores vary from 1 to 4.
1. Completely coherent
2. Mostly coherent
3. Little coherent

162 Guidelines for quality annotation of MT outputs at paragraph level: discourse errors
4. Non-coherent
• Cohesion: are the cohesive devices correctly translated in a given paragraph? If not,do these errors change the information in the translation? (in other words, is it possibleto interpret the paragraph correctly despite cohesion problems?) How appropriate arethe cohesive devices in the machine translated paragraph? The scores vary from 1 to 4.
1. Flawless (perfect, no errors)
2. Good (minor errors that do not affect the understanding)
3. Dis-fluent (major errors that make communication possible, but make the para-graph dis-fluent)
4. Incomprehensible
The cohesive devices that should be looked for are:
• Reference: evaluate whether personal, demonstrative, possessive, relative, reflexiveand indefinite pronouns are translated correctly and, if not, evaluate if this impacts thecoherence of the paragraph.
• Connectives: evaluate whether connectives of the right category are used: Expansion,Contingency, Comparison, Temporal. The main idea is to evaluate whether the MTsystem choses the right (or the best) translation for a given connective.
• Ellipsis: where there are ellipsis, are they correctly translated?
B.3 Examples
B.3.1 Coherence
The coherence concept is more subjective than cohesion. A text is coherent if the sentencesand paragraphs are connected in a logical way (Stede, 2011). In this activity, you should lookfor clues of disconnected ideas that lead to bad translations. To help you in this task, youwill be provided with the source document. We ask you to first read the source document (inEnglish) to identify the main idea and the connections between the sentences and paragraphs.After that, you are asked to read the machine translation (in German) and evaluate if the mainideas remain or if there are problems in logical structure of the paragraph. These problemscan be signalised by wrong use of cohesive devices or mis-translation of a word or phrase,

B.3 Examples 163
changing the meaning of the paragraph or making it less logical. To explain the diferencesbetween cohesion and coherence, let’s consider an example of paragraph that is coherent andcohesive:1
"My favourite colour is blue. I like it because it is calming and it relaxes me. I often go
outside in the summer and lie on the grass and look into the clear sky when I am stressed.
For this reason, I’d have to say my favourite colour is blue."
This paragraph is coherent because the sentences make sense together (the person likesblue, because it is calm and relaxing). It is also cohesive, since the connections (highlighted)are made. It is also possible to have a cohesive paragraph with no coherence:
"My favourite colour is blue. Blue sports cars go very fast. Driving in this way is
dangerous and can cause many car crashes. I had a car accident once and broke my leg. I
was very sad because I had to miss a holiday in Europe because of the injury."
This paragraphs shows lots of cohesion devices and the sentences are well connected.However, the paragraph makes no sense: it is just a bunch of sentences describing differentthings connected together. Finally, one could also find a coherent paragraph with no cohesion:
"My favourite colour is blue. I’m calm and relaxed. In the summer I lie on the grass and
look up."
As in the first example, this paragraph is showing a statement, a cause and a example,although it is more difficult to infer this logical meaning without the cohesive devices.However, one can still make logical connections mentally in order to understanding thisparagraph. On the cohesion view, the paragraph is not cohesive since there are no connectionamong the sentences.
Some examples extracted from the corpora under investigation (translations from Spanishinto English):
Example 1
1Examples extracted from: http://gordonscruton.blogspot.ca/2011/08/what-is-cohesion-coherence-cambridge.html

164 Guidelines for quality annotation of MT outputs at paragraph level: discourse errors
MT: In studies US detected a great index of infection between the groups sample [] itis hard interpret these data and make recommendations firm. The European study showedmortality certain difference among patients had made detection and the not.
SOURCE: En los estudios realizados en los Estados Unidos se detectó un gran índicede contagios entre los grupos de muestra, por lo que es difícil interpretar esos datos yhacer recomendaciones firmes. Por su parte, el estudio europeo mostró cierta diferencia demortalidad entre los pacientes que se habían realizado la detección y los que no.
REFERENCE: In studies conducted in the United States, there was a lot of contamina-tion between control groups, so it is difficult to interpret the data and make firm recommen-dations. Another study, this time a European one, concluded that there was a difference inmortality between patients who were screened and those who were not.
This example could be scored as “3 - Little coherent", since the absence of connectivesor pronouns has several impacts in coherence, but one can still infer the logical relations.
Example 2
MT: Do Hacerse the test or not? Have asked board two specialists.
SOURCE: ¿Hacerse el test o no? Hemos pedido consejo a dos especialistas.
REFERENCE: Take the test or not? We asked two specialists for their opinion.
This example could be scored as “4 - Non-coherent", since a speaker of English will notunderstand the question.
B.3.2 Cohesion
Cohesion can be identified by superficial clues on the text. Different from coherence, it isless subjective in the sense that we should look for cohesion devices that are well markedalong the document (Stede, 2011). Some examples are given as follows:
Examples on wrong usage of pronouns
MT: “Today, many men who have been detected a cancer are not treated, because thecancer is not aggressive and poses a risk to their lives. Instead, they suggest an active

B.3 Examples 165
surveillance of the disease and, if it progresses, we offer a treatment." == according to thesource text, both should be “we" (possible score: 2 - Good)
SOURCE: “Hoy en día muchos hombres a los que se les ha detectado un cáncer no sontratados, puesto que dicho cáncer no es agresivo ni entraña un riesgo para su vida. En sulugar, les sugerimos una vigilancia activa de la enfermedad y, si ésta progresa, les ofrecemosun tratamiento").
MT: “My greatest wish is that I cure diarrhea, it is humiliating,’ he says. A fewhours later, the team found to remedy this evil." == according to the source text the correcttranslation should be “to be cured of my diarrhoea" (possible score: 3 - Dis-fluent)
SOURCE: “Mi mayor deseo es que me curen la diarrea, es humillante’, confiesa. Unashoras más tarde, el equipo encontró remedio a ese mal."
MT: “The biggest fear of Mrs A, 89 years, is dying "conscious and drowned out."But the disease has made him to discover their children." == the correct pronoun is “her".(possible score: 2 - Good)
SOURCE: “El mayor temor de la Sra. A., de 89 años, es morir "consciente y ahogada".Pero la enfermedad le ha hecho descubrir a sus hijos. "Tengo unos buenos hijos", añade."
MT: “Now, the Brennan Center considers this a myth and claims that the electoral fraudis less common in the United States that the number of people who die as a result of the fallof lightning." == the right use is “than". (possible score: 2 - Good)
SOURCE: “Ahora bien, el Centro Brennan considera esto último un mito y afirma queel fraude electoral es menos frecuente en los Estados Unidos que el número de personas quemueren a causa de la caída de un rayo."
Examples on wrong usage of connectives
MT: “Of fact, lawyers Republicans have not found more 300 cases of electoral fraudUnited States ten years." == the right use should be “in fact" (possible score: 2 - Good)
SOURCE: “De hecho, los abogados republicanos no han encontrado más que 300 casosde fraude electoral en los Estados Unidos en diez años."
MT: “Furthermore, legislators Republicans supported 2011 certain laws abolishingentered constituents the same day of scrutiny eight States. Furthermore, cramping the right

166 Guidelines for quality annotation of MT outputs at paragraph level: discourse errors
of people and groups create a service of assistance voters to register. These restrictions haveconsequences." == according to the source text the first occurence of “furthermore" shouldbe “on the other hand" (possible score: 3 - Dis-fluent)
SOURCE: “Por otro lado, los legisladores republicanos apoyaron en 2011 ciertas leyesque abolían la inscripción de electores el mismo día del escrutinio en ocho estados. Además,limitaron el derecho de las personas y los grupos a crear un servicio de ayuda a los electoresque quisieran inscribirse. Estas restricciones tienen consecuencias."
B.4 Task description
You will receive a set of paragraphs (randomly selected from documents) and you are requiredto, for each paragraph, first read the source version (in English) and then read the machinetranslated paragraph (in German) twice: first looking for coherence problems and secondlooking for cohesion problems. For each paragraph, in each iteration, you are requiredto score the paragraph, appropriately for coherence and cohesion, according to the abovedefinition of the 4-point scale.
The paragraphs are extracted from the WMT132 translation shared task test set. Thesedocuments are news texts in English that were machine translated into German.
You are required to fill a metadata form with the following format in which you shouldprovide the evaluation scores for coherence and cohesion respectively:
<paragraph number_doc= number_total= number_sent=><doc_number><system>-
coherence=
<paragraph number_doc= number_total= number_sent=><doc_number><system>-
coheresion=
The parameters marked with “<" and “>" are headers to identify each single paragraph(you will observe that this header is the same that appear in the document with the paragraphs).The first parameter is related to the paragraph itself: “number_doc" is the order of theparagraph inside a given document; “number_total" is the oder of the paragraph consideringthe whole corpus; and “number_sent" is the number of sentences that this paragraph contains.The parameter “doc_number" refers to the number of the document where this paragraphappears and “system" is the machine translated system which produced this paragraph. Theinformation follwing the header is the evaluation level: coherence or cohesion.
2http://www.statmt.org/wmt13/

B.4 Task description 167
As an example, consider that one student is evaluating the paragraphs:
<paragraph number_doc=2 number_total=92 number_sent=6><doc_6><rbmt-1_en-
de_2013>-coherence=
<paragraph number_doc=2 number_total=92 number_sent=6><doc_6><rbmt-1_en-
de_2013>-cohesion=
<paragraph number_doc=2 number_total=200 number_sent=4><doc_13><uedin_en-
de_2013>-coherence=
<paragraph number_doc=2 number_total=200 number_sent=4><doc_13><uedin_en-
de_2013>-cohesion=
<paragraph number_doc=3 number_total=50 number_sent=4><doc_4><rbmt-1_en-
de_2013>-coherence=
<paragraph number_doc=3 number_total=50 number_sent=4><doc_4><rbmt-1_en-
de_2013>-cohesion=
<paragraph number_doc=10 number_total=100 number_sent=4><doc_7><uedin_en-
de_2013>-coherence=
<paragraph number_doc=10 number_total=100 number_sent=4><doc_7><uedin_en-
de_2013>-cohesion=
<paragraph number_doc=5 number_total=368 number_sent=6><doc_17><rbmt-
1_en-de_2013>-coherence=
<paragraph number_doc=5 number_total=368 number_sent=6><doc_17><rbmt-
1_en-de_2013>-cohesion=
<paragraph number_doc=1 number_total=1 number_sent=4><doc_1><uedin_en-
de_2013>-coherence=
<paragraph number_doc=1 number_total=1 number_sent=4><doc_1><uedin_en-
de_2013>-cohesion=
After the student fill the form, the metadata file should look like the following:
<paragraph number_doc=2 number_total=92 number_sent=6><doc_6><rbmt-1_en-
de_2013>-coherence=2

168 Guidelines for quality annotation of MT outputs at paragraph level: discourse errors
<paragraph number_doc=2 number_total=92 number_sent=6><doc_6><rbmt-1_en-
de_2013>-cohesion=3
<paragraph number_doc=2 number_total=200 number_sent=4><doc_13><uedin_en-
de_2013>-coherence=1
<paragraph number_doc=2 number_total=200 number_sent=4><doc_13><uedin_en-
de_2013>-cohesion=3
<paragraph number_doc=3 number_total=50 number_sent=4><doc_4><rbmt-1_en-
de_2013>-coherence=1
<paragraph number_doc=3 number_total=50 number_sent=4><doc_4><rbmt-1_en-
de_2013>-cohesion=1
<paragraph number_doc=10 number_total=100 number_sent=4><doc_7><uedin_en-
de_2013>-coherence=4
<paragraph number_doc=10 number_total=100 number_sent=4><doc_7><uedin_en-
de_2013>-cohesion=4
<paragraph number_doc=5 number_total=368 number_sent=6><doc_17><rbmt-
1_en-de_2013>-coherence=4
<paragraph number_doc=5 number_total=368 number_sent=6><doc_17><rbmt-
1_en-de_2013>-cohesion=3
<paragraph number_doc=1 number_total=1 number_sent=4><doc_1><uedin_en-
de_2013>-coherence=2
<paragraph number_doc=1 number_total=1 number_sent=4><doc_1><uedin_en-
de_2013>-cohesion=1
After you finished the task, you are required to upload the metadata file with your scoresin the area shared by the lecturer.

References
Akiba, Y., Sumita, E., Nakaiwa, H., Yamamoto, S., and Okuno, H. G. (2004). “Using amixture of N-best lists from multiple MT systems in rank-sum-based confidence measurefor MT outputs”. In: The 20th International Conference on Computational Linguistics.Geneva, Switzerland, pp. 322–328.
Almaghout, H. and Specia, L. (2013). “A CCG-based Quality Estimation Metric for StatisticalMachine Translation”. In: The 14th Machine Translation Summit. Nice, France, pp. 223–230.
Avramidis, E. (2016). “Qualitative: Python tool for MT Quality Estimation supportingServer Mode and Hybrid MT”. In: The Prague Bulletin of Mathematical Linguistics 106,pp. 147–158.
Avramidis, E., Popovic, M., Torres, D. V., and Burchardt, A. (2011). “Evaluate with confi-dence estimation: Machine ranking of translation outputs using grammatical features”.In: The Sixth Workshop on Statistical Machine Translation. Edinburgh, UK, pp. 65–70.
Aziz, W., Sousa, S. C. M., and Specia, L. (2012). “PET: a tool for post-editing and assessingmachine translation”. In: The 8th International Conference on Language Resources and
Evaluation. Istanbul, Turkey, pp. 3982–3987.Aziz, W. and Specia, L. (2011). “Fully Automatic Compilation of a Portuguese-English
Parallel Corpus for Statistical Machine Translation”. In: The 8th Brazilian Symposium in
Information and Human Language Technology. Cuiabá - MT, Brazil, pp. 234–238.Bach, N., Huang, F., and Al-Onaizan, Y. (2011). “Goodness: A method for measuring
machine translation confidence”. In: The 49th Annual Meeting of the Association for
Computational Linguistics: Human Language Technologies. Portland, OR, pp. 211–219.Banerjee, S. and Lavie, A. (2005). “METEOR: An Automatic Metric for MT Evaluation
with Improved Correlation with Human Judgments”. In: The ACL 2005 Workshop on
Intrinsic and Extrinsic Evaluation Measures for MT and/or Summarization. Ann Harbor,MI, pp. 65–72.

170 References
Barzilay, R. and Lapata, M. (2005). “Modeling local coherence: An entity-based approach”.In: The 43rd Annual Meeting of the Association for Computational Linguistics. AnnHarbor, MI, pp. 141–148.
Beck, D., Cohn, T., Hardmeier, C., and Specia, L. (2015). “Learning Structural Kernels forNatural Language Processing”. In: Transactions of the Association for Computational
Linguistics 3, pp. 461–473.Ben, G., Xiong, D., Teng, Z., Lu, Y., and Liu, Q. (2013). “Bilingual Lexical Cohesion Trigger
Model for Document-Level Machine Translation”. In: The 51st Annual Meeting of the
Association for Computational Linguistics. Sofia, Bulgaria, pp. 382–386.Bergstra, J. and Bengio, Y. (2012). “Random Search for Hyper-Parameter Optimization”. In:
Journal of Machine Learning Research 13, pp. 281–305.Berka, J., Cerný, M., and Bojar, O. (2011). “Quiz-based evaluation of machine translation”.
In: The Prague Bulletin of Mathematical Linguistics 95, pp. 77–86.Biçici, E. (2016). “Referential Translation Machines for Predicting Translation Performance”.
In: The First Conference on Machine Translation. Berlin, Germany, pp. 777–781.Biçici, E. (2013). “Referential Translation Machines for Quality Estimation”. In: The Eighth
Workshop on Statistical Machine Translation. Sofia, Bulgaria, pp. 343–351.Biçici, E., Liu, Q., and Way, A. (2015). “Referential Translation Machines for Predicting
Translation Quality and Related Statistics”. In: The Tenth Workshop on Statistical Machine
Translation. Lisbon, Portugal, pp. 304–308.Biçici, E. and Way, A. (2014). “Referential Translation Machines for Predicting Translation
Qual- ity”. In: The Ninth Workshop on Statistical Machine Translation. Baltimore, MD,pp. 313–321.
Blain, F., Logacheva, V., and Specia, L. (2016). “Phrase Level Segmentation and Labellingof Machine Translation Errors”. In: The Tenth International Conference on Language
Resources and Evaluation. Portorož, Slovenia, pp. 2240–2245.Blain, F., Senellart, J., Schwenk, H., Plitt, M., and Roturier, J. (2011). “Qualitative Analysis
of Post-Editing for High Quality Machine Translation”. In: The 13th Machine Translation
Summit. Xiamen, China, pp. 164–171.Blatz, J., Fitzgerald, E., Foster, G., Gandrabur, S., Goutte, C., Kulesza, A., Sanchis, A.,
and Ueffing, N. (2004). “Confidence Estimation for Machine Translation”. In: The 20th
International Conference on Computational Linguistics. Geneva, Switzerland, pp. 315–321.
Blei, D. M. (2012). “Probabilistic Topic Models”. In: Communications of the ACM 55.4,pp. 77–84.

References 171
Blei, D. M., Ng, A. Y., and Jordan, M. I. (2003). “Latent dirichlet allocation”. In: The Journal
of Machine Learning research 3, pp. 993–1022.Bojar, O., Graham, Y., Kamran, A., and Stanojevic, M. (2016a). “Results of the WMT16
Metrics Shared Task”. In: The First Conference on Machine Translation. Berlin, Germany,pp. 199–231.
Bojar, O., Buck, C., Callison-Burch, C., Federmann, C., Haddow, B., Koehn, P., Monz, C.,Post, M., Soricut, R., and Specia, L. (2013). “Findings of the 2013 Workshop on StatisticalMachine Translation”. In: The Eighth Workshop on Statistical Machine Translation. Sofia,Bulgaria, pp. 1–44.
Bojar, O., Buck, C., Federman, C., Haddow, B., Koehn, P., Leveling, J., Monz, C., Pecina, P.,Post, M., Saint-Amand, H., Soricut, R., Specia, L., and Tamchyna, A. (2014). “Findingsof the 2014 Workshop on Statistical Machine Translation”. In: The Ninth Workshop on
Statistical Machine Translation. Baltimore, MD, pp. 12–58.Bojar, O., Chatterjee, R., Federmann, C., Haddow, B., Huck, M., Hokamp, C., Koehn, P.,
Logacheva, V., Monz, C., Negri, M., Post, M., Scarton, C., Specia, L., and Turchi, M.(2015). “Findings of the 2015 Workshop on Statistical Machine Translation”. In: The
Tenth Workshop on Statistical Machine Translation. Lisbon, Portugal, pp. 1–46.Bojar, O., Chatterjee, R., Federmann, C., Graham, Y., Haddow, B., Huck, M., Yepes, A. J.,
Koehn, P., Logacheva, V., Monz, C., Negri, M., Neveol, A., Neves, M., Popel, M., Post,M., Rubino, R., Scarton, C., Specia, L., Turchi, M., Verspoor, K., and Zampieri, M.(2016b). “Findings of the 2016 Conference on Statistical Machine Translation”. In: The
First Conference on Statistical Machine Translation. Berlin, Germany, pp. 131–198.Callison-Burch, C., Osborne, M., and Koehn, P. (2006). “Re-evaluating the Role of BLEU
in Machine Translation Research”. In: The 11th Conference of European Chapter of the
Association for Computational Linguistics. Trento, Italy, pp. 249–256.Callison-Burch, C., Koehn, P., Monz, C., and Schroeder, J. (2009). “Findings of the 2009
Workshop on Statistical Machine Translation”. In: The Fourth Workshop on Statistical
Machine Translation. Athens, Greece, pp. 1–28.Callison-Burch, C., Koehn, P., Monz, C., Peterson, K., Przybocki, M., and Zaidan, O. (2010).
“Findings of the 2010 Joint Workshop on Statistical Machine Translation and Metrics forMachine Translation”. In: The Joint Fifth Workshop on Statistical Machine Translation
and MetricsMATR. Uppsala, Sweden, pp. 17–53.Callison-Burch, C., Koehn, P., Monz, C., and Zaidan, O. (2011). “Findings of the 2011
Workshop on Statistical Machine Translation”. In: The Sixth Workshop on Statistical
Machine Translation. Edinburgh, Scotland, pp. 22–64.

172 References
Callison-Burch, C., Koehn, P., Monz, C., Post, M., Soricut, R., and Specia, L. (2012).“Findings of the 2012 Workshop on Statistical Machine Translation”. In: The Seventh
Workshop on Statistical Machine Translation. Montreal, Canada, pp. 10–51.Callison-Burch, C., Fordyce, C., Koehn, P., Monz, C., and Schroeder, J. (2008). “Further
Meta-Evaluation of Machine Translation”. In: The Third Workshop on Statistical Machine
Translation. Columbus, OH, pp. 70–106.Callison-Burch, C., Fordyce, C., Koehn, P., Monz, C., and Schroeder, J. (2007). “(Meta-
)Evaluation of Machine Translation”. In: The Second Workshop on Statistical Machine
Translation. Prague, Czech Republic, pp. 136–158.Carpuat, M. (2009). “One translation per discourse”. In: The Workshop on Semantic Evalua-
tions: Recent Achievements and Future Directions. Boulder, CO, pp. 19–27.Carpuat, M. and Simard, M. (2012). “The Trouble with SMT Consistency”. In: The Seventh
Workshop on Statistical Machine Translation. Montreal, Quebec, Canada, pp. 442–449.Castilho, S. and O’Brien, S. (2016). “Evaluating the Impact of Light Post-Editing on Us-
ability”. In: The Tenth International Conference on Language Resources and Evaluation.Portorož, Slovenia, pp. 310–316.
Castilho, S., O’Brien, S., Alves, F., and O’Brien, M. (2014). “Does post-editing increaseusability? A study with Brazilian Portuguese as Target Language”. In: The 17th Annual
Conference of the European Association for Machine Translation. Dubrovnik, Croatia,pp. 183–190.
Charniak, E. (2000). “A Maximum-Entropy-Inspired Parser”. In: The 1st North American
Chapter of the Association for Computational Linguistics. Seattle, Washington, pp. 132–139.
Cortes, C. and Vapnik, V. (1995). “Support Vector Networks”. In: Machine Learning 20.3,pp. 273–297.
David, L. (2015). “LORIA System for the WMT15 Quality Estimation Shared Task”. In: The
Tenth Workshop on Statistical Machine Translation. Lisbon, Portugal, pp. 323–329.Day, R. R. and Park, J.-S. (2005). “Developing Reading Comprehension Questions”. In:
Reading in a Foreign Language 17.1, pp. 60–73.Denkowski, M. and Lavie, A. (2014). “Meteor Universal: Language Specific Translation
Evaluation for Any Target Language”. In: The Ninth Workshop on Statistical Machine
Translation. Baltimore, MD, pp. 376–380.Dillinger, M. (2014). “Introduction”. In: Post-Editing of Machine Translation: Processes
and Applications. Ed. by S. O’Brien, L. W. Balling, M. Carl, and L. Specia. CambridgeScholars Publishing.

References 173
Doherty, S. and O’Brien, S. (2014). “Assessing the Usability of Raw Machine TranslatedOutput: A User-Centred Study using Eye Tracking”. In: International Journal of Human-
Computer Interaction 30.1, pp. 40–51.Doherty, S. and O’Brien, S. (2009). “Can MT output be evaluated through eye tracking?” In:
The 12th Machine Translation Summit. Ottawa, Canada, pp. 214–221.Doherty, S., O’Brien, S., and Carl, M. (2010). “Eye Tracking as an Automatic MT Evaluation
Technique”. In: Machine Translation 24, pp. 1–13.Eidelman, V., Boyd-Graber, J., and Resnik, P. (2012). “Topic Models of Dynamic Translation
Model Adaptation”. In: The 50th Annual Meeting of the Association for Computational
Linguistics. Jeju Island, Korea, pp. 115–119.Federico, M., Bertoldi, N., Cettolo, M., Negri, M., Turchi, M., Trombetti, M., Cattelan, A.,
Farina, A., Lupinetti, D., Martines, A., Massidda, A., Schwenk, H., Barrault, L., Blain,F., Koehn, P., Buck, C., and Germann, U. (2014). “The MateCat Tool”. In: The 25th
International Conference on Computational Linguistics: System Demonstrations. Dublin,Ireland, pp. 129–132.
Felice, M. and Specia, L. (2012). “Linguistic features for quality estimation”. In: The Seventh
Workshop on Statistical Machine Translation. Montreal, Quebec, Canada, pp. 96–103.Fellbaum, C. (1998). WordNet: An electronic lexical database. Cambridge, Massachusetts:
MIT Press.Fomicheva, M. and Specia, L. (2016). “Reference Bias in Monolingual Machine Translation
Evaluation”. In: 54th Annual Meeting of the Association for Computational Linguistics.Berlin, Germany, pp. 77–82.
Fuji, M., Hatanaka, N., Ito, E., Kamei, S., Kumai, H., Sukehiro, T., Yoshimi, T., and Isahara, H.(2001). “Evaluation Method for Determining Groups of Users Who Find MT “Useful"”.In: The Eightth Machine Translation Summit. Santiago de Compostela, Spain, pp. 103–108.
Fuji, M. (1999). “Evaluation Experiment for Reading Comprehension of Machine TranslationOutputs”. In: The Seventh Machine Translation Summit. Singapore, Singapore, pp. 285–289.
Gale, W. A., Church, K. W., and Yarowsky, D. (1992). “One sense per discourse”. In: The
Workshop on Speech and Natural Language. Harriman, NY, pp. 233–237.Gandrabur, S. and Foster, G. (2003). “Confidence estimation for text prediction”. In: The
Conference on Natural Language Learning. Edmonton, Canada, pp. 95–102.

174 References
Giménez, J. and Màrquez, L. (2010). “Asiya: An Open Toolkit for Automatic MachineTranslation (Meta-)Evaluation”. In: The Prague Bulletin of Mathematical Linguistics 94,pp. 77–86.
Giménez, J. and Màrquez, L. (2009). “On the Robustness of Syntactic and Semantic Featuresfor Automatic MT Evaluation”. In: The 4th Workshop on Statistical Machine Translation.Athens, Greece, pp. 250–258.
Giménez, J., Màrquez, L., Comelles, E., Catellón, I., and Arranz, V. (2010). “Document-level Automatic MT Evaluation based on Discourse Representations”. In: The Joint
5th Workshop on Statistical Machine Translation and MetricsMATR. Uppsala, Sweden,pp. 333–338.
Gong, Z., Zhang, M., and Zhou, G. (2015). “Document-Level Machine Translation Evaluationwith Gist Consistency and Text Cohesion”. In: The Second Workshop on Discourse in
Machine Translation. Lisbon, Portugal, pp. 33–40.Graesser, A. C., McNamara, D. S., Louwerse, M. M., and Cai, Z. (2004). “Coh-Metrix:
Analysis of text on cohesion and language”. In: Behavior Research Methods, Instruments,
and Computers 36, pp. 193–202.Graham, Y. (2015). “Improving Evaluation of Machine Translation Quality Estimation”. In:
The 53rd Annual Meeting of the Association for Computational Linguistics and Seventh
International Joint Conference on Natural Language Processing of the Asian Federation
of Natural Language Processing. Beijing, China, pp. 1804–1813.Grosz, B. J., Joshi, A. K., and Weinstein, S. (1995). “Centering: A framework for modeling
the local coherence of discourse”. In: Computational Linguistics 21.2, pp. 203–225.Guillou, L. (2012). “Improving Pronoun Translation for Statistical Machine Translation”. In:
The Student Research Workshop at the 13th Conference of the European Chapter of the
Association for Computational Linguistics. Avignon, France, pp. 1–10.Guinaudeau, C. and Strube, M. (2013). “Graph-based Local Coherence Modeling”. In: The
51st Annual Meeting of the Association for Computational Linguistics. Sofia, Bulgaria,pp. 93–103.
Gupta, R., Orasan, C., and van Genabith, J. (2015). “ReVal: A Simple and Effective MachineTranslation Evaluation Metric Based on Recurrent Neural Networks”. In: The 2015
Conference on Empirical Methods in Natural Language Processing. Lisbon, Portugal,pp. 1066–1072.
Guzmán, F., Joty, S., Màrquez, L., and Nakov, P. (2014). “Using Discourse Structure ImprovesMachine Translation Evaluation”. In: The 52nd Annual Meeting of the Association for
Computational Linguistics. Baltimore, MD, pp. 687–698.

References 175
Halliday, M. A. K. and Hasan, R. (1976). Cohesion in English. English Language Series.London, UK: Longman.
Hardmeier, C. (2014). “Discourse in Statistical Machine Translation”. PhD thesis. Sweden:Department of Linguistics and Philology, Uppsala University.
Hardmeier, C. (2012). “Discourse in Statistical Machine Translation: A Survey and a CaseStudy”. In: Discours - Revue de linguistique, psycholinguistique et informatique 11.
Hardmeier, C. (2011). “Improving machine translation quality prediction with syntatic treekernels”. In: The 15th conference of the European Assoaciation for Machine Translation
(EAMT 2011). Leuven, Belgium, pp. 233–240.Hardmeier, C. and Federico, M. (2010). “Modelling pronominal anaphora in statistical ma-
chine translation”. In: The 7th International Workshop on Spoken Language Translation.Paris, France, pp. 283–289.
Hardmeier, C., Nivre, J., and Tiedemann, J. (2012). “Tree Kernels for Machine TranslationQuality Estimation”. In: The Seventh Workshop on Statistical Machine Translation.Montréal, Canada, pp. 109–113.
Hardmeier, C., Nakov, P., Stymne, S., Tiedemann, J., Versley, Y., and Cettolo, M. (2015).“Pronoun-Focused MT and Cross-Lingual Pronoun Prediction: Findings of the 2015DiscoMT Shared Task on Pronoun Translation”. In: The Second Workshop on Discourse
in Machine Translation. Lisbon, Portugal, pp. 1–16.He, Y., Ma, Y., van Genabith, J., and Way, A. (2010). “Bridging SMT and TM with Translation
Recommendation”. In: The 48th Annual Meeting of the Association for Computational
Linguistics. Uppsala, Sweden, pp. 622–630.Hobbs, J. R. (1979). “Coherence and Coreference”. In: Cognitive Science 3, pp. 67–90.Jones, D. A., Shen, W., Granoien, N., Herzog, M., and Weinstein, C. (2005a). “Measuring
Human Readability of Machine Generated Text: Studies in Speech Recognition andMachine Translation”. In: The IEEE International Conference on Acoustics, Speech, and
Signal Processing. Philadelphia, PA.Jones, D. A., Gibson, E., Shen, W., Granoien, N., Herzog, M., Reynolds, D., and Weinstein,
C. (2005b). “Measuring Translation Quality by Testing English Speakers with a NewDefense Language Proficiency Test for Arabic”. In: The International Conference on
Intelligence Analysis. McLean, VA.Joty, S., Carenini, G., Ng, R. T., and Mehdad, Y. (2013). “Combining Intra- and Multi-
sentential Rhetorical Parsing for Document-level Discourse Analysis”. In: The 51st An-
nual Meeting of the Association for Computational Linguistics. Sofia, Bulgaria, pp. 486–496.
176 References
Joty, S., Guzmán, F., Màrquez, L., and Nakov, P. (2014). “DiscoTK: Using discourse structurefor machine translation evaluation”. In: The Ninth Workshop on Statistical Machine
Translation. Baltimore, MD, pp. 403–408.Kenter, T., Borisov, A., and Rijke, M. d. (2016). “Siamese CBOW: Optimizing Word Em-
beddings for Sentence Representations”. In: 54th Annual Meeting of the Association for
Computational Linguistics. Berlin, Germany, pp. 941–951.Klerke, S., Castilho, S., Barrett, M., and Søgaard, A. (2015). “Reading metrics for estimat-
ing task efficiency with MT output”. In: The Sixth Workshop on Cognitive Aspects of
Computational Language Learning. Lisbon, Portugal, pp. 6–13.Koehn, P. (2010). Statistical Machine Translation. Marina del Rey, CA: Information Science
Institute.Koehn, P. and Monz, C. (2006). “Manual and Automatic Evaluation of Machine Translation
between European Languages”. In: The Workshop on Statistical Machine Translation.New York City, NY, pp. 102–121.
Koehn, P., Hoang, H., Birch, A., Callison-Burch, C., Federico, M., Bertoldi, N., Cowan,B., Shen, W., Moran, C., Zens, R., Dyer, C., Bojar, O., Constantin, A., and Herbst, E.(2007). “MOSES: Open source Toolkit for Statistical Machine Translation”. In: The
Annual Meeting of the Association for Computational Linguistics, demonstration session.Prague, Czech Republic, pp. 177–180.
Koponen, M., Aziz, W., Ramos, L., and Specia, L. (2012). “Post-editing time as a measure ofcognitive effort”. In: The AMTA 2012 Workshop on Post-Editing Technology and Practice.San Diego, CA, pp. 11–20.
Kozlova, A., Shmatova, M., and Frolov, A. (2016). “YSDA Participation in the WMT’16Quality Estimation Shared Task”. In: The First Conference on Machine Translation.Berlin, Germany, pp. 793–799.
Krings, H. P. (2001). Repairing texts: Empirical investigations of machine translation post-
editing process. Kent, OH: The Kent State University Press.Lacruz, I., Denkowski, M., and Lavie, A. (2014). “Cognitive Demand and Cognitive Effort
in Post-Editing”. In: The Third Workshop on Post-Editing Technology and Practice.Vancouver, Canada, pp. 73–84.
Landauer, T. K., Foltz, P. W., and Laham, D. (1998). “An Introduction to Latent SemanticAnalysis”. In: Discourse Processes 25, pp. 259–284.
Le, Q. and Mikolov, T. (2014). “Distributed Representations of Sentences and Documents”.In: The 31st International Conference on Machine Learning. Beijing, China, pp. 1188–1196.

References 177
LeNagard, R. and Koehn, P. (2010). “Aiding Pronoun Translation with Co-Reference Resolu-tion”. In: The Joint 5th Workshop on Statistical Machine Translation and MetricsMATR.Uppasala, Sweden, pp. 252–261.
Li, J. J., Carpuat, M., and Nenkova, A. (2014). “Assessing the Discourse Factors that Influencethe Quality of Machine Translation”. In: The 52nd Annual Meeting of the Association for
Computational Linguistics. Baltimore, MD, pp. 283–288.Lin, R., Liu, S., Yang, M., Li, M., Zhou, M., and Li, S. (2015). “Hierarchical Recurrent Neural
Network for Document Modeling”. In: The 2015 Conference on Empirical Methods in
Natural Language Processing. Lisbon, Portugal, pp. 899–907.Logacheva, V. and Specia, L. (2015). “Phrase-level Quality Estimation for Machine Transla-
tion”. In: The 12th International Workshop on Spoken Language Translation. Da Nang,Vietnam, pp. 143–150.
Louis, A. and Nenkova, A. (2012). “A coherence model based on syntactic patterns”. In:The 2012 Joint Conference on Empirical Methods in Natural Language Processing and
Computational Natural Language Learning. Jeju Island, Korea, pp. 1157–1168.Louis, A. and Nenkova, A. (2013). “Automatically Assessing Machine Summary Content
Without a Gold Standard”. In: Computational Linguistics 39.2, pp. 267–300.Luong, N.-Q. (2014). “Word Confidence Estimation for Statistical Machine Translation”.
PhD thesis. Grenoble, France: Laboratoire d’Informatique de Grenoble.Machácek, M. and Bojar, O. (2013). “Results of the WMT13 Metrics Shared Task”. In: The
Eighth Workshop on Statistical Machine Translation. Sofia, Bulgaria, pp. 45–51.Machácek, M. and Bojar, O. (2014). “Results of the WMT14 Metrics Shared Task”. In: The
Ninth Workshop on Statistical Machine Translation. Baltimore, MD, pp. 293–301.Mann, W. C. and Thompson, S. A. (1987). Rhetorical Structure Theory: A Theory of Text
Organization. Cambridge, UK: Cambridge University Press.Marcu, D., Carlson, L., and Watanabe, M. (2000). “The automatic translation of discourse
structures”. In: The 1st North American chapter of the Association for Computational
Linguistics conference. Seattle, WA, pp. 9–17.Martínez-Garcia, E., Bonet, C. España, and Màrquez, L. (2015). “Document-level machine
translation with word vector models”. In: The 18th Annual Conference of the European
Association for Machine Translation. Antalya, Turkey, pp. 59–66.Martínez-Garcia, E., Bonet, C. España, Tiedemann, J., and Màrquez, L. (2014). “Word’s
Vector Representations meet Machine Translation”. In: The Eighth Workshop on Syntax,
Semantics and Structure in Statistical Translation. Doha, Qatar, pp. 132–134.

178 References
Martins, A. F. T., Almeida, M. B., and Smith, N. A. (2013). “Turning on the Turbo: Fast Third-Order Non-Projective Turbo Parsers”. In: The 51st Annual Meeting of the Association for
Computational Linguistics. Sofia, Bulgaria, pp. 617–622.Martins, A. F. T., Astudillo, R., Hokamp, C., and Kepler, F. N. (2016). “Unbabel’s Participa-
tion in the WMT16 Word-Level Translation Quality Estimation Shared Task”. In: The
First Conference on Machine Translation. Berlin, Germany, pp. 806–811.Meurers, R. Z., Ott, N., and Kopp, J. (2011). “Evaluating Answers to Reading Comprehension
Questions in Context: Results for German and the Role of Information Structure”. In:The TextInfer 2011 Workshop on Textual Entailment. Edinburgh, UK, pp. 1–9.
Meyer, T. and Popescu-Belis, A. (2012). “Using sense-labeled discourse connectives forstatistical machine translation”. In: The Joint Workshop on Exploiting Synergies between
Information Retrieval and Machine Translation (ESIRMT) and Hybrid Approaches to
Machine Translation (HyTra). Avignon, France, pp. 129–138.Meyer, T., Popescu-Belis, A., Hajlaoui, N., and Gesmundo, A. (2012). “Machine translation
of labeled discourse connectives”. In: The Tenth Biennial Conference of the Association
for Machine Translation in the Americas. San Diego, CA.Meyer, T., Popescu-belis, A., Zufferey, S., and Cartoni, B. (2011). “Multilingual Annotation
and Disambiguation of Discourse Connectives for Machine Translation”. In: The 12th
Annual Meeting of the Special Interest Group on Discourse and Dialogue. Portland, OR,pp. 194–203.
Mikolov, T., Le, Q. V., and Sutskever, I. (2013). “Exploiting Similarities among Languagesfor Machine Translation”. In: CoRR abs/1309.4168. URL: http://arxiv.org/abs/1309.4168.
Mikolov, T., Sutskever, I., Chen, K., Corrado, G., and Dean, J. (2013a). “Distributed repre-sentations of words and phrases and their compositionality”. In: The 26th International
Conference on Neural Information Processing Systems. Lake Tahoe, Nevada, pp. 3111–3119.
Mikolov, T., Chen, K., Corrado, G., and Dean, J. (2013b). “Efficient Estimation of WordRepresentations in Vector Space”. In: The International Conference on Learning Repre-
sentations 2013: workshop track. Scottsdale, AZ, pp. 1–12.Mitkov, R. (2004). “Anaphora Resolution”. In: The Oxford Handbook of Computational
Linguistics. Ed. by R. Mitkov. Oxford University Press.Moschitti, A. (2006). “Making tree kernels practical for natural language learning”. In:
The Eleventh International Conference on European Association for Computational
Linguistics. Trento, Italy, pp. 113–120.Nirenburg, S. (1993). Progress in Machine Translation. Amsterdam, Netherlands: IOS B. V.

References 179
Novák, M., Oele, D., and van Noord, G. (2015). “Comparison of Coreference Resolvers forDeep Syntax Translation”. In: The Second Workshop on Discourse in Machine Translation.Lisbon, Portugal, pp. 17–23.
O’Brien, S. (2011). “Towards predicting post-editing productivity”. In: Machine Translation
25, pp. 197–215.Ott, N., Ziai, R., and Meurers, D. (2012). “Creation and analysis of a reading comprehension
exercise corpus: Towards evaluating meaning in context”. In: Multilingual Corpora and
Multilingual Corpus Analysis. Ed. by T. Schmidt and K. Worner. Hamburg Studies onMultilingualism (Book 14). Amsterdam, The Netherlands: John Benjamins PublishingCompany, pp. 47–69.
Palmer, M., Gildea, D., and Kingsbury, P. (2005). “The Proposition Bank: A Corpus Anno-tated with Semantic Roles”. In: Computational Linguistics 31.1, pp. 72–105.
Papineni, K., Roukos, S., Ward, T., and Zhu, W. jing (2002). “BLEU: a Method for AutomaticEvaluation of Machine Translation”. In: The 40th Annual Meeting of the Association for
Computational Linguistics. Philadelphia, PA, pp. 311–318.Parra Escartín, C. and Arcedillo, M. (2015). “Machine translation evaluation made fuzzier:
A study on post-editing productivity and evaluation metrics in commercial settings”. In:The Fourth Workshop on Hybrid Approaches to Translation. Beijing, China, pp. 40–45.
Pedregosa-Izquierdo, F. (2015). “Feature extraction and supervised learning on fMRI : frompractice to theory”. PhD thesis. Paris, France: École Doctorale Informatique, Télécom-munications et Électronique, Université Pierre et Marie Curie.
Pighin, D and Màrquez, L (2011). “Automatic projection of semantic structures: an ap-plication to pairwise translation ranking”. In: The SSST-5, Fifth Workshop on Syntax,
Semantics and Structure in Statistical Translation. Portland, OR, pp. 1–9.Pitler, E. and Nenkova, A. (2009). “Using Syntax to Disambiguate Explicit Discourse Con-
nectives in Text”. In: The Joint conference of the 47th Annual Meeting of the Association
for Computational Linguistics and the Fourth International Joint Conference on Natural
Language Processing of the Asian Federation of Natural Language Processing. Suntec,Singapore, pp. 13–16.
Plitt, M. and Masselot, F. (2010). “A Productivity Test of Statistical Machine TranslationPost-Editing in a Typical Localisation Context”. In: The Prague Bulletin of Mathematical
Linguistics 93, pp. 7–16.Potet, M., Esperança-Rodier, E., Besacier, L., and Blanchon, H. (2012). “Collection of a
Large Database of French-English SMT Output Corrections”. In: The 8th International
Conference on Language Resources and Evaluation. Istanbul, Turkey, pp. 23–25.

180 References
Prasad, R., Dinesh, N., Lee, A., Miltsakaki, E., Robaldo, L., Joshi, A., and Webber, B. (2008).“The Penn Discourse Treebank 2.0”. In: The 6th International Conference on Language
Resources and Evaluation. Marrackech, Morocco, pp. 2961–2968.Quirk, C. B. (2004). “Training a sentence-level machine translation confidence metric”. In:
The International Conference on Language Resources and Evaluation. Lisbon, Portugal,pp. 825–828.
Ramsay, A. (2004). “Discourse”. In: The Oxford Handbook of Computational Linguistics.Ed. by R. Mitkov. Oxford University Press.
Rasmussen, C. E. and Williams, C. K. I. (2006). Gaussian Processes for Machine Learning.Cambridge, Massachusetts: MIT Press.
Rehurek, R. and Sojka, P. (2010). “Software Framework for Topic Modelling with LargeCorpora”. In: Proceedings of the LREC 2010 Workshop on New Challenges for NLP
Frameworks. Valletta, Malta, pp. 45–50.Rennie, J. D. M. and Srebro, N. (2005). “Loss functions for preference levels: Regression
with discrete ordered labels”. In: The IJCAI Multidisciplinary Workshop on Advances in
Preference Handling. Edinburgh, Scotland, pp. 180–186.Richardson, M., Burges, C. J. C., and Renshaw, E. (2013). “MCTest: A Challenge Dataset
for the Open-Domain Machine Comprehension of Text”. In: The 2013 Conference on
Empirical Methods in Natural Language Processing. Seattle, WA, pp. 193–203.Rogers, S. and Girolami, M. (2012). A first course in Machine Learning. Boca Raton, FL:
CRC Press, Taylor and Francis Group.Rubino, R., Souza, J. G. C. d., Foster, J., and Specia, L. (2013). “Topic Models for Translation
Quality Estimation for Gisting Purposes”. In: The 14th Machine Translation Summit.Nice, France, pp. 295–302.
Sagemo, O. and Stymne, S. (2016). “The UU Submission to the Machine Translation QualityEstimation Task”. In: The First Conference on Machine Translation. Berlin, Germany,pp. 825–830.
Sajjad, H., Guzman, F., Durrani, N., Bouamor, H., Abdelali, A., Teminkova, I., and Vogel,S. (2016). “Eyes Don’t Lie: Predicting Machine Translation Quality Using Eye Move-ment”. In: The 2016 Conference of the North American Chapter of the Association for
Computational Linguistics: Human Language Technologies. San Diego, CA, pp. 1082–1088.
Scarton, C. (2015). “Discourse and Document-level Information for Evaluating LanguageOutput Tasks”. In: The 2015 Conference of the North American Chapter of the Association
References 181
for Computational Linguistics: Student Research Workshop. Denver, Colorado, pp. 118–125.
Scarton, C. and Specia, L. (2015). “A quantitative analysis of discourse phenomena inmachine translation”. In: Discours - Revue de linguistique, psycholinguistique et informa-
tique 16.Scarton, C. and Specia, L. (2016). “A Reading Comprehension Corpus for Machine Transla-
tion Evaluation”. In: The Tenth International Conference on Language Resources and
Evaluation. Portorož, Slovenia, pp. 3652–3658.Scarton, C. and Specia, L. (2014a). “Document-level translation quality estimation: exploring
discourse and pseudo-references”. In: The 17th Annual Conference of the European
Association for Machine Translation. Dubrovnik, Croatia, pp. 101–108.Scarton, C. and Specia, L. (2014b). “Exploring Consensus in Machine Translation for Quality
Estimation”. In: The Ninth Workshop on Statistical Machine Translation. Baltimore,Maryland, USA, pp. 342–347.
Scarton, C., Tan, L., and Specia, L. (2015). “USHEF and USAAR-USHEF participation inthe WMT15 QE shared task”. In: The Tenth Workshop on Statistical Machine Translation.Lisbon, Portugal, pp. 336–341.
Scarton, C., Zampieri, M., Vela, M., van Genabith, J., and Specia, L. (2015). “Searching forContext: a Study on Document-Level Labels for Translation Quality Estimation”. In: The
18th Annual Conference of the European Association for Machine Translation. Antalya,Turkey, pp. 121–128.
Scarton, C., Beck, D., Shah, K., Sim Smith, K., and Specia, L. (2016). “Word embeddingsand discourse information for Quality Estimation”. In: The First Conference on Machine
Translation. Berlin, Germany, pp. 831–837.Schmid, H. (1994). “Probabilistic Part-of-Speech Tagging Using Decision Trees”. In: Pro-
ceedings of International Conference on New Methods in Language Processing. Manch-ester, UK.
Servan, C., Le, N.-T., Luong, N. Q., Lecouteux, B., and Besacier, L. (2011). “EvaluatingAnswers to Reading Comprehension Questions in Context: Results for German and theRole of Information Structure”. In: The TextInfer 2011 Workshop on Textual Entailment.Edinburgh, UK, pp. 1–9.
Shah, K., Cohn, T., and Specia, L. (2013). “An Investigation on the Effectiveness of Featuresfor Translation Quality Estimation”. In: The 14th Machine Translation Summit. Nice,France, pp. 167–174.

182 References
Shah, K., Ng, R. W. M., Bougares, F., and Specia, L. (2015a). “Investigating ContinuousSpace Language Models for Machine Translation Quality Estimation”. In: The 2015
Conference on Empirical Methods in Natural Language Processing. Lisbon, Portugal,pp. 1073–1078.
Shah, K., Logacheva, V., Paetzold, G. H., Blain, F., Beck, D., Bougares, F., and Specia, L.(2015b). “SHEF-NN: Translation Quality Estimation with Neural Networks”. In: The
Tenth Workshop on Statistical Machine Translation. Lisbon, Portugal, pp. 342–347.Sim Smith, K., Aziz, W., and Specia, L. (2016a). “Cohere: A Toolkit for Local Coherence”.
In: The Tenth International Conference on Language Resources and Evaluation. Portorož,Slovenia, pp. 4111–4114.
Sim Smith, K., Aziz, W., and Specia, L. (2016b). “The Trouble With Machine TranslationCoherence”. In: The 19th Annual Conference of the European Association for Machine
Translation. Riga, Latvia, pp. 178–189.Snover, M., Dorr, B., Schwartz, R., Micciulla, L., and Makhoul, J. (2006). “A Study of
Translation Edit Rate with Targeted Human Annotation”. In: The Seventh biennial con-
ference of the Association for Machine Translation in the Americas. Cambridge, MA,pp. 223–231.
Snover, M., Madnani, N., Dorr, B. J., and Schwartz, R. (2009). “Fluency, Adequacy, orHTER? Exploring Different Human Judgments with a Tunable MT Metric”. In: The
Fourth Workshop on Statistical Machine Translation. Athens, Greece, pp. 259–268.Soricut, R., Bach, N., and Wang, Z. (2012). “The SDL Language Weaver Systems in the
WMT12 Quality Estimation Shared Task”. In: The Seventh Workshop on Statistical
Machine Translation. Montréal, Canada, pp. 145–151.Soricut, R. and Echihabi, A. (2010). “TrustRank: Inducing Trust in Automatic Translations via
Ranking”. In: The 48th Annual Meeting of the Association for Computational Linguistics.Uppsala, Sweden, pp. 612–621.
Soricut, R. and Marcu, D. (2003). “Sentence Level Discourse Parsing using Syntactic andLexical Information”. In: The 2003 Conference of the North American Chapter of the
Association for Computational Linguistics: Human Language Technologies. Edmonton,Canada, pp. 149–156.
Soricut, R. and Narsale, S. (2012). “Combining Quality Prediction and System Selectionfor Improved Automatic Translation Output”. In: The Seventh Workshop on Statistical
Machine Translation. Montréal, Canada, pp. 163–170.

References 183
Specia, L. and Farzindar, A. (2010). “Estimating machine translation post-editing effortwith HTER”. In: Proceedings of AMTA-2010 Workshop Bringing MT to the User: MT
Research and the Translation Industry. Denver, CO, pp. 33–41.Specia, L., Paetzold, G., and Scarton, C. (2015). “Multi-level Translation Quality Prediction
with QuEst++”. In: The 53rd Annual Meeting of the Association for Computational
Linguistics and Seventh International Joint Conference on Natural Language Processing
of the Asian Federation of Natural Language Processing: System Demonstrations. Beijing,China, pp. 115–120.
Specia, L., Turchi, M., Cancedda, N., Dymetman, M., and Cristianini, N. (2009a). “Estimatingthe Sentence-Level Quality of Machine Translation Systems”. In: The 13th Annual
Conference of the European Association for Machine Translation. Barcelona, Spain,pp. 28–37.
Specia, L., Turchi, M., Wang, Z., Shawe-Taylor, J., and Saunders, C. (2009b). “Improving theConfidence of Machine Translation Quality Estimates”. In: The 12th Machine Translation
Summit. Ottawa, Ontario, Canada, pp. 136–143.Specia, L., Hajlaoui, N., Hallet, C., and Aziz, W. (2011). “Predicting machine translation
adequacy”. In: The 13th Machine Translation Summit. Xiamen, China, pp. 19–23.Specia, L., Shah, K., Souza, J. G. de, and Cohn, T. (2013). “QuEst - A translation quality
estimation framework”. In: The 51st Annual Meeting of the Association for Computational
Linguistics: System Demonstrations. Sofia, Bulgaria, pp. 79–84.Stanojevic, M., Kamran, A., Koehn, P., and Bojar, O. (2015). “Findings of the 2015 Workshop
on Statistical Machine Translation”. In: The Tenth Workshop on Statistical Machine
Translation. Lisbon, Portugal, pp. 1–46.Stede, M. (2011). Discourse Processing. en. Synthesis Lectures on Human Language Tech-
nologies. Morgan & Claypool Publishers.Steele, D. and Specia, L. (2016). “Predicting and Using Implicit Discourse Elements in
Chinese-English Translation”. In: Baltic J. Modern Computing 4.2, pp. 305–317.Stymne, S., Danielsson, H., Bremin, S., Hu, H., Karlsson, J., Lillkull, A. P., and Wester,
M. (2012). “Eye Tracking as a Tool for Machine Translation Error Analysis”. In: The
8th International Conference on Language Resources and Evaluation. Istanbul, Turkey,pp. 1121–1126.
Tomita, M., Masako, S., Tsutsumi, J., Matsumura, M., and Yoshikawa, Y. (1993). “Evaluationof MT Systems by TOEFL”. In: The Fifth International Conference on Theoretical and
Methodological Issues in Machine Translation. Kyoto, Japan, pp. 252–265.

184 References
Tu, M., Zhou, Y., and Zong, C. (2013). “A Novel Translation Framework Based on RhetoricalStructure Theory”. In: The 51st Annual Meeting of the Association for Computational
Linguistics. Sofia, Bulgaria, pp. 370–374.Turchi, M., Steinberger, J., and Specia, L. (2012). “Relevance Ranking for Translated Texts”.
In: The 16th Annual Conference of the European Association for Machine Translation.Trento, Italy, pp. 153–160.
Ture, F., Oard, D. W., and Resnik, P. (2012). “Encouraging consistent translation choices”. In:The 2012 Conference of the North American Chapter of the Association for Computational
Linguistics: Human Language Technologies. Montreal, Canada, pp. 417–426.Turian, J. P., Shen, L., and Melamed, I. D. (2003). “Evaluation of Machine Translation and its
Evaluation”. In: The Ninth Machine Translation Summit. New Orleans, LA, pp. 386–393.Ueffing, N. (2006). “Word Confidence Measures for Machine Translation”. PhD thesis.
Aachen, Germany: Computer Science Department, RWTH Aachen University.Ueffing, N., Macherey, K., and Ney, H. (2003). “Confidence measures for statistical machine
translation”. In: The Ninth Machine Translation Summit. New Orleans, LA, pp. 394–401.Ueffing, N. and Ney, H. (2007). “Word-Level Confidence Estimation for Machine Transla-
tion”. In: Computational Linguistics 33.1, pp. 1–40.Ueffing, N. and Ney, H. (2005). “Word-level confidence estimation for machine translation
using phrase-based translation models”. In: The Human Language Technology Conference.Vancouver, Canada, pp. 763–770.
Wisniewski, G., Singh, A. K., Segal, N., and Yvon, F. (2013). “Design and Analysis of aLarge Corpus of Post-Edited Translations: Quality Estimation, Failure Analysis and theVariability of Post-Edition”. In: The 14th Machine Translation Summit. Nice, France,pp. 117–124.
Wong, B. T. M. and Kit, C. (2012). “Extending machine translation evaluation metrics withlexical cohesion to document level”. In: The 2012 Joint Conference on Empirical Methods
in Natural Language Processing and Computational Natural Language Learning. JejuIsland, Korea, pp. 1060–1068.
Xiao, T., Zhu, J., Yao, S., and Zhang, H. (2011). “Document-level consistency verification inmachine translation”. In: The 13th Machine Translation Summit. Xiamen, China, pp. 131–138.
Xiong, D., Ben Guosheng Zhang, M., and Liu, Q. (2011). “Modeling Lexical Cohesion forDocument-Level Machine Translation”. In: The 23rd international joint conference on
Artificial Intelligence. Beijing, China, pp. 2183–2189.

References 185
Xiong, D., Zhang, M., and Li, H. (2010). “Error detection of statistical machine trans-lation using linguistic features”. In: The 48th Annual Meeting of the Association for
Computational Linguistics. Uppsala, Sweden, pp. 604–611.Zhao, B. and Zing, E. (2008). “HM-BiTAM: bilingual topic exploration, word alignment and
translation”. In: Advances in Neural Information Processing Systems. Ed. by J. C. Platt, D.Koller, Y. Singer, and S. Rowels. 20th ed. Cambridge, MA: MIT Press, pp. 1689–1696.
Zhengxian, G., Yu, Z., and Guodong, Z. (2010). “Statistical Machine Translation Basedon LDA”. In: The Fourth International Universal Communication Symposium. Beijing,China, pp. 279–283.