document resume ed 210 891 swartz; stanley i.; and … · a learning disabilities eligibility...
TRANSCRIPT
(
DOCUMENT RESUME
ED 210 891 EC 140 E93.
AUTHOR Swartz; Stanley I.; And Others'1ZZLE ° A Learning Disabilities Eligibility Streenirg
Procedure. .
INSTITUTION Western Illinois UniVe, Macomb. Coll. cfEducation,
PUB DAZE Oct 81 ct.
NOTE ..- 48p.; Paper presented at the Annual Conference of-the.
% Illinois Council of Exceptional Childrem 1Chicagor..-
(
. , IL, 06tober 1981), '.
-14l
EDES PRICE. r\ MF01/PCO2 Plus Pobtage.DESCRIPTORS . *Eligibility; Guidelines; *Handicap Identification;
*Lea;ning Disabilities; School Policy; '*ScreeningTests:: Student" Characteristics; *UnderachievementIllinois (Macomb) ..IDENTIFIERS
ABSTRACT ...
:The document contains a review of 'the literature opscreening for learning disabilities; a report of a ?faecal), Mills,study testing the Myklebust Learning. Quotient method of identify nglearning disabilitied; and%guidelines for learning disabilityeligibility screening in the Macomb schools. In the introduction,characteristics fthe learning. disabled child are considere,d, aid
1the Myklebust fo mul, which looks at the ratio of actual achievementlevel to eacpecte achievement level, ieexplained. Studies evaluating.the formula are noted. The Macomb' study used the formula with 163.children previously diagnosed as learning disabled. Ss in grades 1through 12 were given the Kuhlman-Anderson test (to generate mental.
,age); the Pekhody-Individuali;Achievement Teste'and-tte Sbiemce. Re4earch AsSodiates Achievement Series, Wechsler Intelligence Scale
scores were also used when available to calculate learning quotientaccdrding to the Myklebust fbrmula. Results indicated that .use of the
. formula would decrease the number of children labeled learningdisabled 1from 6% bf the total school population to 4%. Eodifications,of the formula when applied to-grades 1 and 2 and to high scicol agedstudents are proposed*4he third-sethicn:presents: the screening stepsto be used in applying /the. eligibility formula in the Mabomb schoolsWith.separate guidelines for grades 1 and 2,,3 and 8, and highschool. Also provided are forms for recording results cf eligibility .
screening..4Appended are statistical tables detailing results of the -
study.,
(DB) ., ,4
4.
A
********************** *****************************************41****** Reproductions -snip ed by EBBS are the best that can be madei, *
from the original document.-*********,**************************************4******#********4******

5
t
1
OU.S. DEPARTMENT OF EDUCATION
NATIONAL INSTITUTE OF EDUCATIONEDUCATIONAL RESOURCES INFORMATION,
CENTER (ERIC/
his document has been reproduced asreceived from the person o? -organization
originating it.El Minor changes have been made to improve
reproduction quality,
Points of view or opinions stated in this docu-
ment do not necessarily represent official MEposition or policy
-.
A LEARNING DISABILITIES ELI IBILITYSCREE
Stanley L, SwartzWestern Illinois University
Janet Miner and Nancy Taylor'--Macomb Community Unit School District #185
'NG PROCEDURE
,
V
Illinois Council fortExceptionalNk Chicago, Illinois
October 1981 N
S
Children
"PERMISSION TO REPRODUCETHIS
MATERI L HAS BEEa-GRANT BY
TO THE EDUCATIONAL RESOURCES
INFORMATION CENTER (ERIC)."
.
e"
I
k
c.
t."'S
TABLE OF CONTENTS
Page
List of Committee Members ii
List of Tables. ,. . iv
I. Introductiona 1
Identification of Learning'Disabled Children 2
Eligibility Screening
II. The Macomb Study
Subjects
-4 Procedure
a
so
Results , . . . . . . . . . . . . . . . . . . . 6
3
5
5
5
Diicussion
,
III. Guidelines for Learning DisabLuty Eligibility Scr
Directions
Forms
,
pibliography
k
iii 3
Ois
9
ening. . 14r
14
16
18
`-t
Table
v
/
ti
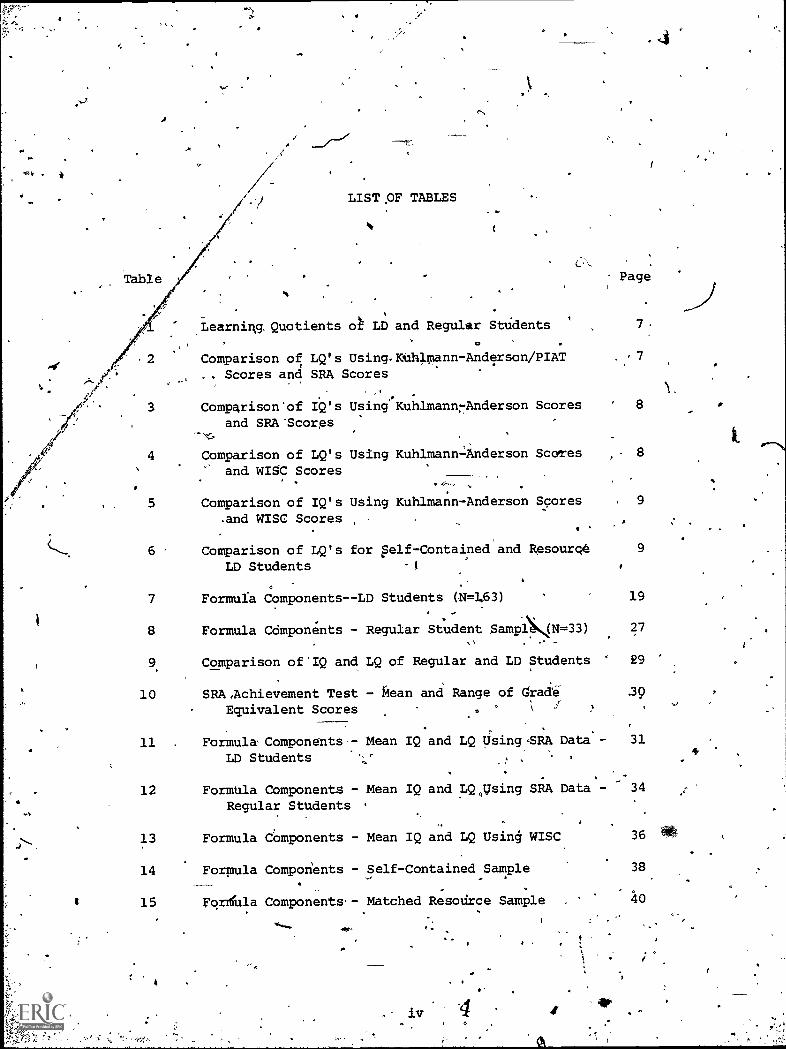
LIST OF TABLES
Page
Learning. Quotients of LD and Regular Students 7:
0
2 Comparison of LQ's Using.Klhlmann-Anderson/PIAT .: 7
Scores and SRA Scores
3 Comparison'of IQ's Using Kuhlmann7Anderson Scores 8
and SRA 'Scores
4 Comparison of LQ's Using Kuhlmann=Anderson Scares 8
and WISC Scores
5 Comparison of IQ's Using Kuhlmann-Anderson Scores 9
.and WISC Scores
6 Comparison of LQ's for pelf-Contained and Resourqe 9
LD Students
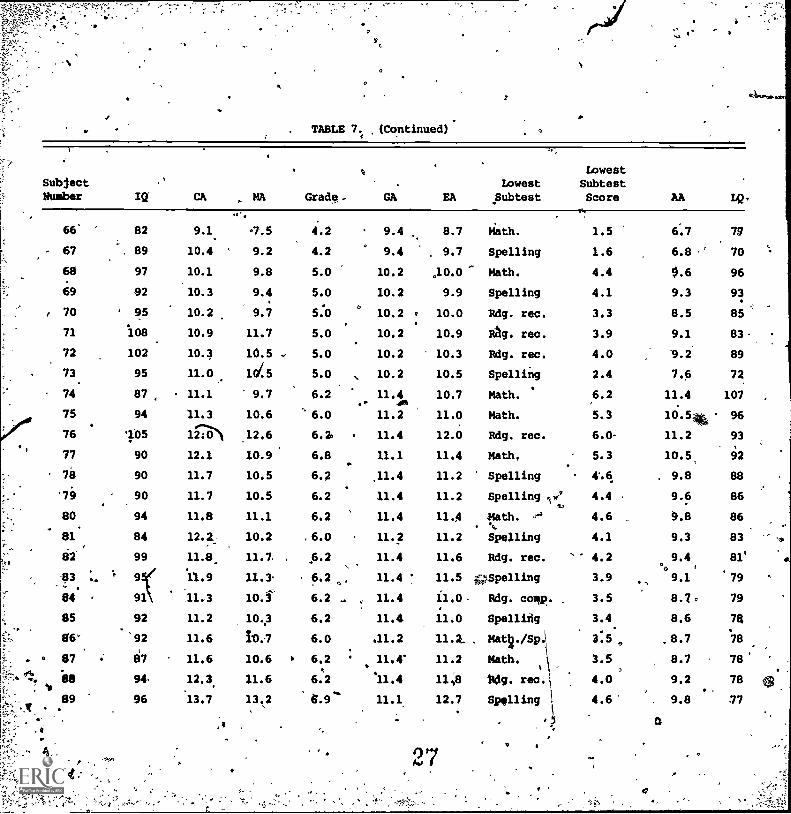
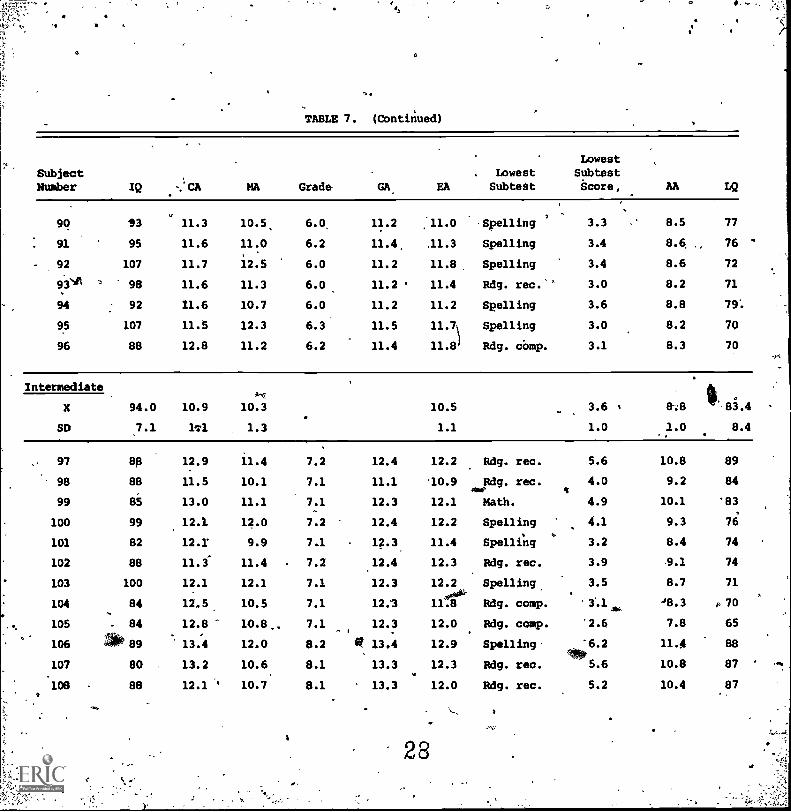
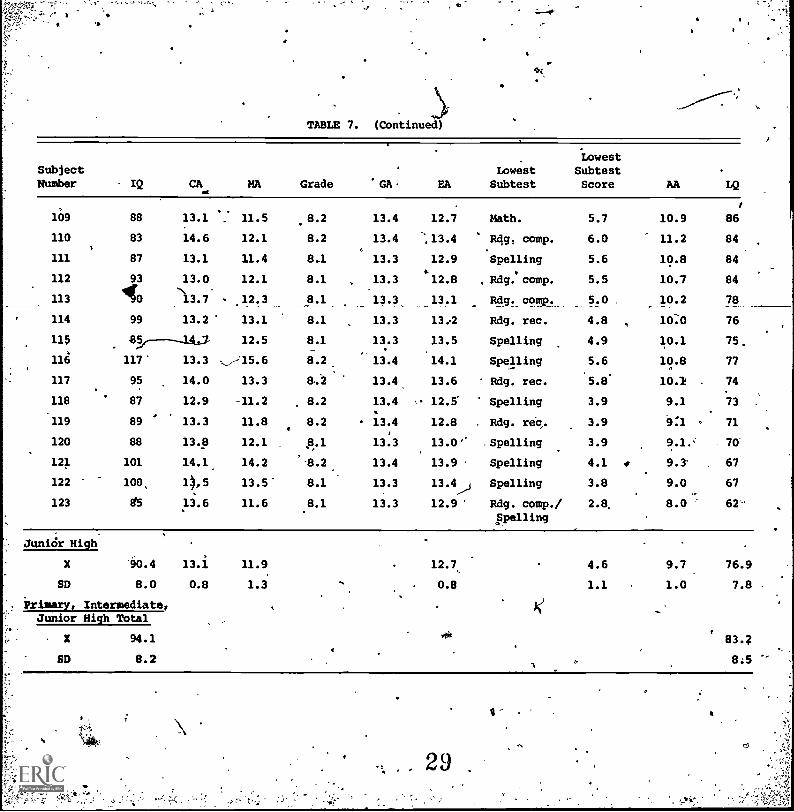
7 Formula Components--LD Students (N =163) 19
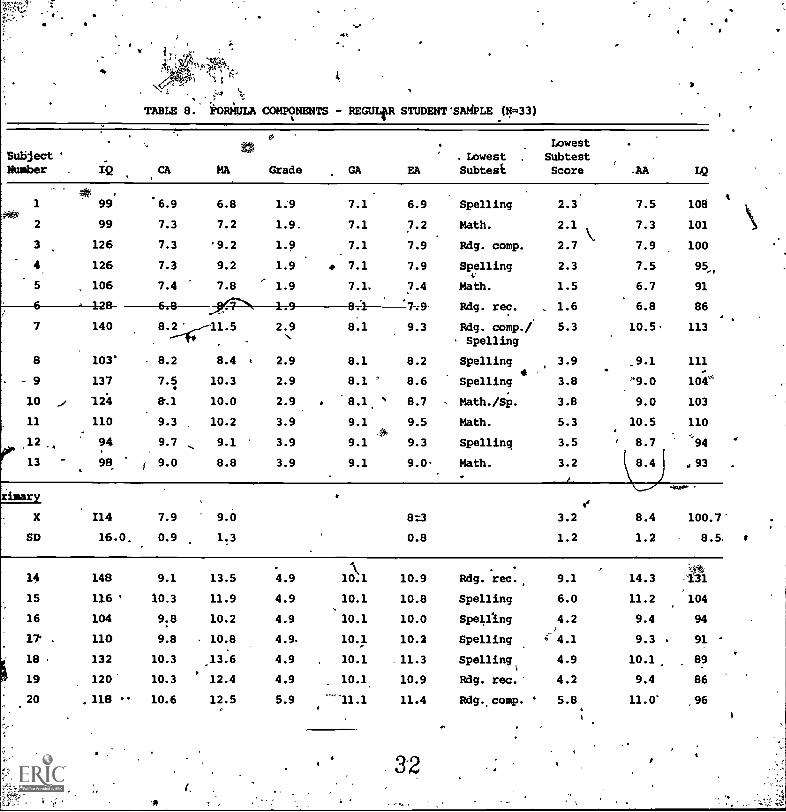
8 Formula Ccimponents - Regular Student SamplN=33) 27
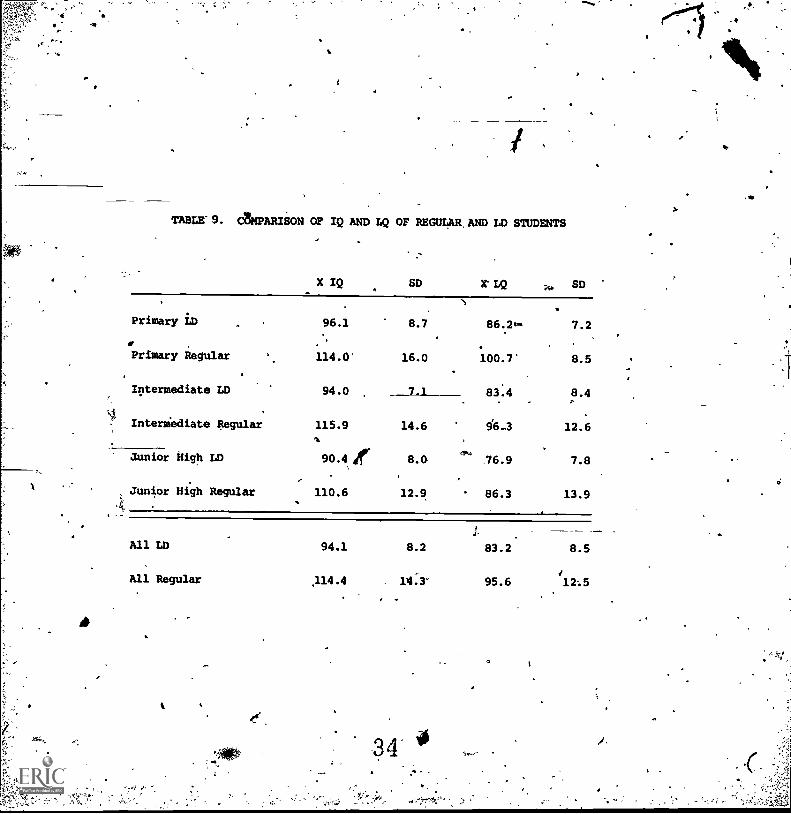
9. Comparison of'IQ and LQ of Regular and LD Students 29
10 SRA ,Achievement Test - Mean and Range of rade 30
Equivalent Scores
11 Formula. Components,- Mean IQ and LQ Using SRA Data - 31
LD Students-
12 Formtla Components - Mean IQ and LQ,Using SRA Data - 34
Regular Students
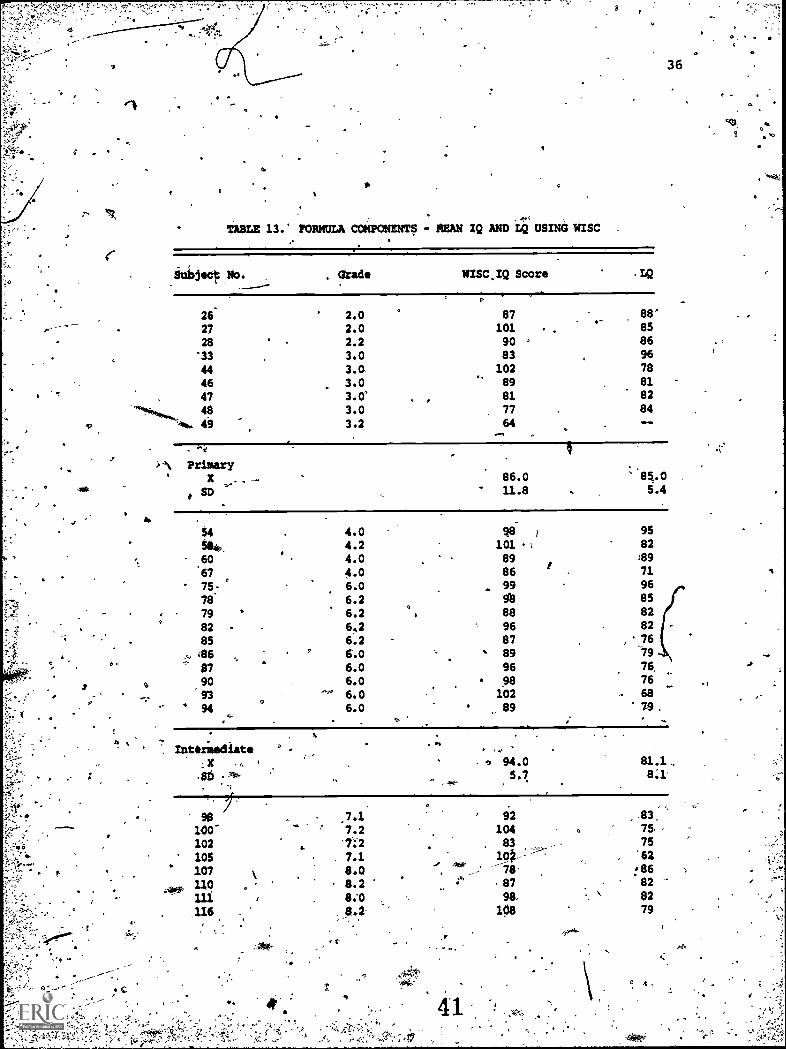
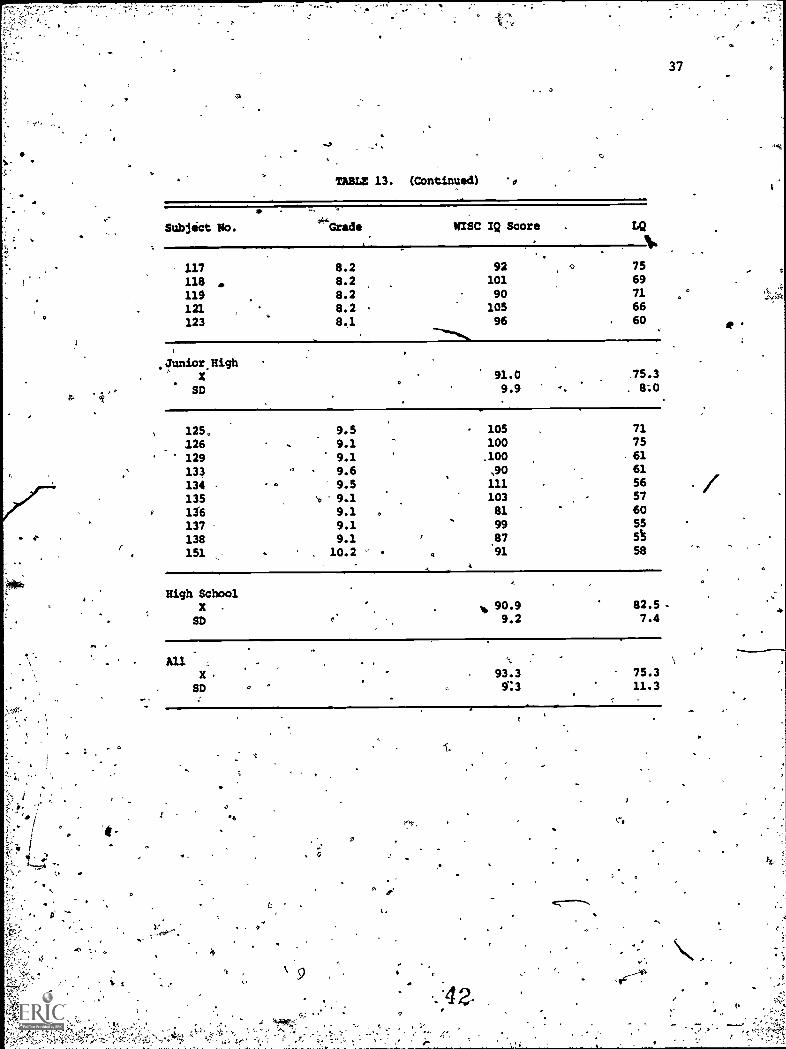
13 Formula domponents - Mean IQ and LQ Using WISC 36
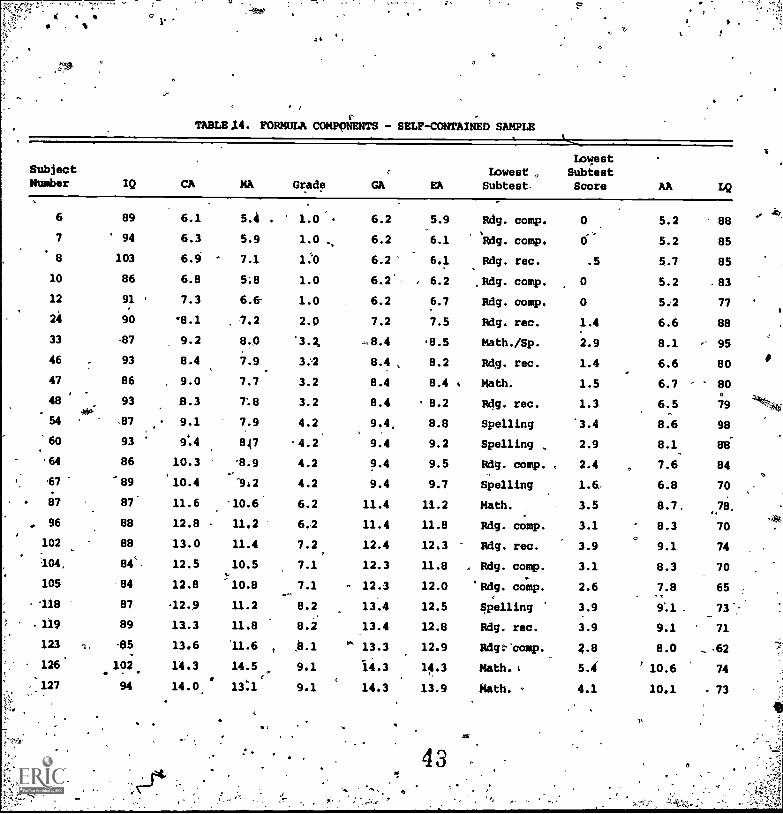
14 Formula Components - Self-Contained Sample 38
15 ForAUla Components - Matched Resource Sample 40
About the authors:
#
,
Stapley L. Swartz, Ph.D., Associate Professor and Chaikman of the
4 Graduate Program, Special Educ.ition Department, Western Illinois
University, Macomb, Il/.11pois
Janet Miner, LD Rdsource Teacher, Macomb Community Unit School District0 #185, Macomb Illinois
r.
,
Nancy Taylor, Special Education Team Leader, Macomb Community Unit'
School District #185, Macomb, Illinois
Js
al*
A
I. INTRODUCTION
7
N
The Learning pisability EligibilityScreening,procedure has been
_
developed by the MacombCommunity Scliools to assist the regular classroom
teacher andithe learning disability teacher identify andmore appropriately
serve children, who,are learning disabled. It is hoped that this procedure ,
will maximize the service available to children and minimize the tiie\s4Dent
determining Iiigibility.
Conservative estimates indicate that'from one to three percent of
school. aged children have a learning disability seriousenough to require'
special education services: Studies have also established that many less
severely disabled students are handled routinely by the regular classroom_
-teacher and if counted could raise the total number'of LD children to as,
high as.seven percent.
The term "learning disability" has emerged after decades, of confusion
regarding various groups of children experiencing similar difficulties.
It hashas included such terms as neurologically impaired,word blindness,.
., A : 4.. .
Strauss syddiome,.minima brain dysfunction, brain injurp, minimal brain.
.1 ...
%., ,
damage,.perceptual disorder, and dyslexia. The lack of a common definition ,
,, "
,,
for LD has caused many lay people and profedsionals alike to inaccurately. ." . .
,..
equate-learning disabilities with.learning problems of almost any type.
. .,to
.
- The Specific learning Disabilities Amendment of P.L. 94-142 has provided
a definition designed to resolve this confusion.
Specific learning disability means a disorder. . . whi ch
may manifest itself'in an imperfect ability to listen, think,speak, re0,- write, spell, or to do mathematical calcul iong.
The term includes such conditions as perceptual handicapbrain linitry-,-ittipisral-btlaim-elysfunc,t-i-cyrry
,s-
O
2
developmental aphasia. The term does not include childrenwho have learning problems which are primarily the result ofvisual, hearing, ot,motar handicaps, of mentalretardation,Of emotional disturbance, or of environmental, Cultural, or*economic disadvantage. "(Federal Register, 1977)
It is clear that LD children'are not a homogenous group. They have
been generally characterized with'some of the following attributes:
1) hyperactivity, 2) high distraction rate-. 3) .easy frustration, 4) persevere-.
tion,45) motor deficits, 6) short attention span, 7) impulsiveness, 8)' short
mernory span, and 9) disturbed self-concept and body image,
It is important to note that many children whO have a learning disability
. may not qualify to receive special education-sei-vices. To qualify as a
handicapped child who is learning disahled the-child will "not achieve
commensurate with_his or her age and ability levels and exhibit) e severe. ,
discrepancy between achievement' and intellea tilal ability in one or more ofK, le
the following areas: 1) oral expression, 2) listening comprehension,,
0.3) written expresSi9n, 4) basic reading skill, 5) reading comprehehsion,
'6) mathematics calculation, or mathematics reasoning." (Federal Register/
.
1977) The child must e xhibit a severe discrepancy between ability and
achievement to be considered eligible fot special education and related4-2
services.
Identification of Learning Disabled Children
"'
There is general agreement/that considerable inconsistency exists int
the identifiCation of learning disabled children and that the process is
:certainly unreliable and probably discriminatory (Adelman, 1979; Sherry;
1979; Van Nagel, 1977; Webster, 1977). Teacher referrals remain the major
Whrce of identification although widely disparate definitions of learning
4 disabilities are emplgyed. Considerable disagredMent has been found among
special educators, psychologists,- speech therapists, and parents'regarding
the major parameters of a learning disability_ (Alley, Deshler, arPi Millard, .5/\''
\1/4
3
a' l979).' Though a multidisciplinary staff approach employs an attractive
group decision making process, it is probably bettik'employed ag a program
planning device than a method of identifying LD children. The tests
administered-and'the information generated by the multidisciplinary team..
appear to be unrelated to reliable identification of learning disabilities
(Thurlow and Ysseldyke, 1979). Effective assessment is the process of
collecting data that can be reliably used in making educatipnal decisions.
That learning disability eligibility must be based on an achievement-,
ability discrepancy is clear in the regulation's of Public Law 94-142. It
is also generallj accepted by authorities in'Ae field that an objective
o
4
way of assessing this discrepancy is needed (Hanna, Dyck, and Holen, 1979)._
Eligibility Screening,
Myklebust (1972) proposed a ratio of actual achievement to expected
achievement, expressed as a Learning Quotient eLQ), as a method of'. .
.
So determining severity of leax'ning disability. The.formula for computation
of the Learning Quotient is as follows:
44%
actual achievement levelLQ = where
expected achievement level.3
act4a1 achievement is a grade equivalent score for any achievement test or
subtest plus 5.2, and exriected achievement level is the average of the
following:vf
chronological age, 4grade level plus 5.2,and mental age.
Grade level irre-actual grade placement of a student and'utental age
(MA) is that yielded by an intelligence 'est. Chronological, age (CA) is,
incorporated because it reflects physiological maturity. Grade level is
included, as a qhantitative indicator of experience, particularly with
respect tocpporturilty for school learning.' The constant value 5.2 (based'
a

4
on school entry ape), added to grade level, is a conversion factor which
f
,Ap-adjusts grade level to the sane relatieve scale as MA and..Ct(Macyt
, Bake,
and Kosinski, 19761. Myklebust suggested that an LQ cutoff value of 90-be
used as one ba'sii for classification of a learning diigbility.
Two major studies.have been conducted on the use of the Myklebust
forinula: Macy,Baker, and Kosinski (1976) and the Skokie (IL) School
,District (1969). .Macy, et al., found that learning quotient distributions ,
differed among grade levels, subject errs and gender-by-ethnicity subgroups.
They:fOund that an IQ of 9C was heeded to use the formula and that the.
inclusion of the grade equivalent scores created a liMitatiOn to the
A-. -
validity of the learning quotient. They indicated that variable criterion0 -
7
vanes (and cutoff scores) should be used 'to guarantee fair selection.
The Skokie study used a two-phase appppach that employed group tests
in phase one and an individually administeied test (WISC) in phase two.
They found the learning quotient to be an effective method to establish
objective placelent criterion. Variable cutoff scores were recommended
based on the results of their study that included 93 for the first three
months of'grade'two or below (many children experiencing learning problems
could not arithmetically attain an 89 or less), 85 for grades two through
'i1o0(89 resulted in the identification of many mild underachievers) and a
continbed monitoringof 86-89 scores in grades two through six (and
1difficulty in two academic areas) for dontinuing problems and possible
future placement.se
The use of a formula to identifythe learning disabled is not without
its critics (McLeod; 1979; Hanna, Dyck, and Holen, 1979). Such a method
is fraught with statistical errors anderrors of assumption and both studies
indicate the need for considering additional criteria when claSeifyingL
learning disabilities.00"
9
.
4
.II. THE MACOMB STUDY
The Myklebust Leaining Quotient Methoeof'identifying learning
'disabilities was field tested (Swartz, 1980) to determine appropriate egs
and efficacy for use lin the Macomb COmmunity Unit School District. The
study generated new data from instruments employed especially to test the
.formula and analyzed existing achievement data in relation to formula
utility.
4
Subiects ,
All children in grades one through twelve diagnosed as learning
disabled (N=163). were used in the study. Selfz-cOntained LD children (N=32)
AO
were matched by gade aid sex to an equal group of resourbe.LD children for
group comparisons.e
A rand:a sample of regular students in grades one through eight N=33)
was selected for comparison to a random group of LD students (N=40) selected
from the total 1.04 population. Children used for the comparison of WISC
.scores constituted a sample of the whole (N=46), all LD children.who had
been administered the WISC in grades one through twelve.
Procedure
The procedure employed tests that can be administered by teachers in a
relatively short period of time. The Kuhlmann-AndersomTest was used-to-
generate mental age. This test was administered in small groups. Achievement
level was measured by the Peabody Individial Achievement Test (PIAT). This4 '
test was-administered individually to all children in the study. The PIAT
4
AC.2*

A6
general informatioVsubtest was not used'in calculating the formula,becauSe,. .
sit should generally not be affected by a learning disability. Calculation
of LQ was terminated for children who scored below 80 on the Kuhlmann-.
Anderson Test or for those whose behavior Problems we affecting test
administration and results. All LQ formula components u ing this data for LD
students is listed in Table 7 of the Appendix and data for the regular
student sample is listed in Table 8, &so in the Appendix. A summary
comparison of this data can be fo9nd in Table 9.
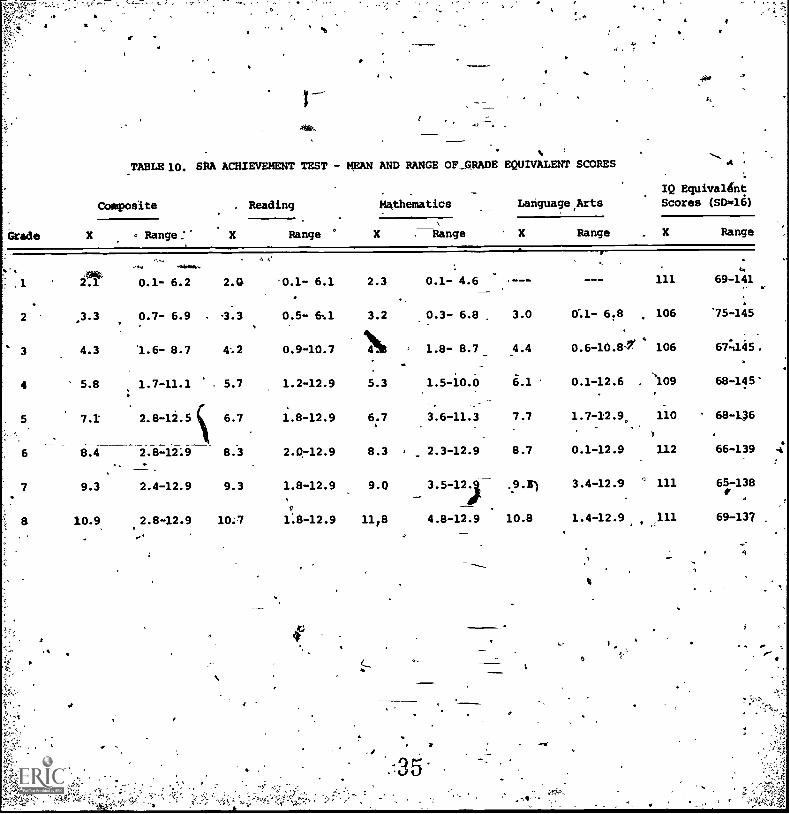
TOe SRA Achievement Series is adminittered each year to all students
in the district for grades one through eight. In addition to achievement
scores this test also generates an IQ equivalent score.- The results of
this testing are summarized in Table 10 in the Appendix: Learning Quotients
were calculated using this data and the results are listed for a sample of
LD- .students'in Table 11 and fOr aesample of re lar students in Table 12 in
the Appendix.
Scores for the Weschler Intelligence, Scale for Children. (WISC) were
not available for all LD students. Though no new data was generated during
, I .
this study, existing data was collected to analyze test stability. Learning,
Quotients calculated using WISC scares .are listed in Table 13.vs.
.
Learning Quotients calculated for LLD self-contained children and the,
,.
matched sample of LD resource children are listed separately in Tables 14-
. . 7
,-)
..
san4 15 of the Appendix. 6
4 , .
Results
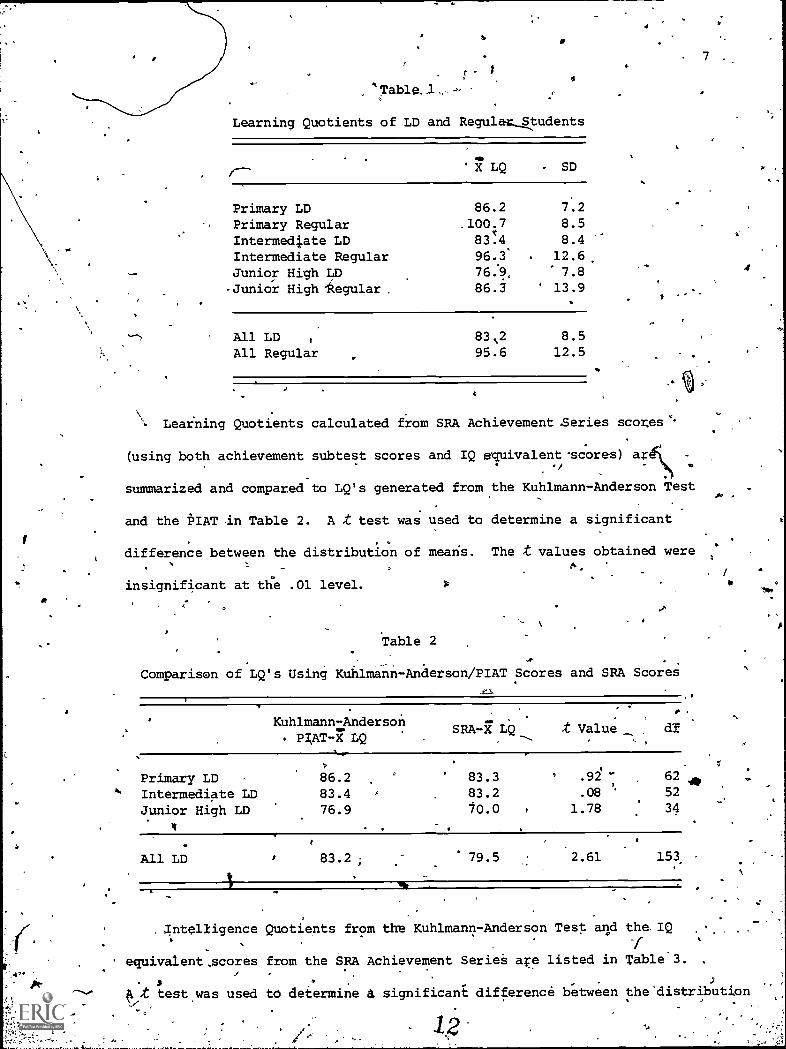
Learning Quotients calculated from the,Kuhlmann-Anderson Test and the,
PIZ.T for LD and regular students are summarized ip Table 1. Mean'LQ's and
Cstandard deviations were calculated for primary, intermediate, and junicir,
1
high levels. Decreases are noted for both groups as grade level increases.
.
a
r .
a' Table. 1 -
Learning Quotients of LD and Regular....Atudents
7
X LQ - SD
Primary LD 86.2 7.2
Primary Regular _100.7 8.5
Intermediate LD 83.4 8.4
Intermediate Regular 96.3' 12.6.Junior High LD 7.8 4
-Junior High -aegular . 86.3 13.9
All LD , 83,2 8.5
All Regular 95.6 12.5
Learning Quotients calculated from SRA Achievement Series scores c-
(using both achievement subtest scores and IQ equivalent-scores) azO
summarized and compared to LQ's generated from the Kuhlmann-Anderson TestJO
and the PIAT in Table 2. A t test was used to determine a significant
difference between the distribution of means. The t values obtained were :
insignificant at the .01 level.
o
Table 2
/
Comparison of LQ's Using Kuhlmann-Anderson/PIAT Scores and SRA ScoreS
. 7
Kuhlmann-AndersonLQ
SRA -7 LQ
, .
t Value
Primary LD 86.2 83.3 .9i " 62411,
Intermediate LD 83.4 83.2 .08 52
Junior High LD 76.9 10.0 1.78 34
4
All LD 83.2 79.5 2.61 153, -
Intelligence
equivalent,ecores
stest was used
Quotients from the Kuhlmann-Anderson Test and the IQ
from the SRA Achievement SerieS ale listed in Table.3.
to determine significant difference between thedistribution,
12

ti
of_means. The t, values obtained for the Intekmediate LD And all LD were
signific,int at the .01-level-
a
,ad -
Table 3
CompariaoriO.fIQ's Using'KuhlmazIn-And4Pn es and SRA Sdores*IF
'Kuhlmann? rsonSRA-X IQ, t Value df
,
..e
Primary .LD 96.1 %A- 93.5 .84 66-
Intermediate LD 94.0 I 85.0 3.84* 57
L Junior High LD. 9044 95.0 1.33 35.1
/
, All LD 94.1 90.7 2.07* 162
*Significant .01
Learning Quotients calculated using Kuhlmann-AndersoA scores and WISC
scores (both using PIAT scor s) are listed in Table 4. A t test was used
to determine, 4 significant difference)
between the distribution of means.
The .t- values obtained were insignificant at the .o. level.'
Table 4
CompariSOn;f LQ's USing Kuhlmann- Anderson Scores and WISC Scores
LD
f
Primary LD 83.4 85.0 .60 15*
.0 Intermediate LD : 82.5 81.1 .44 26
Junior High LD 174.2 .75.3 .34 24
Seniok High LD 60.9 61.8 .29 i8
-0.
Kuhlmann4riderson LQ WISC LQ t Value df
76.2 . 75.3 .35 89
.7,
'"Intelligence 0.9tients from the Kuhlmann- Anderson Test-and the WISC
are liOted in .Table 5., A. test was used tQ a significant
.14
8

\lbdifference between the distr.' ution of means. The values obtaihed are
insignificant at the .01 level, .
°f
9
Table 5 .
/
Comparison of IQ's Using Kuhlmann- Anderson Scores and WISC Scores
e
Kuhlmann-Anderson IQ . WISC IQ Value df
' csfv
Primary LD 91.8 8i.0 1.26 16
Intermediate LD 91.1 . 94.0 1.45 26
Junior High LD 95.1 91.0 1.09 24
Senior High LD 96.7 90.0 1.79 18 :
All LD 91.0 93.3 1.35 90
4 Learning Quotients using Kuhlmann-Anderson and PIAT scores for self-
contained LD and resource LD children are listed in Tabl6'. A, t test was
used to determine a significant difference between the distribution of means.
The t value obtained was insignificant at the .01 leV91.
0
Table
Comparison of LQ's fox Self-Contained and Resource LD Students
X LQ t Value df
Self-Contained LD 75.0 1.6Q 62
Rescurce.LD 79.6
Discussion t
I
The Macomb School District is presently providing'special education to
children labeled learning disabled numbering in excess of 6 percent of the4
total school population. This number' is cpnsidered an overidentification

10
and appears to include-an inordinate number of underachievers (see Table 7);
Table 7 alsoindicates that a large number of children 'Served have an intel-
ligence quotient of one standard deviation- below normal. This could-be.v..
the result of teacher referral being the major method of LD identification.
Children with lower abilities and below average achievement are more likely
to be referred than thildren-with higher than average abilities and near`
average achievement. However, an achievement-ability discrepancy will
0more likely ke found in the second group. Applying the. Myklebust formula
and using a cutoff of 83 (one standard deviation from the regular student
Learning Quotient mean, Table 1) would result in the identification of four .
percent of the school population'as learning disabled. This number more
closely approximates the theoretical incidence level. It was also judged
that the low achievement of those children qualified using this cutoff was
more clearly related to an identifiable learning disability. The'use of
can 83 cutoff score does present some problems when applied to grades 1 and
2. A theoretical child in grade 1 (MA=6.0 - -CA=6.0) with no measurable
achievement would obtain an LQ of 86. theoretical child in grade 2
(MA=7.0 - CA=7.0) with achievement levels at 0, .5, and 1.0 would obtain an
, r' > .
LQ of 74, 81, and 88, respectiv4y: An adjustment_of the rutoff value
seems,indicated for grades 1 and 2. A'cutoff of_one stiadazd deSation
below the mean regulaf primary achievement woul&generate a cutoff score
. ,%4
of 92 (see Table 1). This score would continue to identify an inordinate
. t
number-AT underachievers. A 1.5 standard deviation represents an'appropriate
cutoff modification for grades 1 and 2 (LQ=88).,
The theoretical use of the MyklebUst formUla would factor lin grade,
level to grade twelve. Most learning disability, rogramModels take a
44.
decided "shift in focus in the high school. Work in academid skill deficit
areispis replaced by vocational training and the development of skills
1
#"1
necessary for productive citizenship after high'schodl graduation. This
shift in program content should be reflected.in.calculating the fortiula.
Grade Age (GA) should not skew_the.calculation of Expected Achievement (EA)
it a constant of 9.0 was entered. This would result in the following
formula modification, for high school students: .
MA + CA + 9.0- EA
Because SRA Achievement Series scores are available for all childr
in the district!, it represents an attractive source of potential_screen
en
ng
data. Learning Quotients calculated using this data were not found to be
significantly different than the-LQ's generated using the Kuhlmann- Anderson
Test and the PIAT (see Table 2): Though scores are notavailable for hig
school students (subh achievement scores generally are not); they might be
effectively used as a first level eligibility screening. The IQ equivalent
score generated by,the SRA was not found to be stble.(see Table 3). SRA
'achievement subtest data could be used, however, if the score from the
Kuhlmann-Anderson Test was substiituted for the SRA Q.equivalent score
when calculating the formula. , ;
There is some criticism of using a paper and pencil, group administered
test like the Kuhlmann-Anderson to generate an accurate measure of cognitive
abilities. A comparisbn of LQ "s using the Kuhlmann-Anderson and the WISC
found no significant differenc4 (see Table 4). A comparison of the IQ
scores generated by both tests also yielded no significant differen e (see
Table'5). Though the Kuhlmann:-Anderson Test is not being recommended.as
a substitute for the individually,d 'fiistered WISC, the score is
.t
sufficiently stable when' calculating this formulVo be used with confidence..,i.
... .
.
Though certainly various criteria are used to determine program place-
ment, there is an implicit assumption that the placement of learning
disabled students in a self-contained classroom (more restrictive) rather
.
1.6
4
a
,
12r I
.
4than a resource classroom (leSs restrictive) would be to Some extent based
on severity of learning disability. This was.not found to be the case in':
this study (see Table 6). Criteria used in- addition to the Learning
'Quotient for-program plapMent decisions should clearly be delineated to
insure that such placgmentp are not arbitrary and capricious but rather
based on objective data or'judgement criteria.
If the Myklebust Yormula is to be used as a *hod of deb(raining
eligibility for learning disability programs, some cautions appear in order.
It cannon be 069emphasizeethat the tests used in this process are designed411-.
'
to. quantify the achievement-ability discrepancy only. They are not an
effective substitute for a battery of tests used in the diagnostic-
prescriptive Prpce s :to pinpoint specific learning disibilities and,develop
instructional strategies to remediate these deficits. Screening far
eligibility must be followed by appropriate diagnostic - prescriptive methods.
(Some of the data in this ptudy suggests that lower ability child eh
are the major population being served in learning disability programs.
If this,,,is true, it is the result of an error in'aur Conceptualization of
the parameters of learning disabilities. Achievement relative to grade
level is an unim ortant notion in our consideration of who is learning
. .
disabled.
be expected
child would
achievement approximates grade level is au inadequate yardstick of child
A very bright child (1.0 to 1.5 SD ab4
ve normal) should also
to achieve at th.at level,. Likewise, a below normal ability
be expected to achieve at that level. How Silosely a child's
or program success. The availability of district-wide achievement data
and a measure of ability level would be /a valuable asset as a first level'
screening for learning disability. This would be an important addition to
teacher referral as a method of,identi ying learning disabled students.
The process described'in this study can for the most.part beI
4
accomplished by special education teachers or others familiarewith the
4
'13
.testing instruments. Only children failing to respond appropriately
the testing, instruments need be referred to the "school psychologist. This.°
,
.*
is not-! an attempt to exclude%the psychologist as an important member of
the LD team. It is rather intended to maximize the use of resources and
personnel. If this screening process provides more time for,in-depth workt
with LD children by the school, psychologist, then it'wourd be a worthy
'4iSchool psychologists who do, however, maintain an active role in qualifying
ch dren for LD service-might want to consider the application of this
formula to the results of their own testing. Clinical judgement would be
greatly supplemented if an objective measure of LD eligibility and severity
was used.
'I.
t
.
-
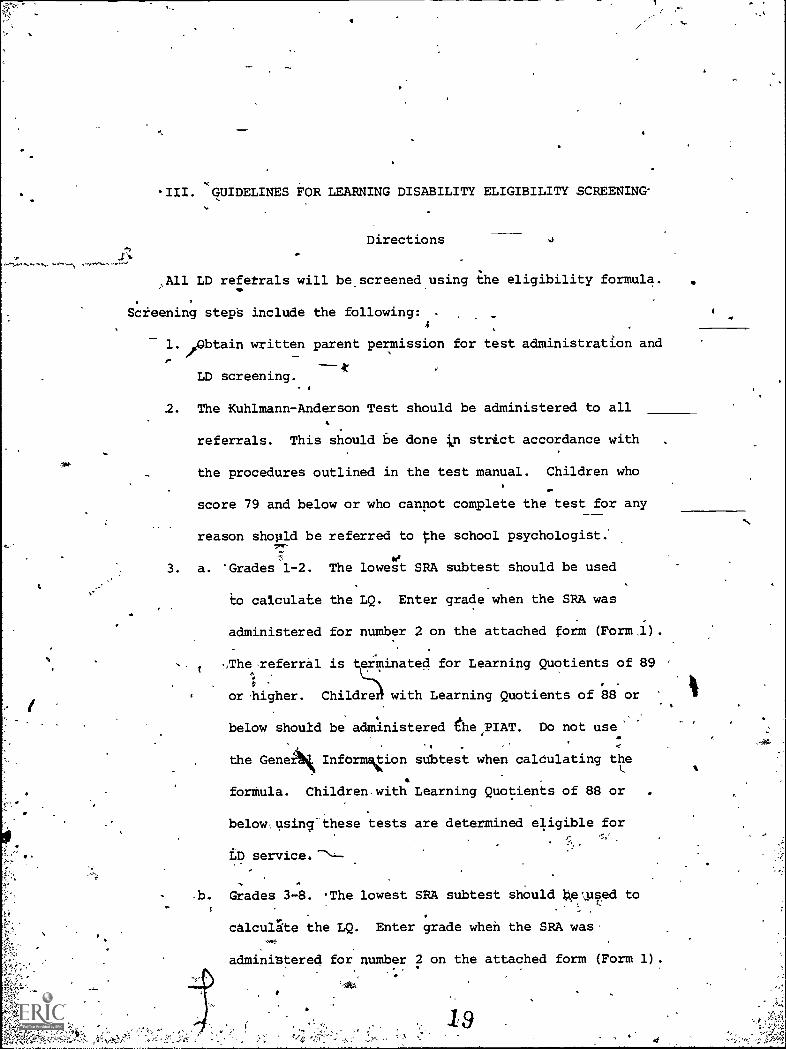
'III. GUIDELINES FOR LEARNING DISABILITY ELIGIBILITY SCREENING"
Directions 4
,A11 LD referrals will be_screened using the eligibility formula.
Scieening steps include the following:
1. ,Abtain written parent permission for test administration and
LD screening.
2. The Kuhlmann-Anderson Test should be administered to all
referrals. This should be done in strict accordance with
the procedures outlined in the test manual. Children who
score 79 and below or who cannot complete the test for any
reason shopld be referred to the school psychologist.
3. a. 'Grades 1-2. The lowest SRA subtest should be used
to calculate the LQ. Enter grade when the SRA was
administered for number 2 on the attached form (Form .1).
,Thereferral is erMinated for Learning Quotients of 89.
.
or 'higher. Childre with Learning Quotients of 88 or
below should be administered he PIAT. Do not use'
the GenjNk Inform\tion subtest when calculating the
fortula. Children.with Learning Quotients of 88 or
below.using-these tests are determined eligible for
LD service.
.b. Grades 3-8. :The lowest SRA subtest should As%used to
cAlcullte the LQ. Enter grade when the SRA was
administered for number 2 on the attached form (Form 1).
19
e
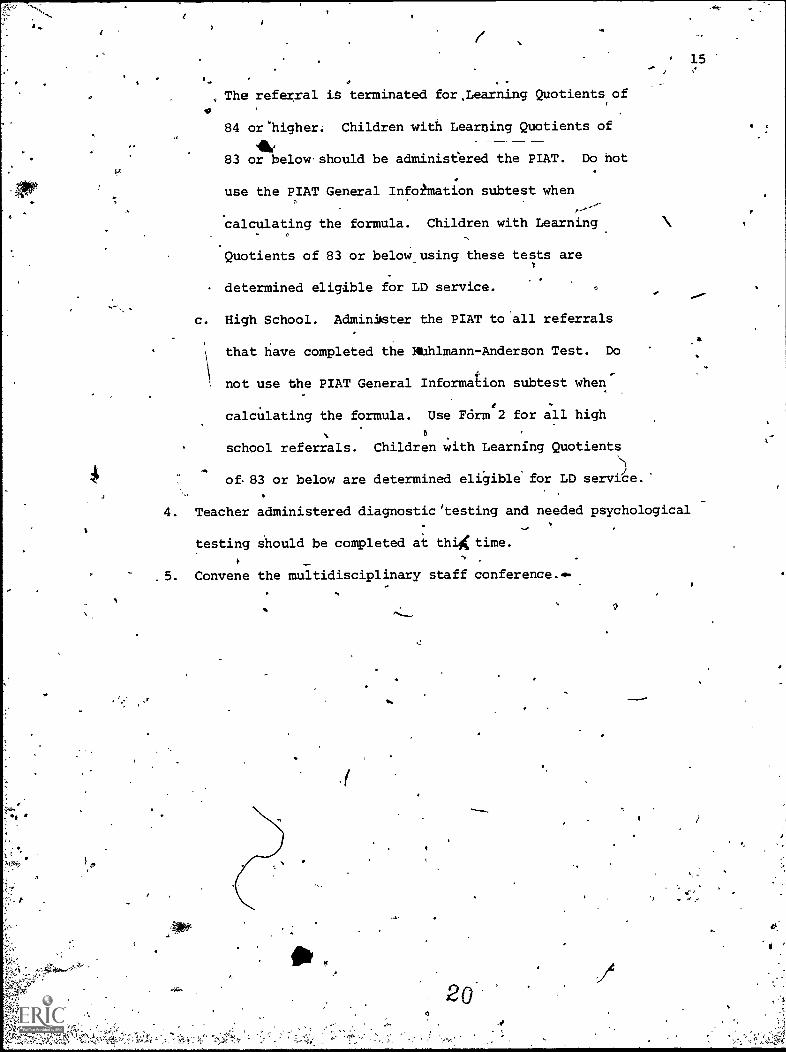
15
The referral iS terminated forLearning Quotients ofo
84 or'higher. Children with Learning Quotients of a
83 or below should be administered the PLAT. Do hot
use the PIAT General Infokmation subtest when
calculating the formula. Children with Learning
Quotients of 83 or below using these tests are
determined eligible for LD service.
c. High School. Administer the PIAT to all referrals
that have completed the Ntihlmann-Anderson Test. Do
not use the PIAT General Information subtest when
calculating the formula. Use Form 2 for all high
O
school referrals. Children with Learning Quotients
of, 83 or below are determined eligible for LD service.'
4. Teacher administered diagnostic'testing and needed psychological
testing should be completed at thi time.
.5. Convene the multidisciplinary staff conference....
9

l;
4c.
.,
__. 4.
.i 16'
LD ELIGIBILITY- SCREENING
Form 1 - Elementary and Junior High
Name
1. Kuhlmann-Anderson (Form
Age (CA)
X -CA
2. Grade
3. IA . + CA
3
+ 5.2 = GA (Grade age)
+ GA
= MA
Grade
. SEA (expectarY age)
, ..
4. Achievement Test (lowest subtest) 4. + 5.2 = . AA (aChievement age)
subtest Used
Other test data
1
Referred by
O
4 _
X 100 = LQ (learning quotient)
.
tk
r.
I
4
f
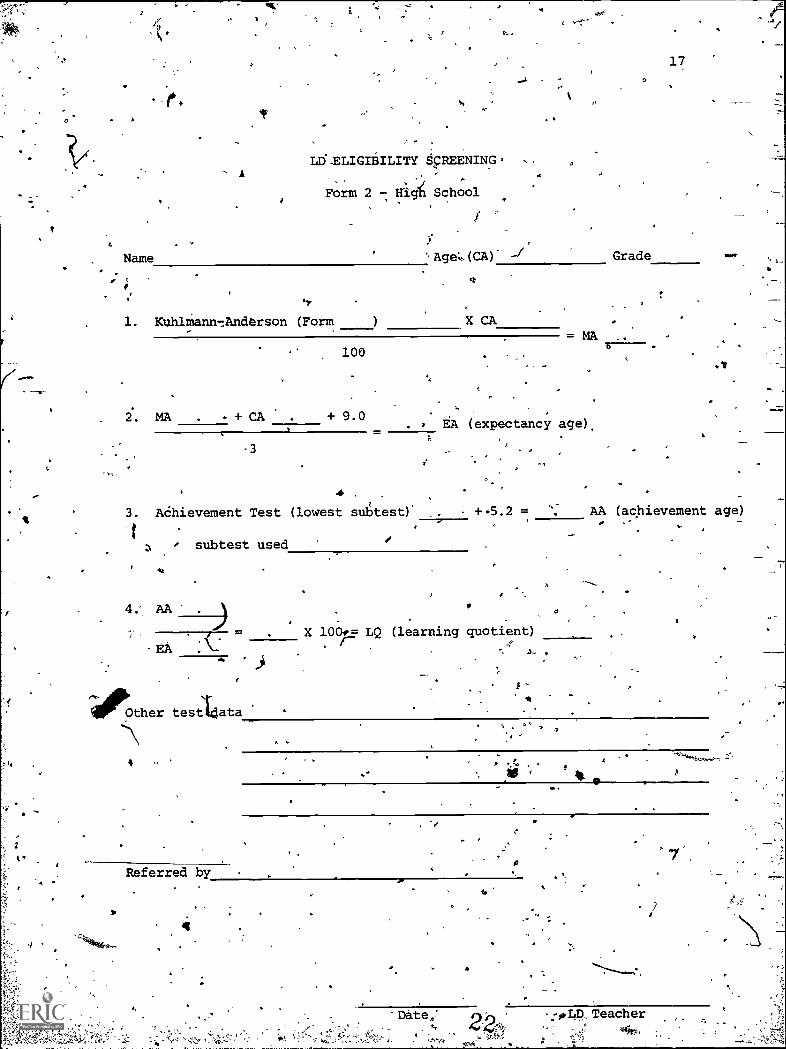
Date LD Teacher
0
'
r
9.
Lri.ELIGIEILITY SCREENING.
Form 2 - Hig School,
/
Name -(
1. Knhlmann7Anderson (Form X CA
0
2. MA
100
+ CA +9.0
3
4
9
Grade
=MA .
: EA (expectancy age)
0
17
VA.
3.AdhievementTest(lowestsubtestr-+.5.2= AA (achievement age)
A sUbtest used
44
AA
EAX 1001= LQ (learning quotient)
d
Other test'Lata
4 -
Referred by
41.
IC
O
4

0,
4
11.
1.
* 1)
S
5)
e
4-
0

NTABLE 7. FORMULA COMPONENTS--LD STUDENTS (N=163)
.Subject.'lumber IQ CA MA
\--7Grade '4 GA EA
LowestSubtest
LowestSubtest
Score, AA LQ
1
2
3
4
5
6
7
8
9
10
11
12
13
14
15
16
17
18
19
'20
- 21
22
23
'
97
107
122
954
103
89
.94
103
: 90
86
113
91-
93
96
96
103
95
98
102
83
,...----46
l0'7
103
st
.
-
,0'
.
6.0
7.4
6.3
6.8
6.8
6.1
6.3
.6.9
8.3
6.8
7.3
7.3i
7.2.
7:2\
6.1.
7.1
8.2
8.1
7.4
7.8
8.2
7.9
7.8
5.8
7.8
7.7
6.5
7.0
5.4
5.9
7.1
7.5
5.8
8.2
6.6
, 6.7
4 6.9
5.9
7.3
7.8
7.9
7.5.6.5
71
8.4
ik8.0
1
1 AP.
1:4
1.2 .
1.9/
1.0
1.0
1.0
.1.5
1.0
..4
1.0cz.
1.5...
4.
1..
2.2
2.2
2.2 ,
2.1
2.0
2.9
2.0'
' 42.3
2.0
y62
6.6
'
6.4
7.1
6.2,
6.2
6.2
.6.7
6.2
6.6
6.2.n
6-.7 °,
6:4 a.
,7.4
7w4
7.. 4
7.3
7.2
8.1
7.2
7.5
7.2
6.0
7.1
\6.9
6.6
7.0
5.9,
6.1
6.1
7.5
6.2
7.4
6.7.
6.9
6.8
6.5
7.3
%,
7.44
7.8
7.4
7.3
7.5'
7.9
7.7
Spelling
Spelling
Rdg. rec./Spelling
'Spelling
Math.
Rdg. Comp.
Rdg: comp.
Rdg. rec.
Math.
Rdg. comp.
Math...,_
Rdg. comp.
Math.
Rdg. comp.
Spelling
Spelling
Math./Rdg.
Rdg. rec./comp.
Rdg. rec.
Rdg.rec.
Rdg. rec.
Math. t
Rag. rec.
.7
1.7
1.4
1.0
1.1
0
0
.5
1.1
0
.6
'4 0
.1
0
1.4
1.7
2.0
2.0
c.. i.'26\
1.5
1.9
1.6
,
.5.9
6.9
6.6
6.2
6.3
5.2
C'4?
, 5.7
6.3
5.2
5.8
52
5.3
5.2
6.6
6.9
7.2
7.2
6.8
6.8
6.7
7.1
6.8
98
97
96
94
90,,
85
85
85
84
83
78
77
77
76
102
96
92
92
92
91
89
89
88
24
te
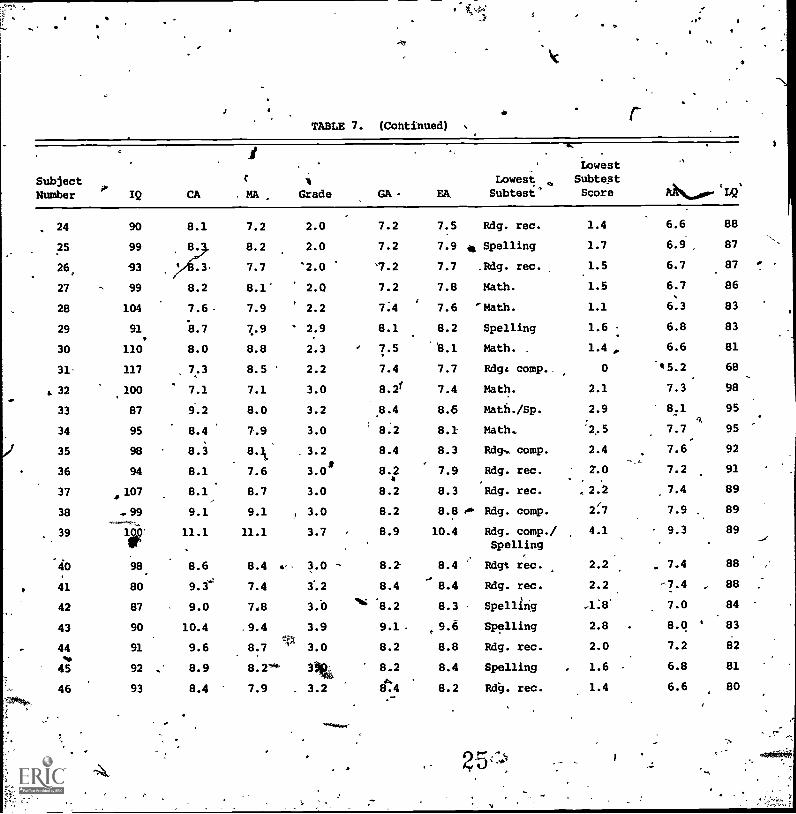
TABLE 7. (Continued)
SubjectNumber ?' IQ CA
It
. MA
.
1
Grade GA-
'
Lowest ,EA, Subtest'
LowestSubtextScore Ak./
24 90 8.1 7.2 2.0 7.2 7.5 Rdg. rec. 1.4 6.6 88
25 99 8. 8.2 2.0 7.2 7.9 ,o, Spelling 1.7 6.9 87
26, 93 7.7 '2.0 '7.2 7.7 .Rag. rec. 1.5 6.7 87
27 - 99 8.2 8.1 2.0 7.2 7.8 Math. 1.5 6.7 86
28 104 7.6. 7.9 ' 2.2 7:4 7.6 'Math. 1.1 6.3 83
29 91, 8.7 7.9 ' 2:9 8.1 8.2 Spelling 1.6 6.8 83
30 110 8.0 8.8 2.3 ' 7.5 E.1 Math. . 1.4 , 6.6 81
31 117 7.3 8.5 2.2 7.4 7.7 Rdg comp.,
0 R5.2 68
& 32 100 7.1 7.1 3.0 8.21 7.4 Math. 2.1 7.3 98
33 87 9.2 8.0 3.2 8.4 8.6 Math./Sp. 2.9 821 95
34 95 8.4 7.9 3.0I
8.2 8.1 Math. 2.5 7.7 95
35 98 8.3 8.1 3.2 8.4 8.3 Rdg. comp. 2.4 7.6 92
36 94 8.1 7.6t
3.0 8.2.
7.9 Rdg. rec. 2.0" 7.2 91
37 107 8.1 8.7 3.0 8.2 8.3 Rdg. rec. , 2.2 7.4 89
38 -99 9.1 9.1 , 3.0 8.2 8.8 ook. Rdg. comp. 2:7 7.9 89
39li
11.1 11.1 3.7 8.9 10.4 Rdg. comp./Spelling
4.1 9.3 89
40 98. 8.6 8.4 4' 3.0 8.2 8.4 Rdgt rec. 2.2 . 7.4 88
41 80 9.3*' 7.4 .23.2 8.4,
8.4 Rdg. rec. 2.2 -7.4 88
42 87 9.0 7.8 3.0 8.2 8.3 Spelling A:8 7.0 84
43 90 10.4 9.4 3.9 9.1 9.6 Spelling 2.8 8.0 ' 83
44 91 9.6 8.7 3.0 8.2 8.8 Rdg. rec. 2.0 7.2 82
45 92 8.9 8.2' 3 8.2 8.4 Spelling , 1.6 6.8 81
46 93 8.4 7.9 3.2 t4 8.2 Rdg. rec. 1.4 6.6,
80
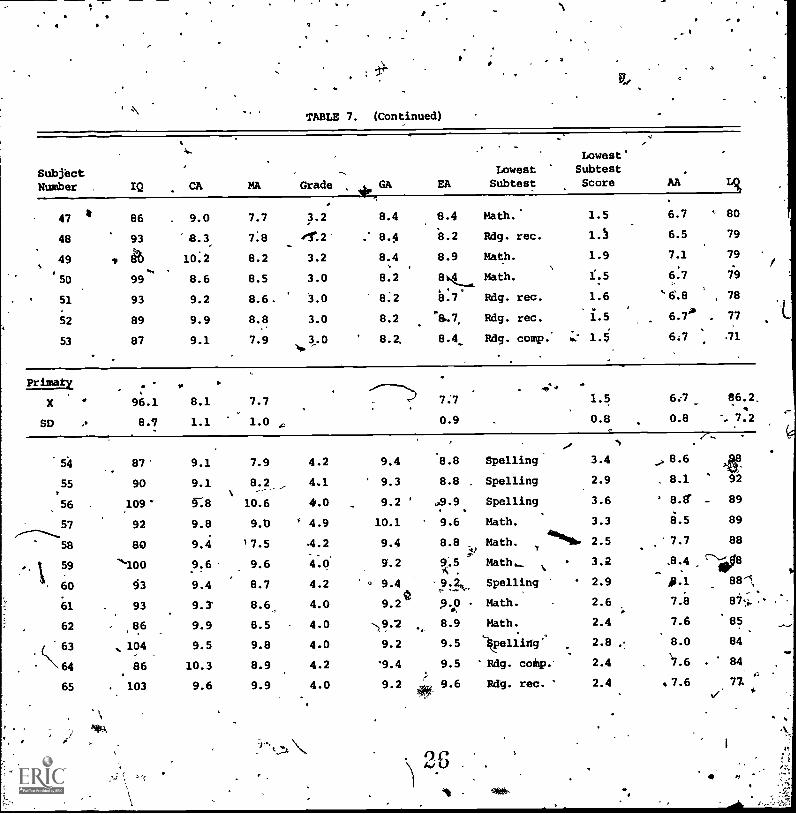
TABLE 7. (Continued)
SubjectNumber , IQ CA MA Grade
IrGAEA
Lowest'Lowest SubtestSubtest Score AA.
Ls
47
48
49
51
52
53
4 86
93
, 416
99
93
89
87
. 9.0
'8.3
10.2
8.6
9.2
9.9
9.1
7.7
7.8
8.2
8.5
8.6
8.8
7.9
3.2
'112
3.2
3.0
3.0
3.0
3.0". '
8.4
8.4
8.4. .
8.2
8.2
8.2
8.2,
8.4
8.2
8.9
848.7*
"8,7,
8.4.
Math.%
Rdg. rec.
Math.
Math.
Rdg. rec.
Rdg. rec.
Rdg. comp. ..
1.5
1.5
1.9
1.5
1.6
1.5
1.5'
6.7
6.5
7.1
6.7
s'6.8
6.7
6.7
- 80
79
79
79
, 78
_ 77
1
Primaty
.
.
;
96.1
8.7
.
8.1
1.1
7.7
1.0 ,
7.7
0.9
1.5
0.8
6:7
0.8
86.2.
". 7.2
X
SD
54
55
56
57,....-7..
58
59
60
61
62
c 63
\ 64
65
87
90
109'
92
80
-"leo93
93
86
, 104
86.
, 103
9.1
9.1
r. e9.8
9.4
9.6
9.4
9.3
9.9
9.5
10.3
9.6
7.9
8.2,-
10.6
9.0
17.5
9.6
8.7
8.60
8.5
9.8
8.9
9.9
4.2
4.1
4.0
' 4.9
.4.2
4.0
4.2
4.0
4.0
4.0
4.2
4.0
'
9.4
9.3
9.2 '
10.1
9.4
9.2
9.4
9.2*
9.2 ..
9.2
'9.4
9.2
8.8
8.8 ,
..9.9.
9.6
8.8,
15
9.2,3
e.,8.9
9.5
9.5
9.6
,,
Spelling'
Spelling
Spelling
Math.
Math. 4414111.
Math._ %
Spelling
Math.
Math.
6pelligg.
Rdg. coMp.
Mg. rec. '
3.4
2.9
3.6
3.3
2.5
3.2
2.9
2.6
2.4
2.8
2.4
2.4
1
.:
8.6
. 8.1
' 8.Er
8.5
7.7
.8.4-0.1
7.8
7.6
8.0
'7.6
.7.6
.' --
4-92
- 89
89
88
c-N-18
.88-s
el,;. :85
84
. 840
77.
V *
9'
. TABLE 7., (Continued)
SubjectNumber
66'
- 67
68
69
70
71
72
73.
74
75
76
77
78
'79
80
81.,
82
p ..
84,
85
86
. . 87
t.v
88
9
e Lowest-' Lowest Subtest
/a CA MA Grade. GA EA Stibtest Score AA Lg.
82 9.1 e7.5 4.2 9.4 8.7 Math. 1.5
. 89 10.4 ' 9.2 4.2 9.4 9.7 Spelling 1.6
97 10.1 9.8 5.0 10.2 .10.0.
Math. 4.4
92 10.3 9.4 5.0 10.2 9.9 Spelling 4.1
. 95 10.2 9.7 5:0 10.2 10.0 Rdg. rec. 3.3
108 10.9 11.7 5.0 10.2 10.9 Rag. rec. 3.9
102 10.3 10.5 5.0 10.2 10.3 Rdg. rec. 4.0
95 11.0 10(.5 5.0 , 10.2 10.5 Spelling 2.4
87 11.1 9.7 6.2 11.4 10.7 Math. 6.2.. ..la
94 11.3 10.6 6.0 11.2 11.0 Math. 5.3
'105 127-0 12.6 6.2. 11.4 12.0 Rdg. rec. 6.0
90 12.1 10.9 6.8 11.1 11.4 Math, 5.3
90 11.7 10.5 6.2 ,11.4 11.2 Spelling .6.
90 11.7 10.5 6.2 11.4 11.2 Spelling Iv' 4.4
94 11.8 11.1 6.2 11.4 11.4 Math. =4 4.6. ..,
84 12.2 10.2 6.0 11.2 11.2 Spelling 4.1
99 11.8., 11.7. , 6.2 11.4 11.6 Rdg. rec. ' 4.2
! 9 11.9 11.3 ' 6.2 11.4 ' 11.5 Spelling 3.9
91( 11.3 10.4' 6.2 .. ,... 11.4 11.0. Rdg. comp. 3.5
92 11.2 10..4 6.2 11.4 11.0 SpelliAg 3.4..
11.6 10:7 6.0 .11.2 11.2. Mat. /Sp. 3:5
87 11.6 10.6 ' 6.2 11.4' 11.2 Math. 3.5
94, 12.3
.
11.6 6.2 '11.4 11,8 14g. rec. 4.0
8 96 13.7 13.2 6'.9 11.1 12.7 Spilling 4.6
.
6.7 77
6.8 ' 70
9.6 96
9.3 93
8.5 85
9.1 83-
9.2 89
7.6 72
11.4 107
10.5* 96
11.2 93
10.5 92
9.8 88
9.6 86
9.8 86
9.3 83
9.4 81'
9.1 '79
8.7. 79
8.6
8.7
8.7 78'
9.2 78
9.8 77
27a
4
'
TABLE 7. (Continued)
SubjectNuaber IQ MA Grade GA EA
. LowestSubteSt
LowestSubtestScore, AA LQ
90 93 11.3 10.5 6.0 11.2 11.0 Spelling 3.3 8.5 77
91 95 11.6 11.0 6.2 11.4 11.3 Spelling 3.4 8.6 76 "
92 107 11.7 12.5 6.0 11.2 11.8 Spelling 3.4 8.6 72
9341 , 98 11.6 11.3 6.0 11.2 11.4 Rdg. rec. '° 3.0 8.2 71
94 : 92 11.6 10.7 6,0 11.2 11.2 Spelling 3.6 8.8 79.
95 107 11.5 12.3 6.3 11.5 11.7 Spelling 3.0 8.2 70
96 88 12.8 11.2 6.2 11.4 11.8 Rdg. comp. 3.1 8.3 70
Intermediate
X 94.0 10.9 10.3 10.5 3.6 8.8 '83.4
SD 7.1 1.1 1.3 1.1 1.0 1.0 8.4
97 88 12.9 11.4 7.2 12.4 12.2 Rdg. rec. 5.6 10.8 89
98 88 11.5 10.1 7.1 11.1 10.9 Rdg. rec. 4.0 9.2 84ANC
99 85 13.0 11.1 7.1 12.3 12.1 Math. 4.9 10.1 '83
100 99 12.1 12.0 7.2 12.4 12.2 Spelling 4.1 9.3 76
101 82 12.1 9.9 7.1 12.3 11.4 Spelling 3.2 8.4 74
102 88 11.3' 11.4 7.2 12.4 12.3 Rdg. rec. 3.9 9.1 74
103 100 12.1 12.1 7.1 12.3 12.2 Spelling 3.5 8.7 71
4A,*104 84 12,5 10.5 7.1 12.3 11.8 Rdg. comp. '3.1.0 8.3 F. 70
105 .. 84 12.8 10.8 7.1 12.3 12.0 Rdg. comp. '2.6 7.8 65
106 89 13.4 12.0 8.2 14. 13.4 12.9 Spelling -6.2 11.4 88
107 80 13.2 10.6 8.1 13.3 12.3 Rdg. reo. 5.6 10.8 87
108 88 12.1 * 10.7 8.1 13.3 12.0 Rdg. rec. 5.2 10.4 87
28
."---ft
TABLE 7. (Continued)
LowestSubject Lowest SubtestNumber IQ CA MA Grade "GA. EA Subtest Score Al LQ
t
109 88 13.1 .' 11.5.8.2 13.4 12.7 Math. 5.7 10.9 86
110 83 14.6 12.1 8.2 13.4 ',13.4 !lig, comp. 6.0 11.2 84
111 87 13.1 11.4 8.1 13.3 12.9 Spelling 5.6 10.8 84
112 93 13.0 12.1 8.1 , 13.3 *12.8 , Rdg. comp. 5.5 10.7 84
113 0 13.7 - ,]23_8 13.3 13.1 Rdg. comp. 5.0 10.2 78
114 99 13.2 13.1 8.1 13.3 13e2 Rdg. rec. 4.8 , 10.'0 76
115 8z----14.7- 12.5 8.1 13.3 13.5 Spelling 4.9 10.1 75.
llg 117" 13.3 :,--'15.6 8.2 13.4 14.1 Spelling 5.6 10.8 77
117.
95 14.0 13.3 8:2 13.4 13.6 Rdg. rec. 5.8 10.1 74
118 87 12.9 -11.2 8.2 13.4 t- 12.5 Spelling 3.9 9.1 73or .
. .
119 89 13.3 11.8 8.2 13.4 12.8 Rdg. rec..
3.9 9:1 * 71
120 88 13.8 12.1 8.1 13.3 13.0° Spelling 3.9 9.1.° 70'
121 101 14.1 14.2 '-8.2 13.4 13.9 Spelling 4.1 9.3' 67
122 100 0,5 13.5 8.1 13.3 l3.4 t. Spelling 3.8 9.0 67
123 es 13.6 11.6 8.1 13.3 12.9 ' Rdg. comp./spelling
2.8. 8.0 62
Junidr High
X '90.4 13.1 11.9 12.7. 4.6 9.7 76.9
SD 8.0 0.8 1.3 0.8 1.1 1.0 7.8
Primary, Intermediate, KJunior High Total
X 94.1 83.?
SD 8.2 8.5
29
4"

CO.
2ar
LowestSubject Lowest SubtestNumber IQ CA MA Grade - GA EA Subtest Score
.124 92 14.9 13.7 9.5 14.7 14.4 Math. -'6.7 11.9 83
125 88 15.6 t. 13.7 9.5 14.7 14.6 Rdg. rec. 5.8 11.0 75,126 102 14.3 14.5 9.1 411C 14.3 14.3 Rdg. rec. 5.4 10.6 74
127 .94 14.0 13.1 9.1 . 14.3 13.9 Math. 4.9 10.1 73. A
.,.,,__128 _14.7 _____11..0__ 9.5 ---,--4.4.7- --44-.1---- -Rdg -comp. 5i0 10-.-2- 72
, 129 82 14.7 12.0 9.1 14.3 13.7 Spelling 3.7 . 8.9 ,65
130 .' 89 14.4 12.8 9.5 14.7 1.3.9 'Spelling 3.9 9.1 65
131 87 15.7 13.6 9.5 14.7 14.6 Math. 3.e. 9.0 61'1, c
,I132 93 16.3 15.1 9.5 14.7 15.3 Spelling- 4.1 9.3 60
13133 82 14.1 11,5 9.6 ' 14.8 .41,- Rdg. rec. 3.3. 8.5 59
134 98 15.3 14.9 9.5 14.7 14.9 ,Rdg: rec. 3.6 8.8 54--\135 99 14.0 13.8. 9.1 14.3 14.0 Spelling '3.8 8.1 58
136 .,.. 90 14.3 12.8 9.1 : 14.3 13.8 Spelling 3.9 8.1 58
137 89 15.2 13.5 9.1 14.3 14.3 Spelling 3.9 8.1011111P 56...:,_
138 89 16.0 14.2 9.1 - 14.3 14.9 Spelling 3.9 8.1 54
139 9r 15.9 14.4 10.5 15.7 15.3 Math. 8.2 1S..4 87`e
140 80 14.5 11.6 10.2 15.4 13.8 Rdg., rec. 5.5 10.5 77
141 88 15.0 11.2' 10.1 ''15.3 14.5 Rdg. comp. 6.0 111 77
142 95 15.9 '15.1 10.5 - 15:0 15.5 Math. 6:4 11.6 74
143 93 14.1 13.1 10.1 15.3 14.5 Spelling 5.3 icko 72 m144 91 15.3 13.9 10.2 15.4 14.8 Rdg. rec. 5.2' 10.4 70
145 82, 15.3 12.5 10.2 15.4- 14.4 Math. 4.9 10.1' 70
146 86 14.1 12.1 10.2 15.4 13.8 Rdg. rec., 4.5 9.7 70147 82 - 16:4 13..4 10.2 15.4 15.0 Rdg. comp. 4.5 9.7 : 65-
4- .
TABLE 7. (Continued)
1-14
. a 30
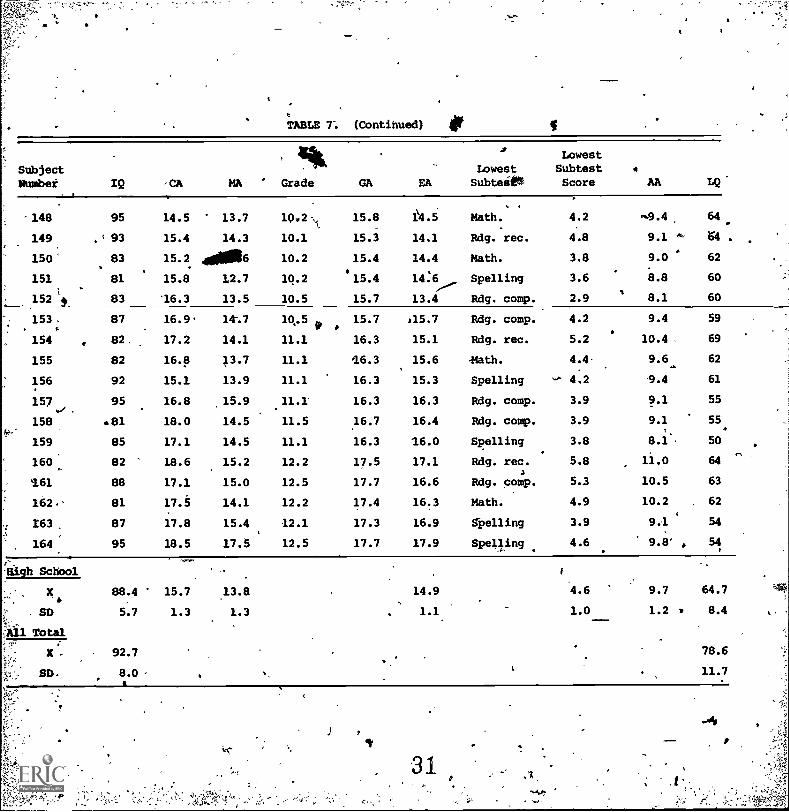
TABLE 7: (Continued)
Subject,1.4111.
Lowest SubtestLowest
Number IQ -CA MA Grade GA EA Subteitt Score AA LQ
148 95 14.5 13.7 18.2 ,,s 15.8 1'4.5 Math. 4.2 m9.4 64
149. ' 93 15.4 14.3 10.1 15.3 14.1 Rdg. rec. 4.8 9.1 '0' 64 .
150' 83 15.2 4101016 10.2 15.4 14.4 3.8 9.0 62Math.
151 81 15.8 12.7 10.2 15.4 14:6 Spelling 3.6 8.8 60/152't 83 '16.3 13.5 10.5 15.7 13.4 Rdg. comp. 2.9 8.1- 60
153. 87 16.9 14-.7 ig.s 15.7 15.7 Rdg. comp. 4.2 9.4 59. P .
154 82 17.2 14.1 11.1 16.3 15.1 Rdg. rec. 5.2 10.4 69
155 82 16.8 13.7 11.1 '16.3 15.6 lath. 4:4 9.6. 62
156 92 15.1 13.9 11.1 16.3 15.3 Spelling -^ 4.2 9.4 61
157./ 95 16.8 15.9 11.1' 16.3 16.3 Rdg. comp. 3.9 9.1 55
158 .81 18.0 14.5 11.5 16.7 16.4 Rdg. comp. 3.9 9.1 55.
159 85 17.1 14.5 11.1 16.3 16.0 Spelling 3.8 8.1' 50.
.
160 82 18.6 15.2 12.2 17.5 17.1 Rdg. rec. 5.8 11.0 64.
161 88 17.1 15.0 12.5 17.7 16.6 Rdg. comp. 5.3 10.5 63
162.' 81 17.5 14.1 12.2 17.4 16.3 Math. 4.9 10.2 62
/63 87 17.8 15.4 2.1 17.3 16.9 Spelling 3.9 9.1 54
164 95 18.5 17.5 12.5 17.7 17.9 Spelling 4.6 9.8° , 54
nigh School
X* 88.4 15.7 13.8
SD 5.7 1.3 1.3
All Total
X . 92.7
SD. 8.0 - 4
14.9
. 1.1.
4.6
1.0
9.7 64.7
1.2 8.4
2
It
31
78.6
t '
4
i 41
4
TABLE 8. ioRipLA COMPONENTS - REGULe STUDENT'SAMI3LE.
(0=33)
SubjectSUbject . Lowest .
LowestSubtest
Number . IQ CA MA Grade GA EA Subtesi Score.AA
LQ
1 99.
6.9 6.8 1.9 7.1 6.9 Spelling 2.3 7.5 108
2 99 7.3 7.2 1.9. 7.1 7.2 Math. 2.1 7.3 101
3 126 7.3 '9.2 1.9 7.1 7.9 Rdg. comp. 2.7 7.9 100
4 126 7.3 9.2 1.9 7.1 7.9 Spelling4
2.3 7.5 95,
5 106 7.4 7.8 1.9 7.1, 7.4 Math. 1.5 6.7 91
6 128-------6.8 9 0.1.
7.9 Rdg. rec. . 1.6 6.8 86
7 140 8.3:1r11.5 2.9 8.1 9.3 Rdg. comp./ 5.3 10.5. 113.. Spelling
8 103' 8.2 8.4 . 2.9 8.1 8.2 Spelling 3.9 _9.1 111. 4
9 137 7.5 10.3 2.9 8.1 ' 8.6 Spelling 3.8 "9.0 104-
10 . / 124 e.1 10.0 2.9 . 8.1 8.7 Math. /Sp. 3.8 9.0 103
11 110 9.3 10.2 3.9 9.1 9.5 Math. 5.3 10.5 110
12 94 9.7 9.1 3.9 9.1 9.3 Spelling 3.5 ' 8.7 '94
13 98. r 9.0 8.8 3.9 9.1 9.0 Math. 3.2 8.4 I ,93
Lowrye
X 114 7.9 9.0 8;,..3 3.2 8.4 100.7'
SD 16.0. 0.9 1.3 0.8 1.2 1.2 8.5
. . v 4*14 148 9.1 13.5 4.9 10.N 1 10.9 Rdg. rec., 9.1 14.3 '131
15 116 ' 10.3 11.9 4.9 10.1 10.8 Spelling 6.0 11.2 104
16 104 9:8 10.2 4.9 10.1 10.0 Spelling 4.2 9.4 94
IT 110 9.8 10.8 4.9. 10.1 10.2 Spelling i' 4.1 9.3 91
18 132 10.3 .13.6 4.9 10.1 11.3 Spelling. 4.9 10.1 89
19 120 10.3 12.4 4.9 10.1 10.9 Rdg. rec. 4.2 9.4 86
.
20 118 . 10.6 12.5 5.9 ""'11.1 11.4 Rdg.. comp. 4 5.8.
11.0' ,96
ss
3-2
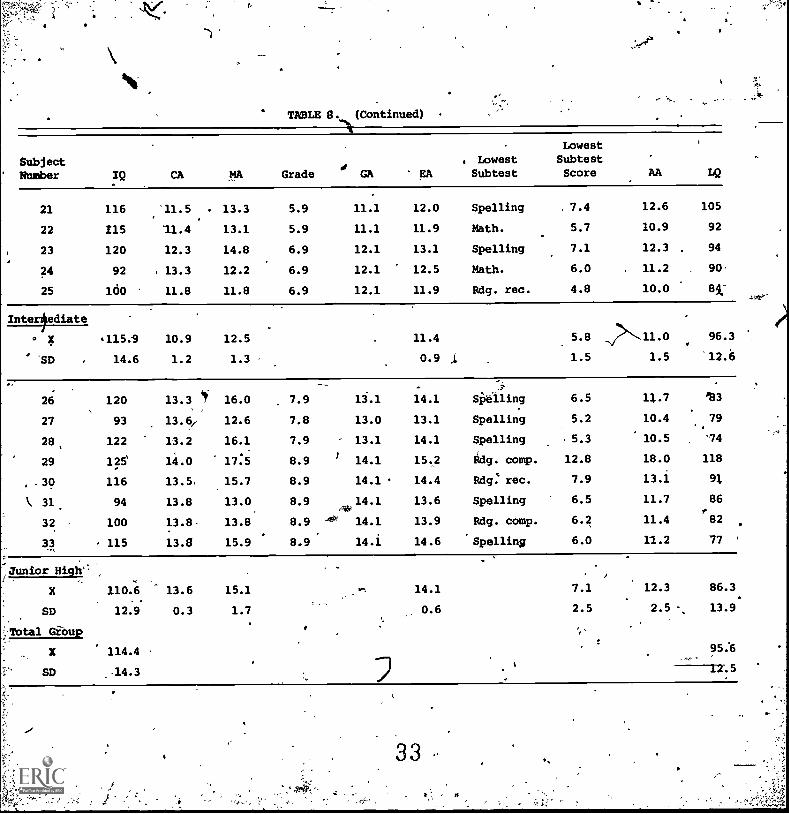
TABLE S. (Continued)
Subject!amber IQ CA MA Grade GA EA
. LowestSubtest
LowestSubtestScore AA LQ
21
22
23
24
25
116
115
120
92
160
'11.5
'11.4
12.3
k 13.3
11.8
13.3
13.1
14.8
12.2
11.8
5.9
5.9
6.9
6.9
6.9
11.1
11.1
12.1
12.1
12.1
12.0
11.9
13.1
12.5
11.9
Spelling
Math.
Spelling
Math.
Rdg. rec.
7.4
5.7
7.1
6.0
4.8
12.6
10.9
12.3
11.2
10.0
105
92
94
90
8,'
Interediate
* '115.9 10.9 12.5 11.4 5.8 ,11.0 96.3
SD 14.6 1.2 1.3 0.9 1 1.5 1.5 12.6
',a
26 120 13.3 4f 16.0 7.9 13.1 14.1 SPelling 6.5 11.7 133
27 93 13.6/ 12.6 7.8 13.0 13.1 Spelling 5.2 10.4 79
28, 122 13.2 16.1 7.9 13.1 14.1 Spelling 5.3 10.5 14
29 125' 14.0 17:5 8.9 14.1 15.2 Rdg. comp. 12.8 18.0 118
, 30 116 13.5. 15.7 8.9 14.1 14.4 Rdg. rec. 7.9 13.1 91
\ 31. 94 13.8 13.0 8.9 14.1 13.6 Spelling 6.5 11.7 86
32 100 13.8 13.8 8.9 14.1 13.9 Rdg. comp. 6.2 11.4r82
33 115 13.8 15.9 8.9 14.1 14.6 'Spelling 6.0 11.2 77
-Junior High'
X 110.6 13.6 15.1 14.1 7.1 12.3 86.3.
SD 12.9 0.3 1.7 0.6 2.5 2.5 -, 13.9
.TOtal Group
114.4 95:6X
SD 14.3 11.5
33
41 ao
TABLE-9. APARISON OP IQ AND LQ OF REGULAR, AND LD STUDENTS
X IQ SD R LQ 7,, SD
Primary LD 96.1 8.7 86.2x. 7.2
Primary Regular 114.0' 16.0 100.7' 8.5
Intermediate LD 94.0 7.1 83.4 8.4
Interiediate Regular
.
115.9 14.6 96..3 12.6
Junior High LD 90.4 t 8.0 76.9 7.8
Junior High Regular 110.6 12.9 86.3 13.9,i
All LD 94.1 8.2 83.2 8.5
All Regular 114.4 14:3- 95.6 X12.5
.
S
'
TABLE 10. SRA ACHIEVEMENT TEST - MEAN AND RANGE OF GRADE EQUIVALENT SCORES
Composite . Reading
A
IQ Eguivalgnt
Mathematics Language,Arts Scores (S0=16)
Grade X - Range:' X Range ° X . Range X Range X Range
0.1- 6.2 2.4 0.1- 6.1 2.3 0.1- 4.6 111 69-141
2 ,3.3 0.7- 6.9 . 1.3 0.5- 6-.1 3.2 0.3- 6.8 3.0 0.1- 6.8 106 75 -145
3 4.3 1.6- 8.7 4.2 0.9-10.7 INI 1.8- 8.7 4.4 0.6-10. 106 67-. x145,
.
- .
4 ' 5.8 1.7-11.1 5.7 1.2-12.9 5.3 1.5-10.0 6.1 0.1-12.6 . '109 68-145'
7.1 2.8-12.5 6.7 1.8-12.9 6.7 3.6-11.3 7.7 1.7-12.9. 110 68-136
6 8.4 2.8-12.9 8.3 2.0-12.9 8.3 2.3-12.9 8.7 0.1-12.9 112 66-139 .41:
3.5-12.1 3.4-12.9 111 65-1389.3 2.4-12.9 9.3 1.8-12.9 9.0
10.9 .2.8-12.9 10.7 1:8-12.9 1118 4.8-12.9 10.8 1.4-12.9 111 69-137
:35
ti

I
TABLE FL- FORMULA COMPONENTS -MEAN IQ AND LQ USING SRA DATE t LD STUDENTS
I
SubjectNumber ... IQ Grade GA EA
'-LoweStSubtest
.Lowest
SubtedtScore AA LQ
1
.3
5
9
13
17
19
21
22
23
32
33
34
.36'
40
96
120
120
96
81
83
97
70
113
89
86.
,79
76
84
112
6.8
6,7
6.6
8.6
7.1..
8.8
a,"8.1
,,8.7 ...
8.6.
8.7
9.8
9.0
9.6
9.2
6.5
13.0
7.9
8.3
5.8
,7.3
7.8
9.8
7.7
7.5
8.1
10.
&
-
.
1.8
1:8
1.8
1.8
1.8
2.8
2.8
2.8
2.8
2.8
3.8
3.8
8
.8
3.8
.0
7.0
7.0
7.0
7.0
7.0
8.0
8.0
8.0
8.0
8.0
9.0
9.0
9.0 '
9.0
9.0 .
6.8,
.1.2
'7.2
.9.0
6.6
8.0
.1.9
8.8..,
'8.1.
'8.4
..
8.9
9.5
fr
.,
0Reading
Reading
, Reading8
'Reading
Reading
.A, Are ^.
L.A.
L.A.
Mat
L.A.
Mat .
L. ....
Reading
L.A,
Reading''
1.0
2.7
3.5
.8
.4
., .9 -
1.1"
.8
2.7.
.5
1.9
1.1
'.1
, .6
1.1
.
.
41
6.2
7.4
8.7
6.0
5.6
6.1
6:3
6.0
'77,f.
5.7
7.0
8.3
8.3
5.8
6.3
-*
91
103,
'121
75
-85 ".
. 76
80,,,:-
.84
7k,
83,,
.
65
66
PrimaryV'
93:5,
16.2
...
83.3
15.9
X
SD
58
)965
65
66
65
84
81
68
94
9.1
10.2
10.1
10.2
10.4
8.6
8.2,
9.8.
4.8
4.8
4.8
4.8
4.8
.,
40.0
10.0
10.0
10:0 .':
10.0
' :9.6
9.4
10.0
° L.A."
° Math.
Reading
Reading
Beading.
..A.,
4°2 '
4.4
.-2.9.
2.2
4.3
9.6
8.0
7.4
9.5
100
85
:.
A ,
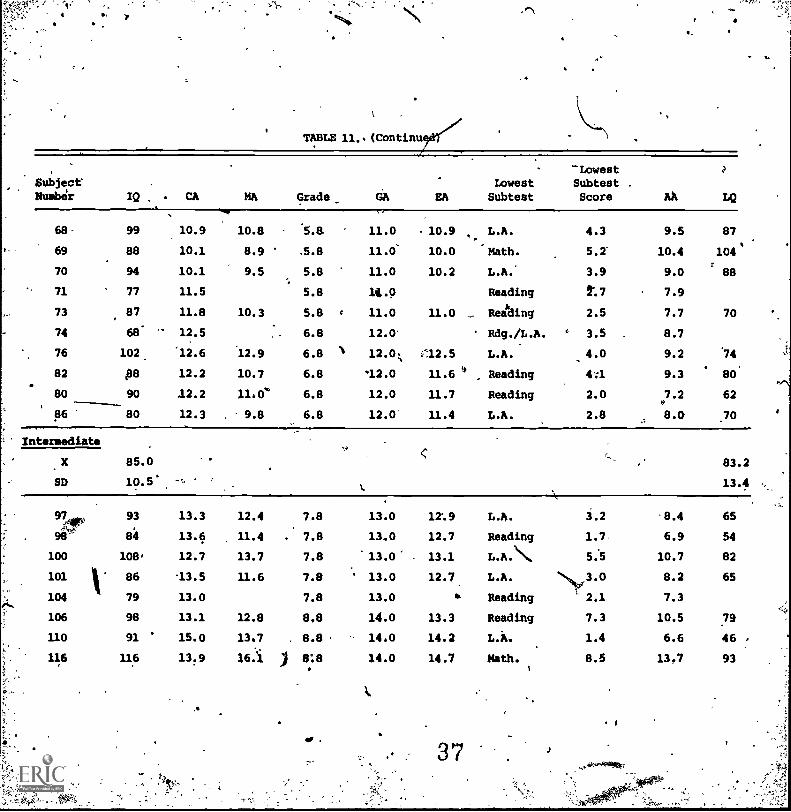
TABLE 11.. (Continu
SubjectDumber
68
69
70
71
73
74
76
82
80
96
Intermediate
X
SD
97
98
100
101
104
106
110
116
1
e.
IQ CA MA Grade_ GA EALowest
Subtest
LowestSubtest .
Score AA LQ
99 10.9 10.8 .5.8 11.0 10.9 L.A. 4.3 9.5 87
88 10.1 8,9 .5.8 11.0- 10.0 Math. 5.2 10.4 104'
94 10.1 9.5 5.8 11.0 10.2 L.A. 3.9 9.0 ' 88
77 11.5 5.8 14.0 Reading l'.7 7.9
87 11.8 10.3 5.8 g 11.0 11.0h
Reading 2.5 7.7 70
68' 12.5 6.8 12.0 Rdg./L.A. 3.5 8.7
102. 12.6 12.9 6.8 1 12.0; .-12.5 L.A. 4.0 9.2 74
P8 12.2 10.7 6.8 '12.0 11.6 Reading 4:1 9.3 80
90 .12.2 11.0.' 6.8 12.0 11.7 Reading 2.0 7.2 62
80 12.3 9.8 6.8 12.0 11.4 L.A. 2.8 8.0 70
85.0 83.2
10.5' 13.4
93 13.3 12.4 7.8 13.0 12'.9 L.A. 3.2 8.4 65
84 13.6 11.4 . 7.8 13.0 12.7 Reading 1.7 6.9 54
108, 12.7 13.7 7.8 13.0 13.1 L.A. 5.5 10.7 82
86 '13.5 11.6 7.8 13.0 12.7 L.A. NN3.0 8.2 65
79 13.0 7.8 13.0 m. Reading 2.1 7.3
98 13.1 12.8 8.8 14.0 13.3 Reading 7.3 10.5 79
91 15.0 13.7 8.8 14.0 14.2 L.A. 1.4 6.6 46 .
116 13.9 16.'1 ) 818 14.0 14.7 Math.i
8.5 13,7 93
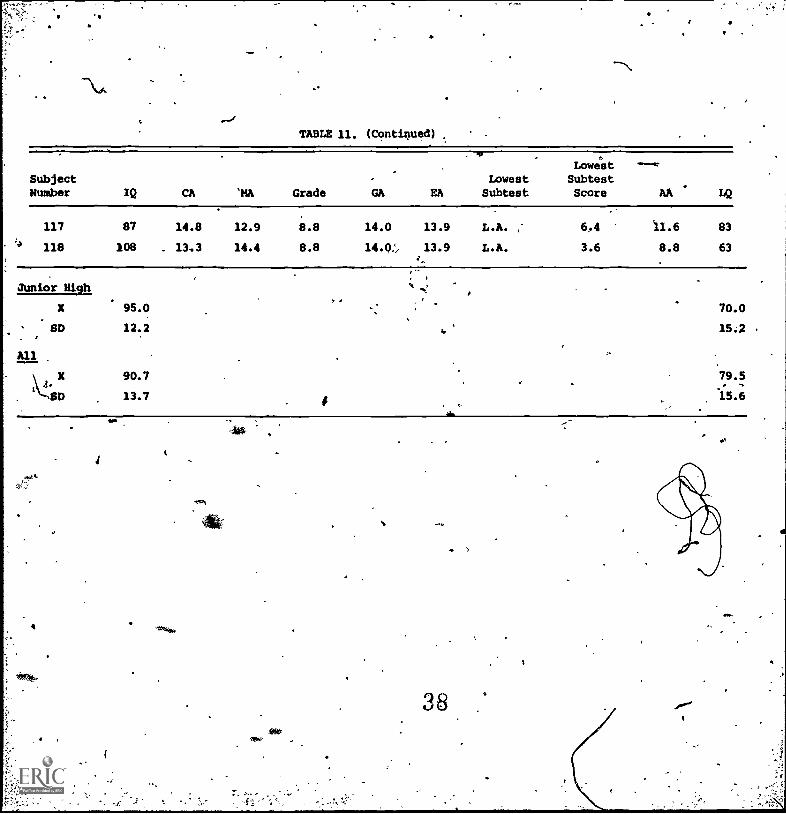
TABLE 11. (Continued)
SubjectNumber IQ CA 'MA Grade GA EA
LowestSubtest
LowestSubtestScore
ne.
142AA
117 87 14.8 12.9 8.8 14.0 13.9 L.A. , 6.4 11.6 83
"4 118 108 . 13.3 14.4 8.8 14.Q.; 13.9 L.A. 3.6 8.8 63
Junior High ". gt,
X 95.0 70.0
SD 12.2 15.2
90.7 79.5X
SD 13.7 15.6
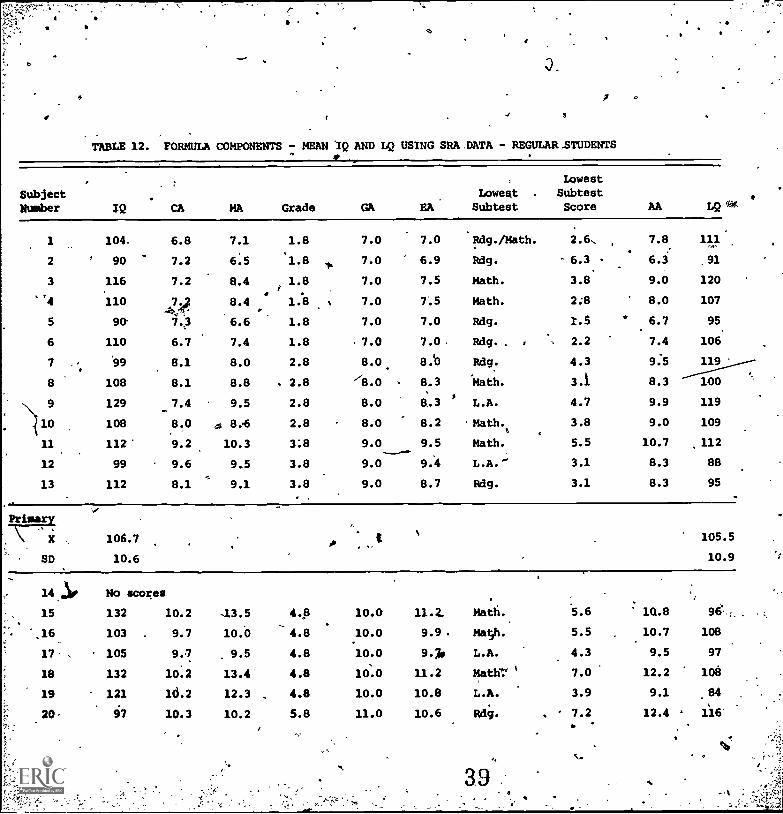
TABLE 12. FORMULA COMPONENTS - MEAN IQ AND LQ USING SRA DATA - REGULAR STUDENTS
Lowest
Subject Lowest . Subtest
Number IQ CA MA Grade GA EA Subtest Score AA LQ
1
2
3
'4
5
6
7'.
8
) 10
11
12
13
Primar
,
SD
14.,10
15
.16,
17-
18
19
20.
104.
90
6.8
7.2
7.1
6.5
1.8
'1.81..
7.0
7.0
7.0
6.9
Rdg./Math.
Rdg.
2.6,
6.3
7.8
6.3
116 7.2 8.4i1.8 7.0 7.5 Math. 3.8 9.0
110 7.2 8.4 1.8 7.0 7.5 Math. 2:8 8.0
90 7:3 6.6 1.8 7.0 7.0 Rdg. 2.5 6.7
110 6.7 7.4 1.8 7.0 7.0 Rdg. . 2.2 7.4
'99 8.1 8.0 2.8 8.0. 8.b Rdg. 4.3 9.5
108 8.1 8.8 2.8 /8.0 8.3 Math. 3.1 8.3
129 -7.4 9.5 2.8 8.0 8 .3
$L.A. 4.7 9.9
108 8.0 as 86 2.8 8.0 8.2 Math.t. 3.8 9.0
112 9.2 10.3 3:8 9.0....._-..
9.5 Math. 5.5 10.7
99 9.6 9.5 3.8 9.0 9.4 L.A. - 3.1 8.3
112 8.1 9.1 3.8 9.0 8.7 Rdg. 3.1 8.3
106.7 0
10.6
No scores. ,
132 10.2 13.5 4.8 10.0 11.2. Math. 5.6 1Q.8
103 9.7 10.8 4.8 10.0 9.9 . Math. 5.5 10.7
105 9.7 9.5 4.8 10.0 9.j L.A. 4.3 9.5
132 10.2 13.4 4.8 10.0 11.2 MAW: 1 7.0 12.2
121
97
16.2
10.3
12.3
10.2
, 4.8
5.8
10.0
11.0
10.8
10.6
L.A.
Rdg. ,
3.9
7.2
9.1
12.4.
39
.
111
91
120
107
95.
106
119
100119
109
112
88
95
105.5
10.9
96 : .
108
97
108
.84
' 116
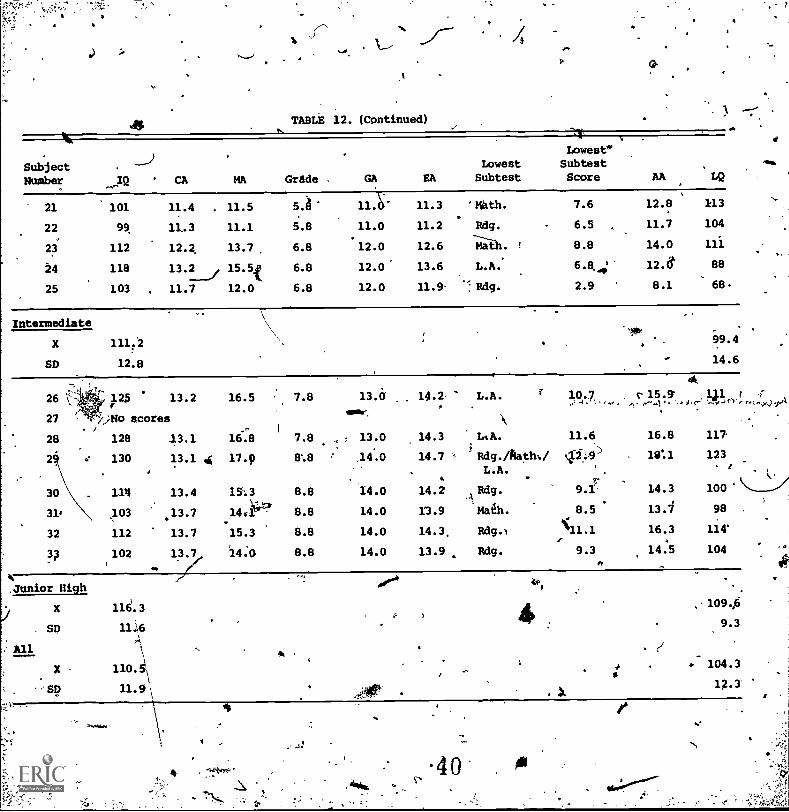
TABLE 12. (Continued)
___,/SubjectNumber IQ ' CA MA Grade . GA
21 101 11.4
22 99, 11 .3
23 112 12.2
4 118 13.2__....,
25 103 11.7
.
,
11.5
11.1
13.7
15.5.
12.0
5.a-
5.8
6.8
6.8
6.8
11."
11.0
12.0
12.0'
12.0
Intermediate
X 111:2
SD 12.8
_
26 l - 125 13.2 16.5 7.8 13.0
27 ' .'y,',No scores411111r.
28 128 13.1 16.8 7.8 , ; 13.0
2 . 130 13.1 4 17.9 8.8 14.0.
.
30 114 13.4 15:3 8.8 14.0
314 103 13.7 14r1.
8.8 14.0
32 112 13.7 15.3 8.8 14.0
3? .102 13.7
ft
14.0 8.8 14.0
Junior High
X 116.3
SD 11.16
1111A
ok
X 110.
SD 11.01
EA
11.3
11.2
12.6
13.6
11.9-
1 .
N
LowestLowest Subtest
Subtest Score AA LQ
'Keith. 7.6 12.8 113
Mg. 6.5 11.7 104
lMath. 8.8 14.0 111
L.A.
1 Mg.
6.8..4: 12.8* 88
2.9 8.1 68-
9
99.4
14.6
44
14.2. L.A.,
10.,7 . r 15.9'4. , , 4 ,,..,4 I 3' 111 " r''".4*".7 1 1 r
1 .
.
14.3
14.7
14.2
13.9
14.3,
13.9
11.6L'.A. 16.8
' 3Rdg./Aath:/ 1.2-.10 19°.1
L.A.. t
.4114g. 9.1 14.3
Math. 8.5 13./
N11.1Rdg.I 16.3
Rdg. 9.3 14.5
117
123e
C-..__.-./...100'
98
114'
104
.
104.3
1g.3
-40
I 1.1
',,; .0
ri
36
TABLE 13. FORMULA COMPONENTS - mEAN IQ AND LQ USING WISC
26.,_____ 27
28
-33
444647
"*"*.*.,, 4810, '46, 49
Subjeq No.
C
. Grade NISC.IQ Score LQ
e
PrisaryX
* SD
54
58.40.
606775-78.798285
, '86879093du4"11
. interieediete
..X
86 -,v;,
O
2.0 87 , 88'
2.0 101 85
2.2 90 86
3.0
3.0.
3.0,
8310289
96
78
81
3.0°, . 81 82
3.0 77 84
3.2 64 --
86.0 85.0
11.8 5.4
4.0 q8 )95
4.2 101 1 82
4.0 89 189
4.0 86 71
6.0 . 99 96
6.2 gb 85
6.2 88 82
642 96 82
6.2 87 76
6.0 89 796.0 96 76,6.0 98 76 I
06.0 102 - 68
6.0 89 79..
94.0 81.1.5.7 8:1'
.
90 7.1 92100- 7.2 104102 '72 83105 . 7.1 10--: .-:-
107...
\ 8.0. ,
-18.
4,0.T.110 . 8.2 .87
111 8:0 98.
.116 . 13...2- 108
V
7575
628682
82
79
4
)
PI
0
TABLE 13. (Continued) '0
Subject No. Grade WISC IQ Score
117118 ,
119121123
8.28.28.28.28.1
92101
9010596
-,..
O 756971
6660
.Junior.High"s. X 91.0 75.3
SD.
9.9 *. . 8:0
125. 9.5 105 71
126 9.1 100 75
129 9.1 .100 61
133 9.6 ,90 61
134 9.5 111 56
135 9.1 103 57
136 9.1 . 81 60
137 9.1 99 55
138 9.1 87 St
151 10.2 . 91 58
High SchoolX 90.9 82.5 .
SD a 9.2 7.4
AllX
SD
93.3 75.3
9:3 11.3
'4i
(2.
TABL1g14. FORMULA comPaams - SELF-CONTAINED SAMPLE
1Lowest
Subject , Lowest , SubtestNumber IQ CA MA Grade GA EA Subtest. Score AA LQ
I
6 89 6.1 5.4 1.o'. 6.2 5.9 Rdg. comp. 0
7 94 6.3 5.9 1.0 , 6.2 6.1 'Mg. comp. 08 103 6.9 7.1 1:0 6.2 6.1 Rdg. rec. .5
10 86 6.8 5.8 1.0 6.2' , 6.2 0Rdg. comp.
12 91 ' 7.3 6.6- 1.0 6.2 6.7 Rdg. comp. 0
24 90 1.1 7.2 2.0 7.2 7.5 1.4
33 87 9.2 8.0 '3.4 ,,8.4 .8.5
Rdg.
2.9
46 93 8.4 7.9, 3:2 8.4 , 8.2 Rdg. rec. 1.4
47 86 9.0 7.7 3.2 8.4 8.4 . Math. 1.5
48 93 8.3 7:8 3.2 8.4 - 8.2 Rdg. rec. 1.3
54 87 - 9.1 7.9 4.2 9.4. 8.8 Spelling '3.4
:60 93 9.4 847 4.2 9.4 9.2 Spelling 2.9
64 86 10.3 '8.9 4.2 9.4 9.5 Rdg. comp. , 2.4
7 '89 10.4 ''9.2 4.2 9.4 9.7 Spelling 1.6.
87 87' 11.6 '10.6 6.2 11.4 11.2 Math. 3.5
96 88 12.8 11.2 6.2 11.4 11.8 Rdg. comp. 3.1
102 88 13.0 11.4 7.2 12.4 12.3 Rdg. rec. 3.9
104, 84`- 12.5 10.5 7.1 12.3 11.8 Rdg. comp. 3.1
105 84 12.8 y10.8..
7.1 12.3 12.0 'Rdg. comp. 2.6
'118 87 -12.1 11.2 8.2 13.4 12.5 Spelling 3.9
.119 89 11.3 11.8 8.2 13.4 12.8 Rdg. rec. 3.9
123 1. 5 13.6 11.6 1.1 " 13.3 12.9 Rdgv'comp. 4.8
126. .
102 14.3 14.5 9.1 14.3 14.3 Math. t 5.4
127 94 14.0. 13:1° 9.1 14.3 13.9 Math. - 4.1,
5.2 88
5.2 85
5.7 85
5.2 83
5.2 77
6.6 88
8.1 , 95
6.6 80
6.7 - 80
6.5 79
8.6 98
8.1 88
7.6 84
6.8 70
8.7. ye
8.3 70
9.1 74
8.3 70
7.8 65
9.1 73
9.1 71
8.0 62
' 10.6 74
10.1 73
1
a
43

0
0
TABLE 14. (Continued)
SubjectNumber IQ. CA MA EA
LowestSubtest
LowestSubtestScore AA LQ
129 82 14.7 12.0 9.1 14.3 13.7 Spelling 3.7 8.9 65
136 90 14.3 12:8 . 9.1 14.3 13.8 Spelling 3.9 8.1 58
138 89-.....e 16.0 l4.2 9.1 14:3 14.9 Spelling 3.9 8.1 54
141 88, 15.0 11.2. "10.1 , 15.3 14.5 Rdg. comp. 6.0 11.2 77
143 93 14.1 13.1 10.1 1543 14.5 Spelling 5.3 . 10.5 72
149 93 s 15.4 14.3 10.1 .. 15:3 14.1 Rdg. rec. 4.8 9.1 ,64
153 87 .16.9 14.7 10.5 15:7 15.7 Rag. comp. 4.2 9.4 59
156 92 15.1 13.9 11.1 1603 15.3 Spelling 4.2 9.4 61
X 89.7 75.0-
SD 4.6 16:8
q__
44
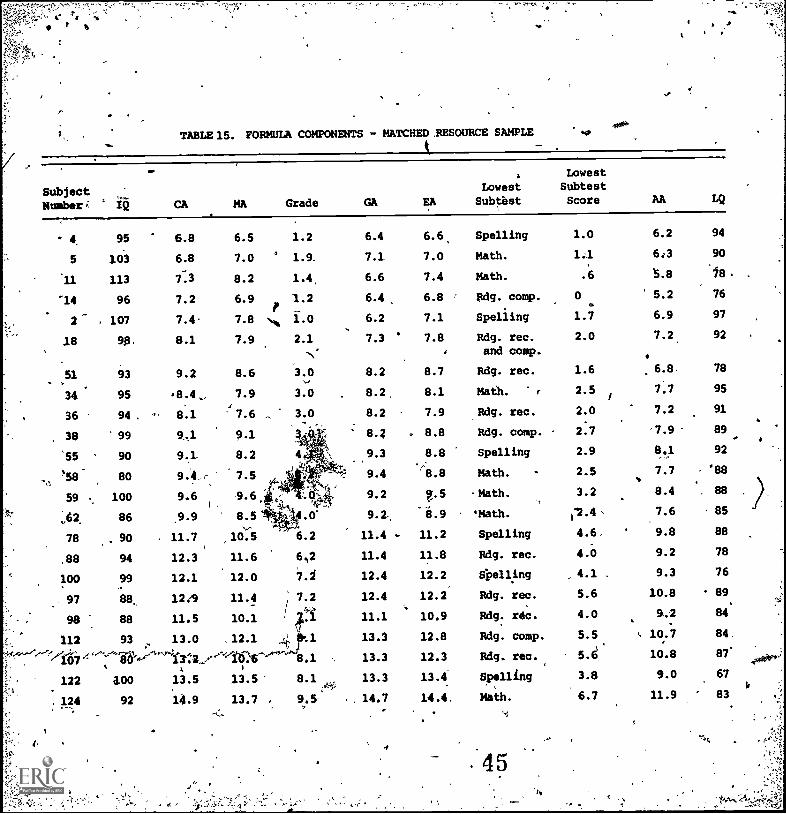
TABLE 15. FORMULA COMPONENTS - MATCHED RESOURCE SAMPLEla
Subject
a LowestLowest Subtest
Number;: ° IQ CA MA Grade GA EA Subtbst Score AA LQ
. 4. 95 6.8 6.5 1.2 6.4 6.6, Spelling 1.0 6.2 94
5 103 6.8 7.0 ° 1.9. 7.1 7.0 Math. 1.1 6:3 90
'11 113 7.3 8.2 1.4, 6.6 7.4 Math. .6 5.8 Ia.
'14 96 7.2 6.9P
1.2 6.4 6.8 f Rdg. comp. 0 5.2 76
2
.
, 107 7.4. 7.8 '. 1.0 6.2 7.1 Spelling 1.7 6.9 97
18 98. 8.1 7.9 2.1 7.3 7.8 Rdg. rec. 2.0 7.2 92
.N and comp.
51 93 9.2 8.6 3.0 8.2 8.7 Rdg. rec. 1.6 6.8. 78
34 952.5 7.7 9518.4_ 7.9 3.0 8.2 8.1 Math. r
8.1 7.6 ... 3.0 7.9 Rdg. rec.36 94 8.2 2.0 7.2 91
38 99. -..
: 2.7 -7.9 899.1 9.1 8.4 8.8 Rdg. comp. .
'55 90 94 8.2 4 % 9.3 8.8 Spelling 2.9 84 92
58 80 -;', 9.4 2.5 7.7 .88..,',
9.4_1- 7.5 '8.8 Math. -
9.2 3.2 8.4 8859 % 100 9.,.:.5 . Math.9.6 a.6
..62 86 9.9 8.5 .0' 9.2 -6.9 'Math. )2.4, 7.6 85
78 . 90 11.7 ,10:5 6.2 11.4 11.2 Spelling 4.6, 9.8 88
.88 94 12.3 11.6 6,2 11.4 11.8 Rdg. rec. 4.0 9.2 78
100 99 12.1 12.0 7.2 12.4 12.2 Spelling 4.1 9.3 76
97 88 12/9 11.4 : 7.2 12.4 12.2 Rdg. rec. 5.6 10.8 89
1 , '
98 I 88 11.5 10.1f
10.9 4.0 9.2 8411.1 Rdg. rec..
112 93:.
13.0 12.1 1 13.3 12.8 Rdg. comp. 5.5 t. 10.7 84,
.;,,.....----..---,916.,.,,,,,,,ap,..f.,,..",,,,,sti,312../......,16:;6..........
, ow 8.1 % 13.3 12.3 Rdg. rec. 5.8 10.8 87.
13.5 13.5 8.1, 13.4 Spelling122 100 13.3 3.8 9.0 67
124 92 14.9 13.7 9.5.,.
14.7 14.4. Math. 6.7 11.9 83
.45r.
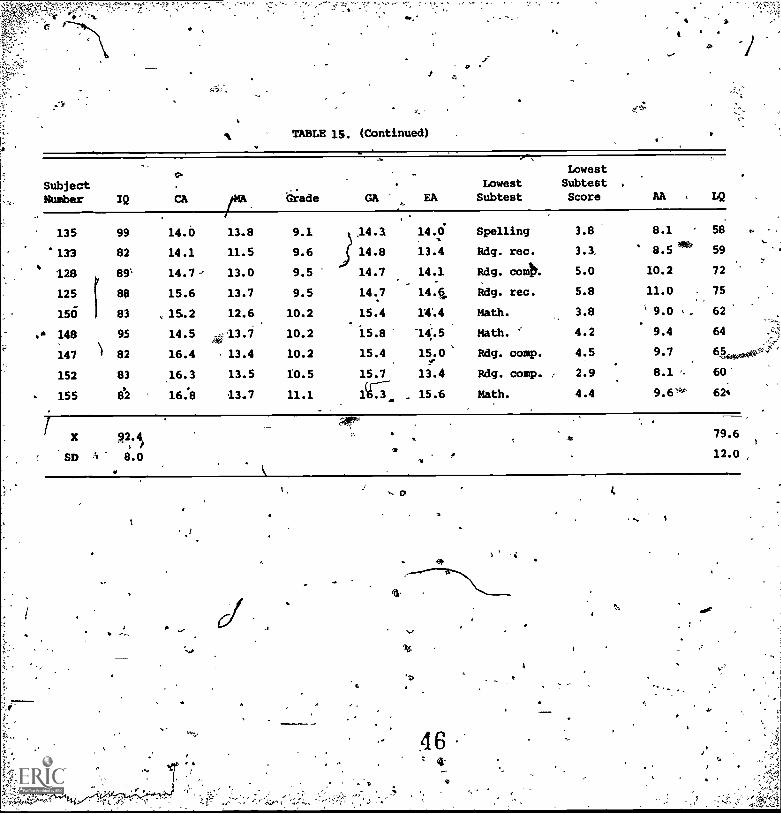
TABLE 15. (Continued)
4.
SubjectNumber IQ CA AMA Grade GA EA
LowestSubtest
LowestSubtest .
Score M LQ
135 99 14.0 13.8 9.1 14.0 Spelling 3.8 8.1 58 d
133 82 14.1 11.5 14.8 13.4 Rdg. rec. 3.3. 8.5 59
28 89 14.7w 13.0 9.5 14.7 14.1 Rdg. comb. 5.0 10.2 72
125 88 15.6 13.7 9.5 14.7 14.6. Rdg. rec. 5.8 11.0 75
156 83 15.2 12.6 10.2 15.4 14.4 Math. 3.8 9.0 62
148 95 14.5 *13.7 10.2 15.8 '14.5 Math. 4.2 9.4 64
147 82 16.4 13.4 10.2 15.4 15.0 Rdg. comp. 4.5 9.7
152 83 16.3 13.5 10.5 15.7 13.4 Rdg. comp. 2.9 8.1 60
155 16.8 13.7 11.1 1(1.; 15 6 Math. 4.4 9.6'4 624
X 92.4i
.. 79.6
SD ' 8.0 12.0
i.
ea'
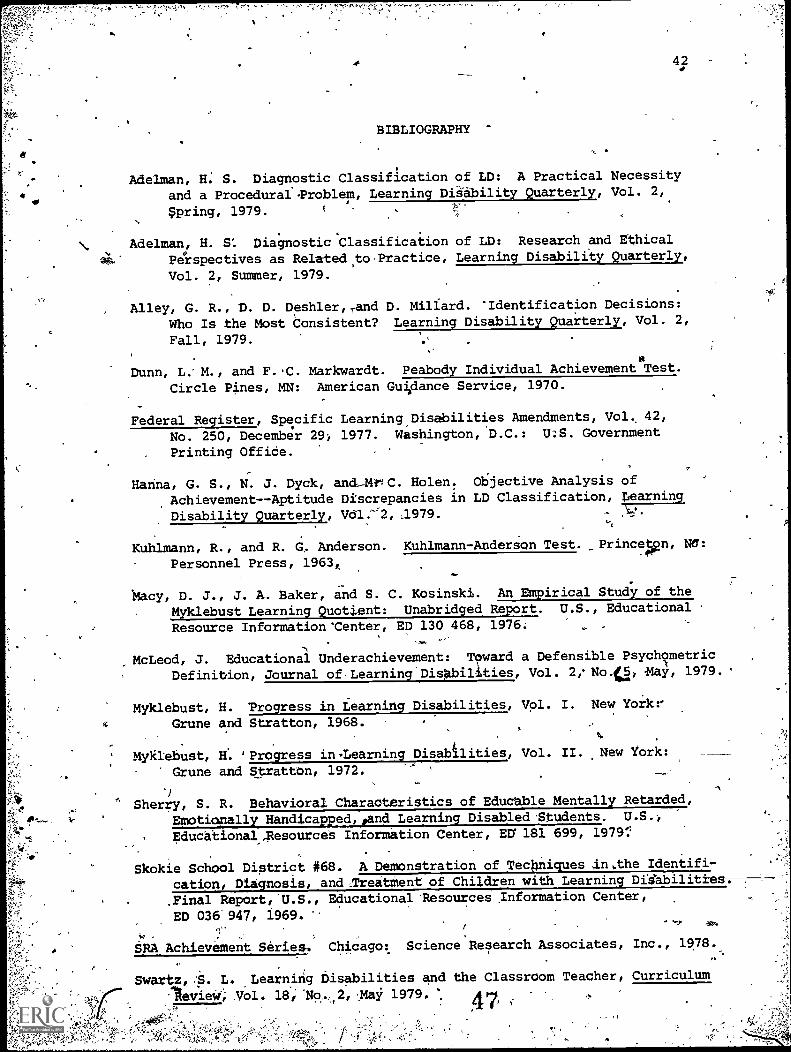
BIBLIOGRAPHY
Adelman, H. S. Diagnostic Classification of LD: A Practical Necessity
and a ProceduralProblem, Learning Disability Quarterly, Vol. 2,
,Spring, 1979. (
Adelman, H. S. Diagnostic Classification of LD: Research and Ethical
Perspectives as Related ,to Practice, Learning Disability Quarterly,
Vol. 2, Summer, 1979.
,Alley, G. R., D. D. Deshler,Tand D. Millard. 'Identification Decisions:
Who Is the Most Consistent? Learning Disability Quarterly, Vol. 2,
Fall, 1979.
0Ot
Dunn, L.' M., and F..C. Markwardt. Peabody Individual Achievement Test.
Circle Pines, MN: American Guidance Service, 1970.
Federal Register, Specific Learning Disabilities Amendments, Vol, 42,
No. 250, December 29; 1977. Washington, D.C.: U:S. Government
Printing Office.
Hanna, G. S., N. J. Dyck, and-Mf4C. Bolen! Objective Analysis ofAchievement--Aptitude Discrepancies in LD Classification, Learning
Disability Quarterly, V(51;-"2, .1979.
Kuhlmann, R., and R. G. Anderson. Kuhlmann-Anderson Test. _Princepn, NC:
Personnel Press, 1963,,
Macy, D. J., J. A. Baker, and S. C. Kosinski. An Empirical Study of the
Myklebust Learning Quotient: Unabridged Report. U.S., Educational
Resource Information'Center, ED 130 468, 1976.
McLeod, J. Educational Underachievement: Toward a Defensible Psych?metric
Definition, Journal of-Learning Disabilities, Vol. 2; No.C5, .May, 1979.
Myklebust, H. 'Progress in Learning Disabilities, Vol. I. New York:
Grune and Stratton, 1968.o.
Myklebust, H.. 'Progress in Learning Disabilities, Vol. II. .New York:
Grune and Stratton, 1972.
' Sherry, S. R. Behavioral Characteristics of Educable Mentally Retarded,Emotionally Handlcapped,sand Learning Disabled 'Students. U.S.;
EducationalyResources Information Center, ED' 181 699, 1979:
Skokie School District #68. A Demonstration of Techniques in,the Identifi-
cation, Diagnosis, and ,Treatthent of Children with Learning Disabilities.
.Final Report,-U.S., Educational 'Resourcei Tnformation Center,
ED 036'947, 1969.
0 SRA Achievement Series, Chicago: Science Research Associates, Inc., 1978.,
Swartz,.S. L. Learning Disabilities and the Classroom Teacher, Curriculum
leviewr; .Vol. 16;14o. 2, Mali 1979, 4 47

A
BIBLIOGRAPHY (Continued)
4.
Swartz, S. L. Modification Of the Myklebust Learning Quotient Method.
Unpublished. Macomb, IL: Western Illinois University, 1980.
E. Ysseldyke. Current Assessment and Decision-
in Model LD Proq\iims, Learning Disability Quarterly,
9.
Thurlow, M. L., a.:14-3.:
Making PracticlsVol. 2, Fall, 197
Van Nagel, C. Observational Techniques for Use by Special Educators InAssessing Students 'with Learning Disabilities. :U.S., EducationalResources Information Center, ED 140 590, 1977.
10t
Webster, R. E., and others. An Individualized Method for Assessing the
"Leaving Disabled" Ch4. U.S., Edu Tonal sources Information
Centee, ED 161 902, 1977
I
Wechsler, D. Wechsler Intelligence Scale for Children--Revised. New York:
The Psychological Corporation, 1974.
O
(
11,