document resume ed 361 901 ea 025 296 … · instrument developed to measure the ... between the...
TRANSCRIPT

DOCUMENT RESUME
ED 361 901 EA 025 296
AUTHOR Johnson, Bob L., Jr.; And OthersTITLE A Guide to Constructing and Interpreting the "School
Vision Inventory" Diagnostic Profile.PUB DATE -Ian 91
NOTE 30p.PUB TYPE Reports Evaluative/Feasibility (142) Guides
Non-Classroom Use (055)
EDRS PRICE MF01/PCO2 Plus Postage.DESCRIPTORS *Administrator Effectiveness; *Educational
Objectives; Elementary Secondary Education;*Institutional Mission; Leadership; LeadershipStyles; Measurement; *Measurement Techniques;Organizational Communication; *Principals; *SchoolEffectiveness; Teacher Attitudes
IDENTIFIERS *School Vision Inventory
ABSTRACT
Blumberg and Greenfield (1986) identified a keyelement of leadership associated with school effectiveness--theprincipal's "vision" for his or her school. Using a 14-iteminstrument developed to measure the extent to which teachers in agiven school know, share, and work toward realization of theirprincipal's vision, this paper offers some steps in constructing andinterpreting a vision profile for a given school, or a measure cf theextent to which a principal's vision is known and shared within aschool. The School Vision Inventory (SVI), which creates subscalesfor the factors of internalization, exchange, and sacrifice, isdescribed. Vision profile data frcm a selected sample of 57 schoolsare offered for consideration and comparison. Directions for usingthe SVI for research and school improvement purposes are alsoprovided. Five tables and four figures are inciuded. (Author/LMI)
***********************************************************************
Reproductions supplied by EDRS are the best that can be madefrom the original document.
********************************************************************
A Guide to Constructing and Interpreting the
School Vision Inventory Diagnostic Profile
Bob L. Johnson, Jr.Louisiana State University
Joseph W. LicataLouisiana State University
and
William D. GreenfieldPortland State University
January 1991
College of EducationDepartment of Administration and Foundational Services
Louisiana State UniversityBaton Rouge Louisiana
U S DEPARTMENT OF EDUCATIONOthce ol Ech,cataonal Research a,cs hho,c. eEDUC TIONAL RESCW1CF
t4Ti P R.,
his document nes been reproduced asreceived trorr the person or organizationoriginating $1
C Minor changes nave been made to ernproverePrOduction cleanly
Points of view or in$, ons Stated in this dor umerit do nO1 neres-eray repiesem Mtn 4.OFRI pos,t4on pohcy
-PERMISSION TO REPRODUCE THISMATERIAL HAS BEEN GRANTED BY
2TO THE EDUCATIONAL RESOURCESINFORMATION CENTER IERIC1.-
a
Abstract
Blumberg and Greenfield (1986) have identified an important leadership elementassociated with school effectiveness, namely, the principal's "vision" of what his/her school is tobecome. Using an 14-item instrument developed to measure the extent to which teachers in agiven school know, share, and work toward realization of their principal's vision, this paper seeksto offer some steps in constructing and interpreting a vision profile for a given school, i.e. ameasure of the extent to which a principal's vision is known and shared within a school. Adescription of the School Vision Inventory (SW) (Greenfield, Licata, and Johnson, forthcoming)is included. In addition, vision profile data from a selected sample of 57 schools is offered forconsideration and comparison. This paper offers specific directions on how to use the SW forresearch and school improvement purposes.

A Guide to Interpreting theSchool Vision Inventory Diagnostic Profile
Blumberg and Greenfield (1986) have identified an important leadership element
associated with school effectiveness, namely, the principal's "vision" of what his/her school is to
become. In an effort to understand how eight effective school principals viewed themselves and
their work, it was observed that each seemed to be guided by a "vision" of what was to be
accomplished both educationally and organizationally in his/her school.
The principal's "vision" is the product of a process which iTivolves the observation of the
current state of affairs in a school. This observation leads to the making of a judgement as to
whether or not the current state of the school is satisfactory. Implicit in the principal's judgment
of his school's condition is some standard of goodness or "vision" of what his school can become.
Given the desire of the principal to conform his/her school to this "vision", he/she must
then act to realize this vision in his school. Such action involves the articulation of this "vision" to
others. Furthermore, the principal must motivate others to action aimed at achieving this desired
aate of school affairs. Since the school is essentially a social situation, the principal's primary
means of influencing what happens in a school is working with and through faculty and staff. The
interpersonal competence of the principal is central to his articulation of the vision. Furthermore
such competence is crucial to his/her motivational skills. Others must be motivated to act on the
"vision" if it is to be realized.
The School Vision Inventory
School Vision Inventory (SVI) items were selected to reflect Blumberg and Greenfield's
(1986) description of the performance of a principal in advancing a schoo: vision:
1) persuading others to accept and share this vision; 2) exchanging ideas about the vision with
others, and; 3) motivating others to act and even make sacrifices towards this vision.
In a pilot study involving 57 schools and over 1000 teachers, factor analysis identified 3
subscales contained in the instrument. These subscales are identified and described below:
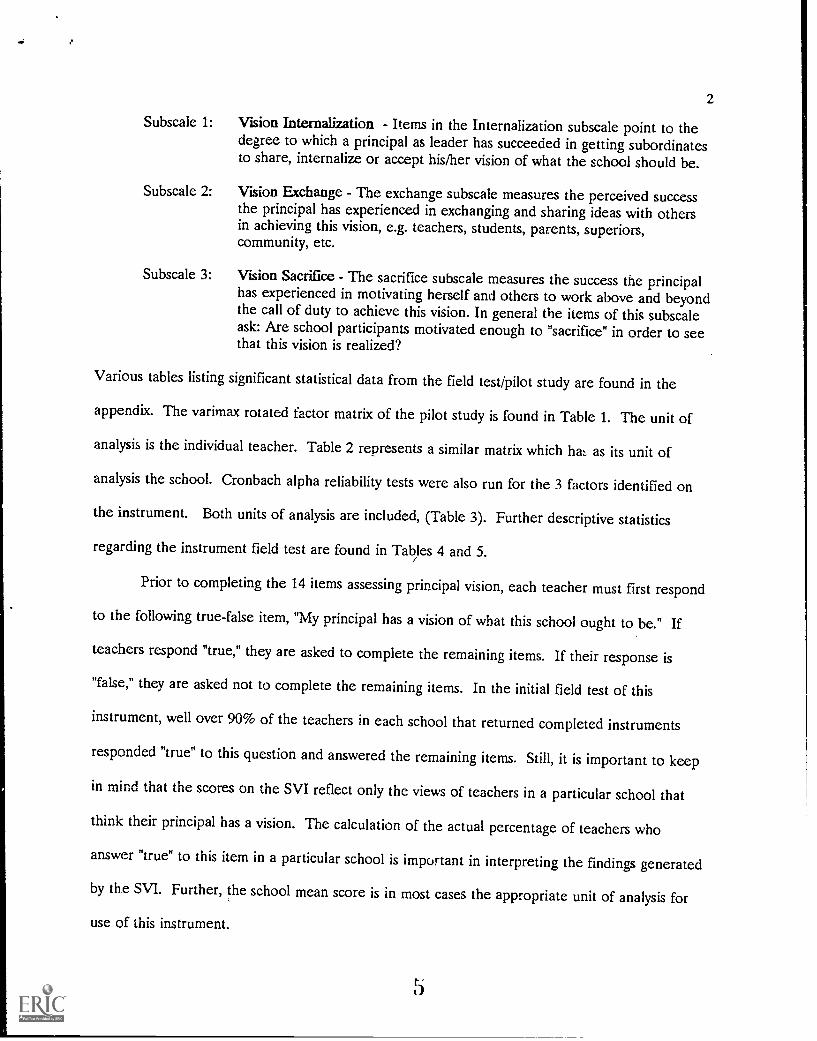
Subsea le 1:
Subsea le 2:
Subsea le 3:
2
Vision Internalfration - Items in the Internalization subscale point to thedegree to which a principal as leader has succeeded in getting subordinatesto share, internalize or accept his/her vision of what the school should be.
Vision Exchange - The exchange subscale measures the perceived successthe principal has experienced in exchanging and sharing ideas with othersin achieving this vision, e.g. teachers, students, parents, superiors,community, etc.
Vision Sacrifice - The sacrifice subscale measures the success the principalhas experienced in motivating herself and others to work above and beyondthe call of duty to achieve this vision. In general the items of this subscaleask: Are school participants motivated enough to "sacrifice" in order to seethat this vision is realized?
Various tables listing significant statistical data from the field test/pilot study are found in the
appendix. The varimax rotated factor matrix of the pilot study is found in Table 1. The unit of
analysis is the individual teacher. Table 2 represents a similar matrix which ha:. as its unit of
analysis the school. Cronbach alpha reliability tests were also run for the 3 factors identified on
the instrument. Both units of analysis are included, (Table 3). Further descriptive statistics
regarding the instrument field test are found in Tables 4 and 5.
Prior to completing the 14 items assessing principal vision, each teacher must first respond
to the following true-false item, "My principal has a vision of what this school ought to be." If
teachers respond "true," they are asked to complete the remaining items. If their response is
"false," they are asked not to complete the remaining items. In the initial field test of this
instrument, well over 90% of the teachers in each school that returned completed instruments
responded "true" to this question and answered the remaining items. Still, it is important to keep
in mind that the scores on the SVI reflect only the views of teachers in a particular school that
think their principal has a vision. The calculation of the actual percentage of teachers who
answer "true" to this item in a particular school is important in interpreting the findings generated
by the SW. Further, the school mean score is in most cases the appropriate unit of analysis for
use of this instrument.
3
As an estimate of the concurrent validity of the SVI, a Pearson correlation was calculated
between the total SW score and teachers' perceptions of the relative robustness of their principal
(Licata & Willower, 1978). The Robustness Semantic Differential (RSD) is composed of ten
adjective pairs such as meaningful-meaningless, challenging-dull, interesting-boring, powerful-weak,
active-passive. The more meaningful, challenging, interesting, powerful or active the teachers
viewed their principal, the higher the robustness score in the RSD. Teachers responded to the
concept "My Principal is" using the 10 RSD adjective pairs. As expected, there was a significant
positive correlation between teacher perceptions of their principal's robustness and their
perceptions of his/her effectiveness in advancing a school vision (r=.41, p <.001, n=57).
Listed below are the three factors and resultant subscales which make up the School
Vision Inventory and the accompanying items for each.
L Internalization
1. "This vision can be achieved."
2. "This vision serves the best interests of all the children in this school."
3. "I share this vision."
4. "I have accepted this vision of my own free will."
IL Exchange
5. "My principal effectively exchanges ideas with teachers to achieve this vision."
6. "My principal effectively exchanges ideas with students to achieve this vision."
7. "My principal effectively exchanges ideas with parents to achieve this vision."
8. "My principal Lifectively exchanges ideas with my superiors to achieve this vision."
9. "My principal effectively exchanges ideas with members of the community toachieve this vision."

..1
4
TEL Sacrifice
10. "My principal regularly encourages teachers to make personal sacrifices toaccomplish this vision."
11. "My principal regularly encourages other members of the school-community tomake personal sacrifices to accomplish this vision."
12. "I make personal sacrifices to accomplish this vision."
13. "Other members of this school community regularly make personal sacrifices toaccomplish this vision."
14. "My principal regularly makes personal sacrificet to accomplish this vision."
Administering the SVI
Each participating school receives 25 SVI forms to be completed anonymously by
randomly selected teachers in the principal's school. In schools of 25 teachers or less, every
teacher in the school completes the SW form. In addition, the principal completes a SVI
predicting the percentage "true" response of his/her teachers to each item on the instrument. In
each school a data collesioi, i.e., the librarian, a lead teacher, is selected to collect the forms from
teachers to ensure anonymity. The data collector chosen should be someone trusted by the
teachers.
Scoring The SW for Research
Each of the 14 SVi items is scored 0 for false and 1 for true. The possible scoring range
for an individual teacher completing the entire SW ranges from 0-14. The range for the four
items on the Internalization subscales is 0-4; the range for the five Exchange items is 0-5 and; the
range for the five Sacrifice items is 0-5. Since most research projects will employ the school as
the level of analysis, total and subscale mean scores must be computed for data analysis. Whether
the researcher is looking at individual teacher scores or school mean scores, the higher the score
reflects effectiveness in advancing a school vision (form 1 is the instrument for researchers).

.1
5
Scoring the SW for Professional Development
After collection of teachers' completed surveys, the data collector then passes the raw data
on to the principal for scoring and profiling. Scoring of the data is to be done by the principal
and not the teachers.
Teachers' perceptions are measurei by the SW, a three factor, 14 item true-false survey
c.ocusing on the principal's vision. The principal's perception of the "vision" which exists in his
school is measured using the same instrunbmt yet with a different response form. Instead of
responding in a true-false fashion to each item, the principal -zcr -mds by predicting the
percentage of teachers in his school whose response will be "true" to each item. The average item
score and subscale score for teacher response items are computed by averaging the item responses
for teachers who answer "true."
The number of items for each of the three subscales is not the same. Note the number of
items for the total instrument and for each factor:
Subscale Number of Items Specific SW Item Numbers
Internalization 4 1-4Exchange 5 5-9Sacrifice 5 10-14
14 Total Vision Items
Teachers' respenses to the survey items take one of two forms: True or False. Questions
answered as "true" should be scored as 1, (T = 1). Those answered as "false" should be scored as
0, (F = 0). A copy of the teacher's version of the SW is found as Form 1 in the appendix.
As noted above, the principal's responses to the survey items will be in the form of
percentages. For each of the 14 items he/she will predict the percentage of the teachers in

6
his/her school who will mark "true" as their response to that item. A copy of the principal's
version of the SW is found as Form 2 in the appendix.
To assist the principal or researcher in computing teachers' aggregate responses for each
item and subscale of the SW, two scoring sheets provided for:
1. SW Item by Item Scoring Sheet for Teachers' Responses
2. SVI Total Vision and Subscale Scoring Sheet for Teachers' Responses
Each of these is likewise found in the appendix, respectively as Form 3 and Form 4. Note, it is
imperative that the Item by Item Scoring Sheet be computed and completed first since data from
it is used to complete the Total Vision and Subsea le Scoring Sheet. Once the principal or
researcher has received the data from the data collector, he/she is to determine the percentage of
"true" responses for each item.
Profiling / Plotting the Data
The data for each individual school is to be displayed on two diagnostic graphs: 1) the
Item by Item Vision Profile; and 2) the Total Vision and Subscale Vision Profile. For the
convenience of the principal or researcher, blank copies of each graph are found in the appendix.
The principal is to use data from two sources to plot these graphs: 1) data from the scoring
sheets; 2) data based on his predictions regarding his teachers' perceptions; and 3) mean scores on
each item and subscale provided from a select sample of 57 schools from previous research
i(Greenfield, Licata and Johnson, forthcoming). A description of how these graphs are to be
plotted is found below.
The first graph, the Item by Item Vision Profile, represents an item by item percentage
score of teachers' perceptions regarding vision at Anywhere Jr. High School. As the first
diagnostic profile from, this graph is found as Figure 1 below. The scores of teachers in the
7
individual school are compared with: 1) that principal's prediction of his/her teachers responses
and; 2) the mean average scores of teachers from a selected sample of 57 schools. The x-axis is
numbered 1 to 14. This represents each item of the SW. Notice that the y-axis ranges from 0 to
100 per cent. This represents the percentage of teachers who answered true to that particular
item. The solid line represents the percentage of the teachers at Anywhere Jr. High School who
responded "true" to each item. The double line represents the principal's prediction of the
percentage of teachers that will respond positively to that item. The broken line represents the
averaged responses of a selected sample of 57 schools to each item. Notice that on item 7, "My
principal effectively exchanges ideas with parents to achieve this vision,." only 40% of the teachers
at Anywhere Jr. High (that is 10 out of 25 teachers) perceived their principal, Mr. Anybody, as
being effective in this area. This is compared to the 65% averaged response of a selected sample
of 57 schools. The principal, Mr Anybody predicted that 90% of his teachers would respond
"true" to this item.
** Insert Figure 1 Here **
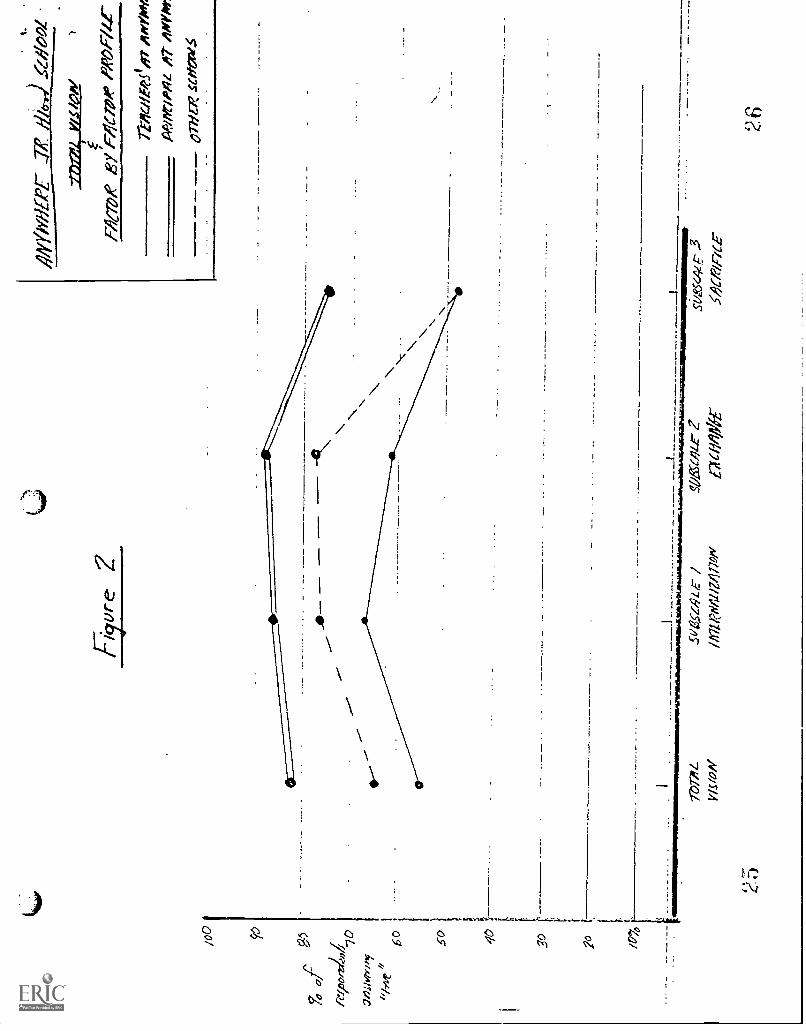
The second diagnostic profile represents total vision plus a subscale by subscale analysis of
each school. This graph, Total Score and Factor by Factor Vision Profile, is found as Figure 2
below. The x-axis has 4 points: total vision; subscale 1-internalization; subscale 2-exchange; and
subscale 3-sacrifice. The y-axis ranges from 0 to 100 per cent. This represents the percentage of
respondents who answered true to that subscale. Once again three lines are plotted: the solid line
represents the averaged percentage of the teachers at Anywhere Jr. 1-7:gh who responded "true" to
a given subscale; the double line represents the principal's prediction of the percentage of
teachers that would respond "true" to that subscale; the broken line represents the averaged

responses of a selected sample of 57 schools to each subscale.
** Insert Figure 2 Here **
Directions for calculating a total vision score and subscale scores for a given school are as follows:
Total Vision Score - After the responses of all teachers in a given school are averaged on
each of the 14 items, a total vision average is then calculated by averaging these 14 percentages.
In the case of Anywhere Jr. High School, the total vision average is 54%.
Subscale 1: Internalization of Vision - Sin,-e items 1-4 of the SVI represent the Vision
Internalization factor, this percentage is calculated by averaging teachers responses in a given
school for items 1-4 of the Item by Item Profile. The Vision Internalization score fof Anywhere
Jr. High is 67.5%. Approximately 67.5% of the teachers there have internalized the principal's
vision.
Subsea le 2: Exchange of Vision - Items 5-9 of the SW represent the Vision Exchange
factor. This percentage is calculated by averaging the responses of teachers in a given school for
items 5-9 as found on the Item by Item Profile. The Vision Exchange score for Anywhere Jr.
High is 62%. This percentage felt that the principal was effective at sharing and exchanging ideas
about his vision with others.
Subsea le 3: Vision Sacrifice - Items 10-14 of the SVI are the Vision Sacrifice factor. This
percentage is calculated by averaging.the responses of teachers in a given school from items 10-14
of the Item by Item Profile. The Vision Sacrifice score for Anywhere Jr. High is 48%. This
percentage of the teachers were motivated enough by the principal's vision to act on it.

13
Interpreting the Profile
Interpretation of the profile centers around the two graphs which the principal has
constructed from the data mentioned above. Using the Item by Item Vision Profile graph as
given in Figure 1, the principal is able to compare the "vision" perception of three groups on each
item of the profile. These three groups are: 1) teachers at his/her school; 2) his/her perceptions
of teachers at his/her school, and; 3) perceptions of teachers at other schools.
Comparisons are made on the following basis:
Principal's perception vs. Teachers' perceptions at Principal's s:thool - Using the Item by
Item Vision Profile graph (Figure 1), the principal may compare the perceptions of his/her
teachers to the perceptions he has of them on any given item. For example, analysis of our
sample graph reveals that for item 3, "I share this vision", there is large discrepancy between the
principal and teachers' perceptions. The principal predicted that 90% of her teachers shared her
vision of the school. In reality, however, only 60% of her teachers share this vision. Since the
discrepancy between the principal and her teachers is so large there is cause for concern.
Furthermore, since the principal's prediction is much greater than what is actuality perceived it is
quite possible that the principal is unaware of some dissatisfaction among teachers. Discrepancy
this large may emphasize the need for some type of rernediation. There are instances, though not
evident on our sample graph, where the perceptions of teachers in a principal's school are higher
than the principal's predicted perception. If the discrepancy is large, it is possible that the
principal is once again unaware of the strength of his teachers' attitudes and perceptions. In
cases where the discrepancy in perceptions is small there may be no need for help or remediation.
However, if a given principal's prediction on an item is low and the teachers' perceptions on that
item are also low then discrepancy becomes irrelevant. This could possibly indicate that the
principal is not sharing her ideas well. She knows it and her teachers know it. Perhaps better

14
communication is needed.
Teachers' perceptions at a given school vs. teachers' perceptions at other schools -
Comparison of the vision perceptions between a given school and other schools is offered for the
purposes of allowing the principal to see how her school compares with others. Once again the
discrepancy of comparison can be large or small. Likewise, the perceptions of one group may be
above or below the other. Looking at item 6 on the sample graph ("My principal effectively
exchanges ideas with students to achieve this vision."), one can see that a l'arge discrepancy exists
between the perceptions at Anywhere Jr. High (50%) and the perceptions of a sample of other
schools (80%). In this case the perceptions which exists in other schools is greater than the
perceptions at Anywhere Jr. High. The direction and size of this discrepancy reveal that on this
particular vision item the perception of the teachers at Anywhere is lower than the perceptions of
teacher in other schools. The principal should think of ways to narrow the discrepancy on this
particular item.
Principal's _perception vs. Teachers' perceptions at other schools - The comparison here is
between the predicted perceptions made by a principal at his/her school and actual teachers'
perceptions in other schools. Ficre the principal is able to compare her perceptions with that of
other teachers in other schools. It allows the principal to compare the discrepancy which exists
between her perceptions and those of her teachers with the discrepancy between her perceptions
and those of other teachers in other schools.
Using the Total Score and Factor by Factor Vision Profile graph (Figure 2), the principal
is able to compare total vision and vision subscale perceptions, i.e. internalization, exchange, and
sacrifice, of the same three groups:
Principal's perceptior vs Teachers' perception at Principal's school - Looking at Figure 2,

15
one can see how this comparison can be made. The principal should look at the degree of fa
between the two perceptions, noting the presence, direction and size cf the discrepancy present.
For example, regarding the Exchange subscale of vision, it is noted that the principal at Anywhere
predicted tilat 89% of his teachers would perceive her as being effective at "exchanging" her
vision of the school with others. However, only 61% of her teachers perceived her as being
effective at vision exchange. The direction and size of this discrepancy is cause for concern. It
points to possible teacher dissatisfaction and the unawareness of teacher attitudes on the
principal's part.
Teachers perceptions at a given school vs. teachers perceptions at other schools -
Comparison of the vision subscale perceptions between a given school and other schools is
offered for the purposes of allowing the principal to see how his school compares with others.
Once again the discrepancy of comparison can be large or small. Likewise, the perceptions of
one group may be above or below the other. Looking at subscale 1, Internalization, one can see
that a discrepancy exists between the perceptions at Anywhere Jr. High (67%) and the
perceptions of a sample of other schools (75%). In this case the perceptions of vision
internalization which exists in other schools is greater than the perceptions at Anywhere Jr. High.
Such a discrepancy allows the principal to see how his school compares with other schools. It
would appear that principal's in other schools are, on the average, more effective than he/she is in
communication his/her school vision to others.
Principal's perception vs Teachers' perceptions at other schools - The comparison here is
between the predicted perceptions on total vision or a subscale of vision made by a principal at
his/her school and actual teachers' perceptions in other schools. Here the principal is able to
compare his perceptions with that of teachers in other schools. Once again the presence, size and
direction of the discrepancy is worthy of note. Analysis of the total vision score found on graph 2
16
above indicates that the principal of Anywhere Jr. High predicted that 82% of the teachers in her
school would perceive her as effective at communicating, exchanging, and getting others to accept
her vision of the school. Teachers in other schools, however, perceived their principals as being
less effective than this prediction (65%). Notice the direction and size of this discrepancy as
compared to that which exists between this principal and her own school. It would appear that
some type of remediation aim at narrowing this gap would be in order.
The utility of the SVi lies in its ability to identify the
principal's success at creating and sharing his/her vision of the school with his/her faculty.
Furthermore, the instrument offers insight into the motivational intensity shared by a faculty in
pqrsuit of this vision. (see form 1. for a presentation of the best form of the SVI).

1
References
Blumberg, A & Greenfield, W.D. The Effective Principal. Second edition. Boston: Allyn andBacon Inc., 1986.
Greenfield, William D., Joseph W. Licata, and Bob L. Johnson, Jr. "Toward a Measurement ofSchool Vision." Journal of Educational Administration, forthcomin&
Licata, J.W. and Johnson, B.L. (1989). Toward a Synthesis of Inquiry on EnvironmentalRobustness. Planning and Changing 20 (4): 215-230.
Licata, J.W. and Willower, D.J. (1978). Toward an Operational Definition of EnvironmentalRobustness. Journal of Educational Research, 71 (4): 218-222.

-
APPENDIX
-tables-forms
-profile forms
1 7

TABLE 1
VARIMAX ROTATED FACTOR MATRIX OF VISION PROFILE INSTRUMENT
TEACHER LEVEL
(FACTOR)*
ITEM I II III
5 .4656 .6247 .8428 .5999 .814
1 .4992 .7323 .9124 .781
10 .67511 .62612 .66813 .66014 .503
* Eigen values and percent of variance by factors are as follows:
Factor 1:Factor 2:Factor 3:
4.7 eigen, 33.4 %1.8 eigen, 13.0 %1.0 eigen, 7.7 %

TABLE 2
VARIMAX ROTATED FACTOR MATRIX OF VISION PROFILE INSTRUMENT
[LEM
SCHOOL LEVEL(N=57)
(FACTOR)*
5 .5946 .7447 .7829 .72610 .579
1 .5622 .7303 .9044 .833
10 .78611 .73512 .42613 .77214 .545
Eigen values and percent of variance by factors are as follows:
Factor 1: 4.5 eigen, 32.2 %Factor 2: 2.6 eigen, 19.0 %Factor 3: 1.0 eigen, 7.2 %
1 9
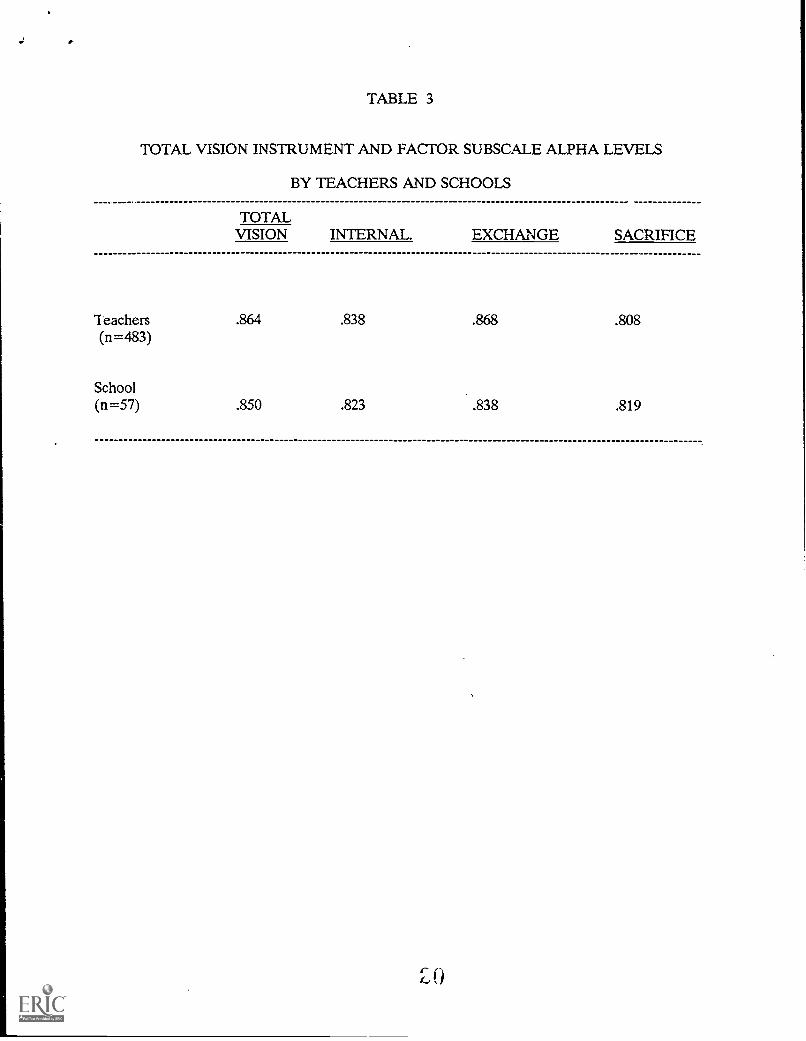
TABLE 3
TOTAL VISION INSTRUMENT AND FACTOR SUBSCALE ALPHA LEVELS
BY TEACHERS AND SCHOOLS
TOTALVISION INTERNAL. EXCHANGE SACRIFICE
eachers(n=483)
.864 .838 .868 .808
School(n=57) .850 .823 .838 .819
0
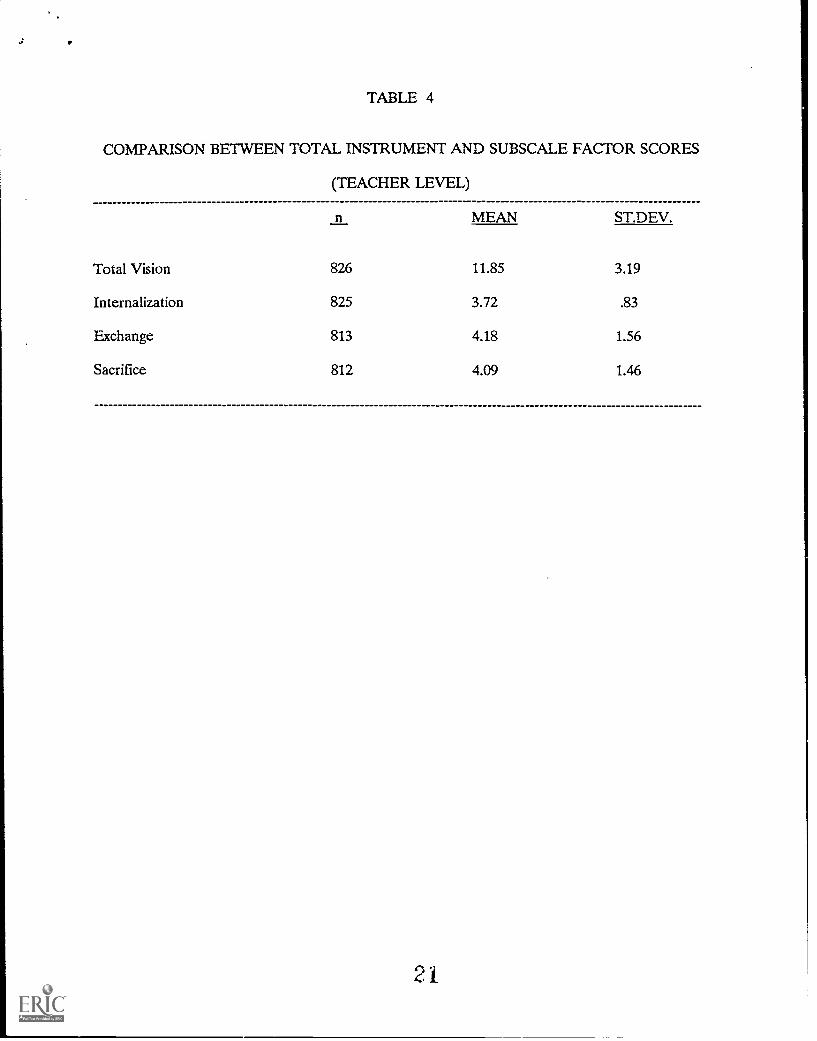
TABLE 4
COMPARISON BETWEEN TOTAL INSTRUMENT AND SUBSCALE FACTOR SCORES
(TEACHER LEVEL)
n MEAN ST.DEV.
Total Vision 826 11.85 3.19
Internalization 825 3.72 .83
Exchange 813 4.18 1.56
Sacrifice 812 4.09 1.46
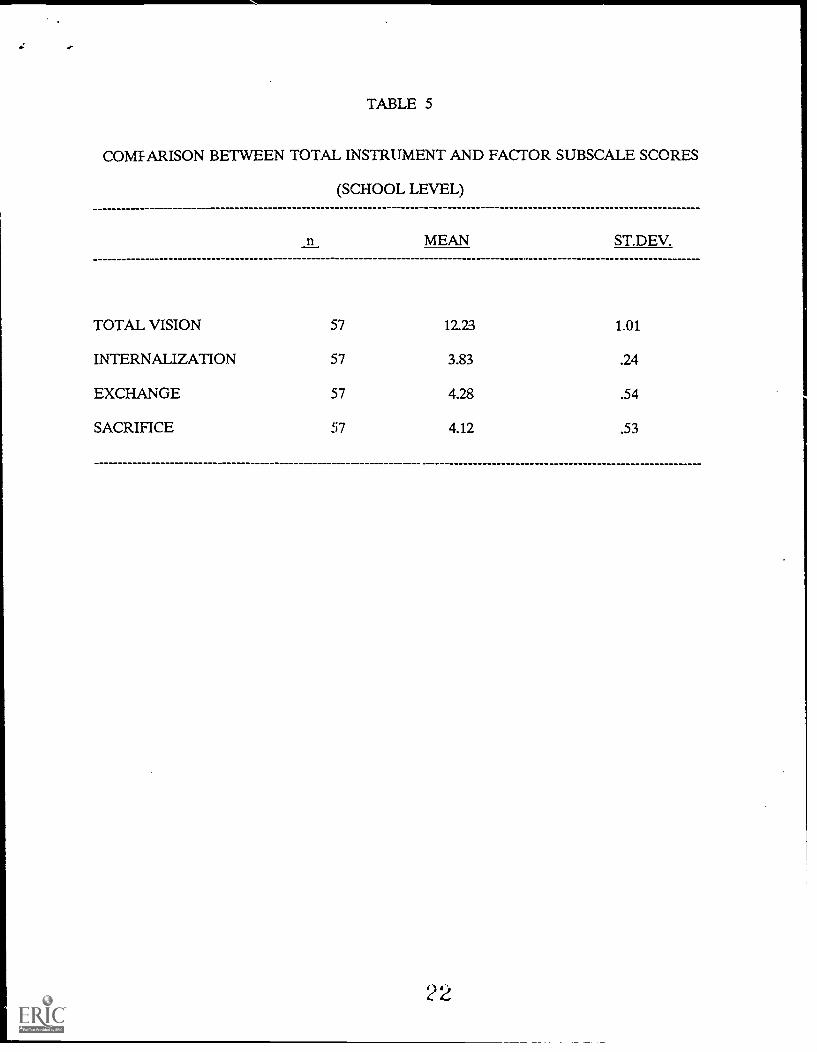
TABLE 5
COME ARISON BETWEEN TOTAL INSTRUMENT AND FACTOR SUBSCALE SCORES
(SCHOOL LEVEL)
MEAN ST.DEV.
TOTAL VISION 57 12.23 1.01
INTERNALIZATION 57 3.83 .24
EXCHANGE 57 4.28 .54
SACRIFICE 57 4.12 .53

/00
76 goaf
Mio
rd',1
4.
f7-4
1w-c
ay 'LO
fiyur
e
g2-
raw
.672
7220
),re
mtv
A-,
4--
,
'
/77i
rtho
nz 4
7-.0
',*Y
zwic
ariY
ir_e
emm
is
20
23
-
5q
C7
6'et
>/1
TE
ST
CO
PYM
ALE
lk/O
NA
kora
r/1
E/Ii
9?,
__772/2/d/X/1
-27-00/2.0?",25$44,5'
2 _771/2.Wa,s.
vs,
Siti21/25' Y
.711.10
411,4AV
29 7f/d/.2A/W
%W
M/ 14 oiR
/1/1214,1
..77/davd.' V
al-7W3
tA
7017374
zooR,)" (Iv
1L 2co4fm,
..
A/at/W
M/O
W/
7e/.75'9/1ivo,711A
2.1.
__
-- - _ -
_ _}
oE
05
Ae/A
INIG
/C
747Z424Y
00/

100
90 80 70PE
RC
EN
T O
FR
ESP
ON
DA
NT
S60
AN
SWE
RIN
G'T
RU
E"
50 40 30 20 10
2?
ITE
M B
Y I
TE
M V
ISIO
N P
RO
FIL
E
II
I.
L AB
12
34
56
78
9 10
11
12 1
314
VIS
ION
PR
OFI
LE
IT
EM
28

100
90 80 70P
ER
CE
NT
OF
RE
SP
ON
DA
NT
S60
AN
SW
ER
ING
'TR
UE
"-
50 40 30 20 10
TO
TA
L V
ISIO
N
EU
BSC
AL
E &
SU
BSC
AL
E
TO
TA
LV
ISIO
NIN
TE
RN
ALI
ZA
TIO
N E
XC
HA
NG
ES
AC
RIF
ICE
SU
BS
CA
LE 1
SU
BS
CA
LE 2
SU
BS
CA
LE 3