document resume - eric · document resume. ud 025 052. ghelfi, linda m. poverty among black...
TRANSCRIPT

ED 272 640
AUTHORTITLE
INSTITUTIONPUB DATENOTEAVAILABLE FROM
PUB TYPE
EDRS PRICEDESCRIPTORS
DOCUMENT RESUME
UD 025 052
Ghelfi, Linda M.Poverty among Black Families in the Nonmetro South.Rural Development Research Report No. 62.Department of Agriculture, Washington, D.C.Aug 8635p.Superintendent of Documents, U.S. Government PrintingOffice (GPO), Washington, DC 20402.Reports - Research/Technical (143)
M701/PCO2 Plus Postage.*Blacks; *Economically Disadvantaged; EconomicStatus; Family Income; Heads of Households; JobTraining; Labor Market; *Poverty; Unemployment;Welfare Services
IDENTIFIERS *Nonmetropolitan Areas; *United States (South)
ABSTRACTThis report analyzes the sources of income and the
income problems of black families in the nonmetropolitan South basedon 1980 data. It also describes some characteristics of familyhouseholders and adult family members related to income-earningcapacity, such as age, education, work disability, labor forcestatus, occupation, and weeks worked. To illustrate how thecharacteristics of these families differ from or coincide with thoseof the majority of southern nonmetropolitan families, the reportcompares blacks and whites by poverty status and ':amily type. Blackfamilies are three times as likely to be poor as white families.Southern nonmetropolitan black families, especially femalehouseholder families, continue to have a high incidence of poverty.Black family members had much higher unemployment rates than didwhites in all poverty status and family type categories. Factorsassociated with poverty among black families include low educationalattainment, high unemployment rates, young or old age, low-wageoccupations, lack of participation in the labor force, and lack ofemployment opportunities. Measures to help solve the poverty probleminclude: (1) increased and improved schooling; (2) economicdevelopment programs such as enterprise zones; (3) job training; (4)daycare for preschool children of single parents; and (5)improvements in public assistance programs. Statistical charts areincluded. (ETS)
************************************************************************ Reproductions supplied by EDRS are the best that can be made ** from the original document. *
***********************************************************************

United StatesDepartment ofAgriculture
EconomicResearchService
Rural DevelopmentResearch ReportNumber 62
Poverty Among BlackFamilies in theNonmetro SouthLinda M. Ghelfi
tis
-.,
U S DEPARTMENT OF EDUCATIONOffice of Educational Research and Improvement
EDUCATIONAL RESOURCES INFORMATIONCENTER 'ERIC)
194 .1; document has been reproduced asreceived from the person or organisationoriginating it
0 Minor changes have been made to improvereproduction quality
Points of view or opinions stated in this decoment do not necessarily represent °MasiOERI position or policy
---- -- --"PERMISSION TO REPRODUCE THISMATERIAL HAS SEEN GRANTED BY
TO THE EDUCATIONAL RESOURCESINFORMATION CENTER (ERIC)."
gill
ii
Additional Copies of This Report...
Can be purchased from the Superintendent of Documents, U.S. GovernmentPrinting Office (GPO), Washington, DC 20402. Include the title and seriesnumber in your order. Write to the above address for price information, orcall the GPO order desk at (202) 783-3238. You may also charge your pur-chase by telephone to your VISA, MasterCard, Choice, or GPO Deposit Ac-count. Bulk discounts available. Foreign customers, please add 25 percentextra for postage.
Microfiche copies ($5.95 each) can be purchased from the NationalTechnical Information Service (NTIS), 5285 Port Royal Road, Springfield,VA 22161. Include the title and series number in your order. Enclose checkor money order payable to NTIS; add $3.00 handling charge for each order.For faster service, call NTIS at (703) 487-4650 and charge your purchase toyour VISA, MasterCard, American Express, or NTIS Deposit Account.NTIS will ship rush orders within 24 hours for an extra $10; charge yourrush order by calling 800-3364700.
The Economic Research Service has no copies for free distribution.
3

Poverty Among Black Families in the Nonmetro South. By Linda M.Ghelfi, Agriculture and Rural Economics Division. Economic Research Ser-vice, U.S. Department of Agriculture. Rural Development Research ReportNo. 62.
Abstract
Nearly all black families in nonmetro areas live in the South. There theyhave a higher poverty rate than black families in other regions; 35 percenthad incomes below the poverty threshold in 1979. Poverty is particularlyprevalent among black families in the nonmetro South with a femalehouseholder-56 percent of them were poor in 1979. Income problems ofthese families and of their poor white counterparts appear to be related tofactors such as low levels of education, young or old age, and workdisabilities. Those poor black family members who are employed are con-centrated in low-wage jobs.
Keywords: Blacks, black families, nonmetropolitan, poverty, South.
Acknowledgments
The author thanks Priscilla Salant, Thomas Carlin, Robert Hoppe, PeggyRoss, Leslie Whitener, John Crecink, and Olaf Larson for their criticalreviews of this manuscript. Thanks also to Gerald Wheelock for the specialtabulations from the 1890 Land Grant Institutions' survey of low-incomerural areas of the South.
Washington, DC 20005-4788 August 1986
iii

Contents
PageSummary v
Glossary vi
Introduction 1
Background 1
Black Residence and Migration Patterns, 1790 to 1980 1
Geographic Distribution of the Black Population in 1980 ..... 2
Aspects of Poverty 3
Families in the Nonmetro South 5
Family Types 5
Data Source and Reliability 5
Family Income 6Ratio of Family Income to the Poverty Threshold 6
Amount and Sources of Income 7
Dependence on Public Assistance 8
Family Member Contributions to Income 9
Human Capital of Black Family Householders 9
Age 9
Education 10
Work Disability 11
Single Parents with Preschool Children 11
Comparison with White Family Householders 11
Labor-Force Status and Employment of Black FamilyHouseholders 12
Labor-Force Status 13
Occupations of the Employed 14
Weeks Worked in 1979 14
Those Not in the Labor Force 15
Comparison with White Family Householders 16
Adult Black Family Members 17
Relationship to the Householder 17
Age 17
Education 17
Work Disability 18
Labor Force Status 18
Occupations of the Employed 19
Weeks Worked in 1979 19
Those Not in the Labor Force 19
Comparison with Adult Members of White Families 22
Conclusions 23
References 24
Appendix Tables 26
iv 5

Summary
There were 1.1 million black families living in nonmetro areas in 1980, 1million (93 percent) of whom lived in the South. Thirty-five percent of thesesouthern nonmetro black families had incomes below the poverty threshold.Poverty is an even greater problem among black female householderfamilies in the nonmetro South, 56 percent of whom had incomes below thepoverty threshold. These poverty rates rival those for families in any centralcity of any metropolitan area.
This report examines human capital characteristics and labor-force par-ticipation of poor black family householders and other adult members ofthese families.
Poor black householders in the nonmetro South do not have high levels ofmarketable skills. Black female householders are generally young and havenot completed high school. One-third of them care for preschool-agechildren. On the other hand, nearly one-third of the poor "other" (married-couple and male, no wife present) family householders were 65 years old orolder and 82 percent had not completed high school. Despite these work-inhibiting problems, earnings are still the largest source of income for thepoor.
In the nonmetro South, nearly 20 percent of poor black female familyhouseholders in the labor force were unemployed. The "other" poor blackhouseholders had a 9.3-percent unemployment rate. Poor householders hadunemployment rates well above those of their nonpoor counterparts. Theseunemployment rates may reflect the low level of skills among the poor'lack householders as well as the lack of employment opportunities in theircommunities.
Only in educational attainment, unemployment rate, and occupationaldistribution are there major differences between poor black and whitehouseholders in the nonmetro South. Black householders completed feweryears of school, had higher unemployment rates, and were more concen-trated in lower wage service and operator, fabricator, and laboreroccupations.
The income status of families also depends on the contributions of familymembers other than the householder. But the human capital characteristicsof these members of poor black families in the nonmetro South show lowlevels of marketable skills.
Additional education, work-related training, increased employment oppor-tunities, daycare for preschool children of single parents, and increasedchild support from absent parents are possible ways to decrease the povertyproblem among these black families.
6

Glossary
Adult. Persons 16 years old and older.
Central city. The largest city, or one of the largest cities, in a StandardMetropolitan Statistical Area (SMSA).
Disability. Work limitinga health condition lasting 6 months or longerwhich limits the kind or amount of work a person can perform. A per-son is limited in the kind of work he or she can do if the health condi-tion restricts the choice of a job. A person is limited in the amount ofwork if he or she cannot work full time (35 or more hours per week).Work preventinga health condition which prevents a person fromworking.
1890 Land Grant Institutions. The historically black colleges establishedthrough the Morrill Act of 1890. The 1890 Land Grant Institutions thatcoonerated on the survey cited in this report are Alabama A&M Univer-sity; University of Arkansas, Pine Bluff; Florida A&M University; FortValley State College (Georgia); Kentucky State University; Alcorn StateUniversity (Mississippi); North Carolina A&T State University; SouthCarolina State College; Tennessee State University; and Virginia StateUniversity.
Family. Two or more persons, including the householder, who are relatedby blood, marriage, or legal adoption, and who live together as onehousehold. If the son or daughter of the householder and the son's ordaughter's spouse and/or children are members of the household, theyare included in the householder's family. A roomer or boarder andhis/her spouse who are not related to the householder are not countedas a family, but as individuals unrelated to the householder.
Family type. Classification of families by the marital status and sex of thehouseholder, and the presence of the householder's spouse. This reportanalyzes female householder families with no husband present and"other" householder families. "Other" includes married-couple familiesand male householder, no wife present, families.
Householder. The person reported in column one of the 1980 Census ofPopulation and Housing form. This was to be the person in whosename the home w. s owned or rented. If there was no such person, anyhousehold member at least 15 years old who was not a roomer, boarder,or paid employee could be reported.
Income. Total money income reported from wages and salaries; nonfarmself-employment; farm self-employment; interest, dividends, and netrentals; Social Security; public assistance; and all other regularly re-ceived sources.
Labor-force status. In the labor forcepersons 16 years old and older whowere either employed or unemployed during the reference week of thecensus.Employedpersons 16 years old and older who were members of thearmed forces or had a job in the civilian labor force during thereference week.Unemployedpersons 16 years old and older who were not in the
vi 7
armed forces and did not have a civilian job, but were actively seekingemployment during the reference week.Not in the labor forcepersons 16 years old and older who were not inthe armed forces, did not have 3 civilian job, and were not seekingemployment during the reference week.Unemployment ratetotal unemployed divided by total in the laborforce.
Metro. Standard Metropolitan Statistical Area (SMSA). Includes countiescontaining a city of 50,000 or more people or a city of 25,000 or morepeople if the city population plus that of contiguous thickly populatedplaces equals 50,000 or more. Additional contiguous counties are in-cluded if they are economically and socially integrated with the centralcity.
Nonmetro. Counties which are not metro.
Poor. Families whose 1979 income was less than the poverty thresholdspecified for their family size, age of householder, and number ofchildren under 18 years old.
Poverty thresh )1c1. Income cutoff used to determine poverty status. The in-come cutoffs vary by family size, number of children, and age of thefamily householder or unrelated individual. The poverty thresholds usedin this study are those published by the Bureau of the Census (36). Forexample, the poverty threshold for a family of four in 1979 was an an-nual income of $7,412.
Race. Families are identified by the race of the householder.
Region. NortheastConnecticut, Maine, Massachusetts, New Hampshire,New Jersey, New York, Pennsylvania, Rhode Island, and Vermont.Midwest (formerly North Central)Illinois, Indiana, Iowa, Kansas,Michigan, Minnesota, Missouri, Nebraska, North Dakota, Ohio, SouthDakota, and Wisconsin.SouthAlabama, Arkansas, Delaware, District of Columbia, Florida,Georgia, Kentucky, Louisiana, Maryland, Mississippi, North Carolina,Oklahoma, South Carolina, Tennessee, Texas, Virginia, and WestVirginia.WestAlaska, Arizona, California, Colorado, Hawaii, Idaho, Montana,Nevada, New Mexico, Oregon, Utah, Washington, and Wyoming.
Rural. Places populated with fewer than 2,500 people.
Unrelated Individual. A householder living alone; a roomer, boarder, part-ner, roommate, or resident employee not related to the householder; ora person living in group quarters who is not an inmate of an institution.Persons living with one or more relatives in a household where thehouseholder is not related to any of them are classified in the census asunrelated individuals.
Urban. Places populated with 2,500 or more people. Urban is notsynonymous with metro. One can be both nonmetro and urban. For ex-ample, a person living in a city of 2,500 or more inhabitants in a countyoutside an SMSA is both nonmetro and urban.
Working-age. Persons 16 to 64 years old.
8vii

Poverty Among Black Familiesin the Nonmetro South
Linda M. Ghelfi*
Introduction
The migration of blacks from the South to theNorth and from rural to urban areas has drasticallychanged the geographic distribution of the blackpopulation since World War I.' From apredominantly rural South population, 80 percentof blacks now live in metro areas and 50 percentlive outside the South. Despite this migration, 1million black families lived in the nonmetro Southin 1980. Thirty-five percent of them had incomesbelow the poverty threshold, a poverty rate whichrivals that for families in any central city of anymetro area.2
This report profiles poor black families in thenonmetro South. Data were computed from the1980 Census of Population and Housing, Public UseMicrodata Sample (PUMS), a 1-percent sample ofthe population that permits detailed analysis of thepopulation living in nonmetro areas (35).2.4 Whilesimilar data for more recent years are not available,the general characteristics reported here probablystill exist.
This report analyzes the sources of income and theincome problems of black families in the nonmetroSouth. It also describes some characteristics offamily householders and adult family membersrelated to income-earning capacity, such as age,education, work disability, labor-force status, oc-cupation, and weeks worked. To illustrate how thecharacteristics of these families differ from or coin-
'The author is an economic! with the Agriculture and RuralEconomics Division, Economic Research Service, U.S. Depart-ment of Agriculture.
'Terms such as the South, poverty, family, householder, andothers are those used by the Bureau of the Census and aredefined in the Glossary.
'The poverty thresholds in this report are those used by theBureau of the Census. The poverty threshold for a family of fourin 1979 was an income of $7,412.
'Italicized numbers in parentheses refer to items in theReferences section.
,Information on the PUMS computer data tape and estimatesof error for the data tabulated from it are presented in the DataSource and Reliability section.
cide with those of the majority of southernnonmetro families, this report compares blacks andwhites by poverty status and family type.
Background
This section provides perspective for the PUMS in-formation. It outlines the changes in the geographicdistribution of the U.S. black population sinceWorld War I. It also places poor black families inthe nonmetro South in national perspective andpresents related research findings on povertyamong black families.
Black Residence and Migration Patterns,1790 to 19805
During 1790-1910, 90 percent of all blacks lived inthe South. But this percentage began to declineafter 1910 as blacks migrated to the North duringWorld War I. By 1940, only 75 percent of all blacksresided in the South. At that time, the migrationstream broadened to include a substantial flow tcthe West, particularly to California. The percentageof blacks living in the South dropped to 50 percentby 1970, a trend that leveled off to 52 percent by1980 (34).
The black migration was not only out of the South,but also from rural areas to urban areas. In 1890(the first census to record rural-urban residence forblacks), 80 percent of all blacks lived in rural areas.By 1970, the situation was completely reversed-80percent lived in urban areas. Most of this urbaniza-tion occurred after 1940, fed by the large influx ofblacks to northern cities from southern rural areas.In 1980, 85 percent of the black population lived inurban areas (34).
Many blacks moved northward for economic oppor-tunities in large northern cities; to escape from
'Except for 1980 data, all information in this section wasobtained from (38).
9

racial discrimination and segregation; or foremployment because agricultural mechanization ordepression left many southern agricultural workersunemployed.
Whatever the causes of migration prior to 1970, anew black migration pattern has emerged. Since1970, the South has experienced a decline in thevolume of black outmigration along with an in-crease in black inmigration. From 1970 to 1975, thenumber of black inmigrants was about the same asthe number of black outmigrants (302,000 enteredthe South while 288,000 left).
Geographic Distribution of theBlack Population in 1980
In 1980, 93 percent of blacks living in nonmetroareas resided in the South. The distribution ofnonmetro blacks is geographically concentrated (asmeasured by the percentage of county population
which is black) along the Southeast Coastal Plain,across Georgia and Alabama, and up through theMississippi Delta (fig. 1). The pattern also extendswest across Louisiana into east Texas.
Nearly all nonmetro counties with 10 percent ormore blacks are in the South. Only 10 of thesecounties are in the Midwest, 6 of which are inMissouri and Illinois bordering the Southern States.No nonmetro counties in the Northeast or West arecomprised of 10 percent or more blacks. Virtuallyall blacks outside the South live in metro areas.
Figure 2 shows the residential distribution of blackfamilies. (The metro-nonmetro breakdown is shownonly for the South because there are so few blacksin nonmetro areas outside the South.) In 1980, 1million black families lived in the nonmetroSouthalmost twice the number of all blackfamilies living in the West (0.5 million) andsomewhat less than those in the Northeast and
Ron iCounties In the nonmetro South with at least10 percent black population, 1980
Scums Carps led Mom (./71
2 10

Midwest, 1.1 and 1.2 million, respectively.However, more black families live in the metroSouth than in any other area, 2.2 million.
Poor black families by region and residence arealso shown in figure 2. Poverty is more prevalentamong black families in the nonmetro South thanin any other area. Although the nonmetro Southcontains only 16.7 percent of all black families, itcontains 22.2 percent of poor black families. Theother areas have a lower percentage of poor blackfamilies than of total black families (see app. table 1for a breakdown of poverty rates by region andresidence).
Aspects of Poverty
Most personal income in the United States isearned through wages and salaries; research on thecauses of poverty has thus concentrated on work-related characteristics of the poor and on the labor
markets in which they work (2, 9, 12, 13, 26).Causes of poverty are generally grouped into threecategories: work - related characteristics (humancapital) of the poor; the availability of employmentand wage rates in local labor markets; anddiscrimination. The combination of these factorsmay also determine the persistence of poverty in apopulation group, such as blacks, or in ageographic area, such as the nonmetro South.
Human Capital. Human capital, the skills andabilities marketable as labor, is usually measuredaccording to the years of schooling completed.Although other measures such as years of work ex-perience, on-the-job training, aptitude test scores,and indicators of motivation have been used, educa-tion is the most available measure and usuallyshows a strong relationship to income (9, 26). Thelower educational attainment of the poor is then in-terpreted as a cause of their low-paying jobs andlow incomes.
Rem 2_
Black families by region and residence, 1980
AN fondlesTO* 6.1 neon
&MOW 04
South-Nonmeho16.7%
Poor familiesTotat 16 million
South-Nonmetro22.2%
11 3

Disability, family type, and age are other facets ofhuman capital that may restrict employment.Physical or mental disabilities which limit theamount or kind of work a person can performrestrict income-generating opportunities. Thepresence of preschool-age children may restrict theability of one parent to work. For single-parenthouseholds, this may mean that there is no adultable to earn income. If the single parent has fewjob skills (little other human capital), he or she maynot be able to pay for child care and support thefamily as well. The employment disadvantages ofadvanced age also limit many people's earnings.For example, forced retirement and retirement dueto health problems keep many older familymembers from earning income.
The population in the nonmetro South, especiallynonmetro blacks, has been found to have low levelsof human capital. A study of four rural southerncounties found that many blacks had low levels ofeducation, little formal job training, little work ex-perience, or had work-inhibiting health problems(26). Another study of southern blacks during thesixties found that plantation agr4Lulture, poorhealth, and poor educational systems ill-preparedrural blacks for nonfarm jobs (19). However, a morerecent study reported that the education levels ofnonmetro blacks have increased, although they stilllag behind those of whites and metro blacks (14).
Local Labor Markets. Characteristics of local labormarkets are also related to poverty. These factorsinclude the wage level of available jobs, the numberof jobs available compared to the number of per-sons seeking employment, and the opportunity forpromotion to better paying jobs. High levels ofunemployment and numbers of able persons not inthe labor force (not seeking employment) are seenas symptoms of deficient demand for labor (28).
Jobs which provide enough income to raise a fa.ailyabove the poverty threshold may be scarce if locallabor markets primarily provide employment in oc-cupations with low wages and little opportunity foradvancement. Low-wage occupations include farmlaborers, service workers, general laborers, andmany clerical and retail sales personnel.
The nonmetro South has become increasingly in-dustrialized since World War II. However,economic growth was not evenly distributed acrossthe region. A study found that during the sixties,industries bypassed southern rural areas with largeblack populations (32). A review of case studies ofindustrial plants locating in nonmetro areas from1945 to 1974 found that minorities were under-
4
represented in these firms, and where they wereemployed, it was in unskilled and semiskilled jobs(30). This employment pattern could be due todiscrimination in hiring, lack of skills among localminorities, or both (30).
More recently, the 1890 Land Grant Institutionsconducted a household survey in a sample of low-income counties in the rural South (12). Over halfof the householders (53 percent) cited limited jobopportunities as a serious problem in securingemployment. Another 34 percent said that limitedopportunities were somewhat a problem. Most ofthe respondents also It there were not enough jobopportunities for the .joung people in theircommunities.
Discrimination. Discrimination is also perceived tocause poverty (19, 23, 26, 28). Discriminationagainst minorities may prevent them from obtainingthe education necessary to obtain employment andlimit their opportunities for employment.Discrimination in education and job training in thesixties was found to be so pervasive amongsouthern nonmetro blacks that it was hard to judgethe effect of these factors on their employment (19).There was some evidence, however, that the situa-tion in the early seventies was changing, andsouthern blacks started to obtain jobs with potentialfor upward mobility (19).
Unpublished tabulations from the 1890 Land GrantInstitutions' survey provide information on whetherthe elderly, women, and blacks in low-income areasof the rural South feel that discrimination by age,sex, or race is a problem in obtaining employment!Seventeen percent of householders over 60 yearsold felt age discrimination was a serious problem inobtaining employment. Combined with the 39 per-cent who felt it was somewhat of a problem, 56percent of older householders thought agediscrimination negatively affected employment op-portunities. Fifteen percent of female householdersbelieved that sex discrimination was a serious prob-lem in obtaining employment, and another 35 per-cent thought it was somewhat of a prehlem.
Thirty-two percent of black householders viewedracial discrimination as a serious employment prob-lem. Added to the 40 percent of black householderswho saw racial discrimination as somewhat of aproblem, nearly 75 percent of black householdersfelt discrimination negatively affected employmentopportunities.
These special tabulations of discrimination by householdercharacteristics were provided by Dr. Gerald Wheelock, AlabamaA&M University. See (12) for published da from the survey.
t2
A larger percentage of older black femalehouseholders found each type of discrimination tobe a serious problem than did any other age-race-sex category of householders, indicating that thesetypes of discrimination may have cumulative ef-fects. Younger white males were the least likely tosee any type of discrimination as an employmentproblem.
Persistence of Poverty. Persistence, or duration, isanother aspect of poverty in the nonmetro South.Although the profile of the poor changes little fromyear to year, the poverty status of particularfamilies changes.' Only slightly more than half ofthe people with incomes below the poverty level inone year were poor the next year (9). Considerablyless than half of those who experience poverty re-main persistently poor over many years. However,the incidence of persistent poverty was highestamong blacks, the elderly, rural residents, andpeople living in the South (9). Persistent povertywas particularly high among black femalehouseholder families. Southern nonmetro blacks areat high risk of being persistently poor because theyfall into many of these categories.
Economic Research Service studies show that coun-ties with per capita incomes which persistentlyranked in the bottom quintile of nonmetro countiesfrom 1969 to 1979 were located predominantly inthe South (7, 15). These "persistently low-incomecounties" had higher percentages of minorities andwere more dependent on extractive industries (suchas mining and agriculture) for employment thanwere other nonmetro counties.
These studies document the income and employ-ment problems of the rural South's population, par-ticularly for the black population and members offemale householder families. This report furtherdetails the income and poverty status of blackfamilies in the nonmetro South. Although there arealso income problems among unrelated individuals,this report examines only families.'
Families in the Nonmetro South
The remainder of this report concentrates solely onfamilies in the nonmetro South. All data andanalysis refer only to that geographic area. Withinthe nonmetro South, families are classified by fam-ily type and race.
'This study of poverty over time is based on data from thePanel Study of Income Dynamics conducted by the SurveyResearch Center at the University of Michigan (9).
My proportion of the nonmetro South population living infamilies is shown in app. table 2.
1
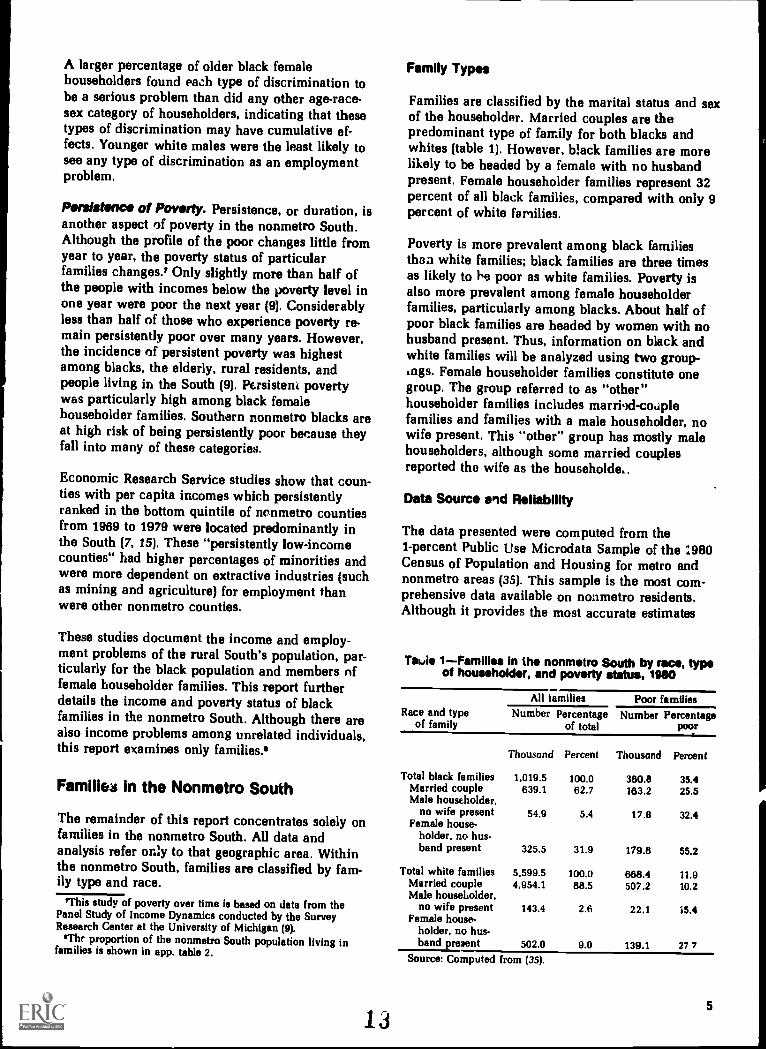
Family Types
Families are classified by the marital status and sexof the householder. Married couples are thepredominant type of family for both blacks andwhites (table 1). However, black families are morelikely to be headed by a female with no husbandpresent. Female householder families represent 32percent of all black families, compared with only 9percent of white families.
Poverty is more prevalent among black familiesthan white families; black families are three timesas likely to be poor as white families. Poverty isalso more prevalent among female householderfamilies, particularly among blacks. About half ofpoor black families are headed by women with nohusband present. Thus, information on black andwhite families will be analyzed using two group-tags. Female householder families constitute onegroup. The group referred to as "other"householder families includes married-coaplefamilies and families with a male householder, nowife present. This "other" group has mostly malehouseholders, although some married couplesreported the wife as the householde,.
Data Source aid Reliability
The data presented were computed from the1-percent Public Use Microdata Sample of the 1980Census of Population and Housing for metro andnonmetro areas (35). This sample is the most com-prehensive data available on nonmetro residents.Although it provides the most accurate estimates
Taub, 1- Families In the nonmetro South by race, typeof householder, and poverty status, 1960
Race and typeof family
All tamilies Poor familiesNumber Percentage
of totalNumber Percentage
poor
Thousand Percent Thousand Percent
Total black families 1,019.5 100.0 360.8 35.4Married couple 639.1 62.7 163.2 25.5Male householder,
no wife present 54.9 5.4 17.8 32.4Female house-
holder, no hus-band present 325.5 31.9 179.8 55.2
Total white families 5,599.5 100.0 668.4 11.9Married couple 4,954.1 88.5 507.2 10.2Male householder,
no wife present 143.4 2.6 22.1 15.4Female house-
holder, no hus-band present 502.0 9.0 139.1 27 7
Source: Computed from (35).

obtainable for the entire population, it is still sub-ject to errors of estimate.
Standard errors and confidence intervals were com-puted for the totals and percentages reported. Thestandard errors were computed directly from thesample, using the 100 random groups method (36).Differences in percentages between poor and non-poor families and between black and white familieswere also tested for statistical significance. All dif-ferences reported in the text are statistically signifi-cant at the 95-percent confidence level or better.
Wherever comparable, the numbers reported havebeen checked against published census data [theestimates reported here are very close to estimatesof the same characteristics reported in (33 and 34)].
Family Income
Factors underlying income differences must beunderstood in order to identify policies that might
increase the income of the poor. This section ex-plores how much additional income it would taketo raise poor families above the poverty threshold;the sources of their income, including the level oftheir dependence upon public assistance; andwhich family members contribute to family income.
Ratio of Family Income to the Poverty Threshold
One measure used to express the relative povertystatus of a family is the ratio of total family incometo the poverty threshold. Black and white familiesby type of householder are distributed according tothis ratio in figure 3. The low-income position ofblack female householder families is striking: 55percent have incomes below the poverty threshold.Nearly 43 percent have incomes below 75 percentof the poverty thresholdincomes of these familieswould have to be increased by at least 33 percentjust to reach the poverty threshold.
Incomes of black "other" householder families andwhite female householder families were similarly
Pose 3Ratio of family Income to the poverty threshold, nonmetro South, 1979
90
60
30
30
60
90
Ratio of looms tothe poverty threehokk
Scum Camp Man (X)
Roos and type of householder
/7, 1// 2.00 or more
0.75 to 0.99
BEE 1.25 to 1.99074 or less
1.00 to 1.24
6 14
distributed in relation to the poverty threshold. Alittle more than 25 percent of each group fallsbelow the poverty threshold. The white "other"householder families are significantly less likely tobe poor than any other group: only 12 percent arebelow the poverty threshold, while 65 percent haveincomes two or more times the threshold.
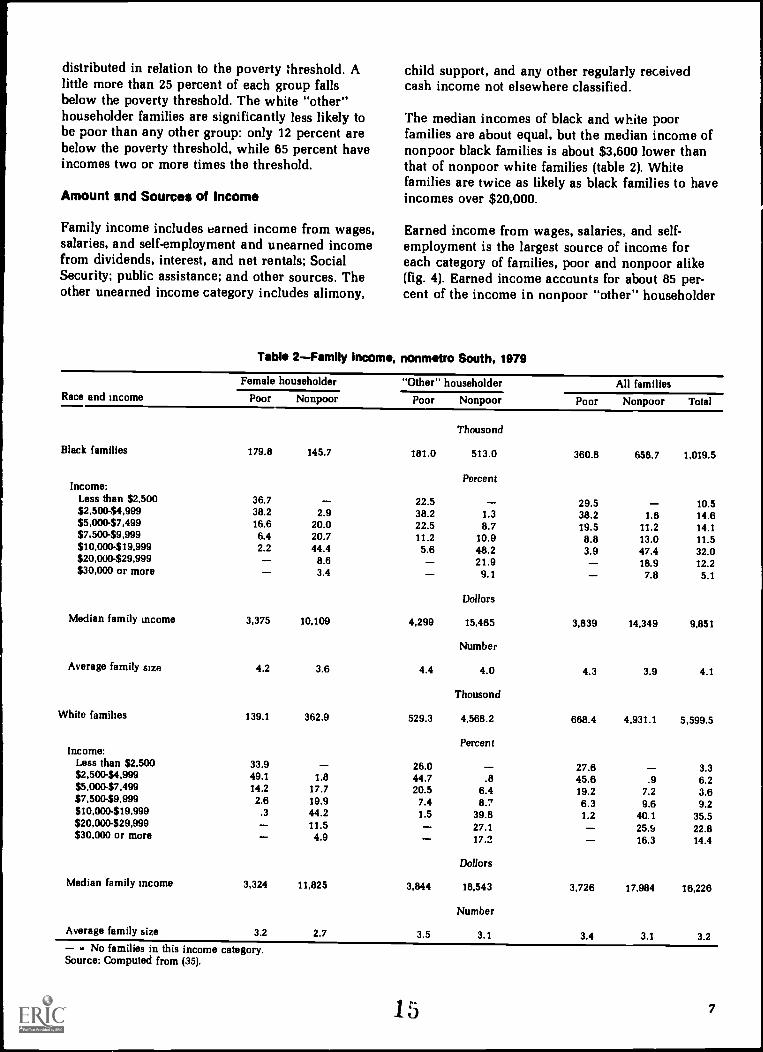
Amount and Sources of Income
Family income includes earned income from wages,salaries, and self-employment and unearned incomefrom dividends, interest, and net rentals; SocialSecurity; public assistance; and other sources. Theother unearned income category includes alimony,
child support, and any other regularly receivedcash income not elsewhere classified.
The median incomes of black and white poorfamilies are about equal, but the median income ofnonpoor black families is about $3,600 lower thanthat of nonpoor white families (table 2). Whitefamilies are twice as likely as black families to haveincomes over $20,000.
Earned income from wages, salaries, and self-employment is the largest source of income foreach category of families, poor and nonpoor alike(fig. 4). Earned income accounts for about 85 per-cent of the income in nonpoor "other" householder
Table 2- Family Income, nonmstro South, 1979
Race and Income
Female householder "Other" householder All familiesPoor Nonpoor Poor Nonpoor Poor Nonpoor Total
Thousond
Black families 179.8 145.7 181.0 513.0 360.8 658.7 1,019.5
PercentIncome:
Less than $2,500 36.7 22.5 29.5 10.5$2,500-$4,999 38.2 2.9 38.2 1.3 38.2 1.6 14.6$5,000-$7,499 16.6 20.0 22.5 8.7 19.5 11.2 14.1$7,500-$9,999 6.4 20.7 11.2 10.9 8.8 13.0 11.5$10,000-$19,999 2.2 44.4 5.6 48.2 3.9 47.4 32.0$20,000-$29,999 8.6 21.9 18.9 12.2$30,000 or more 3.4 9.1 7.8 5.1
Dollars
Median family Income 3,375 10,109 4,299 15,465 3,839 14,349 9,851
Number
Average family size 4.2 3.8 4.4 4.0 4.3 3.9 4.1
Thousond
White families 139.1 362.9 529.3 4,568.2 668.4 4,931.1 5,599.5
PercentIncome:
Less than $2,500 33.9 26.0 27.6 - 3.3$2,500-$4,999 49.1 1.8 44.7 .8 45.6 .9 6.2$5,000$7,499 14.2 17.7 20.5 6.4 19.2 7.2 3.8$7,5009,999 2.6 19.9 7.4 8.? 8.3 9.6 9.2$10,000-$19,999 .3 44.2 1.5 39.8 1.2 40.1 35.5$20,000-$29,999 11.5 27.1 25.9 22.8$30.000 or more 4.9 17.2 16.3 14.4
Donors
Median family Income 3,324 11,825 3,844 18,543 3,726 17,984 16,226
Number
Average family size 3.2 2.7 3.5 3.1 3.4 3.1 3.2- = No families in this income category.Source: Computed from (35).
15 7

families. Poor families obtain a lower percentage oftheir income from earnings than do the nonpoor,and among poor families, female householderfamilies receive the lowest percentage of their in-come from earnings.
Poor families receive a considerably larger portionof income from Social Security and publicassistance than do nonpoor families. Poor femalehouseholder families receive about 25 percent oftheir income from public assistance, while poor"other" families are more dependent upon SocialSecurity income than public assistance.°
Dependence on Public Assistance
While public assistance makes up 25 percent or lessof the income of the poor, some poor families de-
'Percentages of income by source refer to the combined in-come of families within each group. However, not all families ineach group receive income from all sources. The percentages offamilies receiving income from each source are shown in imp.table 3.
pend on this income source much more thanothers. Table 3 examines this dependence in moredetail by showing the ratio of cash public assistanceto total family income.10 Over half of poor blackfamilies reported receiving no public assistance in1979. Female householder families were more likelyto report some cash assistance largely because Aidto Families with Dependent Children (AFDC), thelargest such program, is designed to assist thispopulation. Poor black families are more likely toreceive cash assistance than are white families, andpoor black female householder families had thehighest degree of dependence. Many nonpoor blackfemale householder families (33 percent) receivesome public assistance. This assistance may be themargin of income they need to stay out of poverty
100ther Government assistance programs provide in-kindbenefits to the poor. Food stamps, Medicaid, and housingassistance are the largest of these programs. The PUMS data,which cover only cash income, do not include the ,slue of theseprograms' benefits t3 recipients.
1111111=RPM 4Sources o; Income for families In the nonmetro South, 1979
Poverty status, race, and type of householder
Poor black female
Nonpoor bleak female
Poor Ns* VW'
Nonpoor black Utter'
Poor while female
Nonpoor while female
Pow while Utter'
Nonpoor we 'other
0 25 50 75Percentage of fan* income
boom source: Ill Earned income' ETI Social Security ri Pubic assistance 17-2 Other sources
V Wades wawa Wry. and saliannicennsra inane.Ileums Cenpused Inn (S
100
8 16

4
Table 3- Family dependence on public assistance, nonmetro South, 1979
Race and dependenceon public assistance
Female householder "Other" householder All familiesPoor Nonpoor Poor Nonpoor Poor Nonpoor Total
Thousond
Black families 179 8 145.7 181 0 513.0 360.8 658.7 1,019.5
PercentPercentage of income from
public assistance:100.0 19.4 1.2 5.0 .2 12.2 .4 4.625 0-99.9 24.5 9.8 14.3 3 2 19.3 4.6 9.90.1-24.9 11.3 22.2 10.5 9.9 10 9 12.6 12.00 44.8 66.8 70 1 86 7 57.5 82.3 73.5
Thousand
White families 139.1 362.9 529.3 4,568.2 668.4 4,931.1 5,599.5
PercentPercentage of income from
public assistance:100.0 14.2 4 3.4 .1 56 .1 .825.0-99.9 15.7 5.4 76 11 9.3 1.4 2.40.1-24.9 8.1 9.3 6.8 2.9 7.1 3.4 3.80 61.9 84 9 82.1 95.9 77.9 95.1 93.0
Source: Computed from (35).
because even with the public assistance, many ofthese families are very close to the povertythreshold (fig. ").
Family Member Contributions to Income
Family income, as measured by the Bureau of theCensus, includes the incomes of all family membersat least 16 years old. The low level of income inpoor female householder families appears to be atleast partially due to small contributions ofmembers other than the householder (table 4). Non-poor female householder families report muchlarger contributions by family members to familyincome. Half of nonpoor black female householderfamilies' income is provided by members other thanthe householder. Income of members other than thehouseholder is less significant in explaining incomedifferences between poor and nonpoor "other"householder families.
While these data show the low-income position ofblack female householder families and differencesin income levels, sources, and distributions amongall the family types, they do not explain factors thatcontribute to these observed differences. Variationsin human capital, deficient demand for labor inlocal labor markets, and race and sex discrimina-tion may all contribute to income differences. Whilehuman capital characteristics are examined in this
17
report, the PUMS data only inferentially provideany indications of labor-market conditions anddiscrimination.
Human Capital of Black FamilyHouseholders
Age, education, work disabilities, and caring forpreschool-age children affect the ability ofhouseholders to participate in the labor force. Inthis section, these human capital characteristics ofblack family householders are compared by familytype and poverty status. Data for white house-holders are presented in the tables and graphsthroughout the section. Comparisons of thecharacteristics of black and white householders arediscussed only in the last subsection.
Age
Age indicates where a person is in the income-earning cycle. The prime age for earning incomeranges from 25 to 64. Those younger than 25usually have little job experience or seniority,which results in lower earnings. Most of those age65 and older are retired and earn little or no wagesor salary. The distribution of black householders byage shows that 12 percent of poor female house-holders are under 25 years old, three times thepercentage of nonpoor female householders under
9

Table 4-Family members' contributions to family Income, nonmetro South, 1979
Race and income providedby family members
Female householder
Poor Nonpoor
Black family Income
Percentage contributed by:HouseholderSpouseOther adult family members,
Average number of adultfamily members, includinghouseholders and spouses
White family income
Percentage contributed by:HouseholderSpouseOther adult family members,
Average number of adultfamily members, includinghouseholders and spouses
658.9 1,896.1
71.3NA
28.7
49.3NA
50.7
20 25
454.7 5,038.8
80.0NA
20.0
59 8NA40.2
1.7 2 0
NA - Not applicable.'16 years old and older.Source: Computed from (35).
25 (fig. 5). The poor black "other" householders aremore concentrated at the opposite end of the agedistribution-29 percent were at least 65 years old.This compares with 15 percent age 65 and olderamong nonpoor black "other" family householders.
These distributions are reflected in the median ageof each group of black householders. Poor blackfemale householders are the youngest, with amedian age of 39.8 years, while poor black "other"householders are the oldest, with a median age of51.8 years.
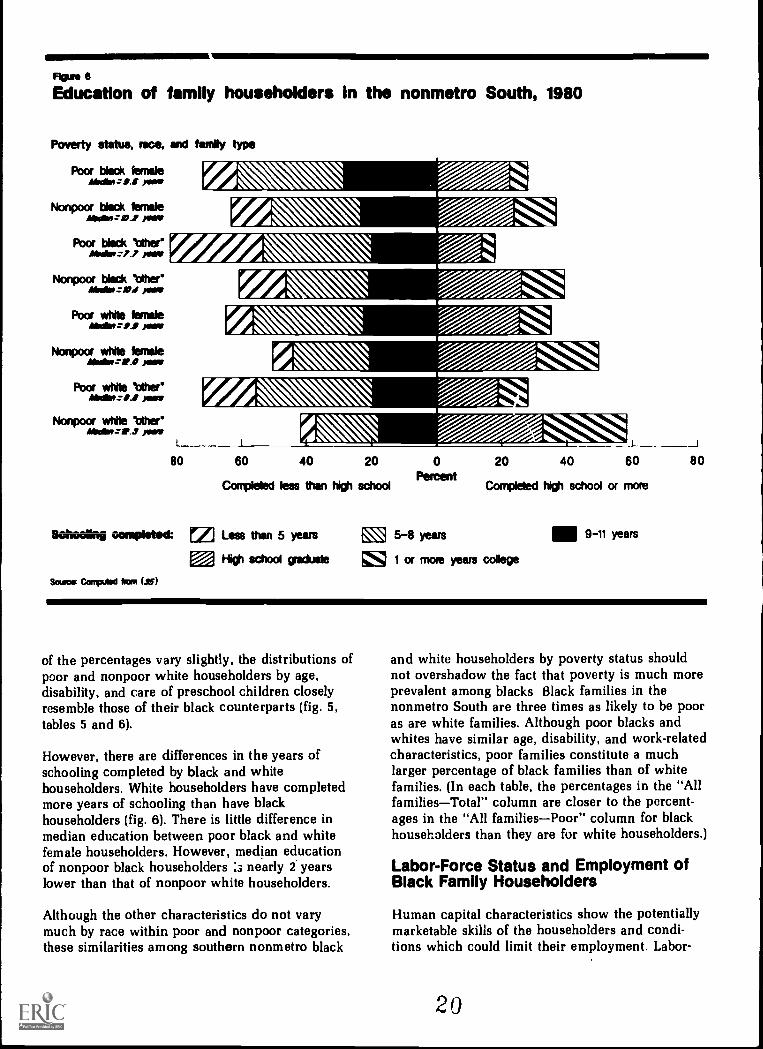
Education
Along with age, years of schooling completed in-dicate employment and income-earning potential.Most poor black householders have not completedhigh school, increasingly a minimum requirementfor obtaining employment today. Figure 6 uses highschool graduation as the reference point of educa-tional attainment. The most dramatic disparity ap-pears in the distribution of poor black "other"
10
"Other" householder All families
Poor Nonpoor Poor Nonpoor Total
Million dollars
844.6 9,005 8 1,503 5 10,905 9 12,409.4
Percent
64.2 57 6 67.3 56:1 57.522.5 27.2 12.7 22 5 21.313.3 15.2 200 21 4 21.2
Number
2.7 2.7 2.3 2.7 2.6
Million dollars
2,014.0 96,178.9 2,468.7 101,217 8 103,686.5
Percent
71.3 72.7 72.9 72.1 72.121.2 20.9 17.3 19.9 19.8
7.5 6.4 9.8 81 8.1
Number
2.3 2.3 2.2 2.3 2.3
householders-nearly 30 percent have not com-pleted 5 years of elementary school, and only 20percent have completed high school.
Education levels of nonmetro blacks have risendramatically since the seventies, but prior to thenthey had very low levels of education (14). Thishelps explain the low median education of the poor"other" family householders (7.7 years), in thatmany of the "other" householders are older, andtheir schooling occurred during a time whennonmetro blacks did not obtain many years ofeducation.
The recent rise in education levels also helps ex-plain the much higher education levels of poorblack female householders relative to poor black"other" householders. Because these femalehouseholders are, on average, younger, wey havecompleted more years of school. However, theirmedian education still lagged about half a yearbehind that of nonpoor black female householders(9.6 versus 10.2 years, respectively).

ROM 6Age distribution of family householders,nonmetro South, 19110
Age
65 and older
55 64
45 -54
35 -44
25 -34
15 -24
65 and older
55 - 64
45 -54
35 -44
25 -34
15 -24
65 and older
55 64
45 -54
35 -44
25 -34
15 -24
65 and olds r
55 - 64
45 -54
35 -44
25 -34
15 -24
Bleck female householders
30 20 10 0 10 20
Black "other householders07-
I
30 20 10 0 10 20White female householders
30
30
I
30 20 10 0 10 20White "other householders
I I
Work Disability
Income-earning capacity is also affected bydisabilities which restrict the amount or kind ofwork one can perform (limiting disability). Thosewho are prevented by a disability from doing anykind of work have no earning capacity. Of allgroups, the poor black "other" householders (16 to64 years old) were most affected by disability: over15 percent were prevented from working andanother 9 percent had a work-limiting disability(table 5). In contrast, only 6 percent of nonpoor"other" family householders report a work -preventing disability.
Work disability is not a large factor in explainingpoverty status among working-age femalehouseholders. Over 10 percent of both poor andnonpoor female householders reported work-preventing disabilities. A lower percentage of eachgroup reported a work-limiting disability.
Single Parents with Preschool Children
Child care, particularly for preschool children, canaffect a householder's availability for work by in-hibiting single parents from entering the labor forceor working full time. About 33 percent of poorblack female householders are single parents withone or more children under 6 years old (table 6).
Only 11 percent of nonpoor female householdershave children under 6. Since most of the "other"householders are married, this group contains fewmale single parents, and few of them have custodyof children under 6 years old.
Preschool children may pose no employment prob-lem for persons who earn wages high enough topay for daycare or for persons with relatives will-
' ing to care for the children while the householder30 works, but many of the poor may not have either of
these arrangements. It is doubtful that most poorfemale householders could pay for daycare and stillearn enough to support the family. This is a par-ticular problem for young black women who haveneither the education or training nor the work ex-perience necessary to obtain higher paying jobs.
30 20 10 0 10 20Percent
sows ComptOod from (15) 0Poor Nonpoor
30
Comparison with White Family Householders
Poor black female householders are generallyyounger than nonpoor female householders. Theyare also much more likely than the nonpoor to havechildren under 6 years old. On the other hand, poorblack "other" householders are older and morelikely to have work-preventing disabilities than arethe nonpoor "other" householders. Although some
1911
Rim 6Education of family householders In the nonmetro South, 1980
Poverty status, race, and family type
Poor black femaleaberanzo.s paw.
Nonpoor black femaleAIssibirzip,r sm.
Poor black titherMallinz1.1 NAV
Nonpoor black tithermmartztod swif
Poor we femaleicaRzs. Nov
Nonpoor while tensAlbarze.0 saw
Poor white tither'AballsvzI4 pmm
Nonpoor we Whew"Arksibtbrap.s slow
./i111%_
PrAw-A.
74.80 60 40 20
Convicted less than high school
0Percent
Completed high school or more
20 40 60
abtrucling complatod: r7] Less than 5 years MI 5-8 years
PA High school graduate NI 1 or mom years college
Somme Computed In (SS)
III 9-11 years
80
of the percentages vary slightly, the distributions ofpoor and nonpoor white householders by age,disability, and care of preschool children closelyresemble those of their black counterparts (fig. 5,tables 5 and 6).
However, there are differences in the years ofschooling completed by black and whitehouseholders. White householders have completedmore years of schooling than have blackhouseholders (fig. 6). There is little difference inmedian education between poor black and whitefemale householders. However, median educationof nonpoor black householders :3 nearly 2 yearslower than that of nonpoor white householders.
Although the other characteristics do not varymuch by race within poor and non poor categories,these similarities among southern nonmetro black
12
and white householders by poverty status shouldnot overshadow the fact that poverty is much moreprevalent among blacks Black families in thenonmetro South are three times as likely to be pooras are white families. Although poor blacks andwhites have similar age, disability, and work-relatedcharacteristics, poor families constitute a muchlarger percentage of black families than of whitefamilies. (In each table, the percentages in the "AllfamiliesTotal" column are closer to the percent-ages in the "All familiesPoor" column for blackhouseholders than they are for white householders.)
Labor-Force Status and Employment ofBlack Family Householders
Human capital characteristics show the potentiallymarketable skills of the householders and condi-tions which could limit their employment. Labor-
20

Table 5-Work disability of working-age family householders, nonmetro South, 1980
Race and work disabilityFemale householder "Other" householder All families
Poor Nonpoor Poor Nonpoor Poor Nonpoor Total
ThousandBlack householders, 16 to 64
years old 152.2 111.6 128.0 433.9 280.2 545.5 825.7
PercentWork disability:
None 79 6 84.1 75.8 89.3 778 882 84.7Work limiting 7.6 5 2 8 7 5 1 6.1 5 2 6.1Work preventing 12 8 10.8 15.5 5.6 14.1 6 7 9.2
ThousandWhite householders, 16 to 64
years old 116.4 260.9 391.7 3,825.7 508.1 4,086.6 4,594.7
PercentWork disability:
None 77.8 87.4 71.0 88.1 72.6 88.1 86.4Work limiting 7.2 4.6 10.7 6.0 9.9 5.9 6.3Work preventing 15.0 7.9 18.3 5.9 17.5 6 0 7.3
Source: Computed from (35).
Table 6- Single parents with preschool children, nonmetro South, 1980
Race, marital status, andpresence of preschool children
Female householder
Poor Nonpoor"Other" householder All families
Poor Nonpoor Poor Nonpoor Total
Black householders
Single parents with child(ren)under 6
White householders
Single parents with child(ren)under 6
179.8 145.7
32.4 11.2
139.1 362.9
29.0 9 1
Thousand
181.0 513.0 360.8 658.7 1,019.5
Percent
1.5 1.1 16 9 3.3 8.1
Thousand
529.3 4,568.2 668 4 4,931.1 5,599.5
Percent
6 .2 6.6 .9 1.2
Source: Computed from (35).
force and employment data in this section show theparticipation of householders in the labor force andthe types of jobs they hold. The unemployment ratepartially reflects the demand for workers with givenjob skills. And, the characteristics of nonworkinghouseholders provide insight into the potential ofthese poor family householders to enter the laborforce and increase family income.
Labor-Force StatusLabor-force status is the dominant factor in deter-mining income levels because wages and salariesare the largest source of personal income. Butlimited human capital of poor black householders
21
limits their participation in the labor force. Poorblack householders are less likely to be employed orin the labor force than are the nonpoor (table 7).
As expected from their age, education, and dis-ability status, nonpoor blat.'.- "other" householdershave the highest rate of participation in the laborforce: 76 percent were employed in 1980 andanother 4 percent were unemployed (actively seek-ing employment). Thus, only 20 percent of nonpoorblack "other" householders were not in the laborforce. In contrast, 57 percent of poor femalehouseholders and 49 percent of poor "other"householders were not in the labor force.
13

Table 7-Labor-force status of family householders, nonmetro South, 1980
Race and labor-force status
Female householder "Other" householder All families
Poor Nonpoor Poor Nonpoor Poor Nonpoor Total
Thousand
Black householders 179 8 145 7 181 0 513.0 360.8 658 7 1,019 5
Percent
Labor-force status.In the labor force-
Employed 34.7 56 4 46 6 76.4 40 7 72.0 60.9
Unemployed 8 5 4.0 4.8 3 6 66 37 4.7
Not in the labor force 56.8 39 6 48 6 20 0 52 7 24.3 34.4
Unemployment rate' 197 66 9 2 4.6 14.0 4 9 7.2
Thousand
White householders 139.1 362 9 529 3 4,568.2 668.4 4,931.1 5,599.5
Percent
Labor-force statusIn the labor force-
Employed 32 9 55 6 47 8 76.1 44.7 74 6 71.0
Unemployed 6.6 23 5.6 24 5.8 2.4 2.8
Not in the labor force 60.5 42.1 46.7 21.4 49.6 23.0 26.1
Unemployment rate' 16.7 4.0 10.4 3 1 11.4 3 2 3.8
'The unemployment rate is total unemployed divided by total in the labor force.Source: Computed from (35)
Unemployment rates for the various groups may in-dicate the employability of members of the group aswell as the lack of employment opportunities intheir communities. Nearly 20 percent of poorfemale householders in the labor force wereunemployed. And, 9.3 percent of poor "other"householders were unemployed. Unemploymentrates for nonpoor female and "other" householderswere well below those for their poor counterparts.
Occupations of the Employed
Being employs d may not always raise a family outof poverty. For example, a full-time worker earningthe minimum wage does not earn enough to sup-port a family of four above the poverty threshold.Among the major occupational groups shown intable 8, managerial and professional, and precisionproduction, craft, and repair are the relativelyhigher wage occupations. Although incomes fortechnical, sales, and administrative support occupa-tions vary widely, this category contains many low-wage clerical occupations. The service; farming,forestry, and fishing; and operator, fabricator, andlaborer classifications contain mostly low-wagejobs.
Black women have historically been employed inservice occupations (38). Over half of employed
14
poor female householders worked in service oc-cupations in 1980 (table 8). Along with 27 percentin operator, fabricator, and laborer jobs, and 12 per-cent in technical, sales, and administrative supportpositions, these three occupational groups accountfor nearly 90 percent of poor female householders'occupations.
Employed poor black "other" householders are con-centrated in operator, fabricator, and laborer oc-cupations, the historically predominant occupationsfor black men (38). The 46 percent employed in thisgroup, combined with the 24 percent in farming,forestry, and fishing occupations, account for 70percent of employment of poor black "other"householders.
Employed nonpoor black householders are also con-centrated in lower wage occupations. However, 14percent of black female householders and 9 percentof black "other" householders are employed inmanagerial and professional occupations, aboutthree times the percentage of poor blackhouseholders employed in these occupations.
Weeks Worked In 1979
Earnings also depend on the duration of employ-ment. Part-time workers could have low earnings in
2z

Table 8-Occupatlois of employed family householders, nonmetro South, 1980'
Race and occupation
Female householder "Other" householder All familiesPoor Nonpoor Poor Nonpoor Poor Nonpoor Total
Thousand
Employed black householders 62.1 82.0 83 3 384 4 145 4 466 4 611 8
PercentOccupation:
Managerial/professional 42 138 3 0 8.5 3.5 9.4 8 0Technical/sales/administrative
support 12.1 14.5 3 7 7 0 7.3 8.3 8.1Service 51.0 34 9 10 7 11.8 27.9 15.9 18.7Farming/forestry/fishing 3.1 1.9 24.0 7.3 15.1 6.4 8.4Precision craft/repair/production 3.1 2 3 12 8 19.1 8.7 16 2 14.4Operators/fabricators/laborers 26.6 32.6 45.7 46.3 37 6 43.8 42.4
Thousand
Employed white householders 45 8 200.8 249.6 3,426.0 295.4 3,626.8 3,922.2
PercentOccupation:
Managerial/professional 7.9 17.9 7.1 19.6 7.2 19 5 18.8Technical/sales/administrative
support 32.8 37.7 9.1 15.9 12.7 17.1 16.8Service 30.8 15.9 6.2 5.3 10.0 5 9 8.2Farming/forestry/fishing .6 .8 23.2 7.7 19.7 7.4 8.3Precision craft /repair/production 2.2 4.0 25.6 27.0 22.0 25.7 25.4Operators/fabricators/laborers 25.8 23.7 28.8 24.5 28 3 24.5 24.8
'Employed in the civilian labor force.Source: Computed from (35).
higher wage jobs. Labor-force status and occupationreported by the census are for the week prior to theone in which the respondent completed the censusquestionnaire (generally the last week of March orthe first week of April, 1980). The amount of in-come families report for the previous year (1979)determines the poverty status of families. Althoughit i not known whether respondents held the samejobs in 1979 as they did in 1980, data are availableon the number of weeks individuals were employedduring the previous year.
Twenty-seven percent of pour black householdersworked 40 or more weeks in 1979, compared with65 percent of nonpoor black householders (table 9).This disparity is largely due to the high percentageof the poor family householders who did not workat all. For the poor black householders who didwork, the median weeks worked was not muchlower than the median weeks worked by nonpoorhouseholders (41.5 and 45.2 weeks, respectively).
Those Not In the Labor Force
The income level of many poor families would beraised if the family head were employed, but manyhouseholders are unable to work for a variety ofreasons.
23
Most family householders are not in the labor forcebecause they are 65 years old or older or have awork disability which prevents them from working.Seventy-six percent of poor black "other"householders and 44 percent of poor black femalehouseholders not in the labor force meet thesecriteria (table 10). Nonpoor householders not in thelabor force are even more concentrated in thesetwo groups than are their poor counterparts: 81percent of black "other" and 72 percent of blackfemale householders are aged and/or disabled.
Although 56 percent of poor black femalehouseholders not in the labor force are neither agednor totally disabled, other factors, such as care forpreschool children, limited education, or a work-limiting disability, may restrict their employment.Although none of these conditions is an absoluteblock to employment, they all affect the ability towork, the hours available to work, or the qualifica-tions for occupations. These circumstances, com-bined with age and total disability, affect all but 6percent of poor black female householders who arenot in the labor force.
About 95 percent of poor black householders not inthe labor force have one or more of thesecharacteristics. For many poor black householders,
15

Table 9-Weeks worked by family householders, nonmetro South, 1979
Race and weeksworked in 1979
Female householder "Other" ho, der All families
Poor Nonpoor Poor r spoor Poor Nonpoor Total
Thousand
Black householders 179.8 145.7 181.0 513.0 360.8 658.7 1,019.5
PercentWeeks worked:
None 56.4 35.5 49.8 17.3 53.1 21.3 32.6
1-13 weeks 8.7 3.8 5.9 2.7 7.3 2.9 4.5
14-26 v _vks 7.2 4.0 6.2 4.2 6.7 4.2 5.1
27-39 weeks 6.1 7.5 6.6 5.8 6.3 6.2 6.2
40-52 weeks 21.6 49.1 31.5 69.9 26.6 65.3 51.6
NumberMedian weeks for those who
worked 39.6 44.5 42.7 45.3 41.5 45.2 44.5
Thousand
White householders 139.1 362.9 529.3 4,568.2 668.4 4,931.1 5,599.5
PercentWeeks worked:
None 58.5 38.0 45.6 17.8 48.3 19.3 22.81-13 weeks 8.9 2.6 6.4 2.2 7.0 2.3 2.814-26 weeks 9.8 3.4 7.1 3.3 7.7 3.3 3.9
27-39 weeks 5.8 5.3 6.5 4.4 6.3 4.4 4.740-52 weeks 17.0 50.7 34.3 72.3 30.7 70.7 65.9
NumberMedian weeks for those who
worked 31.6 45.1 42.7 45.6 42.1 45.6 45.4
Source: Computed from (35).
employment is not an available means to increaseincome. For others it could be if daycare, furthereducation or job training, or other services wereavailable.
Comparison with White Family Householders
Poor black householders were less likely to beemployed than were the nonpoor. The poor blackhouseholders who were employed in 1979 workedslightly fewer weeks than did the nonpoor. And,nearly all of the black householders who were notin the labor force, regardless of poverty status, hadhuman capital characteristics which limited orprevented employment. The same was true for poorand nonpoor white family householders; labor-forcestatus, weeks worked, and characteristics of thosenot in the labor force were strikingly similar tothose characteristics of their black counterparts(tables 7, 9, and 10).
However, there are major differences in theunemployment rates and occupational distributionsof black and white family householders. The overallunemployment rate for white householders was 3.8
16
percent, compared with 7.2 percent for blackhouseholders (table 7). This higher unemploymentrate is due primarily to the high unemployment ratefor poor black female householders (19.7 percent).Although the 16.7-percent unemployment rate forpoor white female householders was not muchlower, black female householders constitute a muchlarger percentage of all black family householdersand have a larger effect on the overall blackunemployment rate than white female householdershave on the overall rate for whites.
Employed white female householders are less con-centrated in low-wage service occupations than areblacks (table 8). A larger percentage of whitewomen are in technical, sales, and administrativesupport occupations. Although not service jobs,these are still generally low-wage, traditionallyfemale, occupations. White "other" householdersare less concentrated in operator, fabricator, andlaborer occupations then are blacks. A higherpercentage of white "other" householders hold pro-fessional and managerial or precision jobs than doblacks, perhaps due to the higher educationalattainment of whites.
24

Table 10-Selected characteristics of family householders not in the labor force, nonmetro South, 1980
Race and selected characteristicq
Female householder "Other" householder All familiesPoor Nonpoor Poor Non poor Poor Non poor Total
ThousandBlack householders not in the
labor force 102.0 57 7 88.0 102.5 190.0 160,2 350.2
PercentCharacteristic:'
65 years old or older 24.9 51.1 53 2 56 9 38.J 54.8 45.7Work-preventing disability 19.1 20.8 22 6 23.7 20 7 22 6 21.6Work-limiting disability 4.4 2 4 2.6 2.0 3.6 2.1 2 9Less than 5 years of education 3.8 2.6 5.1 2.1 4.4 2.3 3.5Single parent with preschool child 25.1 5 4 .3 .1 13 6 2.0 8.35-11 years of education 17.0 13 5 11 8 9.6 14.6 11.0 12.9
None of the above 5.7 4 2 4.3 5 6 5 1 5.1 5.1
ThousandWhite householders not in the
labor force 84.0 152.7 247.0 979.0 331 0 1,131 7 1,462.7
PercentCharacteristic:'
65 years old or older 26.0 60 5 50.7 58.5 44.5 58.8 55 6Work-preventing disability 20.8 13.5 28.9 22.9 26.9 21 6 22.8Work-limiting disability 3.9 1.7 3.3 2.2 3.4 2.1 2.4Less than 5 years of education 2.6 1.8 2.3 .7 2.4 9 1.2Single parent with preschool child 21.0 2.6 .3 . . 5.5 .4 1.55-11 years of education 16.0 11.5 9.3 6.5 11.0 7.1 8.0
None of the above 9.6 8.3 5.1 9.1 6.3 9.0 8.4
'Characteristics are not mutually exclusive groups. So that a person does not appear in more than one category, each category takespre "edence over all those below it.
** - Less tLan 0.1 percent.Source: Computed from (35).
Adult Black Family Members
Although family householders provide the majorityof family income, adult members uther than thehouseholder provided about a third of poor blackfamilies' income in the nonmetro South in 1979(table 4). The human capital characteristics andlabor-force status of adult family members are thenimportant in analyzing the income-earning capacityof these families. As in the discussion of house-holders, black family members are discussed first,followed by comparisons with white family members.
Relationship to the Householder
Regardless of poverty status, 70 percent of the adultmembers of black female householder families arechildren of the householder, indicating the lowlevel of human capital most of these members bringto the labor market (fig. 7). The average age of thesehouseholders is about 48, so most of their childrenwould be under 25 years old, with many under 19.
The distributions of adult members in poor andnonpoor "other" householder families are also iden-tical. Fifty-four percent of adult family members of
25
both groups are spouses of the householders andanother 36 percent are their children.
Age
As would be expected from the youth of many poorblack female householders, members of theirfamilies are also very young. Seventy percent of theadult members of these families were between 16and 24 years old (fig. 8). Most adult members ofnonpoor female householder families were under25, but a larger percentage fell in the 25- to 34-year-old category.
Adult members of poor black "other" householderfamilies are more evenly distributed among the agecategories. However, 40 percent were under 25 andanother 13 percent were 65 or older.
Education
This age distribution is reflected in the years ofschooling completed by adult family members (fig.9). A lower percentage of poor than nonpoor blackfamily members completed high school. Many adultfamily members in black female householderfamilies are not old enough to have completed high
17

Rpm 7Relationship of adult family members to the householder,nonmetro South, 1980
Members of black femalehouseholder families
Kw Non Poor
Members of white femalehouseholder famNies
Poor Non Poor
&rim concave Man (x)
Members of black "other'householder families
Pm Nonpoor
Members of white 'other'householder families
Pm Nonpoor
school. In the "other" family group, the largepercentage of black family members with limitededucation reflects the low educational attainment ofolder blacks in the nonmetro South. However,regardless of the age of the person, if high schoolgraduation is a prerequisite to employment, a muchsmaller percentage of poor black family memberswould qualify than would their nonpoorcounterparts.
Work Disability
Work disability is also a problem for some poorblack "other" family members of working age; 11percent were prevented from working and an addi-tional 4 percent had work-limiting disabilities (table11). Working-age members of black female house-holder families have the same incidence of disabil-ity regardless of poverty statusabout 8 percentwere prevented from working.
18
Labor-Force Status
As would be expected from their lower average ageand educational attainment and their higherdisability rate, poor black family members are notas likely to participate in the labor force as are non-poor family members. About 67 percent of poorblack female householder family members and 70percent of poor black "other" family members arenot in the labor force (table 12). About 40 percentof nonpoor family members are not in the laborforce.
Poor black family members also appear to have aharder time finding employment than do nonpoorblack family members. The unemployment rateshows that 34 percent of members of poor blackfemale householder families and 23 percent ofmembers of poor black "other" families who are inthe labor force cannot find a job, compared with 14
26

RamsAgo distribution of adult family members,nooinvetro South, 1NO
Age Members of Mesh female householder females
66 and older
cf.-64
45-54
35 - 44
25-34
16-24
80 40 0 40 80
Members of Mesh 'other' hmaamm--"o""-gual fondles
65 and older
55-64
45 -54
35 - 44
25-34
16-24L
-01
oy
I __I
80 40 0 40 80114:111111 of white female housePdder families
65 and older
55-64
45 -54
35-44
25-34
16-24:;;;;,,
80 40 0 40 80Members of white 'other householder families
65 and older
1.",-64
45 -54
35 - 44
25-34
16-24
;A.r4:
80 40 0Percent
ElPoorgam Complied lam Ona
40 80
Nonpoor
27
percent for nonpoor black female householder fam-ily members and 10 percent for nonpoor black"other" householder family members.
Occupations of the Employed
The majority of employed black family members,whether poor or ikn-poor, were concentrated in ser-vice, or operator, fabricator, and laborer occupa-tions (table 13). Nonpoor "other" family memberswere somewhat less concentrated in these occupa-tions than were members of the remaining groups,and were more likely to hold managerial and pro-fessional jobs. The majority of these adult familymembers are spouses in married-couple families.Spouses are similar to the householder in age andeducation, and therefore, are more likely than theadult members of female householder families(mostly children of the householder) to have betterjobs.
Although the pe.,.entages are not large, members ofpoor black families are nwq likely than nonpoorblack family memt- Ts to be employed in farming,forestry, or fishing occupationq, 10.5 percent of thepoor compared with 3.5 percet of the nonpoor.Poor black family members e also more concen-trated in service occupations than are the nonpoor.
Weeks Worked in 1979
The number of weeks worked by adult black familymembers also indicates their contribution to familyincome. Nonpoor black family members had ahigher incidence of working 40 to 52 weeks; 37 per-cent of those in female householder families and 41percent of those in "other" householder families(table 14). This contrasts sharply with the poorblack family members' weeks worked: only 9 per-cent of those in female householder families and 11percent of those in "other" householder familiesworked 40 to 52 weeks. The high incidence of thepoor not having worked at all in 1979 also points tothe small effect of family members on the incomeof many poor families. With only about 30 percentof adult family members working, earned incomefor many poor families depended largely on thehouseholder working.
Those Not !n me Labor Force
As in the CEIF.f.; of family householders, there arevalid reasons why many adult black familymembers are not in the labor force. Many of themare umier 19 years old and in school. Some aretotally disabled, and others are 65 years old orolder. These three groups account for 63 percent of
19

Nan aEducation of adult family members, nonmetro South, 1980
Poverty status, race, and family type
Poor black femaleMean A.t 'Nov
Non000r black femaleMainz, V .4 pm,
Poor black 'otherAwe: lt7.1 pm,
Nonpoor black 'otherMelon :11.7 pm,
Poor white femaleMaillatz O./ "Nov
Nonpoor white isms*Maim 11.11 Fars
Poor white 'other*Alger,:S./ lows
Nonpoor white 'otherMods" IP.I pow
80 60 40 20
Completed less than high school
0 20 40 60 80Percent
Completed high school or more
Schooling completed: '7J Less than 5 years EM 5-8 years
01 High school graduate 1;S 1 or more years college
Sans Computed hom (X)
9-11 years
Table 11-Work disability of working-age family members, nonmetro South, 1980
Race and work disability
Female householder "Other" househ, der All families
Poor Nonpoor Poor Nonpoor Poor Nonpoor Total
ThousandBlack family members,
18 to 64 years old 175.8 205.4 263.2 808.6 439.0 1,014.3 1,453.0
PercentWork disability:
None 88.5 88.3 84.7 91.5 86.2 90.9 89.5Work limiting 3.0 3.9 4.1 3.3 3.7 3 4 3.5Work preventing 8.5 7.8 11.2 5.2 1C.1 5 7 7 0
ThousandWhite family members,
16 to 64 years old 87.6 324.8 582.1 5,482.1 669.7 5,806.9 6,476.6
PercentWork disability:
None 79.2 85.4 82.7 91.5 82.2 91.2 90.3Work limiting 5.6 4.5 4,2 3.4 4.4 3.4 3.5Work preventing 15.3 10,1 13,1 5.1 13.4 5.4 6.2
Source: Computed from (35),
20 26

Table 12--Labor-force status of adult family members, nonmetro South, 1980
Race and labor-force status
Female householder "Other" householder All familiesPoor Nonpoor Poor Nonpoor Poor Nonpoor Total
ThousandAdult black family members 184.8 221.8 302.4 877.9 487.0 1,099.7 1,588.7
PercentLabor-force status:
In the labor force-Employed 22.0 48.2 23.2 53.5 22.8 52.4 43.3Unemployed 11.3 7.7 8.9 8.2 8.6 8.5 7.2
Not in the labor force 68.8 44.0 89.9 40.3 88.6 41.0 49.5
Unemployment rate' 33.9 13.8 23.1 10.4 27.4 11.1 14.2
Thousand
Adult white family members 94.3 375.8 689.8 8,107.8 784.1 8,483.8 7,287.7
PercentLabor-force status:
In the labor force-Employed 23.4 50.8 20.2 47.1 20.6 47.3 44.3Unemployed 9.1 8.2 4.3 3.5 4.9 3.7 3.8
Not in the labor force 87.4 43.1 75.4 49.4 74.5 49.0 51.8
Unemployment rate' 28.0 10.9 17.8 7.0 19.2 7.3 8.0
'The unemployment rate is total unemployed divided by total in the labor force.Source: Computcd from (35).
Table 13- Occupations of employed adult family members, nonmetro South, 19801
Race and occupationFemale householder "Other" householder All families
Poor Nonpoor Poor Nonpoor Poor Nonpoor Total
Thousand
Employed black family members 40.4 106.8 89.9 487.3 110.3 573.9 684.2
PercentOccupation:
Managerial /professional 5.4 7.9 5.7 12.8 5.6 11.7 10.8Technical/sales/administrative
support 10.1 13.8 9.2 15.1 9.5 14.8 13.9Service 32.2 20.4 34.8 24.6 33.8 23.8 25.4Farming /forestry/fishing 10.9 5.7 10.3 3.0 10.5 3.5 4.8Precision craft/repair/production 3.5 7.5 4.9 5.8 4.4 8.1 5.8Operators/fabricators/laborers 37.9 44.9 35.2 38.9 38.2 40.0 39.4
Thousand
Employed wh 'e family members 22.1 190.0 139.5 2,889.9 181.8 3,059.9 3,221.5
PercentOccupation:
Managerial/professional 3.2 10.1 7.8 18.9 7.0 18.5 18.0Technical llsalt Jadministrative
support 18.3 25.0 23.5 38.7 22.5 36.0 35.3Service 24.9 13.4 24.5 13.8 24.8 13.8 14.1Farming/forestry/fishing 12.2 5.8 10.2 3.1 10.5 3.3 3.8Precision craft/repair/production 12.7 13.8 5.4 8.3 8.4 8.8 8.8Operators/fabricators/laborers 30.8 32.1 28.7 23.4 29.0 23.9 24.2
'Employed in the civilian labor force.Source: Computed from (35).
2j 21

Table 14-Weeks worked by adult family members, nonmetro South, 1979
Race and weeksworked in 1979
Female householder "Other" householder All families
Poor Nonpoor Poor Nonpoor Poor Nonpoor Total
Adult black family
Thousand
members 184.6 221.8 302.4 877.9 487.0 1,099.7 1,586.7
Percent
Weeks workedNone 67.0 39.2 70.4 37.1 60.1 37.6 47 3
1-13 weeks 13.0 9.2 10.2 7.4 11 3 7.8 8.9
14-26 weeks 6.9 7.5 5.1 6.8 5.7 7.0 6.6
27-39 weeks 3.7 7.4 3.3 8.1 3.4 8.0 6.6
40-52 weeks 9.4 36.7 11.0 40.5 10.4 39 7 30.7
NumberMedian weeks for those who
worked 20.6 42.2 25.8 42.9 23.4 42.8 41.8
ThousandAdult white family
members 94.3 375.8 689.8 6,107.8 784.1 6,483.6 7,267.7
Percent
Weeks worked:None 63.2 37.0 72.9 42.6 71.7 42.2 45.4
1-13 weeks 16.1 8.6 9.0 7.8 10 0 7.8 8.0
14-26 weeks 8.2 9.1 5.9 7.5 6.2 7.5 7.4
27-39 weeks 4.7 7.3 2.9 6.7 3.1 6.8 6.4
40-52 weeks 7.8 37.9 9.3 35.5 9.1 35.6 32.8
NumberMedian weeks for those who
worked 17.6 42.2 24.1 42.5 23.2 42.5 42.2
Source Computed from (35).
members of poor black female householder familiesand 56 percent of poor black "other" householderfamily members who are not in the labor force(table 15). When the remaining circumstances arealso considered, about 88 percent of all black familymembers who were not in the labor force appear tohave some work-inhibiting characteristic.
Comparison with Adult Members ofWhite Families
While the characteristics of black and whitehouseholders were quite similar, the characteristicsof their adult family members were more divergent.In every type of family (except poor femalehouseholder families), the median age of whiteadult family members was at least 3 years higherthan that of black family members (fig. 8). In poorblack female householder families, 70 percent of themembers were under 25 years old, compared with57 percent of members of poor white femalehouseholder families (fig. 8). Fewer members ofpoor black families were in the prime income-
22
earning age categories than were poor white familymembers.
Black family members are more equal to whitefamily members in years of education than areblack and white householders. While median educa-tion of nonpoor black family members is lower thanthat of nonpoor white family members, poor blackfamily members have a higher median educationthan poor white family members (fig. 9). Althoughthe median for all groups except white nonpoor"other" family members was less than high schoolgraduation, many members of these families werestill in school.
Black family members had much higher unemploy-ment rates than did whites in all poverty status andfamily type categories (table 12). Unemployment,coupled with the concentration of employed blackfamily members in low-wage occupations (table 13),
demonstrates the difficulty some black familymembers have in finding employment to help bringfamily income above the poverty level.
30

Table 15-Selected characteristics of adult family members not In the labor force, nonmetro South, 1980
Race and selected characteristicsFemale householder "Other" householder All families
Poor Nonpoor Poor Nonpoor Poor Nonpoor Total
Adult black family members
Thousand
not in the labor force 123.0 97.7 211.3 353.6 334.3 451 3 785.6
PercentCharacteristic:'
65 years old or older 6.7 15.5 17.8 17.1 13.7 16.7 15.4Work-preventing disability 12.2 16.4 13.9 11.9 13.3 12.9 13.0Work-limiting disability 2.0 1.8 1.9 2.1 2.0 2.1 2.0Less than 5 years of education 1.5 .9 3.0 2.1 2.4 1.9 2.1In school 43.9 38.8 23.9 31.4 31.3 33.0 32.3Spouse with preschool child NA NA 10.6 8.7 6.7 6 8 6.85-11 years of education 20.2 13.9 18.5 14.7 19.1 14.5 10.5
None of the above 13.4 12.7 10.3 12.0 11.5 12.1 11.8
ThousandAdult white family members
not in the labor force 63.6 162.1 520.3 3,016.5 583.9 3,178.6 3,762.5
Percent
7haracteristic:'65 years old or older 10.2 29.2 20.1 19.0 19.0 19.5 19.4Work-preventing disability 21.1 20.2 14.7 9.2 15.4 9.8 10.7Work-limiting disability 3.1 2.7 2.3 2.3 2.4 2.3 2.3Less than 5 years of education 3.1 .7 3.1 1.1 3.1 1.1 1.4In school 29.4 27.1 11.9 15.9 13.8 16.5 16.1Spouse with preschool child NA NA 17.4 15.8 15.5 15.0 15.15-11 years of education 24.4 10.1 21.0 16.7 21.4 16.3 17.1
None of the above 8.6 9.9 9.5 20.1 9.4 19.6 18.0NA Not applicable.'Characteristics are not mutually exclusive groups. So that a person does not appear in more than one category, each category takes
precedence over all those below it.Source: Computed from (35).
Conclusions
Southern nonmetro black families, especially femalehouseholder families, continue to have a high in-cidence of poverty. However, poor black house-holders and other adult family members exhibithuman capital characteristics similar to those ofpoor whites. This suggests that measures to in-crease work-related skills would improve the in-come situation of both groups.
Factors associated with poverty among blackfamilies include low educational attainment, highunemployment rates, low-wage occupations, andlack of participation in the labor force. Educationalattainment of black family householders is lowerthan that of white family householders. Part of thisdisparity may be due to the low educational attain-ment of older black householders. Many blackhouseholders in the nonmetro South need addi-tional education and work-related training to com-pete in the job market. Their family members arebecoming better educated, so future needs forremedial education may be reduced. However, not
only is nonmetro black educational attainmentlower than that of nonmetro whites, but educationalattainment of nonmetro residents is lower than thatof metro residents (14). Therefore, if poor blacks inthe nonmetro South are to compete in the nationallabor market, they will have to increase theirschooling even more to match that of metroresidents.
Expectations that better education will result in amore skilled labor force and a higher wageeconomy have led many Southern States to reformtheir education systems. Many of those States haverecently instituted more stringent teacher certifica-tion testing, increased the number of high schoolcredits necessary for graduation, increased teachersalaries, and raised per-pupil expenditures (24).
The high unemployment rates for black familymembers in general and for poor blacks in par-ticular show that the local economies were not ableto provide enough employment or employment ap-propriate to these persons' skills. The 1890 LandGrant Institutions' survey found that lack of
3123

employment opportunities was a serious problem inlow-income areas of the rural South (12). Thesurvey also found that racial discrimination is stillperceived as a hindrance in finding employment.
Blacks in the nonmetro South are affected both bypolicies that affect the distribution of jobs and bypolicies that affect national economic structure andgrowth. The concentration of nonmetro blacks inservice and laborer occupations demonstrates notonly the lower skill levels among poor blacks butalso the inability of loca' economies to provide ad-vancement into more specialized, higher paying oc-cupations. Rural development initiatives cmld beundertaken to attract business and industry tononmetro areas with poverty and employment prob-lems. Economic development programs, such as theproposed Enterprise Zones (which would offer taxincentives to industries locating or expanding indepressed areas), might attract new jobs tochronically low-income areas (20). However, the ef-fects of such programs might be mitigated by struc-tural changes in the U.S. economy such as the re-cent decline in manufacturing employment. Manynonmetro communities in the South depend onmanufacturing for their economic base.
Job training may also be necessary for the poor,especially the unemployed, those employed in low-wage occupations, and those not in the labor forcewho are poorly educated, because new businesseswith higher paying jobs are not likely to locate inareas with an under-trained labor force (1). If lackof child care keeps single parents from working,then public or private daycare could also facilitateemployment.
Improvements in public assistance programs wouldbenefit those unable to work or increase theamount of work they are doing. A study of par-ticipation in the Supplemental Security Income(SSI) program found that only about 55 percent ofthe elderly who are eligible to participate in the pro-gram (39). If many poor elderly black householdersare among these eligible nonparticipants, then SSIparticipation could increase their incomes.
Aid to Families with Dependent Children (AFDC) isa joint FederallState program designed to assistpoor female householder families. Each Stateestablishes its own needs standard (amount ofmoney a family needs to meet a predeterminedstandard of living) and payment standard (amountof the needs standard the State will provide). Theseneeds standards vary by size of family and otherfamily characteristics. However, the payment stan-dard in each State reflects, among other factors, the
24
State's ability to finance the program and itsphilosophy about such support. The Southern Statesgenerally have the lowest AFDC payments in theNation. There have been proposals to provide asingle set of national minimum-benefit levelsmostproposals having benefits considerably above thosecurrently paid in the South. If such a proposal wereimplemented, the incomes of many poor femalehouseholder families in the nonmetro South wouldbe improved.
The recently enacted child-support law should in-crease the incomes of many female householderfamilies. This law provides national enforcement ofjudicially assessed child-support payments, in-cluding the right of the courts to order employersto withhold child-support money from paychecks offathers who are delinquent in their payments (4).However, a much lower percentage of divorcedblack women are awarded child support comparedwith the percentage of white women awarded sup-port (11), so the prospects for many nonmetro blackwomen receiving payments due to this law may belower than those of white women.
References
(1) Abt Associates, Inc. The Industrialization ofSouthern Rural Areas. Study conducted forthe Office of Economic Research, EconomicDevelopment Administration, U.S. Depart-ment of Commerce (under Contract No.7-35482), 1968.
(2) Bawden, D.L. "Work Behavior of Low-IncomeRural Nonfarm Wage Earners," AmericanJournal of Agricultural Economics, Vol. 56,No. 5 (Dec. 1974), pp. 1076-83.
(3) Christensen, T.L. "The Urban Bias of thePoverty Program," in D.B. James, AnalyzingPoverty Policy. Lexington, MA: LexingtonBooks, 1975, pp. 145-54.
(4) The Christian Science Monitor. "EnsuringChild Support." Editorial, Aug. 20, 1984, p.17.
(5) Corcoran, M., and G.J. Duncan. "WorkHistory, Labor Force Attachment, and Earn-ings Differences Between the Races andSexes," Journal of Human Resources, Vol.14, No. 1 (Winter 1979), pp.3-20.
(6) Danzinger, S., I. Garfinkel, and R. Haveman."Poverty, Welfare, and Earnings: A New
32

(7)
Approach," Challenge, Vol. 22, No. 4(Sept./Oct. 1979), pp. 28-34.
Davis, T.F. Persistent Low-Income Counties inNonmetro America. RDRR-12. U.S. Dept.Agr., Econ. Stat. Coop. Serv., May 1979.
(8) Dennis, W.J., Jr. Enterprise Zones: The SmallBusiness Perspective. Washington, DC: Na-tional Federation of Independent Business,undated.
(9) Duncan, G.J. Years of Poverty, Years of Plenty.Ann Arbor, MI: Univ. Michigan, Institutefor Social Research, Survey ResearchCenter, 1984.
(10) Eddleman, B.R. "Policy Implications of Alter-native Theoretical Frameworks for ViewingRural Poverty and Income Distribution," inR.O. Coppedge and C.G. Davis (eds.), RuralPoverty and the Policy Crisis. Ames, IA:Iowa State Univ. Press, 1977, pp. 152-59.
(11) Ehrenreich, B., and K. Stallard. "The NouveauPoor," Ms. Magazine, Vol. 12, No. 1(July/Aug. 1982), pp. 217-24.
(12) 1890 Land Grant Institutions and U.S. Depart-ment of Agriculture. Isolation of FactorsRelated to Levels and Patterns of Living inLow-Income Areas of the Rural South. 1890Land Grant Regional Research PublicationNo. 1, 1983.
i13) Ferleger, L. "Explaining Away Black Poverty:The Structural Determinants of BlackEmployment," in R. Goldstein and S.M.Sachs (eds.), Applied Poverty Research.Totowa, NJ: Rowman and Allanheld, 1984,pp. 148-74.
(14) Fratoe, F. The Education of Nonmetro Blacks.RDRR-21. U.S. Dept. Agr., Econ., Stat.,Coop. Serv., July 1980.
(15) Hoppe, R.A. Economic Structure and Changein Persistently Low-Income Nonmetro Coun-ties. RDRR-50. U.S. Dept. Agr., Econ. Res.Serv., Oct. 1985.
(16) Housing Assistance Council. Taking Stock,Rural People and Poverty from 1970 to 1983.Washington, D.C., July 1984.
(17) King, A. "Labor Market DiscriminationAgainst Black Women," Review of Black
Political Economy. Vol. 8, No. 4 (Fall 1978),pp. 325-35.
(18) Kuvlesky, W.P., C.S. Knowlton, T.J. Durant,Jr., and W.C. Payne, Jr. "Minorities," inD.A. Dillman and D.J. Hobbs (eds.), RuralSociety in the U.S.: Issues for the 1980's.Boulder, CO: Westview Press, 1982, pp.103-23.
(19) Marshal, R., and V.L. Christian, Jr. Employ-ment of Blacks in the South, A Perspective onthe 1960's. Austin, TX: Univ. Texas Press,1978.
(20) Miller, J.P. "Rural Enterprise Zones: What AreThey? Are They Needed and Will TheyWork?" Paper presented at the SouthwesternSocial Science Association Meeting, San An-tonio, TX, March 17-20, 1982.
(21) Moland, J.J., Jr., and A.T. Page. "Poverty," inD.A. Dillman and D.J. Hobbs (eds.), RuralSociety in the U.S.: Issues for the 1980's.Boulder, CO: Westview Press, 1982, pp.136-42.
(22) Owens, E.W. "Survey of Poverty Issues andPrograms: Can We Improve the Perfor-mance?" in R.O. Coppedge and C.G. Davis(eds.), Rural Poverty and the Policy Cr Hs.Ames, IA: Iowa State Univ. Press, 1977, pp.163-80.
(23) Patterson, J.J. America's Struggle AgainstPoverty, 1900-1980. Cambridge, MA: HarvardUniv. Press, 1981.
(24) Richburg, K.R. "Today's Lesson in the South:Better Schools Mean Better Jobs," TheWashington Post National Weekly Edition,Vol. 2, No. 47 (Sept. 23, 1985), pp. 31-32.
(25) Ross, A.H., and H. Hill, eds. Employment,Race, and Poverty. NY: Harcourt, Brace, andWorld, 1967.
(26) Runge ling, B., L.H. Smith. V.M. Briggs, Jr.,and J.F. Adams. Employment, Income andWelfare in the Rural South. NY: PraegerPublishers, 1977.
(27) Schaub, J.D. The Nonmetro Labor Force in theSeventies. RDRR-33. U.S. Dept. Agr., Econ.Res. Serv., Nov. 1981.
(28) Schiller, B.R. The Economics of Poverty andDiscrimination. 2nd ed. Englewood Cliffs,NJ: Prentice-Hall, Inc., 1976.
3325
1

(29) Smeeding, T.M. "The Anti-Poverty Effect ofIn-Kind Transfers: A 'Good Idea' Gone TooFar?" in R. Goldstein and S.M. Sachs (eds.),Applied Poverty Research. Totowa, NJ:Rowman and Allanheld, 1984, pp. 148-74.
(30) Summers, G.F., S.D. Evans, F. Clemente, E.M.Beck, and J. Minkoff. Industrial Invasion ofNonmetropolitan America, A Quarter Centuryof Experience. NY: Praeger Publishers, 1976.
(31) Thomas, G. Poverty in the NonmetropolitanSouth. Research Monograph, Univ. Georgia,Regional Institute for Social WelfareResearch, Nov. 1971.
(32) Till, T.E. "Industrialization and Poverty inSouthern Nonmetropolitan Labor Markets,"Growth and Change, Vol. 5, No. 1 (Jan.1974), pp. 18-24.
(33) U.S. Department of Commerce, Bureau of theCensus. 1980 Census of Population, Vol. 1:Characteristics of the Population, Chap. B:General Population Characteristics, Part 1:United States Summary, PC80-1-B1. May1983.
(34) 1980 Census of Population,Vol. 1: Characteristics of the Population,Chap. C: General Social and EconomicCharacteristics, Part 1: United States Sum-mary, PC80-1-C1. Dec. 1983.
(35) 1980 Census of Populationand Housing: Public Use Microdata SampleB, computer tape.
(36) 1980 Census of Populationand Housing: Public Use Microdata Samples,Technical Documentation. Feb. 1983.
(37) 1980 Census of Populationand Housing: Summary Tape File 3, com-puter tape.
(38) "The Social and EconomicStatus of the Black Population in the UnitedStates: An Historical View, 1790-1978," Cur-rent Population Reports. Special Studies,Series P-23, No. 80, 1979.
(39) War lick, J. "Participation of the Aged in SSI,"Journal of Human Resources, Vol. 17, No. 2(Spring 1982), pp. 236-60.
Appendix table 1-Poverty status of families by race and residence, 1980
Region and residence
U.S. families Black families White families
All Percentagepoor
All Percentagepoor
All Percentagepoor
Thousand Percent Thousand Percent Thousand Percent
U.S. total 59,190.1 9.6 6,105.7 26.5 50,644.9 7.0
Metro 43,918.9 8.7 5,006 8 24.7 36,840.1 6.0
Nonmetro 15,271.2 12.0 1,098.9 34.3 13,804.8 9.9
Northeast 12,731.6 8.7 1,136.8 25.3 11,167.7 6.2
Metro 10,788.7 8.8 1,118.8 25.3 9,258.1 5.9
Nonmetro 1,942.9 8.1 18.0 21 4 1,911.6 7.9
Midwest 15,424 5 8.0 1,234.9 24.6 13.921.1 6.3
Metro 10,817.6 7.5 1,189 2 24 6 9,409.4 5.1
Nonmetro 4,606.9 9.2 45.8 24.7 4,511.7 8.8
South 20,009.7 11.9 3,201 0 28.6 16,318.1 8.4
Metro 13,274.8 10.1 2,179.3 25.6 10,712.3 6.7
Nonmetro 6,734.9 15.5 1,021.7 35.1 5,605.9 11.7
West 11,024.3 8.5 533.0 20.3 9,237.9 6.7Metro 9,037.8 8.1 519.5 20.3 7,462.3 8.2Nonmetro 1,986.5 10.4 13.4 22.8 1,775.6 8.7
Source: (34).
26 3,

Appendix table 2-Persons by family status, nonmetro South, 1980
Family statusand relationshipto householder
Total population Blacks Whites
Number Percent Number Percent Number Percent
Total persons 25,005,370 100.0 4,632,117 100.0 19,867,549 100.0
In families 22,150,888 88 6 4,092,778 88 4 17,611,875 88.6Householder 6,710,942 26.8 1,013,372 21.9 5,590,449 28.1Spouse 5,616,141 22.5 619,901 13 4 4,901,970 24.7Child 8,444,015 33.8 1,894,882 40.9 6,339,920 31.9Other relative 1,379,790 5.5 564,623 12 2 779,536 3.9
Not in families 2,854,482 11.4 539,339 11.6 2,255,674 11.4Householder 1,874,528 7.5 311,992 6.7 1,538,300 7.7Nonrelative 360,374 1.4 85,096 1.8 262,694 1.3In group quarters 619,580 2.5 142,251 3.1 454,680 2.3Source: (33).
Appendix table 3-Families by source of Income, nonmetro South, 1979
Race and source of incomeFemale householder "Other" householder All familiesPoor Nonpoor Poor Nonpoor Poor Nonpoor Total
Thousand
Total black families 179.8 145.7 181.0 513.0 360.8 658.7 1,019.5
PercentWith income from:1Earnings, 57.5 89.8 65.1 93.9 61.3 93.0 81.8Interest, dividends, or rentals, 1.9 7.3 3.3 10.5 2.6 9.8 3.6Social Security 26.4 39.2 37.7 23.8 32.1 27.2 28.9Public assistance 55.2 33.2 29.9 13.3 42 5 17.7 26.5Other sources 18.0 27.2 16.1 22.4 17.0 23.5 21.2
Thousand
Total white families 139.1 362.9 529 3 4,568.2 668.4 4,931.1 5,599.5
PercentWith income from:1
Earnings, 55.3 85.5 63 0 89.9 61 4 89.6 86.2Interest, dividends, or rentalsz 5.5 30 2 12.2 37.4 10.8 36.9 33.8Social Security 28.0 45.7 35.0 24.1 33.5 25.7 26.6Public assistance 38.1 15 1 17.9 4.1 22.1 4.9 7.0Other sources 23.0 39.5 15.7 24.3 17 2 25.4 24.4'Categories are not mutually exclusive. Families may have income from multiple sources.,Includes families with net losses.Source: Computed from (35).
0 U.S. Government Printing Office 1986 490.918/40478 35 27