document resume he 016 019 - eric - education ... resume ed 226 693 v. he 016 019 author williams,...
TRANSCRIPT

DOCUMENT RESUME
ED 226 693
v.
HE 016 019
AUTHOR Williams, Melanie Reeves; Kent, LauraTITLE Blacks in Higher Education: Access, ChOice, and
Attainment.INSTITUTION Higher Education Research Inst., Int., Los Ahgeles,
Calif.8PONS AGENCY Foid Foundation, New York, N.Y.PUB DATE Jun 82NOTE 154p.; For related documents, see ED 214 457, HE 016
016 hnd HE 016 018.PUB TYPE Reports.- Research/Technical (143)
EDR$ PRICE MF01/PCO7 Plus Postage.DESCRIPTORS Acadepic Persstence; Access to Education; *Black
Students; Black Teachers; Career Choice; College -
Factilty; *College Students; *Enrollment Trends;Fellowshipsf Followup,Studies; Highee Education;*Majors (Students); *Outcomes of Education; *StudentCharacteristics; Teacher Attitudes; TeacherCharacteristics
ABSTRACTThe status of blacks in U.S. higher education was,
studied as part of an investigation of four disadvantagedminority/ethnic groups. Attention was directed to: rates ofeducational access and attainment and factors influencing educationaloutcomes; trends in choice of college majors and careers;representation in various fields; personal and environmental factorsaffecting educational attainment; perspectives'and employmentexperiences of blackprofessionals; and institutional andprogram-related factors affecting the progress of blacks.Additionally, a brief historical sketch of blacks in the UnitedStates is included, emphasizing changes in their educationalattainment and the influence of court litigation. Responses of thefederal 'government and the highex education community to the civilrights movement and developthent in 'the 1970s are also coveredFindings of a 9-year Cooperative Institutional Research Program studyof 1971 freshmen are presented, along with redults of surveys ofminority grOup academic personnel and Ford Foundation FellowS.Recommendations are offeeed concerning: precollegiate education,community colleges, support services, equal access, tinancial aid,gradilete and professional education, a'nd minority.facillty andadministrators. (SW)
***********************************************************************Reprodu'ctions supplied by EDR8 are the best that chn be made *-
from the orislipal document.***********************************************************************'
7/

5
.
4J
BLACKS IN HIGHER EDUCATfON
ACCESS, CHOICE, AND ATTAINMENT
Melanie,Reeves WiThams
and
Laura Kent
"PERMISSION TO REPRODUCE THISMATeRIAL HAS BEEN GRANTED BY
TO THE EDUCATIONAL RESOURCESINFORMATION CENTER (ERIC)::
U. DEPARTMENT OF EDUCATIONNATIONAL INSTITUTE OF EDUCATION
EDUqATIONAL RESOURCES INFORMATIONCENTER (ERIE)
e-c1 u rn n t has been reproduced asreceived from the person or organizationoriginating itMinor changes have been made to improvereproduction quality.
Points of view or opmions stated in this docu
ment do not necessarily represent official NIEposition or poky.
Higher Education.Research Instttute
Lbsi iAngeles, California
June 1982
a

CONTENTS
List of Tables
Acknowledgements
Chapter
1 Introduction 1
Value Premises, 2
Role of the Commission 3
'Context of the Study 5
Design of the §Ludy. 8
The Limit of Higher Education 11
Organization of the Report 12
Historidal Background 13
From 1870 to 1910 13
The Black Colleges 16
From 1910 to 1950 18
Court Cases: From Murray to Brown 22
3 Changes in Access and Attainment During the Sixties 3f
The Federal Response 32
The Response of Higher Education 39
Progress During the 1960s 42
.4 Charwes in Aceess and Attainment During the Seventies 50
Court Cases: Bakke and. Adak 52
Progress During the 1970s 58
Institutional Disteibution 7g
RepresentAion by Field r
87
Summary 94
)

r
Chaptercf.
5 Factors Influencing the Educational Development of Blacks
Student Inp.ut Factors 99
Environmental Factors 104
6
Summary 111
Experiences and Insights of Black Professionals
Survey of Minority, Acemic Personnel. 113
Siirvey of Ford Fellows 121
Summary 126'
Recomniendations
References 141

List of Tables
1. Black Institutions in,the U.S. Institutional Population, 1978. ,
2. Trends in Factors Related to Eligibility for College Attendance,1960-1970, by Raceand Sex .
3. Changes.in Educational Attainment of Persons 25 Years and Older,1960-1970, by Region and Sex
4, Changes in Collgge Enrollment Rates'of 18-24-Year-Old, 1960-1970,by Race and Sex
5. Changes in College Completion Rates of 25-29-Year-plds, 1960-1970,by Race and Se
,
6. Proportions of Hiih School Dropouts in the 14-25-Year-Old Black and.White Populations
7. Regional'Differences.in Black and White High School Completion Ratesand Median Years of Schooling, 1975
8. Proportions of Black and White High School Graduates Enrolled as Full-,
. Time College Students
9. Proportions of Blacks- and-Whites of-Different Age :Cohorts Who Hav,e
Attended College
10.. Proportions of 25-29-Year-Old Blacks and Whites Who Have CompletedAt Least Four Years of College
11. Regional Differences in'the Proportions of Two Age Cohorts of Blacksand. Whites With Atleast Four Years of College, 1975
12. Proportions of 25,-29-Year-Old Blacks and Whites Who Have AttendedGraduate or Professional School
13. .Black and White Participation in Graduate'Training
14. Black and White Repres'entation in Profe'ssional Schools
.15. Institutional Distribution of Blacks and'Whites, Fall 1978
16. Institutional Distrffition of Blacks, by Race of Institution, Fall 1978
17. Representation of Blacks in Eight' Major Fields at Different Levels'
18. Distribution of Blacks and Whites Among Eight Major Nelds at DifferentLevels
19. Baccalaureate Completion Rates of Blacks and Whites at Different Types ofInstitutions
20. Institutional Type and Quality Variables Affecting Persistence Among Blacks

ACKNOWLEDGEMENTS
f II
All the members of the Commission on the Higher Education of Minorities
I.
contributed to this report through their 'discussion of the issues generailf
and their specific criticisms and comments on earlier drafts.
We would like to express our appreciation to Stephen J.,Wright,
who guided our init01 data gathering efforts, helped us to decjde on
the basic outline of the report, read successive drafts of the manu-,
scrip;ts wifh care and'patience, and made thany valuable suggestions for
its improvement. His experience and wisdom were of immeasurable benefit.
Our thanks go also to Yvonne Brathwaite Burke who, as a member of the
subcommittee on Blacks, gave us many practiCal insights.ID
Our colleagues at the Higher Education Research Institute helped
in a variety of ways. Alexander W. Astia, study director, not only
oversaw our work but also.drafted the initial report on the results of
II.
the longitudinal analyses. Margo R. King supervised the preparation
of the manuscript; flarbara Kommel and Lisa Rentschler typed the final
report with skill and'forebearance.
Melairie Reeves Williams
Laura Kent ,
II
II
1,

(2
;
CHAPTER,1
. INTRODUCTION
L.
This reporfassesses the'status of Blacks in American'higher education-,
with special emphasis on.changes during the last two decades-Between 1960
and 1979, considerable progres's was made toward the societal 6oal of pro-
viding equal educational opportunity -Co all U.S. citizens, regardless-of
race/ethnicity, but that goal has not yet'been attained.
The factors that currently impede the educational progress of Blacks
are not identical to the barriers that existed in the sixties; they are much
more complex. Asan e5(ample, let us consider the black student's.access to
higher education, especially in the public secton. Until the mid-1960s, most
Blacks in the South had access to Only one type of institution--the Ulack
college. Choosing among different types of institution was notan issue. With
the development of community colleges and the desegregation of the, public
,.., white colleges in the South during the'1960s, aecess was broadened. By 1970,
Bladks were enrolled in all types of public co Teges, though they were substanti-..
1ally underrepresented in'the most'prestigious. Thus, the issue of access had
been redefined: from whether the black student attended college to where he or
she attended college. The question has become: How can Blacks achieve fair
representation in all types of colleges, in particular the most prestigious
tolleges which have-the resources to provide qualitatively different collegiate
preparation and experiences?
This*report is part of a larger pr'oject funded by the Ford Foundation and
conducted by the'Higher Education Research institute. The immediate impetus
for the project was the recognition th4 America's racial/ethnic minotities
C

-2-.
are grossly underrepresented n almost all occupational fields, that require a ,
college education. Given the nation's racial history prior to.the advent of
the civil rights movement in the 1950s, this underrepresentation'would give
less cause for concern if the various racial/ethnic minorities were adequately
represented among current participants in higher education. But they are not.
Minority groups continue to be underrepresented today in the system as a whole
and especially in those advanced fields that prepare students for positions of
leadershi0 and.status in American society.
The project fácusedon the recent progress, current status, and future
prospects of Blacks, Chicanos, Puerto R ans, and American Indian§ in higher
education. Although other,racial and ethnic minorities can also be viewed as
having unmet claims on U.S. higher education, these fourgroups were chosen
for.study because of their size, the gravity of-their economic and educational
disadvantagement, and their original experience of forced,incorporatiOn into
American society.
During the fall of 1978, when the project Was in the planning stage, HERI,4
and the Ford roundation joint1 y,se1pcted a national commi'ssion, structured to
,i1P4clude at least one member ofeach of the four minority groups studied, to
serve as advisory board and policy, arm for.the project. The commiss.ioners
were: O. Meredith Wilson (chair), Alexander W. Astin (study director), Frank
Bonilla, Cecilia Preciado Burciaga, Yvonne Brathwaite Burke, Albert E. Hastgrf,
Calvin B. T. Lee, Alfonso A. Ortiz, and Stephen J. Wright.
Value Premises
The commissioners brought to their task a set,of shared value premises,
believing that these premises'are widely held,among the four peoples who
Werethe'main concern otLthe project and that the principles they embody are

1.
-3-
-consistant with ideals of social equity that have an enduring appeal.for
people of 'all conditions-and nationalities. These value premises can be
stated as follows:
o Education is a vlue nd a night that is unequally distributedin U.S. society.
o Blacks, Chicanos, Puerto'Ricans, and American Indians are majorgroups with longstanding, unmef claims on U.S. education. These
claims concern not only the amount of schooling received, butalso its quality, scope, and content. ,
o Redressing inequality in higher education is not only anessential component of any significant effort to guarantee tothese groups full participation in U.S. society but also agoal worth pursuing in its own right.
o The attainment of full participation in higher education forthese groups may in the short run require that.financial andother resources be allocated in a manner governed more byconsiderations of the magnitude of existing inequality than byconsiderations of the proportions these groups represent in the
total U.S. population.
o U.S. society as a whole has practical and moral interests inthe achievement of this goal.
None of these premises, it, should be emphasized, assumes that any of .the
four groups need give up its cultural distinctiveness, languages, Dr values
11 in the process of gaining full accesS to higher education and full social and
1
economic participatioh in American life.
Role of The Commission
The commission on the Higher Education of Minoritie-, viewed its work as
comprising four major tasks:
I. To document, as extensively and as accurate'y as available
data permit, the current underrepresentation of Blacks, Chicanos,
Puerto Ricans, and American Indians in higher education, By
degree level and by field.

J. ,
Z. To assess:the educational progress of these four minority
groups during the past 10 to 15 years, by degree level'.and
by field;
3. To identify factors in the social and educational environment
that facilitate'or hinder the educational developtent of
minority students; and
4. To formulate retommendations for increasing the numbers of
minority students who enter and complete programs at both the
undergraduate and graduate Tevels and to disseminate these
recommendations to practitioners, policymaker, and the general
public.
The four functions of the commission were to advise the HERI staff on
proposed and completed studies, to give guidance in the interpretation of
"findings and the Formulation of recommendations, and to assist with the dis-
semination of both findings and recommendations tb policymakers, 'practifioners,
and the,general'Oublic. Subcommittees.composed of both commissioners and staff
members, were Formed to deal with specific issbes such as governmental programs,
the quality of the data used in the project, and minority women. A major out-
come of the commission's inyolvement in the project-was the decision to produce,
in addition Io-andverall. sutmary report on the entire project (Astin, 1982) and
a.briefer ddcument setting forth the recommendations'(Final Report of the
Commission oh the HiglIer Education of Mnorities, 1982), four separate reports
T (onle.aCh of the minority grouPs. It was felt that these "subrepOrts" would
. provide an opportunity to dfscuss in detail the history and pecial problems '
of each group', This report, then, focuses on Blacks in American higher education.
The full commission met eight times during th)e project period: on February
.25-26, 1979, June 1-2, 1979, and October 5-6, 1979, at Los Angeles; On January.
44,

6
12-13, 1980, at San Antonio; on March 21-22, 1980, in New York; on November
7-8, 1980 at Los Angeles; on April 10-12, 1981, at Ramona (California),; and
on July 19-21, 1981, again at Los Angeles. These meetings gave commissioners
and staff memoers an opportunity to debate and discuss the issues, to review
and revise the study design, to assess the quality of available data, to
suggest interpretations of empi,rical findings, and to draft recommendations.
At the San Antonio and New York meetings, which focused on the special problems
of Chicanos and Puerto Ricans, respectively, the commissioners met with local
people involved with programs targeied for these two groups. The April and
July meetings in 1981 were designed to review draft sections of the reports.
Context of the Study
When this project was initiated in late 1978, concern for the plight of
disadvantaged minorities--whith had its genesis inithe civil rights movement
of th'e 1950s and which had beenstrong in the,1960s and early 1970s was on the
4
wane. National attdntion was being absorbed instead by such issues as inflation,
unemployment, the energy crisis, and the defense budget. In addition, an increas-
ing numbee of socially,and economically disadvantaged groups, including the
elderly, women workers,.and the handicapped, had b'egun to assert their claims to"
equitable treatment', financial resources, and compensato6 services.
More recent developments on the'political scene have not been reassuring.
The Reagan Administration has made major cuts in the federal budget, the iMpact
of which will fall heavily on education and on minority oriented programs.
This mood shift flas been as apparent in higher educationias in other sectors
of American society. ,During the 1960s and early 1970s, partly as a result of
racial protests on,the campus and in the community, many cblleges and universitiu
accepted changes--open admissions, recruitment of minorities, establishment of
ethnic studies programs--that acknoWledged the unmet claims of minorities in the
1

1
United States and the inequitable treatment they had received,from the
educational system. However, concern over rising costs, along with the
fear that projected declines in the college-age population during the
1980s and 1990s wOuld severely erode institutional revenues, led to cost-
consciousness and calls for retrenchment. These newer programs, many of
, which had been initiated on an .experimental basis or upported by special
outside funding from foundations or the federal government, were especially
vunerable to funding reducations or to elimination. Adding to the budgetary
anxiety was apparent public skepticism about the value of higher education,
particularly its relative costs and benefits.
A recent report of the National Forum on Learning in the American
Future makes it cleat- that higher education has begun to subordinate
minority issues to other con6erns (Glover and Gross, 1979). Respondents
to this survey--including 1,556 "policy makers, educators, and scholars"
were asked to indicate the relative importance of a-number of issues
both as ftesent and-al future goals.. Although minority issues were
generally given high priority as present goals, they were rated very
low among future goals; this was especiaTly true for such matters as
promoting affirmative action for minority advancemept, recruiting and
training minority-group member's for managerial and profeWonal positions,
providing compensatdry educational opportunities to the disadvantaged,
and enabling bilingual minorities to study their own cultures and
languages..
If the current attitude of some educators toward mindrity issues is
obe of benign neglect or indifference, the attitudes expressed by some
litigants throughthe federal courts may be characterized as overtly
hostile. The U.S.

1
1
Suprel'e Court's Defunis 971) and Bakke (1S,73) cases, for example, reflect
a growing public view that higher education institutions have "gone too far"
in their attempts to accommodate the special needs of minorities. Similar
attitude changes are evidenced by increased resistance to court-ordered
- busing as d means of ending racial segregation in the public schools.1
The prevailing political climate regarding minority issuesis illustrated
in a recent column by British journalist Christopher Hitchens writing for
the predominantly American audience of The Nation (June 13, 1981):
The status of Black Americans seems hardly to be an
issue any more. A depressing series in The New York Times
reveals what a low priority the question has become, and
sees Blacks bracing themselves fbr a period of neglect
and isolation. I well remember, last autumn, during your
election campaign,,attending a liberal fund-raising party
in New York City. Moving around the glittering appartment,
I noticed two things: First, there were no Black guests.
Second, all those handing round drinks and canapes were
black. On a liberal occasion, it seemed to me that.you
could have one or the other, but not both, of those
phenomena. I asked the host about it. He looked puzzled
for a moment and then said, "(Oh, that. Out of style."
1 For a more detailed discussion of changing public attitudes toward minorities
especially Blacks, see Chapter 4 and Jones (1977) and,Gill (1980).
1

1
I.
-8--
Design of the Study
To provide an empirical basis for policy recommendations, the study
concentrated on two main areas: first, a description of the current and
recent situation of the four minority groups with respect to their rates of
educational access and attainment; and second, an analysisof the factors
that influence the access and attainment of these minority groups. These
research activities were approached by means of a series of analyses of the
empirical data. While considerable use was made of existing data sources, a
substantial amount of new data was also collected.
In the course of the study, the cOmmission added a third major area of
activity--an analysis of controversial issues relating to the higher education
of minorities--which was addressed through a number of essays drawing on the
literature and, in somelltstances, upon relevamt data. The overall summary
rep.ort on this project (Astin-, 1982) includes two chapters on these
issues: Equal Access and Equal Opportunity (Chapttr 7) and Stan-
darized Testing and the Meritocracy (Chapfer 8).
Data Sources
,Empirical studies performed by the commission staff involved the use
of several resources, including data from public documents; unpublished data
from outside agencies; and data collected especially for the project and, in'
most cases, involving questionnaire surveys. Data pertaining to the educational
access and attainment of minorities were obtained from several public and
private sources, including the U.S. Bureau of the Census, the Commission on
Civil Rights, ihe Office for Civil Rights, the National Center for EduCation
Statistics, the National Science Foundation, the National Academy of Sciences

-9-v
II (National Research Council), the College Entrance Examination Board
IF(Educational Testing Service), the American College Testing Program, and
the'Cooperative Institutional Research Program of the American Council on
Education and t6.e University of California, Los Angeles. These data
provided the principal basis For the commission's analysis of the educational ,
pipeline for minorities (from the high school years through completion of
advanced training), the representation of minorities in different fields,
and recent trends in minority representation both by level dnd by field.
HI
11
I.
had, also entered college in 1971.
11
academic personnel.working in the same ins,titutions attended by the 1971
°sample'and a survey designed to tap the experiences arid perceptions of minority
educators.
Factors,Anfluencing the educationa development of minority students
were assessed primarily through longitudinal data from the Cooperative'
InstitutiOnal Research Program. The principal source for these analyses was
a nine-year follow-up of 1971 entering freshmen, conducted especially for
this project during the spring of 1980. In.order to obtain an accurate
picture of the persistence rates of minorities during this nine-year inter/FA,
a number of follow-up procedures were used to improve response rates.
Another source bf student data involved a gational sample of minority
studen-0 who had received graduate fellowships for doctoral study from the
Ford FoundAtion between 1969 and 1976. To estimate the impact of this fellow-.
ship award itself, a "natural experiment" was conducted whereby the same
follow-up questionnaire sent to the 1971 freshmen was sent to all For Fellows
who began their undergraduate studies in 1971 and to a control group of
applicants for the Ford graduate awards who had not received the award and who
Data on faculty and staff were also collected via a' national survey of

These data on students and faculty were supplemented by additional
data on the institutions' finances, enrollments, physical plants, and
admissions policies, and other environmental information obtained from
public and,private sources.
Data Analyses
.Descriptive studies of the educational access and attainment of
midority undergraduates were obtained from published' tabulations of several'
of the data sources described above as well as through special tabulations of
these same data sources conducted by the project staff: Analyses of factors
influencing minority students educational development generally Involved
a two-stage procedure. In the first stage, an attempt was made to adjust for
the fact that students entering different types of institutions and different
types of programs frequently have dissimilar entering characteristiCs. Thus
in the first ftage an attempt was made to control statistically for initial
differences in entering student characteristics such as demographic factors
(sex, race and ethnicity, age), socioeconomit background (parental education,
income, and occupation), high school activities and achievements, plans and
aspirations, and values and attitudes. Once these characteristics had been
controlled, the second stage in the analysis was performed to estimate the
impact of institutional type, financial aid, and other college environmental
factors.
Limitations of the Data
It should be emphasized that conclusions based on the commission's
analyses of empirical data'must be tempered with the recognition, that most
of the data sources suffeF.pd in varying degrees from technical limitations.

Among the most frequently encountered types of limitations were inadequate
racial and ethnic definitions, small sample sizes, nonrepre.;entativeness,
and low survey response rates. The best data currently available pehain to
black students, whereas the most serious deficiencies occur in data on Puerto
Ricans and American Indians:
The Limits of Higher Education
Higher education was' chosen as the focus of this study because the
Ford Foundation and the persons associated with the project believe that it
contributeswto the social and economic well-being of individuals' and to the
political resources and strength of groups within U.S. society. Blacks,
Chicanos, Puerto Ricansi, and American Indians all suffer from powerlessness',
and higher educatibn is clearly one of the main routes whereby individuals
can attain positions of economic and political power. Further, the quality of
life fn general can be improved through higher education, which expands
employment options and contributes to greater'geographic mobility% Finally,
higher education can enrich leis'ure by expcising the individual to a wi,de
range of experiences in the arts, music, literature, history, science,z and
technology.
But higher education is by no means a panacea for all the problems
that confront disadvantaged minorities in the United States. Vestiges of
prejudice may persist in the minds of many Americans for years to come, no
matter how many minority students complete higher education programs. Perhaps
more significant is the fact that many of the educational problems facing these
groups occur prior to higher education, at the elementary and secondary levels.
Indeed, the results of this study dramatize the need for a much more concerted
national effort to up'grade the quality of elementary and secondary education

1
1
1
for minorities. Although it is true that 'higher education can play .
* / .,
some role in,this process through the selection and training of administrators
and teachers in the lower sctiools, many of the problems of minorit education
are probably beyond the control of Kigher education. While the commission
believes that this reality does not relieve the higher education system of
.the responsibility for doing the best job possible with those minority students0
who manage to enter academic institutions, it also recogni2es that solving
the prol5lems of precollegiate education for minorities will require the sus-,
tained efforts of feaeral, state, and local governments.
Organization of the Report
Tfie next chapter of this report gives a brief historical sketch of
Blacks in the United States, emphasizing changes in their educational attain-
ment, especially as.those changes are related to a series of legal decisions
from Plessy v. Ferguson (1896) to Brown v. Board of Education (1954). Chapters
3 and 4 detail the educafional progress of Blacks over the last two decades:
Chapter 3, covering the 1970s, also discusses the:responses of the federal
government and the higher education community to black demands as embodied in
the civil rights movement; Chapter 4 documents the reaction that set in during
the 1970s. The next two chapters present empirical findings from this study of
the status of minorities in higher education: rn Chapter 5, the personal and
environmental factors related to the educational attainment and development of
Blacks are discussed; Chapter 6 deals with the perceptions and experiences of
black professionals. The final chapter sets forth the recommendations formulated
by the commission.
-12-ri
for minorities. Although it is true that higher educat'ion can play
some role in this process through the selection and training of administrators
and teachers in the lower schools, many of the problems of thinority education
are probably beiond the.control of higher education. While the commission
believes that this reality.does not relieve phe higher education system of
the responsibility for doing the best job posSible with those minority students
,who manage to enter academic institutions, it also recognizes that solving
the problems of precollegiate education for minoritieswill require the sus-
talned efforts of federal, state, and local governments.
Organization of the Report
The next chapter of this report gives a brief historical skeich of
Bjacks in the United States, emphasizing changes in their educational attain- f(
ment, especially as fhose changes are related to a series of legal-decisions
from PTessy v. Ferguson (1896).to Brown v. Board of Education (1954). Chapters
3 and 4 detail the educational progress of Blacks over the last two decades:
Chapter 3, covering the 1970s, also discusses the responses of the federal
government apd the higher education community to black:demands as embodied in
the civil rights movement; Chapter 4 documents the reaction that set in during
the 1970s. The next two chapters pnesent empirical findings from this study of
the status of minorities in higher education: In Chapter 5, the personal and
6nvironmental factors related to 'the educational attainment and develo,unt of
Placks are discussed; Chapter 6 deals with the perceptions and experiences of
'black professionals. The final chapter sets forth the recommendationsformulated
by the commission.
40.

I.CHAPTER 2
HISTORIGAL BACKGROUND
IC
This chapter sketches the historical background of Blacks in the
11°
I.
I.
I.
United States from the period immediately iollowing the Civil War to the'middle
of the twentieth century, wiih special reference to changes in educational
attainment.' Particular attention is given to the development of the black
colleges and to the major court cases affecting the educational access of
Blacks.
From 1870 to 1910
In 1870, Blacks constituted 13 percent of the U.S. population. Nine in
ten :lived in the South, with the remainder divided between the Northeast (4 ,
percent) and the North. Central regions (6 percent). There were approximately
96 black men for every 100 black women.
Of the 5-19-year-old population, 31 percent of Blacks ( compared with 49
percent of Whites) in the South'and 48 percent of Blacks (compared 4ith 61
percent of Whites) in other regions were enrolled in school in 181.90. Two
factors account for the lower rates of school attendance in the South: its
history of opposition to providing education for Blacks, and the lack of public
schools'in its rural areas. (In 1890, nearly four in five Blacks lived in
rural rather than urban areas.) The fact that as many as one-third of all
school-age Bla.cks in the nation were attending school is surprising. Nonetheless,
their need for education was still great; in 1890, 61 percent of Blacks age 15
J7-The historical account given here is, of necessity, brief. The interested
reader is referred to the voluminous literature that exists on Blacks in the
U.S.; e.g., Franklin (1978); Kluger (1976); Myr:dal (1944); and Woodward(1974).

-
vand older were illiterate (Bureau of Census, ;978).2
Prior to the Civil War, educatioa in the South was available only
to the children of wealthy Whites; indeed, it was illegal to educate slaves.
Missionaries from variou; religious and philanthropic organizations (e.g.,
the American Missionary Society, the Baptist and Methodist churches), following
the Union Army as it moved south, established schAls for the newly freed Black's.
In the years immediately after the war, the Freedman's Bureau--the federal
agency responsible for overseeing the resettlement of both black and white re-,
6
fugees and for dealing with the numerous problems that confronted former slaves
--opened more than 4,000 schools throughout the South, and people flocked to
them to learn basic literary skills.
From the beginning, the public schools in the South were segregated by
state 'law, reinforced by local sanctions. The legal precedent that rationalized
segregation as a way of life was the Supreme Court's decision in Plessy V.
Ferguson (163 U.S. 537) in 1896, which upheld a Louisiana statute requiring
separate cars for white and black passengers on railway trains. The plantiff,
Homer A. Plessy, argued tbat the statute deprived him of his constitutional
rights as guaranteed by the Fourteenth Amendment. The Supreme Court disagreed;
states could mandate separate facilities as long as they were equal. The
majority opinion, written by Justice Henry Billings Brown (with six other justices
concurring, one dissenting, and one not participating in the case), maintained
that the Louisiana law was reasonable because the legiSlature ha'd acted "with
reference to ,established usage, customs and traditions of the people, and with
a view to the promotion of their comfort, and the preservation of the public
2Estimates of illiteracy are derived from decennial census data. Between
1870 and 1930, a person was considered illiterate if he/she has completed lesthan-six years of schooling and can neither read nor write.

-15-
peace and good order0 (quoted in Kluger, .1976, p. 79). Justice Brown further
commented that "enforced separation" did nOt stigmatize Blacks except to the
extent that "the'colored race chooses to put t at conStrvction upon it" (quoted
in Kluger,"1976, p. 80)L., This rulihg established the 4eparate but equal"
doctrine, which was thereafter used to justify"segreppon not only in public
transportation but in all types of public facilities and institutions.
Two other Supreme Court decisions are relevant here. In the Slaughter-
house Cases (16 Wallace 36, 1879), the Court suggested-that citizenship is
dual--in the United states and_in the state of residence--and implied that
state laws 'could take precedence over the Constitution, particularly with re-
spect to defining and prOtecting the citizen's civil rights. In Cumming v.
Richmond County Board of Education (1975 U.S. 528, 1899), the Court ruled that.
the states had full authority to provide public education as they saw fit.
Considered singly or together, these declisions did nue bode well for Blacks:
Just as they had gained access to education, the Supreme Court was giving
its stamp of approval to segregation.
Subsequent to these decisions came the proliferation of Jim Crow laws
and the end to integration in such settings as barber shops, baseball wks,
11
auditoriums, circuses, and pool halls. To cite a few examples: In 19U,
Georgia established segregated parks; in 1910, restricted neighborhoods were
established in Baltimore.. And throughout the South, separate but far-from-,
equal school systems developed.
So pervasive was the beltef that segregkion was necesSary to maintain
"peaceful" relationships between Blacks and Whites that even voluntary inter- .
racial contact was outlawed, as the Berea College v. Kentucky (211 U.S. 45,
1908) case demonstrates. Berea College, a small religious institution fhlose
student body had been integrated since .C.fis inception in 1859, was the target of

,
a Kent4cky law requiring that any institution serving both Whiie and B]acks
teach them at different times and in different places. Both the Kentucky
Supreme Court and the United States Supreme Court upheldsthe law
11
The importance of these developments cannotbe overestimated; they
reflected the dominant mood in most of the'country until the civi14ights
movement began to-gain Momentum in the late 1950s.
11 4The Black Colleges
II ,
The first collegiate institutions'designed specifically to egcate Blacks'1P
appeared in the North prior to the Civil War, chiefl as a product df the
'IIAbolition Movement. They included Ashmun Institute (which later-became
.
.
1 G
Lincoln Univcrsity)', in Pennsylvania, founded by the'Oresbyterian Church;
II
c
Wilberforce University, in Ohio, founded by the Methodist Chtirch; and the
Institute for Colored Youth (which underwent several name changes, ending .
up as Cheyney%State College), in Pennsylvania, founded by the Quaker (Louis,
., .
li1978). The great majority of private black colleges were es1ablished by
,
church-related organizations between 1865.and 1890. MOst of the public
I.
institutions for Blacks were established as a result of the second Morrill
II
Act of 1890 (Bowles and DeCosta, 1971)..,
At firs.t, these institutions offered little more than secondary-level
IIwork, because of the basic educational needs of Blacks. According to a
__..,
surve) conducted in 1916, fewer than 3 percent of all students in black
IIcollegesmere taking college-level work. 'By the 1926-27 academic year, the
1figure had risen to 32 percent, and five years :later, it had nearly, doubled
(63 percent) (Holmes, 1934).
IIBlack colleges were established in the South at a time when segregation
.
was inevitable. Louis (1978) describes the situation as follows:
II .
.

C-
6
With the hardening of race relations into a legal caste
system in the half-century following the combined impacts
of the second.Morrill Act, the Depression of the 1890s,
and the Disenfranchisement campaigns of 1890 to 1907 in all
these states /ie., southern and border states/, there was
no prospect of Black.entry into the white institutions of.
the'South and little prospedt, f more than legal minimal
support from the state governments. With 90 percent of
the American Black population continuing to be resident in
the South 'until World War I, these institutions--public and
private--became the'only means of higher education for the
vast majority of Black AmericanS. (p. xxiii).
Thus, these colleges were important symbolically and practically. Symbolically,
they both emlabi.ied and advocated the value of education as a means for black
people to improve their socioeconomic status. Practically, they trained
teachers and other professionals to serve the black community. (Not until the
middle of the twentieth century were large numbers of black professionals able
to work outside the black community.) The private institutions emphasized
teacher training, whereas-the land-grant colleges emphasized agricultural and
industrial curricula, although some of the most noted private colleges (e.g.,
Hampton Institute in Virginia, Tuskegee Institute in Alabama) also had a
strong vocational orientation (Louis, 1978).
As Table 1 shows, in the.fall of 1978, there were 100 historically black
colleges (HBCs) operating in the United States; they, constituted about 3 per-
cent of the total institutional population of 3,173 (National Advisory Com-
mittee, 1980). In this group of HBCs, private institutions outnumbered public
institutions by about three to two. Forty-eight of the 61 private institutions

I.
-18-
(79 percent) were affiliated with religious organizations. All but three
were coeducational. (The three expections are Morehouse College for men
and Spelman College for women, both in Georgia, and Bennett College for
women, in North,Carolina.) The majority of HBCs (82) were four-year colleges,
16 were two-year colleges, and only two were universities. However, one-third
offered graduate degrees. Two of the HBCs were located in the Northeast
region, two were located in the North Central region, and the remaining
96 were located in the South.
In addition to the historically black colleges, the National Advisory
Committee on Black Higher Education and Black Colleges and Universities
(NACBHEBCU) identifies 60 institutions as new predominantly black colleges
(NPBCs), defined as institutions where blacks accounted for more than half
of both the total enrollment and the full-time enrollment in fall 1978.
Most of the IPBCs were located in urban centers: Eleven were in the North-
east region (chiefly the New York City area); twenty, in the North Central
reg{on (especially Chicago, Detroit, St. Louis, and Kansas City); twenty-three,
in the South; two, in the District of Columbia; three, in California; and one,
in the Virgin Islands. Slightly over half of the NPBCs (31 institutions) were
public, and three-fourths (46 institutions) were two-year colleges.
From 1910 to 1950
According to the U.S. Bureau of the Census (1978), Blacks constituted
11 percent of the total U.S3 population in 1910. As in earlier decades, the
vast majority--89 percent--lived in the South.
Illiteracy among Blacks was cut by about half between 1890 and 1910:
from 61 pencent to 33 percent of the 14-years-and-older population. Whereas
in f390, illiteracy had been more common among black men, in 1910 about equal
proportions of black men and women were illiterate. Younger Blacks were more

.1
1
-19-
likely to be literate than older Blacks, suggesting that black children
were taking advantage of the new educational opportunities available to
them. This implication is confirmed by the fact that school enrollments
among 5-to-9-year-old Blacks increased by about two-thirds over the 20-year
span.
Regional differences were pronounced; In 1910, 36 percent of, Blacks
in the South, compared with 11 percent of Blacks in Other regions of the
country, were illiterate. The comparable figures for Whites were 8 percent
in the South and 5 percent in other regions. Similarly, only 44 percent of
school-age Blacks in the South, compared with 57 percent of those in other
regions, were attending school in 1910. Among school-age Whites, 58 per-
cent in the South and 63 percent of those in other regions were enrolled in
school. Clearly, then, Blacks had greater educational oppprtunities outside
the South, though they were still disadvantaged relative to Whites in other
regions.
Between 1910 and 1930, the regional distribution of Blacks began to
shift as Blacks left the South for other parts of the country, chiefly the
Northeast and No,--th Central regions (Bureau of the Census, 1979). The first
large migration of Blacks from the South had taken place during the 1890s, but
the out-migrations of the 1910s and 1930s were much larger. letween 1910 and
1920, approximat.ely 454,000 Blacks moved from the South, an almost-threefold
increase over the figure of 170,000 for the first decade of the century.
From 1920 to 1930, net migration increased one and a half times again, to
749,000.
Foremost among the factors that gave impetus to these population shifts
among Blacks was the availability of employment in the industries of the
North, particularly at the beginning of World War I. Immigration from Europe

1
(1
-20-
ft
had slowed doft, and workers were needed to, fill the factory jobs that had
previously been taken by.those Euftpean immigrants. At the same time, agri-
culture was stagnating in the South, and industry developed slowly. Blacks
were also pushed out of the South by the severe and blatant discrimination
they experienced there.
Net migration drQpped during. the depression of the 1930s, but the
declinemas only temporary. In the 1940s, as industry was revitalized under
the impact of World War'II, black migration from the South increased once
more and continued at a high rate during the 1950s and 1960s, with some
'Blacks settling in the West. Moreover, those Blacks who remained in the
South were moving froRthe rural areas to the cities. Thus, the black
population in the U.S. underwent another kind of redistribution: In 1910,
approximately three in four Blacks lived in rural areas; in 1940, the-figure
had dropped to 51 percent. In.1960, only three in five Blacks lived in the
South, and only three in ten lived in rural areas (Bureau of the Census, 1979)
Further progress was made in reducing illiteracy. The ,proportion of
illiterates in the black population (age 14.and older) dropped from 33 percent
in 1910 to 18 percent in 1930. Regional differences Persisted, however. In
1930, slacks in the South were more than four times as likely-as those in
dther regions to be illiterate (22 percent versus 5 percent). Indeed, the
illiteracy-rate among Blacks living outside the South was only slightly higher
Lhan the overall illitercy rate for Whites (3 percent). By 1947, the il-
literacy rate among Blacks nationwide had declined-to'11 percent, and in 1959 it
stood at 4 percent.
Concomitant with the drop in illiteracy was an increase in school at-
tendance among Blacks, attributable chiefly to the enactment of compulsory
school attendance laws in most states. The Proportion of 5-20-year-old Blacks =

enrolled in school rose from 45 percent in 1910 to 65 percent in 19p, an
increase of 20 percentage points. The comparable figures for Whites in
thattage range were 61 percent in 1910 and 72 percent in 1940, an increase
of only 11 percentage points over the 30-year period. Even in 1940, however,
Whites were generally more likely to be enrolled in school than were Blacks,
and these racial differences in school attendance were more marked among
boys than among girls, among those living in the South than among those'
living in other-xegions, and among 15-20-year-olds than among younger people.
Although these increases in school,attendance among Blacks were impressive,
many Blacks stilj lacked the basic credential nted to get a decent job and
thus to improve their socioeconomic status: a high school diploma. In 1940,
only one in ten Blacks betweefi the ages of 25 and 34 had completed four years
of high school; the comparable figure:for Whites was-40 percent., Thus, BTatB
lagged behind Whites.by about 30 percentage points. These differences in high
school completion rates may partially reflect prior'discrepancies in enroll-
ment; if such is the caSe, then the gap between the races should have narrowed
after 1940; .In actualifty, howeljer, as late as 1970, the high school-,completion
rate for Bladks was."52 percent, whereas that for Whites was 74 percent, a
difference of 22 percentage:points. Thus, the gap had narrowed.only slightly
(Bureau of the Census; 1979).
J. in summary, as Blacks gained greater access to public elementary and. ,
secondary schooPing, illiteraCyyates dropped and high school completion rates
'rose. Blacks made steady progress between 1910 and 1950 in attaining formal
education; nonetheless, they still had a long way to go to achieve parity
with the white majority. The public'school systems in southern states were
strictlY segregated, with black sChools far from equal towhite schools. The
black sChools operated with much lower budgets; their facilities were usually

1
-22-
old, cramped, arid in disrepair; their curricula were limited; and black
teachers were paid far less than white teachers. 'At the postsecondary
level, the majority of Blacks had no choice but to attend a black institutio
which was likely to be inferior'in mdst respects to a whii'e institution.
One of the greatest obstacles to progress was widespread social suppOrt
of discriminatory practices. Laws in individual states condoned--fildeedi
mandated--segregation in virtuallY all areas of life. Most of the Supreme
'Court's decisions during this period sanctioned suCh practices, as dicithe
attitudes and behavior,of both the executive andlegislative branchesof the
federal government. Virtually no one who occupied a positibn of power on
the natiOneNscene was interesi"ed in changing the status quo or in working to
end racist prattices. However, starting-in the Mid-1930s, a series of judicial'CL
decisions gradually helped to change the situation.c.) .
. A
COurt Cases: From Murray to Brown
Inequality in education was challenged in a number of-'-lawsuits instigated
by the Legal Defense Fund Of.the NAACP. Ultimately,,the issue_went beyond
the inequanty of segregation, to its basic injustice. Most of these cases
involved Blacks' right of access to white public colleges: If such a right could
be established, then Blacks would have a choice among colleges rather'than being
limited to black institutions (Kluger, 1976).34
. The first case, known as Murray v. Maryland (169 Md. 478, 1937), involved
Donald Murray, a black Baltimore resident and igraduate 'of Amherst, who applied
for admission to the law school at,the Univers'ity of Maryland. (Neither of the
black pbstsecondary institutions 4n the state--the public Princess Ame Academy
3Kluger, in Simple Justice (1976) provides a detailed and informative accountof-the legal cases up to and:including the Brown decision.

-23-4
.1/
or the private Morgan College--had a law school.) He was rejrcite-d on the
grounds of race, with the suggestion_that he apply for an out-of-state
s'cholarship. His attorneys pointed out that, although the state of Ma6land
had auihorized a program of out-of-state scholarships for Blacks, the
program had not been funded at the time Murray applied to the University;
moreover, since Murray planned to practice law in Maryland, studying law
at an out-of-state institution would hardly answer his needs. The case
was first argued in Baltimore City Court, where the judge-decided.in
favoroof the plantiff and ordered the University of Maryland to admit
Murray to its law school. jhis decision mas subsequently upheld by
the Maryland COurt of Appeals, which ruled: "Compliance with the
Constitution cannot be deferred at the will of the state. Whatever
systdm is adopted for legal education now must furnish,equality of
treatment noW" (quoted by Kluger, 1976, p. 193). This victory StimUlated
much interest and some hOpe among Blacks. But the ruling fell far short
of establishing a legal precedent for a similar argument in other cjr-
cumstances. Maryland was a border state, and discrimination was not
as severe there as in the Deep South.0
The circumstanCes precipitating the second case, Missouri ex rel. Gaines
v. Canada (305 U.S. 337, 1938) were similar: Lloyd Gaines, a graduate of
. Lincoln University in Missouri.(a state-supported black institution which
did not have a law tchool) was denied admission on the ground of race when
he applied to law school at the all-white University of Missouri. Two
features distinguished Gaines from Murray:
4Missouri, unlike Maryland, said it had every intention of main-
. ,
taining Lincoln university as a...first-rate school on a par with

p.
1
i.
-24-
the white university . . If [Blacks] wanted a law school,
then the state would.provide them with a law school, but
there was no point building one if.no colored applicants
showed any interest. Let Gaines apply to Lincoln, and
wheels would begin to turning. The out-of-state subsidy,
furthermore, was a bona fide offer--not an.empty vessel as
the schorarship program had been in'Maryland when Murray4
was applying to the law school there--and if Gaines choe
not to Wait until Lincoln could meet his needs, the state
would pay the extra tuition charge, if any. The state said
nothing, of course, about paying Gaines's extra traveling
erid living ,expenses that would be necessitated by hiS
attending an out=of-state law school:
(Kluger, 1976, p. 202)
The Supreme Court, in a six-to-two decision, ruled in Gaines's favor:
Missouri was required to provide education equally for Blacks:and Whites
within the state; out-of-state opportunities were irrelevant. Moreover,
Gaines could 'not be expected to wait'until a law school for Blacks was,
established at Lincoln University; the ?temporary character" of discrimination.
did not excuse it. Therefore, Gaines was- to be admitted to the law school at
, the University of Missouri.
The Gaines decision seemed at first to be a major victory in the fight
against segregation, establishing that:
. 1. If an educational program is provided for Whites within a State,
then a similer program must also be provided withfn the state for
any black applicants. Otherwise, black applicants.must-be admitted
, to the white program.

I.
1
1
-25-
2. If the state chooses to provide a separate program for Blacks
rather than to admit them.2to the white program, then that
program must be proVided.in a timely manner," in response to
interest expressed by Blacks.
Obviously, the fess expensive alternative, from the state's point of view,
would be to admit Blacks to the white program. Nonetheless, one outcome of
the Gaines decision was the introduction of graduate and professional programs
at several black institutions. The deeply engrained racism of 'some Southern
states is manifested in the extreme measures they took to maintain segregation.
A case in point is Sipuê1 v. Oklahoma Board'of Regents (332 U.S. 631,
1948), which constituted a setback for the NAACP's Legal Defense Fund. Ada
Sipuel, a black graduate of the State Col)ege for Negroes in Oklahoma, was
denied zdriii:ssion to the University of Oklahoma's law school. .Cognizant of
the Gaines decision, the state offered to establish 4 separate law school
for Blacks when sufficient numbers of them showed an interest in attending
law school, and the Oklahoma Supreme Court found this offer acceptable; but
the United State Supreme Court ruled that the-state would have to prOvide legal
education for Blaas immediately. The state then set up a mockery Of a 16w
school in a.roped-off section'of the state capi University students and
faculty protested against this travesty, and the Legal.Defense Fund, spearheaded
by Thurgood Marshall, carried the case back to the U.S.'Supreme Court, arguing
that this 'segregated "law school" marked Blacks as inferior by excluding them
from the norlual process of obtaining a legal education. The Court, however,
rejected this argument, holding that the state's provis.icon of legal education
for the plaintiff was all th"at mattered. The quality of the separate program
was not even taken into consideration.

I.
-26-
InJ950, the Sppreme Court handed'down three decisions which broke new
ground and which partially compensateefor the defeat in Sipuel. Sweatt
v. Painter (339 U.S. 629, 1950) addressed the question of the quality of the
educational programs offered to Blacks. Sweatt, a Texas mail carrier, was
rejected when he applied to law school at the University of. Texas at 'Austin.
The District Court of Travis CountY gave the state six months to establish
a.law school at Prairie State University, a black institution; an alternative
was to admit Sweatt to the University of Texas' law school. In response to
this ruling, the state firsto"rented a few rooms in Houston, about forty miles
southeast of the Prairie View campus, hired two Negro lawyers to serve as its
faculty, mid called the arrangement the Prairie View law school' (Kluger,
1976,' p. 261). .A short while later, the state legislature appropriated funds
to build a new law schoo) for Black's in Austin: "It consisted of fhree smaliish5
basement rooms, three paci-time faculty meMbers who were first-yeae instrUctors
at the Texas law school the rest of the time, and a library of 10,000 books
plus access to the state law library in the capitol (Kluger, 1976, p. 251).
At a second trial before the Travis County court, the Legal Defense Fund argued
that these separatefacilities were vastly inferior to those available to
white law students. When the District Court ruled .against Sweatt and the
Legal Defuse League, they Carried the case lo the United States Supreme Court,
which reversed the 'ruling of the lower courts, finding that because the new law
school for Blacks lacked such qualities as am experienced faculty, influential
alumni, and a reputation in the community, it did not offer Blacks a law
education equivalent to the one offered to WhITes.. The Court declined, however,
to address the broadex question of the "separate but equal" doctrine or to
consider the social and psychological effects of segregation, as the Fund bad
requested.

1
-27-
At the same time, the U.S. Supreme Court ruled on another case concerning
access for Blacks, McLaurin v. Oklahoma State Regents fOr'Higher Education
(339 U.S. 637, 1950). McLaurin was a 68-year-old black professor.who, under
order of the federal District Court, had been admitted to ihe graduate school
of the University.of Oklahoma. However, "in accordance with the legislature's
hurry-up revision of the state laws, all such instruction of colored students
was to be given 'on a segregated basis' within the university (Kluger, 1976,
p. 268). Thus, McLaurin had to sit by himself in the classroom, in the library,
and in the cafeteria. The District Court found this arrangement perfectly
acceptable, but the U.S. Supreme Court agreed with the Legal Defense Fund. In
a unanimous decision, the Court stated the. "the restrictions placed upon
/McLaurin_j were such that he had been handicapped in his pursuit of effective
,graduate instruction. Such restrictions impir arid.inhibit his ability to study,
to engage in discussion and exchange views with other students, and in general,
to learn his profession" (quoted in Kluger, 1976, p. 283). The court made in
a similar ruling in a third case, Henderson v. United States (339 U,S. 816,
1950), involving separate dinilig tables for black passengers on trains. In
these three cases, then,
the Court had asserted 'that separate-but-equal education was
not a mere sldgan. The equality had to be real or the
separation was constitutionally intolerable. That was what
Sweatt had accomplished. And if separate facilities were
not provided, no individual. or group might suffer restriction
or harassments within the biracial school. That was what
McLaurin did. And .Henderson ex:tended McLaurin to interstate
transportation. (Kluger, 1976, p. 284)

-28-
In none of thAe cases, however, did the Court regtard the restrictions as
segregatiori., therefore, it did not reconsider the validity of the "separate-
but-equal" doctrine.
Since the Plessy decision in 1896, the Court had come a long way from
enunciation of the doctrine to consideration of specific instances in which .
`1.
the practice did not follow thedoctrine. From here, the next steps for
those concerned with the rights of Blacks were to continUe to expose the
obvious inequities n,separate facilities (e.g., physical plant, teachers'
salaries, curri.culum, materials, transportation) and then to butld a case
showing the less obvious but more pernicious effects of those inequities on
the ps.ycholdgical development of black children. The goal was to co pel tife
U.S. Supreme Court to question the legality of segregat:ion in light of the
rights guaranteed to all American citizens by the Fourteenth Amendment.
In.the wake of these suits against public white,colleges came a series
of suits against segregated sthool ,districts. The Supreme Court agreed to
hear five such cases at the same time, and its decision on these cases became
known by the,name of the first case, Brown v. Board .of Education of Topeka
(347 U.S. 483), The cases directly challenged the legality of segregation.
The Legal Defense Fund argued that the full benefits of education can only be
realized when black and white students attend school together. (The Court
had alluded to this very point in Sweatt.) The Court agreed. The unanimous
opinion was delivered by Chief Justice Earl Warren on May 17, 1954:
Does segregation of children in public schools solely on 12)
the basis of race, even though the physical facilities and
other "tangible" factors may be equal, deprfve th'e children
of the minority group of equal education opportunities? We
believe that it does.

-29-
. . . To separate /childrenj from others of similar
age and qualifications solely because of their race
generates -a felling of inferiority as to their status
in the community that may affect thein hearts and minds
in a way unlikely ever to be undone. .
We conclude that in-the field of public education
the doctrine of "Separate but equal" has no place.
Separate educational facilities are inherently unequal.
(Quoted in Kluger, 1976, pp. 781-82)
The Supreme Court realanded the cases to the respective district courts, which
were instructed to oversee plans for desegregating the public school systems
named in the suits. The plans were to be implemented "with all deliberate
. speed." The Brown decision represented a monumental victory for Blacks tn
their right for equal educational opportunities.
To summarize: Blacks were greatly facilitated in their pursuit of equal
educational opportunity by a nOmber of court decisions beginning with Murray
and ending with Brown. These decisions laid the legal foundation from which
Blacks were able to.challenge the entrenched system of segregation in the
public schools and colleges. More important, they signaled and stimulated a
shift in national priorities, frOm tacit acceptance of segregation to active
pursuit of equal opportunity for Blacks (and other minorities) not only in
education but also in housing, voting, employment, and other areas of life.
The federal government launched a concerted effort to assure that no citizen
woUld be denied his or her constitutional rights because of race or national
origin. With the direction coming from the federal government--first, the

1
-30-
judicial branch, then the executive and legislative branches--it becamet
easier for Blacks to demand an end to discrimination and segregation at the
estate anq lotal levels.
s,

CHAPTER 3
CHANGES IN ACCESS AND ATTAINMENT DURING IHE SIXTIES a
Beginning with the Montgomery bus boycott in 1965-56, tlib civil
rights movement gained momentum throughout the.South'and won public
, attpntion and support throughout the nation. Such activist organizations as
the Suithern Christian Leadership Conference (SCLC), the Student Nonviolent
Coordinating Committee (SNCC), and the Congess of Racial Equality (CORE) took
the init4ative ih organizing Southern Blacks tO demonstrate for their rights.
Black leaders.demanded an end to segregation in all areas of public life and
backed their demands with peaceable sit-ins, marches, and voter registrationa
drives They Were joined by many white liberals, -who were attratted,by the
justness of.their cau'se and thenonviolence'of their meanS. Although civil
rights, effort,s wereoften countered by hostility and violence on the part of .
Southern Whites--as'was the case in Montgomery, Selma, Little Rock, and at
the,University of Alabama and the University of Missfssippi--some progress
k,toward desegregation was made, and themood was generally hopeful. Faustine
C. Jones (1981) summarizes the situation during the 1960s as follows:
The black civil rights movement served,to give ftrm, shape,
and substance to domestic politic during the 1960s. The
enormous efforts of blacks and their allies to achieve equal
citizenship rights.succeeded ln awakening the conscience of
the nation. As a result, the promise of Brown was brought
closer to reality; court decisions, executive orders,
legislative acts, and public sentiment worked for the same
general purposes. (p. 78)

-32-
This chapter describes the federal government's response to the civil
rights movement and the Brown decision, focusing.Oh government programs
designed to promote equal opportunity in higher education; discusses the'
efforts of the higher education community itself to-improve access for
Blacks and other minorities; and assesses the educational advances made by
Blacks during the 1960s.
The Federal Response
The Eisenhower Administration, which was in power at the time of the
Brown decision, was apparently reluctant to give explicit endorsement to the
Supreme Court's :ruling or to pursue a vigorous policy of enforcing desegre-
gation in the public schools. President John F. Kennedy and his brother
Robert, as Attonney General, spoke out and acted more boldly in the cause
civil rights. But it was under President Lyndon Johnson that the first real
progress was made in the legislative arena: "Johnson used his influence to
promote the enactment of over a hundred bills designed to overcome state and
local, obstruction of civil rights for blacks" (Jones, 1981, p. 76), as well
eas issuing a number of executive orders that embodied the concept of affir-
mative action.to.
Two of the most important 15iMIces of legislation to come out of this
period were the Voting Rights Act of 1965, which gave Blacks the potential
for political, power by outlawing practices (e.g., poll taxes, literacy tests)
that had prevented them from voting, and the Civil Rights Act of 1964. Title
VII of the latter act prohibited any institution receiving federal funds from'
discriminating on the basis of race, color, or national origin. The penalty
for failure to comply with this provision was suspension of federal funds.
Thus, Title VII reflected a moral commitment, on the part of the federal'0
government, to end racial discrimination and, perhaps more importan
imposed economic sanctions against institutions that attempted to continue
their diScriminatory practices.
Along with this provision came a number of programs designed4to help
the ecopomically and educationally' disadvantaged (a disproportionate number
of whom were minority-group members) gain access to the nation's colleges
and universities. According to Green (forthcomin9, these programs represent
an expahded federal role in higher edUcation (which, prior to 1965, Ids
chiefly the'responsibility of the states), with emphasis being given to
ensuring t,he rights of individual citizens rather than jUst to meeting national-4
manpower needs (for instance, in space techhology.an1 health 'care)%
Existcing federal programs.that assist minorities can.be divided'into
four major categories: institutional aid, student financiial assistance,
special (categorical) assistance to promot access and persistence, and
support for professional training and humarnresource dgyelopment:
Many of these programs, particularly those,iwthe last
two categories; are, by statute, Tirected.,at minorities.,.
In some instances==e.g., financiA aid programs--minority
students are not the'statutory beneficiaries, yet dist-
proportionately hi-gh minority participation in these-
programs provides clear evidence of their significance
'to minority gl-oup goals -and interests.
(Greene fortkoming) / .
9
The following sections briefly describe the four categories.of federal pro-
grams and note their effects on the educational'access and attainment of
Blacks.'
4

L34-
Institutional Aid Programs
In fiscal 1980, the largest institutional aid program in the education
budget of the federal -government was "Strengthening Developing Institutions,"
authorized as Title III of the Higher Education Act of 1965 and administered
by,the Departmeni of EdAation. Title III funds have been used for such diverse
purposes as developing a comprehensive Freshman Studies Program, a competency-,
based curriculum in a public two-year college, a Career Development Program
for liberal arts students, an Administrative Improvement Program, and A
Center for Urban Affairs
Although some of its funds have been.specifically directed to institutions
that serve Hispanic or American Indian students,,Title III has since its
inception been closely associated with the suppOrt of the historically black
colleges: Between fiscal 1966 and fiscal 1977, these institOtions received'
40 percent or more of the awards granted under the program. It is not surpris-
ing, then, that as enrollments have declined'and'resources grown scarce, Title
III has been criticized for thi's apparent focus on the historically black
colleges. Other institutions--including some predominantly white colleges--
have claimed that they are 6etter qualified to be regaraed as "developing
institutiOns" and thus should be eligible for Title III funds. The program has
also been under fire because various evaluation studies have raised doubts
about its overall effectiveness.
Student Financial Aid Programs
Prior to 1965, mast federal aid to higher education went directly to
the institutions themselves. With the Johnson Administration, the emphasis
shifted, and more financial assistance was targeted to students. Moreover,
the concept of "entitlement" was introduced: that is, the notion that all
fr

-35-
,
U.S. citizens who so desire and who can benefit are entitled to a higher ,
education and sho0d not be prevented from attending college merely becailse
they come from low-income backgrounds. Earlier, financial aid to students
usually tookdthe form,of scholarships, aviarded on the basis of the student's
ability as demonstrated by high school grades, test scores, and so forth. .
Since mtnority students often suffer from the educational deficiencies
associated with poverty, their participation in such scholarship programs
tended to be low.
None of the fivesstudent financial aid programs currently administered
by the U.S. Department of Education--Basic Educational Opportunity Grants.
(renamed Pell Grants in 1981), Supplemental Educational Opportunity Grants,
College Work-Study, National Direct Student Loans, and Guaranteed Student
Loans--was specifically intended to benefit minority students. Nonetheless,
they have played "a critical role in facilitating minority access to and
participation in postsecondary education" (Green, forthcoming). Thus, in
1976, minority students constituted 14 percent of all college enrollments but
35 percent of all financial aid recipients (Atelsek and Gomberg, 1977).
The Basic Educational Opportunity Grants program (BEM, authorized by
e 1972 Education Amendments, established the entitlement concept: Its
tent Was "to put a college education within the grasp of every student,
0
re rdlesS 'of how poor"-(Brown and Stent, 1977, p. 133), with grants being
a*ard d on the basis of need, as determined,by a formula that takes into
" account family income (or, in the case of independent students,,the indivi-
dual's income). Thus, because tITey tend to come from lower socioeconomic
backgrounds, minority stuidents have been particularly likely to receive these,
grants: In 1976, they constituted 43 percent of all BEOG recipients. The
total number of BEOG recipients has increased steadily over tfi.e years--frbm

-36-
apprbximately 570,000 in 1975 to nearly 3 million by 1979making thisthe. .
largest-of the federal student assistance programs (Dearman and Plisko,-.,...
19813). It seems to have contributed more to increasing access than to
increasing choice, since the-great majority of recipients are enrolled in
lower-cost institutions. Although the awards are higher for students who
attend higher-cost institutions, they cover a sti4ller proportion of the
\S
.total costs'of such schools National Advisory Committee, 1979a).
In the Supplemental Educational OpportunityGrants ftogram (SEOG),
grants are channeled to students-through the institutjons, usually as part
of a financial aid package, to supplement the resources of students whose
financial needs are not met through other sources of aid. SEOG funds are
allocated to each state on,the bas'is of that state's s4are of the' national
FTE college enrollment. In 1976-77, minority students constituted two-fifths
of all SEOG recipi.ents.- e
The College Work-Studpprogram (CWS), whieh is also institutionally
based, subsidizes part-time employment in'on- or off-campus jobs for students,
4
who-must.be enr4lled in college at least half time. In 1976-77, 29 percent
of the participants in CWS were minority students. Research indicates that:r
this program is particularly effective in promoting unhrgraduate persistence.
Lir<e the SEOG and CWS programs, the National Direct Student Loantprogram
(ND'sL) administers its funds through the states to the institutions, which
arrange the loans or the students. .-fhe"governMent pays the,interest on
students' low-interest loans whi3e they are enrolled; the borrowers assume
payments six months after leaving school. This program is the o1dest of the
a federal student assistance program. .In 1976-77, miribrity students accounted
for fewer.than 30, percent of participants in NDSL (National Advisory Committee,
1979a).

-37-
11 The Guaranteed Student Loan program (GSL) resembles .the NDSL program,
except.that the funds come from private sources (lending inilitutions) rather
than public sources with repayment guaranteed by the federal government or,
, by the states. Moreover, interest rates are higher (9 percent, as compared
with 4 pertent in the NDSL prograM). The GSL has a lower rate of mi ority
participation (17 percent) than any other federal student aid progr (Green,
forthcoming). In recent years, the program has come underileavy criticism
Iecause'of high Aefault rates, especially among studentsattending proprietary.',,
,
schools (National AdviSory Council, 1979a).
, A sixth student aid program (thoughnot administered by the Department
of Etlucation) is the State Student Incentive Grant,program-(SSIG), autho-,
rized by-the 1972 Education Amendents and designed to encourage states to
provide financial assistance to needy college students. Federal challenge
grants are made available to states on a matching basis (50-.50), "although
in many states the ratio of.feder4l to state'coniributions ft much smaller".
(Green, forthcoming). Statistics on minority partioipation in SSIG are not
/ available.
Special (Categorical) Programs
The Higher Education Act of 1965 authorized four special prOgraths 'designed
to improve access and persistence among the disadvantaged by addressing non-
financial barriers: Talent Search, Upward Bound, Special Services for the
Disadvantaged, and Educational Opportunity Centers. According to Green (forth-
coming), "although the legislation does not specifically identify minority
students as,the intended 'target population' for these programs, their
legislative history as well as the high level of minority participation attests
to their impoftance in helping minority students to enter and persist in higher
education."

Talent Search aims at identifying disadvantaged high school students
with exceptional academic potential and encoura tgthem to complete high
school and-go on to college. runds come entirely om the federal govern-
ment. Between 1971 and 1977, Blacks accounted for about two-fifths of
a31 Talent Search palicipants.
Upward Bound is similar to Talent Search.in that both programs are
targeted to high school students and funded by the federal government.
Upward Bound prurams, however, are operated by colleges and universities
rather than by private agencies and emphasize exposing disadvantaged youth
to the college environment and developing the academic skills they will
.1
1
need for college work. Since 1966, Blacks-have.typicaTTy accounted for at--
least half of all Upward ,Bound participants. hvrding to.One study,
Upward Bound participants were no more.likely than a-control group,of non-
participants to gl-aduate from high' school (the completion rate being about
.70 percent for both groups) but were considerably more likerTto enroll in
0llege: "In 1974, 71 percent of the UB high school graduates compared
wi h 47 percent of the-coMpariOnrgroup entered an institution of high
education" (National Advisory Committee.,1979a, p. 35), and the long 'they
were in the program, the greater the probability of their attending college.
Special Services for the Disadvantaged are directed at underg'raduates
rather than high school students and are ineended to promote persistence by
offering personal and academic counseling, tutoring, and other support
services not generally available to regular students. The federal goveimment
covers about three-fourths of the costs of these services, with the remainder
, coming from the higher education institutions themselves. Between 1971 and
1977, .the proportion of Blacks participating in this progrimCdropped from4.1
55 percent to 43 percent; cOncomitantly., the proPortion of white participants
rose from 10 percent in 1971 to 32 percent in 1977 (Green, forthcoming).

-39-
The Educational Opportunity.Centers program (EOP) differs from the
other three jn that the centers are:located in the community rather than
educationaj settings. They are intended tO meet the needs of the
res,idents of low-inpme,neighborhoods by providing financial and academic
counseling that will enable the disadvantaged to attend college. )flacks
constitu.te'd"45 percent of all EOP clients in 1974 but only 39 percent in;.'
1977 (G*reen.. forthcoming).
Support for Professlonal Training and Resource Development
This categoryincflides a number of federal programs designed to increa.se
minority- p-articipation in selected disciplinesespecially the sciences,
4
engineering, and health fieldsat advanced levels. Several of these pro=
grams are targeted specificaljy to American Indians and managed by the
Indian Health Service Office. 'Others.7.-suc4 as Legal Training for the Dis--
advantaged, Minority'Biomedical Support; and Minority Access to Research
pCareersare directed at minority students in general.
, One 'program of special interest'iS' the Graduate and Professional Op-
portunity Program (GPOP), which provides two types of aid) fellowships for
students from groups that have been underepresented at the graduate and
professional levels (including minorities and women), and grants to insti-
tutions for use intidentifying, recruiting, and providing support services
for these students. In 1978-79, Blacks constituted 45 percent of the fellow-
ship recipients, and three h'istorically,black institutions received institUt-
tional'awards under this program (National Advisory Committee, 19Z9a).
-1*4
- ,
The Response of Higher Education
The liberal mood represented by the Brown decision and by Lyndon
Johnson's Great Society programs was shared by the natfon's academic

institutions, which were enjoying,a period of unprecedented expansion
and high prestige during the early 1960s. ,, The large sums of money, availableI! 4
from both public and private sources enabled them tO give expression to'
this concern forikocial justice-and equality of opportunity by initiating
policies and programs designed to help minorities gain acCess to higher
,education.. Many colleges and universities--including some of the most
elite--developed putreach and recruitment programs and introduced special
admissions procedurd aimed at identif1ytrgiinority appl,icants whose
overall profiles gave evidence of pot ntial for sucCess in college, even
though their past academic records and test scores did not meet traditional
criteria. The number of these special admissions programs increased_
dramatically aftpr the assassination of 0r. Martiniuther King,0Jr., in
1968, and the violence that ensued in some U.S. cities.1 0
As more minority students entered predominantly white colleges,.it .
became obvious that, because -of their poor preparation in thelower schools,
many of them required special support services to help them adapt to and
persist in college. Thu, reMedial, tutOring, and counseling facilities
were developed for this purpose. In the latter half of the decade, student
protests over racial issues resulted in the establishment of ethnic studies
prpgrams and ethnic centers on many tampuses, and in-greater efforts,to
increase minority representation on the faculty an6 in the administration.
The proliferation of community colleges, 'starting shortly after World
War II and continuing through the 1950s and 1960s, was one important factor
in the expansion of college enrollments generally and in the increased attendance
,
of young people from disadvantaged backgrounds in particular. In 1960,
there were 521 tOo-year college4 in the United States, about three-fifths,
of them publicly controlled. By 1970, the number of two-year colleges had
increased to 8 73 percent of them publicly controlled. The number of
47

-41:-
.degree-credit enrollments in public two-year colleges jumped from 392,3.10
in 1960 to 1,519,762 in 19701 an increase of 287 percent. Enrollments in
private two-year colleges also rose over thiq period, but at a much lower.
rate.: from 59,023 in 1960 to 110,220 in 1970, an 87 p-ercent increase
(Giant and Lind, 1975). Because community colleges charge little or no
tuition., are nonresidential and thus enable students to live at home while
attending cbllege, have nonselective admissions criteria (often requiring
no more than a high school diploma), and are conveniently located (with
many in urban centers and thus easily accessible to inner-city residents),
they offer to poor and to poorly prepared:students opportunities for higher
education that would otherwise not be,available to them. Such students
//can enroll in dcommunity'college expecting either to complete an associate
degree in% two-year career program or to transfer to a four-year colleije
in order to complete a batcalaureate program.
But even as it provides opportunities, the communiti college poses,
dangers. Abundant research has demonstrated fhat students wh9,enter such '
institutions planning to transfer to a senior institution are more likely
than are their counterparts who initially enroll in other types of institu-
tion to drOp out before completing their college education. What makes
the.situapon more serious, Blacks and ither minorities have a greater ten-.
I;
dency than do'Whites to'enroll in community col.ftges. For instance, in
the fa.11 of 1978, close to two in five of All black.college students,
over half of all Hispanics, but only one-third o'f all white college students °
were a,ttending public two-year colleges,(Dearman and Plisko,,1980). The
dangers are widely recognized, as the following statement froma document
published by the National Urban League'demonsVates:
The issue is whether [the community colleges] are 'evolving
*11..
into "thecoming slum's" of higher education," or into &vehiclefor equal educational opportunity for blacks.
.48

If the community colleges becoMe increasingly:the institutionsfor the high-risk, economically disadvantaged' minorities,of thiscountry, a differential society, wherein minorities will have toprove the merit of these institutions, is perpetuated. . . .
Could it be that these institutions just by definition re-direct' black students towarq alternative goals which are usually.of lower
social rank? The question becomes how tO enhance and perpetuatethose characteristics which provide for an egalitarian, accessible,high quality, low cost opportunity for higher education without thesacrifice of status and quality of educationaT services. Thepromised open door cannpt become a merry-go-round only-to dreamsof upwar'd social and economic mobility% (Stent, 1979, pp. 98-99)
, Progress During the 1960s
Before assessing the gains made by Blacics durfng the 1960s with respect
to higher education attainment, one must take into account several factors
that help to determine the pool of young people eligible to matriculate at
a higher education inWtution. These factors include delayed education
(i.e., being behindHn school), high school nonattendance, and high school
completion. Table 2 shows statfsticseon these factors for male and female
1
Blacks of relevant age groups in 1960 and in 1970;.changes (in percentage
points) over the ten-year period are also silown. For purposes of comparison;
the table also includes figures for majority (i.e., non-Hispanic) Whites.
Students who fall behind others of their age level in school are more
l ikely to drop out before high School graduktiOn fhan are those who make
"normal" progress. Amomg the reasons for their Righer attrition rates are
"boredom with materials designed for yopnger Students, feeling out of place,
being blamed.for disruptions and losing interest, and a lack of normal social
life with children of.similar ages" (U.S. Commission on-Civil Rights, 1978,
p. 5). As Table 2 shows, in 1960 over one-third of male Blacks and one-
-fourth of female Blacks age 15-17 werN two or more years behind the modal
grade for their age (modal grade being defined as the grade in which ther*
greatest number of students of a given age are enrolled). . Comparable figures
for Whites'were 18 percent of 'the boys and 10 percent of the girls. By
. 4 9,

4
Table 2
Trends in Factors Related to Eligibility for College Attendance, 1960-1970,by Race and Sex
(percentages)
tr
Male Blacks Female Blacks 4 Male Whitesa Female Whites
a
1960 1970 Change 1960 1970 'Change 1960 1970 Change 1960 1970 Change
Delayed educationb
High schoolnonattendance
c
High school. d
completion
36
21
41
26
16
59
-10
5
+18
25
23
42
1 7
15
62
8
- 8
+20
18
18
6
12
9
83
- 6
+14
10
12
70
6
8
82
- 4
4
+12-1=C.A3
Source: Adapted from U.S. Commission on Civil Rights, Social Indicators of Equality for Minonleties and
Women --(Was-pington: The Commission, 1978), Tables 2.1, 2.2, .and 2.3.
a Whites refers to majority (i.e., non-Hispanic) Whites.
bProportion of 15-17-year-olds. who are'two or more years behind the modal grade for their age.
cProportion of 15-17-year-olds who were not enrolled in school on April 1.
dProportion,of 20-24-year-olds who had completq 12 or more years of school.
5051
T3

-44L
1970, delayed education rates had dropped for all four groups, ethin each
racial category, girls were less likely than were boys, to have fallen
behind in school, but [flacks of both sexes were still much more likely than
their white'counterparts to lag two or more years behind their modal grade,
and the racial gap was wider for females than for males..
Tbe second row of Table 2 shows the proportions of 15-17-year-olds, by
race and sex, who were not,enrolled in school rin 1960 and.in 1970% Again,
one finds considerable improvement over the decade in that nonattendance
rates dropped for all groups,(a decrease of from four to eight percentage
points). Nonetheless, even in 1970, Blacks of both sexes were almost
twice as likely as their white counterparts not to be.enrolled in school.
These young people are not necessarily "dropouts," since their nonattendance
may be temporary; some of them may return to high school and get the diploma
and thus may become eligib,le for college. But the likelihood is small. /
Once having left the system prior to high school completion, they are probably
lost to higher education:
Finally, Table 2 shows sizable increases in high school completion
rates over the ten-year period. In 1960, about two-fifths of Blacks and
70 percent of Whites in the 20-24-year-old population had graduated from
high school; by 1970, the proportions had increased to about three-fifths
of Blacks and 82 percent of Whites. The gap between the races narrowed
only slightly, however: ,from 30 percentage points in 1960 to about 22
percentage points in 1970.
These trends are confirmed by data on other.age groups. Table 3
shows changes in the educational attainment of-Blacks and Whites,age 25
and older over the ten-year period. IR 1960, close to one in four Blacks in
the U.S. had no more than five years of schooling; by 1970, the proportion
had dropped to 15 percent, whe'reas the proportion of B1c completing
52

Table 3
Changes in EduCational Attainment of Persons 25 yearand Older, 1960-1970, by Region and Race
1 with [..ss Th'an
5 Years of Schooling% CompletingHigh School
Median SchoolYears Completed
1960 1970 Change .1960 1970 Change . 1960 1970 GhAnge
Total U.$..:
tilacks 24 15 - 9 20 31 +11 8.2 9.8 +1.6
Whites 7 5 - 2 43 .55 +12 10.9 12.1 4.1.2
South:
Blaas 32 21 -11 15 24 + 9 7.0 8.7 +1.7
Whites 10 /,a
- 3 40 49a + 9 10.4 11.9a +1.5
\
North and West: ;.3.
glacks 13 8 - 5 27 39 +12 .9.2 10.8 +1.6
Whites 5a
4 - 1 44 57a +13 11.1 12.2a
Source: Adapted from Bureau of the CenstA, U.S. Department of uommerce,The Social and Economic Status of the Black Population in the United States:A Historical View, 1790-1978. Current Population Reports, Special Studies,Suries P-23, No. 80 tWashington: U.S. Government Printing Office, 1979), Table 70.
aDdta incaude persons of "other" races.
'
53.

-46- ,
high school increased from 20 percent to 31 percent-during the,decade. The'
Median number of school years completed by Blacks rose from 8.2 years to,9.8
years. Among Whites, the increase was,sligntly smaller: fom 10.9 years to
12.1 median years of schooling. As Table 3 indicates:regional differences
persisted. 'In both 1960 and 1970, Blacks in the South averaged about
two years less schOOling than their counterparts in the and West.
Whites in the South also had loWetfl median levels of, education than Whites in
other regions of the count6; but de disCrepancy was less marked.
In summary, the decade of the sixties saw substantial increases in,
the numbers and proportions of Blacks compTeting high school.and thus.
IIconstituting the pool of'Blacks eligible for higher education.
Table 4.shoWs college enrollment rates for 18724-year-oihs in 1960 . .
Iwere actually attending college rose from about 7 *cent tp 15 pencent.over
and 1970. Among' Blacks, the proportion of,the callege-age population who
,
.
. ..
the decade.' Among Whites, the proportion'increased-frop 15 percent. to 27,
11percent. It is interesting to note that, in bdth years, col.lege-aap_biack
1
.
__......----
.
men were only slightly more7likely than theirfemale counterpkrts to enroll.
IIin higher education,,whereas among Whites, the sex differential was marked,
II
especially in 1970, when one in three white men, but only onein 'five white.
,
women, between 18 ind 21 years 4 age was attending college. 'Looking et absolute. ,
. 0.
II
numpers, One finds that, even though the inctrase in theecollege-age (18-247year-
, ,
old) populafion mis the same'for both races (44 per'ent), the increase in the
IInumber of college students was considerably higher for Blacks (223 percent)...._,
. . .
6'1
than for Whites (155 percent). Women of C,eth races made greater.gains aver
II.the decade thar did their male counterparts-.
,
As to college completion rates, Table 5 shows the proporfion of
18-24-year-olds who hat, Completed four or more years of college, as"reported
in 1960 and in 1970. White women registered the greatesfgains percen-.
tage points). Once aga in, however the sex differential among Whites
5 4

Table 4
Changes in College.Enroliment Rates.of 18-24-Year-Olds, 1960-1970,by Race and Sex
1960a
1970
Popu-latior
NumberIn College
ProportionIn College
Popu-lationu
NumberIn College
b\Provortion!In College
Black,.:,: 1,865 .129 6.9 2,691 417 15.4.
Men 887 63 7.1 1,220 192 15.7
Women 978 66 6.7 1,471 225 15.3
Whites: 13,609 2,078 15.3 19,608 5,305 27.0
Me,n 6,688 1,267 18.9 9,053 3,096 ,34.2
Women 6,921 811 11.7 10.555 2,209 20.9
Source: Adapted fr'om Bureau of the Census, U.S. bepartment of Commerce, .TheG
EcOnomic Status of the'Black Population in the United States: A Historical
View, 17A-1'.i7. Current Population Reports, Special Studies, Series P-23, No. 80(Wasninoton: U.S. Government. Printing Office,'1979), Table 66.
aData for Blacks include "other" races.
bNumbers in thousands
55

Table 5
Chanqes in College Comple4tion Ratesa of 25-29-Year-01ds, 19610=1970,.by Race and Sex,
1960 1970 Charige
,Blacks:
Men.,
Women ,
Whites:b
Men
Women
4
6
20,. I.
9
6
8
-Z2
14
+2
+2
+2
+5
SoUrce: Adapted from U.S. Commission bn Civil Rights, Social Indicatorsof Equality for Minorities _and Women (Washington: The Commission, 1978).
aproportions who have completed at least four years of college.
aites refers to majority (i .e. , non-Hi spani c) Whites.
56

.
strongly favored men, whereas women had the advantage among Blacks.
College completion rates arp lower when.one looks at a wider age range,
sinQe older people tend to have-had less schooling. Accoreling to CensusP
Bureau figures, the proportions of Blacks 25 years and older who had at
least four years of college increased from 3 percent in 196b,to 4 percent
in 1970. Among Whites, the proportion increased from 8 percent in 1960
to 11 percent in 1970. There were virtually no regional differences in these
rates. That Blacks in the South, were just as likely 'to have a college'education
as those in the North and West is probably attributable to the concentration
of hispric4lly black colleges in the South.. Even in 1970: these institutions,
were the chief means whereby Blacks were afforded access to higher education;
thus, it was comparatively convenient for Blacks in the South to go to college
(Bureau of the:Census, 1979). It should also'bg noted that the gap between
Blacks and Whites, in terms of higher education attainment, did not diminish
over the ten-year Period. Indeed, it was slightly greater in 1970 than
in 1960.
57

CHAPTER 4,
CHANGES IN ACCESS AND ATTAINMENT DURING THE.SEVENTIES
If the sifties can be characterized as a period of hope and progress
for Blacks and other minorities in an atmosphere of economic expansion
and social libdalism, then the seventies must be viewed as a period of
reaction, of shrinktng resdurces and fading prospects, and of growing
conservatism. With the costly and divisive Vietnam War coming to an
end.and with an economic recession making itself felt, the mood of the
country turned sour.
Two writers have described this chkiAging mood as it has affected theV
efforts of Blacks to achieve equality in education, employment, and other .
areas of American life. Covering the period from 1969 to 1975, Faustine
Childress Jones (1977) analyzes the growing hostilitiy of the white working
class toward Blacks:
These whites were generally frustrated, dissatisfied, and feltthemselves to be powerless in their communities 'and in theAmerican system. This latent hostility appeared to be indepen-dent of immediate dissatisfaction and frustrations, butreflected aspects of a general racial orientation built upover the individual's lifetiMe. . . .These white people viewblack progress as a threat to their own strivings and achieve-ments. (p. 32)
As competition for jobs and resources becomes more fierce, tha la-Cent
hostility has often become overt, erupting in violent confrontation.
In addition to the "ethnic backlash" of the working class, there has
developed among more affluent and educated Whites a kind ofNdeological
backlash,Idirgcted against the liberalism and social commitment that
inspired much of the Great Society legislation. "Finding no easy answers
to complex social and racial problems," some influential white intellectuals--
including Daniel Moynihan, Irving Kristol, and Nathan Glazer--"retreated
into the secure positions and are now concened with the maintenance and
stability of an order which has rewarded them" (Jones, 1977, p. 41).

1
J.
1
U.
-51-
Jones defines'four "streams" that make up neoconservative thought.
The first, associated with William Shockley of Stanford and Arthur Jensen4
of the University of California at Berkeley, is a renewal of the belief
that Blacks are genetically inferior to Whites and that their intellec-
tual capacity is limited/bynature'. The second is a "blame the victim"
mentality which attributes poverty to the bad habits of the poor: for
instance, their supposed inability to delay gratification. The third is
the cOnvictiOn that 'igovernmental and institutional intervention in
individual affairs makes no substantial difference" (p. 43). Both these
notfons were expressed by Daniel Moynihan when he wrote about the "tangye
of pathology" that characterizes the lives of poor Blacks and counseled
"benign neglect" on the part of the government. Jones labels the fourth
sfream "pseudomeritocracy," the belief that "adult success comes solely,
orbprimarily, fi-offrmerie (p. 46) and that hard work will inevitably be
rewarded; according to this school of thought, the "haves" in our society
obyiously deserve their status.
All these ideas-4ich receive wide circulation in such "serious" andA
trend=setting journals as Commentary, Public Interest, d Atlantic Monthly--
lend an aura of respectability to attacks on minority aspirations and
efforts to achieve some measure of,equality and justice in American society.
Jones concludes that the negative effects of neoconservative thought
"coulCi become a self-fulfilling prophecy. When blacks and the poor are
labeled as inferior, this confirms a 'natural rightness' for assigning them
an inferior status in society,'. with all the resulting effects of that status"
(Jones, 1977, p. 79).
Gerald R. Gill's Meanness Mania: The Changed Mood (1980) was written as
a sequel to Jones' book an.d gescribes changes from 1969 to 1975. The
term "meanness mania"--with all its implications of "selfishness, stingi-.
ness, and hostility"--is used to characterize the "fiscal and social
59

conservatism" that has dominated the "political, cultural, and social"
scene in recent years. According to Gill, this mania springs in part from
the erroneous belief of many middle-class Whites that Blacks have made
enormous advanCes Sin the past few decades and no longer suffer from the
effects of discrimination; in part from a new ethos 'of narcissicism,
hedonism, and self-absorption coupled with a callousness toward the
disadvantaged in American society; and in part from a "weariness with
change" and a nostalgic desire to return to (some false image of) the
past--impulses.that soMe authorities regard as part of a cycliCal pattern
in American history.
Most of Gill's book is devoted to the issues that absorbed the
attention of middle-class white Americans during the-late seventies.
Among the topics he covers are attacks (from both the radical left and
the reactionary right) on the quality of public education, opposition
to busing, prollosals for tuition tax credits and educatton vouchers (in-
tended primarily to benefit the middle class), demands:For competency-
based testing, the tax revolt as exemplified in California's Proposition
13, and recent challenges to the toncept of affirmative action.
Both tiones and Gill offer a mass of evidence to suppori=their argu-
ment that the cause of equal opportunity for minorities hasleen losing
ground in the past decide. The next section discusses two-court cases
which seem, on balance, to add further weight to this.arguMent. The body
of the chapter presents data on the recent progress and current status of
Blacks in the higher education system, on-their institutional enrollment
patterns, and on their representation in various fields.
Court Cases: Bakke and Adams
.The charge of "reverse discrimination"--the notion that affirmative
action taken to redress the effects of past discrimination on Blacks and

I.
I.
1
Ii
-53-,
other mino?ities --(including women) necessarily discriminates against white
men and is thus unfair arld illegal--lies at the heart of the Bakke case
(Regents of the University of California v. Allan Bakke). Bakke, a white
male, claimed that he had unfaiTly been denied admission to the UO Davis
medical school because of the school's special admissions program, which
reserved up to 16 plades in the first-year class for minority-group
meMbers. The case, which.made its way through the California Supreme
Court to the United States Supreme Court, attracted nationwide attention
and drew a wide variety of organizations and institutions into the arena:
a record 69 amicus curiae briefs were filed in the case. Supporters of
Bakke leveled the charge of reverse discrih,,rotion,. maintaining that
the medical school's special admissionsjrogram amounted to the establishment
of a quota system and that such quotas Are repugnant and unconstitutional;
in their admissions practices, public institutions must be color-blind.. On
the other side, advocates of affirmative action held that traditional admissons
practices had long worked to the detriment of the disadvantaged and that
special programs are needed to compensate for past inequities and to bring
Blacks and other minorities into the mainstream of American life; a decision, .
in favor of Bakke, they said, would undo whatever small progress has been'
made in-this area. As Justice Thurgood Marshall stated in his opinion:
"During most of the past 200 years, the Constitution as interpreted by this
Courddjd not prohibit the most ingenious and pervasive forms of discrimina-
tion against the Negro. Now, when a State.acts to remedy the effects Of,
that legacy of discrimination, 1 cannot believe that thiS same Constitution
IIstands as a barrier" (quoted in Gill, 1980, p._75).
li
,
0 The Court's decision, handed down in June of 1978, raised more questions,
. .
,than it answered. The Court (voting five to four) found the Davis program
II"unacceptable and directed that Bakk& be admitted to Meacal school. At
..
the same time (in another five to four vote), it upheld the use of race as
II
1,
, 61

1
1
1
di*
-54-
a "determining factor" in admissions decisions, citing Harvard's program
as acceptable. Predictably, reaction waemixed. Gill (1980) describes the
range of responses:
[There were] those who viewed the decision as harmful to blacksand other minoritie; those who viewed the decision to admitBakke with alarm, but who agree with the Court's approving the.
/ use of race as a factor in the admission process; those whoapplaaded the elimination of Davis' special minority admissionsplan; and, thoe who praised the Court for eliminating the specialminority/admtAions plan, but wfto decried the use of race as afactor in admissions. (0. .64)
The ,precise effect's of the Bakke decision are difficult to assess. Many.
colleges and universities may have retreated from their commitment to
affirmative action. Some graduate and,professional schools have eliminated
their special admjssions programs or revised'them to make economic' disad-.,
vantagement rather than race/ethnicity a key fb.ctor, thus reserving soma, -
places for'low-income Whites as well es low-income minorities; even this
accommodation,has been attacked by some critic's as an illegal quota system.
Gill maintains that "the controversy surrounding the Bakke case [had] a
chilling effect" on the erfriollment of black students in professional
schools- Data 'provided by the Association of American Medical Colleges '
show that the proportion of Bracks among first-year medical school eriroll-,
ments dropped frOm 6 percent in 1977-78 to 58 percent in 1978-79 and '5.7
percent in 1979-80, then rose to 6.5 in 1980-81; moreover, the absolute
number of Blacks admitted to medical school has remaine4 fairly steady
or increased (see Astin, 1982, p. 84). Thus, Gill's statement ts not
supported by this evidence. What is important about the Bakke case, however,
is what it reveals abdut the.mood of the country: widespread opposition.
to affirmative action and a feeling, oh the part of,many mfddle-class Whites,
'that the government has already "done enough" to'help disadvantaged
minorities. It is impossible to Calculate how many Blacks have been discouraged
from continuing on to graduate or professional school by their awareness
62

that a large segment f the public is indifferent, or outright hostile,
to their aspirations.
A somewhat unexpected consequence of the Bakke decision is that
graduate and professional schools withim predominantly black institutions'--
which historically have played such a vital role in training Blacks for ;
high-level positions--have come under attack for giving preferential
treatment to black applicants and for directing their programs at black%
students. The integrity of the historically black colleges is also
threatened, according to some observers, as a9result of another court
case: Adams v. Richardson (480 F, 2nd, 1159, D. C. Cir., 1973).
The Adams litigation began in 1970 when the Legal Defense Fund (LDF) of
the NAACP filed a class action suit against the Department of Health,
'Education and Welfare.(or, more accurately, against Elliot Richardson,
'then Secretary of HEW, and Stanley pottinger, director of'NEW's Office
for Civil Rights), charging that HEW was moving too sldwly in enforcing
Title VI of the.Civil Rights Act of .1964, Which -prOhibits federal support
to public education institutions that practice segregation and discrimina-,
tion, The LDF complaint poin±ed out that, following,earlieninvestigations
HEW had concluded that ten 'southern and border states were violating Tftle
VI by operating a dual system of education but had failed to take any
action beyond sending letters to the states involved requesting voluntary
compliance. In February of 1973, Judge'John Pratt of the U.S. District,
Court of the-District of Columbia "ordered HEW either to obtain'compliance
from the ten states by receiving acceptable desgregation plans or to 'begin
enforcing Tittle VI by terminating -funds to those states that failed to
Aevelop and 'submit acceptable desegregatiln plans.' (Haynes, 1978, pp. 117
6-7), ,This decision was upheld by the U.S. Court of Appeals, which set
June 1974 as the deadline for receiving acceptable plans. Nine of the
ten states submitted: plans by the_deadfine, and eight of the plans were
6 3

1
-56-
deemed acceptable by HEW. (Louisiana fa'iled to submit a plan, and Missis-
sippi submitted one that was not completely acceptdble; both cases were
referred to the Justice Department for action.)
In August of 1975, the Legal Defense Fund returnN to the Circuit
Court with a Motion for Further Relief, charging that the eight desegre-
gation plans accepted by HEW did not in fact comply with the decisions
of the.courts and that HEW was doing nothing to enforce implementation.
IDF called for the development of new plans designed to result in the
increased representation of Blacks in the student bodies and on the
faculty, administration, and governing boards of white colleges and to
enhance the role of the fiack colleges. Judge Pratt's final decision,
delivered in April 1977, generally found for the plaintiffs; HEW was
ordered to seek more effective desegregation plans from six of the eight
states. The new plans were to be submitted and approved by January 1978
and implemented during the 1981-82 academic year.
Opinion within the black community on the issues raised by the Adams
case has been divided, with some black educators fearing that desegregation
in highei- dducation would, in effect, mean the end of the historically
black cdlleges (HBCs). The National Association for Equal Opportunity
in Higber Education (NAFEO), an"organi7ation comprising presidents of
black Colleges, filed two amicus brief opposing LoF in the'course
of the litigation. Accbrding to NAFt0, the HBCs have long served as
'4pecial-purpose" institutions, corlipensating'for the,negative effects of
the "crippling and debilitating elementary and secondary educational
system" on black youth. .Elimination of the dual system.of higher education
that eXists in some states, and establishment of a unitary system, would
mean ihat "the Black Institutions must be assimilated into e white unitary
system" (NAFEO amicus curiae brief filed with the U.S. Court,of,Appe 1 ;
quoted in Haynes, 1978, pp. C-22, C-23). Although thjs assimilation
64

would oStensibly promote equality of.educational opportunity, it would
actually subvert the larger goal of providing "equality of educational
attainment," a function long performed by the HBCs, which have moreover
since the very beginning been open to all races and have thus "been more
profoundly representative.of the American Ethic than the larger, more
affluent schools of Higher Education in t[ii country" (quoted in HaynIsi
1978, p. C-28).
In response to the concerns expressed by NAFEO, the appeals court
referred to the "important role" played by the black colleges in training
minority professionals and emphasized that desegregation in higher education
must be carried out on a statewide basis, rather than institution by insti-
tution, in order to assure the continued vitality of the historically black
colTeges. Moreover, in his 1977 Supplemental Order, Judge Pratt ordered
HEW to draw up pew guidelines for desegregation plans that would take
into account the special needs of black colleges: "The process of desegre-
gation must not place a greater burden on Black institutions or Black
studdnts' ppportunity to receive a quality public higher education. The
desegregation process should take into account the Unequarstatus of the
Black colleges and the real danger that desegregation will diminish higher
educiition opportunities for blacks" (quoted in Haynes, 1978, p. 1-5).
The National Advisory Committee on Black Higher Education and Blacks
Colleges and Universities, a group of educators created to advise the
Department of Health, Education and Welfve, has mixed views on the
ramifications and possible consequences of the Adams case. On the other
hand, itbelieves that "the emphasis on equitable treatment: . . .will
do much toward'helping the public Black colleges to attract.and maintain
the quality faculty with the appropriate commitment to the type*of inst,mic-
tion thet'HBC'5 have characteristically offered" (1979b, p. 40). On the
other, it warns that increased competition for qualified black students

1
I.
1
I
1
1
-58-
may have adverse effects. Insofar a the pool is limited, and to the
extent that white institutions are successful in recruiting a larger share
.of that pool, the hiftorically black colleges are threatened by severe
.enrollment reductions, and concomitantly, loss of revenue.
In its recommendations,for "financing and planning for diversity in
American' higher education," the National Advisory ComMittee (1979b) states:
Where diversity as to control is a Clearly defined and acceptedcbncept, there exists a contradictory posture with respect to
' the maintenance of diversity based upon ,zoial characteristics..The direction of integrati7fforts in the Adams States
pojnts to an emphasis on adjusti the mix of other race students. .
at historically Black and white institutions. . . .Loss of a
minority sensitive environment such as that typically affordedin the NBC's in not an even trade,-off and may be a setback inequal educational opportunites for Blacks. (p. 55)
Thus, jt recommends that the public black colleges continue to pursue
their historical mission's and that federal and state agencies monitor
desegregation efforts to assbre that they do not lead to loss of black
enrollment or to increases in the attrition of black students.
In sum, both .NAFE0 and the National Advisory Committee support the
Adams decision insofar as it may -lead to the programmatic and physical0
enhancement of the historically black colleges. BUt they oppose desegre-
gation of the HBCs to fhe extent that the predominantly minority atmosphere
would be lost and the.institutions no longer r'acially identifiable (as
was originally proposed by the Legal Defense Fund).
Progress During the 1970s
This section examines the recent progress and current status of
Blacks in their quest for equal educational opportunity. Using data
from a variety of.sources, it follows Blacks through the educational
pipeline: from high school completion, through college entry and bacca-
laureate attainment, to participation in graduate and professional
. education.
66

-59-
a
High School Completion
Chapter 3 noteethat the pool of young Blacks eligible to matriculate
at a higher education institution increased during the 1960s, as rates of
delayed education and high school nonattendance dropped and as the high
school completion rate rose. Progress continued,to be made in these areas
during the 1970s. According to the U.S. CoMMission on Civil Bights (1978),
the proportion of 15-17-year-old Blacks who wei-e two or more,years behind
the modal grade for their age dropped: from 26 percent in 1970 to 23 per-
cent'in 1976 for boys; from 17 percent in 1970 to 15 percent in 1976 for
girls. Nonetheless, even as recently as 1976,'Blacks were about twice as
likely as majority (non-Hispanic) Whites (whose delayed education rates
were 10 percent for boys and 7 percent for girls) to have fallen at least
two years behind in school. As pointed out earlier, this scholastic '
retardation increases the student's probability of dropping out of school
prior to graduation. The proportion of 15-17-year-old Blacks not enrolled
in school also dropped between 1970 and 1976: from 16 percent to 7 percent
for boys; from 15 percent to 6 percent for girls. The comparable figures
for majority Whites in 1976 were 5 percent for boys and 6 percent for girls.
In short, Blacks were close to achieving parity with Whites in terms of
high school attendance rates for this age group. Among 20-24-year-old
Blacks, high school completion rates rose from about three in five in
1970 to about three in four (74 percent) for both sexes in 197. Thus,
26 1,ercent of Blacks, Lapared with.13-14 percent of Whites1, in this age
group may be designated high school dropouts.
Table.6, which is based on weighted five-year averages from the 1974-78
Current PoOulation Surveys (CPS) of the Bureau of the Census, arrives at slightly
higher estimates for both racial groups: About 30 percent of 20-25-year-old
Blacks and 18 percent of 20-25-year-old Whites were neither high school e
graduates nor enrolled in school at the time of the October survey,. The
I,
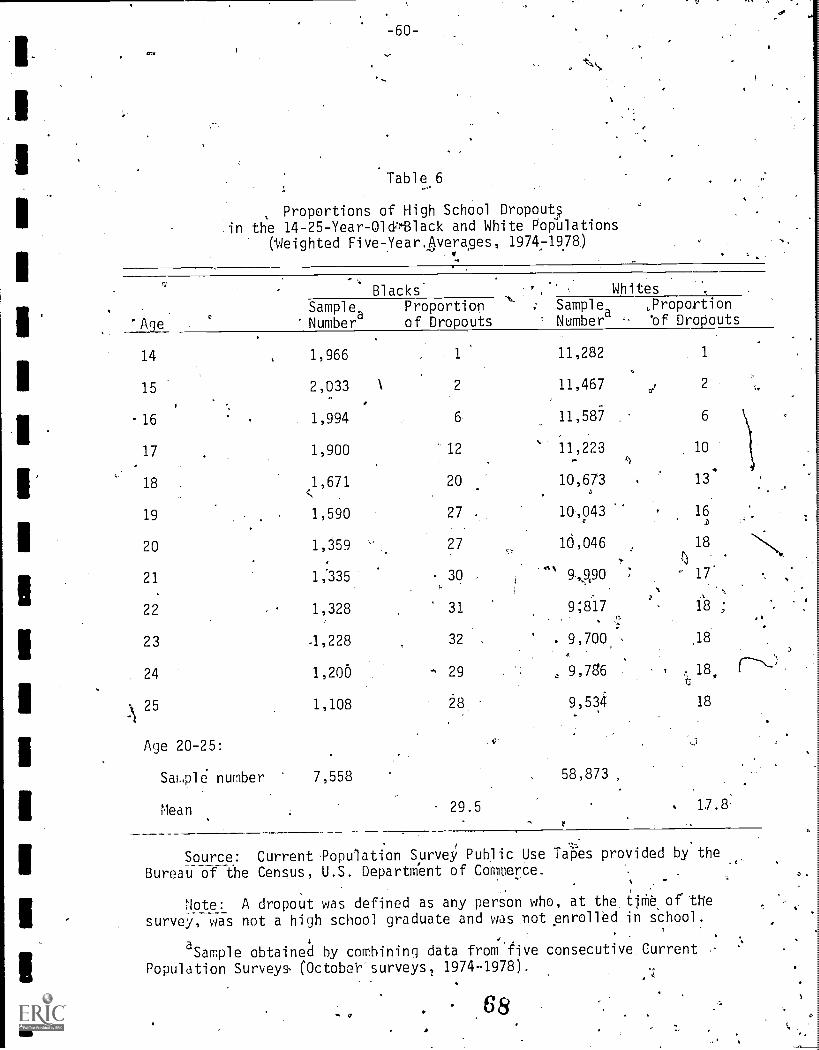
-60-
Table
Proportions of High School Dropouin th'e 14-25-Year-OldL*Black and White Populations
(Weighted Five-Year.hvera,ges, 1974719.78)
'Age
..,
Blacks'
.-.5
Whites,
SampleaNumber
1,966
2,033
1,994
1,900
1,671c,1,590
1,859
1:335
1,328
,1,228
1,200
1,108
7,558
Proportiopof Dropouts
1
\ 2
6
12
20
27
27
30,
31
32
- 29
28
29,5
SampleNumber
11,282
11,467
11,50
11,223
10,673
10,043
16,046
., 990
9;817.
. 9,7004.
, 9,786
9,534
58,873
,
t,
..
',
,Proportion'of Dropouts
1
..'2
6
10
13'
16
18
): .
17'
:
18 ;
.
,18
, - 18, r--N.).
18
17.8:
-
.17
:\
14
15
16
18
19
20
21
22
23
24
25
Age 20-25:
Salple number
Mean
Source: Current,Population Survey Public Use Ta6es provided by theBureaurcir-fhe Census, U.S. Department of CoMmerce.
Note: A dropout was defined as any person who, at the,tjthe,of the
survey, was not a high school graduate and was ,not enrolled in school.
aSample obtained by combining data from'five consecutive,Current
Population Surveys . (October-surveys, 1974-1978).
S 68
)

-62-
f,
. Table 7
Rejional Differences in Black and White High School Completion Ratesand Median Years of Schooling, 1975
Blacks Whites
Percent MedianCompleting School
High YearsSchool Completed
Percent MedianCompleting School
High Years
School Completed
Ages 25-34:
Total U.S. 69 12.4 82 12.8
South 63 12.3 78 12.7
North and West 75 12.5 84 12.8
Age 25 and over:
Total-U.S. 10.9 65 12.4
South 33 9.5 60 12.3
North and West 53 12.1 66 12.4
Source: Adapted from Bureau of the Census, U.S. Department of Commerce,The Social and Economic Status of the Black Population in the United States:
A Historical View, 1700-1978. Current Population Reports, Special Studies,
Series P-23, No. 80 (Washipgton: U.S. Government Printing Office, 1979),
. Ta,bles 70 and 71.

-63-
Table 7 ..also shows regional differences. Residents of the North
and West have fared somewhat better educationally than Southerriers, and
this is particularly true for Blacks. OF those Blacks age 25 and over,
Only one-third in the South, compared with slightly over half (53 percent):
in other region's, had completed high school. The gap between Blacks and
Whites in this age group is particularly evident in the South, where
Blacks were almost twice as likely as Whites to drop out of school;
in the North and West, Blacks were only about one-fifth more likely than
Whites to fail to graduate from hIgh school. Regional differences between
the races are less apparent-in the 25-34-year-old population, reflecting
improvements over the last decade or so in the secondary education offered
to Blacks living in the South.
In summary, during the 1970s, the proportion of Blacks dropping out
of.high school prior td graduation continued to decrease. By the last
years of the decade, the high school completion rate for Bl'acks was about
72 percent. The comparable figure for Whites was 83 percent; for the other
minorities under consideration (Chicanos, Puerto Ricans, and American
Indians), it was only 55 percent.
College Entry
Of those Blacks who graduated from high school in the 1974, how many
continued on to higher education? Table 8, which is based on aggregate
data (1974-78) from the October Current Population Surveys (CPS), shows
that about two in five Blacks (41 percent, compared with 45 percent of
the Whites) who graduated from high school in June were enrolled in college
on a full-time basis the following September.
An alternative estimate comes from the National Longitudinal Study
(N , conducted'hy the National Center for Education Statistics, which
found that 37 percent of the Blacks (and 45 percent of the Whites) who
70
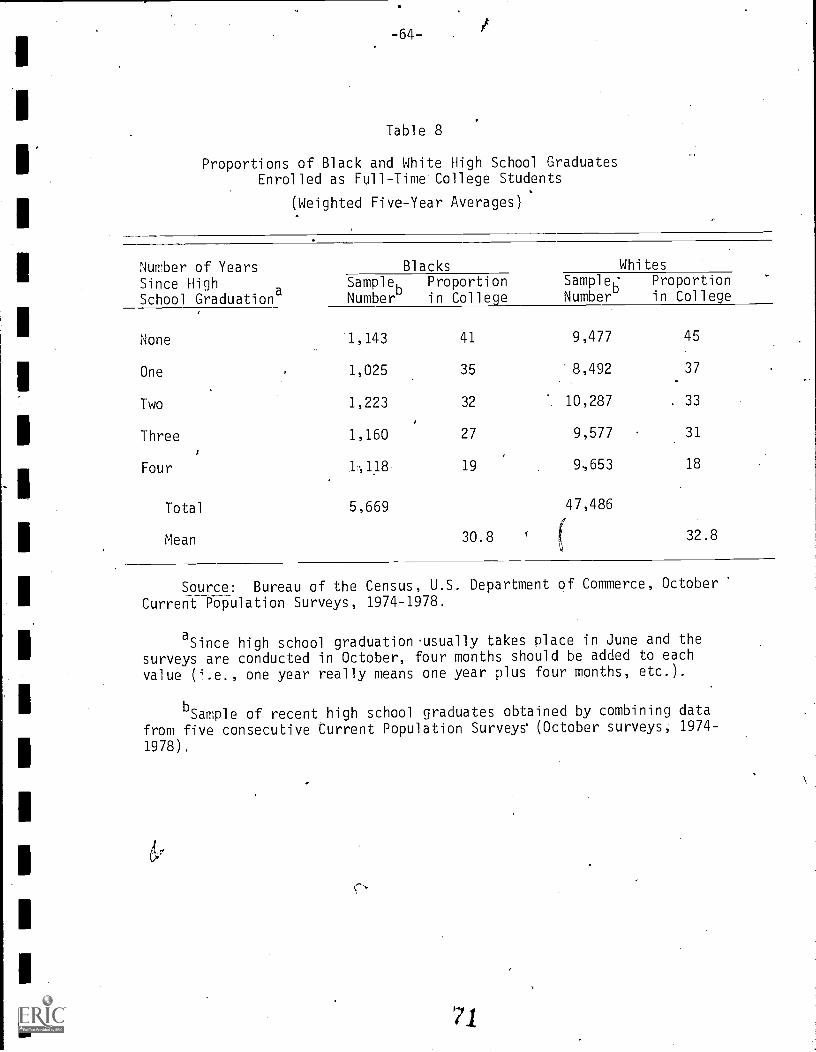
Table 8
Proportions of Black and White High School GraduatesEnrolled as Full-Time College Students
(Weighted Five-Year Averages)
Number of YearsSince HighSchool Graduation
a
Blacks Whites
Sampleb ProportionNumber in College
SamplebNumber
Proportionin College
None 1,143 41 9,477 45
One 1,025 35 '8,492 .37
Two 1,223 32 .. 10,287 . 33
Three 1,160 27 9,577 31
,
Four 1,118 19 9,653 18
Total 5,669 47,486
Mean 30.8 " ( 32.8
Source: Bureau of the Census, U.S. Department of Commerce, OctoberCurrent Population Surveys, 1974-1978.
aSince high school graduation.usually takes place in June and the
surveys are conducted in October, four months should be added to each
value ('.e., one year really means one year plus four months, etc.).
bSample of recent high school graduates obtained by combining data
from five consecutive Current Population Surveys (October surveys, 1974-
1978).
71

graduated from high school in 1972 were attending college the following
September. In judging which of tl'iese figures for Blacks--41 percent or
37 percent--is most accurate, one should bear in mind that the NUS data are
based on a single year (1972), whereas the Census data represent a five-,
year average (1974-78). Thus, the Census data may better reflect increases
in the college entry rate for Blacks during the decade. On the other hand,
Astin (1982) points out that the Census data are based on the response
of "household informants" ana consequently may be somewhat inflated:
"Because a household informant does not always have up-to-date information
on the enrollment status of other household members, he or she may tend to
err by indicating that a household member is enrolled as a college student
when that person is in fact not enrolled. Similarly, household informants
mayconfuse trade or vocational schools with degree-granting colleges and
universities" (pp. 33-34).
Returning to-lable 8, we find that, one year after high school graduation,
the proprtions attending college full time had dropped to 35 percent for
Blacks and 37 percent for Whites. It does not necessarily follow that the
attrition rate during the freshman year amounts to 15 percent for Blacks
and 18 percent for Whites. The rate could be lower (since some of the
students may have switched to part-time enrollment or may be "stopping out"
of college temporarily), or it could be higher (ince the figures for full-
time enrollment 'are swelled by those who delay entry to college for a year
or more). The proportions continue to decline until, in the October four
years after high school graduation, only about one in five of the high school
graduates (19 percent of,the Blacks, 18 percent of the Whites) was attending
college full time; it should be,noted that undergraduates making "normal"
progress would have received the baccalaureate the previous spring. Aver-
aging the proportions over time, we arrive at a eollege entry rate for
Blacks (30.8 percent) that is only slightly lower than that for Whites
tp.72

(32.8 percent).
The proportions of Blacks and Whites in two different age cohorts
who reported having at least some college education are shown in Table 9.
Over the seven years of the March CPS, the rate averages 28 percent
for Blacks and 41 percent for Whites in the younger cohort; and 28 percent
for Blacks and 45 percent for Whites in the 25-29-year-old population.
Taking into account the high school dropout rate, we may conclude that, in
the 1970s, about two in five of the Blacks (39 percent) and about half of
the Whites (47 percent) who were high school graduates enrolled in college.
Another way of examining college entry rates is to estimate the
proportion of Blacks among entering college freshman. Different sources
yield somewhat different estimates: .In the National Longitudinal Study,
Blacks constituted 11.5 percent of 1972 college entrants; according to
1976 data from the Office for Civil Rights, they constituted 12 percent
of the entering freshman class. Figures from the Cooperative,Institu-
tional Research Program (CIRP) are markedly.lower: a mean of 7.6 percent
in the 1971-73 freshman surveys and a mean of 8.7 percgnt :in the 1975-77
freshman surveys. Since Blacks accounted for about 12 percent of the
college-age population (18-22-year-olds) in 1975, and since the NLS and OCR
figures would indicate that their reiresentation among enterina freshmen
was equal to their representation in the population, the more conservative
CIRP estimates make better sense (Astin, 1982, pp. 37-39).
CIRP data also provide information on trends over Orpe in the repre-.
sentation of Blacks among entering freshmen. In the early years of the
freshman survey (1966-69), Blacks constituted less than 6 percent of
first-time, full-time freshmen at the nation's colleges and universities.
The figure jumped from 6.2 percent in 1970 to 7.5 percent in 1971, then
increased steadily to 8.7 percent in 1976, and fluctuated somewhat in the
later years of the decade, rising to 9.2 percent in 19'10. Between 1970
IIt,: 73

6
Table 9
Proportions of Blacks and Whitm -of Different Age CohortsWho Have Attended College
Year of Survey
OverallCollegeEntrybRates1973 1974 1975 1976 1-977 1978 1979
Aces 20-21:a
Blacks 25 29 26 26 32 30 29 39
Whites 41 41 39 42 41 40 41 . 47
Ages 25-29:
Blacks 22 24 28 28 31 35 31
Whites 38 42 43 46 47 48 48
Source: Bureau of the Census, U.S. Department of Commerce, March Current
Population Surveys, 1973-1979.
aFrom 1976 on, data include ages 20-24.
bMean rate adjusted for high school dropout rates (that is, rates show
percentage of high school graduates who attend college).
7 4

-68-
8
and 1980, the proportionate increase was 48 percent.
In absolute terms, the numbers of 18-21-year-old Blacks enrolled in
colle0 increased from 522,000 in 1971 to 665,000 in 1975 (a 27.4 percent
increase, compared with,an 11.7 percent increase in total college enroll-
ments of 18-21-year-olds). Enrollments grew more slowly over the latter
part of the decade, reaching 696,000 for college-age Blacks in 1979 (a.4,6
percent increase from the 1975 figure, compared with an increase of only
0.8 percent for total enrollments). Thus, over the decade (1971-79), bl'ack
enrollments increased by about a third, whereas total enrollments grew
by about an eighth (12.6 percent) (Dearman and PliskO, 1981, p. 148).,
In summary, the college enrollment of Blacks rose during the'1970s--
in absolute numbers, as a proportion of the college-age black population,
and as a propartion of all college enrollments--peaking around 1976 or
1977 and remaining fairly stable after that. To generalize: Of those
Blacks who graduate from high school, about two in five (39-41 percent)
enter college. This rate is about equal to that for Chicanos (40 percent)
but lower than those for Whites (45-47 percent) and Puerto Ricans (about
50 percent). Where Blacks enroll is discussed later in this chapter.
College Completion
According to the National Longitudinal Study, of 1,081 Blacks who
graduated from high school in 1972 and entered college the following fall,
almost one in four (24, percent) had earned the baccaluareate by 1976.
Comparable figures Were 34 percent for Whites, 13 percent for Hispanics,
and 16'percent for American Indians. In addition, about two in five blaCk
college entrants had completed two or more yeas of college by 1976, and
the remainder' .(36 percent) had lompleted less than two years of college.
Since a body of research shows that undergraduates often take longer than
the traditional four years to complete the baccalaureate, it is likely
t

that maRy.of those who had not received the degree by 1976 eventually
received the baccalaureate. Indeed, data from the present study
show that, Of the Blacks who entered colleqejn 1971 and Were followed up
, nine ycars later, in 1980,..about half (50.4 percent; two-thirds of t'hose
initially enrolling in four-year colleges and universities, and one-fourth
of those initially enrolling in two-year colleges) h&c' gradqated.from college.
(See Chapter 5, Table 19).
Other data on college completion rates come from the,Bureau of the
. Census and the U.S. Commission on Civil RightS. Table 10 shows the propor-
tions of 25-29-year-old Blacks who reported, in,the Current Population
Surveys (1973-79) having completed four or more years of conege; comparable
figures are given for Whites. The proportion of Blacks increased from 8
percent in 1973 and 1974 to 11 percent in 1975, then to 13 percent in
1976.and 1977; tn 1978 and 1979, it dropped to 12 percent. The prOportion
of 25-29-year-old Whites completing at least four years of college was
about two-and-a-half timeg.that for Blacks in the early part of the decade;
as late as 1979, Whites were twice as li.kely as Blacks to have earned a baCca-
laureate. Expressing the college completion rate as a percentage-/or the
college entry rate, we may conclude that about two in five of the Blacks
who enroll in colllge (compared with three in five,Whi.tes but only three
in ten Hispanics) actually attain the baccalaureate. Thus, the college
attrition*rate for Blacks is about 60 percent. Of course, Many students
enter college aiming no higher than an associate degree and leave college
after fulfilling these aspirations; such students cannot properly be
regarded as pouts.
The .S. Commtssion on Civil Rights presents data sepa ately by sex
for the,25-29-year-old population. In 1970, 6 percent of black men and
8 percent of black women in this age cohort had completed at least four
years of college; by 1976, the figure had increased.to 11 percent for

1
-70-
Tabl e 10
Proportions of 25-29-Year-0ld Blacks and WhitesWho Have Completed At Least Four Years of College
EstimatedCollege
CompletionYear of Survey Rate Among
1973 1974 1975 1976 1977 1978 1979 College Entrants
Blacks 8 8" 11 13 13 12 12 41.4
Whites 20 22 23 25 25 25 24 58.5
Source: Bureau of the Census, U.S. Department of Commerce, CurrentPopulation Surveys, 1973-1979.
a. 1979 figures expressed as a percentage of all students who entered
college (Table 9).

both sexes. As reported in Chapter 3, the gender difference was much
more pronounced among Whites. In 1976, about one-third (3,4 percent) of
25-29-year-old white men, but only 22 percent of their female counterparts,
had a baccalaureate. Thus,.white men were over three times as likely as
black men, and white women twice as likely as black women, to have
graduaed from college (Commission on Civil Rights, 1978, p. 14).
As Table 11 indicates, in 1975, regional differences in college completion
rates .were slight. Somewhat surprisingly, among 25-34-year-old 8lacks,
those living in the South were slightly more likely than those in the
North and West to have completed at least four years of college, whereas among .
Whites in this age cohort, the opposite was true. Moreover, the college
,
completion rates of Blacks had increased more in the South (from 6 percent
, in 1970 to 12 percent in 1975, an increase of 100 percent) than in other
regions (from 6 percent in 1970 to 10 percent in 1975, a 67 percent increase).
Again, college completion rates were higher for the 25-34-year-old population
than for the age-25-and-older population (Bureau of the Census, 1979).
Data from the National Center on Education Statistics give somewhat
different national figures on the college completion rates of 25-29-year-
ck,,.old Blacks: 10 percent in 1970, 15.2 percent in 1975, and 15.3 percent
1978. Nonetheless, the trend is the same as that reported for college
enrollments: an increase during the early part of the 1970s, followed
by stabilization in the later part of the decade. Thus, Blacks accounted
for 6.4 percent of the baccalaureates awarded in 1975-76 and 6.6 percent
in 1978-79, a negligible increase.
Participation in Graduate and Professional Education
As Table 12 indicates, the gap between Blacks and Whites with respect
to graduate/professional school attendance narrowed somewhat over the
decade of the seventies. In 1973, 1.5 percent of 25-29-year-old Blacks:
78

-72-
Table 11
Regional Differences in the Proportions of Two Age Cohortsof Blacks and Whites with At Least Four Years of College, 11975
Ages 25-34 Age 25 and OverBlacks Whites I Blacks Whites
Total U.S. 11 22 i
i
6 14
South 12 20 ! 6 14
-
North and West 10 23 f 7 15
Source: AdaPted from Bureau of the Census, y.s. Department of Commerce,The Social and Economic Status of the Black Population in the United States:A Historical View, 1790-1978. Current PopulationiReports, Special Studies,
Series P-23, No. 80 (Washington: U.S. Government Printing Office, 1979),
Table 70 and 71.

-73-
Table 12
Proportions of 25-29-Year-Old Blacks and WhitesWho Have Attended Graduate or Professional School
Estimated Rate ofGraduate School
Year of Survey Entry Among Col-
1973 1974 1975 1976 1977 1978 1979 lege Graduatesa
Blacks 1.5 2.4 2.3 4.2 3.9 3.5 4.3 35.8
Whites 7.0 7.4 8.1 8.2 8.6 8.3 8.1 33.8
Source: Current Population Survey Public Use Tapes for Octobersurveys, 1974-1978, provided by the Bureau of the Census, U.S. Department
of Commerce.
a 1979 figures expressed as a percentage of all students who completed .
least four years of college (from Table 10).

-74-
compared with 7 percent of Whites in thrat age group, reported having some
training beyond the baccalaureate; by 1979, the figures were 4.3 percent
of the Blacks and 8.1 percent of the Whites. Thus, in the early years
of the decade, Whites were four times more likely thanTlacks to have
attended professional school, whereas in 1979, they were only twice as
likely. Moreover, comparing the proportions having some advanced training.
with the 'proportions receiving the baccalaureate, we find that black college
graduates have slightly better graduate school entry rates than white college
graduates (see last column).
Table 13 summarizes data on the graduate enrollment and attainment
of Blacks, as compared with Whites. Dividing the number of first-year
graduate enrollments in fall 1976 by the number of baccalaureates awarded
in the previous academic year (1975-76), one arrives at a slightly higher
graduate entry rate for Blacks (70 percent) than for Whites (67.4 percent).
Of course, these rates are to some extent approximations, since not all
students embark on their graduate education directly after receiving-the
baccalaureate. On the other hand, first-year graduate enrollments are
swelled by those who graduated from college in earlier years.
As to graduate degree attainment, Blacks accounted for 6.9 percent of
those receiving master's degrees and 4.4 percent of those receiving doctorates
in-the 1978-79 academic year. Dividing the total number of graduate-degree
recipients by the nuMber of-first-year gradLate enrollments two years earlier,
one arrives at a graduate completion rate of 49.8 percent for Black'and
50.3 percent for Whites. (It would have been preferable to look over_a
longer time span in calculation doctorate attainment rates, since'm st
students take considerably longer than two years to complete their
doctoral work; 'however, the 1978-79 figures were the most recent aliailable.)
In other words, the attrition rate from graduate school is about the same
for Blacks and Whites.(50.percent), though it should be noted that only
81

-75-
-.I
Table 13
Black and White Rarticipation in Graduate Training.
Blacks Whites
,N %
Total
N -
Baccalaureate recipients, 1975-76 59,187 6.7 811,772 37.6 927,085' .100
First-year graduate enrollments;Fal- 1976 41,483 '6:4 547,148 84.3 649,125 100,
Master's degree recipients,1978-79
Doctorate recipients
19,393. 6.9
l',267 4.4
249,051 , 88...8
26,128 90.9
280,482 100
28,774 100
Total graduate:degree recipients,1978-79 20,660 6.7 24,179 89.0 309,256 100.
Vey
Graduate entry 'rate 70.7 67.4 70
Graduate completion rate 49:8 50.3 47.6
Souces: NancyT. Dearman. and Valena W. Plisko, The Condttion of Education,1931 nition (Washington: National Center for Education 'Statistics, 1981); U:S.
. Department of Health, AucatiOn and-Welfare, Racial, Ethnic ,and Sex _EnrollmentData from Institutions of Hwgher Education, Fall 1976 (Washington: Office fclrCivil Rights, 1978).

-76-
about 6 percent of the graduate degrees awarded to Blacks, compared with
9".5 percent of those awarded to Whites, were doctorates. The greater
propensity of Blacks to earn master's degrees may in part be explained
by their con,:entration in the field of education, where a master's degree
is more appropriate than is the case in other fields, especially the
natural sciences. (Black representation fn various major fields is
discussed later in this chapter.)
Precise data on black participation n professional education is
difficult to obtain; Table 14 Suadarizes information for law and the
medical professions (medicine, dentistry, and veterinary medicine).
Blacks constituted 10.2 percent of the 1971 freshmen who named prelaw
as their intended major and 6.7 percent of those planning to major in pre-
medical curricula. In the fall of 1976, they accounted for 4.6 percent
of first-year enrollments in law school and 5.3 percent of first-year
enrollments in medicine, dentistry, and veterinary medicine. In 1978-79,
they received 4.3 percent of the law degrees awarded and 4.5 percent of
the degrees awarded in the medical professtions. Dividing the numbers
receiving degrees from the numbers of firslt-year enrollments, we arrive
at a completion rate of 28 percent for Blcks (and 31 percent for
Whites) in law and of 22 percent for Blac'ks (and 26.5 perrent for
Whites) in medicine, dentistry, and veterinary medicine. In other
words, Blacks were only slightly more liely than Whites to drop out
of law and medical schools.
As to trends over time, CPS data show that the proportions of 25-
29-year-old Blacks who reported havingattended graduate or professional
school rose during the 1970s, from 1.5 percent in 1973 to 4.3 percent in
1979, an increase of 187 percent. Among Whites, the increase over the
same period was only 16 percent. Nonetheless, in 1979, Whites in the
25-29-year-old cohort were almost twice as likely as Blacks to have at
83

-61-
table also shows the proportions of dropouts at younger ages. Up to age 17,
Blacks show no greater propensity to leave school than Whites. By age 18,
however, 20 percent of the Blacks (but cnly 13 percent of the Whites) were
dropouts. The gap between the races widens up to age 23, then stabilizes
for Whites at 18 percent and drops slightly for Blacks from 32 percent of
23-year-olds to 28 percent of 25-year-olds.
The discrepancy between these two data sources illustrates the difficulty
involved in calculating high school completion (or attrition) rates pre-
cisely. One arrives at different estimates depending on the age ranges
considered and the definition of "dropout" used. For instance, according
to additional data from the October Current Population Surveys, in 1978,
73 percent of 20-24-year-old Blacks and 77 percent of 25-29-year-old Blacks
had completed high school (Astin, 1982, p. 30). The reason that the former
figure is lower is that many 20-24-year-old Blacks are probably still in
high school; thus, Piey cahnot properly be called dropouts. Generally speaking,
however, the Irre older people included in the range considered, the lower
the high school completion rate will be, because of generational dif'erences
in length of schooling. Simply put, more recent age cohorts go to school
longer. Further, the older one gets, the less likely one is to return
to school in order to get a :!iploma.
These cohort differences are apparent injable 7: In 1375, over
two-thirds (69 perc,nt) of 25-34-year-old Blacks in the U.S., and,over
four-Fifths (82 percent) of their white counterparts, had completed
high school. When the age range is expanded to include all persons age
25 and older, the high school completion rate drops: to 43 percent for
Blacks and 65 percent for Whites. The gap between the races is much
wider in the latter age cohort than in the former, indicating that
younger Blacks nave had greater opportunities for schooling than their
parents did.
8 4

MN UN M. MI NM uI --111M1 MI NM MN Mil 1111
Table 14
Black and White Representation in Professional Schools
EnteringFreshmenFall 1971
ProfessionalEnrollmentsFall 1976
ProfessionalDegree
Recipients1975-76
Law: 116,066 100.0 35,524 100.0
Blacks 10.2 5,339 4.6 1516 4.3
Whites 83.7 105,260 91,0 32,363 91.8
Medicine, dentistry, and veterinary medicinel 83,601
Blacks 6.7 4,431 5.3 989 4.5
Whites 88.1 74,752 89.2 19,736 89.8
Sources: Cooperative INstitutional Research Program data tapes for 1971 freshmen; U.S. Departmentof He-alfll, rducation and Welfare, Data on Earied Degrees Conferred from Institutions of Hi'gher Educationby Race, Ethnicity, and Sex, Academic Year 1975-76 (Washington: Office for Civil Rights, 1978); U.S.Department of Health, Education and Welfare, Racial, Ethnic and Sex Enrollment Data from Institutionsof Higher Education, Fall 1976 (Washington: Office for Civil Rights, 1978).
86

-78-
least some graduate or professional school education (8.1 percent, versus,
4.3 percent). The proportion of Blacks among doctorate-recipients also
increased over the decade: from 2.6 percent in 1973 to 4.1 percent in 1979;
the peak year was 1977s when Blacks accounted for 4.3 percent of the doctorates
awarded. The proportion of Blacks among first-yeLr medical school enrollments
jumped from 2.7 percent in 1968-69 to 7.2 percent in 1971-72; through the
remainder of the decade, the proportion remained fairly stable, fluctuating
between 6 'and 7 percent. The proportion of Blacks among total law school
/
enrollment rose during the early 1970s, peaked at 4.7 percent in 1976-77, /
then decli/ed slightly (Astin, 1982, pp. 45, 83-85).
In summary, black participation in graduate and professional education
increased in the early years of the decade but has stabilized or declined'
4.-... slightly since the mid-1970s. The graduate entry and graduate completion
rates of Blacks are about the same as those for Whites, but Blacks are
4 somewhat more likely than Whites to get a master's degree and less likely
to attain !..he doctorate.
Conclusion
Looking at trends in the 1970s, we find that the high school dropout
rate of Blacks decreased, while that for Whites increased. Nonetheless,
even in 1979.," Blacks were less likely than Whites to complete high school.
The representation of Blacks among entering freshmen, among baccalaureate-
recipients, and among graduate and professional school enrollments and
degree-recipients rose during the early 1970s, peaking in 1976 or 1977.
Since then, however, little improvement in access or attainment has been
regi'Stered.
Blacks are increasingly underrepresented, relative to their proportion
in the population and relative 'to Whites, at each higher level of the
educational pipeline. Thus, about 72 percent of Blacks (compared with

-79-
83 percent of Whites) complete high school; 29 percent of Blacks-(com-
pdred with 38 percent of Whites) enter college; 12 percent of Blacks
(compared with 23 percent of Whites) earn the baccalaureate; 8 percent of
Blacks (compared with 14 percent of Whites) enter graduate school; and
4 percent of Blaas (compared with 8 percent of Whites) earn a doctorate
or a professional degree. The greatest "leakage" of Blacks occurs during
the high school and the college years; both their high school and their
undergraduate attrition rates are about one-third higher than the rates
for Whites. They are only slightly less likely than Whites to enter
college (40 percent of black, compared with 45 percent of white, high
school grdduates) and slightly more likely to enter advanced-training
(66 percent of black, compared With 60 percent of white, baccalaureate-
recipients). Their attrition from graduate or professional school is
somewhat greater than that of Whites.(50 percent versus 43 percent) (Astin,
1982, p. 51). On the whole, Blacks succeed at a higher rate than the
other three minorities un.der consideration; only 2 percent of Chicanos,
Puerto Ricans and American Indians "survive" in the educational pipeline
through completion of a graduate or professional degree.
Institutional Distribution
Academic institutions differ in their resources and thus in the
quality of the education they offer, Consequently, "a minority student's
future.may depend as much on the kind of institution attended as on
attendance itself" (Astin, 1982, pp: 129-30). If the phrase "equality of
opportunity" is to have any meaning beyond simple access to a postsecon-
dary institution of some kind, then the distributio'ns of minority students--
including Blacks--among higher education institutions should be roughly
the same as that of 'Mites. This section examines the enrollment patterns
of Blacks and considers the implications of these patterns.insofar as
8 8

-80-
'educational attainment is concerned.
In 1978, Blacks constituted 9.4 Percent of all higher educration0
enrollments. Of these more-than-one-million black students, 62 percent
(compared with 59 percent of white students and 53 percent of Higpanic
students) were enrolled on a full-time basis, and 57 percent (compared with
50 percent of white students and 49 percent of Hispanic students) were
women (Dearman .and Plisko, 1980, p. 112).
Table 15 shows the institutional distribution, by level and control,
of black students, comparing it with that of Whites and of all students.
(including nonresident aliens). The proportion of Blacks attending public
institutiOns (79.6 percent) was about the same as that of Whites (77.7
percent but was lower than that of Hispanics (86.9 percent) and American
Indians (87.9 percent).
Given this heavy concentration in the public sector, it is useful to
examine the representation of Blacks in "flagship" uhiversities, defined
as "the most prestigious and influential public institutions" within a
state. Astin (1982) remarks: "Access to such public institutions is of
considerable significance to disadvantaged minorities, since these insti-
tutions frequently serve as conduits to position's of power and influence
within state government and private ineJstry within the state" (p. 132).
Accordingly, in a special analysis undertaken for this project, 65 flag-
ship universities were identified, and black representation in each was
ascertained by comparing the proportion of hlack students in its total
undergraduate population with the proportion of black students among total
higher education enrollments in the state. (For a fuller discussion of
the methodology, see Attin;f.i1982, pp. 132-30..
The results of this analysis Showed that,Blacks were underrepresented
in 56 of these 65 flagship universities. Thq greaiest absolute discrepancies
between actual enrollments and expected enrollments (i.e., the proportioa
89
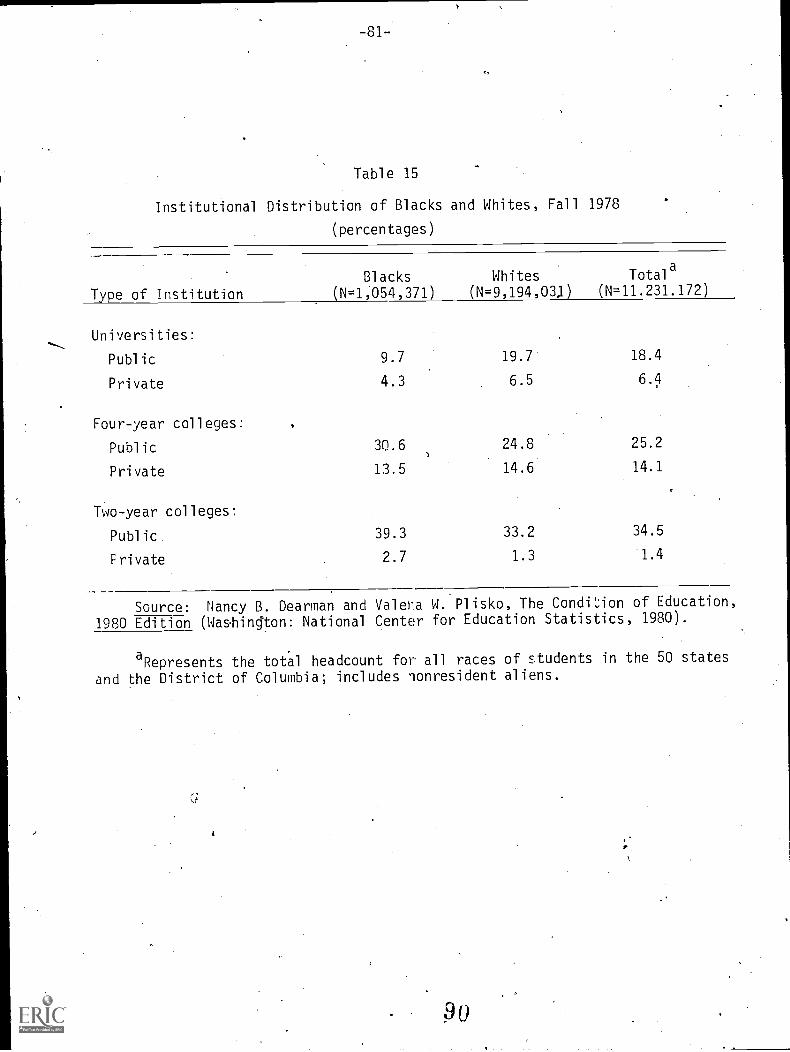
Table 15
Institutional Distribution of Blacks and Whites, Fall
(percentages)
1978
Blacks Whites Totala
Type of Institution (N=1;054,371) (N=9,194,03,1) (N=11.231.172)
Universities:
Public 9.7 19.7 18.4
Private 4.3 6.5 6.4
Four-year colleges:
Public 30.6 24.8 25.2
Private 13.5 14.6 14.1
Two-year colleges:
Public 39.3 33.2 34.5
Frivate 2.7 1.3 1.4
Source: Nancy B. Dearman and Valera W. Plisko, The Condi!;ion of Education,
1980 Edition (Was-hington: National Center for Education Statistics, 1980).
aRepresents the total headcount for all races of students in the 50 states
and the District of Columbia; includes lonresident aliens.

-82-
of Blacks.among all higher education students in the state) occurred at
Mississippi State University (7.6 percent actual enrollment, versus 29.6
percent expected enrollment), Clemson University in South Carolina (1.7
percent versus 22.2 percent), Auburn University in Alabama (1.9 percent
versus 22.3 percent), and Louisiana State University (4.7 percent versus
23.3 percent), all in the Deep South. These institutions would have to
increase their enrollments of Blacks anywhere from fourfold to tenfold
to achieve proportional representation of Blacks. Thus, even with the
desegregation of public colleges in the South, Blacks have still not
achieved equal access.c.11111.
In the Midwest and Northeast, the flagship universities where Blacks
were most severely underrepresented included the University of Illinois
(Urbana), the University of Delaware, the State University of New York at
Stony Brook, Michigan State University, and Pennsylvania State University
In the West, they were most severely underrepresented at two University
of California campuses: Berkeley and Davis
At three of the 65 flagship institutions (the University of Massachusetts,
Amherst campus; the University of Montant2; and the University of North Dakota),
the proportion of Blacks in the undergraduate student body was equal to the
proportion of Blacks among all higher education enrollments in the state.
The greatest overrepresentation of Blacks occured at the main campus of
the University of Pittsburgh, where they accounted for 10.3 percent of
undergraduates; their expected proportion (based on their share to total
Pennsylvania enrollments) was 7.4 percent. The other five flagship uni-
versities at which Blacks were overrepresented (though'usually by no more
than a few tenths of a percent) were the Universlty of Idaho, the Univeristy
of Iowa, the University of Minnesota (Minneapolis-St. Paul campus), the
University oKWashington, and the University of Wyom'ing. It should be
noted that all these institutions are located outside the South, most
91

of them in states with relatively small black populations. The three with
the greatest overrepresentation of Blacks (University of Pittsburgh,
University of Washington, and University of Minnesota) are located in urban
centers. 'It should also be noted that "the median (absolute) degree of .
underrepresentation of Blacks at fifty-six institutions (4.0 perdent) is
about fwty times greater than the median overrepresentation of Blacks
at six institutions (0.1 percent)" (Astin, 1982, p. 134).. By this measure,
then, we may conclude that Blacks have come nowhere close to achieving
adequate representation in the nation's most prestigious public institutions..
Returning to Table 15, we find that Blacks were more likely than
average to be enrolled in public and private two-year colleges and in public
four-year colleges and less likely than average to be enrolled in public
and private universities. The proportion attending private four-year
colleges was only slightly smaller than'the proportion of Whites enrolled
in such institutions.
The importance of the community colleges in providing access to
higher education is demonstrated by the fact that these institutions
enroll the largest share of the total student population (34.5 percent)
as well as of each of the various groups (with the exception of nonresident
aliens) for which the National Center for Educaticn Statistics reports
data. Unfortunately, Community colleges rank at the,bottom of the insti-
tutional status hierarchy in the United States. They generally have fewer
resources (as measured, for instance, by per-student expendfiures for
educational and general purposes, for instruction, and for libraries)
than do other institutional types, and they do not offe'r their students
the advantages of living on campus. As the results of the longitudinal
analyses reported in the next chapter show, "a student's chances of com-
pleting a baccalaureate nrogram are substantially reC,Jd if he or she
initially enrolls at a community college rather than a tour-year insti-
"; 92

-84-
tution" (Astin, 1982, pp. 145-46). Thus, the heavy enrollment of, minority
students in community colleges constitutes a major obstacle to their
educational attainment.
It should be noted, however, that Blacks are somewhat less likely to
suffer the disadvantage of attending a community college than are other
minorities: Only about two in five Blacks (39.3 percent), compared with
over half (53 percent) of Hispanics and American Indians; were enrolled
in public two-year colleges in the fall of 1978. This difference is in
part attributable to the concentration of Hispanics and Indians in states
with well-developed status hierarchies in public higher education and thus
with strong community colleges systems. An equally important factor is
the existence of the historically black colleges (HBCs), which in the past
were instrumental in providing Blacks with access to higher education.
As was pointed out in Chapter 2 (see'Table 1), of the 100 HBCs indenti-
fied as still predominantly black in the fall of 1978 (National Advisory
Committee, 1980), only two were universities, and sixteen were two-year
colleges. 'The remainder were four-year colleges, the majority of them
private institutions. Thus, close to half of the HBCs were private four-
year colleges, and in 1978, they enrolldd one-third of the Blacks attending
private four-year collec,es and 28 perc7t of the Blacks attending HBCs
(see Table 16).
Table 16 shows the institutional 4istribution of Blacks, by race
of institution (historically bladk colleges, new predominantly black
colleges; and other institutions), in the fall of 1978. Clearly, the
NBC's no longer enroll the majority of black college students; in 1978,
they accounted for-16.5 percent of total black enrollments. The new
predominantly black colleges (most of which are public two-year colleges)
accounted (for 12.9 percent of total black enrollments. Generally,
the 1970s saw a proportionate decrease in black enrollment in HBCs, and a
93

Table 16
Institutional Distribution of Blacks, by Race of Institution, Fall 1978
Total
Enrollment
HistoricallyBlack
Colleges
New:PredominantlyBlack Colleges
Other Ti,an
HBCs/NPBCsN %
All institutions: 1,055,964 173,821 100,:0 135,855 100.0 746,288i 100.0
Public 841,113 115,057 66.2 121,249 .89.2 604,807 81.0 -
Private 214,851 58,764 33.8 14,606 10.8 141,481 19.0
Universities: 146,360 13,243, 7.6 133,744 17.9
Public 102,162 5,085 2.9 97,077 13.0
Private 44,825 8,158 4.7 36,667 4.9
Four-year colleges: 466,360 152,895 88.0 26,800 19.7 286,665 38.4
Public 324,310 104,582 60.2 23,880 17.6 195,848 26.2
Private 142,050 48,313 27.8 2,920 2.1 90,817 12.2
Two-year colleges: 442,617* 7,685 4.4 10,9,055 80.3 5,877 43.7
Public 414,641 5,390 3.1 97,369 71.7, 311,882 41.8
Private 27,976 2,295 1.3 11,686 41.8 13,995 1.9.
Source: Adapted from National Advisory Committee on Black Higher Education and Black Co'leges andUniveFsities, Still a Lifeline: The Status of Historically Black Colleges and Universities (Washington:
Department.of Health, Education and Welfare, 1980), Table 4.
959 4

-86-
concomitant increase in black enrollments in NPBCs. Thus, the HBCs are
threatened with enroJlment drops and, faced with severe fiAancial problems,
may be struggling tfor their very'existence.
In yesponse to an inquiry from Secretary of Education Bell,,
the National Advisory Committee (1'981)-recently.dreW up a list of "illustrapye'
examPles. of the uOque services rendered bSi the historically black colleges."0
-By no mean§ exhauStive, the list included the following items:
5
--Tuskegee Institute graduated 85 percent of the Black
veterinarians in 1976 and 1977.
- -Atlanta University graduated 92 percent of Black master's .
Tecipients and 15 percent of all master's:recipients An
biological sciences in Georgia in 1979.
--Howard University graduated almost a quarter of all Bldck
physical scienCes doctorates who earned degrees in 1979.. ".
--Texas Southern University gradudted two-thirds of the
Black lawyers in Texas in 1'177.
-Alabama A & M University and Tuskegee Institute produced
*all_of the master's degrees in architecture/enviionmental
design awarded in Alabama in 1070.
- -Southern University, Baton Rouge, graduated 5 percent of the_
Black engineering baccalaureates awa'rded nationwide in 1979.
--Four Black institutions, Howard and Fisk Universities, More-
house and Oakwood Colleges, produced 259, or 10 percent, of
the total number of Black applicants to medical school in 1979'
. 4
and each supplled more than the 32 which came rom the largest
predominantly white institution.
--Meharry Medical College and Howard Universitogether
produced 22 percent of all Black doctors and 40 percent of
all Black dentists in 1977. (National Advisory Committee, 1981)
96
9
I

-87-
Representation by Field
Blacks (and other minorities) continue to be underrepresented in major
4fields associated with high-status occupations, especialty in the'natural
siences and engineering. Table 17 shows the proportion of Blacks-among all
students in each of'eight major field categories (allied health, arts and
humanities; biological sciEnce, business, education, engineering, physical
science and mathematics; and social science) at four levels of the higher
education pipeline (freshman class,'baccalaureate attainment, master's degiee
attainment, and doctorate attainment). (For a detailed description of.the
major field categories and the data,soui-ces, see Astin, 1982, pp. 52,-57).
Generally speaking--and consistent With the increasing underrepre-
sentation of BlackS at each higher delgree level--the proportion of Blacks
declines steadily from college entry to doctotzate attainment within a giVen
major field of category. For example, Blacks constituted about 7 percent
Sofall 1971 freshmen,naming one of the bioldgical sciences as their intended
major field, apporximately 4 per'Cent of the 1975-76 baccalaureate-recipients
in biological science, approximately,3 percent of the 1978-79 aster's degi-ee
biological
science in 1978-79. This pattern of.steady decllne is repeated in the
fields of business, engineering, and the physical,sciences/mathematits.
At the freshman level, Black3 werecipest represented in social science
()ahere they constituted 13.9 percent of those 1971 entering students who
named one of the social scientes as their probable major), business (12.9
percent), allied health (10.8_percent), and education (10.5 percent).
Four''years later, in 1.975-76, Blacks constituted 6.7 percent of all
baccalaureate-recipients in the eight major field categories covered
in this analysis but only 5 percent or fewer of those receiving a bachelor's
degree,in engineering, phy,sical science/matheffatics, biological science,
arts and hufflanities.,.and allied heath. The proportion of Blacks among

-88
Table 17
Representation of Blacks in Eight Major Fields at pifferent Levels
(percentages)_
Major Field
EnteringFreshmenFall 1971
, Bacca-laureate
.Recipients. 1975-76
Ma'ster'sDegree
Recipients1978-79
,
DoctorateRecipients
. 1978179
Allied health
Arts and humanities
Biological science ,
Business
Educationc
Engineering
Physical science,
.mathematics
Social science
'
. -
10.8
7.8 ....
6.9
12.9
10.5
6.0
, r6.1
13.9
5.1
4.6
4.3-
6.7
9.1-.
a
3.2
4.0
8.4
5.3
3.6
3.4
.4.7
,9.9
2.2
..
2.2'
8.4
3.1
3.5
1.5
2.6
8.6
1.5
1.9
4.7
,'
.Source: Cooperative Institutional Research Program data tapes for- *
1971 freshmen'; U}S. Department of Health, Education and Welfare, Racial, .
. Ethnic and Sex Eni-ollment Data from Institutions .of Higher Education, Fall
1976 (Washington: *ice for Civil Rights, 1978); U.S. Department,of Health,'Educaticin a'nd Welfare; Data on Earned Degrees Conferred from Institution's'of Higher Education by Race, Ethnicity, and Sex, Academic Year 1975-76TWashington: Office for Civil Rights, 1978).
3
'98

-89-
baccalaUreate-recipients in business was the same.as their proportion
amonl.l baccalaureate-recipients in the e'ight fields, and'they were
overrepresented:among those earning baccalaureates in education and social
science. The proportionate loss during the undergraduaty years was
greatest in allied health (where Blacks const4uted 11 percent of:freshmen
.2naming thit choice but only-5 percent of baccalaureate-recipients), business
0
(fr'om 13 percent to 7 pejrcent), and engineering (from 6 Percent tO 3 percerit)..
Of course, this loss dbes not mean that close to half the Blac& naming these
fields as their probable major droped out of\tollege; many of them simply
"defected" fronitheir initial major field choice to'some other'field.
The overall'representation of Blacks at the master's-degree lvel was
slightly higher (7.2 percent).than at,the baccalaureateJevel (6.7 percent ). +3
In other words, Blacks were somewhat more likely than average to eproll in
graduate school and tO earn the master's degree. Thus, it is not surprising
that in two fields--allied health and education--the proportion of.Blacks among
master's degree-recipients was slightly higher than the proportion among
baccalaureate-recipients. The'sharpest.declines occurred in engineerincLand
In physical science/mathematics.
Blacks constituted 4.6 percent of a11 '1978-79 ddetorate-recipients in .
the eight major field cateljories covered. They were best represented among
those earning doctorates in educatiOn (8.6 percent) and social tcience (4.7
percent). However, they accounted for less than 3 percent of doctorate-
recipients in biological sc,ience, business', engineering, and physjcal science/
mathematics.2k
Over the span covered--from freshman preference to doGtorate attainment-.
th'e prop.ortionate loss of Blacks was greatest in tIle,major field,categorjes
, of business, biological s,cience, engineering, allied health, and physical
,science/mathematiCs: It was least severe in education (14re Blacks accounted
for 10.1 percent of all the freshmeri naming this choice, 9.1 percent of those
2. 9

-90-
actually earning a'baccalaureate in education, 9.9 percent of the master'S
degrees awarded, and 8.6 percent,of the doctorates awarded).
Table 18 looks at these data from a different-angle, showing the dis7
tribution of Blacks among the eight major field categories at each level
and comparing it ,W1th the distribution of Whites. Among Blacks,who entered
college in 1571, the mast popular choices were social science (named as a ^
probable,major b34 about one in five black freshmen), business(named by
15.6 percent),,and al-ts and.hugnities (named by 11.5 percefit). Interestingly,
-white freshMen also.Preferred these three fields, though the order was
slightly different: arts and'humanities was their top-ranked choice, followed
by sodial sience and business. Least popular Were biological science
(named as a probable majorby only 2.6 percent of black freshmen, and 3.5
percent of wh'ite freshmen) and physical science/mathematics (3.3 pei-dent of
black freShmen,'5.1 percent of white freshmen).
At the baccalaureate level, the social sciences dominated (accounting
for 29.6 percent of the degrees awarded to Blacks and.22.2 percent of those
awarded to Whifes in 1975-76), followed by education and business.. Again,
the rank-orddring of the'eight fields (that is,°their relative poplflarity)
was thelsame' for both races, and it remains roughly the same at the master's
degree and.doctorete levels, although the proportions of Black's and Whites
inreajor field differ, often drastically. BAcks become more heavily
concentrated in ce-rtain fields, whereas Whites are more evenly distributed
.among the eight fields.
Thus, though only about one in ten black (end white) freshmen said
they planned to major in education, Oproximately onein fair Blacks (but
only 16.7 percent of the Whites) actually.got a baccalaureate in education; -. 0
over half (55.8.-percent) af the black master's-degree-recipients, and
.half of the black doctora'terecipients*(but.only 37.7 percent of the.Whites
earning master's degrees and only 24.2 percent of those,earning doctorates)
1 00 .
4
.4-

Table 18
DistMbution of Blacks and Whites Among Eight Major Fields at Different Levels
(percentages)
4
Mjor Field
EnterTng BaccalapreafeFreshMen Recipients
'Fall 1971 1975-76Blacks, Whites Blacks Whites
Allied,health
Arts and humanities
,
Biological science %
Business
Education.h
Engineering-, ,
Physica,3 science, mathematics.
Social science.
11.2 9.6 ,4.6
11.5 13.6 10.8
4
2.6 3.5 3.9
15.6 11.5 -16.1
41.2 §.9 24.0
4.6 7.1 2.3
3.3 5.1 2.4
. .
19.9 13.3 .29.6
6.0
14.8
.
6.0
16.4
16.7
4.8
4.1
22.2
Master'5Degree
3 Recipients14978.-:79
DoctorateRecipients.1978-79
Blacks. Whites- -Bla.cks, Whites
4.1
4.1
1.1
11.1.
55.8
1.3
_0.8
.
16.8
5.4
8.2'.,
2.4
16.7
37.7
4.0
,. 2.7
13.5
t.
1.6
9.1
3.7
1.4
49.3
2.0
4.8
21.6
2.3
11.8
11.4
25
24.2
'' 5,4
11,.2
20.5
to,...,
I
Sources: Same as Table 17.
101_102 .

. -92-
took the degree in education. Blacks were somewhat more likely than Whites
to earn their.bachelor's, and their master's degree in social science; .
0 about one-fifth of both races eeceived their doctorate in social science.'
rz7
Blacks 6nd whites are about,equally likely to receive-a baccalauneate
business; but 16.7 percent of white master't-degree-eecipients, compared
with 11.1 percent of black master's:-degree-recipients, had majored in
business. (The proportions receiving doctorates in business were small,
since a doctoral degree is not eSsential to a career'in business; the
same is true for allied health, a.field.in which relatively few-doctorates,
are awarded.) Whites were about twice as,likely as Blacks.to earn their
master's degree in arts and humanities (8%2 percent versus 4.1 percent);
but the gap had closed slightly at the doctoral level: (9.1 percent cif
- the Blacks and. 11.8 perTent of the Whites received their doctorate in
arts and humanities)..;
Besilies the heavien concentrationof Blacks in education, as already,
noted, the greatest discrepancies between Blacks and Whites occur in thea
natural sciences and engineering. These discrepancies, already evident
, at the freshman level, become greaty at each higher degree level. Among,
Master's-degree- and doctoral-yecipients, the proportions of Whites in
these fields are from two to three times- greater than the proportions of
BlackS. Moreover, Blacks Wre less likely than were the othen minority
groups under consideration in this study o get advanced degrees in science
and engineering (see Astin, 1982, pp. 64-65). For instance, in 1978-79,
approximately 8 percent of American Indians and 7.percent of Hispanics,
but only 5_percent of Blacks; who attalned the doctorate got their degree
in physical science/mathematics. As freshmen, however, Blacks were more,
likely than were Chicanos, Puerto Ricans, or American Indians to plan on
ffia,j9rs in allied healtli, physical science/mathematics, and.business. Their
greater tendency to major in e ucationlispears at the baccklaureate leVl
103.
1 s
u 1

and persists through the graduate degrees.
'Several factors may be cited to account for the marked preference on.'
Blacks for the field of education and their apparent aversion to tlie
natural sciences andengineering. The firsf is the relatively large.pro-
:pdrtion of womn among black degree-recipients. Thus in 1975-76, women
accOunted for.57 percent-of all the baccalaureates, 62 percentlof all the
master-14 degrees, and 36 percent of all the doctorates awarded to Blacks
(U.S. Department of Health, Education and Welfare, 1978a). Education has
traditionally been regarded as a "female" field, whereas the-sciences and
engineering are.male-typed choices. Secor the existence of the black
colleges may play a role in these preferences. That is, most students
(including Blacks) are aware of the current shortage of teaching jobs
both in higher education and in the lower schools; but Blacks may
assume that teaching jobs will be available to them at the black colleges
and thus may be less hesitant about getting a degree in educatidn than
are those from other racial/ethnic backgrounds, who seek degrees in fields
that will Offer them more job opkion'S. Finally, the relative difficulty
of various, major fields may be a factor. Using data on the college admission
'a test score's and intended major fields of a natiOnal'sample'of high .school
seniors in 1974-75, Astin (1982) found that, for all racial/ethnic groups,
the seniors plOning to major in physical science/mathematics, engineering,
or biological science tended to make much higher scores han thoseplanning
Pothemmajors: "Students With the lowesttest scores. . . .are strongly
oriented toward education'and, to a..lesser extent, business'and the arts
and. humanities" (Astin, 1982, p. 73). Thus, the poor educational prepara-
4,tfon that many Blacks (and other'mino(ities) receive in elementary and .
hih school may limit thee choice of a major (and, ultimately,.of a career)
by leading them o prefer relatively undemanding disciplines.

-94-
Summary,
During the 1970s, as the national economy took a downward turn, there
developed a marked hostility toward minority effortS to achieve equality
in eduEation and employment. This hostility was evident not only among
working-class Whites, fearful of.competition fOr,jobs and other resources,
but also among many affluent and ell-educated Whites, iTacting against
the liberalism of the 1960s. The new conservatism emphasized genetic
theories of intelligence, belief in "pseudomeritocratic" ideas, and the
apparent failure of government interventions to solve social problems.
The Bakke case--which involved a charge of 'reverse discrimination"
directed against the University of California, Davis, medical school ,because
of its special minority admission program-- was a manifestatiOn of this
hostility..
Despite the changing mood of the country, Blacks continued to make
some progress with respect to edUcational attainment, at leat until the
later years of the decade. Th-eir high school attrition rates dropped,. 2
and,their college entry and completion rates increased, as did the pro-
portions continuing on to graduate and professional school and receiving
a6anced degrees. Nonetheless, Blacks.,continue to be'underrepresented at
each higher level of the educational pipeline. In particular, they are
much more likely than Whites to drop out of high school and college. k
Their underrepresentation is not as severe, however, as that of other .
disadvantaged minorities (Chicanos, Puerto Ricans, and,American Indians).
Differences in the educational,attainment of the different racial/
ethnic groups is both reflected in and explained by differehces in their
iN 11enrollment patterns. Thus, Blacks are much less likely than are Whites'
to attend the "flagship" institutions of state public education systems
and private universities. On the other hand, they are less likely than
are Hispanics and American Indians to be enxolled in community colleges
105

-95-
I.
(which general:1Y have negative effects on persistence) and more likely to
4be enrolled in private four-ye& college, many of them historidally
tblack'in'Aitutions. ThoUgh the total Aare of black students enrolled .
in the historically black colleges had dropped to 17,percent in.1478,
these institutions catinue to playa vital role in the higher educatfon
of Blacks. The Adams litigationinitiated by the Legal Defense Fund of
the NAACP to speed up desegregationv'in public education'and opposed by
other bllack organizationsmay ultimately threaten the survival of the
historically black colleges.
Ln addition to being undarrep'resented, relative -CO Whites., at the
higher levels Qf the educational pipeline and in the more prestigious
public and private institutions--Blacks a're underrepresented in'the natural
sciences and engineering and overrepresented in the field of education
and, to a lesser extent, in the social sciences.
4.1*);
11,
SO
(

f
'CHAPTER 5 :
FACTORS INFLUENCING THE EDUCATIONAL DEVELOPMENT OF BLACKS
A major focus of this project on the, status of minorities n higher
education was an analysis of the factort that influ'ence educational attain-
ment and development. An understanding of the personal and environmental
characteristics related to achievement in higher.education is essential
in formulating recommendations that will promote minority progress in
academe and facilitate access to a wide variety of social benefits. It
is particularly imprtant to identify the collegiate settings and experi-
ences astbciated with desirable educational outcomes5 since suchApformar
cdil be used by min rity students and their parents, teach'ers, afid
/counselors in' chaosin a College and by policymakers and educators in
changing the institutional environment and initiating policies and prac-
dyes designed 'to optimize studerrt achievement.
For'the pUrpose of"identifYing.the relevant fLtors, a series of
regression analyses was.Onderiaken, based on.two longitudinal data files.
The first, of 1975 freshmen followed up in 1977, had been created for an
earlier HERI studp of the,-,impact of financial aid on persistence over
the firtt two yea s'of coll;ege (Attin, Cross, and Porter, 1979). The
second file, created skoifically for this.,project on minorities in fligbeT-L,,
education, involved A national sample entering college as freshmen in the
fall of .1971 and followed up nine yeaTt later, in, 1980. Only thosewho
haa initially*aspired to at least,a bacealaureate were included in the
sample for these analyses,
The sample of 1971 p.eshmen originally selected-foi- the 1980 followr'
up inauded all American Indians, Chicanos, and Puerto Ricans; approximately
half of the Blacks, and approxiniatelY 10 percent of the Whites who "had
participated.in the 1971 freshmansurveY of the Cooperative Institutional.
. -
4.
d

-97-
Research Program (CIRP)., Members of this-follOw-up.sample were maped a
four-page questionnaire which cOntained items on their educational and
occupational.experiences and current status. Because the rate of.response
to-this mailed questiorinaire was low (about 20 percentof the tbtal
follow-up sample and about 12 percent of the Blacks), two additional
procedures were employed. First, the names of ndnrespondentsldere given
to a commercial s6rvey research firm (Chilton Research Ser/ices, based in
r Chicago), with a request that it cpntact them by telephone and conduct, .
b
brief interviews which.included critical questions about educational
f. progress. Second, rosters of names of nonrespondents to the questionnaire. a
were sent out to the institutions which the subjects had entered'in 1971.
EaCh institution was asked to provide the following information about each
person listed on the rosteri higllest degree earned, number of years enrolged,
and whether or not a transcript had eve f. been forwarded to one or
oder institutions.
. Approximately 1,300.B1ipcks returned follow-up questionnaire forms
_that could be used in the analyses; this group is termed the "limited
sample." An additional 795 Blacks were contacted by telephone, and-basic
. 'data on 867 more were collected through the insfltutiOnal rosters. The
"extended sample" was Avilded into three "subgroups for purposes df'- . s
analysis: (1) all entra** (which includes the limited sample,:plus all.
those Blacks contacted in the.telephone follow-up); (2) two-year-college% 4
entrants (which "includes only those who entered tww-year c o11dges in 1971
from theliMited sample, from those contacted in the telephone folfow-up,
and from those for whom.the freshman institutions provided information); and11
(3) fair-year-college entrants (which includes only those who entered four-'
year colleges and universities in 1971 from the, limited sample,'from those
contacted in the telephone follow-up, and from thok for whom the freshman
institutions.provided data). The numbers involyed in each bf these sub-
1.08

-98-
samples of Blacks were as follows:
4
1975-77 : 2,779
1971- limited : 1,287
1971-80 extended.
All entrantS :. 2,082
2-year-college entrants: 513
4-year-college entrants: 2,436
The-method of analysis was a two-step multiple regression. For each
. -
outcome investigated, students' input characteristics were controlled
before any attempt was made to'access the effects of, env,ironmental variables.
These initial controls are necessary because studen,ts entering'Aifferent
institutions may not be comparable; that is, different types of colleges
enroll different types of students. In effect, controlling for tudent
input characteristicS statistically "Matches" students entering different
types of institutions gnd thus permits a clearer assessment of how different
college characteristics and experiences affect students.
A variey of outcomes were examined in these longitudinal-analyses.
, For the 1975-77 sample, the three outcomes of interest were persistence,
cumulative grade average, and satisfaction over the first two years of
college. For the 1971-80 limited sample, the outcomes included persistence
(bacCalaureatel completion), undergraduate grade average, satisfaction with
the undergraduate college, graduate attainment, an-d final career choice.
Outcome measures for the 1971-80 extended,sample were persistence among
.two-year-college entrants, persistence among entrants to four-yea colleges
and universities, and general persistence (all-entrants). tFor a fuller
description of the outcome measures, see Astin, 1982, Appendix B.)
D
In the remainder of this chapter, findings are presented first for(2, A
the Student input variables, then for the environmental variables. The
final section summari7.es the results for the three most important dependent
1 9

re
(outcome) vari,b) e .
1
Student Input Factors
The student input variables used in the langitudinal analyses can
be grouped'into four categories: academic preRaration; deigraphic
characterist:Ocs and family background; plans and expectations; and other
student characteristics.
Academic Preparation
Performance in high school was consistenly and strongly7related.to
performanCe in College among Blacks. Thus, high school grade average wa?0
by far the most important predictor of college grade avgrage for both
the 1975-77 sample and the 1971-80 limited sample and of persistence
over the fif-st tWo4years of.college for the 1975277 sample. High school
.grades and rank in graduating class also predicted persistence for the
other samples of Blacks. Other indicators of outstvding performance
in high school as well were positively related to some of-thl outcomes:
For instance, Blacks who had been members of a scholastic honor society
in high school tended to'make good grades and to be satisfied wfth college,
and'those who had won recognition in the National Merit SchOlarship contest
were likely to persist and to pursue careers as lawyers.
Academic aptitude, as measured by scores on standard admissions tests
.(Scholastic Aptitude Test, American College Test), was a significant pre-,.
dictor of persistence and of collqge grades for the 1975-77 sample only;
and the relationship was weak compared with relationship for high
school grades.
Black studeRts who felt that their'high schools had prepared theniwejl
in foreign languages and in mathematics were inclined to feel satisfied
1The detailed results of 'the regresston znalyses can be obtained
at cost by wri,ting to the Higher Educgtion Research Institute,' Graduate Schoolof Education, 405 Hilgard Ave., UCLAr, Los Angeles, CA 90024.
1

-100-
with their colleges at the end of their second undergraduate year. Those
who had a relatively strong background in science (as- wasured by the
number of years of science in high school) tended to make good grades in
college. On the other hand, those who entered college feeling that they
would probably.need tutoring or remedial Work in mathematics were
somewhat likely to drop out:be-fare baccalaureate completiOn_
Good study habits have some bearing on,college performance. For instance,
Blacks who indicated that they had frequently studied in the Jibrary while
in high schootended to persist, whereas those who said that the.y
had,frequently failed to complete a homework assignment on time tended to0
rop out. .For the 1975-77 sample, feeling well prepared in study skills
was as-sociated with.satisfaction, while feeling a need for remediation
in study skills was negatively related to grades.
Finally, Blacks who attended high schools with a high proportion of
minority student's did less well in college than those from high schools where
. the percentage of minority students was relatively low: The proportion of
minority students in the high scheol was negatively related to persistence,
grades, and,satisfaction for the 1971-80 limited sample. Thus, in addition
to any disadvantagement they suffer because of their relatively low socio-
'economic status, many black undergraduates may face special difficulties
in collebe beCause they come from segregated lower schools.
D.graphic Characteristics and 'Family Background
A body of previcius research indicates aconsistent relationship between
gender and college performance, witli women tendina to make better grades than
men, and.this sex difference held true for.the present sample. In addition,
black women were more likely to peoist and to feel satisfied7with the college
experience than Were their male counterparts. r
Age was negatively related to persisteride, with older black students being
111

-101-
more likely to drob.out prior to ba,ccalaureate completion. This tendency
may be related to delayed education rates; that is, studen-LIS. who have fallen
behind their Modal grade in high school and who are thus older than average
at college entry may be moreqikely to get bored or discouraged with their
undergraduat'e studies: On the other hand, being married at the time of
college entry positively predicted both grades and satisfaction for the
1971=80 limited sample.
The higher the parental income, the More likely the black student
was to persist in college; parental income was also.postively associated
with Satisfaction for.the 1975-77 samOle. Since Blacks (and other minorities)
often come from low-income 'backgrounds, this .i-elationship underscores the
difficulties that many minority studOhts face in college, a difficulty that
has apparently not been solved by the financial aid and other special
programs designed to compensate for the disadvantages associated with low
4
socioeconomic status.
Similarly, the better educated the parents, the more likely the black-
student was to persist in college, although ihe mother's educational level
was negatively associated with satisfaction for the 1975-77 sample. Parental .
'occupation was -onfy moderately related to most of the outcomes studied,
however, except for the final career choice of medical professional: Black
students who, at the time of the 1980 follow-up, said they were working
as medical professionals (physicians, dentists, veterinarians, optometrists)
or that they planned such career were more likdy than those with other
career choices to have fathers who were medical professionals.
Plan and Expectations
The 1971 freshman questionnaire asked respondents to indicate their
intended major field of study and their probable career. Not surprisingly,
these initial choices turned out to be the best predictors of career choice
1.1

-102-
nine yeart later. For instances Blacks pursuing careers as engineers in 1980
were likely to have named that career choice as freshmen and those pursuing
careers as allied health professionals were likely to say as freshmen.that they
tplanned to major in an allied health field. Relationships between freshman
plans and the other outcomes investigated are discussed in the section on
evnironmental variables.
Freshmen were also asked to estimate the likelihood of Othei- occurrences
during college,and their expectations proved to be related to actuality.
Thus,,black students who felt they had a very good thance of making at
least'a B av4rage were likely to make good'grades in.college, whereai those
who expected to be satisfied with college were likely to expr:ess satisfaction
later on. Expecting to drop out Of college temporarily or permanently was
negatively related Yo persistence. Among two-year-dollege entrants in the
extended sample,, expecting to transfer to another institution prior to
graduation was related to baccalaureate completion. For the 1976-77 sample,
expecting to need counseling for personal problems was positively i.elated
to persistence but negatively related to satisfaction.
Other Student Characteristics
A number of indeloendent variables involving self-ooncept, attitudes,
goals, and behavior were found to be related to the outcOmes. Tor instance,
Blacks who rated themseives high on academic abiljty anti on public'speaking
ability were likely to make good grades in college. ,It is important to note
tkatthese relationships were significani even after control for other,
variables'indicative of academic ability (e.g., high school grades, aptitude.
test scores). Thus, the student's perception of.being atademically able
is important, independent of actual ability. Moreover,a high self-rating
on drive to achieve was positively related-to peristence and satisfaction,
a high self-rating on popularity was positively related to_ satisfaction, and
//) 113

--103-
IA,
a high self-rating on social self-confidence predicted a ffnal career'choice
of:businessperson.
Blacks who, as freshmen, agreed that the chief benefit of a col, ege
education is to inErease one's earning power were likely to drop out of college.
Agreement with the statement that all pOblic institutions,should have open-
admissiom polic'ies was negatively, related to persistence among.twq:year-
:
college entrants tn the extendeSsample and negatively related to satisfaction
for the 1971410 limited samRle.
Giving high priority to artistic goals *achievement in-the per-
forming rts, creative writing, or the grapWc arts) was negatively related
L-
to persistence and satisfaction for the 1975-77 sample. Perhaps many artis-.
tically inclined blaCk students are initially disappointed with college because
it doesrot give them scope to use their particular talents.
Finally, those Blacks who as freshmen indicated that they were cigarette
smokers were less successful in college-lhan weA non-sffokers; that is,4
smoking Cigarettes was negatively related to persistence, grades, and sat-.
isfaction among Blacks. This relationship, thouglil it may seem trivial and
inexplicable, is consistent with a body ur previous research (Astin, 1977;,,
Dvorak, 1967; Pumroy, 1967) and thus cannot be ignored. Astin (1982) remarks:
the reasons for the association are not clearly understood.Smoking may be a symptom of.rebelliousness and nonconformity--traits directly associated with dropping out. Smoking may'directly interfere with concentration or produce physiologica1.
stress that interferes with the ability to study on to conformto the academic and social demands of college. (p. 97)
-In support of the first of these hypotheses, it should be noted that three
other behavioral items that suggest rebelliousness and nonconformity--,
st'aying up all night, oversleePing and missing a class or appointment-,
and failing to complete a homework assignment on time--were alSo negatively
related to persistence in these analyses. That is, Blacks whoindicated
on the fresman questionnaire that they engaged in these behayiors fre-
11 4

-quently while in high school Were more likely thab average 6 drop oui
before completing the baccalaureate.
Environmental Factors
The en.Vironmental variables used 4n these analyses can,be grouped
'into six categories: institutional type (control, leVel, and race); insti-.
Atutional qualitY; other institutional charactekstics; field of study;
.sources of fina'nce; and freshman residence.
Institutional Type
Table 19 shows the baccalaureate completion rates of Blacks entering
diTierent types of institutions in 1971; for purposes of cbmparisoh, figures
for Whites are also given.' Slightly.over half the Blacks wh%entered college
in 1971,planning to get at least a baccalaureate had actually repceiVed-.
Opachelor's degree by 1980.: this figure is' higher than that for,any other
minority group but slightly lower than that for_Whites. Clearly, those
-Blacks enrolling as freshmen in four-year colleges and univercsities were
substantially moreThkely to'complete c011ege than were those Who initially
enrolled in two-year colleges, and the same difference in completion rates
was observed among Whites (and among other minorities). Moreover,
close to' two-thirds of the Blacks who entered black colleges in 1971 had
earned a baccalaureate by the tiime of the follow-up.
The resulAts of the regression analyses indicate that'these differences
in baccalaureate completion rates are in part attributable to differential
institutional effects: Table shbws the partial correlations between
institutional type and persistence,* after student input variables have
been controlled. Although the effects of some types of institutions are
Oxed, enrolling as a freshman in a public two-year college clearly increases4,
theiplack student's chances of dropping out. As was pointed mit in Chapter 3,
115 60

t
Table 19
Baccalaureate Completion Rates of Blacks and:Whitesat Different Types of InstitutiOnt
(percentagesi
Freshman Institution Blacks Whites
All institutions 50.9 55.6
Universities 68:0 73.3
4.
Four-year colleges 66.6 72.7
Two-year colleges 24.4 29.0
Black in.stitutions ,64.8
Note: Rates based on those who, when they entered collegeass rreshmen in 1971, said they planned to get atleast a bacca-
laureate. ,-
A116

7
-106-
'. Tables 20
Iostitutional Type and Quality,Variables Affectin Persistence Among Blacks
(Partial Correlations A4er Control of Student Input Variables)
Variable
Institutional ty.pe:
Public university,
Private university
Public four-year college
Private four-year college
Public two-year college
Private two-year college
Black college
Institutional quality:
Prestige
Selectivity
Per-stddent expendituresfor educational andgeneral purposes
Tuition
Student-:faculty ratio
1971-801971-80 Extended Sample ,
2-Year 4-Year1975-77 Limited All College CollegeSample Sample Entrants - Entrarits Entrants(N=2,779) (N=1,287) (N=2,082) (N=513) (N=2,436)
-.05
-.04 .04
-.06 -.11 :.06 -.14
.14
-.05 .14
.05 . .09
.08 :09 .09
.08
.02 .04
-.07 -.071
Note: Only significant'(p .05) partial correlations are reported.
11 7
144

n
-107-
the negative impact of,the communitrcoljege op persistence is a particular
.
problem because of the concentration of minorities in such institutions.
Though not shown in the table, attending a private two-year college
was positively associated' with both grades and satisfactlen for the 1975-77
sample; and attending a public-university was negatively related to grades
fdr, the 1971-80 limit'ed sample. Those Blacks' who initially enrolled in
black colleges were likelytO get higher grades than Blacks entering
predomjnuntly white institutions but were less likely to persist in
college and,be satisfied with the college experience.
The freshman institution also had some effects on final career 'choice.'
.Thus, attending a public four-year college was positively related to pyrsuing
a career as an elementary or high school teacher but negatively.related to
pursAng a career in business or nursing. Attendance t a private university
predicted a final career choice of lawyer and attendance at a privatef /
four-year college predicted a final career choice of college teacher.
Institutional Quality
Among the environmental variables used in the longitudinal analyses
were several measures traditionallY dssociated with institutional qualitt;
selectivity.(as measured by the ave'rAge academic ability of entering
freshmen), prestige (an index combining lelectfvity and enisollment size
per-student expenditures Mr educational and general purposes, tuition,0
and student-faculty ratio (which is inversely related to quality). As
Table 20 shows, these quality measures were cdnsistently reldted to
persistence for all entrants and for entrants to fOur-year colleges and
4
universities in the 1971-80 extended sample. For two-year-college entrants,
only selectivity was .positively associated with baccalaureate coMpletion
among Blacks; the other measures had neg.able, or negative but nonsig-
nificant, partial correlations with persistence. According to Astin
118

-108-,
.
(1982) "one obvious reason that qualityshows a different pattZrn of
relationships among.two-year college siudents is that twoyear cOlpges
tend to score very low on most traditionarquality measures and :ilso to
show less variability on,such measures than the four-year colleges" (p. 401).
The quality measures also positively predicted graduate attainmenti4Com-..
pletion or current pursuit of a graduate or professional-degree) among
Blacks. The implidation of these findings is clear:' Blacks (and other
minorities) stand,a better chance bf completing a baccalaureate and.con-
tinuing on for advanced"training if heY initially enroll in an insfitu-*
tion of high quality, as indicated by tradlt'ional quality measures:':
The quality measures had.only scattered relationships with other(.
.
ooutcomes. Attending.a highly selective institution had a strorfg negative
oimpact on grades for the 1975-77 sample; this finding makes sense in view
of the heavy competilion that students face in selective lnstitUtions,
which by definition enroll freshmen of superior acad mic ability. In'
addition, attending'a high-cost.institution was positively relted to a
final career choice of lak.".,yer or medical professional bLit negativqy related
to a final career choice of nurse.
Other Institutional Characteristics,
The location of.the freshman institution had some relationship to the
outcomes investigated. Blacks who entered colleges in the Northeast tended ,
to persist to baccalaureate completion, to.make good grades, and to be
satisfied with their college experience. Astin (1982) suggests that colleges
in tf.e Northeast may be "more sophisticated and progressive in dealing with
the special_ needs of Black students because of the high concentration of
Blacks in that region of the country and the lii)eral tradition of the North-
east in the area of civil rights" (p. 105). Attendihg an institution in
the Far West Oas positively related to persistence among two-year-college

-109-
entrants in the 1971-80 extended sample and to persistence and grade
average among' Blacks in the 1971-80 limited sample. 'Those Blaoks fh6
the 1975-77 sample whO as freshmen entered insti,tutions in the Southeast
tended to make low grades and to be dissatisfied with college.
Blacks in the:101-80 extended samp.le who enrolled in two-year colleges
with a reltively high proportioff of women on the faculty had some tendency
to,drop out. 'For BlaCksjn the 1971-80 liMited sample, attending a Protestant
institution was positively 'associated with grades and with a final career
choice of elljed health professional but negatively associated with sat-.
tsfaction.-- A'final career choice of allied health professional was also
positively related to attending a men's college or an institutiOn with ao.
large proportion of graduate students, whereas a final,career choice of-
engineer was negatively associated with attending.a women's college.
Field of ,Stud.j/
As was indicated earlier, intended major field of study,,as reportedt
on the freshman questionnaire, can be,regarded as'a student input variable,
since it is a characteristic that the freshman brings with him/her.to college.,.
Insofar' as,studentas actually end up majoring in their intended fields, these
variables can also,be regar;ded as environmenAl factors. A body of research. , .
shows that different major fields constitute important subenvironments
within the ovrall institutional envirdnment and that the characteristics
of the subenvironments may have a significant impact on the individuals exposed
to them.
In the present analyses, Blacks who majored.in the natural sciences
or engineering were found to make relatively low grades, whereas thOse
majoring in education, social sciences, or arts and humanities tended to
make relatively high grades. Since other student input variables4
measuring academic ability were controlled, the implication is that
1 2 )
0
thee differential'effects are attributableto differehsces in the
difficulty and riqorousoess of various sub4ects; courses'in the sciences
are simply more demanding academically than Courses- in other.fields.
. In addition, majoring in prelaw Was negatively related to persistence,
majoring in engineering was negatively related to satisfactton, and
majoring in nursing was positively related to satisfaction,,among Blacks
in the 1971-80 limited'sample.
SoUrces olFinance
Respondents to the 1971 freshman questionnaire were asked to indicate
their anticipated.sources of finance for their college educatioo; however,
becabse the list of opt-long wds limited and because most federal financial
aid programs for college students did not begin operation until the mid-1970s,
the results of these analyses are somewhat ambigumis and difficultto
interpret. For instance, reliance on parental or family aid was negatively
associated with satisfaction for the 1975-77 sample, whereas' reHance on
savings was positively a§sociated with grades for he 1971-80 limited sample.
Generally 'speaking, past research has indicated that support from
scholarships and grants has a positive impact on desirable student outcomes,
whereas reliance on loans has a negative impact. Participation in a work-
study program seems to facilitate persistence, especially if the job is
located on campus and provided'that it entails no more than 20 hours per
week. (For a fuller discussion of the impact of financial aid, see Astin,
1982, pp. 108-09).
Freshman Residence
The litergiure on college impact indicates that living on campus (for
instance, in college residence halls) generally has beneficial effects on
students, probably because such residential arrangements enable them to
121

I
become more involved in campus life (see Astin, 1975, 1977; Chickering, 1974).
Findings from the present analyses were somewhat mixed in that those Blacks
u in the 1971-80 sample mho, said that their freshman institution was'located
more than 50 miles from their homes (and who'thua2presumably livea on campus)
were,more likely to persist, whereas those who indicated,that they would
live at Vome du'ring their' freshman year.were more likely to be satisfieda
11.
with college.
Summary
This chapter has presented the findings to emerge from longitudinal
analyses of the effects of various student input and environmental factors
on a number of outcomes. This final section summarizes the results for
the three most important outcome measu e : persistence, gi.ades,.and satis-
faction.-
Blacks are mosi likely to persist in college to baccalaureate com-
pletion if they come from a relatively high socio-economic background,
attend an integrated high school, make good grades in high school,
perform well on aptitude tests, and develop good study habits. Those
who enter college feeling that they will need remedial work ih mathematics
and who_exhibit nonconformist or rebellious behavior in high school
(smoking, staying up all night, oversleeping and missing classe: or appoint-.
ments, fa4ling to complete homework assignments on time) are likely,td drop
out. A freshman career choice of elementary or secondary school teaCher
and an intended major in the social sciences are associated with persistence.
Blacks have a better chance of completing the baccalaureate if they initially
enroll in four-year colleges or universities (rather than community colleges),
especially high-quality institutions located in the Northeast region ofthe
United States.
A high undergraduate grade average in asSociated with making good
1 9r)-r

112-
grades in high §chool, being femle, attending anigrated high'school,
and expecting to make a B'average or higher. Blacks who see themselves
as outstanding in academic ability and public speaking ability are also
likely to perform well jn college. Attending a black college and majoring
in social sciences, education, or arts and humanities are assbciated with
good grades, whereas attending a.highly selective college and majoring
in the natural sciences or engineering are associated with relatively poor
grades.
c\
Blacks who eilter college expecting to be satisfied with the college
experience are likely to be satisfied. The environmental variables associated
with satisfaction:incldde attending a two-yOr college, majoring in
nursing, and living at home.
1 23

. CHAPTER 6
EXPERIENCES AND INSIGHTS OF 10,CK PROFESSIONALS
Blvks who,haye attained advanced degress and taken positions of0 .
influence an'd responsibility can offer valuable insights, based on theii,
own experiences, into those factors in the higher educational system and
. in the general society that contributed to their acHevement or that
constituted obstacles. Two surveys, conducted especially for this study,
produced such data: One.tapped the opinions of minority academic personnel
(faculty, administrators, and counselors), and the other collected,
information on the experiences of recipients of Ford Foundation Graduate
Felfowships. ;This chapter summarizes relevant findings from these two
surveys.
Survey of Minority Academic Personnel
The survey, of minority academic personnel involved two questionnaires:
The first was open-ended in format, the intention being to encourage resp6n-
dents to write fully and freely about their views and experiences. Responses
to.this first questionnafre were coded and categorized to produce the 'second
questionnaire, which used a forced-choice format that was easy to complete-
and score while at the same time offering ffeaningful alternatives:.
Profil.e 'of the Respondents
Of the 311 minority academics who completed the second questionnaire,
73 (23 percent) were Blacks. Of this group, three-fifths (comparel with
70 percent of the total sample) were male. The black respondents tended
to be older and more highly credentialed than did respondents from otber
minority groups. Thus, about two in five (42 percent), compared with
about one-fourth of the total sample (27 percent), were age 46 or over
at the time of the t.irvey; only 37 perckt of the Blacks, compared with
124

54 percent of all,respondents, were age 40 or under. The great majority
of Blacks (84 percent), compared with 66 percent of all respondents, held
a doctoral or professional degree, and the remainier (15 percent) held a
master's degree. With respect to the field of their highest degree, Blacks
were overrepresented in education (42 percent, compared with 36 percent' .
of the total sample) but underrepresented in arts and humanities (15
percent, compared with 19 percent of the total saMple) and natural and
health sciences (15 percent; compared with 18'percent of 'the total sample).
,The,proportion of Blacks with degrees in social sciences (23 percent) was
about the same as the.proportion for all respondents.
0Of the .7,b1ack'respondents, all but three were currently employed in
academic institytions. Consistent with their tendency to be slightly older
than other minority academic personnel, about one-fourth.of the Blacks had
'taken their 'first academic appointment in 100'or earlier; the analogousft
figure for alj respondents was only 10 percent.
6-f. the 70 Blacks currently employed in academic instituVons, over half
(53 percent) worked in institutions where the student body was predominantly
black, and the remainder worked in predominantly white institutions. They
were more likely than any other minority group to be employed iwprivate
institutions (38 percent, compared with 19 pecent.of all respondents);
indeed, about one-fourth (compared with 8.7 percent' of all respondents)'
were employed in private four-year colleges. (As was pointed out in Chap(er 2,
.the majority of historically black institutions are private four-year colleges.)
They were more likely than other minorities to work in'institutions located
in the South (27 percent), the,Great Lakes region (14 percent), and New4
England (12 percent), but less likely, to wore in institutions located in
the plains region (0 percent),.the Southwest (1.4 percent), or the Rocky
MoUntains and Pacific Northwest (1.4 percent).

-115-
Of the 48 black respondents who indicated faculty ranks, over half
(compared with 30 percent of all respondents indicating faculty ranks)
we.re full professors. Of-the 41 black respondents who indicated adminis-
trative orstaff titles, one-fifth were presidents or vice-presidents of
their institutions (compared with 9 percent of all respondents), 15 percent
were deans (compared with 7 percent'of all respondents), 22 percent were
'associate or assistant deans (compared with 8 percent of.all respondents),
and 17 percent were the chairs of academic departments (compared with 11
percent of all respondents). On the other hand, black respondents were less
likely than were those from ether minority groups to be counselors or advisors,
researchers, or nonclerical lower-level administrative staff. That Blacks
tended to hold higher faculty and administrative ranks than did academic
persorinel from other minority gralps is consistent with,their higher average
age and longer period of academic employment.
Personal Experience
About three-fifths of the black respondents indicated that they had
gone to a predominantly black college for their undergraduate work. Asked
about the factors and fxperiences that encouraged them to complete a bacca-
laureate, the overwhelming majority of Blacks (86 percent) mentioned the
encouragement and support of theii- families. This was the top-'ranked factor
among all'respondentsas well, though only 66 percent of the total sample
mentioned it among the top three reasons. The second all:2st frequently mentioned
facilitator of college completion involved educational goals and interests,
mentioned by 58 percent of the Blacks and 47 percent ,of the total sample.
Blacks were more likely than respondents from other minority groups to mention
financial aid (such as grant or scholarship) and opportunity (the avallabiiity
of a conveniently located, low-cost public institution, the availability of
a special program of interest) as influential -'factors. The three top-ranked
126
-116-
factors in graduate school attendance were the same for Blacks as for the
total sample: educational goals and interests (mentioned by 74 percent,of
the Blacks and 60 percent of the total sample), career and economic
goals such as the desire to expend job options and to increase earning
capacity (49 percent of the Blacks, 50 percent of the total sample), and'
receiving financial aid (47 percent of both groups). Blacks were more
likely than others to mention family encouragement and,support as a factor
%
in their,taking adianced training, but less likely to, mention the support
and influence of others (such as co-workers and peers), the desire to
serve their community, or the personal challenge of proving they could do
it.
espondents were also asked to indicate, from a list of nine factors;
those that had constituted prdblems or obstacles at the undergraduate and
graduate level. In virtually ell cases, the proportion of Blacks citing
a given factor as a barrier was smaller than the proportion of each of the
other three minority groups, as well as smaller, than average for the totaf
sample. For instance, financial toncerns constituted 'the most common barrier;
it was mentioned as an undergraduate obstacl'e by 45 percent of the Blacks
(compaved with 60 percent of the tOtal sample) and as a graduate obstacle
by 4g percent of the Blacks (compared with 55 percent of the to-Oal semple).
v/The two Other most frequently_mentioned undergraduate barriers were
'institutional indifference (29 percent of the Blacks, 33 percent of all
'respondents) and faculty compositiom and attitudes (23 percent of the Blacks',
33 percent of all respondents)-. Blacks were markedly,l,ess likely than
others to indicate that their undergraduate progress had been impeded by
lack of educational preparation (12 percent, compared with 27 percent of
the total sample), culture shock (10.percent, compared with 24 prcent of
the total saMple), or family responsibilities (10 percent, compared with.,

-117-
20 percent of the total sample).
At the graduate level, however, Blacks Were somewhat more likely
than average to say they suffered from social isolation and loneliness-
(32 percent, compared with 26 percen:t of the total sample). ,This difference
may be attributable to the fact that many of the black respondents pursued
their undergraduate education at a predominantly black colrege but then
twent to a predominantly white institution for their advanced training.
Thus, not until graduate/professional school did they find themselves
in an alienating environment; the experience was apparently traumatic
for about one-third'of the respondents. Other obstacles at the graduate
level included fatulty Composition and attitudes (mentioned by 30 percent
of the Blacks and 36 percent of the total sample); lack of courses,
curriculum materials, methodological approaches, and research opportunities
that addressed minority concerns (25 percent of the Blacks, 30 percent of
the total sample), and :institutional indifference (22 percent of the Blacks,
23 percent of the total sample). On the other hand, only 8 percent of:the
Blacks, compared with 20 percent of the total sample, said they had problems
with emotional adjustment (lack of 'self-confidence, lack of discipline,
fear of failure).
Another item on-the questionnaire asked respondents whether they faced
problems or had responslbilities "above and beyond those of Anglo professionals
'in comparable positions." Once again,"Blacks were somewhat less likely
than average to cite a given problem or responsibility. Most commonly
mentioned' were the difficulty of gaining the acceptance and respect of
colleagues (36 percent of Blacks, 40 percent of all respondents): the lack .
of real institutional commitment to recruiting and,retaining minority
students and staff (32 percent of Blacks, 42 percent of arli. respondents):
:lack of other minority academic personnel to accomplish áfl that needs
to be done (30 percent of Blacks, 36 percent of all respon.dents), and
128

institutional ethnoCentrism as manifested in ignorance of and insensi-.
tivity to other cultures (30 percent of Blacks, 38 percent of all 'respondents
Opinions on Minority Issues
In addition to gathering information about the past and current experiences
of minority academic personnel, the survey asked respondents.for their
opinions about the obstaqes affecting the educational attainment of young
men and woMen of the respondent's race/ethnicity and about.particular
barriers at different levels of the educational system. Poor educational
preparation and financial problems were viewed as major problems con-
fronting minority young people, both by black respondents and by the
total sample of respondents. Blacks were more likelY. than average to say
that lack of equal access and educational opportunity and inadequate
motivation or direction were problems for young people of their racial
background, but less likely than others to mention demands_and conflicts-
created by.early marriage and multiple roles, low self-Confidence and identity
problems, and lack of survival skills for making it through the educational
system. Inaddition, hey were more likely than average to say that young
q,black men were hamperAd by peer-pressure against academic achievement
and that young black women were hampered by poor guidance and counseling.
At the elerijentary level, the chief obstacles were poor quality of -Leaching
(mentioned by 67 percent of the black respondents and 61 percent of the
total sample); poor educational preparation, dtpecially in basic skills
(66 percent of the Blacks, 50 percent of the total sample); lack of resources.
,..,_ .
in the hoMe (42 percent of the Blacks, 35 percent ofthe total sample),.
and the poor quality oi schools (34 percent of the,Blacks, 30 percent
of the total sample). Black's were more likely than were other minorities
to say that poor educ tional apd career guidance and negative peer
influences were obs acles at the elementarylevel, but less likely than
b .
1 2 !

-119-
average to perceive as problems the lack ()If effective instructional
programs, the lack of transitional programs for students with limited
English-language abilites, or impractical and irrelevant curricula.
The chief obstacles at the high school 'level were poor educational
preparation (mentioned by 62 percent of the Blacks and 58 percent of the
total sample); poor teaching (58 percent of the Blacks, 52 perLent of the
'total sample); and lack of effective educational and career guidance (38
percent of the Blacks, 40 percent of the total sampfe).' Blacks' were more
likely than other minorities to*see poor quality of schools, lack of
resources in the home environment, negative peer influence, and a lack
of effort to challenge, motivate,,and encourage students to do %heir best
as problems for high school students of theft- race/ethnicity. However,
realtivelY-small proportions mentioned the lack of minority teachers as
a problem.
, Top-ranked among perceived barriers at the college level were poor
educational preparation for college work (cited by 73:percent of the
black respondents and 61 percent of all respondents) and financial
difficulties (mentioned by about half of blacks and of the total sample).
Larger-than-average proportions of black respondents viewed lack of pridr
knnwledge about colleges and, its demands and overrepresentation in "soft"
-.fields as obstacles to black undergraduates. Relatively few, however,
believed that a lack of minority faculty or identity Problems and
motivational difficulties constituted problems.
Financial problems were-top-ranked at the graduate level. In addition,
..45 percent of the Blacks (compared with-40 percent of the total sample)
saw the lack of minority faculty at the graduate level as an obstacle to
the educational attainment of their young people. Blacks were more
likely than were other minoritie's to cite indifferent and insensitive
faculty members as an.obstacles, but less likely to mention.identity
1.2".e)

;-120-
problems, low self-esteem, and fear of failure.
Respondents were asked'to indicatemhat particular 'strengths char-
acterized young people of their race/ethnicity; the patterns of characteristics
differed somewhat for the four minority groups. Most cOmmonly mentioned by
black respondents were intelligence and curiosity (57 percent, compared with
47 percent of the total sample), resilience, and flexibility (48 percent,
compared with 34 percent Of the total sample), strongAfamily and community
ties (42 percent, compared with 51 percent of the total sample), and the
AeSire'and determination to succeed (34 percent, compared with 21percent
of the total sample)., klacks were markedly less likely than others to
mention a strong sense of cultural identity (32 percent', compared with 52
percent of the total sample), bilingual skills and abilities,(1.4 percent,
compared with 24 percent of the total sample), or sensitivity to and respect
for others (19 percent, compared with 28 percent of the total sample).
Finally, suggestions for improving higher education institutions.so that
they might better serve minority students Were solicited. The most
frequent recommendation (mentiondd by 51 percent of the black respondents
and 43 percent of the total sample) was that academic institutions hire
and promote, mdre minority faculty, Counselors, and administrators. Second-.
ranked was thsUggestion that minorities should be giyen more encouragement
to attend college (for instance, by the development of outreach and recruit-
ment programs, the establishment of open admissions, and tile improvement
of articulation between community colleges and four-year colleges). Black
respondents were also more likely than others to recommend that higher
education institutions give greater emphasis to quality (36 percent; compared
with 27 percent of all respondents) and develop academic assistance and
tutorial programs (42 percent, compared with 31 percent of all respondents
13i

-121-
Survey.of Ford Fellows
One of the most effective programs in improving,Tigority access to
advanced training has been the Ford Foundation's Graduate Fel:loWship
Program. Since its inception in 1969, over 1,500 minority graduate
students have received awards under this program. To learn more aboute-) P
their characteristics,yerceptions, and experiences, the project staff
mailed out questionnaires to 1,350 Ford,Fellows in the summer of 1980.
Usable questionnaires were retdrned by a total of 630 recipients of
Ford Graduate Fellowships, of whom 286 (45 percent) wer,e Blacks.
Profile of the Respondents
Of the 286 black respondents, 122 (43 percent) had done their under-,
graduate work at predominantly black colleges, and 164 (57 percent) had
attended white institutions as undergraduates. These two groups differed
somewhat in other demographic characteristics. For instance, men constituted
57 percent of those who had attended black collev.s, but only 46 percent
of those who had attended white colleges. In addition, one-third of
those who attended black Golleges, but only 15 percent of those who'had
attended white colleges, were age 40 or older. These differences are
probably explained by the fact that only recently have white institutions
made a concerted effort to recruit black students. Moreover, the college
attendance of womeft\has increased in recent years. Thus, it is not
surprising that the graduates of black colleges tended to be older or that
a larger proportion of women were found in the younger group (i.e., those
who had attended white colleges). The two groups differed as well in
their current residence: ,Black graduates of black colleges were more likely
than any other group to live in the South (37 percent, compared with 12
percent of the total sample) but less likely than average to live in the
West (21 percent, compared with 31 percent of the total sample). Black
132

-122-
graduates of white colleges were more likely to live in the fast (39 percent).
About two-thirds of both groups of Blacks had completed the doctorate
at the time of the survey. Those who had attended black colleges for their
undergraduate work were more likely to haveereceived their highest degree
in physical sciences/mathematics (15 percent, compared with-9 percent
of the graduate of white colleges) or in education (24 percent, mpared'
with 20 percent of the graduate of white colleges), whereas those who
had attended white colleges for their undergraduate work were more likely
to have received.fheir highest degree in-social sciences (31 percent, compared
with 22 pergent of the graduates of black colleges) or psychology (12
percent versus,9 percent). Relative to other minority respondents, Blacks
as a group were more likely than others to have a degree in physical
sciences/mathematics but less likefy to.have a degree in social sciences.
Graduate School Experiences
Respondents to ihe survey were asked which of five factors had been
essential in enabling them to attend their first-choice graduate.institution,
Eighty-seven percent of the Blacks who" had attended predominantly black
institutions and 83 percent of those who had graduated from white colleges
(compared with 87 percent of the total sample) said that the Ford Fellow-
ship itself was essential. The next most commonly mentioned factors
(66 percent bf the' Blacks graduating from black colleges, 60 percent of
those from white colleges) was the availability of a job. Spousal
support was more frequently mentioned by those from black colleges (38
percent) than those from white colleges (23 percent); this may be a function
'of the higher average age of the former. Graduates of white colleges were
more likely to cite student'loans (4 percent, compared with $6 percent
of those from black colleges); perhaps yourfger people who do not have
families to support are wire willing to incur indebtedness. One-third
133

-123-
of both grdups said that family/parental support was-an iMportant factor
in their being able to attend the+r first-choice institution.7
A sl-ightly larger proportion of the black graduates of white colleges
(84 percent) than of the black graduates of black cblleges (72 percent)
had worked while attending graduate school. Otherwise, the two groups of
black respondents did riot differ much with respect -Co work-related factors:
Slightly over half (56 percent) said that thejr job was-related to,their
doctoral program; slightly under half (48 percent) sgid that they worked
in an on-campus location; and 23 percent said that their department required
all graddate students to have assistantship experience.
About.one-fifth of the black respondents said that, in addition
to.the Ford Fellowships, they got 'some kind of financial help (fellow-
ship, schOlarship, assistantship) from their univers3ty; and about
one-fifth got an award from an outside source (national association,
other foundation, gove'rnment agency). Forty-six percent of the black graduates
of white colleges took a student loan during graduate study, compared with
41 percent of the black gradu'ates Of black institutions. The latter
were more likely than the former to get-financial support ft-pm part-time .
'jobs or, from their spouse during,graduate school.
.Several tems on the questionnaire dealt with the departmantal climate ,
and with relationships with faculty and other students during graduate school.
Over three-fifths (63 percent) of those black,Ford Fellows who had attendgd
predominantly black colleges indicated that they had a faculty mentor during
graduate school; one-fburth said that the mentor was a minority-group member.
Of those.black respondents who.had done their undergraduate work at white
colleggs, 57 percent had a faculty mentor, and 22 percent said the mentor
was a minority-group member. Black graduates of black colleges were more
likely than any other group of Ford Fellows to feel that they had received
very good academic advising during graduate school (53 percent, compared
134

-124-
with 32 percent of black graduates of white colleges and 37 percent of
the total tample). Graduates of black,colleges Were alsd more likely
than those blacks who had attended white colleges to' feel that the
faculty stimulated the development of different points of view among
their students, that the fellowship had a positivq impact on.their
relations with faculty, and that there was usually competitiok for grades.
Blacks who had attended white colleges were more likely than their
counterparts from black colleges to say that they usually had the opportunity
to determine their 9wn program and.that the fellowship had a positive
impact on their relationships with other,studentS.*
Asked about problems that had affected the-iv' progress in graduate
school, black Ford Fellows most frequently mentioned finances, though
they were less.likely than other minorities to cite this source of
difficulty. Mof.eover, they were less likely than average to have
difficulty with the oral examinatibn for their doctoral proposal
but somewhat more likely than average to say that the foreign language
requirement constituted a.problem. Those Blacks who had attended
black undergraduate institution§ were more likely than were their counter-
eparts from white. colleges to encounter difficulties connected with writing
skills, course requikements, the qualifying examination, pregnancy, and
family problems. Black. graduates of white colleges were more likely
to encounter difficilties with research methods, research for their
dissertation; and pe blems with spouse.
The aspect of graduate school experience most commonly mentioned at
positive by Blacks who had attended black colleges was interaction with
faculty; whereas those Blacks who had done their undergraduate work at
'white institutions most frequently mentioned personal development. In
addition, about one-fourth mentioned interaction with other students,
15 percent mentioned research 4nd training experiences, and 16 percentt,

Cr,
, -125-
,
mentioned academic freedom and the opportunity to explore new fields.
These proportions are similar to those for the total sample. Blacka
graduates of.white colleges were twice as likely as their counterparts
who had attended black,collegesto say'that the academic resources Of
graduate school constituted a positive experience 00 percent versus
5 percent).
As to the negative aspects of the graduate school experience,, most
frequently mehtione'd were racial discrimination (by 18 percept of the 6
Blacks from white colleges, 20 p'rcent of the Blacks from black colleges,
and 17 percent of the total Sample), departmental politics (15 percent of
0black graduates of white colleges,'11 percentof black graduates of black
colleges, and'14'percent of the total'sample). Black Ford Fellows-1
who had done their undergraduate work at black instituions were more
likely than were their counterparts from white colleges to say fhey
experienced stress and personal uncertainty, personal problems, and4.
difficulty with course requirements; whereas those Blacks from white colleges
more often complained about poor academic advising, but the proportions
were very small.
Current Employment
Four-fifths of the black Ford Fellows who had done their undergraduate
work at predominantly black institutions were employed at the time of the
sdrvey, the majority'of thedr(80 percent) in academic institutiOns. Of
those blacks who Were graduates of white colleges, 73 percent were dmplo9edP
at the time of the survey, 70 percent of them in academic institutions. As
to nonacademic employment, graduates of black colleges were more likely to
be working'in research organizations or elementary and secondary-school
systems, wherea'S black gradautes of white colleges were more likely to be
employed in private-sector organizations, government agencies, or public
, v 4
r')
-126-
service organizations.
Loo,king just at those black Ford Fellows who were employed in academic
institutions, we find that close to half of graduates of black colleges
were currently working in predominantly black institutons, about one-
fifth were employed in white universities, one-fifth in white four-year
colleges, and 9 percent in white two-year colleges. Of those Blacks w4o
had done their undergrauate work in white colleges, on the other hand,
close to two-thirds of those who were academically employed worked in
white universities, 18 percent in white four-year colleges, only 11
percent in black institutions, and 4 percent in.white two-year colleges.
Consistent with their tendency to be older, those who had attended black
colleges were more likely than their counterparts.who'had attended white
colleges to hold full-time positions, to have tenure, and to be associate
or full professors.
Summary
This chapter has presented the findings from two surveys conducted
especially for this project and designed to. elicit the views of minority-
group members who have achieved at high level in the higher education
system.
Black respondents to the survey of minority academic personnel were,
on the average, older than respondents from other minority groups, and were,
more likely to have doctoral or professional degrees. Consistent with these
characteristics, they tended to hold high faculty or administrative ranks,
and about half were emploYed in predominantly black,institutions.
Blacks were somewhat more likely than other minority academic personnel
to attribute their educational attainment to the encouragement of their
families and to their own desire to learn and to gain an educatiu. They
were less likely than others to merition most specific barriers, obstacles,

-127-
and problems, perhaps because many of them attended predominantly black
colleges as undergraduates (59 percent) and were currently employed in
1;
predominantly black institutions (50 percent), where t=hey did not face
the difficulties encountered by minority personnel in a white-dominated
*environment. Lonelinegs ancLsocial isolation were often a problem at
the oraduate level, however.
Like espondents of other minority groups, Blacks were likely
tosee poor educational preparation as a barrier to young people at various
levels-of the educational gystem. In addition, financial difficulties,
inadequate guidance and counseling, and negative peer influences were
viewed as a. problem. However, Blacks do not seem to face the problems
enCountered by Hispanics and American Indians because of their markedly
different cultural heritage, nor do they seem to suffer to the same
extent from low self-esteem or identity problems.
The 286 Blacks who responded to the survey of Ford Graduate Fellow-
ship recipients were divided into two subgroups: those who had done their
undergraduate work at a black institution (43 percent) and those who had
done their undergraduate work at a predominantly white institution. The
former group tended to be older and included a larger proportion of
men and of persons who nrrently resided in the South. In addition, black
Ford Fellows wha had attended black colleges were more likely fo have .
received support from their spouse or to have worked during graduate school
ahd to be cur'rently employed at black institutions. Those who had attended
,white tolleges were more likely to have taken loans to help pay for their
graduate education. Finally, those from black institutions were more likely
to feel satisfied with their relations with faculty and.ttl believe that '
they had re6eived adequate academic advising, wher'ea; :those- fromi3white
institutions'were more likely to be'satisfied with their ielations with
other students and with their autonomy and independence during graduate
1 38

-128-
school: Blacks from both groups tended to feel that the Ford Graduate
-fellowship made It possible for them to attend their first-choice
institution,ir
1 3 44

CHAPTER 7
RECOMMENDATIONS P
On the basis of the findings to emerge from'the study of the higher
'education of disadvantaged minorities, the commission formulated a
number of recommendations intended to increase the numbers of minority
students who enter and complete programs at both the undergraduate and
graduate levels. Those recommendations that have special relevance to
Blacks are abstracted from the commission report (1982) and presented
in this chapter.
Implementation of the Value-Added Model
° Educational institutions should revise their testing and grading
procedures to reflect and enhance the value-added misssion. Such
a revision requires, first, that current normative or relativisticA
measures be replaced by meaTures that assess the learl_ing and
growth of the individual student and, second,,that these measures
be administered periodically to assess the individual's growth overA
time. Results from both local and natiohal tests should.be routinely
fed back to individual students and teachers On an item-by-item
basis. Such revised testing and grading procedures will'better
serve the educational process by providing students; teachers;
institutiops, and policy makers wjth feedback on the nature and
extent of student learning and growth over time. This feedback
will be useful not only in evaluating the effectiveness of educational
programs but also in diagnosing the educational progress and needs
of individual students.
° Educational institutions shoUld use standardized tests for course
placement, evaluation, and counse'ing rather than just for the
selection and screening of students.
140 .

Educational institutions should enlarge their concept of competency
measures to include the assessment'of growth in the noncognitiveA.
realM: personal developeent, interpersonal skills, and self-esteem.
Precollegiate Education
° School counselors and teachers must make specil efforts to,assist
minority students in understanding the relationship between their
education and their future careers and other life options.
° Secondary school conselors and teachers should encourage minority
students to enroll in college preparatory curricula and to'take
courSes in mathematics, languages, natural science, and :social
science.
o Schools should routinely test new and continuing siudents, a's a.
basis for undertaking any remedial efforts that.may be requthed
to correct for the effects of earlier educational Oficiences.
o Secondary school teachers and administrators, working in closek
collaboration with faculty from nearby colleges and universities,\I
should define those intellectual competencies that are crucial
to effective preformance in college and develop tests to measure
such competencies..
o Such test should be administered on a repeated before-anCl-after
basis to assess student progress and program effectiveness, in
accoedance with the value-added model.
o The results of such periodic testing and retesting should be a
major element in the accountability of school teachers and admini-
'strators, and those who are demonstrably effedtive in assisting
minority students should be more adequately compensated.
° The school leadership should make greater efforts to ascertain
and respond to the concerns of minority parents, to involve them
141

. -
A31-
iri the operation of the schools, and to-assist them in understanding
the obiectives, procedures, and practices of the schools.
o The per7student formula now used to alloCate resources among public
elementary ano6secondary schools within a school district should
be revised so thatspredominantly minority schools receive a 'greater
sha're of these resources, some of which shoulCkbe used to develop
rigorous academic programs and,associated support services for their'
stuilents.
o Higher education institutions, schools, and departments concerned
,
with thvtraintng-of elementary.and secondary school teachers should
develop strongerraCademic.programs designed, among other things, to
4
increase the prospectiye teacher's awareness of and sensitivity to
minority cultures and values.
Community Colleges'
o Community colleges should revitalize their transfer function by.
establishing as one option a "transfer-college-within-a-college,"
wherein all students aspiring to a baccalaureate can bp brougbt
together and exposed to the same kinds of intensive educational
and extracurricular experiences commonly available to students
at residental institutions. Funding formulas May have to be
revised to4strengthen the,"college-within-a-college."
o The transfer program staffs of community colleges should work
closely with their counterparts at senior institutions to improve
articulation.
ok
Transfer programs within community colleges should offer inten-.
sive remediation and academic counseling.
o Senior institutions should make more effort to facilitate the
transfer of community college graduates by setting aside an
1.19

-132-
appropriate amount of financial aid for these students and by
offering orientation and counseling -CO meet their special needs.
o In the areas where senior institutions and'community colleges are
located close to one another, young people aspiring to a.baccalau-
reate should be encouraged to enroll in the senior institutions,n.
without prejudice to the continuing opportunity of students in
two-year colleges who may wish to transfer to the senior instfitution.
Academic and Personal Support Services
o Colleges and universities should strenghten their efforts to help
underprepared minority students improve their study habits and develop
their basic skills, by offering tutoring, deveTopmental courcses,
and academic'counselinq. Such efforts will not only benefit the
individual student but will also help institutions financially by
reducing student attrition rates.
o Colleges and universities should provide resources to establish
centers where minority students can meet together for social and
educational exchanges. Such centers can 16romote'a sense of community,-
can help new students learn abOut the system, and can fOster
cultural identity, pride, and strength in such a way that.minority
students will 6e able to challenge as well as to enrich and broaden
. the traditional values of the instiution.
o Minority students them'selves, as well as local minority communities,
should be used as a reSource in.providing leadership and initiatives
for the organization of such academic and personal support services,
and should be.given a responsible role in decisions concerning the
operation and management of mitority services.
o The trustees, administrators, and faculties of colleges and universities
should give strong ind visible support for the development of ethnic
113

-133-
'studies programs, so'that the pertpectives added by s.uch programs.
will be available for th"e'benefit of all students, minority and
majority.
The Myth of Equal Access
o Educational policy makers and planners should revise their trallitional
concept of equality access to take intO account the type, quality,
'and resources of the institution entered.
o The more selective institutionsincluding the "flagship" (major)
universities in each state--should revlew their recruitment and
admissions procedures and where necessary revise them to attract
rand admit more minority studen d/tsz
These,selective institutions should make clear their commitment
to the goal of tncrea"sing minority"enrollMents by providing support
services., presenting minority perspectives in'the curriculum, and
hirin, promoting, and tenuring more minority faculty and admini-r '
strators.
Institytions should reexamine the educational rationale under-
lying traditional selective admissions practices. Ideally, the
predicktive model of admissions should be replated with a model
that focuses on the.institutiOn's value-added mission.
Those institutions using the predicitiye model of admissions shoulda
exaffine the validity of their formulas separately for minorities,
with'special at tention to the possibility that standardized test
scores, which pose a far greater handicap to minorities 'then high
school grades, add little to the prediciton of college performanCe.
Financial Aid
Whenever possible, students with s*ignificant financial need should
114 .

be gi.ven aid in the form of gratits rather thariloans.
o Students should be given enough aid so that they do not need
to work more than half time.
o If students are given enough aid in the form of work-study support,
it uld be packaged in such a way that they work 4ss than half
time and, whenever possible, at on-camps jobs.
o Federal and state legislators and policy makers; should Support
expanded grant and work-stUdy programs.
Graduate and Professional Education
o Federal, state, and 'institutional policy makers should increase
financial aid for minority students at the graduate and profes-
sional levels. In particular, every effort should be made to
expand the number of aSsistantships available to minority
l'graduate students, since this form of aid seems to intensify
student involvement in graduate study, promote professional
deyelopment, and strengthen the bond between student and faculty
mentor.1
° Federal, state,.and private agencies should consider implementing
challenge grant programs, since such prOgrams seem likely to increase
the, amount of finanCial aid available for minority graduate students
as well as to strengthen institutional commitment to the goal of
increasing minority enrollments.
o Graduate faculties should be more sensitive and re4onsive to
the need of minority graduate siudents to have more freedom and
suppart in selecting research topics, chbosing methodologies,
analyzing data, 'and interpreting results, consistent with gradtfte
standards.
o Graduate and professional schools should make special efforts to
. 1'15'

-135-
increase their pools of minority graduate students an,d the presence
. of minority members on their faculties.
°- Federal and state policy makers should give inkreased attention to
the nation's long-term needs for highly skilled,academic, research,
and technical workers. We believe that recent cuts in funding for
advanced training programs based on actual or presumed shoit-term
surpluses of personnel in certain fields are short-sighted, and that
they disproportionately and unfairly reduce the opportunities of
emerging minority scholars to contribute to the general good.
Minority Faculty and Administrators
o Colleges and universities should seek to recruit and ,hire more
minority faculty membei-s, administrators, and student services
personnel and should make every effort to promote and tenure
minority educators. Actions do indeed speak louder than words:
no amount of rhetorical commitment to the principles of equal
opportunity, affirmative action, and pluralism can compensate
for or,justify the current degree of minority underrepresen-i
tation among faculty, administrators, stafT members, and students
in higher education.
o Top administrators should demonstrate their clear and unequivocal *
support of efforts to recruit, hire, promote, and tenure minorities.
In many respects, the administration establishes the campus atmos-
phere or "tone." Thus, a visible personal commitment to change on
the part of one or two senior officials can be critical in
effecting increased minority representation on a campus.
o Colleges and universities sho9,1d make every effort to ensure that
minority faculty members, administrators, and student personnel
workers are represented in 'all types of positions at all levels
116
-136-
within the institution. An unfortunate side effect of the effort
to provide better services to minority students has been the
creation of positions that are perceived and labeled as "minority"
positions; often, minority staff are hired for part-time, short-
term, nontenure-track jobs that are supported by "soft" funds
from outside the institution's line-item budget.. Because they are
isolated from the institutional mainstream, the incdmbents of such
jobs have little opportunity to influence institutional policies
and practices, limited interaction with majorit Y students and
few prospects for advancement.
O Colleges and universities should revise their hiring and promotion
criteria so as to recognize and reward a wider variety of accomplish-
ments and types of service. Although we are certainly not the first
to advocate change in the current review and promotion system,
continued adherence to narrowly defined criteria tends to penalize
minority staff members who, in trying to fulfill the multiple roles
demanded of them, often have little time or energy left to devote
to scholarly research and other traditional functions. Institutions
that)emphasize scholarly activity as a major criterion for promotion
should consider estAlishing a junior faculty, research leave program
for those young faculty members who have taken on special advising
and counseling duties.
O State legislatures and state boards should support administrative
internship programS (such as the current state-funded program in
the University of California and California State Universitysand
College systems) to develop and promote minority and women admini-
strators in public colleges and universities.

-137-C./
Government Programs
The federal government should continue to play it% leadership role
in emphasizing access to higher education for all segments of society.
In particular, federal programs in the areas of student aid, institu-
tional support, and special interventions deserve continued support.
o State and local policy makers, planners, and educators should devote
more attention to the factors that impede full minority participation
in higher education. Federal funding should supplement, not sup-,
plant, state and local efforts to support a range of programs and
interventions responsive to the needs of minority students..
Minority Women
o Colleges and universities should provide counseling services and
personal support groups to assist minority women in.overcoming
.the barriers that result from double standards and sex-role
stereotypes.
o Colleges and.universities should provide science and mathematics
clinics and special courses to help minority women make up for
deficiences in preparation in these subjects, so that these women
will be able to consider a wider range of careers. These efforts
should be additional to particular interventions at the precollege
level.
o Institutions should hire and promote more minority women as faculty,
administrators, and staff.
o Institutions should provide child care seryices on campus.
o Institutions should make an effort to involve those minority women
who live at home more fully in campus life--for example, by providing
dormitory space or other facilities wh6re these women can spend time
interacting with other students:

-138- ,
Data Pertaining to Minorities
° The U.S. Bureau of the Census should hire and train more minority
census takers and researchers to develop and administer questionnaires'
and to analyze and interpret the results of Census Bureau surveys.
° .The officials responsible for public higher education in each state
should institute a comprehensive data system for tracking arid monitoring
the flows of minority and nonminority students through the community,
colleges, baccalaureate-granting institution's, and graduate institutions
in the state.
Evaluation of Minority-Oriented Programs
" Public and private agencies funding minority-oriented programs
should require that all proposals'for such projects include an
evaluation component,ed should earmark a certain fraction of the
P project funds for such evaluation.
° Funding agenjes should view the results of evaluation studies as
a means of improving and strengthenfng programs, and should communi-
cate this view to those involved in operating the programs.
Further Research on Minorities
° Officiaks in private and state agencies, as well as in the federal
government, should give priority to minority-oriented research'in
allocating their increasingly limited funds. These funding sources
should aim to establish a process whereby a (iroad-based,and sustained
cons,ultation about information needs and issues in.higher education
can take place within minority communities. Schojars from these
communities should have a leading role:in efforts to combine imaginatey
the talents and energies presept within these communities for the
purposes of generating research agenda and priorities, carrying out
research, and implement-Mg the action implications flowing from these
1.19

.4
-139- ,
studies.
' The following specific topics should be given much more thorough
study:'
a. factors affecting attrition from secondary school;
b. .the quality of education received in secondary schools with
'predominantly minority enrollments;
c. the effectiveness of programs for improving articplation.
between secondary schools And higher education institutions;
Jactors affecting Minority students' decisions to pursue careers
, in natural sciences and engineeriKg;
e. f,actors affecting minority access to the more prestigioUs institutions;
f. factors -affecting minority attrition from.undergraduate study;- ,
. .,
g. - the impact of alternative .financial ai4 programs on the achieement
and persistehce of minority students; %
h. fadtors Affecting the success of.community College students,w O'
Aspire to the baccalaureete;
i. the importance of sex differenceswithin minority grdups;
j. ways.to develop the talents and skills of adults living in
minority communities who have not had prior access to eacational
opportunitIes. 0
Public and private funding dgencies should give serious consideration '
to providing telatively-long-term support for programmatic research
on minorities. Given the importance of longitudinal research in
furthering our understanding of issues.".related toi the high?er education
of minorities, what is specifically needed is a p iodic longitudinal
study that will make it passible tO monitor the flows of Olinorities
through the educational system and into the workforce, to evallAte-
the impact of special minority-oriented programs, and to identify
educational policies or practices that facilitate or inhibitninority
1 .1

-140-
progress through the system. Such a study should begin during
the secondary school years (or at the latest by college entry)
and should be replicated on a regular basis at least every four
years.
151

- -141-
REFERENCES
Astin, Alexander W. Preventing Students from Dropping Out_ San Ft4ancisco: ,
Jossey-Bass,- 1975.
AstinNjlexahder W. Four Critical Years. San Francisco: Jossey-Bass, 1977.
Astin, Alexander W. Minorities in American Higher Education. San Francisco:
. Jossey-Bass, 1982.
Astin, Helen S., Patr,cia Cross, and Oscar Porter. Student Financial Aidand Persistence in College. Los Angeles: Higher Education ResearchInstitute, 1979.
Atelsek, Frank J., and Irene Gomberg. Estimated Number of Student AidRecipients,.1976-77. Washington: Higher Education Panel, AmericanCouncil on Education, 1977.
Blake, Elias, Jr. "Federal Policy and the Goal of Equal OpPlortunity." In
Beyond Qesegregation: Urgent Issues in the Education of Minorities.New York: College Entrance Examination Board, 1978. Pp. 28-33.
Bowles, Frank, and Frank A. DeCosta. Between Two'Worlds: A Profile ofNegro Higher Education., Sponsored by the Carnegie Commission onHigher Education. New York:. McGraw-Hill Book Co., 1971.
Brown, Frank and Madelon D. Stent. Minorities in U.S. Institutions of
Higher Education. New York: Praeger, 1977.
Bureau of the Ctnsus, U.S. Department of Commerce. The Social and EconomicStatus of the Black Population in the United States: An Historical View,r790-1978. Current Population Reports, Special Studies, Series P-23,
No. 80. Washington: U.S. Government Printing Office, 1979.
Chambers, Fredrick. Black Higher Education in the' Uniied,States: ASelected Bibliography of Negro Higher Education and Hi§toricallyBlack Colleges and Universities., Westport, CN: Greenwood Press, 1978.
Chickering, Arthur. Commuting Versus Resident Students: Overcoming Educa-tional Inequities of Living Off Campus. San Feancisco: JosseY-Bass,
1974.
Commi.ision on the Higher Education of Minorities. Final Report. Los
Angeles: Higher Education Research Institute, 1982.
Dearman, Nancy B., and Valena- W. Plisko. The Condition of Education, 1980
Edition. Washington: National Center for Education Statistics, Depart-
ment of Education, 1980.
152

-142-.
Dearman, Nancy B., and Valena W. Plisko. The Condition ofiEducation, 1981Edition. Washington: National- ,Cuter for Education Statistics, Depart-ment of Education, 1980.
Dvorak, E. J. "A Longitudinal Study of Nonmedical Drug Use Amqng UniversityStudents--A Brief Summary." Raper presented to American Cdllege HealthAssociation, San Francisco, April 1971.
Franklin, John Hope. From Slavery to Freedom: A History of American Negroes,5th edition. New York: Alfred A. Knopf, 1978.
Gill, Gerald R. Meanness Mania: The Changed Mood. Washington: Howard University Press, 1980.
Glover, R.'and Gross, B. ReRort of the National Forum on Learning in theAmertcan-Future: Future Needs and Goals for Adult Learning, 1980-2000.New York: Future Directions for a Learning Society, The College Board,1979.
Grant, W. Vance, and C. George Lind. .Digest of Educational Statistics,1974 Edition.. Washington: National Center for Education Statistics,19757--
Green, Kenneth C. Government Support for Minority Participation in HigherEducation. AAHE/ERIC Research Report. Washington: American Associationfor Higher Education, forthcoming.
Holmes, D. O. The Evolution of the Negro College. New York: Teachers CollegePress, 1934.
Institute for the Study of Edudational Policy. Equal Educational Opportunityfor Blacks in U.S. Higher Education: An Assesment. Washington: HowardUniversity Press, 1976.
Haynes, Leonard L., III. A Critical Examination of the Adams Case: A SourceBook. Washington: Institute for Services to Education, 1978.
Jones, Faustine Childress.- The Changing Mood n America: Eroding Commitment.Washington: Howard University Press, 1977.
Jones, Faustine Childress. "External.Crosscurrents and Internal Diversity:An Assessment of Black Progress, 1960-1980." Daedalus, 110, Spring1981, 71-101.
Kluger, Richard. Simple Justice: The History of Brown v. Board of Educationand Black America's Sti;6-61T1e for Freedom. New York: Alfred A. Knopf,1976.
Louis, James P. "Igtroduction." In Black Higher Education in the UnitedStates: A Selected Bibliography on Negro Higher Education and HistoricallyBlack Colleges and Universities, compiled by Fresirick Chambers. West-
port, CN: Greenwood Press, 1978.
153
21-1(
-143-
Mingle J. R. Black Enrollment in Higher Education: Tren.ds in the Nation
and the South. Atlanta, GA: Southern Regional Education Board, 1978.
Myrdal, Gunnar. An American Dilemma: The Negro Problem and Modern Democracy,New York: Harper and Row, 1944.
, National Advisory Committee on Black Higher Education and Black Colleges...).
"and Universities. Access of Black Americans to Higher Education: How
Open Is the Door? Vashington: Department of Health, Education and
Welfare, 1979. (a)
National Advisory Committee on Black Hi.gher Education and Black Colleges and,Universities. Black Colleges and Universities: An Essential Component.of:a Diverse System of Higher Education. Washington: Department of
flealth, Education and Welfare, 1979. (b)
National Advisory Committee on Black Higher Education and Black Collegesand Universities. Still a Lifeline: The Status of Historically BlackColleges and Universities. Washington: Department of Health, Education
and Welfare, 1980.
Pumroy, D. K. "Cigarette Smoking and Academic Achievement." Journal of
General Psychology, 1967, 77, 31-34.
Stent, Madelon D. "Education for Black Americans on the 25th Anniversary of
the Brown Decision." In The State of Black America, 1979. New York:
National Urban League, 1979. Pp. 79-103.
Turner, W. H., and J. A. Michael. Traditionally Black InWtutions of HigherEducation: Their Identification and Selected Characteristics. Washington:
National Center for Education.Statistics, 1978.
U.S. Commission on .ciwil-Rights. Social Indicators of Equality for Minorities
and Women. Washington: The Commission; 1978.
U.S. Department of Health, Education and Welfare. Data on Earned Degrees
Conferred from Institutions of Higher Education by Race, Ethnicity, and
Sex, Academit Year 1975-76. Washington: Office for Civil Rights, 1978. (a)
U.S. Department of Health, Education and Welfare. Raciaq, Ethnic and Sex
Enrollment Data from Institutions of Higher Education; Fall 1976.
Washington: Office for Civil Rights, 1978. (b) 6
Woodward; C. Vann.. le Strange Career of Jim Crow, 3rd revised edition.New York:-)0xfc7"rd)University Press, 1974.
15 4