document resume integrating science with technical · pdf fileseveral brands of antacid...
TRANSCRIPT

DOCUMENT RESUME
ED 420 493 SE 061 325
AUTHOR Snyder, Larry; Shreckengast, CraigTITLE Integrating Science with Technical and Vocational Areas.PUB DATE 1998-04-16NOTE 53p.; Paper presented at the Annual Meeting of the National
Science Teachers Association (Las Vegas, NV, April 16,1998) -
PUB TYPE Guides Classroom Teacher (052) Speeches/MeetingPapers (150)
EDRS PRICE MF01/PC03 Plus Postage.DESCRIPTORS Chemical Reactions; *Chemistry; Elementary Secondary
Education; Environmental Education; *Integrated Curriculum;Interdisciplinary Approach; *Relevance (Education); ScienceActivities; *Science and Society; Science Education;Teaching Guides; Technical Education; *Vocational Education
ABSTRACTThis guide presents learning activities and lesson plans
that integrate science with technical and vocational areas. Activities andplans are organized under broad headings such as Environmental Science andAcid Rain Research; Criminal Justice, Chemistry, and Narcotics; Children'sEducation and Services; Cosmetology; and Health Professions. Students areable to explore the collection and testing of rainwater, use narcotic testingmodalities, develop a science activity appropriate for elementary-agedchildren, investigate the general characteristics of their own hair, and testseveral brands of antacid tablets for their ability to neutralize excessstomach acid. All activities include procedures, materials lists, graphgrids, and data sheets. (DDR)
********************************************************************************
Reproductions supplied by EDRS are the best that can be madefrom the original document.
********************************************************************************

en
0CNI4:1
1
Integrating Science withTechnical and
Vocational Areas
Presented by
Larry Snyder & Craig Shreckengast
PERMISSION TO REPRODUCE ANDDISSEMINATE THIS MATERIAL HAS
BEEN GRANTED BY
C. Atk2 _
TO THE EDUCATIONAL R RCESINFORMATION CENTER (ERIC)
eko-u
Sussex Technical High SchoolRt. 9, PO Box 351
Georgetown, DE 19947
[email protected]@den.k12.de.us
302-856-0961
Thursday, April 16, 1998NSTA National Convention
Las Vegas, Nevada
U.S. DEPARTMENT OF EDUCATIONOffice of Educational Research and Improvement
EDUCATIONAL RESOURCES INFORMATIONCENTER (ERIC)
This document has been reproduced aseived from the person or organization
originating it.
Minor changes have been made toimprove reproduction quality.
Points of view or opinions stated in thisdocument do not necessarily representofficial OERI position or policy.

4
77dvanced Chemistry and TechnicalIntegration P70.*CiS
Environmental Science: Acid Rain Research
Project Activities:
Students will design a rainfall water collector - The environmental science instructorwill advise you concerning construction of this device.Students will develop a groundwater collector.Students will make measurements of rainfall amounts and pH.
* Students will compile their results and prepare a written reportStudents will present to the Advanced Chemistry and/or the Environmental class theresults of their research.Students will discuss the relevance of pH to their technical area.
Criminal Justice: Chemistry and Narcotics
Project Activities:
Students will use narcotic testing modalities under the direction of the state crime labsupervisor or a local forensic science expert.Students will maintain written records of the tests used to classify different types ofnarcotics.Students will prepare a poster that diagrams one of the following:
1) the classification of narcotics2) the types of chemical tests used to differentiate the different types of narcotics3) the effects of different narcotics
Students will prepare and give an oral presentation dealing with one of the topicsmentioned previously.Students will discuss the relevance of this study to their technical area.
3

Children's Education and Services:
Project Activities:
Students will develop a science activity that is appropriate for elementary agedchildren.Students will review concepts to be taught from elementary teachers that are tied tostate standards.Students will write a lesson plan dealing with the activity.Students will prepare and practice teach the activity to their chemistry and/or technicalclass.Students will visit an elementary school and present the activity to first and/or secondgraders.Students will discuss the relevance of science to their technical area.Students will self-evaluate their project by answering the following questions:
1. What did you learn from this project?2. What did the children learn?3. What was the best part of this project?4. What would you change about this project for next year?
Cosmetology
Project Activities:
Students will investigate the general characteristics of their own hair and test theeffects of various hair cleansing and treating solutions on the properties of hair.Students will work in groups of two, testing the effects of a pH 4 solution, pH 8solution, a permanent wave solution, or a permanent wave + neutralizer solution onthe hair samples.In addition, students will perform similar tests on their own hair.Students will determine the amount lead present in a commercial hair color product.Students will maintain records of experimental results.
a The students will make a presentation of the results to their chemistry class. Thestudents' presentation should include a description of the relationship of pH to thechemistry of hair.
Health Professions
Activities
. * Students will test several brands of antacid tablets for their ability to neutralize excessstomach acid.Students will rank the antacid tablets based on amount of acid neutralized by mass andby cost.
4

Resources:
Criminal Justice: Forensic Science Activities
"Forensic Laboratory Science and Detective Mystery Writing"; Flinn Scientific, Inc.,PO Box 219, Batavia, IL 60510 Telephone Number: 708-879-6900.
Kemtec Educational Corp., 9889 Crescent Park Drive, West Chester, OH 45069makes science kits that can be purchased from science vendors. Sample kits include:Analysis of Fingerprints, Hair, Drugs and Poisons.
Clue Finders, Inc., PO Box 20531, Tampa, FL 33622-0531: BloodDetection Kit.
Various Internet sites are dedicated to Forensic Science Activities.
Criminalistics: An Introduction to Forensic Science, 6th Edition by Richard Saferstein.Prentice Hall, 1998.
Lab Manual Criminalistics: An Introduction to Forensic Science, 6th Edition by RichardSaferstein, Clifton Meloan, and Richard E. James. Prentice Hall, 1998.
Environmental Science
Hach Co., PO Box 389, Loveland, CO 80539 Tel: 1-970-669-3050
Lamotte Company, PO Box 329, Chestertown, MD 21620: Environmental Science TestingKits
Chemistry with CBL by Richard Holmquist, Jack Randall, and Donald L. Volz. VernierSoftware, 8565 S.W. Beaverton-Hillsdale Hwy, Portland, OR 97225-2429.
Access Excellence- Acid Rain Research- Internet Address:http://www.gene.com/ae/AE/AEC/AEF/1995/jones_rain.html
Cosmetology
Chemistry in the Community, American Chemical Society, Kendall-Hunt Publishers.Laboratory Activity: Chemistry of Hair, Section D of Health Unit : Your Risks and Choices.
Practical Chemistry Labs, A Resource Manual. J. Weston Watch Publishers, PO Box 658,Portland, Maine 04104-0658
Health ProfessionsA source for the antacid activity can be found at the following Internet address:
http: //chem. csustan.eduichemistry/chem1002/antacid. htm
5

Title:
Concept:
Objectives:
1. The child will
2. The child will
Materials Needed:
Introduction:
Activity Procedure:
Conclusion:
How child will be involved:
Date used:
Evaluation:
Source:
. Lesson Plan
6
Teacher:
Age Group:
Preparation Required:

TITLE: Homemade Rockets
CONCEPT: Chemical change
OBJECTIVES:1. The child will use small-motor skills.
2. The child will practice eye-hand coordination.
LESSON PLAN
AGE GROUP: elementary level
MATERIALS NEEDED:glass bottle with cork toppaper towelsvinegarbaking soda
INTRODUCTION:1. Introduce the activity.2. Get out materials.3. Explain procedure.4. Demonstrate the activity.
straight pinsscissorstissue paper or ribbonspaint or stickers
ACTIVITY PROCEDURE:1). Decorate the glass bottle with paint or stickers.2). Use straight pins to attach bright strips of paper or
ribbon to the cork.3). Pour 1/2 cup vinegar into the bottle.4). Cut a 5 inch square of paper towel. Pour 2 tablespoons
baking soda into the center. Roll up the paper and twist the ends.5). Get the cork wet.6). Drop the rolled-up paper into the bottle. Quickly put the
cork in the bottle, stand back, and watch your rocket launch.
CONCLUSION:1. Explain concept learned.2. Review procedures.3. Clean-up.
HOW CHILD WILL BE INVOLVED:The child will be able to perform all procedures with teachers
assistance.
EVALUATION:As the vinegar soaks into the paper towel, it mixes with the
baking soda. Baking soda, a chemical called sodium bicarbonate,reacts with vinegar to produce a gas called carbon dioxide. Themolecules in gas move faster and push each other apart. Thiscauses pressure to build up in the rocket and the pressure launchesthe cork rocket.
7
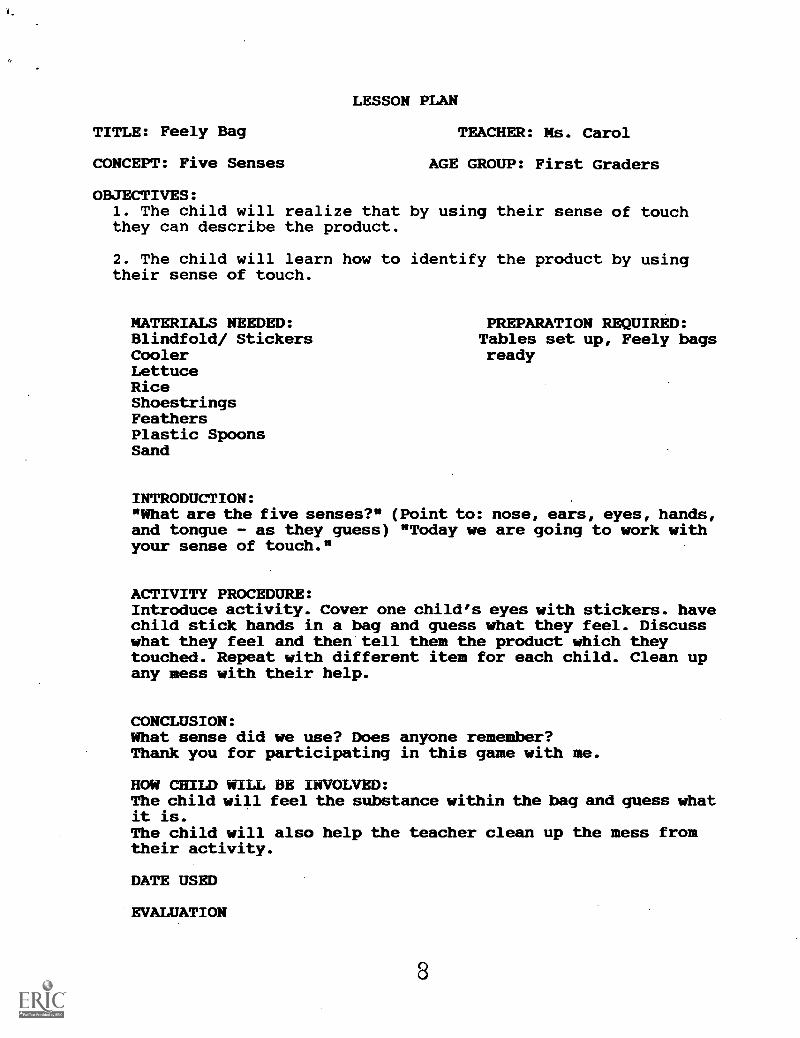
TITLE: Feely Bag
CONCEPT: Five Senses
LESSON PLAN
TEACHER: Ms. Carol
AGE GROUP: First Graders
OBJECTIVES:1. The child will realize that by using their sense of touchthey can describe the product.
2. The child will learn how to identify the product by usingtheir sense of touch.
MATERIALS NEEDED: PREPARATION REQUIRED:Blindfold/ Stickers Tables set up, Feely bagsCooler readyLettuceRiceShoestringsFeathersPlastic SpoonsSand
INTRODUCTION:"What are the five senses?" (Point to: nose, ears, eyes, hands,and tongue - as they guess) "Today we are going to work withyour sense of touch."
ACTIVITY PROCEDURE:Introduce activity. Cover one child's eyes with stickers. havechild stick hands in a bag and guess what they feel. Discusswhat they feel and then tell them the product which theytouched. Repeat with different item for each child. Clean upany mess with their help.
CONCLUSION:What sense did we use? Does anyone remember?Thank you for participating in this game with me.
HOW CHILD WILL BE INVOLVED:The child will feel the substance within the bag and guess whatit is.The child will also help the teacher clean up the mess fromtheir activity.
DATE USED
EVALUATION
3

Who Done It?A Forensic Science Activity
Developers:Larry J. Snyder'Sussex Technical High SchoolGeorgetown, DE
Katerina DukesPlastics Additives ResearchBristol, PA
Acknowledgment: we would to thank the following individuals who providedexpert assistance in development of some of the activities.Jim Miller Julie WilleySupervisor SupervisorRegional Laboratory-Serology Unit Delaware State Police Crime LabBethelehem, PA Dover, DE
Grade Level:10 through 12
Goals:Upon completion of this lesson, the student will:1. Understand the application of chemistry to criminal investigation.2. Work cooperatively in groups, using the scientific process.3. Use real world laboratory techniques as a problem solving tool.4. Solve a crime using deductive reasoning.
Specific Objectives:Upon completion of this lesson, the student will be able to:1. develop latent fingerprints using three different chemical techniques.2. identify possible blood stains through the use of two chemical methods.
Introduction:
The purpose of this exercise is to expose the students to forensic sciencetechniques and problem-solving. Forensic science is the application of scientificprinciples to law. Forensic science includes the disciplines of medicine, geology,chemistry, physics, and biology. This exercise will focus on the application ofchemistry to the identification of fingerprints and to the presumptive testing ofblood.

Special Note for Instructors:
This exercise can comprise a forensic science unit concerning the discussion ofphysical versus chemical methodologies for each problem-solving topic. Lessonsfrom this and other forensic science units can then culminate in a final mock crimescene.
Safety -
Fingerprint Analysis:
Background
Fingerprints, usually found at the scene of a crime, are a very reliable means ofidentification. The activities that follow will focus on the methods used forobtaining latent fingerprints. Fingerprints left at the scene of a crime are classifiedas being visible, plastic, and/or latent. Visible fingerprints are formed by fingerstouching colored materials such as paint, ink, blood, or grease. Plastic fingerprintsare produced by fingers coming in contact with soft materials such as wax, soap,dust, or some other soft surface. Latent fingerprints are those that are caused byperspiration on the ridge impressions of the person's skin. These impressions arecomposed of sweat, glucose, lactic acid, peptide, ammonia, riboflavin, andinorganic salts of potassium and sodium. Different types of surfaces requirespecial techniques to make the fingerprints visible. Fingerprints can be physicallydeveloped by using powders. Usually gray and black colored powders are used.The powders adhere to the oils and perspiration left on a surface. A record of thefingerprint can be made by photographing it or by lifting the impression withScotch tape. The records of the prints are then studied by fingerprint experts inorder to determine the owner of the prints.
The activities that follow will be used to demonstrate some of the chemicaltechniques used to develop latent fingerprints. The advantages and disadvantagesof each technique can be compared at the end of the 3 activities. In addition theadvantages of these chemistries can be compared to the physical methods . Forexample, dusting for fingerprints with powders is time-limiting in that theperspiration tends to dry and thus be less effective as an adsorbent for the powder.
10

Activity 1- Cyanoacrylate Fuming
Cyanoacrylate fuming (also called the super glue method) is a proven and effectivetool for obtaining latent fingerprints. This type of fingerprint development is achemical method. The super glue reacts with fragments of amino acids, fattyacids, and proteins from the latent fingerprint along with moisture from the airmaking a visible white material that adheres to the ridges of the fingerprint. Thefinal result is an impression of the fingerprint:
Materials
Elmer's Wonderbond (or other brand of "superglue")Rit Fabric Dye (recommended colors are Navy Blue and Black)0.5 N sodium hydroxide solution (20g NaOH per one liter of distilled H20)absorbent 100% cotton (gauze, cheesecloth, or cotton balls)a glass microscope slidea polyethylene (HDPE) article (e.g. a square cut from a plastic cup)a polystyrene article (e.g. a section of a styrofoam cup)a dessicator (the finning chamber)
Saturate absorbent cotton (we used 2 x 2 in. gauze) with 0.5 N sodium hydroxide.Allow to thy completely. Apply approximately 2 g of the glue on the surface ofthe NaOH- treated dry pads and immediately place the lid on the dessicator. Within10-15 seconds white fumes will be visible and the fuming will continure forapproximately 1-1.5 minutes. The evidence should be exposed to thecyanoacrylate fumes in the enclosed chamber for at least 30 minutes. The latentprint should develop as a white, sticky material
Activity 2- Ninhydrin
Ninhydrin reacts with amino acids, a substance found in perspiration. Theninhydrin will cause the amino acids to turn purple, providing a visual impressionof the print. The object to be sprayed is usually paper or wood products which donot work well with powders.
Activity 3 - Iodine
Iodine is an element that will vaporize quite readily. It will vaporize from the heatof your hand. The iodine vapor produced will react with fats in fingerprints to
11
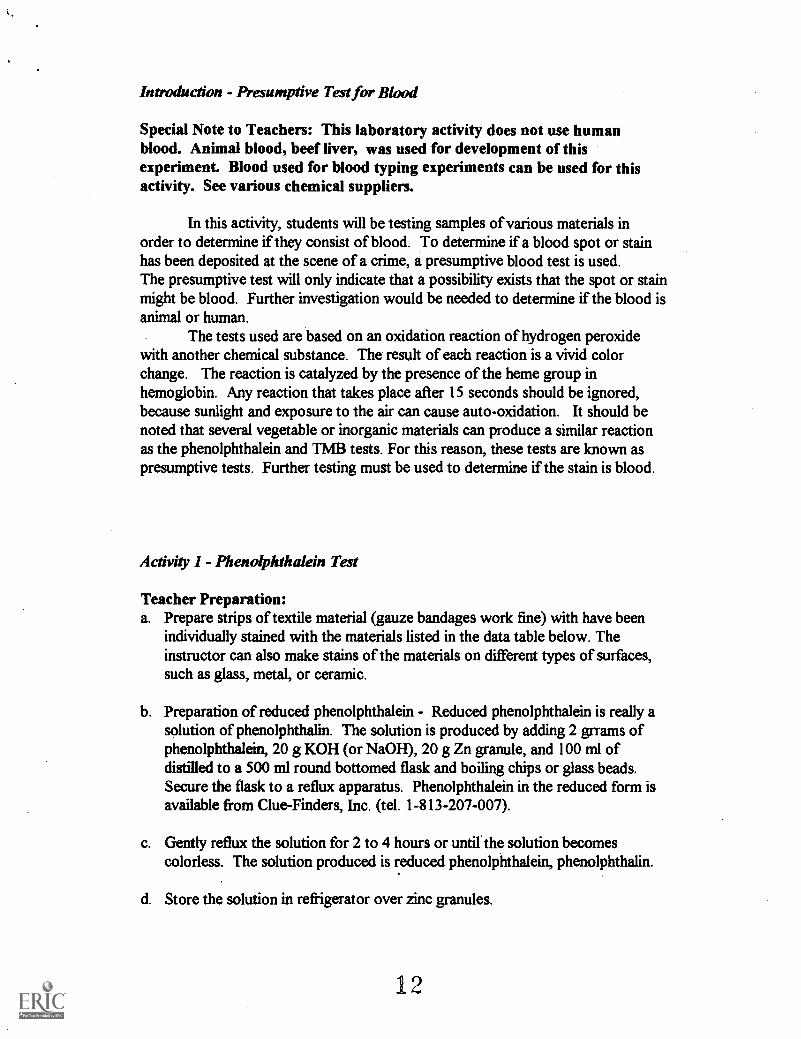
Introduction - Presumptive Test for Blood
Special Note to Teachers: This laboratory activity does not use humanblood. Animal blood, beef liver, was used for development of thisexperiment. Blood used for blood typing experiments can be used for thisactivity. See various chemical suppliers.
In this activity, students will be testing samples of various materials inorder to determine if they consist of blood. To determine if a blood spot or stainhas been deposited at the scene of a crime, a presumptive blood test is used.The presumptive test will only indicate that a possibility exists that the spot or stainmight be blood. Further investigation would be needed to determine if the blood isanimal or human.
The tests used are based on an oxidation reaction of hydrogen peroxidewith another chemical substance. The result of each reaction is a vivid colorchange. The reaction is catalyzed by the presence of the heme group inhemoglobin. Any reaction that takes place after 15 seconds should be ignored,because sunlight and exposure to the air can cause auto-oxidation. It should benoted that several vegetable or inorganic materials can produce a similar reactionas the phenolphthalein and TMB tests. For this reason, these tests are known aspresumptive tests. Further testing must be used to determine if the stain is blood.
Activity 1- Phenolphthalein Test
Teacher Preparation:a. Prepare strips of textile material (gauze bandages work fine) with have been
individually stained with the materials listed in the data table below. Theinstructor can also make stains of the materials on different types of surfaces,such as glass, metal, or ceramic.
b. Preparation of reduced phenolphthalein - Reduced phenolphthalein is really asolution of phenolphthalin. The solution is produced by adding 2 grrams ofphenolphthalein, 20 g KOH (or NaOH), 20 g Zn granule, and 100 ml ofdistilled to a 500 ml round bottomed flask and boiling chips or glass beads.Secure the flask to a reflux apparatus. Phenolphthalein in the reduced form isavailable from Clue-Finders, Inc. (tel. 1-813-207-007).
c. Gently reflux the solution for 2 to 4 hours or until the solution becomescolorless. The solution produced is reduced phenolphthalein, phenolphthalin.
d. Store the solution in refrigerator over zinc granules.
12

e. For each group of students, prepare 3 labeled Beral pipets, one labeled forethyl alcohol, one for phenolphthalein, and one for hydrogen peroxide.
Student Experiment1. Make a small cutting of the blood stain. Place the cutting on a piece of filter
paper.
2. Add 1 drop of ethyl alcohol to the small cutting, followed with 1 drop ofreduced phenolphthalein solution. Note any reaction. Note: Any colorchange during this step should be ignored.
3. Add 1 drop of 3% hydrogen peroXide. Note any color change that takes placewithin 15 seconds. Record your observations in the data table.Teacher Note: A vivid pink color should be interpreted as a positive test.
4. Repeat Steps 1-3 for each of the other stains.
Procedures for materials on hard surfaces:
5. Gently rub the outer edge of a questioned stain with a cotton swab moistenedwith distilled water. Add 1 drop of ethyl alcohol to the swab followed by 1drop of reduced phenolphthalein solution. Note any reaction, however
disregard any color change.
6. Add 1 drop of 3% hydrogen peroxide. Note any color change that takes placewithin 15 seconds. Record your observations in the data table.Teacher Note: A vivid pink color should develop within 15 seconds.
Phenol hthaleinItem Tested/Surface Cutting glan metal ceramic
BloodCoffeeRust
KetchupTea
VanillaCoke or Pepsi
BleachA-1 Sauce
Ink
13

Activity 2 - TMB (tetramethylbenzidine) Test
1. Make a small cutting of the blood stain. Place the cutting on a piece of filterpaper.
2. Add 1 drop of TMB solution to the rubbing and cutting. Note any reaction.Note: Any color change should be ignored.
3. Add 1 drop of 3% hydrogen peroxide. Note any color change that takes placewithin 15 seconds. Record your observations in the data table.
Teacher Note: A vivid blue green color should develop.
4. Repeat steps 1-3 for the other stains.
Procedures for materials on hard surfaces:
5. Gently rub the outer edge of a questioned stain with a cotton swab moistenedwith distilled water. Add 1 drop of TMB. Note any reaction, however
disregard any color change.
6. Add 1 drop of 3% hydrogen peroxide. Note any color change that takes placewithin 15 seconds. Record your observations in the data table.Teacher Note: A vivid blue green color should develop.
Tetrameth lbenzidine, TMBItem Tested/Surface cutting glass metal ceramic
BloodCoffeeRust
KetchupBleachVanilla
Coke or PepsiTea
A-1 SauceInk
14

Discussion and Conclusions:
1. Use the Internet or reference sources to find the types of fingerprint patternsthat are used for identification.
2. Describe the differences between a Superglue print, a ninhydrin exposed print,and a print exposed to iodine.
3. Which of the methods described in #2 are the most effective? What factorsinfluence the effectiveness of the techniques used?
4. Why would substances other than blood produce results similar to blood whenusing the phenolphthalein and TMB tests?
Identification of Glass Fragments by Density
Background:
Broken glass sometimes will be found at the scene of a crime. Broken fragmentsof the glass may have carried away by the person committing the crime. Beingable to identify the glass at the scene may provide valuable physical evidence thatmay help determine who committed the crime.
Activity:
This activity will be used to determine the density of a piece of glass by the waterdisplacement technique. Note: This activity can be used to determine the densityof materials other than glass.
Equipment
Balance: +1- 0.01 g or better which has attachment for determining density bywater displacement.Scissors and String: 1 meterSmall beakers : 250 ml or smallerSmall pieces of glass or other materials (check at a recycling center for assistance)Iron ring and support stand
Method
1. Attach a piece of string to a piece of glass. Attach this combination to the hookon the balance.
2. Weigh the piece of glass in the air to the nearest 0.01 g. Record this amount.
15
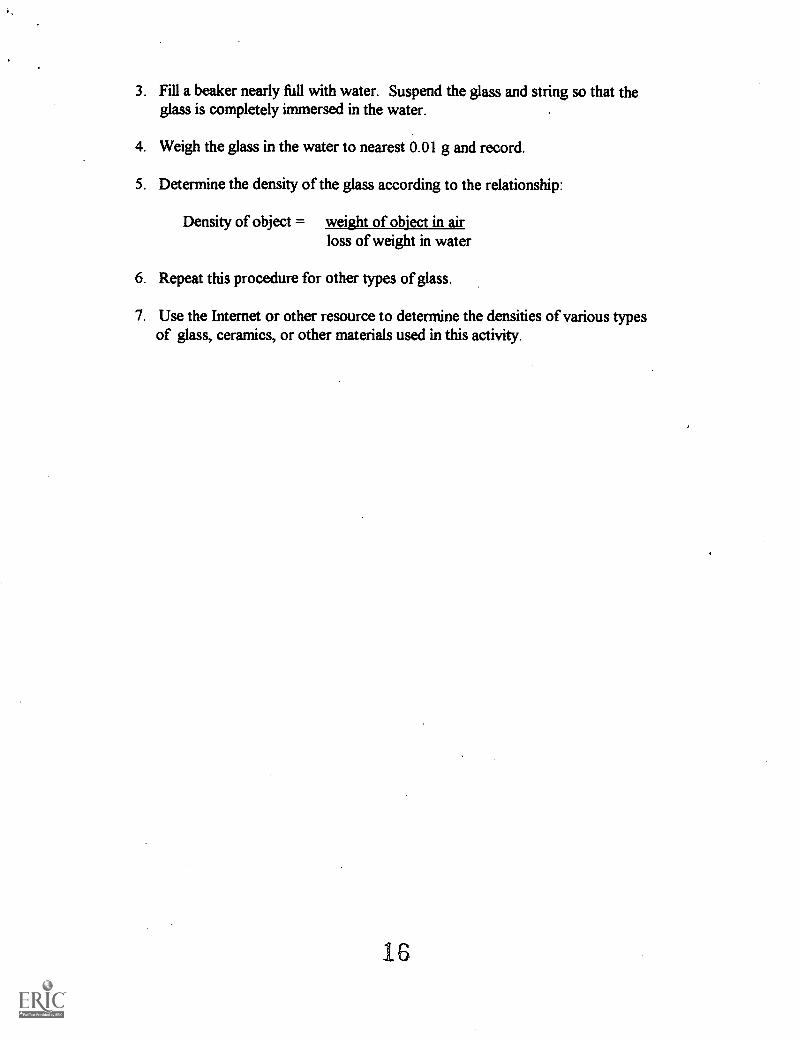
3. Fill a beaker nearly full with water. Suspend the glass and string so that theglass is completely immersed in the water.
4. Weigh the glass in the water to nearest 0.01 g and record.
5. Determine the density of the glass according to the relationship:
Density of object = weight of object in airloss of weight in water
6. Repeat this procedure for other types of glass.
7. Use the Internet or other resource to determine the densities of various typesof glass, ceramics, or other materials used in this activity.
16
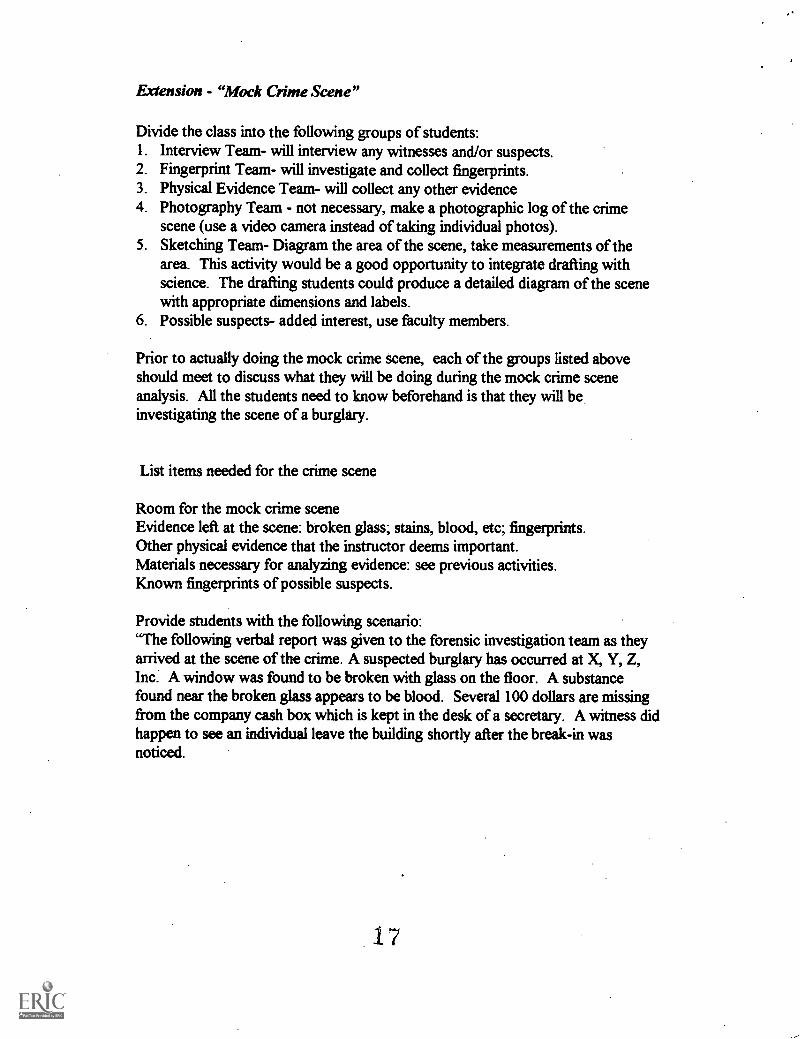
Extension - "Mock Crime Scene"
Divide the class into the following groups of students:1. Interview Team- will interview any witnesses and/or suspects.2. Fingerprint Team- will investigate and collect fingerprints.3. Physical Evidence Team- will collect any other evidence4. Photography Team - not necessary, make a photographic log of the crime
scene (use a video camera instead of taking individual photos).5. Sketching Team- Diagram the area of the scene, take measurements of the
area. This activity would be a good opportunity to integrate drafting withscience. The drafting students could produce a detailed diagram of the scenewith appropriate dimensions and labels.
6. Possible suspects- added interest, use faculty members.
Prior to actually doing the mock crime scene, each of the groups listed aboveshould meet to discuss what they will be doing during the mock crime sceneanalysis. All the students need to know beforehand is that they will beinvestigating the scene of a burglary.
List items needed for the crime scene
Room for the mock crime sceneEvidence left at the scene: broken glass; stains, blood, etc; fingerprints.Other physical evidence that the instructor deems important.Materials necessary for analyzing evidence: see previous activities.Known fingerprints of possible suspects.
Provide students with the following scenario:"The following verbal report was given to the forensic investigation team as theyarrived at the scene of the crime. A suspected burglary has occurred at X, Y, Z,Inc: A window was found to be broken with glass on the floor. A substancefound near the broken glass appears to be blood. Several 100 dollars are missingfrom the company cash box which is kept in the desk of a secretary. A witness didhappen to see an individual leave the building shortly after the break-in wasnoticed.
17
Students:
Working in teams the students will investigate the scene of the crime. Evidenceshould be gathered and interviews conducted. After the evidence has been testedand all suspects interviewed. The members of the teams should work together anddetermine who is the prime suspect. Detailed notes, reports of evidence testresults, and written reports detailing how conclusions were drawn as to the identityof the suspect will be used as an evaluation.
Further Extension:
The information deriVed from the mock crime scene investigation could be used asa basis for a mock trial. This activity could be integrated with a social studiesclass. The evidence and other information could be collected by the chemistryclass and the trial could be conducted in the social studies class. This activity willgive the students the opportunity to make oral presentations, provide examples oftheir writing skills, and reinforce their reasoning and problem solving skills.
References
Kendall, Frank, and Rehn, Burton. Rapid Method of Super Glue FumingApplication for the Development of Latent Fingerprints, pp. 777-780,Journal of Forensic Sciences, Vol. 28, No. 3, July, 1983.
Pennsylvania State Police. PSP Serology Procedures Manual, pp.2-3 through2-13, 1996.
Saferstein, Richard. Criminalisitics- An Introduction to Forensic Science (6thedition). Upper Saddle River: Prentice Hall, 1997.
18

The Neutalizing Ability of Antacid Tablets Page 1 of 3
h ttp: //c C. Cs L4S+DM &LA AviisAiv/c4eth /0,0?/aNhic id, At/The Neutralizing Ability of Antacid Tablets
Purpose: In this experiment you will measure the amount of stomach acid consumed (or neutralized)by various antacid tablets. If you have a favorite one, bring a package to the lab (one color only).
Procedure: This experiment involves several steps. First the tablet is dissolved and an excess of acidof known concentration is added to the tablet. The solution is then briefly heated to insure that all ofthe antacid reacts. Finally, the remaining unreacted acid is titrated with base (NaOH) to determine theamount left over and hence, the amount that reacted with the tablet. The chemical reaction whichoccurs is:
NaOH + HC1 > NaCI + H2O
A detailed description of the individual steps in the analysis follows.
Preparation of Sample:
1. Weigh an antacid tablet and transfer it to a 250 ml erlenmeyer, flask. Record the weight of thetablets you are going to analyze.
2. Add 50.0 ml of hydrochloric acid solution (labeled 0.50 M) with a pipette to the flaskcontaining the tablet.
3. If the tablet does not dissolve readily, cover the flask with a watch glass and boil gently for5-10 minutes on a hotplate. Set it aside to cool. While it's cooling, weigh out another tablet ofthe same brand and proceed through steps 1 and 2.
The Titration:
1. Check out a buret from the Stockroom. Test it to see if it is clean by filling with distilled waterand letting it drain. If the water does not drain from the walls, wash carefully ($$$) with warm,soapy water using a buret brush. Rinse several times with distilled water.
2. Using a funnel fill the buret with base (sodium hydroxide) solution (labeled 0.5 M) to justabove the top line.

The Neutalizing Ability of Antacid Tablets Page 2 of 3
base
acid + tablet+ indicator
3. Allow it to drain to just below the top line. If air bubbles remain in the tip, drain more out. Ifthey still are in the tip, your instructor- -who is lurking nearby, will be happy to get them out foryou.
4. Add several drops of the indicator, thymol blue, to the cooled solution of antacid tabletcontaining unreacted acid. The solution will be red.
5. Read the initial volume of the buret using the graduations on the buret and bottom of themeniscus. It is often easiest to put a white piece of paper behind the buret to sight against.Record this as the initial volume for the first trial in your notebook in the results section.
6. Add a small amount (less than one milliliter) of the sodium hydroxide to the flask. A spot ofcolorless solution may appear where the drops hit. With swirling, this area will disappear. Theidea is to add the exact amount of the base solution needed to cause the solution in the beakerto change from red to very pale yellow and stay yellow for 15 seconds or more. This is harderthan it may sound. The color change should be observed with the addition of only one or twodrops of the base solution and you can't go back if you add too much. Watch the solution in theflask. As it gets more difficult to get rid of the pinkish color when you swirl the flask, addsmaller amounts. Ideally, you should be adding it dropwise when you reach the point wherecolor finally changes from red to yellow (endpoint). Patience! The first time is the hardest.Once you know how much it takes for a tablet, you can add slightly less in the next trial andadd the last milliliter or so dropwise and you won't go past the endpoint. It may be necessary torefill the buret once.
7. Read and record the final volume. Calculate the total volume you used by subtracting the initialfrom the final volume. Record this, too, in your notebook.
8. As time permits, do one or two more trials. They should, as you practice, agree to within about0.20 ml.
Wastes: The HCl and NaOH used in this experiment are weak. They can be put into the sink with thewater running. The finished titrations are not hazardous and can also be rinsed down the drain.
The Calculations: The number of grams of stomach acid that is neutralized can be calculated usingthe expression:
20

The Neutalizing Ability of Antacid Tablets Page 3 of 3
grams stomach acid per tablet = 10[ 25.0 (ml base)(.50) ]
If, for example, it took 8.0 ml of base to titrate the sample, then
grams stomach acid = 10[ (25.0) - 8.0 (.50) = 210 g
Record the value for each of your samples and the average value with your results.
Conclusion: Does your tablet neutralize 47 times its weight in stomach acid? You can answer thisquestion for your conclusion by dividing the mass of stomach acid by the mass of the individual tablet.
21
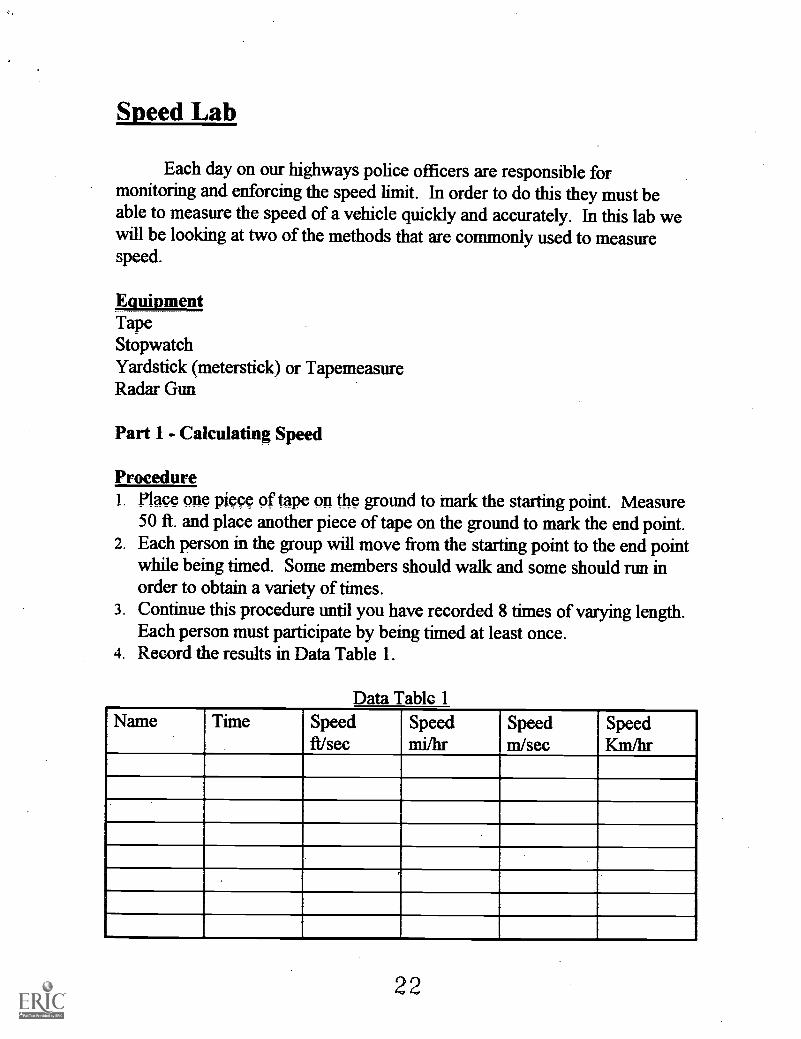
Speed Lab
Each day on our highways police officers are responsible formonitoring and enforcing the speed limit In order to do this they must beable to measure the speed of a vehicle quickly and accurately. In this lab wewill be looking at two of the methods that are commonly used to measurespeed.
EquipmentTapeStopwatchYardstick (meterstick) or TapemeasureRadar Gun
Part 1- Calculating Speed
Procedure1. Place one piece of tape on the ground to mark the starting point. Measure
50 ft. and place another piece of tape on the ground to mark the end point.2. Each person in the group will move from the starting point to the end point
while being timed. Some members should walk and some should run inorder to obtain a variety of times.
3. Continue this procedure until you have recorded 8 times of varying length.Each person must participate by being timed at least once.
4. Record the results in Data Table 1.
Data Table 1Name Time Speed
ft/secSpeedmi/hr
Speedm/sec
SpeedKm/hr
22

Calculations
1. Calculate speed for each person from trial 1 in ft/sec and record in datatable 1.
2. Convert speed for each person in trial 1 from ft/sec to mi/hr and record indata table 1.
Speed = Distance 1 mi/hr = 1.47 ft/secTime
3. Convert speed for each person from English units to SI units of m/sec andKm/hr.
1 meter = 3.3 feet 1 Kilometer = 1,000 meters
Part 2 - Measuring Sneed with Radar
Procedure1. Each person will again run 50 ft. while being timed. Record times in Data
Table 2.
2. During each persons run, the instructor will measure their speed with theradar gun. Record in data table 2.
3. Calculate each persons speed in mi/hr. and record in data table 2.
23

Data Table 2Name Time Speed
CalculatedSpeedRadar
Questions
1. Describe how a police officer could use method number 1 in catchingspeeders.
2. Is there a difference in the calculated speed and Radar measured speed inPart 2.
24

3. The world record for running 100 meters was set by Donovan Bailey at9.84 seconds. The world record for running the mile was set by NouredMorceli at 3 minutes 44 seconds. The world record for running themarathon (26 2 miles) was set by Belayneh Dinsamo at 2 hours 6 minutesand 50 seconds. Calculate the speed of each of these runners in bothft/sec and in mi/hr. Would they be speeding if they ran past your school?
1 mile = 5280 ft 1 mi/hr = 1.47 ft/sec 1 meter = 3.3 feet
25

Traffic Accident Reconstruction Resources
Institute of Police Technology and Managementhttp://www.unf.edu/iptin/Best source for information on accident reconstruction. Includes books, videos, articlesand courses in accident reconstruction.
The Traffic Accident Reconstruction Origin-Web Pagehttp://www.tarorigin. comfindex. htmlWeb page with useful information on accident reconstruction. Includes a listing ofother resources and links. Also contains a section with real accidents that you maysubmit reconstruction solutions to along with other peoples solutions and supportinginformation.
PASCO Scientifichttp:www.pasco.com/home.htmComputer software and scientific equipment supplier. Claim to have simulationsoftware capable of simulation of collisions and their affects.
"Squeal Those Tires!", Linda Griffin Cables, The Mathematics Teacher, Vol. 85, No. 1,January 1992. This article describes how to set up a mock accident and thecalculations necessary to thoroughly investigate the accident.
26
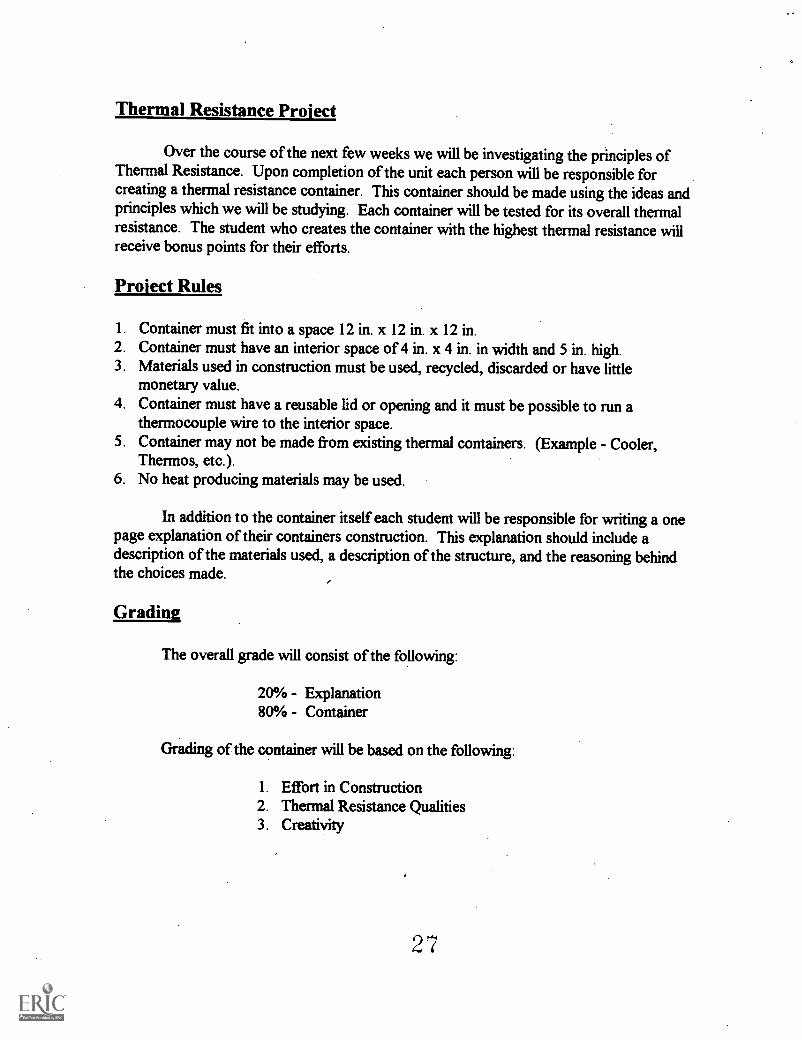
Thermal Resistance Project
Over the course of the next few weeks we will be investigating the principles ofThermal Resistance. Upon completion of the unit each person will be responsible forcreating a thermal resistance container. This container should be made using the ideas andprinciples which we will be studying. Each container will be tested for its overall thermalresistance. The student who creates the container with the highest thermal resistancewillreceive bonus points for their efforts.
Project Rules
1. Container must fit into a space 12 in. x 12 in. x 12 in.2. Container must have an interior space of 4 in. x 4 in. in width and 5 in. high.3. Materials used in construction must be used, recycled, discarded or have little
monetary value.4. Container must have a reusable lid or opening and it must be possible to run a
thermocouple wire to the interior space.5. Container may not be made from existing thermal containers. (Example - Cooler,
Thermos, etc.).6. No heat producing materials may be used.
In addition to the container itself each student will be responsible for writing a onepage explanation of their containers construction. This explanation should include adescription of the materials used, a description of the structure, and the reasoning behindthe choices made.
Gradine
The overall grade will consist of the following:
20% - Explanation80% - Container
Grading of the container will be based on the following:
1. Effort in Construction2. Thermal Resistance Qualities3. Creativity
27

Thermal Container Test
Constructed ByTested By
Procedure:1. Obtain student container from instructor2. Bring 300 ml of water to boil on a hot plate.3. Place an empty beaker in the thermal container.4. Pour hot water into beaker within container.5. Place thermocouple probe in hot water and seal container lid.6. Take thermocouple readings each minute for a total of 20 minutes. Record results in
data table 1.7. Measure room temperature and record in data table 2.8. Find room temperature thermocouple voltage on thermocouple table and record in
data table 2.9. Add thermocouple voltage to room temperature voltage. Record result in data table 1
as total thermocouple voltage.10. Find the equivalent water temperature by finding the total thermocouple result on the
thermocouple table. Record results in data table 1.
Data Table 1Time Thermocouple
VoltageTotal ThermocoupleVoltage
Water Temperature
1
23
45
678910
11
12
13
14
15
16
17
18
1920
28

Room Temperature Room Temperature Voltage
Chrome' - Constantan Thermocouple Calibration Table
0 °C 2 °C 4 °C 6 °C 8 °C 10 °C
-20 °C -1.15 mV -1.26 mV -1.38 mV -1.49 mV -1.60 mV -1.71 mV-10 °C -0.58 -0.70 -0.81 -0.93 -1.04 -1.15
0 °C 0.00 -0.12 -0.23 -0.35 -0.47 -0.580 °C 0.00 0.12 0.23 0.35 0.47 0.58
10 °C 0.59 0.71 0.83 0.95 1.07 1.1920 °C 1.19 1.31 1.43 1.56 1.68 1.8030 °C 1.80 1.92 2.05 2.17 230 2.4240 °C 2.42 2.54 2.67 2.80 2.92 3.0550 °C 3.05 3.17 3.30 3.43 3.56 3.6860 °C 3.68 3.81 3.94 4.07 4.20 4.3370 °C 4.33 4.46 4.59 4.72 4.85 4.9880 °C 4.98 5.12 5.25 5.38 5.51 5.6590 °C 5.65 5.78 5.91 6.05 6.18 6.32
100 °C 6.32 6.45 6.59 6.72 6.86 7.00
280 °C 19.48 19.64 19.79 19.95 20.10 20.26290 °C 20.26 20.41 20.57 20.72 20.88 21.03
300 °C 21.03 21.19 21.35 21.50 21.66 21.81310 °C 21.81 21.97 22.13 22.28 22.44 22.60320 °C 22.60 22.75 22.91 23.07 23.23 23.38

Calculations
1. Find the temperature change for the water in container. This is equal to the differencebetween the initial and final water temperature for each container.
Twater = Tinrtial - Irina
AT
2. The time for the temperature change was 20 minutes. Convert this to seconds, andrecord. the value below.
T = sec
Water has a density of 1 gm/cm. Therefore, the mass of water expressed in grams isequal to the volume expressed in milliliters.
Inwater = 300 grams
The specific heat of water is shown below.
c = 1 calgm C
3_ Find the heat flow rate for each container.
QH = (mwater) ( C ) Twater)
t
Where QH = heat flow rate in cal/sec
Inwater. = mass of water
c = 1.0 cal specific heat of watergm C°
kawater = temperature change of water
t = time for temperature change in sec.
QH =
Approximate the temperature difference across the container. Do this by finding thedifference between the average water temperature for each container assembly and the
30

room temperature:
T = Tavg - Troom
T=
Find the thermal resistance of each container assembly, using the equation below.
RT = TQH
Where: RT = thermal resistance in Ccal/sec
T = temperature difference across the container
QH = heat flow rate in cal/sec
RT
31

NameDate
PeriodLab Partners
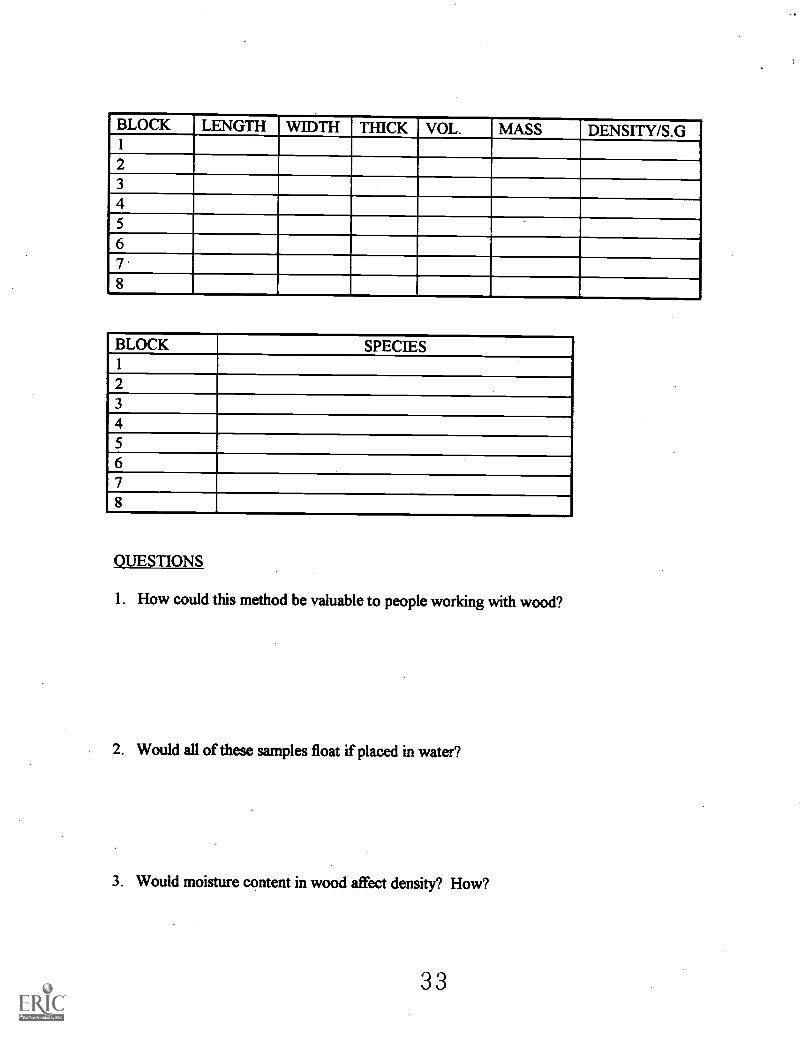
Density - Specific Gravity ProjectPART 1
INTRODUCTION
During this project you will be exploring the principles of Density and SpecificGravity and their value in identifying materials. In part one you will identify differentSpecies of wood by calculating their density/specific gravity and comparing it to a list ofknown densities. In part two you will be identifying different metals by calculating theirdensities and comparing them to a list of known densities.
Finally in part three you will be using a hydrometer to measure the specificgravities of unknown liquids. You will then use this information to identify theseunknowns.
DETERMINING SPECIFIC GRAVITY OF WOODS
PROCEDURE: Read all instructions prior to performing the activity.
1. Measure each block of wood to determine the length, width, and thickness inCentimeters.
2. Using the triple beam balance, determine the mass of each block in grams. Recordthe results in the table below.
3. Find the density of each block of wood. Remember Density = Mass/Volume.
4. Calculate the specific gravity for each block of wood and record the results in the tablebelow.
5. Determine the species of each block according to the specific gravity of each block.
KNOWN DENSITIES OF WOOD SPECIES1. Mahogany-2. Red Oak-3. White Oak-4. Pine-
5. Western Red Cedar-6. Red Wood-7. Poplar-8. Miple-
32
BLOCK LENGTH WIDTH THICK VOL. MASS DENSITY/S . G1
23
45
67,
8
BLOCK SPECIES1
23
45
678
OUESTIONS
1. How could this method be valuable to people working with wood?
2. Would all of these samples float if placed in water?
3. Would moisture content in wood affect density? How?
33

PART 2
DETERMINING SPECIFIC GRAVITY OF METALS
In this lab you will determine the volume, mass, density and specific gravity of fivedifferent metal samples. You will compare your calculated specific gravity to the actualspecific gravity and determine the percent of error.
PROCEDURE: Read all instructions prior to performing the activity.
1. Using the triple beam balance, determine the mass of each metal sample in grams.Record your results in data table one.
2. Fill a graduated cylinder half way with water. Record the initial volume of the wateronly in data table one.
3. Slightly tilt the graduated cylinder and slide the sample to the bottom. Make sure thesample is completely emersed in the water. Record the volume of the water and thesample as the final volume in data table one.
4. Subtract the initial volume from the final volume to determine the volume of thesample. Record your results in data table one.
DATA TABLE ONEMETAL INITIAL VOL. FINAL VOL. VOL OF SAMPLE MASSTINALUMINUMSTEELCOPPERLEAD
5. Find the density of each sample as follows and record your results in data table two.DENSITY = MASS
VOLUME
6. Determine the specific gravity as follows and enter your results in data table two.S.G. = DENSITY OF OBJECT
DENSITY OF WATER
34

7. Compare your calculated specific gravity with the actual specific gravity for eachsample. Determine the percent oferror as follows and record your results in data tabletwo.
% ERROR = SAMPLE VALUE - ACTUAL VALUE X 100%ACTUAL VALUE
DATA TABLE TWOMETAL DENSITY CALCULATED
S.G.ACTUAL S.G. PERCENT OF
ERRORTIN 7.3ALUMINUM 2.7STEEL 7.8COPPER 8.9LEAD 11.3
QUESTIONS
1. List three possible sources of error.
2. Why did you tilt the graduated cylinder and slide the sample into it? How could thisprocedure affect the percent of error?
3. How did the procedure for finding the density of wood in part one differ from theprocedure for finding the density of metals in part two?
35

PART 3
DETERMINING SPECIFIC GRAVITY OF LIQUIDS
PROCEDURE: Read all instructions prior to perfonning the activity.
1. Obtain cylinder of unknown liquid from instructor.
2. Place light hydrometer in cylinder read specific gravity from scale on hydrometer andrecord in data table. If hydrometer floats above scale remove from cylinder andreplace with heavy hydrometer. Read specific gravity from the scale and record in thedata table.
3. Return unknown liquid to instructor and obtain new unknown liquid.
4. Repeat steps 1-3 until specific gravity of all 7 liquids has been measured.
5. Compare unknown results to list of known densities and identify each sample.
6. Rank samples from most dense (1) to least dense (7).
KNOWN DENSITIES OF LIQUIDS1. Water 4. Anti-freeze2. Alcohol 5. 50% Anti-freeze3. 50% Alcohol 6. Windshield Wiper-Fluid
7. Salt Water
Liquid Number Specific Gravity Identification Density Rank
QUESTIONS
1. What principle are we using to measure specific gravity?
36

2. How could automotive technicians use this principle to test Anti-freeze?
3. Would you float more easily in Alcohol or Anti-freeze?

Acceleration Lab
Acceleration is any change is speed of a moving object. In this lab we will be measuringthe acceleration of a car over a measured distance.
Equipment
automobile11 stop watchestapetape measure
Procedure
1. Place a line of tape on the ground.
2. Measure ten feet and place a mark with tape on ground. Continue this process untilyou have 10 sections each 10 ft in length. See diagram 1.
Car
711Section Section
1 210ft 10ft
(
startline
Diagram 1
Section Section Section Section Section Section Section Section3 4 5 6 7 8 9 10
10ft 10ft 10ft 10ft 10ft 10ft 10ft 10ft
Timer Timer Timer1 2 3
Timer Timer Timer Timer Timer Timer4 5 6 7 8 9
Tither10
endline
3. Move car to start line. Car must be turned off and placed in neutral. Driver must stayin car for braking and safety.
4. Position 1 person at end of each section with a stop watch.
5. 3 people will get behind car and when signaled they will begin to push. The peoplebehind car will push until they reach the fifth section at which time they will stop andallow car to coast through the next 5 sections.
6. At the signal to start each of the 10 timers will begin their stopwatches. As the carreaches the line at the end of each section that timer will stop their watch. Recordthese times in Data Table 1.
33
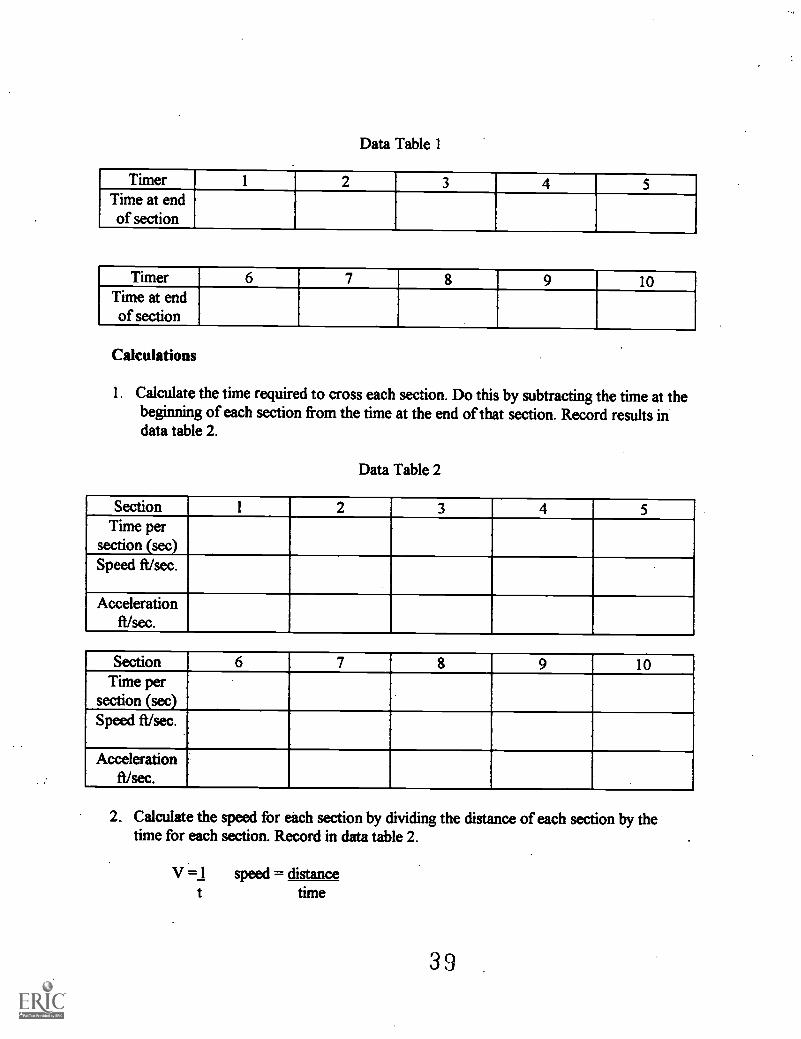
Data Table 1
Timer 1 2 3 4 5Time at endof section
Timer 6 7 8 9 10Time at endof section
_
Calculations
1. Calculate the time required to cross each section. Do this by subtracting the time at thebeginning of each section from the time at the end of that section. Record results indata table 2.
Data Table 2
Section 1 2 3 4 5Time per
section (sec)Speed fl/sec.
Accelerationft/sec.
Section 6 7 8 9 10Time per
section (sec)Speed ft/sec.
Accelerationft/sec.
2.. Calculate the speed for each section by dividing the distance of each section by thetime for each section. Record in data table 2.
V =1 speed = distancet time
39

3. Calculate the acceleration for each section by subtracting the initial speed (the speed ofthe previous section) from the final speed (the speed of that section) and dividing bytime. Record in data table 2.
A = Vf -Vi acceleration = final speed - initial speedt time
4. Draw an acceleration graph by graphing speed versus time
Acceleration Graph
NV
Time (seconds)
4©

Questions
I. In What section was acceleration the greatest? Why?
2. In what sections was the acceleration negative? Why?
3. Was the acceleration uniform? (see graph) Explain.
41
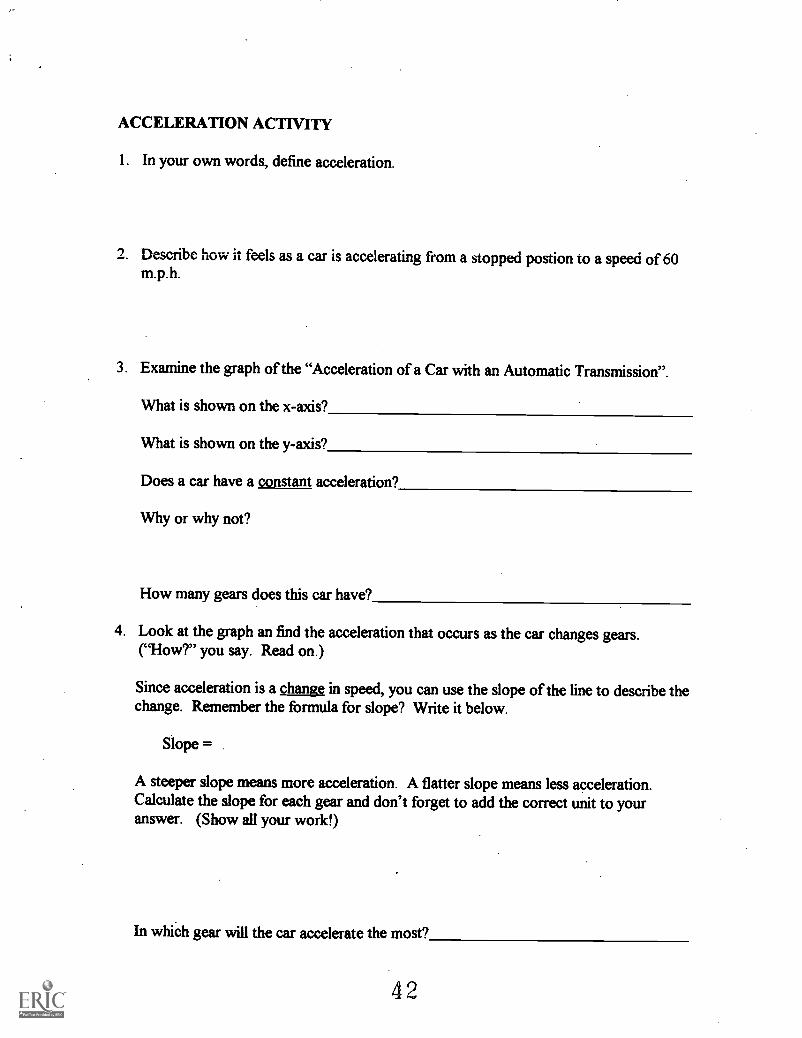
ACCELERATION ACTIVITY
1. In your own words, define acceleration.
2. Describe how it feels as a car is accelerating from a stopped postion to a speed of 60m.p.h.
3. Examine the graph of the "Acceleration of a Car with an Automatic Transmission".
What is shown on the x-axis?
What is shown on the y-axis?
Does a car have a constant acceleration?
Why or why not?
How many gears does this car have?
4. Look at the graph an find the acceleration that occurs as the car changes gears.("How?" you say. Read on.)
Since acceleration is a change in speed, you can use the slope of the line to describe thechange. Remember the formula for slope? Write it below.
Slope =
A steeper slope means more acceleration. A flatter slope means less acceleration.Calculate the slope for each gear and don't forget to add the correct unit to youranswer. (Show all your work!)
In which gear will the car accelerate the most?
42

43
She
et1
Acc
eler
atio
n of
Car
s W
ith A
utom
atic
Tra
nsm
issi
on
Pag
e 1
44

Power in Mechanical Systems
Power is the "rate of doing work". In other words whenever I do work, the time it takesto complete the task determines how "powerful" I am. In this activity we will determinehow much power you truly have.
Equipment - automobile5 stopwatchestape3 bathroom scales3 towelstape measure
Procedure -
I. Place line of tape on ground as starting line.
2. Measure five sections each 20 ft. long and mark each with a piece of tape. The lastmark will be the finish line. (see diagram 1)
Diagram 1
CarSection Section Section Section Section
1 2 3 4
20ft. 20ft. 20ft. 20ft. 20ft.
startline
timer1
timer2
timer3
timer4
timer5
finishline
3. Move car to starting line. Car must be turned off and placed in neutral. Driver muststay in car for braking and safety.
4. Place one person with each of the bathroom scales at the rear of the car. Place thetowel between the scale and the car and prepare to push.
5. Position one person at the end of each 20 ft. section with a stopwatch.
45

6. Have one person at the start line as starter. At the signal each person at the rear of thecar will push on the scale with a force of 25 lb. (this may be increased if necessary butshould remain constant through each trial) At the start signal each timer should beginhis stopwatch.
7. Pushers will continue pushing car with constant force through entire course. As thecar passes each 20 ft. mark the timer at that section will stop his watch. Record timesin Data Table 1. Record force and distance in data table 2.
Data Table 1
Section 1 2 3 4 5Time at theEnd
Data Table 2Section 1 2. 3 4 5ForceAppliedTime forSectionDistance
Power
Horse Power
Calculations
1. Calculate the time for each 20 ft. section by subtracting the time at that point from thetime of the section before. Record in Data Table 2.
2. Calculate the power for each section in ft x lb. Record in Data Table 2.Sec.
Power = Force x Distancetime
3. Convert power in ft. x lb. into Horsepower and record in Data Table 2.Sec.
550 ft. x lb. =1 horsepower.Sec.
4G
Questions
1. How did power change as you moved through course?
2. In which section was power the highest? In which was it the lowest?
3. Why did power vary from section to section? Explain.

Friction in Automobile Tires
Friction is a force that acts to oppose motion between two surfaces in contact with eachother. This force is caused by the interaction of the two surfaces. This interaction is theresult of a force called the normal force. A normal force pushes the two surfaces together.The greater the normal force, the greater the frictional force.
For a given normal force, different surface textures will produce differing amounts offrictional force. The coefficient of friction relates to the amount of frictional forceproduced per unit of normal force This is shown in the equation below.
In the equation above,Atis the coefficient of friction, Ff is the force offriction, and N isthe normal force. In general, rough surfaces have higher coefficients of friction thansmooth surfaces.
In this lab we will be finding the coefficient of friction for different tire treads and belooking at how a lubricant on the road would affect the coefficient of friction.
Equipment
Tire tread samples25 kg. Spring scaleWeight set
Procedure
1. Obtain tread sample from teacher.
2. Measure the mass of the tread sample using spring scale and record in Data Table 1.
3. Place tread sample on ground, attach spring scale to pulling string.
4. Place 5 kg. Of mass on tread sample. Record in Data Table 1.
5. Pull tread sample horizontally across ground and read force needed to pull tread. Youmust pull at a constant speed in order to get a consistent reading. This force is theforce of sliding friction and must be read while the tread is moving. Record in DataTable 1 as Friction Force.
46
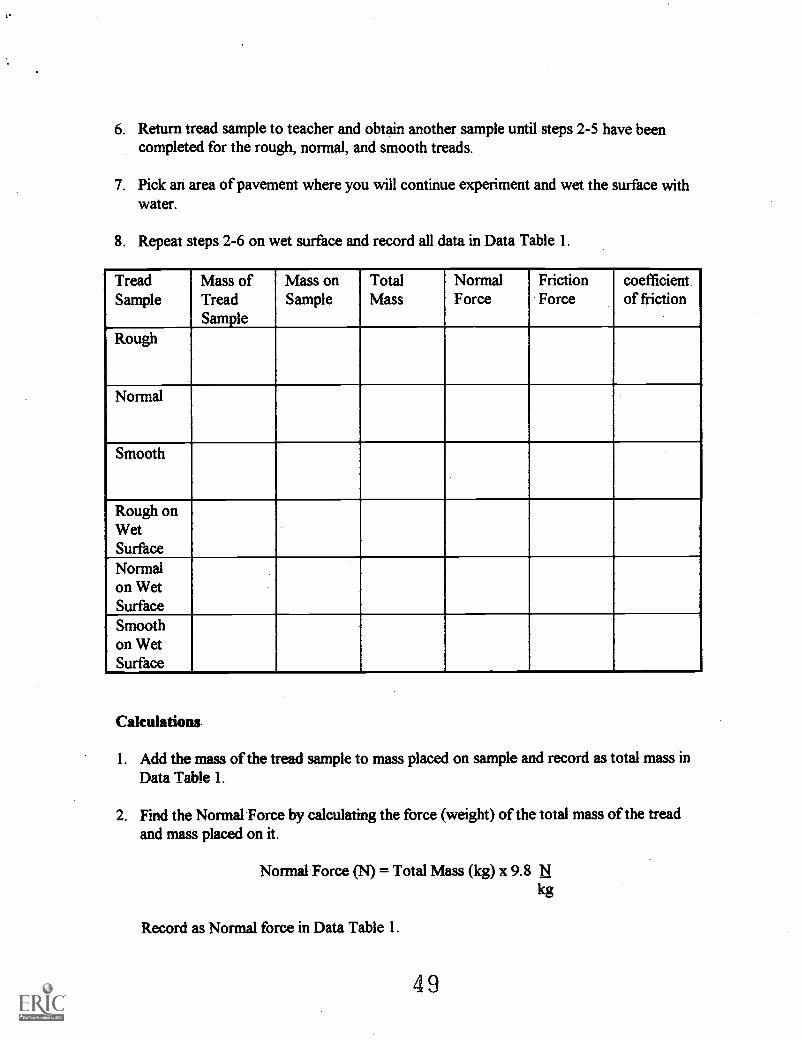
6. Return tread sample to teacher and obtain another sample until steps 2-5 have beencompleted for the rough, normal, and smooth treads.
7. Pick an area of pavement where you will continue experiment and wet the surface withwater.
8. Repeat steps 2-6 on wet surface and record all data in Data Table 1.
TreadSample
Mass ofTreadSample
Mass onSample
TotalMass
NormalForce
FrictionForce
coefficient.of friction
Rough
Normal
Smooth
Rough onWetSurfaceNormalon WetSurfaceSmoothon WetSurface
Calculations
1. Add the mass of the tread sample to mass placed on sample and record as total mass inData Table 1.
2. Find the Normal Force by calculating the force (weight) of the total mass of the treadand mass placed on it.
Normal Force (N) = Total Mass (kg) x 9.8 Nkg
Record as Normal force in Data Table 1.
49
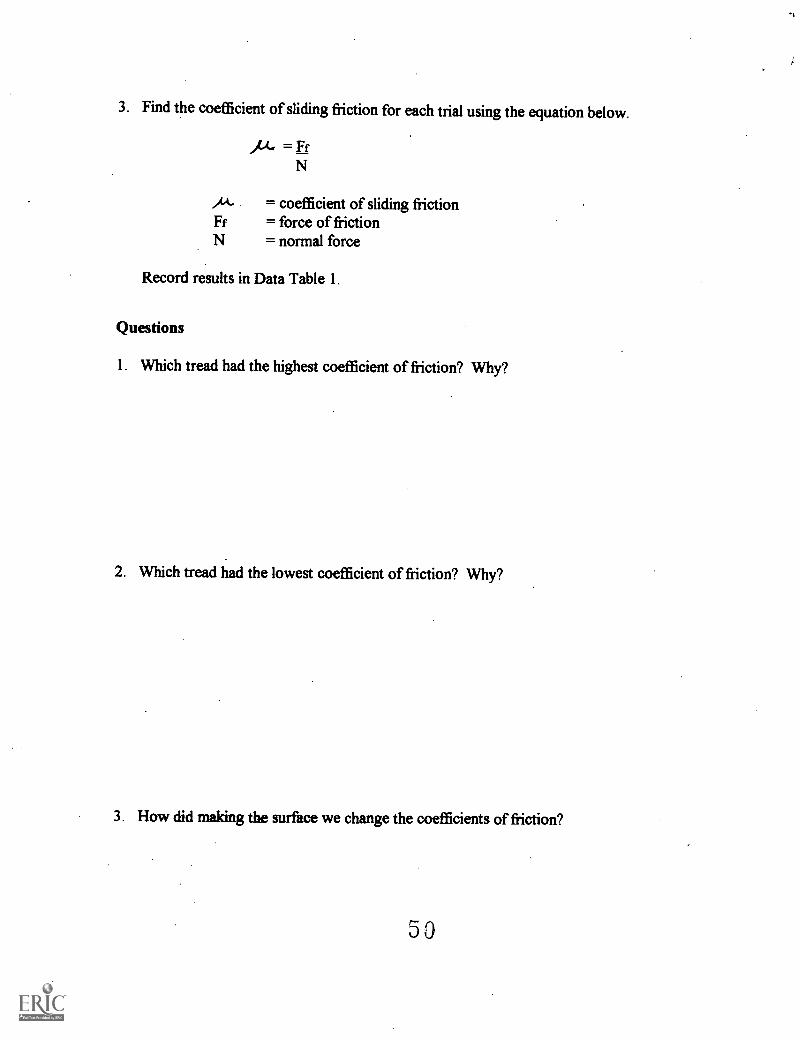
3. Find the coefficient of sliding friction for each trial using the equation below.
14, = FfN
At- = coefficient of sliding frictionFf = force of frictionN = normal force
Record results in Data Table 1.
Questions
1. Which tread had the highest coefficient of friction? Why?
2. Which tread had the lowest coefficient of friction? Why?
3. How did making the surface we change the coefficients of friction?
50

Physics-Technical Integration Project
This project will involve the integration of each students technical are to thematerial covered during the two years of Physics. Each student will be required to write atwo page report detailing the relationship between their technical area and one subunitcovered within this course. This report should show the application of the ideas in aparticular subunit or should show how the ideas have led to developments directlyaffecting their technical area. The subunits that have been covered in the past two yearsinclude:
FORCE MechanicalFluidElectricalThermal
WORK MechanicalFluidElectrical
RATE MechanicalFluidElectricalThermal
RESISTANCEMechanicalFluidElectricalThermal
ENERGY Mech. and Fluid 1Mech. and Fluid 2ElectricalThermal
POWER MechanicalFluidElectricalThermal
FORCE TRANSFORMERSMechanical LinearMechanical FluidFluidElectrical
MOMENTUMMech. and Fluid 1Mech. and Fluid 2
The second part of this project will involve a five minute presentation of yourpaper. During this presentation you should show the relationship between your technicalarea and Physics and demonstrate this with some type of visual aid.
51

-Le
gisl
atio
n
-lit
igat
ion
-N
onvi
olen
t dire
ctac
tion
-V
illin
gnes
s io
bea
r bi
ght.'
(MIS
- A
ppea
ls to
ele
cted
repr
esen
tativ
es a
ndag
ency
offi
cial
s
- 'ta
keov
er b
y m
ilita
nt le
ader
s
-F
orm
atio
n of
coa
litio
ns
- 'ta
sk g
roup
s to
stu
dy is
sues
-P
ublic
ity in
new
spap
ers
Em
erge
nce
ofle
ader
ship
Issu
es p
ut o
n ag
enda
of
othe
r m
eetin
gs
Info
rmal
citi
zen
mee
tings
Lette
rs
Tel
epho
ne c
alls
Figu
re 1
. Spi
ral o
f U
nman
aged
Con
flic
t.
a-La
w e
nfor
cem
ent m
easu
res
-lit
igat
ion
- R
eallo
caof
res
ourc
esto
blo
ck a
dver
sarie
s
-W
illin
gnes
s to
bea
r hi
gher
cost
s
- A
ppea
ls to
ele
cted
repr
esen
tativ
es a
ndag
ency
offi
cial
s
- E
mer
genc
e of
har
dlin
ers
- E
MI
y of
hig
h-le
vel
man
ager
s in
dec
isio
n
Bui
ldin
g su
ppor
t in
pow
erst
ruct
ure
Med
ia c
ampa
ign
in tr
ade
and
othe
r pa
pers
- S
ingl
e pr
ess
rele
ase
- C
omm
.. le
i ter
- N
o re
spon
se
Sen
se o
f cris
is e
mer
ges
Per
cept
ions
bec
ome
dist
orte
d
Con
flict
goe
s ou
tsid
eth
e co
mm
unity
Res
ourc
es a
re c
omm
itted
Com
mun
icat
ion
stop
s
Pos
ition
s Ila
rden
Sid
es fo
rm
Pro
blem
em
erge
s
INT
EN
SIT
Y
San
cbe
com
e is
sues
-M
otiv
atio
n ba
wd
on r
even
geA
- M
omen
tum
of c
onfli
ctbe
yond
indi
vidu
al's
con
trol
- N
ew id
eas
are
stal
emat
ed
Pro
cess
as
sour
ce o
fU
nrea
listic
goa
ls a
read
voca
ted
ft us
trat
ion
- S
ense
of u
rgen
cy-
"I li
teat
s be
com
e is
sues
-Is
sues
shi
ft fr
oM s
peci
fic to
gene
ral,
sing
le to
mul
tiple
-M
ilita
nt h
ostil
ity
- Is
sues
bec
ome
pola
rized
-In
abili
ty to
per
ceiv
e ne
utra
ls
- P
ower
exp
licitl
y ex
erci
sed
- S
tere
otyp
ing
- R
umor
s an
d ex
agge
ratio
ns
-Is
sues
and
pos
ition
s ar
eha
rden
ing
ofsh
at p
ette
dpo
sitio
ns
-In
divi
dual
s ta
ke s
ides
on
anis
sue
-In
tens
ifica
tion
of fe
elin
gs
- E
xpt e
ssio
n of
feel
ings
- P
eopl
e be
com
e aw
are
ofsp
ecifi
c is
sues
- In
crea
sed
anxi
ety
Citi
zen
Gim
p A
ctiv
ities
Gov
ernm
ent o
r In
dust
ryA
ctiv
ities
Con
flict
Spi
ral
Evo
lutio
n of
the
Issu
esP
sych
olog
ical
Effe
ct o
n th
eP
artie
s
52B
EST
CO
PY M
AM
A 1
12E
r
53

U.S. Department of EducationOffice of Educational Research and Improvement (OERI)
National Library of Education (NLE)Educational Resources Information Center (ERIC)
REPRODUCTION RELEASE(Specific Document)
I. DOCUMENT IDENTIFICATION:
Title: Dote5"e+1":5 EcjeAJC e wi TedvvicA ( a A,d Vo cech'ory 4,4( 111W
Author(s): Larri SN.Lider gt C (11 /13 sArecxeivsas-f--Corporate Source: StAS Sex retk cod ,' 5 A scitoo I Publication Date:
April 1, /978II. REPRODUCTION RELEASE:
In order to disseminate as widely as possible timely and significant materials of interest to the educational community, documents announced in themonthly abstract journal of the ERIC system, Resources in Education (RIE), are usually made available to users in microfiche, reproduced paper copy,and electronic media, and sold through the ERIC Document Reproduction Service (EDRS). Credit is given to the source of each document, and, ifreproduction release is granted, one of the following notices is affixed to the document.
If permission is granted to reproduce and disseminate the identified document, please CHECK ONE of the following three options and sign at the bottomof the page.
The sample sticker shown below will beaffixed to all Level t documents affixed to all Level 2A documents
The sample sticker shown below will be The sample sticker shown below will beaffixed to all Level 2B documents
1
PERMISSION TO REPRODUCE ANDDISSEMINATE THIS MATERIAL HAS
BEEN GRANTED BY
\e
S?
TO THE EDUCATIONAL RESOURCESINFORMATION CENTER (ERIC)
Check here for Levellrelease, permitting reproductionand dissemination in microfiche or other ERIC archival
media (e.g., electronic) and paper copy.
Signhere, -'please
PERMISSION TO REPRODUCE ANDDISSEMINATE THIS MATERIAL IN
MICROFICHE, AND IN ELECTRONIC MEDIAFOR ERIC COLLECTION SUBSCRIBERS ONLY,
HAS BEEN GRANTED BY
TO THE EDUCATIONAL RESOURCESINFORMATION CENTER (ERIC)
2A
Level 2A
Check here for Level 2A release, permitting reproductionand dissemination in microfiche and in electronic media
for ERIC archival collection subscribers only
PERMISSION TO REPRODUCE ANDDISSEMINATE THIS MATERIAL IN
MICROFICHE ONLY HAS BEEN GRANTED BY
TO THE EDUCATIONAL RESOURCESINFORMATION CENTER (ERIC)
2B
Level 2B
Check here for Level 2B release, permittingreproduction and dissemination in microfiche only
Documents will be processed as Indicated provided reproduction quality permits.If permission to reproduce is granted, but no box is checked, documents will be processed at Level t.
I hereby grant to the Educational Resources Information Center (ERIC) nonexclusive permission to reproduce and disseminate this documentas indicated above. Reproduction from the ERIC microfiche or electronic media by persons other than ERIC employees and its systemcontractors requires permission from the copyright holder. Exception is made for non-profit reproduction by libraries and other service agenciesto satisfy information needs of educators in response to discrete inquiries.
orgpmzation s:
kss ea gm/ CAI /1,94 SC-11_06
RI: 9, P .80 3S1 ere A., PE /,'9 y7
Primed Name/Pmitionifitle: jLae r.3 C c4e1 She iCe
e tvtiStr -1-Nsirtade) r Teu.c_ine,Telephone362-5ktre. -0e/Coi
FAX302 -8.M." /76
E-Mail Address:siv50212Calefo.C2.41.4
Date: 6.-19, /9Ls,..,ae,..@ de/4).10244.14-s
Intnarl