document resume tm 003 570 › fulltext › ed090291.pdfdocument resume bd 090 291 tm 003 570 author...
TRANSCRIPT

DOCUMENT RESUME
BD 090 291 TM 003 570
AUTHOR Ax, Albert. F.; And Others
TITLE The Contribution of Limbic Learning Aptitude toAchievement in High School. Final Report.
INSTITUTION Lafayette Clinic, Detroit, Mich.SPONS AGENCY Office of Education (DREW), Washington, D.C. Bureau
of Research.BUREKU NO BR-0-0015PUB DATE 28 Feb 74GRANT OEG-0-70-2736 (508)NOTE 115p.
EDRS PRICE MF-$0.75 HC-$5.40 PLUS POSTAGE, DESCRIPTORS *Academic Achievement; Academic Aptitude; Aptitude;
Classical Conditioning; *Disadvantaged Youth; GradePoint Average; High School Students; *IndividualCharacteristics; *Intelligence; Intelligence Tests;Learning Motivation; *Motivation; Negro Students;Operant Conditioning; Personality; Physiology;Underachievers
IDENTIFIERS *Limbic Learning
ABSTRACTAchievement in earning grades in high school was
resolved into its intellectual and motivational components. Thisstudy employed tests of I.Q., personality inventories and classicaland operant conditioning of autonomic nervous system controlledvariables. Eleven procedures were given to 99 Black inner city highschool seniors. Six physiological variables were analyzed directly on
a computer using analog-to-digital conversion and programs whichidentified and summarized all responses and recoveries to the tonesand pain stimuli of the classical conditioning and those during the'operant conditioning using analog biofeedback of heart rate.Achievement (ACH) was defined as the residuals of average total gradepoint average (GPA) regressed on I.Q. Both ACH and GPA were examinedas to their components. Results of regression analyses showed that
50.89% of the variance of GPS was accounted for by I.Q. 20.44%,Edwards Personality Inventory 9.08%, operant conditioning 18.7C%, andclassical conditioning 2.6%. Findings from this study appear tojustify the conclusions that for this population of students, themeasures of motivation, account for 30.45% of the variance whereasI.Q. accounts for only 20.46% of the variance in grades.(Author/MLP)

FINAL REPORT
Project No. 0-0015Grant No. OEG 0-70-2736(508)
THE CONTRIBUTION OF LIMBIC LEARNING APTITUDE
TO ACHIEVEMENT IN HIGH SCHOOL
C.)Albert F. Ax, Ph.D.John C. Gorham, Jr.
bk Anna Marie LootensRalph Robinson
1.0 Psychophysiology DivisionThe Lafayette Clinic951. East Lafayette
V5 Detroit, Michigan 48207
0
February 28, 1974
U.S. Department ofHealth, Education and Welfare
Office .of. Education
Bureau of Research
SCOPE OF INTEREST NOTICEThe ERIC Facility has assignedthis document for processingto;
In our judgement, this documentis also of interest to the clearing.houses noted to the right. Index-ing should reflect their specialpoints of view.
U.S. DEPARTMENT OF HEALTH,EDUCATION I WELFARENATIONAL INSTITUTE OF
EDUCATIONTHIS DOCUMENT HAS BEEN REPRO.DUCED EXACTLY AS RECEIVED FROMTHE PERSON OR ORGANIZATION ORIGIN.AT ING IT. POINTS OF VIEW OR OPINIONSSTATECif DO NOT NECESSARILY REPRESENT OFFICIAL NATIONAL INSTITUTE OFEOUCATION POSITION OR POLICY.

FINAL REPORT
Project No. 0-0015Grant No. OEG 0-70-2736(508)
THE CONTRIBUTION OF LIMBIC LEARNING APTITUDE
TO ACHIEVEMENT IN HIGH SCHOOL
Albert F. Ax, Ph.D.
John C. Gorham, Jr.
Anna Marie Lootens
Ralph RobinsonPsychophysiology DivisionThe Lafayette Clinic951 East Lafayette
Detroit, Michigan 48207
February 28,. 1974
U.S. Department ofHealth, Education and Welfare
Office of EducationBureau of Research

CONTENTS
Problem and Objectives Page 1
Method 6
1. Subjects 6
2. Procedures. 7
a. Testing 7
b. Rationale for Test Battery 8
c. Analysis Procedures 12
Results 31
1. Preliminary Analyses 31
2. Achievement Group Differences 34
3. Specific Discussion of Significant CorrelationsWith ACH and GPA 34
4. Multiple Regression and Discriminant Analysesfor ACH and GPA 43
Discussion of Findings 49
Conclusions 53
Appendix and List of Tables 59
Tables
1. P.I. Output 61
2. Summary Output for Classical Conditioning 64
3. Summary Output for Operant Conditioning 71
4. Factor Loadings for FA3B 73
5. Factor Loadings for FA9B 74
6. Achievement Groups 75
7. CPA Groups 76
8. t-tests of Criterion Group Differences 77
ii

CONTENTS (Continued)
Tables
9. Correlations with GPA and ACH .. Page 79
10. Regression for Achievement 81
11. Regression for GPA 82
12. Discriminant Function for ACH 83
13. Discriminant Function for GPA 84
14. Approval for Research by Lafayette Clinic Committee onHuman and Animal Experimentation 85
15. Letter of Permission to Conduct This Study by theResearch and Development Department of the DetroitPublic Schools 86
16. Letter of Permission by Parents for Student to Participate 88
17. Letter of Permission by Student to Participate 89
iii

Acknowledgments
Personnel and organizations which contributed significantly
to this project were:
Ms. Jacqueline L. Bamford, M.S. who helped in the early
planning and preparation of the proposal.
John C. Gorham, Jr., M.S. who participated in the program-
ming and data analysis to its finish.
Ms. Anna Marie Lootens, B.A. who tested subjects, edited
records, and generally kept things going.
Ralph Robinson, B.A. who recruited, interviewed and admin-
istered many of the tests to the subjects.
Peter Perona and William Fetzner who kept the apparatus
operational and assisted in the programming and data reduction,
Sam Wasson, M.S., Lafayette Clinic engineer, designed the nec-
essary computer interfaces for input.
Robert A. Novelly, M.A. who contributed in many ways,
especially to the acquisition of data, and who scored many of
the psychological tests.
Ms. Kathleen Lennox of the Lafayette Clinic Cbmputing
Laboratory whose general efforts, especially in statistical
programming, greatly facilitated the statistical analysis phase
of the study; Joel Ager, Ph.D., of Wayne State University,
greatly contributed to our effective use of certain statistical
algorithms.
iv

The computer programmers, James Grisell, Ph.D., Rudy Stahlke,
Benay Abrams, Dennis Geller, Roger Gudobba, George Hovey, James
Porzak, Gary Langolf.
The following individuals, who assisted with testing subjects,
editing records, and/or setting up computer jobs: Jerry Kirzner,
Robert Cornette, Peter Patrick, Connie Lanzisera, Marshall Silver-
stein, Barbara Sanders.
The computer operators, especially Mr. M. Cil, who displayed
endless patience with detailed instructions.
Ophilena Mann, Manuscript Publication Assistant, and others,
whose efforts during the final stages of preparation of this report
were noteworthy.
Facilities of Lafayette Clinic and equipment provided by
NASA and NIMH were all essential for undertaking this project.
Finally the contributions of Grace Seegert, secretary,
throughout this study were considerable and greatly appreciated.

SUMMARY
Achievement in earning grades'in high school was resolved intoits intellectual and motivational components. Based on previousstudies of social achievements of various kinds this study employedtests of I.Q., personality inventories and classical and operantconditioning of autonomic nervous system controlled variables. Over
a two day period for each subject these eleven procedures were givento 106 Black inner city high school seniors of which the data for 99subjects were suitable for analysis.
The six physiological variables (respiration,, heart rate, fingerplethysmogram, frontalis muscle potential, pa mar skin conductance andpalmar skin potential) were analyzed directly on a computer using.analog-to-digital conversion and programs developed by the authorswhich identified and summarized all responses and recoveries to thetones and pain stimuli of the classical conditioning and thoseduring the operant conditioning using analog biofeedback of heartrate.
Achievement (ACH) was defined as the residuals of average totalgrade point average (GPA) regressed on I.Q. (full WAIS). Both ACHand GPA were examined as to their components.
By 9 factor analyses, high and low achievement group comparisons,correlations with ACH and CPA a final set of 19 significant variableswere employed in step-wise regression and discriminant functionanalyses for GPA and ACH separately.
Results of these regression analyses showed that 50.89% of thevariance of GPA was accounted for by I.Q. (20.44%), Edwards PersonalityInventory (9.08%), operant conditioning (18.70%), and classicalconditioning (2.67%). The discriminant function analysis for. GPAcorrectly predicted 84.84% of the 99 subjects into their correctcriterion groups. The regressions for ACH accounted for 41% of thevariance similarly proportioned.
Findings from this study appear to justify the conclusions thatfor this population of.students, the measures of motivation accountfor 30.4E% of the variance whereas I.Q. accounts for only 20.46% ofthe variance in grades. Since the physiological measures areapplicable, before school or even before language is available, itis suggested that these physiological measures of motivational andemotional learning aptitude should be examined in prospective studiesto determine their efficacy in identifying preschool children as totheir achievement potentials. With such knowledge in hand moreappropriate expectations and facilitative educational procedurescould be instituted at the most opportune times for maximum success.
This study, and future ones suggested, it is hoped, also advancethe theory of human motivation and point to some of its mechanismsand approaches to its further study.
vi

PROBLEM AND OBJECTIVES
The underachiever constitutes a severe problem for education andfor our society. A major study (Impellizzeri, Barr, and Cooney, 1965)
'found that about 12% of the 40,000 high school students in the New YorkCity schools were of superior ability but nearly half of these could beidentified as underachievers in terms of their school grades. Othersestimate that up to 10% of students are performing substantially below'their I.Q. or school aptitude test results. Most writers on the problemagree that underachievement is a genuine phenomenon and not merely dueto the unreliability of the two distributions involved (grades and I.Q.).The basis for this confidence in the construct of underachievement is thefact that it is very easy to detect difficulties among the underachieverswhen compared to control groups of normal achievers. These difficultiescover the range of human failure including all types of neurosis,character and personality disorder, family disharmony and lack of parentalincentives, low socio-economic status, low motivation and lack ofenvironmental incentives. One way to look at underachievement is torecognize that school is the main serious work of children and hence anybehavioral inefficiency or impairment would be expected to reveal itselfin some aspect of school achievement. Still another viewpoint is thatproposed by Schwitzgebel (1965) who suggests that instead of speaking ofunderachievement we call it over prediction. The notion here is thatachievement in school requires abilities other than I.Q. or that which iscurrently measured by school achievement tests. We simply have failed tomeasure relevant aptitudes, thus in many cases mistakenly label the childas having good school aptitude whereas in reality he lacks some essentialcharacteristics. We propose that this is a much more realistic andhelpful attitude, because it impels us to look further into the abilitiesof the child rather than blaming him or society for somehow being bad. Wehave oversold ourselves on I.Q. as the essential and sufficient prerequi-site for school achievement. Rubin and Braun (1968) studied severalhundred grade school children comparing those who were having trouble inschool with'those doing well. With a special battery of cognitive-motordysfunction tests they found that about 40% of those in trouble hadcognitive-motor dysfunction but without depressed I.Q. This suggests thatthe other 60% of those doing poorly in school without depressed I.O. musthave some other problem. We propose that the problem may involve psycho-physiologic aspects of motivation. Clearly, to achieve many abilitiesare required and many deficiencies or faults must be absent. The problemis to describe each child's particular abilities and faults so as toenable corrective measures to be taken. This needs to be done very early,preferably before the child begins school. Once he accumulates experienceof failure, the correction is all the more difficult. One study (Shaw andMcCuen, 1965) found that underachieving high school boys had beenconsistently underachieving since the first grade. More often girls begintheir underachievement with puberty at about grade six.
The very promising work that McClelland and Alschuler (1967-68) aredoing at Harvard on the Achievement Motivation Development Project showsthat the achievement motive can be taught and often results in substantialincreases in performance. This pioneer work will no doubt have profoundinfluence on teaching methods and will probably become even more effective

when applied to younger people. It is also very clear from their reportsthat there are very wide individual differences in the extent to whichthis special motivation training results in improved performance. Novery convincing explanation has been offered for this great variabilityin learning achievement motivation. We propose that learning the socialmotives, including the achievement motive, requires special abilities.
Previous experiments (Ax and Bamford, 1968, and Ax, Bamford, Beckett,Fretz and Gottlieb, 1970) have found evidence for one such aptitude andhave demonstrated that it can be measured. We view the aptitude forlearning motivation as a logical necessity which follows from the state-ment that motives are learned. Nearly, all modern writers on motivationassert that motives are learned (McClelland, Atkinson, Clark, andlovell,1953; Cofer and Appley, 1964). For every learned behavior, it isnecessary that the individual possess the aptitude for such learningwhether it be athletic, musical, intellectual or motivational. The
controversial point is the extent to which a general aptitude serves manykinds of behavior versus the viewpoint that the aptitude may be rather'specific to particular behavior. Guilford (1967) has demonstratedconvincingly that quite specific aptitudes can be differentiated evenwithin the general intellectual category. On the other hand it has alsobeen shown (Spearman, 1932) that there is usually a low to moderatecorrelation among abilities suggesting that there is also some generality.As with so many controversies in psychology, it is probably true thatboth general and specific aptitudes are useful concepts. Within one broadcategory like intelligence, the specific aptitudes such as numerical,verbal, reasoning, memory, etc. probably have a fairly substantial commoncore which Spearman called general intelligence. The more disparateaptitudes such as physical athletic aptitude, musical talent, I.Q. andemotional learning aptitude are probably essentially uncorrelated. Atleast our findings were that the autonomic conditioning measure ofemotional learning aptitude is uncorrelated with I.Q.
Earlier we spoke of the aptitude for learning motivation, but nowwe equate it to the aptitude for emotional learning. 'Since we aremeasuring the learning rate of physiological processes under control ofthe limbic nervous system, it seems correct to speak of the aptitude foremotional learning. However, it is our thesis that the same aptitude isinvolved in motivation.
We have completed two studies which provide evidence for the constructof an aptitude for motivational learning. The first study (Ax, et al. 1970)was a classical conditioning study of autonomic variables in chronicSchizophrenic and healthy control groups. The variables studied werepalmar sweating (GSR) and finger plethysmogram. The conditional stimuliwere three tones each of a different pitch. The two higher-pitched toneswere paired each 10 times with one of two different intensities of pain.The lower-pitched tone was never paired with the pain. The 28 chronicschizophrenic patients constituted a group studied over several years by the
research labs of The Lafayette Clinic (Gottlieb, J. S. & Tourney, G., Eds.1970) and were kept on a good diet, required to exercise daily and were

off all drugs for several years. They all were clearly chronic schizo-phrenics as agreed upon by three psychiatrists who studied them forseveral years. The control group were 18 healthy staff members andstudents matched for age to the patients.
The main findings were that the patients responded normally to thepain stimulus with their ANS. They showed somewhat reduced amplitude ofthe orienting responses to the tones before habituation. The moststriking finding was the drastically impaired conditional responses tothe tones that had been paired with the pain. Since this was clearly alearning task for the autonomic nervous system we interpreted theseresults as evidence for a reduced aptitude for emotional learning. As doall chronic schizophrenic patients these subjects manifested inappropriateand reduced affect, lack of emotional control, and certainly were muchimpaired in the normal social motives. Thus clinically they presentedthe symptoms that were compatible with the hypothesis of reduced orimpaired aptitude for emotional learning. By this experiment alone, wecould not prove that this impairment in emotional learning played anyrole in the etiology of their illness. Some characteristics of the illnessmight be causing the poor conditioning.
We thought that if we could find people who were not schizophrenicbut had a life history manifesting very low social motivation, they couldtest our hypothesis of relationship between poor emotional learning andlow motivation. After much effort we finally persuaded a few skid rowhabitu4s to come into the hospital for two weeks during which they weregiven physical, neurological, and psychiatric examination. If all threeexaminations were negative, they were then given the conditioning test.Three. met the criteria and were tested. All were as severely impairedin autonomic conditioning as were the chronic schizophrenic patients.These findings we think at least suggest that there may possibly be arelationship between impaired autonomic conditioning and low motivation.We readily admit, however, that three subjects were too few forconfidence. Then, too, there may be something in the life pattern ofskid row habitud which tends toward poor performance on a conditioningtask as it is possible to argue for the schizophrenic patients.
Next we (Ax and Bamford, 1968) studied a younger group of schooldropouts and other persons most of whom were attending a specialvocational retraining school called the Detroit Skills Center. We hadlearned that about 50% of such students were able to profit from theschool and get and hold jobs and become self sustaining; whereas, theother half seemed not able to profit by the school. We asked the teachersof the Skills Center School whether they felt they could distinguishbetween those who were well motivated and those who seemed poorly motivited.The teachers felt they could distinguish between the two types. Our hypo -.thesis was that some school dropouts and other chronically unemployed hadreached this state because of poor family incentives, unfortunate school andhealth experiences, etc., but may have a normal endowment of aptitudefor,learning social motives. These should do well in the permissiveand helpful Skills Center atmosphere. On the other hand if a personreally lacked the aptitude for emotional learning he would acquiremotivation much more slowly.and would thus certainly come to the attention
of the teachers. These students who were low in emotional learning apti-tude might also be expected to;have more neurotic, and other evidences ofemotional, immaturity.
A group of 32 were selected who were judged to be relatively higherin motivation by, their teachers and PY their case histories; and a groupof 31 were selected who were judged to be relatively lower in motivation.These 63 subjects were given a simplified version of the autonomic conditioning test and several other psychological 'tests. The findingssupport our hypothesis very well Eighteen scores, which included 10Physiological and conditioning scores, each discriminated significantlybetween the two groups. When these 18 discriminating scores (from atotal of 51, with less than three expected to be significant bychance) were combined into a 'discriminant function analysis, itcorrectly identified 92% of the 63 subjects as to criterion group. Inaddition to this strong support of our major hypothesis that impairmentin autonomic conditioning is associated with a-life history of lowsocial motivation, there were several interesting interrelationshipsamong the variables. There was no correlation between I.Q. and autonomicconditioning. Thus it is clear that the conditioning variable is tappingan aptitude different from intellectual aptitude. Subjects who becameaware of the contingency between the tone and the pain gave larger condi-tioning scores; but these aware subjects were about equally distributedbetween high and low motivation groups, showing that awareness could notbe responsible for the discrimination. When the aware and unaware groupsdata were treated separately, it was found that the physiological condi-tioning scores of each group separately still discriminated significantlybetween the high and low motivation groups. In fact awareness made thediscrimination between high and low motivation groups better.
Several psychological tests also discriminated significantly betweenthe two criterion groups. The level of aspiration test required thesubject to estimate his score just before performing the task. The taskconsisted of pushing a steel ball with, a cue stick attempting to get theball to stop in the middle of 20 holes thus gaining the top score of 10.Consistent over-estimation would be counted as a high level of aspiration.This level of aspiration score, however, did not discriminate the groups.Another level of aspiration score (Axi 1946), called the judgment errorscore which totalled the error in estimates disregarding the sign, diddiscriminate -- the low motivation group earning the higher error score.Some of these low motivation subjects consistently over-estimated, someunder-estimated, and some fluctuated from over- to under-estimating. Weare unsure whether this judgment error score relates to lcw aptitude formotivation, but it surely relates to poor performance in school and life'swork.
Three of the scales of the 16-Personality Factor Questionnairediscriminated significantly. These were Scale G - conscientiousness,perseverance (high gp), L - suspiciousness (low gp), and M - imagination(high gp). Interestingly the other scales relating to personality andneurotic trends did not discriminate. Nor did either of two anxietyscales detect any difference between groups. Thus we feel confident,groupings were not primarily based on neurosis.

On intelligence tests, the high motivation group scored significantlyhigher (99.0 vs. 87.6) than did the low group. Since intelligence testsmeasure what has been learned they surely measure motivation as well asintelligence. It was expected on this basis that high and low motivation-groups would score differently on I.Q. The zero order correlation betweenour physiological conditional measures and I.Q. provide evidence that ourtwo criterion groups were not merely different on I.Q., but it is alsoprobably true that the rating teachers, although instructed to select onmotivation only, may have been somewhat influenced by performance whichwould of course be a joint function of intelligence and motivation.
Why should classical conditioning of such variables as palmar sweating,heart rate and vascular constriction relate to the aptitude for social moti-vation? We believe the explanation is straightforward. Social motivationis mediated by the emotional nervous system (limbic (LS) and autonomic (ANS)systems). Classical conditioning of such LS and ANS variables measures thelearning rate of the system. Since an aptitude is defined by the learningrate of the systems involved, the conditioning rate would appear to be adirect measure of the aptitude for motivational learning. Classical condi-tioning has another advantage because it is relatively free from theconfounding factor of subject cooperation, understanding of instructions, etc.
In our two previous studies we found the conditioning procedure toproduce results which correlated well with ratings of achievement. In
this current study we also have attempted to study the strength of theachievement motive as it is already developed in each subject. Althoughthere will tend to be some correlation between the aptitude for learningmotivation and current strength of a particular motive, it will be farfrom a perfect correlation. As with other , apti tudes , there will be someindividuals who have a high aptitude for learning motivation who will nothave had the opportunitity to have developed a strong achievement motive.These people would rapidly develop motivation if given the incentive, andopportunity such as might be provided by a good vocational school. Otherswho have little aptitude for learning motivation would not benefit muchby such opportunities. Those with a strong achievement motive alreadydeveloped will not be school dropouts nor underachievers. They may varygreatly in amount achieved due to other aptttudes and opportunities aswell as the realism of their hierarchy of motives.
The objectives of this study, then, were to describe and measure theachievement motive and the aptitude for learning motivation in two groupsof high school seniors: (1) those described as underachievers and(2) those who have demonstrated a strong achievement motive. Theultimate objective of this type of research is to bring better under-standing of the causes of underachievement and to develop tests whichcan distinguish between those underachievers' who are merely lacking in aproper achievement motive but who have the basic aptitude to developmotivation and those whose low motivational aptitude will, require sPecialprocedures and can only be expected in their present state to develop amodicum of achievement motive. Being able to identify these two types ofunderachievers at an early age will enable more effective and economicaleducational procedures. Our goal for motivational aptitUde is analogousto the development of tests, for intelligence so that those differing in

motivational aptitude may be detected early and more appropriate educa-tional opportunities provided for them.
This is an application of psychophysiology to education. Up to noweducation has dealt chiefly with the cognitive aspects of developmentwith the emotional and motivational aspects largely ignored except whendifficulties arose. With adequate research sophisticated methods can beapplied to deal with these very important emotional and motivationalaspects of development.
In addition to the practical aspects of this study it has relevanceto motivation theory. While it is generally agreed that human motivesare learned (Cofer and Appley, 1964; McClelland, 1965a, 1965b), thereis probably less agreement that a specific aptitude can be identifiedfor the learning of motives. Our previous study (Ax.and Bamford, 1968)suggests that an aptitude independent of I.Q. apparently exists whichwe have tentatively named the aptitude for emotional learning. Theaptitude would relate to more than the learning of motives.. It wouldunderlie all aspects of emotional development. As with other aptitudessuch as I.Q. or musical talent, it is probably a combination of geneticendowment and environmental stimulation. This study makes no attemptto evaluate the relative contributions of heredity and environment.
METHOD
1. Subjects.\\
Subjects were 106 Negro seniors of Eastern. High; School -- acentral city school of Detroit, Michigan. These subjecti were selectedby our Black psychologist interviewer. He obtained full cooperation ofthe principal, assistant principal and counselors. Grades for 2 or 3years, the SCAT scores when available and the advice of the counselor wereutilized in selecting the subjects. The goal was to have about 65 prob-able underachievers defined tentatively as grades below their expectedgrade as predicted by the SCAT, and about 35 high or over achieVersdefined as having grades equal or above SCAT predicted values. Sinceour experimental design required no exact proportions of high and low'achievers, and because the definition of high and low achievement wouldhave to be finally defined after testing in our laboratory, we did notspecify or demand any rigorous limits on grades or SCAT scores for thestudents selected as subjects..
Since a substantial portion of these subjects were selected becausethey were showing poor school motivation, there was a built-in problemof gaining their cooperation. Of course there were many students con-tacted who did not participate, so that, the very poorest motivated ofthe underachievers were probably not included in this study which is boundto attenuate to some unknown extent our findings.
6

2. Procedures.
Each student contacted was told the purpose of the tests andthat he would be paid $2.00/hr. or about $24 total if he completed thetests. Half of his first day's pay was held back pending his completionon the second day. He was given a permission form for his parent tosign (see appendix).
a. Testing
The tests were administered in the following order and times:
First Day:
8:00 Subject picked up by Clinic car and brought to Clinic
8:30 LEVEL OF ASPIRATION TEST is a test which consists of an alleywith numbered depressions, the middle one being the targetinto which the subject attempts to roll a steel ball by push-ing it with a cue-like stick. After being told his mean scorefor five hits, he is asked to estimate his next trial score.
8:55 INSTRUMENTAL CONDITIONING is a psychophysiological test whichutilizes the polygraph and requires the student to attempt tochange the rate at which his heart beats. The object is todetermine the extent to which this physiological function isunder the student's voluntary control.
10:00 Coffe Break and urine sample taken
10:15 THE NEED FOR ACHIEVEMENT is measured by means of a techniqueinvolving the presentation of several situation pictures tothe subject, requesting him to write a story about each andthen scoring the stories in terms of the degree of need forachievement which is expressed.
10:35 CLASSICAL CONDITIONING is a psychophysiological test utilizingthe polygraph in which the subject is presented with two toneswhich differ in pitch, one of which is paired with a mild painstimulus to the big toe. The extent to which his autonomicresponse differs to the two tones was recorded.
12:10 Lunch
12:40 MINNESOTA COUNSELING INVENTORY is a test to identify threeareas in which teenagers may be adjusting particularly wellor poorly: family relationships, social relationships, andemotional stability; and to indicate four aspects of thestudent's characteristic ways of meeting problems: conformity,
adjustment to reality, mood, and leadership.
1:40 EDWARDS PERSONALITY INVENTORY-This 1967 version is composed of5 booklets of many hundreds of statements describing personality
7
^4.
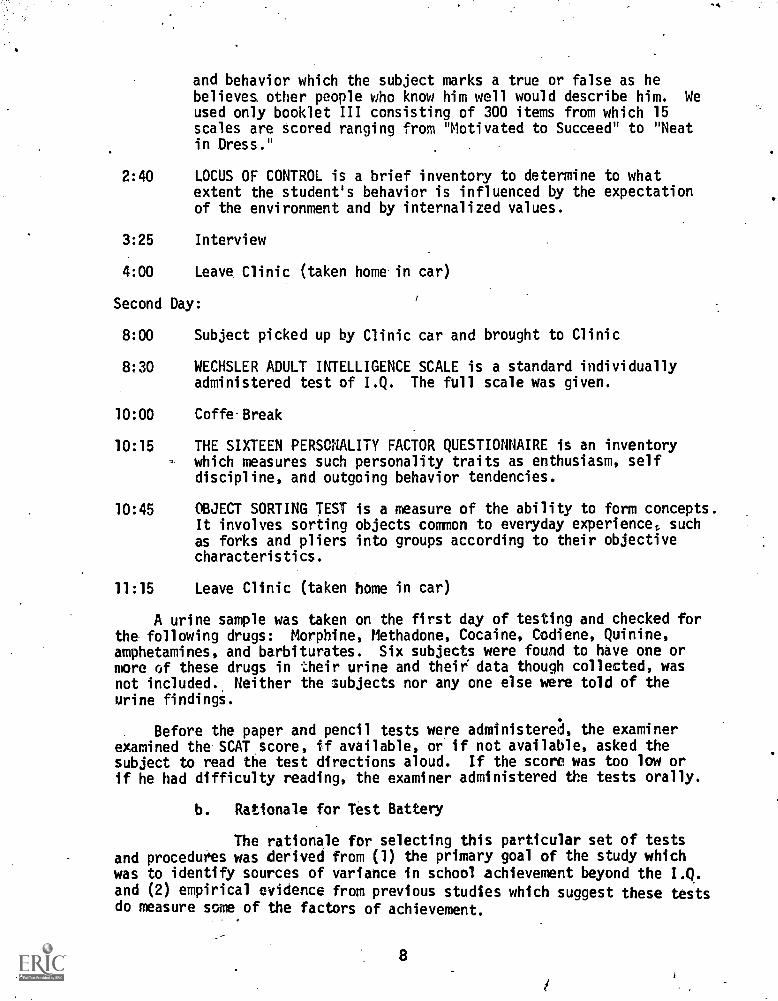
and behavior which the subject marks a true or false as hebelieves other people who know him well would describe him. Weused only booklet III consisting of 300 items from which 15scales are scored ranging from "Motivated to Succeed" to "Neatin Dress."
2:40 LOCUS OF CONTROL is a brief inventory to determine to whatextent the student's behavior is influenced by the expectationof the environment and by internalized values.
3:25 Interview
4:00 Leave. Clinic (taken home.in car)
Second Day:
8:00 Subject picked up by Clinic car and brought to Clinic
8:30 WECHSLER ADULT INTELLIGENCE SCALE is a standard individuallyadministered test of I.Q. The full scale was given.
10:00 Coffe-Break
10:15 THE SIXTEEN PERSONALITY FACTOR QUESTIONNAIRE is an inventory- which measures such personality traits as enthusiasm, self
discipline, and outgoing behavior tendencies.
10:45 OBJECT SORTING TEST is a measure of the ability to form concepts.It involves sorting objects common to everyday experience, suchas forks and pliers into groups according to their objectivecharacteristics.
11:15 Leave Clinic (taken home in car)
A urine sample was taken on the first day of testing and checked forthe following drugs: Morphine, Methadone, Cocaine, Codiene, Quinine,amphetamines, and barbiturates. Six subjects were found to have one ormore of these drugs in their urine and their data though collected, wasnot included. Neither the subjects nor any one else were told of theurine findings.
Before the paper and pencil tests were administered, the examinerexamined the SCAT score, if available, or if not available, asked thesubject to read the test directions aloud. If the score was too low orif he had difficulty reading, the examiner administered the tests orally.
b. Rationale for Test Battery
The rationale for selecting this particular set of testsand procedures was derived from (1) the primary goal of the study whichwas to identify sources of variance in school achievement beyond the I.Q.and (2) empirical evidence from previous studies which suggest these testsdo measure some of the factors of achievement.
8

The Level of Aspiration Test has a long history of measuringmotivation (K. Lewin, 1944) including my own little study in 1946 whichdeveloped the judgment error score and which successfully discriminatedbetween the high and low motivation groups in our study (Ax and Bamford,1968). In this study we chose the performance version rather thin thepaper and pencil version developed by Jensen and Rotter because we knewit would be of more intrinsic interest'to this age group and likely toelicit their genuine motivation. The difference score (D) betweenestimate and previous accomplishment was scored as well as the judgmenterror score (JE) which is the absolute difference between estimate andscore earned on that trial.
Operant conditioning'consisted of 10 one minute trials with instruc-tions to raise heart rate (HR), 10 one minute trials with instructions tolower HR with 20 one minute rest periods intersperced between the pseudorandom interlaced Hi and Lo trials. A HR meter displayed the subject'sH1 to him on all the Hi and Lo trials whereas the meter was inoperativeduring the rest trials to prevent practice when rest was instructed. Awhite light lit just over a red sign of Hi or Lo on the right or leftside of the meter to indicate to S the trial instruction and toward whichside of the meter he should try to make the pointer go. The purpose ofemploying this operant learning task in addition to the classical condi-tioning was to utilize the additional motivation such a challenging taskarouses and thus to help measure the current motivation as well as theaptitude for being motivated which I believe the classical conditioningbest measures since for most people the learned behavior and often eventhe contingency is unconscious, thus preventing conscious current moti-vation from being operative.
The Wechsler Adult Intelligence Scale was administered to obtain thebest estimate of intelligence essential for our definition of underachieve-ment. The SCAT and STEP scores were not available for all subjects andfrom discussions with the school test administrators it was clear thatthese tests were taken by the students with widely varying motives andseriousness suggesting unreliability for the individual scores.
Originally the Minnesota Multiphasic Personality Inventory (MIIPI)was to have been used to provide measures of personality disorder so thattheir contribution to underachievement could be determined. Since,however, the U.S. Office of Education ruled that this test may not begiven to subjects in studies supported by OE funds we substituted anothertest -- the Minnesota Counseling Inventory (MCI.) which omits the presum-ably offensive questions but still provides measures of personalitydisorder.
. .
Classical conditioning of autonomic controlled variables constitutesthe major experimental variable as on our, two previous studies and therationale that the rate and degree of new learning by this autonomicbehavior constitutes .a measure of the aptitude for learning motives andemotional control. The procedure was to attach sensors to the subjectfor recording (1) respiration, (2) heart rate, (3) finger plethysmogram,t4) frontalis muscle tension, (5) palmar skin conductance and (6) palmarskin potential.
9

The testing studio consisted of a sound attenuated room with one-wayviewing ports and with the temperature controlled to 25.50 C + 0.20 C.
The subject sat in a reclining chair and had audio communication with theexperimenter. The beckman Type R dynograph, and the stimulus apparatus were inan adjoining room. Special couplers designed by our electronics staff wereused for skin conductance and heart period. The standard Beckman couplers,including the high impedance electrometer Model 9808 for skin potential,were used for the other variables.
Skin conductance electrodes were O'Connell type, made of silver-silver chloride 3/8 inch in diameter, filled with Redux electrode paste,and attached on the volar surface of the distal phalanges of the thirdand fourth fingers of the left hand. Skin potential electrodes were thesame type and located on the volar surface of the distal phalanx of thefifth finger of the left hand referenced to an electrode on the innerside of the left forearm about midway between wrist and elbow. Fingerpulse was measured by an E & M photoelectric sensor located on the volarsurface of the distal phalanx of the first finger Respiration wasmeasured by two Silastic tube mercury strain guages located on the chestand abdomen connected additively to a single bridge circuit. EKG elec-trodes were located on the right arm and left leg. The single groundelectrode was located on the right ankle.
The skin conductance bridge provided a nearly constant 0.6 volt tothe subject with a voltage output approximately linear with conductanceof the subject. Current values ranged from 4.07 uamp/cm2 for 5 umho(200K) to 28.1 uamp/cm2 for 50 umho (20K) conductance values. The cardio-tachometer produced an output voltage linear with heart'period--beat bybeat intervals (R wave to R wave) in milliseconds.
'Stimuli given the subject consisted of tones and pain, the latterbeing produced by a D.C. electric current. The auditory stimuli, each of12 seconds duration, were sine waves of 454 and 1276 Hz, interrupted 5times per second, of approximately 50% duty cycle. Intensity was 70 dbmeasured at the subject's ear with a General Radio sound level meter seton the C scale (ref. = 0.0002 dynes/cm2). The pain stimulus consistedof a 4 sec duration, 3 ma continuous D.C. electric current applied tothe pads of the great and adjacent toes of the right foot with 1 molarzinc sulphate wetted sponges backed by pure zinc plates in a plastic cupof 7 mm inside diameter. These characteristics produced a current densityof 7.80 ma/cm2. An electronic current-regulator maintained preciselythis preset current regardless of skin or electrode resistance changes.This stimulus is perceived by most subjects as heat.
The "need for achievement test" developed by McClelland (in Atkinson,Ed,, 1958) requires the subject to tell stories to 4 pictures: (twomen working in a machine shop, a. boy at his desk apparently pondering apaper he is writing, the father and son picture 7BM from TAT, and theboy and an operation scene in background 8BM from TAT.) The subject isinstructed to look at the picture for 20 seconds and then write a phantasywith these 4 questions in mind (1) What is happening? (2) What has ledup to the situation? (3) What is being thought--what is wanted by whom?
10

and (4) What will happen? Scoring followed McClelland's Manual (p. 179 -204 in Atkinson; Ed., 1958). Research published by McClelland and otherssince 1954 indicate this phantasy test can measure the achievement motivewith considerable validity.
Object sorting test was used as described by Rappaport, Gill andShafer in Diagnostic Psychological Testing,1968. Part I consists ofrequiring S to sort or classify some 36 items from everyday life such asknives, forks, pliers, pipe, etc., into 7 successive categories withverbalization as to his rationale. There are 25 scores created by theexaminer on both the conceptual span indicated by the adequacy and con-ceptual level judged from the verbal report. In Part II, E makes 12successive groupings and S is asked to verbalize the theme which unitesthe group. The purpose of including this test was to see whether itcould provide a still further contribution to the measurement of theconceptual factor in achievement possibly not fully explored by theWAIS.
The Sixteen Personality Factor Questionnaire Form E Copyright 1967,Institute for Personality and Ability Testing was developed by R. B.Catell and H.. W. Eber. Both rationale and published research indicatethe 16 PF has considerable validity for a comprehensive variety of per-sonality factors. Specifically 3 of its scales G, L and M discriminatedsignificantly between the high and low motivation groups in our 1968study. In fact, the M factor which purports to measure "imaginativeness"and "cre.!tivity" had the third highest t-value of 3.38 in the 1968 study.
Locus of Control was developed by J. Rotter (1960) and the version usedin this study, by James O. Miller,has two.scores, the locus of control(internal or self vs. external or environment) and "evaluation" of hisfeelings in this regard. Research suggests that internal locus of con-trol should correlate with motivation, ego strength and achievement. It
seems plausible that the aptitude for learning emotional control andsocial motivation may underly the internal locus of control attitude.
Edwards Personality Inventory (EPI), Booklet Three was used in thisstudy, The factors obtained from this inventory, according to Dr. Edwardsare motivation to succeed, impressed by status, desires recognition, planswork efficiently, cooperative, competitive, articulate, feels superior,logical, assumes responsibility, self centered, makes friends easily,independent in his opinions, is a hard worker, neat in dress. Althoughthere are other interesting factors especially in booklets lA and 1B inaddition to these 15, we felt that most of these additional ones would bepicked up by the 16PF or the M.P.I.
There was also an interview done which sought to obtain informationfor the socioeconomic status, attitudes toward school and achievementin life, trends toward neuroticism or psychopathy. Our interviewer beingBlack'air:irerY ekperienced in working with delinquent and disturbed boyswas quite skilled in building rapport with these students. The fact thatall but one subject continued through the testing procedure by coming backthe second day speaks well, I think, of his ability to motivate them.

c. Analysis Procedures
The data analysis began for the psychological data by handscoring the various tests and tabulating the scores for computer card
input. For the physiological data, the analysis began by our editing
process. Editing was done by the uperienced psychophysiology technicianswho actually operated the polygraph during testing. There were two poly-
grams produced for each subject: One for classical and one for operant
conditioning. Each contained the recording of six physiological variables,an event marker trace, a time code in seconds which was a precise countdown from the 100 sample/second time code recorded on the magnetic tapewhich was used to time the computer during Analog-to-Digital (A/D) conversionduring computer acquisition. After labeling the polygram time code in tensof seconds, the editor had available the precise time which could beestimated to the nearest tenth of a second.
The first editing job was to identify and list the times of onset andoffset of each epoch for analysis. For the operant conditioning sessionthere were 10 high, 10 low and 21 rest periods pseudo randomly interlacedtotalling 41 epochs for analysis. For the classical conditioning therewere 127 scoring epochs consisting of 21 high pitched tones of 10 secondsduration, 20 low pftched toes of 10 seconds duration, 21 pain stimuli of4 seconds duration, 20 no pain intervals of 4 seconds, 41 intertrial intervalsof from 45 to 60 seconds, two rest periods of 3 minutes and two BP epochs of3 minutes during which BP was taken by hand before and after conditioning.These epoch points served to mark the periods for including analysis andfor specific points to obtain a data point value.
The editor also coded the gain and offset values written on the poly-gram by the recording technician to be used by the computer in itsconversion programs described below. Since during the changes in gain andoffset, invalid recording was made the editor edited out the portion ofthe record that was invalid. The recording operators were trained tomake these changes in gain and offset as quickly as possible. They weremade all through the records when the subjects' physiological valueschanged beyond the rather narrow limits of the pen. The pen and mag tapechannel limits were made equal and rather high gains were used so thatoptimum resolution would be possible. The AID conversion used 14 bits andhence had a maximum resolution of 16384 which was more than adequate forour data. The Ampex Mag Tape Recorder used the + 1.8 RMS with a resolu-tion of about 6 or 7 millivolts which provides about 1 part in 500 orabout 0.2%. Of course this is about 10 times the resolution that can beread on a polygram. Thus we believe there was little or no loss ofinformation from the raw data in these computer processes.
Editing for the elimination of artifact or bad data due to any causewas based on the experienced judgment of the editor as to what constitutesvalid data. Any error of inclusion of invalid data or exclusion of validdata could only degrade the data in a random way with regard to thehypotheses under study since the editor had no way of knowing how a par-ticular portion of the data could affect such hypotheses. There weretwo types of edits. A short edit bridged across a short section of gooddata by means of a cubic equation which utilized two samples just beforethe edit and.2 samples just after the edit, thus making it possible to fill
12

in short curved portions even including a high or low. If the portion ofinvalid data to be edited, out was too long or if the editor judged the"true" data curve would too complex for the extrapolation formula toaccurately fill in, he used the long .edit which directed the computer tostop analysis and skip to the point of End Edit (EE). Careful comparisonsampling of the computer's performance in this editing with hand filledin short edits established the general validity of the process. Both theraw polygrams and computer prepared analog curves made from the digitalvalues. When all this editing information had'been key punched the cardswere utilized along with the data from the mag tape by the computer forthe analysis. The next step was to do the A/D conversion, calledacquisition, of the data from the analog mag tape record via a computerterminal in our lab. The IBM 1800 Computer up one floor acquired the databy being timed by the 100 S/S time pulses on the analog tape. Actuallythe analog tape was reproduced at 15"/sec which was 8 times the originalacquisition rate of .1 7/8/sec. Thus the actual A/D rate was 800 S/S pervariable. It sampled the six variables once each in the 1/800 secondbetween timing pulses. These samples were recorded on t continuous inter-spersed form on the first digital acquisition tape. The second tape calledthe TST tape blocked the data into 100 samples per variable and suppliedappropriate headers so that future programs could find the desired data.The third step filtered the data, smoothing out noise by a weighted digitalsmoothing system which most efficiently preserved the data. The smoothingwas tailored for each variable so as to best remove the small or brief noisethat vis too small to edit out. Again computer prepared graphs were usedto adjust the smoothing to an optimum value. The great advantage ofdigital over analog filtering is the lack of lag introduced since digitalsmoothing "looks ahead" as well as back, and because it can be adjustedand redone as often as desired without destruction of the raw data. Aftersmoothing the computer compressed the data into 10 samples per second pervariable from the original 100 S/S thus reducing the amount of data to19; of its original amount. Since the fastest changing variables (respir-ation, HR and MT) could not complete a cycle of change in less than onesecond, after filtering, we judged the 10 S/S would faithfully mediatethe data for digital statistical analysis. The fourth step in the com-puter was to scale and convert each variable to physiological units.Mathematical formulae were prepared for this purpose for each variablebased on the electronic calibration of the transducers and amplifiers.After application of the formula to each variable, the digital valueswere checked and if any discrepancy was found throughout the range of thevariable, the formula was corrected, if necessary, by use of non-lineartransformations.
The final physiological units were for respiration, inches stretchof the mercury filled silastic strain gages around the chest and abdomen.Heart rate was in beats/min but each single R-R interval was measured.Finger plethysmogram was in millivolts of the transducer output since wehad no more basic calibration such as volume changes. Muscle tension wasin microvolts at the transducer. The "leaky-peak" detector integrator
output was calibrated by a 400 Hz microvolt source. Zero values were setwith the electrodes, in place on the subject but shorted so as to have a
13

zero MT level to start from and which would include any common mode noisenot excluded by the preamplifier. Skin potential was recorded in milli-volts using the very high impedence (>100 megohms) Beckman type 9808electrometer coupler. Skin conductance was recorded in micromho unitsof conductance.
The next computing step was to find and measure the "points ofinterest" (PI). See Table 1. This concept and program development hashad a long history. The concept to devise a general method to find allthe points of interest in any continuous physiological recording wasconceived by Ax about 1952 while working on the Fear and Anger study atHarvard. Several abortive attempts to use analog computing were abandonedand the digital approach was began in 1957. The first success was achievedwith the help of Sam Singer, M.D. and George Zachary using the Bender G-15drum type computer resulting in a publication by Ax, Singer, Zachary,Gubobba and Gottlieb in 1964. Later the program was rewritten by Singer andR. Stahlky for the IBM 7094. This version is reported in my Chapter 14 ofVenables and Martin (Eds) 1967. Next the programs were rewritten for theIBM 1800 by the following programmers: John Gorham, William Fetzner, J.Porzak, J. Grisell, D. Geller, Benay Abrams, and G. Langolf, all under thegeneral supervision of Ax. A NASA grant (Ax, 1968) supported much of thisprogramming work. John Gorham, Dr. Grisell and Ax carried out the finaldebugging and revisions so as to make them all work satisfactorily. Theeffort to accomplish this turned out to exceed the expectations of all of us.
The PI program compares adjacent groups of samples so as to identifythe following 8 PI. See figure below:
ontms -ms
BR
DnifIn addition all edit and epoch points are found from the editor's
input. For all PI the type, time, and amplitude are computed and saved.For the maximum slope points the slope is also determined. (See appendixfor sample of PI output) The premise underlying the PI procedure is thatthere are physiological responses that can be identified by their morerapid rates of change than the gradual homeostatic drifts which change moreslowly. The difference in rate of change between a response and a homeo-static drift is, of course, a matter of degree but it seems the concept hassufficient merit to be useful for the psychophysiologist. This studyis the first one in which we have had the. opportunity to give theconcept and method a large scale test.
In order to select the rates of change desired, two tolerances areset. (1) Amplitude Tolerance (AT) and (2) Time Tolerance (TT). The ATtogether with the time over which the samples of data are compared (since2 or more samples may be used to provide additional smoothing) determinesthe minimum slope required to reach response status. All slopes less thanresponse are called drifts. The TT defines how long a slope of less thanresponse status must prevail to achieve the no-response or drift status.Since both ends of a drift are recorded as the end and beginning of theadjacent responses, and we know the variable could not have exceeded the
14

TABLE 1
POINTS OF INTEREST OUTPUT SAMPLE
IDENTIFICATION OF PI FILES OF CURRENT
INT.
FILE PROTECT CODE
NO
STUDY....-
ACCESSION
124
SESSION..
ANALOG TAPE
22
SUBJECT.-..
TINES DIGITIZED
1PI RUN...
SNUOTHED TAPE
0P1 TAPE.:.
NO.
VAR TITLE
1RESPIRATION
2CARDIOTACHOMETER
4FINGER PULSE DC
5MUSCLE TENSION
6SKIN CONDUCTANCE
7SKIN POTENTIAL
10
TINE CODE (1.0/SEC)
*IDENTIFICATION SUMARY COMPLETE
15
ATOL
0.06000
0.60000
0.00070
4.00000
0.25000
0.31000
0.50000
TTOLK 0.4
0.2
1.4
1.0
0.8
0.8
p.2

:RE
ST
......
.....
.... .
. ...
......
....
......
....
1 149
1
......
...T
TO
LD 1.5
2.0
3.0
1.5
3.0
3.0
0.2
1
NO
. PI
?618
2541 44
751
312
814
7 9

TIWE,TYPE
MPLITUDF
VARIABLE NO.
SUH,St4SO,SLUPE
1M
O..F
i
TIME TYPE
26.S EP1
2.2099
0.000E 00
74.9 LO
27.2 FS
1.8199
-0.107E 01
76.-0 RS
29.2 LO
1.0898
-0.109E 00
76.2 HI
30.0 kS
1.6897
0.134E 01
76.5 FS
30.6 HT
2.2478
.0.546E 00
77.9 LO
31.3 FS
1.8177
-0.856E 00
79.4 RS
33.5 Ln
1.1579
-0.878E-01
79.6 HI.
34.3 RS
2.0435
0.153E 01
79.7 FS'
34.7 HI
2.4538
0.862E-00
79.8 LO
:-
35.5 FS
1.8776
-0.111E 01
80.0 RS
37.5 LO
1.1338
-0.357E-01
80.1. HI
38.3 ITS
1.9957
0.147E 01
80.3 FS
36.7 HT
2.3516
0.749.E 00
85.4 EF
40.6 FS
1.5496
-0.900F 00
86.8 EP1_
41.3 LU
1.1816
-0.428E 00
86.8 EP2
42.1 I-S
1.8078
0.126E 01
87.5 BR
42.7 HT
2.3736
0.683E 00
88.3 RS
43.6 FS
1.8496
-0.884E 00
88.5 HI
45.6 LO
1.1277
-0.140E 00
%&.7 FS
46.5 RS
2.1138
0.166E 01
89.3 LU
46.9 HI
2.5137
0.900E 00
%::9.6 RS
47.8 FS
1.6759
-0.859E 00
;-;9,9 HI
49.6.1.0
1.0892
-0.247E-01
90.1 FS
50.5 RS
1.9435
0.135E 01
90.6 LU
50.9 HT
2.3599
0.101E 1)1
91.1 RS
51.9 FS
1.6815
-0.911E 00
91.3 HI.
53.0 LO
1.17.1.7
-0.365E 00
91;6 FS
53.8 RS
1.9155
0.134E 01
92.1) LO
54.2 HT
2.3055
0.889E 00
92.3 RS
55.0-FS
1.7699
-0100E 01
92.7 HI
56.2 LO
1.1519
-0.335E 00
93.0 FS
56.9 RS
1.8479
0.12E
93.5 LO
57.5 HI
2.2857
0.469E 00
93.8 RS
58.1 FS
1.7858
-0.104E 01
94.4 HI
59.4 LO
1.1958
-0.153E 00
4.4. FS
59.9 RS
1.5815
0.117E 01
95.1 LO
60.7 HI
2.2237
0.815E 00
95.5 RS
61.3 FS
1.8897
-0.969E 00
95.8 HI
63.0 LU
1.1056
-0.129E 00
96.0 FS--
63.9 RS
1.9358
0.136E 01
96.6 LO
64.3 HI
2.2918
0.736E 00
97.0 RS
65".1 FS
1.7957
-0.925E 00
97.2 HI
66.8 Li)
1.1239
-0.247E-01
97.5 FS
67.6 RS
1.8655
0.139E 01
68.1 HI
2.3599
0.791E 00
98.8 RS.
69.0 FS
1.8056
-0.876E 00
99.0 HI
70.5 LO
1.1656
-0.170E 00
99.3 FS
71.7 RS
1.9039
0.129E 01
100.1 LU
72.2 HI
2.3196
0.601E 00
100.4 RS
72.9 FS
1.9418
-0.845E 00
100.9 H I

TABLE 1 Continued
FOUND WAS
2618
No.PI STORED WAS
2618
AMPLITUDE SUM,SMSO,SLOPE
1.1854
3.0317
3.4959
2.7757
1.6578
5.0456
5.6438
5.1478
4.6935
.6.5156
6.7474
6.1355
2.4247
'2.3758
0.0109
2.2692
4.3177
5.0555
3.8898
1.8095
3.8359
5.4999
-4.1057
2.0517
4.5237
5,5499
3,8217
2,0237
3.9019
5.9437
4.3056
2.2418
3,6799
4,3715
3.5355
2.0275
-.3.2839
4,1199
3.3157
.2:1478
_3,6695
.4.3919
3.5179
2;1819
3;8475
4;4056
3.6678
2;0737
2;8999
4.3375
-0.225E 00
0.289E 01
0.266E 01
- 0.272E 01
-0.255E 00
0.479E 01.
0.405E 01
-0.336E 01
- 0.336E 01
0.803E 01
0.803E 01
- 0.288E 01
0.000E 00
0.193E 01
0.739E 00
- 0.134E 00
0.546E' 01
0.466E 01
- 0.599E 01
-0.249E 01
0.791E 01
0.791E 01
- 0.675E 01
- 0.345E 01
0.697E 01
0.604E 01
- 0.677E 01
- 0.413E 01
0.819E 01
0.458E 01
- 0,580E_01
- 0.325E 01
0.530E 01
0.240E 01
- 0,329E 01
-0.119E 01
0.470E O1
0.293E 01
-
0.393E
0.140E
0.473E 01
0,411E 01
70.411E 01
-0.102E 0'1
0..340E
0,311E
- 0.354E
-0.99.4E
0.342E
.0.269E
TIME TYPE
AMPLITUDE
101.2 FS
3.4816
101.9 LU
2.0578
102.4 RS
-3.3196
102.7 HI
4.2155
103.1 FS
3.3295
103.7 LO
2.0874
104.2 RS
3.1718
104.6-HI
_4.0337
104.9 FS
3.1537
105.5 LU
2.0858
105,9 PS
2.9779
106.4 HI
4.0139
106.7 FS
3.1355
107.2 LO
2.1759
107.6 RS
3.0757
107.9.HI
3.7975
108.2 FS
.3.0954
108.8 LO
1.9979
1C)9.3 RS
2.8779
109.9. HI
-4.2897
110.4 FS
3.3937
111.2 LO
1.9836
112.0. RS
-
3.7134
112.4 HI
4.4259
112-.8 FS
-
3.3196
113.5 LO
2.0918
114.1 RS
3.2679
114.5 HI
- 4.4078
114.9 FS
3.4157
115.9 LU
1.9276
116.6 PS
3.5519
116.9 HI
-
4.1996
117.2 .FS
3.3816
117.9 LU
2.1715
118.5 RS
3,1158
11.8.8 HI
- 3.8195
119.1 FS
.2.9938
119.9 tO
-2.0874
120.-5 :RS
3.4256
120.9 'HI
4.3435
121.3 FS
122.2 LO
122.6-RS
12 3 0 HI
123.3 FS
124,1 LO
124,6-RS
124.9 HI
125.1FS
125.910
3.4239.
2.0654
3.1658
4,2139
1'1674
2.0874.
3.4855
'4.2496
-3.4558
`2.1539.
SUM,SMSO,SLOPE:
- 0.332E 01
- 0.131E 01
0.358E 01
0.306E 01
-0.327F. 01
- 0.153E 01
0.307E 01
0.189E 01
- 0.313E 01
- 0.105E 01
0.329E 01
0.154E 01
- 0.321E: 01
-0,145E 01
0.313E 01
0.245E 01
-0,286E 01
- 0.128E 01
0.274E 01
O .274E 01
- 0.243E 01
-0.136E C)1
0.270E 01
O .158E 01
70.337E 01
- 0.100E 01
0,328: 01
O .286E 01
- 0.326E 01
- 0.422E 00
n.32?i-- 01
O .221E 01
- 0.373E 01
,-0.785E 00
0.298E 01
0.246E 01
-0.313E 01
- 0.313E 01
0,341E 01
0.196E .01
- 0.302E 01
- 0.395E 00
0.352E 01
0.253F 01
-0,379E 01
-'0,417E 00
,0.4081E 01
0..275E 01
- 0.407E 01
-70.494E 00

0.-I
ON
ON
CN
ON
O00
0000
0000
0Z
0 0
(\!C
NC
.-w
t"\V
.7.-
N0r
4')C
NO
NC
-*:.
0000
0000
0000
00C
'L
UL
UL
UL
U 1
.1JU
J L
UL
U L
IJ;1
.J2J
NIC
).-4
;...,0
'..f)
(.4
q...)
CN
sCt -
R0
rt"C
CP
.-1C
-.1"
N r
C)
Ccp
.r..1
0`0-
10I
4"is
0000
0OC
CC
CO
CC
OC
L .
C 1
: 1 7
.1
11
11
I
N1
n U)
-f)
LU
NN
CC
J\'J
cNO
'fl-4
...71
z":1
;_c
tryl
l -.1
\ V-0
Lc\
r-,
:NI
cc:0
cC,
r\J
1-c
C -
1 -
0 c
\J,-
-; N
-C
sc:(
\JO
, a:.
cnrn
att
._,
0-sc
.()
Inco
.-o-
41--
crsc
so
Lt.
<
Nz\
10-C
\10,
-IC
N00
0000
0,7,
LU
LU
LL
: LU
LU
LL
4L1.
I L
LJ
Ntr
,C'
\:cc
03,
OC
CO
CO
CC
II
-1":
00*.
--',
0rn
cc'C
3'fl
sCt.-
PN
t.n m
.-40
An
m
Lc\
in .0
E.-
1,-N
i-,0N
0NO
NO
N0N
ON
0r4O
N00
000:
`.00
C_`
.000
0C...
"00
LL
J U
JLJJ
UJU
J L
UL
L' L
UL
U W
LU
11J
L.1
.1L
LJ
LL
!
.00L
Cvs
) C
\!N
-3D
f-C
N0,
-ND
CC
'LN
- 'C
-4:s
rcr
,-;...
LJ
LU
LU
Lta
Ll L
UL
L3
L1J
LU
LU
LL
J4-
may
-- m
<1.
Cl r
\1N
L(1
.000
0,41
" sr
)N
O"
tv; r
s. t
cc)
c....
......
c.oc
c--.
..c.)
c)co
ccoc
coc0
00co
ccoo
cc.,
II
II
I
C N
CtN
0' 0
tr)
cc '-
'00
NO
' ,C
)O
N-
OC
IMC
pI's
IP.
1C. C
C\ C
r) M
Cr\
in N
C c
v- Q
'..9
0L.r
ION
:.-cm
--.1
-r-
-cc
--.0
:),..
0 .0
.0
LL
..! 0-N
>-
;41-
1,4"
,"_"
%ep
-tv,
;:[1-
1zr
) -
01,1
1-1(
4=-
ILL
U.
ILL
of :1
: u_
WuW
xz`
. IL
LIL
L -
JL
L _
_t
LU
cs.J
cc)
rc't
4' C
C:\.
.!L
r.M
0055
1-
r- r
--r-
r-
r- r
-L
.C.;
t.-T
Cfs
0, :7
.
N
LL
Ccc
.jc-_
,,NIr
sjc\
jor\
j0;\!
ON
NN
0NIC
L.)
-NO
NC
NO
N,0
N0N
0N'O
NC
.)0`
00:-
..C.:0
0000
,000
00.0
0000
0C.-
)0C
DC
.."00
0000
(I)
LU
L.L
11.1
:LL
I L
LJ
LL
I L
LI
LI!
WW
WW
LIR
J.J
LL
IU
i LU
LU
LL
P-L
111J
ILL
IJU
J L
LJ
LU
LL
: LU
LU
1-12
CC
-1,C
Cr.
.L' (
\IM
CP-
-=
:;L
ol 7I
IS
5;$
CC
CC
CO
CC
CC
OC
CO
CC
CC
CC
CC
CO
CO
CC
CC
CC
OO
II
0...
0r. 0
_ cz
.0
Lc;
c N
:Lr,
r,r.
cr.
; ,0r
--c:
.\
Cts
) m
-.0
0, L
..-
r+rr
)cC
cN
0',-
;r-
9900
9:r
,L
c),
tr(
)("
NJ
C.7
.(s
.: C
C. 0
'C
c:c.
-;.
<0_
cri "
-IC
C1"
--C
l f-I
t-L
rl 0
0r.
--.0
Lc)
cri cc
Cl
cxc
In C
l CC
r'fl
,C; N
.-I
0 N
O's
cc
N N
O, m
,0r-
-(-
4--
I,-
sc
2- I
CC
I Li
-
Ce)
Lf)
r-t
is-
C r
e) 0
0
CC
cc
0-. 0
",C
0", C
C 0
0
CN
Oc\
jO-4
ON
0000
0000
1.11
:1J
LU
LU
LL
LU
LL
J L
U
0C.t
'C-I
C-C
\fN
t<
1- s
C r
- 0
N L
C1
II
II
V.)
I-1V
) C
U)
0-4
5/)
CC
IUJC
CjU
_1
cc 0
.0 ,-
41.r
00.
.i
mc
Cc
Cc,
CC
C1-
4
ON
0NO
NO
N00
0000
00L
LI
LU
LU
WL
Li L
UL
U L
LI
r-,-
y0 S
C O
N-4
-C
l0'
C I
f C
.0 -
4-N
CJ
N
0000
-000
0I
II
crt
Cco
CC
. r-r
--C
lr-
-c
..ON
cc
LrI
CC
ILI-
NC
PC, 0
0'C
". f
"-tr
ir,u
)tf
ori
rnL
C?
CC
s0'C
'-CG
'
NC
)' 0"
m t.
N0,
40 C
Ccc
N-
cc c
" ,c
.'C
I
LU
r--;
Cr,
tr!
LP;
C L
T;
tf:
C.C
;(A
O tr
; --
CD
V;
Vi (
-0 C
V.,
0 tj)
."-r
%1-
-"A
V)
>-
UIL
.-J
LL
ILL
.a:
Li-
--I
al C
u --
1..1
1(_
Cu
_ --
I '2
.cL
L -
-10:
LL
f-'7
.u
ILL
-JC
L!:
LL
--f
1.--
.r-
- r-
-c
.--i
c\Je
nsel
ls)
Lcu
nr"-
ce
(NJ
c\Ir
\;(\ic
\nni
-=0'
,ri
)r,"
-q r
n cc
'ul
try_
ntr
l u-)
Lrt
t_n
u-1.
0,c
-JD
.0 s
oso
sor-
-

PI STORED WAS
2541
TIME TYPE
AOPLITUDE SUMISMS0,SLOPE.
105.1 RS
105.5 HI
105.9 FS
.106.5 LU
106.8 RS
107.1 HI
107.7 FS
108.2 LO
108.5 RS
109.0 HI
109.3 FS
109.8 LO
110.2 RS
110.5 HI
111.8 FS
112.3 LO
112.7 RS
.113..1 HI
113.5 FS
115.0. L0
115.3 RS
115.6. HI
116.1 FS
116.7 LO
117.1, RS
117.6 HI
118.8 FS
119.1 EF
..121.3 BR
121.6 RS
1221. HI
-.122.5 FS_
,123.2Lo
123.5jtS
124.2. HI
124.5.FS-
125.1. Lo
125.5.: RS
125.7.. HI
-126.-4,FS
127.1, LO..
127.4. RS
127'.7 HI
.128.4. FS
129.1, LO
129.7H.
:1
.130.5 FS
131.3. LO.
132.6_ RS
72.9880
74.6482
71.6147
68.2577
71.8771
73.6411
70.4184
69.6432
73.9097
0.160E
0.000E
-0.1$9E
0.000E
0.164E
0.000E
-0.117E
-0.183E
0.169E
020002
0002
0002
(10
02
75.0206
0.244E
00
71.6391
-0.168E
02
69.2831
-0.366E
00
73.2810
0.147E
02
74.1416
0.244E
00
70.0705
-0.178E
02
67.0369
-0.5,f91.:
00
72.5913
0.235E
274.7642
0.000E
00
71.4072
-0.195E
02
66.5364
-0.183k
00
72.3715
0.246E
02
74.5750
0.18-:)E
00
- 70.9189
-0.233E
02
66.6097
-0.366E
00
70.1132
0.120E
02
70.6076
0.000E.
00
6!.;.8223
-0.12!::
02
n000E
on
6L.2536
0.183E
00
72.8354
0.33E
02
74.7154
0.244E
00
67.3177
-0.b65E
02
57.0024
-0.122E
00
. 64.8823
-
0.355E
0?
68.5079
0.183E
00
61.8182
-0.379E
02
56.2028
-0.122E
00
67.8487
0.441E
oz
69.3990
0.115E
01
63.. 7592
-0.411t
02
56.23(15
-0.183E
00
63.3564
0.330
02
.67.1285
0.366E
00
61.7084
-0.379E
02
.54.9516
0.000E
0(1
61.5192
0.2561
02
62.9902
0.976E
00
58.4063
-0.242?,
02
54.8295
-0,244k
00
-63.6433
0.162E
02

minimal rate of change, there is little mystery about the variable's
behavior. The PI program produces too much output in a major study suchas this one to conveniently handle or inspect. Samples of the PI fromnear the beginning and end of each subject's record were printed out and
'inspected to make sure that all had gone well up to this point.
The summary computer program (See Tables 2 and 3) selected parametersfrom these P.I. The parameters we selected for this study were notexhaustive due to programming and computing limitations and are tailoredto each variable and to the experimental procedure and goals of this study.Other summary programs could be prepared for other variables and/or otherstudies from the data provided by the same P.I. program.
Cer''.n variables have similar response characteristics as to typesof responses and will be grouped together for economy of exposition. Animportant consolidation of the data was achieved by computing the meanvalue of each parameter over a uniform type of epoch. For example, in thesession of operant conditioning of HR the high trials were combined intoa single mean of each parameter.
For classical conditioning for all variables there were 8 epochs:Rest 1, (3 minutes) orienting response to the first tone, orienting responseto the first pain stimulus, the 20 high pitched tones followed by the painstimulus, (UCS), the 20 pain stimuli, low pitched tone, the no pain periodfollowing the low tone, and rest 2 (3 minutes). For operant conditioningthere were only 3 epochs for all variables. Rest, Hi and Lo, there being10 one-minute trials each of Hi and Lo with 21 one-minute rest periodsinterspersed between them. Samples of summary output are in the appendix.
Respiration was unique for our summary program. The parameters forinspiration and expiration scored separately were duration, time constant,magnitude, maximum slope and the ratio of duration of inspiration/durationof that respiration cycle and the numbers of each.
. Muscle tension, sk!n conductance and finger plethysmogram wereuniphasic response variables which could be summarized in the same manner.The parameters for increments and decrements separately were duration,time constant, magnitude, slope and latency and the number of each perepoch.
Heart rate and skin potential being multiphasic response variableshave for all the epochs other than rest, increments and decrements asfirst and also as second responses summarized separately. We thoughtthis analysis of first and second responses for diphasic variables shouldbe done since the physiological and psychological significance of HRincrements has been shown to be different from HR decrements (Graham, F.and Jackson, J. D., 1972; Lacey, J. I., 1967.) and it seems likely thatthe order in which they occur to a stimulus might carry additional signi-ficance. There are disadvantages however, of such a detailed analysisbecause the number of parameters is doubled for these diphasic variables.and the number of responses to each type may be greatly reduced sinceneither HR nor SP always has diphasic responses.
9

- ti:!')P1kr:ITIOP
TABLE 2
SUMMARY OUTPUT FOR CLASSICAL CONDITI
4esT
10UK
kO.
TC
HO.
52.00
0.51
hAG
,IEC
0.61
53.1.;0
1.47
2.01
;;EAH =
o.78
SD'!
=
53.00
0.52 NU. =
-1.49
53.00
0R P:017
NO.
TC
OUR
.HO.
0.54
2.00
PT.
1.39
1.00
0.54
1.30
1.50
2.00
-1.28
r:FAN =
0.72
SD\'
=
2.00
0.42 ilO.
=
1;,AG
PR Y,'.U0
OUR
TC
P.0
0.35
MI.
NC].
!ipr:
O.Rg
1.03
3.00
3.00 0.98 SDV =
0.33
1;:(0)1())"h2
:']11°U::
M
0.44
HI
TO
.DUR
NO.
TC
D.
1.33
26.00
30.00
1.13
L'FC
1.77
22.00
0.62
29.00
-1.13
OF
=0.22 S1JV =
0.69 W....
=
DA FA
DUR
1:0.
TC
MO.
P.17
1.32.
0.42
11.13
37.00
43.00
'9FC
1.4
36.00
0.59
36.00
-1.11
NE/\N =
0.30
S"
=0.66 Nu. =

NIN
G
0.fi
t.WPF
.:i,:
u.ul/uO
5.3.00
1.62
53.00
0.406
53.00
-1.35
53.00
800.00
ro.
SLOPE
NO,
OI/0(..
2.00
2.00
57.99
1.37
-1.36
2.00
2.00
0.4?
NO. 4.00
3.00
40.00
SLOPE
1.80
-1.18
NO. 4.u)
3.00
OI/DC
0.465
NO.
SLOPE
NO.
U I /GC.
30.00
1.37
35.00
o.42m
27.00
-1.32
34.00
170.01
NO.
SLO
PEi..
.i0.
0I/0
C43
.00
1.34
43.00
0.417
38.0
0-1
.27
38.0
077
6.99

=
'.!(-)
1;:c,
P:i3.i
i-C
1.29
1.58
:.E;_..
1.)0;
1.26
=
31.(0 0.37
r0.
37.00
TC
0.3-,
S01.1
=
TC
0.47
NO
37
35
r0
41
032.0
=0.12
:-:rn,
=
EST
,,
0uR
.0.
TC
;10.
1.79
48.00
0H-.
1.',?
4.00
ST! -
n5() 42
9

TABLE
2Continued
;1AG
JO.
SL(JP
:U.
01/
IC.
00
1.33
37.00
1.70
3,j.:)0
0.44d
00
1.19
2.6.00
1.71
37.00
1.03
NO.
=1158.99
r.AG
i.O.
SLOP
IN_;.
01/0C
00
1.12
41.00
1.45
4).00
0.400
00
1.03
35.00
1.25
35.00
1:..6.6
NO.
=783.00
iaq,
NO.
SLUFF
wU.
01/.2L
00
7.'47
4E;.00
1.41
c;,,00
U.4
,.
t..
00
J.90
4R.00
1.0t;
4k4.00
0.57
i'Yi.
=1800,00
224

t%. 1J: -
r.ATE
TABLE 2
Continued
::ST
1OUk
NO.
7C
10.
iiAG
1:4-.:
0.95
43.00
n.39
4800
4.34
2.07
39.00
0.7:i
40.00
-4.6
=60.13 SDV =
2.76 iJj. =
IC
ET AS FIRST RFSPONSE
ciR ITHF
OUR
NO.
TC
NO.
0.50
1.00
0.19
1.00
2.89
orzc
.2.3o
1.,00
1.H0
1.00
-3.72
0!---CIPT AS FIRST kF:SPOSF
nR TO .E
DOR
NO.
TC
NO.
:.t..;
!)Fr,
0.00
0.00
0.00
0.00
0.00
IC(7.
(!.O0
0.00
0.00
0.00
0.00
NFA.=
58.74 cOV =
1.18 00. =
j:.-:
'T AS FIRST k!7.SP0HSE
PR P/'
rim
iJ).
TC
PG.
:AG
IHC
0.60
1.00
0.40
1.00
3.91
UEC
0.70
1.00
0.5(4
1.00
-2.64
DECrM. AS FIRST RES?01SE
nR PAIN
OUR
00.
TC
NO.
MAG
DEC
0.00
0.00
0.00
0.00
0.00
ii.C.
' 0.00
0.00
0.00
0.00
0.00
:4EAN =
59.13 SDV =
1.47
O. =
25A

NO.
SLOPE
1W.
48.00
12.0-6
4i.00
39.00
-11.02
40.00
600.00
NO.
SLoPE
r:t.).
1.00
8.97
1.00
1.00
-7.0it
1.00
LAT 0.;9
-u. 1.00
NO.
SLOPE
NO.
LAT
1!0.
0.00
0.00
0.00
0.00
0.00
0.00
.0.00
0.00
57.99
NO.
SLOPE
NU.
LAT
i:u
1.00
13.30
1.00
1.29
1.00
1.00
-7.56
1.00
NO.
SLOPE
Ai.
LAT
:,u.
0.00
0.00
0.00
0.00
0.00
0.00
0.00
0.00
40.00
231

TA
i'ARJLF
--1-1F;;RT RATE
P'CRU=IT AS FIRST
RESPUSE
HI TOJJE
OUR
NO.
TC
NO
WC
1.62
8.00
0.46
12
DEC
1.52
7.00
n.79
10.
Dr:CU.:1E0T
&S FIRST RESPO:.SE
HI TC;I:F
DUR
NO.
IC
HO.
DFC.
1.45
'
4.00
0.92
8.
PC
1.03
8.00
0.77
8.
1EAN =
61.95 SDV
IiC,-IiPT
FIRST RESPO:SE
P.AJi
DUI:
NO.
TC
NO.
I: T.
0.61
'
10.00
0.29
11.
OK
2.04
8.00
0.59
8.
DECRET i,S FIRST RESPONS;I:
.PAI.
DUR
NO.
TC
D.
orC
1.70.
3.00
0.92
8.
IC
1.14
7.00
0.75
7.
flEAN =
60.27 SDV
IoGRENENT AS FIRST RESPOSE
LO Tft!E
OUR
i'0.
TC
NO.
INC.
0.58
8.00
0.29
12.
DF.0
1.63
.6.00
0.61
7.
DECREflEiqT AS FIRST RESPONSE
10 TO;IE
DUR
HO.
IC
NO.
DEC
1.19
4.00
0.92
7.INC
0.84
4.00
0.90
6.
MEAN =
61.47 SD'! =

E 2 Continued
NAG
NO.
SLOPE
Nb.
LAT
00
8.72
12.00.
15.49
12.00
1.57
6.00
00
-4.93
7.00
-17.32
10.00
kAG
NU.
SLOPE
NO.
LAT
00
-4.02
8.00
-10.66
8.00
0.64
4.00
00
5.47
6.00
14.00
V.00
4.59 NO. =
1170.01
kAG
NO.
SLOPE
1.40.
LAT
Lu.
)0
3.54
11.00
11.46
11.00
1.3.3
10.00
0-5.40
8.00
-14.03
6.00
NAG
NO.
SLOPE
NO.
LAY
14o.
0-6.43
8.00
-18.73
8.00
1.40
3.00
04.00
7.00
10.82
7.00
3.47 NO. =
778.99
NAG
NO.
SLOPE
NO.
LAT
NO.
5.74
13.00
15.27
13.00
1.63
: 9.00
-4.96
6.00
-12.76
7.00
NAG
NO.
SLOPE
NO.
.L
AT
NU
.
0
)0
5.03
-4.49
3.85
NO. =
7.00
4.00
1158.99
-14.19
14.36
7.00
6.00
0.32
4.00
241o
r

TABLE 2 ContinuedL
ILC
.i.-
_':
'jI;S
.F
II:S
T-:
ES
PO
NS
E
Pi,
IHD
UI:
PO
.IC
!-,:n
.F
.AC
;
I_ I.
0 .5
44.
000.
277.
003.
161
.5.
000.
575.
00-6
.36
1::;-
' F1-
i.% S
F I
k S
I R
E C
P U
f..:S
E
f ';_
lP
I\ 1;
.'D
UI.:
:113
.T
CU
.
0171
.1.
786.
001.
1912
.00
-6.1
41C
0.75
12,0
00.
4c,
12.0
03.
53=
61.1
,2 S
i)'!
=4.
02 ii
i.=
r:ST
2_D
UI:
1...1
).T
C..;
(i.
I: .1
.:0.
9634
.00
0.47
34.0
05.
190F
.C,
1.76
24.0
00
.3
24.0
0-6
.22
=56
.8 S
D'!
=4.
36 ;1
0.
254

NO.
SLOPE
NO.
LiCI
HU.
7.00
10.82
.7.00
1.15
4.00
5.00
-12.62
5.00
-NO.
SLOPE
NU.
Lk.T
r:o.
12.00
-15.15
12.00
0.44
6.00
.12.00
10.60
12.00
,785.00
-NO.
SLOPE
W.
LAT
11).
34.00
12.39
"A4.00
24.00
-14.47
24.00
1800.00

VARIALE,- GSR
!Ir--.ST
1 INC
DEC
.
OR TOE Twc
DEC
OR PAIN INC
OEC
PI
Tr,'
IPC
DEC
DEC
OUR
KO~
TC
NO'
1.00
1.00
0.50
v
'0.00
0.00
0.00
0
MEAN
=7.22
SDI! =
OUR
NO.
TC
NO
-
2.00
1.00
1.09
1--
-0.00
0.00
0.00
0.
MEAN
=7.44
SON! =
OUR
'
1.1.00
6..20
.FIEAN
OUR
=
NO. 1.00
1.00 8.76
NO.
TC
10..20
3.39
SDV =
IC
NO.
.1.''. "
NU..
2.06
8.00
1.18
_.,
0.00
0 .00
1.29
:-:
1.)EAH
=10.27
SDV =
OUR
NO:
TC
NO.
3.26
9.00
2.04
U.
- 3'.62
17.00
1.39
1T.
..MEAFF
'=-
12.40 ' SDV =

ABLE 2 Continued
00
00
0.32
00
00
0.70
itiA
GNO.
SLOPE
If..)
.
0.41
1.00
0.65
1.00
0.00
0.00
0.00
0.00
NO. =
NAG 1.33
0.00
NO. =
NAG
1000.00
NO, 1.00
0.00
57.99
NO.
SL:;PE
1.02
0.00
SLO
PE
NO. 1.00
0.00
NO.
LAT
2.79
0.00
LAT
NG.
00
8.53
1.00
1.95
1.01;
2.40.
1.00
00
-2.96
1.00
-0.76
1.00
o.00
G.00
.0.55 NO. =
40.00
kAG
MO.
SLOPE
NO.
LAT
.40.
00
2.64
20.00
1.79-
10.00
2.17
2u .0O
00
0.00
-
0.00
-0.02
1.00
-).00
0.00
1.67 NO.
1170.01
;lAG
NO.
SLOPE
NO.
LAT
NU
.00
2.76
20.00
.1.61
11.00
2.05
9.00
00
-2.19
17.00
-0.'90
17.00
6.36
9.00
1.60 N.O.
=778.99
264
>X

',IAIAP,LE 7: -GSR-
LO
DO
NO.
INC
17.00
DEC
0.00
0.00
=9.85
PAIN
DO
INC
DEC
REST 2
-F'UR
INC
2.03
DEC
0.79
MEAN
TA
BLE
.2-C
ondu
cled
-
TC
NO.
MAG_
1.12
-17.00
1.88
0.00
0.00
0.00
SDV =
1.58 NO. =
-NO.
TC
NO.
1-1AG
2.75
4..00
1.85
4.00
2.90
2.00
1.95
2.00
NEAN
=10.47
SDV =
2.70
-1.46
1.42 NO. =
NO.
TC
ro.
Flikr.
6.00
0.81
6.00
1.20
1.00
0.19
1.00
-1.33
=9.22 SDV =
0.91 NO. =

NO.
SLOPE-
a).
LAT
4;LJ.
20.00
1.44
20.00
2.29
19.00.
- 0.00
0.00
0.00
0.(10
0.00
58.99
.NO.
SLOPE
.10.
LAT
a).
5.00
2.01
4.00
6.17
4.00
.2.00
-0.84
2.00
0.00
0.00
.785.00
NO.
SLOPE
NO.
LAT
ii.
6.00
1.09
6.00
1.00
-1.42
1.U)
800.00

TP
SU
MM
AR
Y O
UT
PU
TV
AR
IAB
LE -
RE
SP
IRA
TIO
N
RE
ST
DU
RN
O.
TC
NO
.IN
C1.
6631
6.00
0.49
323.
DE
C1.
6332
4.00
0.55
329.'
ME
AN
=1.
87 S
DV
=H
I-R
AIS
ED
UR
NO
.T
CN
O.
INC
1.49
161.
000.
4116
6.D
EC
1.62
166.
000.
59167.1
ME
AN
=1.
82 S
DV
=10
-LO
WE
RD
UR
NO
.T
CN
O.
INC
1.57
142.
000.
4714
4.0
DE
C1.
59.
141.
000.
5514
4.0
ME
AN
=1.
85 S
DV
=

LE 3
R O
PE
RA
NT
CO
ND
ITIO
NIN
G
MAG
0.63
NO.
323.00
SLOPE
0.83
NO.
337.00
DI/DC
0.505
0-0.63
326.00
-0.78
331.00
0.64
NO. =
11699.09
MAG
NO.
SLOPE
NO.
DI/DC
0.51
166.00
0.75
170.00
0.479
0-0.52
167.00'
-0.68
168.00
0.47
NO. =
5377.99
MAG
NO.
SLOPE
NO.
DI/DC
0.39
144.00
0.48
152.00
0.496
-0.39
141.00
-0.43
144.00
0.35
NO. =
5111.99
28

VARIABLE - HEART RATE
TA
BLE
3 C
oncl
uded
RE
ST
DUR
NO.
TC
NO.
NAG
INC
'
1.48
314.00
0.75
635.00
19.15
DEC
1.99
306.00
0.99
623.00
-19.20
MEAN =
90.58 SDV =
12.99 NO. =
11
HI-RAISE
DUR
NO.
TC
NO.
NAG
INC
1.49
148.00
0.78
151.00
16.61
DEC
1.97
144.00
1.04
148.00
-16.80
MEAN =
94.42 SDV =
10.22 NO. =
LO-LOWER
,DUR
NO.
.TC
NO.
NAG
INC
1.34
150.00
0.67
150.00
18.11
DEC
1.94
145.00
0.95
149.0k)
-18.68
MEAN =
85.88 SDV =
9.99 NO. =
3
29
1

10. 1.00
3.00
34.0
90.
SLO
PE
44.2
2-4
5.73
SLO
PE
NO
.
323.
0032
2.00
NO
.
LAT
LAT
NO
.
NO
.
0.00
38.9
715
2.00
0.00
0.00
6.00
-38.
6014
8.00
77.9
9.
0.S
LOP
EN
O.
LAT
NO
.
0.00
43.4
515
0.00
0.00
0.00
8.00
-44.
4315
1.00
.tg
11.9
9
:1
.29.
0

RESULTS
Preliminary Analyses. The first step in the analysis of the results was toinspect thefrequency distributions for each parameter over all subjectsfrom the summary output, employing a special statistical program developedat Lafayette Clinic. Data values that exceeded 3 standard deviations fromthe mean, were identified by a data dump and the values were checkedagainst the original polygram. If values were found to be erroneous,either the correct values.were computed and inserted or, if the correctvalue could not be obtained, a missing value code was inserted. Most ofthese errors found were traced to.errors in editing.
Examples of extreme values not due to editing errors were palmar skinConductance (SC) values for 5 subjects which at times were in excess of 75micromhos whereas the mean SC is about 23 micromhos. The polygrams andlaboratory log was carefully scrutinized to seek some'rational explanation.No apparatus or electrode malfunction could be found. Other subjects,from other studies with normal SC values had been interspersed betweenthose with abnormal values which argues against any apparatus malfunction.Our present conclusion is that a combination of the high salt concentrationof the electrode paste (Redux) and the constant voltage method employed inour apparatus which permits current values to rise as skin conductancerises may for some subjects with high initial conductance levels lead tocurrents high enough to maintain and increase electrophoresis of sodiumions so that still higher abnormal conductance values are produced in apositive feedback "snow balling" effect. Special research is under wayto test this hypothesis and devise a method free from this defect. Forthis O.E. study these abnormal values of SC have been treated as artifactand edited out thus effectively preventing them from distorting the dis-tributions.
No variable of interest had to be discarded because of error ordistortions of the distributions although the number of subjects was
reduced for some parameters. Having nearly 2000 parameters (variablesin the statistical sense) to choose from, some efficient method ofselection had to be applied. It has been shown by Paul Horst thatfactors provide superior prediction of a criterion from large sets oftest variables than does any set of variables of comparable size. At.
the Lafayette Clinic Computing Service, the factor analysis computingprogram was limited to 50 variables. We chose the strategy of doingseveral factor analysis employing sets of variables with some overlapin each to help serve as marker variables for the main factors found.The type of FA employed was principle axes with Varimax, an orthoganalrotation method (Harman, 1960).
Factors with quite substantial loadings were found with obviousrelevance to our hypotheses (for example, see Tables 4 and 5). Using thesefactorswe wanted to compute the multiple regression for grades and achieve-ment, testing whether high and low achievement. groups could be identifiedandwith what degree of significance. Achievement scores were defined asthe residuals of grades regressed or I.Q. Those residuals falling above the

TABLE 4
FACTOR LOADINGS FOR FAH*
Description*** Rotated Factor Loadings
Var-iable (1)
HR
(2)
Rl.
(3)
MAG D.
1
024
2
-236
3
-079
4
-961
5
0081 173
2 174 HR R1 MAG C N -059 137 928 201 001
3 165 HR R1 MAG I -026 233 126 957 -009
4 166 HR R1 MAG I N -003 121 951 043 -030
5 790 SC R1 MAG I N 161 851 055 189 -090
6 974 SP R1 MAG D N 090 837 115 138 003
7 966 SP R1 MAG I N 002 854 129 134 -183
8 825 SC OR Tone Standard Dev. 958 087 465 -026 -155
9 848 SC OR Pain Standard Dev. 792 116 -029 -044 -340
10 1647. MT PAIN MAG** 1 630 -101 005 005 -176
1 1637 SC PAIN MAG** I 530, 1.17 006 016 -635
12 808 SC OR Tone MAG I 937 118 -106 -026 -195
13 831 SC OR Pain MAG I' 492 070 057 -128 -440
14 '.;47 SC OR Pain SUM 645 445 022 132 -004
15 887 SC PAIN MAG D -358 -154 -036 -026 687
* All variables are from the classical conditioning session.
** These magnitude means were computed with absence of response in an epoch
treated as a response of zero (0.0) magnitude.
*** (1) Physiological variable name; (2) epoch type from which measurement was
taken; (3) parameter measured: MAG is mean response magnitude for an
epoch type, SUM is mean level of the variable over all epochs of a type,
D indicates decrement, I indicates increment, N indicates frequency of
I or D. 32

' VARIABLE
TABLE 5 FACTOR LOADINGSDESCRIPTION*
FOR FA9B.
2 3 4
ROTATED FACTOR LOADINGS(1) (2) (3) 14) 1 -7
1 1401 OC HR SUM HI-LO 258 -204 -037 206 -048 -235 -1852 1461 OC' FP D N HI-LO 312 002 133 -318 087 070 2293 1466 OC FP I N R-LO -175 210 005 -206 -051 079 1264 1460 OC FP SUM R-LO -129 -014 -328 337 -396 -110 -1105 1443 OC SC I N HI-LO 925 039 -146 -012 032 -131 0026 .1479 .0C SC D N HI-LO 902 044 -127 045 -051 -259 0367 1482 OC SP I N HI-LO 879 -083 -147 005 015 -167 -1108 1484 OC SP I N R-LO 065 060 -086 -073 818 -063 -1069 1487 OC SP D N R-LO -U66 118 064 -007 836 -108 046
10 1448 OC FP SUM R 031 981 -136 -076 058 -052 04511. 1452 OC FP SUM HI 025 982 -134 -080 063 -047 05012 1456 GC FP SUM LO 035 981 -128 -084 068 -049 04813 790 OC SC I N R 109 159 -053 007 098 -914 10514 809 OC SC I N HI 533 088 -161 040 -193 -759 06215 842 OC SC D N LO 211 079 -075 056 -198 -861 11616 966 OC SP I N R 137 -015 -031 -094 262 -699 -12917 977 OC SP SUM R -162 -126 968 073 098 024 01618 998 OC SP SUM HI -176 -141 959 060 086 012 04419 1037 OC SP SUM LO -150 -140 963 044 092 038 040
20 283 CC HR MAGD HI TONE (CRfl 045 159 -104 -017 -111 263 02921 1517 CC SP MAGI HI-LO TONE
(Discr.) -036 -006 -319 -066 -474 -003 06122 1514 CC SP MD HI-LO TONE
(Discr.) -033 -054 -279 -125 108 -055 171
23- 1301 16PF-L Suspiciousness -036 110 -130 054 169 -169 43824 1369 EPI-A Motivation to succeed -072 035 093 819 -024 025 07725 1372 EPI-D Plans work efficient, 081 -189 110 804 -025 049 00126 1375 EPI-G Articulate 118 -112 086 469 034 013 -08827 1376 EPI-H Feels Superior -099 082 -047 -055 -102 060 65728 1379 EPI-K Self-Lentered 028 099 046 090 -006 105' 703'29 1381 EPI -1 Independence of Opinbn 123 -093 086 -075 -190 -111 52630 1382 EPI-N Hai.d Worker 028 -077 004 779 047 060 02731 1383 EPI-O Neat in Dress -102 054 -043 521 -078 -096 016
;*(1) OC indicates operant and CC indicates classical conditioning; (2) Physiological variablename; (3) Parameter measured: MAG is mean response magnitude for epoch type, SUM is meanlevel of variable over all epochs of a type, i indicates decrement, I indicates increment, Nindicates frequency of I-or D. (4) HI, LO, and R indicate epoch types, singly; or incombination, e.g., HI minus LO.
33

regression line are positive and represent better grades than was predictedby I.Q., and those falling below the regression line are negative andrepresent underachievement (Table 6). Of the 99 subjects 50 were definedas low achievers and 49 as high achievers. The 50 subjects whose gradeswere below the mean were identified as the low grade group and these whosegrades were above the mean as the high grade group (Table 7).
Achievement Grcup Differences. The low achievement and low GPA groups had44 cases in common and the high achievement and high GPA groups had 43subjects in common. The correlation between achievement and GPA was .856indicating about 73% of the variance in common. These two ACH groups werethen compared on 96 operant conditioning, 38 classical conditioning, 32psychological and 64 factors by t-tests of their group mean differences. The64 factors came from 9 factor analyses of which 15 factors were composed of 43physiological variables from the classical conditioning session, 26 factorscomposed of 127 operant conditioning variables and 23'factors composed of119 psychological variables. Some of these variables were common to twoor more factor analyses and many were variables for which separate t-testswere done on the variables themselves as well as the factor scores computedfrom the factor loadings and raw scores. Thus it is rather difficult tocompute how many independent group mean t-tests were done. But even ifall the t-tests are added together they total 230 which would only produceabout 12 significant by chance. Since 44 significant differences (Table 8)were found between low and high achievement groups, we feel confident atleast 32 of them are probably significant. The variables that producedsignificant group differences are, of course, essentially the same onesthat produced significant correlations (Table 9) with the ACH criterionvariable. Since over twice as many t-tests were computed as correlationswith ACH, there were naturally more significant t-tests found, 44 as comparedto 24 significant correlations with ACH.
We regret that there was simply not enough computing time availableto exhaustively compute either all the inter correlations or all the groupmean differences for all variables. Since a rather detailed discussion ofthe variables with significant correlations with GPA and ACH follows inthe next section, no further analysis of these ACH group differences willbe made.
Employment of the 13 most discriminative factors and 3 physiologicalvariables from inspection of the correlations in a multiple regressionaccounted for 39.4% of the variance in ACH. A discriminant functionbased on these 13 factors and three variables correctly discriminated73 cases or 73.6% correct. We feared these results may have been Weakened(1) by being based on less data than was actually available since for thefactor analyses not all subjects could be included and (2) possiblybecause each factor inevitably was diluted with the variables which didnot correlate with the criterion.
Specific Discussion of Significant Correlations With ACH and GPA
Accordingly next was tried the more direct approach of selectingall variables which correlated with the criterion--achievement--signi-ficantly (.05 or better). Of the 27 significant correlations (Table 9)
34

TABLE 6
LO ACHIEVERS
(GROUP 1, N = 50)
S NO. RESIDUAL
HIGH ACHIEVERS
(GROUP 2, N = 49)
S NO. RESIDUAL
1 1 -1.27 1 2 .879
2 11 - .598 2 3 .5863 14 - .427 3 4 .9944 16 - .817 4 5 .8145 17 - .0794 5 6 .8506 18 - .8 6 7 .956
. 7 29 - .157 7 8 1.418 32 - .0703 8 9 .3729 33 - .110 9 10 .91410 34 -1.34 10 12 .10811 35 -1.28 11 13 .063112 36 - .341 12 15 .092413 38 - .310 13 19 .46214 41 - .303 14 20 0/11
....r-r..,
15 43 -1.25 15 21 .381
16 45 - .364 16 22 .36917 49 - .195 17 23 .28818 51 -1.12 18 24 .15919 58 - .711 19 25 .30820 60 - .522 20 26 .521
21 61 - .290 21 27 1.0622 63 - .262 22 28 .50423 64 - .684 23 30 .117
24 65 - .144 24 31 .081725 66 - .253 25 42 .530
26 69 - .693 26 44 .558
27 70 - .693 27 46 1.01
28 71 - .333 28 47 .516
29 75 - .00787 29 48 .329
30 77 - .816 30 50 1.46
31 79 - .101 31 52 .365
32 80 -1.10 32 53 .248
33 81 - .703 33 54 1.44
34 82 - .532 34 55 .50835 84 - .958 35 56 .874
36 85 - .510 36 57 .910
37 87 - .464 37 59 .536
38 92 - .253 38 62 .431
39 93 - .887 39 72 .355
40 96 -1.10 40 73 .245
41 97 - .424 41 76 .715
42 98 -1.32 42 78 .482
43 100 - .276 43 83 .351
44 101 - .205 44 88 .475
45 102 - .465 45 90 .0676
46 103 - .369 46 91 .113
47 104 - .413 47 94 .308
48 105 .925 , 48 95 .736
49 106 - .294 49 99 .0381
50 680 - .191
35

TABLE 7
S
NO.
LOW GRADE POINT AVERAGE(GROUP 1, N = 50)
SGPA NO. GPA
S
NO.
HIGH GRADE POINT(GROUP 2,
GPA
AVERAGEN = 49)
SNO. GPA
1 0.900 65 1.263 2 3.500 47 2.733
11 1.250 69 0.750 3 2.692 48 2.61914 1.421 70 0.750 4 3.100 50 2.72716 0.700 71 1.000 5 2.700 52 2.214
18 1.600 72 1.615 6 2.625 53 2.318
22 1.666 75 1.105 7 3.062 54 3.625
24 1.714 77 0.333 8 2.714 55 2.13625 1.642 80 1.333 9 2.000 56 2.833
29 1.250 81 1.071 10 2.285 57 2.428
31 1.636 82 1.500 12 1.736 59 2.091
32 1.300 84 1.111 13 2.353 62 1.87533 1.333 85 0.933 15 2.272 66 2.000
34 0.428 87 1.200 17 1.769 73 1.800
35 0.381 93 1.071 19 2.421 76 2.086
38 0.913 96 0.526 20 2.629 78 2.000
41 1.545 97 1.461 21 2.083 79 1.85743 0.777 98 0.777 23 1.769
45 1.300 99 1.666 26 2.444 83 2.200
49 1.285 100 1.388 27 2.583 88 2.545
51 0.170 102 0.500 28 2.500 90 2.100
58 0.916 103 1.111 30 2.076 91 3.167
60 1.363 104 0.846 36 1.875 92 2.00061 0.933 105 1.291 42 2.636 94 2.083
63 1.181 106 1.333 44 2.444 95 2.438
64 1.090 680 1.142 46 2.789 101 1.937
36

TABLE 8
. VARIABLES WITH SIGNIFICANT ACHIEVEMENT GROUP MEAN DIFFERENCES'
VAR. NO. VARIABLE NAME LO
4.2317.3018.88
1301
13691372
PSYCHOLOGICAL VARIABLES
16PF-L SuspiciousnessEPI-A Motivation to succeedEPI-D Plans work efficiently
1375 EPI-G .Articulate 10.161376 EPI-H Feels superior 11.621379 EPI -K. Self- centered 8.681381 EPI-M Independent in opinion 5.261382 EPI-N Is a hard, worker 15.821383 EPI-O Neat in dress 7.421292 McClelland N-ACH 3.281,384 Object Sort Pathological Signs 2.17FA5B-1 EPI Motivation A B C D E F I N -.27FA5B-4 EPI B-Status, C-Recog, F-Compet, K-Self Cent. .17FA9B-4 EPI Motivation A D N 0 -.30FA9B-7 EPI H feels superior, M-Iodep, 16PF-L Suspicious .34
PHYSIOLOGICAL VARIABLES FROM. C.C.
HI t PROB.
3.47 2.065 .05
20.22' 2.670 .01
22.50 2.508 .01
11.93 1.788 .05*
9.93 2.194 .05
6.74 2.527 .01
4.56 1.804 .05
17.64 1.924 .05.
8.25 2.20 , .05
4.29 .884 NS **
2.67 1.299 NS**.27 2.681 .01
-.17 2.327 -.05
.31 3.207 .01
283 HRD High Tone, CR+ (Dec Scored Neg,) C.C. -8.631514 SP-D1 H-L Tone Disc. C.C. .07
1517 SP-I1 H-L Tone Disc. CeC. .19
FA1-3 Respiration Period (CRS,-CR0) Disc. C.C. -.22
PHYSIOLOGICAL VARIABLES FROM OP.C.
-.37 3.487. .01
-9.93 1.777 .05*
-.45 2.160 05
1.41 1.701 ,05*.23 1.898 .05*
435 FPI (Time Constant Rest) 2.18 2.47 2.488 .01
790 SC .I N R 49.45 33.82 2.007 .05
798 SC D N R 28.76 13.2 1 2.385 .05
809 SC I N H 29.34 19.52 2.110 .05
819 SC D N H 19.39 8.73 2.532 .01
842 SC D N L 11.97 6.50 1.914 .05*
966 SP I N R 25.37 17.26 1.764 .05*
977 SP SUM R -26.49 -21.21 1.998 .35*
998 SP SUM H -26.96 -21.51 2.046 .05
1037 SP SUM L -26.58 -21.15 2.061 .05
1448 FP SUM R -367.89 -1039.27 2.902 .01
1452 FP SUM H. -372.34 -1047.34 2.919 .01
1443 SC N H-L. .75 .29 2.140 .05
1456 FP SUM L -360.56 -1041.89 2.947 .01
1460 FP SUM R-L 7.31 2.62 2.128 .05
1461 FP D N H-L .18 -.07 2.353 .05
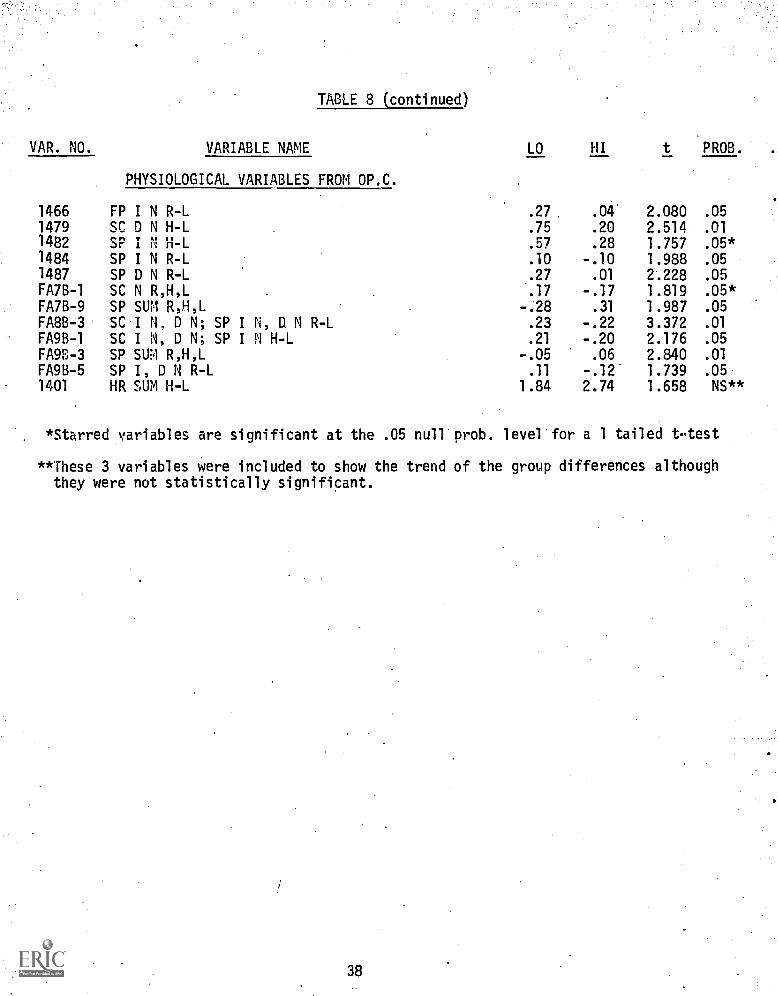
TABLE 8 (continued)
VAR. NO. VARIABLE NAME LO HI t PROB.
PHYSIOLOGICAL VARIABLES FROM OP.C.
1466 FP I N R-L .27 .04' 2.080 .05
1479 SC D N H-L .75 .20 2.514 .011482 SP I N H-L .57 .28 1.757 .05*1484 SP I N R-L .10 -.10 1.988 .05
1487 SP D N R-L .27 .01 2.228 .05FA7B-1 SC N R,H,L .17 -.17 1.819 .05*FA7B-9 SP SUM R,H,L -.28 .31 1.987 .05
FA8B-3 SC I N, D N; SP I N, D N R-L .23 -.22 3.372 .01
FA9B-1 SC I N, D N; SP I N H-L .21 -.20 2.176 .05
FA913 -3 SP SUM R,H,L -.05 .06 2.840 .01
FA9B-5 SP I, D N R-L .11 -.12 1.739 .05
1401 HR SUM H-L 1.84 2.74 1.658 NS**
*Starred variables are significant at the .05 null prob. level for a 1 tailed t test
**These 3 variables were included to show the trend of the group differences althoughthey were not statistically significant.
38

TABLE 9
VARIABLES WITH CORRELATIONS SIGNIFICANT WITH EITHER GPA OR ACH
Psychological Variables
GPAr
ACHr
No. ofVar. Name of Variable
Achievement .856 MOM.=
1368 Full WAIS I.Q. .451 -.023*1369 Edwards Personality Inventory (EPI) A. motiv. to succ. .169* .204
1372 EPI-D Plans Work Efficiently .247 .2621382 EPI-N Is a hard worker .249 .2341383 EPI-O Neat in dress .152* .197
FA9B-4 EPI - A D N 0 .273 .312
1379 EPI-K Selfcentered -.308 -.2221381 EPI-M Independent in opinion -.286 -.162*1302 16PF-M Imagination -.161* -.200FA9B-7 EPI-H,K,M, 16PF-L Suspicious (H =feels superior) -.311 -.2461291 Locus of Control C + E .215 MO I= MI
1412 Awareness of contengency in C.C. .228 OM MP
Physiological Variables from Classical Conditioning
701 MT Mag I pain C.C. -.195 Mandl.
808 SC Mag I O.R. to C.S. C.C. -.210 MMA111
877 SC Mag I Pain C.C. -.225 MOMM
FA3B-5 SC Low Mag I to pain .217 .203
1514 SP Mag D. Disc.(CR4.-CR0) (Dec Scored neg) -.093* -.203
(Table 9 continued on next sheet)
39

Table 9(continued)
Physiological Variables from Operant Conditioning
No. ofVar. Name of Variable
GPA ACH
1037 SP SUM R .223 .223998 SP SUM H .233 .231
FA9B-3 SP SUM R, H, L .204 .271
1448 FP SUM R -.304 -.3491452 FP SUM H -.308 -.3521456 FP SUM L -.309 -.3541460 FP SUM R - L (FP scored neg) .277 .273
790 SC IN R -.216 -.229
809 SC IN H -.261 -.265
832 SC IN L -.237 -.2121443 SC Mag. I N H-L -.220 -.259
1479 SC Mag. D N H-L -.253 -.257
1482 SP Mag. I N H-L -.195 -.172*
1487 SP Mag. D N R-L -.166* -.220
FA9B-1 SC + SP N H-L -.222 -.2071401 HR SUM H-L .186* .190*
** Achievement scores are residuals of GPA regressed on I.Q.* Correlations starred are not significant but filled in for comparison.
All other correlations in table are significant at least at the nullprobability of .05 or less with 2 tailed test.
- Indicates that particular correlation has not been computed.
40

found with GPA (not counting achievement) nine were with psychologicalvariables, four with classital conditioning variables and 14 with operantconditioning variables. As one would expect the correlations were verysimilar with GPA and ACH since GPA and ACH are highly dependent,(r=.856),ACH being the variable composed of residuals of GPA regressed-6n I.Q.Three additional psychological variables were significantly correlatedwith achievement--16 PF M (imaginative), Edwards Personality Inventory(EPI) scale A (Motivation to Succeed), and EPI -0 (Neat in Dress).
EPI (independence of opinion) which correlated with grades didnot reach significance with ACH. Of course I.Q. is uncorrelated withachievement since the ACH scores are equally distributed above and belowthe regression line.
The motivation scores of the EPI-D (plans work efficiently) -N(is a hard worker), -0 (neat in dress), and the motivation factor FA9B-4,composed of EPI scales A,D,N, and 0 are easy to understand as contributingto good grades. EPI scales -K (self centered), -M, (independence ofopinion) and the factor, FA9B-7, composed of EPI scales -H (feels superior),-K (self centered), -M (independence of opinion) and 16 PF-L (suspiciousness)are not difficult to conceive of as likely to interfere with earning goodgrades in the social intellectual climate of many students in this inner-city school at that time. These two variables negatively correlated withgrades and achievement coula represent a rejection of the school establish-ment with self esteem related more to non-school values.
The negative correlation between grades and 16 PF scale M(imaginative) is at first glance surprising since imagination shouldbe a positive factor in scholastic achievement. It is possible thathigher levels of imagination, perhaps without sufficiently strongachievement abilities or attitudes could lead to day dreaming, lesspractical consistent application to the teacher's demands, and thus resultin lower grades than the I.Q. would predict. In our previous study,(Ax and Bamford, 1968) 16PF-M was highly discriminative (p<.01) betweenthe high and low motivation groups in favor of the high motivation group.Whether this opposite finding for the two studies is due to differences inthe student populations, differences in teacher attitudes and gradingpolicies or simply a statistical aberration cannot be determined at thistime. Because of other differences in our findings between these twostudies we suspect rather fundamental differences in the two populationsand that the teacher ratings of motivation for the Skills Center Studydiffered considerably from the GPA criterion of this study.
Only one physiological variable -- low SC response to pain fromfactor FA3B-5--from the classical conditioning session--was significantlypositively correlated with GPA and only one additional one--SP DiscMag D1 (i.e., magnitude of CR+ -CRo for decrements)--correlated signifi-cantly with ACH. This SP palmar sweating score is a major classicalconditioning discrimination score similar to those found highly discrimi-natory for the previous study (Ax and Bamford, 1968) and of course, in thesame expected direction with superior discrimination learning of thispalmar sweating response positively correlated with higher achievement.
41

The negative sign (r = -.203) of the correlation merely reflects the factthat decrements in SP are the sweating response and are scored as negative.Thus larger negative scores represent larger differences between the painreinforced CR+ and the non-reinforced CRo. The factor FA3B-5 loaded by SCprilmar sweating low magnitude of response to the UCS, pain, being positivelycorrelated with achievement suggests that the high achieving group has amore restrained or relaxed attitude toward the pain stimulus. The threesignificant negative correlations with GPA (which were not computed for theACH score)--magnitude of response of SC to the first tone (OR), to pain,and of frontalis muscle tension to pain--all support the fact that the lowGPA group responded more vigorously with less control than did the high GPAgroup. This finding supports the other evidence of less GSR lability amongthe high achieving groups and their personality scores of greater controland stability. These high achieving students who have not dropped out andare finishing their senior year in high school may be as motivated as wereour higher motivated group of the Skills Center but are also better organizedand controlled. The Skills Center group had previously failed or dropped outof school but now with added incentive of a second chance were finallysucceeding by extra effort but probably they still perform with lesscalm control. From this viewpoint it may well be that our classicalconditioning paradigm and the rather mild pain stimulus as the UCS wasbarely sufficient to test this basic limbic learning aptitude by classicalconditioning so successful in the lcwer achieving Skills Center groups.
In contrast to our meager findings with classical conditioning in thispresent study, operant conditioning was much more prolific with significantfindings. Operant conditioning consisted of 10 one minute trials duringwhich S was asked to speed up his heart rate and 1C trials during which hewas asked to lower his HR. These 20 trials were presented in a pseudo randomorder and were interspersed with 1 minute rest periods. A cardiotachometer.meter visually displayed to S his HR in a continuous' analog fashion exceptduring rest periods. Although HR was the variable of attention and feedbackit just failed to reach statistical significance in correlation with GPA orACH. We find, however, that many other autonomically controlled variablestend to be irfluenced and respond more or less during HR conditioning. Thetotal organism is being conditioned, not merely his HR. It is true, of course,that with long continued practice with onlyone variable reinforced, gradualdifferentiation is achieved as it is with skeletal behavior skills. Thuswith this brief period of practice we are not surprised that several ANSvariables also revealed evidence of conditioning and produced significantcorrelations with GPA and ACH. It was with this expectation that they wererecorded and analyzed.
The three SP variables with positive correlations with GPA and ACHindicate that a more positive skin potential (less sweating arousal) isdirectly related to ACH during the operant conditioning session. Thismore relaxed level of palmar sweating in the high achieving groups isconsistent with the lower frequency of SC and SP responses as indicated
42

by-the negative correlations with GPA and ACH for variables) SC N I R,H, L; SC N, I and D, H-L; SP N I H-L and D R-L; and the factor FA9B-1which is loaded with frequency of SC and SP H-L responses. The findingfor FP-- the index of finger skin vasoconstriction--is quite the opposite..Since FP is a negative going variable scored so that smaller or negativevalues represent vasoconstriction it is clear that the negative correlationsof FP with GPA and ACH indicate a positive relationship between fingervasoconstriction and achievement. Even the FP SUM Rest - Low positivecorrelation with GPA and ACH indicates that the high achievers constrictedmore during their effort to lower HR than did the underachievers. Thus wesee a situation where the high achievers while trying to control their HRdo not generalize to palmar sweating but focus their effort on their cardio-vascular system, operating from a more relaxed sweating level but makinglarger vascular constrictions. This finding raises .a very interestingproblem: Why did not the high achievers succeed in raising their HRrelative to their vasoconstriction significantly more than did the lowachievers? Actually they came very close to doing so. The mean HRdifference between H-L for high achievers was 2.74 beats/minute, whereasfor low achievers it was 1.84 a difference whose t-test value came within.01 of reaching the null prob of .05 for a one-tailed test. With only 20trials of this novel task it is indeed not surprising that differentiationwithin the cardiovascular system was not significantly achieved. In facttheir success in raising HR may have been attenuated by this tendency togeneralize to excessive vasoconstrictive and probably BP rise. There isa physiological compensatory mechanism which lowers HR when BP gets toohigh. We have only half the evidence to test this hypothesis of HR riseattenuation by vasoconstriction because unfortunately no BP recordingswere made during the operant conditioning. Such a finding of intellectuallyachieving persons Using vasoconstriction rather than increased HR during anunfamiliar effort is quite in line with evidence from such high achievingclinical types as essential hypertension and migraine headache sufferers;but, of course, there is no suggestion here that these high achievingstudents are heading toward psychosomatic pathology. It may only be awidespread tendency among many humans and worthy of further study.
In summary of this section then it was found that the higher achievingstudents operate from a more specifically relevant physiological arousal(cardiovascular), dissapate less of their effort in remote physiologicalsystems (sweating) but bear down more vigorously with their vascularconstriction which may have interfered with their full potential to controltheir HR. With more practice their aptitude and motivation might well haveenabled them to progress further in this subtle differentiation requiredwithin the cardiovascular system.
Multiple Regression and Discriminant Analyses for ACH and GPA
After eliminating, to the extent possible, the overlapping scoresobviously highly correlated with each other, 19 variables were used in a
N means number of increments (I) or.decrements (D) during the rest (R)high (H), or low (L) epochs. SUM means the ave. level of the variable dur-ing the R, H, or L epochs.
43

TABLE 10
REGRESSION ANALYSIS FOR ACHIEVEMENT
VarOrder
VarNo.
.
Variable NameCUMR2
A R2
PHYS PSY
1 ACH -- Dependent Variable2 1456 FP SUM L OPC .1087 .10873. 1460 . FP SUM R OPC .1661. .05744 809 SC IN H OPC .2237 .05765 FA9B-7 EPI-H,K,M; 16PF-L (Removed) .2572 .03356 998 SP SUM H OPC .2876 .03047 1302 16PF-M Imaginative .3086 .0210
8. FA9B-4 EPI-A, D, N, 0 MOTIV. .3380 .0294
9 1487 SP D N R-L OPC .3538 .015810 1379. EPI-K Self-centered .3630 .0092
11 FA9B-3 SP SUM R, H, L OPC .3728 .009812 790 SC N I R OPC .3858 .013013 1382 EPI-N Hard worker .3959 .0101
14 FA3B-5 SC - Low Mag I, Pain OPC .4044 .008515 1383 EPI-O Neat in dress .4100 .005616 1369 EPI-A Motivation to succeed .4115 .001517 1443 SC Mag I N H-L OPC .4128 .001318 FA9B-1 SC + SP N H-L OPC .4133 .000519 1514 SP DI Hi-Low Tone cc (not used)20 1372 EPI-D Plans work efficiently (not used)
Percent variance of ACH accounted for by OP Cond. Phys. Var. 30.3%
Percent variance of ACH accounted for by Psychol. Var. 11.0%
44

multiple regression to predict achievement. The step-wise regressionanalysis (Anderson and Bancroft, 1952; Efroymson, 1960) selected 16 ofthe 19 variables with a multiple R of .6429. R2 was thus .4133 whichmeasures the amount of the variance in the achievement scores accountedfor by the 16 variables. The tolerance and critical F-values were setlow (F to ADD = F to Remove = .01, TOL = 0.0). I.Q. was of course omittedfrom this calculation since I.Q. had made its contribution by helping todefine achievement. These variables can readily 'be classified .aspsychological or physiological. From Table 10 it can be seen how muchof the variance (R2) of achievement each variable contributes. Operantconditioning accounted for 30.3%, and the psychological variables accountedfor 11.0% of the variance in achievement, as ACH was defined by regressingGPA on I.Q.
It is of considerable interest to note that 30.3% of the variance inachievement is accounted for by our physiological measures whereas only11% (about 1/3) is accounted for by the psychological tests (rememberingthat I.Q. is already taken out in computing the achievement scores.)
A similar analysis was done for grades now using I.Q. as one ofthe psychological variables. These results are posted in Table 11.Not surprising is that I.Q. is the largest single contributor, 20.4%, withthe other psychological tests contributing another 9.1%. The physiologicaltests accounted for 21.3%. Thus the physiological tests are slightly morepotent in predicting grades (21.3%) than is I.Q. (20.4%). But there areadditional psychological tests that contribute another 9.1% of the variancein grades.
Taken as a totality our test battery (physiological and psychological)account for 50.9% of the variance in grades whereas I.Q. can only accountfon 20.4%. Thus our particular set of tests can predict grades about 2 1/2times as well as can I.Q. alone.
Discriminant function analyses (Mahalanobis, P. C.; 1936; Rao, C. R.,1952) for these same sets of variables were computed. For the achievementgroups 41 of 50 of the low group and 40 of 49 in the high achievement groupwere correctly classified which is82.4% correct prediction (Table 12). Forthe high and low GPA groups the discriminant functions correctly identified42 of the 49 in the high group, and 42 of the 50 in the low group correctwhich is 84.8% correct (Table 13). Such predictions are of course highlysignificant by a Chi Square test. (D2 as X2 = 58.528 and 70.092, respectively,with 19 df). Only variables which were each individually significantly cor-related with achievement (for the Achievement D.F.) or with grades (for theGPA D.F.) were employed in these discrimination analyses. Thus there is reasonto believe that there would be substantial replicability if these variableswere applied to another similar sample of high school students.
45

TABLE 11
REGRESSION ANALYSIS FOR GPA
VarOrder
VarNo. Variable Name
CUM A R2
R2 PHYS PSY
1 G.P.A.2 1368 I.Q. Full WAIS .2044 .20443 1456 FP SUM L OPC .2790 .07464 1460 FP SUM R-L OPC .3316 .05265 FA9B-7 EPI-H,K,M, 16PF-L (Removed) .3847 .05316 1479 SC ND H-L OPC .4192 .03457 1382 EPI Hard worker .4422 .02308 FA3B-5 SC Low mag to pain OPC' .4689 .02679 998 SP SUM H OPC .4837 .014810 FA9B-3 SP SUM R,H,L OPC .4892 .005511 1379 EPI Self centered .4968 .007612 1381 EPI Independence in opinion .5033 .006513 832 SC NI L OPC. .5055 .002214 790 SC NI R OPC .5080 .002515 809 SC NI H OPC .5083 .000316 '1372 EPI Plans work efficiently ..5085 .000217 FA9B-4 EPI- A D N 0 Motivation .5089 .000418 1443 SC NI H-L OPC (not used)19 1482 SP NI H-L OPC (not used)20 FA9B-1 SC + SP N H-L OPC (not used)
72737 .2952
Psychological variables accounted for 29.52% of thevariance in GPA of which 20.44% was I.Q. and 9.08% wasEPI scales. Physiological variables accounted for 21.37%of the variance in GPA of which 18.70% was from OperantConditioning and 2.67% was froth Classical Conditioningvariables.
46

TABLE 12
DISCRIMINANT FUNCTION ANALYSIS FOR ACHIEVEMENTLOW ACHIEVEMENT GROUP
L-GP H-GPPREDICTION PREDICTION
S-No.HIGH ACHIEVEMENT GROUP
L-GP H-GPPREDICTION PREDICTION
1 .371* .628 1 .431 .5682 .939 .060 2 .129 .8703 .508 .491 3 .015 .9844 .786 .213 4 .002 .9975 .429* .570 5 .368 .6136 .466* .533 6 .013 .9687 .578 .421 7 .062 .9378 .731 .268 8 .043 .9569 .207* .792 9 .212 .78710 .727 .272 10 .543* .456*11 .991 .008 11 .190 .80912 .556 .443 12 .161 .83813 .765 .234 13 .433 .56614 .824 .175 14 .053 .94615 .802 .197 15 .145 .85416 .852 .147 16 .158 .84117 .425* .574 17 .423 .57618 .241* .758 18 .228 .77119 .766 .233 19 .387 .61220 .388* .611
4)20 .506 .493*
21 .682 .317/ 21 .046 :95322 .255* .744 22 .950 .049*23 .983 .016 23 .413 .58624 .649 .350 24 .640 .359*25 .929 .070 25 .113 .88626 .717 .282 26 .335 .66427 .957 .042 27 .227 .77228 .783 .216 28 .346 .65329 .979 .020 29 .540 .459*30 .929 .070 30 .011 .98831 .977 .022 31 .089 .91032 .910 .089 32 .184 .81533 .759 .240 33 .012 .98734 .767 .232 34 .475 .52435 .925 .074 35 .758 .241*36 .200* .799 36 .327 .67237 .586 .413 37 .121 .87838 .708 .291 38 .388 .61139 .685 .314 39 .470 .52940 .812 .187 40 .449 .55041 .976 .023 41 .152 .84742 .765 .234 42 .343 .65643 .761 .238 43 .284 .71544 .685 .314 44' .473 .52645 .741. .258 45 .450 .54946 .875 .124 46 .503 .496*47 .504 .495 47 .694 .305*'48 .589 .410 48 .792 .207*49 .826 .173 49 .207* .85050 .783 .216
41 of Low GP Correct 40 of High GP Correct81 Subjects Correctly Predicted as to Achievement Group is 82.4% correct by the 19 variablessupplied to the Regression Analysis.
47

TABLE #13DISCRIMINANT FUNCTION ANALYSIS FOR GPA
S-No.LOW GPA GROUP
S-No.HIGH GPA GROUP
LOW GPPREDICTION .
HIGH GP. PREDICTION
1 .132* 1 .961
2 .924 2 .9843 .605 3 .9924 .590 4 .711
5 .192* 5 .9176 .791 6 -.986
7 .911. 7 .9418 .738 8 .6669 .996 9 ,66710 .936 10 .761
11 .520 11 .71812 .546 12 .70413 .992 13 .91314 .834 14 .981
15 .942 15 .88616 .725 16 .84817 .834 17 .307*18 .636 18 .90819 .425* 19 .036*20 .831 20 .394*21 .201* 21 .61722 .925 22 .89623 .638 23 .95824 .942 24 .51825 .669 25 .95326 .648 26 .94527 .900 27 .73628 .799 28 .39829 .893 29 .97530 .994 30 .912
31 .936 31 .991
32 .140* 32 .78933 .713 33 .56734 .437* 34 .511
35 .941 35 .54436 .559 36 .59737 .782 37 .65138 .558 38 .400*39 .913 39 .196*40 .907 40 .65941 .343* 41 .56942 .827 42 .85643 .729 47. .70844 .971 44 .90045 .963 45 .82446 .850 46 .716
47 .o59 47 .395*48 .956 48 .118*49 .938' 49 .35750 .381*
42 of low GPA GP correct. 42 of High GPA GP Correct.84 subjects of 99 were correctly predicted as to GPA GP by the 19 variables supplied to
the regression analysis. 84.34% correct.
48

DISCUSSION OF FINDINGS
The finding that a battery of psychological and psycsiologicallearning and response variables accounts for about 50% of the variancein grades, whereas I.Q. (full WAIS) canonly account for 20% indicatesthat variables are being examined which are important for earning gradesand that they can be measured in a reasonable amount of time and cost.Probably more importantly than their prediction value is the fact thatthese particular variables were selected on the basis of a theory ofmotivation which has been neglected not only in educational research butin general psychological research as well. This theory states that acrucial factor in achievement is the aptitude for learning many socialmotives, among them is earning high grades in school, and that thisaptitude can be maasured by appropriate learning tasks for those functionscontrolled by the motivational systems of the individual. The limbicsystem is known to be the chief part of the brain which mediates motivationand emotional control so essential for sustained effort in achieving anygoal. The motor system for the limbic system is the autonomic nervoussystem (ANS). Hence ANS functions are the appropriate behavior to examinefor their sensitivity, range of response and capability to modify theirresponse in terms of experience, that is to learn.
The values of this theory of motivation are that it can provide therationale for measuring, predicting, and understanding achievement ingeneral. Any human achievement which requires sustained effort requiressustained motivation sufficient to overcome the obstacles, frustrationand seduction of quicker gratification with less effort. Such motivationby which competence and goals can be achieved can only come from somegenetic or constitutional aptitude combined with appropriate environmentalopportunities for learning. Regardless of whether a current state ofmotivation is regarded as some vigorous physical-mental state not basedon learning or whether a motivational state is believed to be primarilylearned, the aptitude to become so motivated or to be able to learn to beso motivated must be a characteristic now or previously possessed by theperson. If regarded as primarily learned then the aptitude for suchlearning must have been present previously during the learning stages.The particular competence a person acquiresis clearly the resultantof the particular set of aptitudes and environmental learning and motivatinginfluences to which he is exposed. The motivational theory herein beingproposed is that there is a general aptitude to learn to be motivated.The extent to which the aptitude to be motivated and to learn to be motivated,is general, the same for all types of achievement, or is specific to eachtype of behavior remains to be determined. The history of intellectualability research suggests that motivational ability also will be found tohave a general factor that can underlie most any successful endeavor andthat there are more specific aptitudes to be motivated for various typesof activities. Many examples from life illustrate the general component ofmotivation. Many people are quite successful at several quite differenthuman achievements such as football, business, and politics; or converselywe have all known highly intelligent people who try one thing after anotherseveral of which fall clearly within their area of intellectual competence,yet fail at all of them. In-depth analyses of their histories of failureusually reveal .a lack of persistant application over sufficient time
49

for success to be achieved. So often the presence or absence of earlyenvironmental incentives or rewards seem not to be-determining insustaining the human persistance in our activity. Rather there seems
to be for the successful person an inner conviction of his abilityto achieve against all odds; or conversely the person who consistentlyfails, discounts his small successes as meaningless and feels he doesn'thave the ability to succeed. Most of us have experienced an analogousfeeling when we mistakenly undertook some behavior for which we lackedtalent. In competition with others who have such talent, say in music,art or mathematics, we quickly sense that we are fish out of water yetsome of us who had high aptitude for motivation (as proven by latersuccess in skills more appropriate for our special aptitudes) inay havepersisted for years in our misplaced effort to become a musician.
This theory of a general aptitude for motivation has enabled us toapply several well known techniques to its measurement. These areclassical and operant conditioning (learning) of functions controlled bythe ANS and hence, by the limbic system which is superordinate to the ANS.Historical inquiry by questionnaire, interview and other performancerecords are also of course useful evidence of sustained motivation. Allthree methods (classical and operant conditioning of ANS functions andpsyChological inquiry) have demonstrated their power to identify lowmotivational aptitude among mentally disturbed patients (Ax, et. al., 1970),underachievers in vocational school (Ax and Bamford, 1968) and in a publichigh school by this study. We believe the common factor in the underachieve-ment of these three different groups of people was their low aptitude forlimbic learning. For the schizophrenic patients this low aptitude was sosevere as to preclude normal emotional development necessary for maturehuman relationships. For the school groups the low limbic aptitude beingeither less severe or being accompanied by different patterns of otheraptitudes and/or environmental conditions, resulted not in severe mental oremotional disorder but rather in underachievement in their current chieflife's work. Since both statistical and clinical evidence shows this limbicaptitude to be independent of I.Q. there is justification to postulate anadditional aptitude important for achievement and emotional maturity.
The conditioning methods are applicable to humans of any age evenneonates, thus the aptitude could be measured at the earliest ages andobserved in its development. Early awareness and quantitative measuresof limbic aptitudes could provide pediatricians, child psychologists,parents and teachers with valuable data to guide their handling of eachchild. Special educational programs can be devised for the various degreesof limbic aptitude found. One can suggest various corrections orpreventive treatments, but these would of course require extensiveresearch. Just as the skeletal sensory-motor system can be exercisedand disciplined to reliable habits so can the limbic emotional andmotivational sensory-motor (ANS) systems be trained and disciplined bydeliberate programs of exercise employing known methods of reinforcement.Biofeedback of ANS functions is one new adjunct to such training.
It may be interesting to note which tests failed to contributeany significant discrimination between the criterion groups of the 85variables intercorrelated with achievement and G.P.A: 27 correlated
50

significantly with achievement and 24 with G.P.A. Thus 58 did notcorrelate significantly with achievement and 61 failed for G.P.A. Thephysiological measures which either we had previously found to besignificantly correlated with achievement or by hypothesis predictedwould be but are not found in this study to be significantly correlatedwith either achievement or G.P.A. were: (1) finger pulse unconditionedresponse to pain, (2) classical', conditional scores for HR, finger. pulse,GSR, and frontalis muscle tension response. Psychological, tests whichfailed to correlate with either achievement or G.P.A. were: (1) SocialEconomic Class, (2) Level of. Aspiration test variables including thejudgement error score, (3) scale G of the 16 P.F., and (4) Edwards scales"articulate" and "feels superior."
There are at least two possible explanations fqr these discrepancieswith our previous results: (1) Either these particular discordantcorrelations are random fluctuations departing from the true populationnorms, or (2) the populations were sufficiently different to merit differentresults. Other tests that we used but didn't produce interesting factorloadings or significant criterion group differences so were not includedin the correlation matrix were the Minnesota Counseling Inventory, Need forAchievement, Object Sorting test and Locus of Control. We cannot statewith absolute certainty that if the correlations had been done betweenall these test scores and the two criterion variables of achievement andG.P.A. that none would have reached significance, since they were screenedvia the factor analyses which, as mentioned previously, did not seem quiteas sensitive as did our direct correlation approach. The lack of obviousloadings on factors relevant to achievement on these 4 tests does stronglysupport our present findings that these tests (Minnesota CounselingInventory, Need for Achievement, Object Sorting and Locus of Control) dnot account for much of the variance in achievement or G.P.A. in thispopulation. We are not surprised by the lack of discrimination by theMCI since our previous study (Ax and Bamford, 1968) had found no supportfor the hypothesis that the low achievers are more neurotic. The objectsorting test was a surprising disappointment since'we had, assumed itwould tap cognitive abstracting abilities that would be useful in earninggrades but now in retrospect if this were a fact the object sort would bea standard part of I.Q. tests. The many recent reports on locus ofcontrol also had led us to expect a significant contribution to achievement,but possibly either the version we used (J. O. Miller) is not as sensitiveor valid as Rotter's (see Rotter, 1960) or else the social desirabilityaspect of so many of the items destrqys its validity when actual long-termbehavior like earning good grades.is involved.
Our greatest surprise and disappointment was the McClellan Need.Achievement test (McClellan, 1958). Because of his impressive successeswith it we are inclined to suspect that we did not sufficiently get thesubjects involved and/or that we did not score the protocols withenough insight and sensitivity. If the opportunity arises that we couldget one of Dr. McClelland's trained staff to rescore these n Ach protocolsfor us we would like to pursue it further.
More serious for our hypothesis than the failure of these severalpsychological tests was the very small percent of variance (about 3%) inachievement that was accounted for by our classical conditioning scores.
51

We are essentially at a loss to explain these results in view of the past
power of the classical conditioning procedure. One possibility is thatthe classical conditioning of ANS variables is primarily sensitive to verylow levels of limbic learning aptitude and that the H.S. seniors of this'study having stayed in school this long and being motivated enough toparticipate in our study were above this critical level in contrast tothose from the Skills Center study who had all dropped out of H.S. and thechronic schizophrenic patients of the earlier study who were of course muchmore seriously handicapped in terms of achievement. Another possibility isthat our psychophysiology technicians who did the testing may not havewatched for drowsiness as carefully as we did on the previous study. Bore-
dom and drowsiness can seriously degrade classical conditioning. Carefulquestioning and the frequent observations which we did during the testingphase does not lend much support to this hypothesis. Only future researchcan clarify this point.
The outstanding contribution of 30% of the variance of the operantconditioning of heart rate and the associated pattern of ANS arousalachieved by the high achieving group is a new and substantial finding.As we suggested in our 1968 study we believed that operant conditioningwould indeed besuperior for predicting achievement because it wouldmeasure the limbic learning aptitude as well as the current motivation.Motivation and emotional aptitude tests are analogous to I.Q. tests forpredicting intellectual achievement in school. Each type of aptitude testcombines the measurement of a presumed original constitutional aptitudeand the resultant skills and motives achieved through the interactionof that original aptitude and the environmental opportunities andincentives experienced in life up to this point.
The other gratifying finding is the substantial contribution of theEdwards Personality Inventory (8.9% of the variance for achievement).This demonstrates that a sophistocated self reporting inventory can elicitinformation relevant to achievement in addition to what I.Q. and psycho-physiological tests can obtain. Future efforts to predict achievementshould not omit this source of information.
The pattern of the 15 factors of the EdWards Personality Inventorytells an interesting story of what seems to contribute to achievement inH.S. and what prevents it. All the motivation and-good work habitscorrelate in the expected directions. The high achieving groups havehigher scores on motivation to succeed, desires recognition, plans workefficiently, is cooperative, articulate, logical, assumes responsibility,makes friends easily, is a hard worker and is neat in dress. Beingimpressed by status and competitiveness is irrelevant. Feeling superior,being self- centered and having independence of opinion were all higher inthe low achieving group. Among this age group and possibly because ofanti-establishment sentiment among many students during this period, itis not difficult to see that even without the social rewards of good grades
these underathieving students may feel superior, be self-centered andbelieve themselves to have independence of opinion which may mean -
independence of their perceived establishement opinion. It is possible ofcourse that these three characteristics of the underachieving group arereacted to by teachers in giving them lower grades; but then society
52

throughout their lives may also withhold rewards from them if they continueexhibiting these attitudes without sufficient of the other high motivation
characteristics. Parents, teachers and counselors might well be able toemploy this kind of finding in seeking to help their charges gain. insightand change their attitudes more in harmony with circumstances of the real
world. There is no suggestion implied that at times independence ofopinion, feeling superior and even being self centered may not be appropriateand necessary when other compensatory qualities are also present.
CONCLUSION
The findings of this study of 99 inner city high school studentssupport those of two previous studies by the senior author that autonomiclearning and selected psychological tests of motivation correlate verysignificantly with criteria of achievement. In this study 50% of thevariance in grades was accounted for: 20% by I.Q., 18.7% by operant con-ditioning of Heart Rate, 8.89% by psychological tests for motivation and3.0% by classical conditioning and response of ANS functions to pain stress.For achievement, defined as the residuals of grades regressed on I.Q.,about 41% of the variance is accounted for, distributed between autonomicconditioning (30%) and psychological tests of motivation (not includingI.Q.) 11%. The marked superiority over classical conditioning of operantconditioning of Heart Rate employing instantaneous visual feedback forthe reinforcement supports the notion that this learning paradigm testslimbic control of autonomic variables by employing continuous knowledgeof performance. It simultaneously measures the ability of limbiccontrol and the strength of current motivation elicited by the socialincentive of the experimental situation. No financial or other rewardswere given for better achievement. Thus about 3 hours of testing (1 hr.for I.Q., 1 hr. for operant control of heart rate and 1 hr. of Edwardstype motivation questions would account for 50% of variance in grades.Refinement of the testing procedure and the use of a comprehensive schoolachievement test as the criterion rather than grades would probablyfurther improve the correlations. Grades are known not to be a veryprecise or reliable measure of intellectual achievement, although theaverage over 3 years of high school must have considerable validity.
The results of these studies are substantial enough to justify thenext obvious steps in research of achievement.
1. Replication of those tests procedures found most predictiveon a non-inner city high school group should be done.
2. A predictive study of younger students is essential. Bothfuture performance in high school and past grades could becorrelated with experimental psycho-physiological variables.
3.. Pre school or first grade evaluation should be done for apredictive study where the results could be put to the bestuse.
4. Those young children found deficient in motivational andemotional control variables could be treated by specific
53

training procedures of autonomic control and in practicingdelayed gratification. Matched control groups of bothmotivationally deficient and non-deficient should be employedso as to sensitively test the value of the specialized moti-vational procedures in terms of future performance In grades,general adjustment and in psycho-physiological test performance.
5. A study should be done of infants by classical and operant ANSconditioning in which these aptitude variables would be corre-lated with future health and performance.
If these 5 programs were undertaken, within 5 to 10 years of followup, our current theory of motivational aptitude would be thoroughlytested and programs for prevention and treatment could be based on afirm foundation of fact.
It is likely that both a general aptitude for motivation andemotional development as well as specific aptitudes of motivation willbecome differentiated. Motivational testing should have a greaterimpact on special educational practices than has I.Q. and the specialsensory-motor impairments now being so well researched and treated.The concept of underachievement can fade away as the specific aptitudesand environmental factors are understood and measured. One does notspeak of a child who has little musical talent as an underachiever inmusic; why should a child who has little aptitude for learning thesocial motives or emotional control be stigmatized as an underachievereither in school or in life. Once knowledge replaces ignorance,compassion and skilled educational methods can replace condemnation,punishment or neglect of the "Underachiever" in our society.
54

REFERENCES
1. Anderson RL and Bancroft TA: Statistical Theory and Research. New York:McGraw Hill, 1952.
2. Ax AF: A validation of the Rotter-Jensen level of aspiration test, J Person-ality 15:166-172, 1946.
3. Ax AF: Electronic storage and computer analysis, In PsychophysiologicalData Retrieval and Utilization. Edited by Venables PH and Martin I.Amsterdam: North-Holland Publishing Co., 1967, pp. 481-519.
4. Ax AF: Systems and process development for selection of high stress tolerancepersonnel. Final report: NASA Contract No. NAS 2-1031. NASA, Washington,D.C., 1967.
5. Ax AF: System and process development for selection of high stress toler-ance personnel. NASA Contractor Report No. 1122. NASA, Washington, D.C.,1968.
6. Ax AF: Psychophysiology of schizophrenia, In Lafayette Clinic Studies onSchizophrenia. Edited by Tourney G and Gottlieb JS. Detroit: Wayne StateUniversity Press, 1970.
7. Ax AF and Bamford JL: Validation of a psychophysiological test of aptitudefor learning social motives, Psychophysiology 5:3:316-332, 1968.
8. Ax AF, Bamford JL, Beckett PGS, Fretz NF and Gottlieb JS: Autonomicconditioning in chronic schizophrenia, J Abnorm Psychol 76:140-154, 1970.
9. Ax AF, Singer SJ, Zachary G, Gudobba RD and Gottlieb JS: Psychophysiologicaldata retrieval and utilization, Ann NY Acad Sci 115:890-904, 1964.
10. Cofer CN and Appley MH: Motivation: Theory and Research. New York:John Wiley & Sons, 1964.
11. Edwards AL: Manual for the Edwards Personality Inventory.,Science Research Associates, 1967.
12. Efroymson MA: Multiple regression analysis, In MathematicalDigital Computors. Ralston A and Wilf HS. New York: John1960.
13. Gottlieb JS and Tourney G (Eds): Lafayette Clinic Studies iDetroit: Wayne State University Press, 1970.
5.5
Chicago:
Methods forWiley & Sons,
n Schizophrenia.

REFERENCES(continued)
14. Graham FK and Jackson JC: Arousal systems and infant heart rate responses,In Advances in Child Development and Behavior, Vol. 5. Edited by Lipsitt LPand Reese HW. New York: MacMillan, 1963.
15. Guilford JP: The Nature of Human Intelligence. New York: McGraw-Hill,1967.
16. Harman HH: Modern Factor Analysis. Chicago: University of Chicago Press,1960.
17. Impellizzeri IH, Barr D and Cooney TE. An investigation of the scholastic func-tioning of 4875 high ability secondary school students in New York, InUnderachievement. Edited by Kornrich M. Springfield: Charles C Thomas,1965, pp. 138-173.
18. Lacey JI: Somatic response patterning and stress: some revisions ofactivation theory, In Psychological Stress: Issues in Research. Editedby Appley MH and Trumbull R. New York: Appleton-Century-Crofts, 1967,pp. 14-37.
19. Lacey JI and Lacey BC: The law of initial value in the longitudinal studyof autonomic constitution: reproducibility of autonomic responses andresponse patterns over a four-year interval, Ann NY Acad Sci 98:125771290 &1322-1326, 1962.
20. Lewin K, Dembo T, Festinger L and Sears PS: Level of aspiration, In Person-ality and the Behavior Disorders, Vol. I. Edited by Hunt JM. New York:Ronald Press, 1944, pp. 333-378.
21. Mahalanobis PC: On the generalized distance in statistics, Proc Nat InstitSci, India 12:49-55, 1936.
22. McClelland DC: Risk-taking in children with high and low need for achievement,In Motives in Fantasy, Action, and Society. Edited by Atkinson JW. New York:Van Nostrand, 1958, pp. 306-321.
23. McClelland DC: Achievement motivation can be developed, Harvard Business Review43:6-29, 1965.
24. McClelland DC: Toward a theory of motive acquisition, Amer Psychol 20:321-333, 1965.
25. McClelland DC, Atkinson JW, Clark RA and Lovell EL: The Achievement Motive.New York: Appleton-Century-Crofts, 1953.
56

REFERENCES(continued)
26. McClelland DC and Alschuler AS: Achievement motivation development project.Working papers 4 through 8, 1967-68; and occasional paper No. 3, 1967.Office of Education, U.S.D.H.E.W. Contract Nos. OES 5-10-239 and 0E-0-8-071231-1747.
27. Miller JO: CLOE-C Scale (unpublished).
28. Rao CR: Advanced Statistical Methods in Biometric Research, New York:John Wiley & Sons, 1952.
29. Rapaport D, Gill M and Schafer R: Diagnostic Psychological Testing. Editedby Holt RR. New York: Int University Press, 1968.
30. Rotter JB: Some implications of a social learning theory for the predictionof goal directed behavior from testing procedures, Psychol Rev 67:301-316,1960.
31. Rubin EZ and Braun JS: Behavioral and learning disabilities associated withcognitive-motor dysfunction, Percept Motor Skills 26:171-180, 1968.
32. Schwitzgebel R: Underachievement: a common fallacy, In Underachievement.Edited by Kornrich M. Springfield: Charles C Thomas, 1965, pp. 484-487.
33. Shaw MC and McCuen JR: The onset of academic underachievement in brightchildren, In Underachievement. Edited by Kornrich M. Springfield: CharlesC Thomas, 1965, pp. 488-497.
34. Spearman C: The Abilities of Man. London: MacMillan, 1932.
57

Appendix
TableNo. Page
1. P.I. Output 61
2. Summary Output for Classical Conditioning 64
3. Summary Output for Operant Conditioning 71
4. Factor Loadings for FA3B. 73
5. Factor Loadings for. FA9B 74
6. Achievement Groups. 75
7. GPA Groups 76
8. t-tests of Criterion Group Differences 77
9. Correlates with GPA, and ACH 79
10. Regression for Achievement 81
11. Regression for GPA 82
12. Discriminant Function for ACH 83
13. Discriminant for GPA 84
14.. Approval for Research by Lafayette Clinic. Committee on Human and
Animal Experimentation 85
15. Letter of Permission to Conduct This Study by the Research and
Development Department of the Detroit Public Schools 86
16. Letter of Permission by Parents for Student to Participate 88
17. Letter of Permission by Student to Participate 89
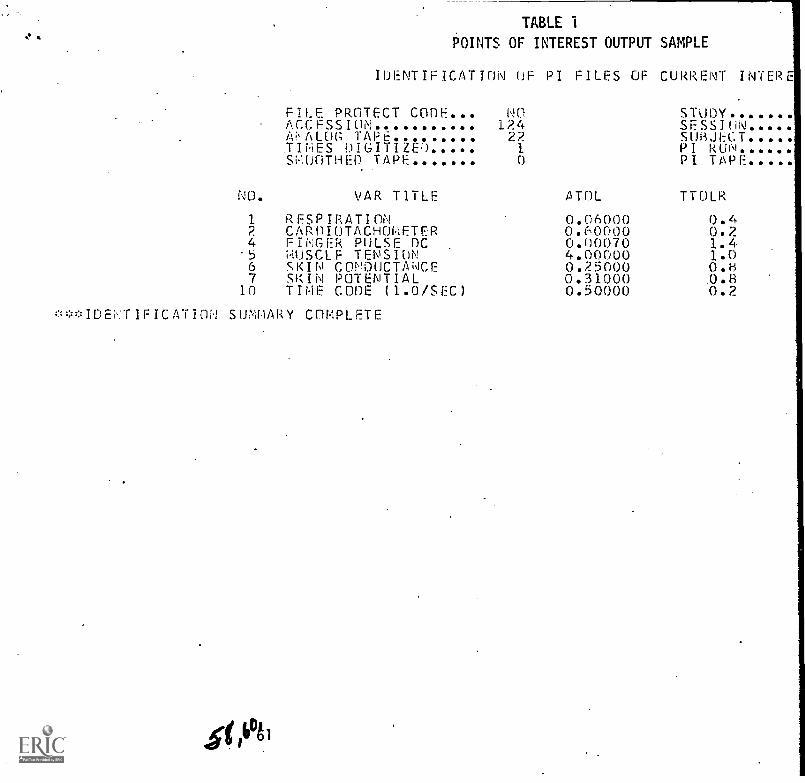
e.
TABLE 1
POINTS OF INTEREST OUTPUT SAMPLE
IDENTIFICATION OF PI FILES OF CURRENT INTER
FILE PROTECT Conti. NO STUDYACCESSION 124 SESSIONANALOG TAPE 22 SUBJECTTIMES DIGITIZED 1 PI RUNSMOOTHED TAPE 0 PI TAPE
NO.
1
2
VAR TITLE
RESPIRATIONCARDIOTACHCJIIFTER
ATM_
0.060000.60000
TTOLR
0.40.2
4 FINGER PULSE OC 0.00070 1.4'5 ;;IUSCIF TENSION 4.00000 1.06 SKIN CONDUCTANCE 0.25000 0.87 SKIN POTENTIAL 0.31000 .0.8
10 TIME CODE (1.0/SEC) 0.50000 0.2
*IDETIFICATION SUMMARY COMPLETE

TABLE I
TS OF INTEREST OUTPUT SAMPLE
ON OF PI FILES OF CURRENT INTEREST
NO STUDY1114 SFSSJHN 122 SUliJI:Cf 491 PI RUN10 PI TAPE1
ATOL TTOLR TTDLD NO. PI0.06000 0.4 1.5 26180.60000 0.2 2.0 25410.00070 1.4 3.0 4474.00000 1.0 1.5 5130.25000 0.H 3.0 1280.31000 0.8 3.0 1470.50000 0.2 0.2 9

TII;E TYPE
2e,.8 FP127.2 FS29.2 Ln30.0 RS30.6 HI31.3 FS33.5 L034.3 RS34.7 HT35.5 FS37.5 Ln38.3 iS3.7 HI4O.!- FS41.=1 Ln42.1 kS42.Y HI.4c.=6 F545.6 LO46.5 kS46.9 HI47.8 FS49.6 LC)50.5 P.
50.9 HI51.9 FS53.0 Ln53. RS54.2 HI59.0- FS56.2 Ln56.9 RS97.5 HI58.1 TS59.t!- Li59.9 PS60.7 HI61.3 FS63.n LO63.9 PS64.3 HI65.1 FS66,8 LO67.6 RS68.1 HI69.0 FS70.5 LP71.7 PS72.2 HI72.9 FS
VPLITUDE
P.?0Yt?1.81991.08981.6072,24781.=A771.15792.04392.45381.87761.13381.99972.35161.54961.1161.80782.3/361.84961.12772.1132.51.371.875Q1.089S1.94352.35991.68151.17171.91552.30951.76901.15191.f14792.28571.78iiP.1.1k4581.58192.22371.88071.10581.93582.29181.79571.12391..86592.359°1.A0561.16961.90392.31991.9418
VARIARLE HO.
SOM,SMSOISLOPE
0.000E 00-0.107E 01-n.lo9E oo0.134E 010.546E 00
-0.856E 00-0.878E-010.153E,010.862E 00
-0.111E 01-0.357E-010.142E 010.749E 00
-0.900E 00-0.428E 000.126E 010.663E 00
-0.884E 00-0.140E 000.166E 010.900E 00
-0,859E 00-0.247E-010.135E 010.101E 01-0.911E 00-0.36E 00.0.134E 010.889E 00
-0.100E 01- 0.335E 000.128E 010.469E 00
-0.104E 01-0.153E 000.117E 010.815E 00
-0.969E 01)-0.171_9E 000.136E 01.0.736E 00
-0.929E 00-0.247E-010.139E 010.791E 00
-0.876E 00-0.170E 000.129E 010.601E 00
-0.845E 00
1
TIME
74.976.076.276.577.979.479.679.779.880.080.180.389.486.F86.887.581-;.388.588.789.389.689.990.190.691.191.391.692.092.392.7c,3.093.595.894.194.495.195.595.896.096.697.097.297.598.298.899.099.3100.1100.4100.9
TABLE 1 Continued
NO.PI FU II HAS 2.618 'O.PI
TYPE AMPLITUDE SUM,SMSOrSLOPE
LO 1.1854 -0.225E 01) 1RS 3.0317 0.289E 01HI 3.4959 0.266E 01.FS 2.7757 -0.272E 01 1LU 1.6578 -0.255E 00RS 9.0456 0.479k 01 1HI 5.6438 0.405E 01 1FS 5.1478 -0.336E 01LO 4.6935 -0.336F 01 1RS 6.5156 0.803E 01 1HI 6.7474 0.803k 01 1FS 6.1355 - 0.288E 01 1ri-2.4247 0.000E 00 1FP1 2.3758 0.193E 01. 1EP2 0.0109 ().739E 00 18k 2.2692 -0.134E 00 1RS 4.3177 0.546E 01 1HI 5.0555 0.466E 01 1FS 3.8898 -0.999E 01 1
LP 1.8095 - 0.249( 01 1
RS 3,8359 0.791F 01 1
HT 5.4999 0.791k 01 1FS 4.1057 -0.675E 01 1LU 2.0517 - 0.3,45E 01 1
RS 4.5237 0.697E 01HI 5.5499 0.604E 01FS 3.8217 -0.677E 01 1
LO 2.0237 -0.413E 01 3.
PS 3.9019 0.819E 01HI 5.9437 0.458E 01 1
Fs 4.3056 -0.580E 01 1
LO 2.2418 -0.325F 01 11,S 3.6799 0.530E 01 1
HT 4.3715 0.240E 01 1
FS 3.5355 -0.329E 01 1
LO 2.0275 -0.119E 01 1
RS 3.2839 0.470F 01 1
HI 4.1199 0.293E 01 1
FS 3.3157 -0.393F 01 1
LO 2.1478 -0.140E 01 1
RS 3.6695 0.473E 01 1HI 4.3919 0.411E 01 1
FS 3.5179 -0.411E 01 1
LO 2.1819 -0.102E 01 1kS 3.8475 0.340E 01 1HI 4.4056 0.311E 01 1
FS 3.6678 -0.354E 01 1
Lit 2.0737 -0.994E 00 1RS 2.8999 0.342E 01 1
HI 4.3375 0.269E 01 1
62

10.1)1
YPE
(1
I
S0S.1
S0S.I
S
P1P2
TABLE 1 Continued
FUOHD WAS
AMPLITUDE
2618 NO.Pf STORED WAS
SI.E.1,SMSO,SLOPE TIME TYPE
1.1 ;54 -0.225E 00 101.2 FS3.0317 0.29E 01 101.9 LO3.4959 0.266F 01 102.4 RS2.7757 -0.272i:: 01 102.7 HI1.6578 -0.255E 00 103.1 FS5.0456 0.479E 01 103.7 LO5.6438 0.405F 01 104.2 RS5.1478 -0.336F 01 104.6 HI4.6935 -0.336F 01 104.9 FS .
6.5156 0.803E 01 105.5 LO6.7474 0.803T. 01 105.9 kS6.1355 -0.2WiF 01 106.4 H12.4247 0.009F 00 106.7 FS2.3758 0.193E 01 107.2 LO0.0109 (1.73,)F 00 107.6 kS2.2692 -0.134E 00 107.9 HI4.3177 0.546E 01 108:2 FS6.0555 0.466h 01 108.o La3.8.89 -0.-9° 01 109.3 RS1.8095 -0.249E 01 109.9 HI3-.8339 0.791F 01 110.4 FS5.4999 0.791E 01 111.2 LU4.1057 -0.675E 01 112.0 IS2.0517 -0.345E 01 112.4 HI4.5237 0.697F7 01 112.8 FS5.5499 0.604E 01 113.5 LO3.h-?17 -0.677E 01 114.1 RS2.0237 -0.413E 01 114.5 Hi3.9019 fl.819 01 114.9 FS5.9437 0.458E 01 115.9 LO4.3056 -0.580F 01 116.6 kS2.2416 -0.325E 01 116.9 HI3.e.799 0.530E 01 117.2 FS4.3715 0.240E 01 117.9 LO3.5355 -0.329F 01 118.5 RS2.0275 -0.119E 01 118.8 HI3.2W39 0.47(9,- 01 119.1 FS4.1199 0.293E 01 119.9 LO3.3157 -:).393E 01 120.5 RS2.1478 -0.140E 01 120.9 HI3.6695 0.473E 01 121.3 FS4.3919 0.411E (h1 122.2 LO3.5179 -0.411F 01 122.6 RS2.1819 -0.102E 01 123.0 III
3.6475 0.340E 01 123.3 FS4.40563.6678
0.311E-0.354E
0101
124.1124.6
LOI'S
2.0737 -0.9941- 00 124.9 HI2.8999 0.342E 01. 125.1 FS4.3375 0.269E 01 125.9 LU
62
2618
AMPLITUDE SW1,SNS,SLOPE
3.48162.05783.31964.21553.321:52.08743.17184.03373.15372.0858
-0.332F 01-0.131E 010.35E 010.30(',F 01
-0.327:: 01-0.15L ol0.307E 0101,.4E 01
-0.31:,1-. 01-0.1051.: 01
2.9779(i.;:MF N.
f-lie.VA2.1759
:;".(2/1X3.09541.99792.8779
-0.321f7 01-0.1411;: 010.311,E 010.245E 01
-0.2C,t 01-0.12W: 010.274L ol
=7 4.01 (?11
4.4259i..1)43:2:4 -= 1111o.2 70E 01
3.31(6 -0.337E 012.0918 1.AM N3.26794.4073.4157.1.92763.55194.19963.38162.17153.11583.01952.99382.08743.42564.34353.42392.06543.1658
g$ 1.-B H
!).?86F 01-0.326E 01-0.422F 000.3?? 01.0.221E 01-0.373[ 01-.7;i 000./.9.: 010.246E 01-0.313 01,-0.313F 01
0.341 E 010.196 01
-0.3021 01-0.Y)95F 000.352E 010.253!- 01
4.2496 0.275;.: 013.4558 -0.407i: 012.1539 -0.494k 00

TIr.E TYPE
26.P FPI.27.1 PS27.3 H12*,"1.0 FS29.9 LO31.2 RS31.r HI33.2 FS34.I LI.7
35.4 PS35.9 HI36.2 FS3.2 LD39./ kS3(.1.9 iH40.3 U-s-,
42.7_ Lr!'!5 PS43B HI.44.5 FS46./: L047.7 P.S4 1i .1 HI4',-.6 FS50.4 LO51.7.RS52.1 H't527 FS53..6 L054.8. PS55.1 HI55.R FS57.6 Lc)5F.0 c::5;
58.(: I-I
60.0 FS60.7 L0261.1 RS62.2 HI63.0 FS63.P LU65 .0 RS05.2 HI65.9 FS67.6 L0()B.', P.S
69.2 FT7 ; ).2 FS71.5 1.072.0 PS
VARPOALE NO.
AiiPLITODE SMi,SriSO,SLOPF
5.6199 0.000E 00M.R223 0.256E 02 .
6A.3R99 0.610E 0001.5375 -0.266E 0251...3R;9 -0.266E 0265.1631 0.219E 026ri.6270 0.183E 0055.92P? -0.227E 0251.5762 -0.122E 00AA.9311 0.335E 0265.5903 0.nooE 01)
63.4560 -0.170E 0254.8783 -0.244E 00(-3.4723 0.272E 02(. :::..i:9,')5 0.272E 02.V3.1550 -0.173E 0254.9699 -0.244E 0062.3004 0.219E 02649P27 0.366E 00!,=,.7552 -0,335E 02t.-.?.;153 0.000E 006.i,300 0.275E 0269.2587 0.000E 0()63.0573 -0.283E 0255.6657 0.000E-0063.3381 0.236E 02
..26 0.000E 0059. 907H -0.0RE 0255 .1469 0.000E 0061.6473 0.249E 026/;.0156 0.13E 0059.71>03 -0.234E 021.,z!..60/,- -0.322E 001)1.8854 0.266E 0262.6300 0.000E 0056.7R8P -0.140E 0254.873 -0.244E 0059.5477 0.166E 0261.3177 0.671E 0059.5233 -0.90,)E 0157.9973 -0.122E 006-?.0106 0.25311 0268.0623 0.793E 0063.2R97 -0.231E 025P.94')5 0.000E 0066.4265 0.156E 026990 0.000E 00
B946 -0.167E 0256.8315 -0.244E 00.65.7490 0.214E 02
2
TIhE
73.274.676.276.577.).78.378.979.2:i0.381.882.582.983.483.804.186.886.RR8.7890P9.45-9.890;390.690.991.491..892.292.495.596.196.496.997.397.9co1.398.599.199.7100.0100.310(1.81014101.0102.0102.6103.1103.5304.0104.?104.8
TABLE 1 Concluded
(00.1%1 FOUND HAS 2541 NO4)
TYPE AMPLITUDE SON,SflSOISLOPE
HI 66.5547 0.000E 00FS 62.4347 -0.162E 02LO 59.0040 0.000E 00RS 60.9230 0.411e 02HI 73.1894 0.427E 00FS 63.8081 -0.216E 02LH 59.4195 -0.305E 00RS 74.8802 0.664E 02HI 84.292 0.305E (II)FS 64.8457 -0.113E 03LH 47.4257 -0.366E 00RS 67.0369 0.606E 02HI 68.2943 0.000E 00FS 62.1723 -0.394F 02 1EF 55.7451 0.000F 00 1EP1 56.1906 0.608F 02. 1
EP2 0.0000 0.39111 02 1
57.5640 -0.122E 00 1
OS 68.9230 0.496E 02 1
HI 73.4580 0.244E 00 1
FS 71.5964 -0.805F-01 1
LO 70.3390 0.000E 00 1
RS 77.1935 0.296E 02 1HI 80.0500 0.549E 00FS 76.7479 -0.126E 02Lo 75.5082 0.000E 00 1
OS 79.5739 0.145E 02HI 80.1599 0.305E 00 1
FS 65.7490 -0.452E 02 1
LO 59.2425 -0.427E 00 1
E'S 68.2149 0.408E (32HI 72.5058 0.4.27E 0()FS 67.2811 -0.250E 02 1
LO 64.0156 0.000E 00 1
OS 60.2760 0.137E 02 1
HI 68.5262 0.000E 00 1FS 67.0369 -0.701E 01 1
LO 66.1336 -0.366E 00 1RS 69.9046 0.116E 02 1
81 69.8873 0.244E 00FS 68.3553 -0.964E 01 1LU 66.5101 -0.1133E 00 1
kS 72.3208 0.195E 02 1
HI 72.0110 0.427E 00 1
FS 69.3197 -0.153E 02LO 67.677. -0.66E OnOS 73.7266 0.204E 02 1.
HI 74.1599 0.183E 00 1
FS 72.0053 -0.142E 02LU 69.2831 -0.366E 00 1

.TABLE I Concl uded
FOUOD WAS 2541 NO..PI STORED WAS 2541
PE AMPLITUDE SON,SSO,SLOPE TIkE TYPE AkPLITUDE SUk,SMS0,SLOP66.554762.434759.804068.923073.189463.808159.419574.880284.298264.845747.425767.056968.2,-,;4362.172355.745156.19060.0000
57.564068.923073.458071.596470.339077.193580.050076.747975.588279.573980.159965.749059.24256.214972.505867.281164.015668.276068.526267.036966.133669.904669.887368.355366.518172.328872.11069.319767.677673.726674.159972.005369.2831
0.000E 00-0.162E 020.000E 000.411E o20.427E 00
- 0.216E 0?-0.505E on0.664E 020.305E 00
- 0.113E 03- 0.366E 000.66E 020.000F 0o
- 0.3941' 020.000E 100.(11.Wli 0?0.391E 02
-0.122E on0.696E G.,?0.244E 00
-0.885F 010.o0oE GO0.296E Cl?0.549E on
-0.126E 020.000E (Cl)0.1',5e. 02n.3o5E 00
-0.4!.;2E U2-0.427E 000./:09F 020.z!2.7E 00
...0.?50E 020.n;0 oo0.i37E 020.000E 00
-0.7o1E 010.366E 000.116E 020.244E 00- 0.964E 01- 0.183E 000...195E 020.427E 00
-0.153E 02-0.366F On0.204E 020.193E 00-0.142E 02- 0.366E 00
105.1 RS105.5 HI105.9 FS106.5 LO106.8 RS107.1 HIU7° FS106.2 LO108.5 RS109.0 HI109.3 FS109.6 LU110.2 RS110.5 HI111.8 FS112.3 LO112.7 RS113.1 HI113.5 FS115.0 LO115.3 8S115.6 HI116.1 FS116.7 LO117.1 RS117.6 HI118.8 FS119.1 EF121.5 8R121.6 RS-122.1 HI122.5 FS123.2 LO1-23.5 RS124.2 HI124.5 FS125.1 LU125.5 kS125.7 HI126.4 FS127.1 LO127.4 RS127.7 HI
8° FS129.1 LO129.5 RS129.7 HI130.5 FS131.3 LU132.6 RS
72.988074.648?71.614766.257771.877173.641170.418469.643273.909775.020671.639169.283173.281074.141670.070567.036972.591374.764%71.407266.536472.371574.575070.918966.609770.113270.607665.822363.65556,'.1,253672.835474.715467.317757.002464.882368.507961.818256.202867.048769.399063.759256.239563..356467.128561.708454.951661.5192.62.990258.406354.829563.6433
0.160E 02O .0noF 000.189L 02O .000E 000.164E 02O .000E 00
-0.117E 020.18':3E noo.16QE wr.o.2.44-c no0.161T 020.:1661.: 000.1117F: 02O .244:7 00
'-0.1-0E 020.540,: 000.235E 02O .000E 000.195E 0?
- o.183' 000.246E 02O .18?,E 00
-0.233E 02-0."7"Jo6 000.12f:L. n2O .000 no
-0.12%'':: n2O .000i: 00
no0.339E 02'0.244E 00
02-0.122E 00O .1i5;jF 02
(On°)7» 02
-0.122L 05O .4/aL 020.115E 01
-0.411E 02-0.183L 000.3:ior 020.366 000.-.179E 020.000E no0.256E n20.976E 000.242E 020.244E 000.162E 02

1, l,1A:.ii - kf:::,IRATION TABLE 2
SUMMARY OUTPUT FOR CLASSICAL CONDITIONING.:I ST 1
INC:
0..,
OUR
1.30
2.01
NO.
52.00
53.00
TC
0.51
0.61
NO.
53.00
53.00
NAG
1.47
-1.49
NO.
53.00
53.00NV:AN = 0.70 SDV = 0.52 NO. = 1800.00
nk Ti F OUR NO. TO 'NG. HAG NO.PO . 1.39 1.00 0.54 2.00 1.30 2.00OFC 1.50 2.00 0.54 2.00 -1.28 2.00
NE:AN 0.72 SDV = 0.42 NO. = 57.90PR (-:'.110 OUR NO. ,TO NO. MAG NO. .
'HT. 0.09 3.00 0.35 4.00 1.09 4.00OFC 1.03 .3.00 0.33 3:00 -0.93 3.00
NE,M! = 0.98 Slit/ = 0.42 NO. = 40.00.HI Tin!r: FAJP, NO. TO NO. NAG NU.
1:-O 1.33 26.00 ,,, 0.44 30.00 1.13 30400'OFC 1.77 22.00 0.62 29.00 -1.13 27.00
E4Cl = 0.22 SDV = 0.69 '1U. = 1170.01DAT OUR NO. T. c NO. NAG NO:
-1;..C, 1.32 37.00 . 0.42 43.00 1.13 43.00-'OK 1.84 36.00 0.59 36.00 -1.11 38.00
:iEAN = 0.30 SDV = 0.66. NO. = 778.99
64

TABLE 2....---,
'OUTPUT FOR CLASSICAL CONDITIONING.NO. riAG N'.O. 44 SLOPE NO. Ul/UC
53.00 1.47 53.00 1.62 53.00 0.406,53.00 -1.49 53.00 -1.35 53.00
0.2 :10. = 1800.00
'NU. :.',AG NO. SLOPE NO. OI/0t:
2.00 1.30 2.00 1.37 2.00 0.422.0) -1.28 2.00 -1.36 2.00
0.42 NC. = 57.99
No. i:tAG i:0. SLOPE NO. D1/01:
4.00 1.09 4.00 1.8U 4.00 0.465300 -0.93 3.00 -1.18 3.06
0.42 NU. = 40.00f
NO. :.IAG 1;ii. SLOPE al. DI/bC
30.00 1.13 30.00 1.37 35.00 0.42:A
29.00 -1.13 27.00 r1.3.2. 34.00
0.(719 l'.:1;. = 1170.01.'NU. ,/::(:; i'0. SLOPE NO. DI/GC
43.00 1.13 43.00 1.34 43.00 0.417
36.00 -1.11 36,00 -1.27 30.00
0.66 N..J. = 778.99
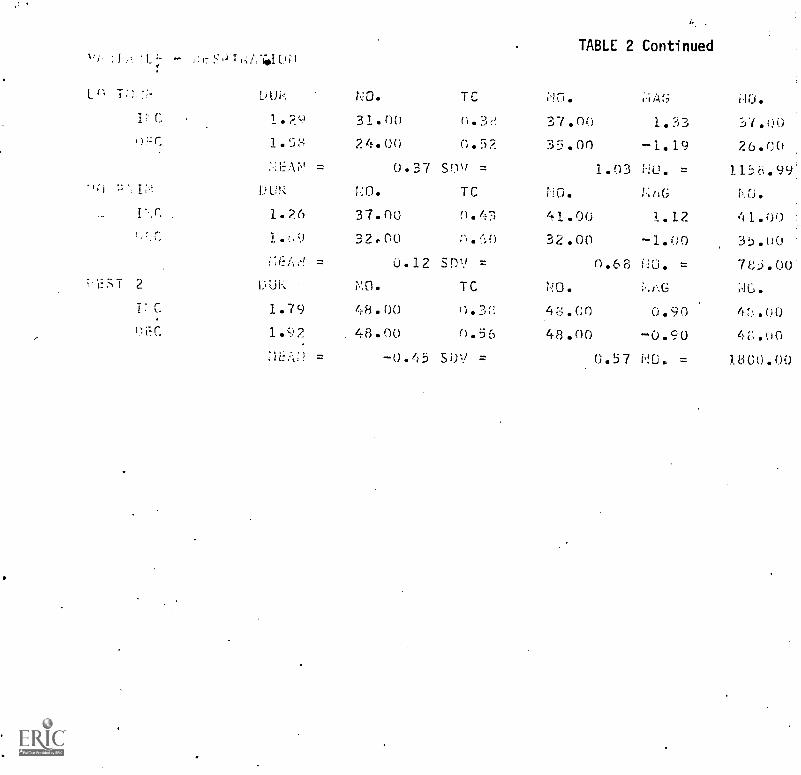
-
L0 T;L:;-.
0HC
q) '-',2.,I
r.r.
LEST 2
T:C
1.1FC
Litfr.
OUR
1.26
1.9
OUR
1.79
1.,)2
:i.
=
.
=
NO.
31.00
24.00
0.37
37.00
32r00
0.12
NO.
48.00
. '-8.00-0.45
TC
(1.3.,.
0.50.5?SOv =
0.47;
0.60
':.t.)V =
TC
0.',,
0.56
SUV =
TABLE 2 Continued
;!n. ;,ii-V4
37.00 1.?,3
70° :I1:1.03 :di:
41.00 1.12
-1.00
0.68 NU. =
i..1,.G
4;3.00
48.00
0.90
-0.90
570.57 NU. =
i,10.
Yt.00
9 9 .'1121.w658..
41.00
783.00.
3:01"
41".:..00
1=0

h. .
TABLE 2 Continued
37.1, 1.33
1.93
NO. I.:hG
32.00 1.(;0
().6,-', ;:j., =
4;.t.(;f; U.:.;()
48.M -0.V0
0 NL. =
i,f.(i
rc.J
3._).o0
700
i,f o0
t-,00
1;3(::).57
SLUPE
1.70
1.71
SLHPI7'.
.
1.2
. 1.41
-1.0.*!,
1m.
-:3:-;.:
1.:G.
41.un
35.Q0
Nb.
46.uo
it. o0
o.,i..;
DI/Lc:
ii1/,C
U.6.6;!.
65

ki,TF
-'i--SI 1 [Air; i.:0. TC
0.95 48.00 n.39
2.07 39.00 0.78
= 60.13 SDV =
IHC,:i:-:i,T i'S FIkST 1.0;-SPON5E
ri..). Ti,V; Diii: NO. TC NO. NAG NO.
TABLE 2 Continued
Ph. NO.
4Fs.00 4.34 4e.no
40.00 -4.E6 39.00
2.76 i.. = 1800.00
17:C 0.50 1.00 0.19 1.00 2.89 1.000PC
n!LGT AS
2.50
FI"ST kESPOSE
1.00 1.80 1.00 -3.72 1.00
fv;-:: Tci'lii. OUR NO. TC NO. :.";;=.G NO.
n=C 0.00 0.00 00 0.00 0.00 0.00IiT. 0.00 0.00 0.00 .0.00 0.00 0.00
NEAN = 58.74 S0\' = 1.18 NO. = 57.99
I:(7.7--T AS FIiST I:ESMNSEr :),11-; OUR. i!0. TC NO. NAG NO.
It-: 0.60 1100 0.40 1.00 3.91 1.00
0.79 1.00 0.5c; 1.00 -2.64 1.00.mi.;FT ii.S Flr-:ST iFS.PONSF.
nt.? PAU' CIU's NO. TC 'NO. HM:, NO.
DFC 0.1)0 0.00 0.00 0.00 0.00 0.00I!..; 0.00 0.00 2.00
. 0.00 0.00 0.00
:1EA;i = 59.13 snv = 1.47 NO. = 40.00
66

TABLE 2 Continued
10.0. ;i.A(.; No. SLUPE NU. LAT I :LI
39 46.00 4.34 48.0p 12.00 4.0078 40." -4.66 39,00 -11.02 40.00
2.76 . = 1800.0o
NO. i.:AG Nf;. SL(/PE !iJ, LA[ f.A.)..
9 1.00 2.69 1.00 H.97 1.00 0.;:i 1.0u0 1.00 -3.72 1.00 -7.08 1.00
Nn. ::.(; 1.0.!. SLOPE N0. LAT 0U.0 0.00 0.00 0.00 0.00 0.00 0.00 0.00)0 0.00 0.00 0.00 0.00 0.01.)
1.111 i.!ti. = 57.99
N0° flAG i';0. SLOPE 00. LAT ;Th.
0 1.00 3.91 1.00 13.30 1.00. 1.29 1.00
) 1.00 -2.64 1.00. -7.56 1.00
pm. :.i.:c, NU. SLOPE NO. .L.AT :J.J.
0
0
0.00 0.00
. 0.00 0.00
1.47 ND. =
0.00
0.00
40.00
0.00
0.00
0.00
0.00
0.00 0.00

TABLE 2 Continued
i-O 7-;.T -.... FIHST :-::)LS'I.-:'
HI ttl.!-7- .';..Jr, i.:o. IC ND. ..;AG i.:U.
TOT. 1.r,2 R.00 0.4(, 12.00 t..72 12.00
HHI. 1.52 7,( n.7c) 10.00 -4.C.}3 7.00.-1?C, ', E. ,r-::T F IKST ''.ESPIT,'S
l
"i"l--.I'il. f)UE :!o. TC iln. ,...,.7, - NU .
1.'5 4.00 r,(-.;:',= {..00 -4.02 8.00
I C 1.03 8.00 n77 Ci. 09 ''./.7 b.00
= 61.95 SM./ = 4.9 -=,- 1170.01
T ,.F, FILT LESPO.:SE
;:11. TC 10. i..,',G i..!G.
0.61 10.00 0.2c 11.00 :::):34 11.00
2.1'. R.00 05', 8.0n -5.40 8.00
Ti I S. F i:-:ST ''.T'SP'.,;':S.:-:.
p:. 1".,.... .:O. TC F.O. i.iAG NO.
i .yr,i 3.0u 0.9% 8.00 -6.43 .8.00
1.11, 7.00 ".75 7.00 400 7.0060.27 c0V = 3.47 NU. = 776.99
i.S FfltST :::sPrwsE
L::- -17i H: DU!:. PO. TO NO. VjA6 NO.
i:T. y.Z.) Fi.00 r.1.2.(.; 12.00 5.74 13.00
1.(,3 6.00 0.61 7.00 -4.06 6.00
S FIVST 1-.SP!iHcF
I C0
I' C.
=
4.00
C
.`:.)2
4.00
61.47 Sri. =
NO.
7.00 -4.49
6.00
5.08 =
7.00
4.00
11:56.99

TABLE 2 Continued
n. st_wr,E ilh. LAT .0.
12.00 6.72 12.00 15.49 12.00 1.57 6.00
10.00 7.ou -17.32 10.00
Nfl iA.i. Si (4,:.:. .%:(J. Lbcf :.0.
6.C)0 -4.02 i...00 -10.66 8.00 0.64 4.00
8.00 :3.47 i7.00 14.00 00
117,1.01
i!L. SLIJi, .:L.,. L,f . !...
11.W) 1.1..uo 11.46 11.00 1.:-, 10.0y,
01:J -j.40 o0 -.14.0'i .01.;
NO. SLl'?t i.!0. L. ',Li.
..u0 -18.73 14.00 1.4u
7.00 4.00 7.00 10.62 7.00
3.47 = 77.,:)
'..-ii.J. SL1F'I :1). Lip i.12.00 13.00 15.27 13.00 1.63 9.00
7.00 6.00 -12.76 7.00
'110. ,:.. SLuPi.i 1\0. 1._;:f ..64.
7.00 -4.49 7.00 -14.19 7.00 0.-32 4.00
6.00 ".01) 14.36 6.00
5.08 =
67

-TABLE 2 Continued
H::SPOWSE
' (1 P. 1.
07C 5.00
,%S FIKCI 1:ESPISE
NO.
07C 1.7 6.00
U.75 12.00
NEAN = 61.E2
I.',r7:ST 2 DUk
0.9r)
T:C 1.7%)
=
68
34.00
24.00
10 NO. F, A G NO.
0.27 7.00 3.16 7.00
0.57 5.00 -6.36 5.00
TC . NO. LAG NO.
1.1? 12.00 -6.14 12.00
12.00 353 12.00
SPIV = 4.02 KO. = 7E5.00
TC NO. NAG ;qt.).
n.47 34.00 5,19 34.00
',-3 24.00 -6.22 24.90
S0V = 4.36 NO. = 1800.00

TABLE 2 Continued
NO. kAG
7.00 3.16
5.00 -6.36
NU.
1,(.1.
7.00
500
St..(;PE
10.62
-1.62
SLIWE
rJO.
7.00
5.00
IW.
LAY
Li.,.T
4.00
I U12.0( -6.14 12.00 -15.15 12.00 0.44 c.) .0u
72.00 3.53 1'1.00 10'.6o 12.i)0
4.o2 ;.Th 7i;!-.).00
SLW)E NO. LAT :.0.
34.no 34.00 12.39 34.00
24.00 -6.22 24.00 .-14.47 24.00
= 1.00.00
t'
)1
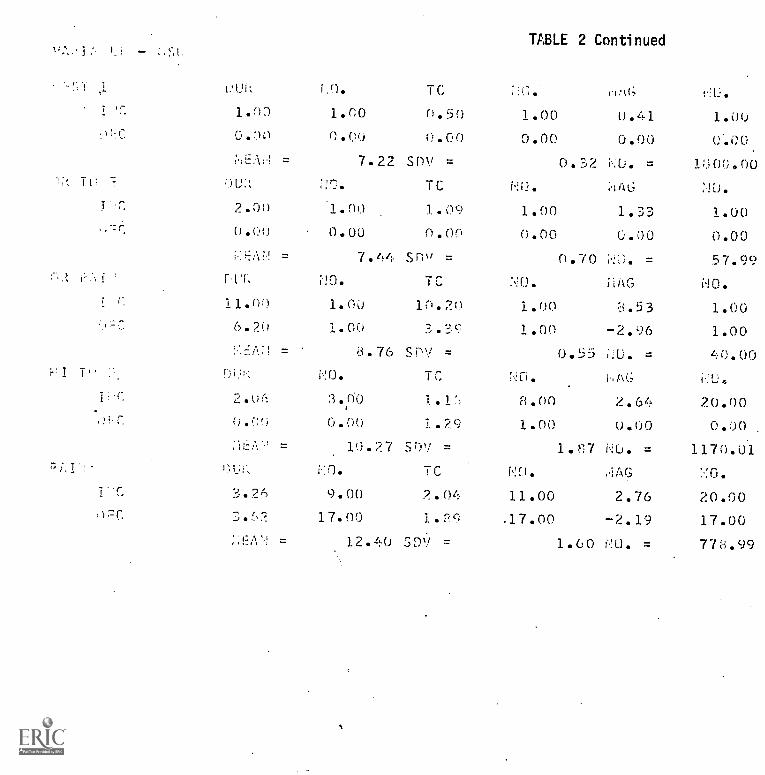
TABLE 2 Continued
NU.''.-!-,I ,1 L.W. LO.
1.00
if..;.
1.00 0.41
0.00n.00
O.
0.00
-1.',E0
:INC 0.!.)o 0.00
= 7.22 SDV = 0.32 L. =
;IAG,:r.it -,'. ;.:IL: TC :D.NO.
1.33V 2.00 .1.00 1.09
0.000.00 )..(^,((:)0.00 0.00 0.00
744 Snv = 0.70 ;.:C;. = :67799i....,C.! =
TC :,:0. ilAG NO.F.Tk
i fl 11.00 1.00 10.20 1.00 :c.53
6.20 3.'-=,c, -2.96
1.00
1.001.00
8.76 SPY =
1
;:u. ==
AG
L).00
TC NU.,i,!0. NO.
IH-, 2 0(- 3.(1. 10 .1 8.00 2.64 20.00..
.,i:F. 0.0 0.00 1.29 1.00 0.00 0.00
= 10.27 SPY = 1.07 NU. = 1170.01
i0.:. TC .,i/AG NO.
2.049.00 11.00 2.76 20.00
.17.00 -2.1917.00 17.00
=
1.P9
12.40 SDV = 1.60 i'.!0. = 778.99

O
O
9
CI
TABLE 2 Continued
flf.7,. HAG
1.00 0.41
0.00 0.00
0.32 kU. =
NO° ilAt.;
r:U.
1.0u
6. 6:0
1;:,6:'.00
n.
SLOdL:
0.65
0.60
SLHJI2
..!(.1.
1.00
0.00
HO.
1...1
Lrf
..i.).
4.0.
1.00 1.D3 1.00 1.02 1.00.
6.00 6.60 6.00 0.0u 0.00
1:u0
,',7.(:)90.70 :,.. =
i.Je.;iAG SLOPf:.
1.00 . :33
1..00
1.00 1.(;5
1.00 -2.96 1.00 -0.76
0.55 .f_*.. = 4c).on
.,;%(.;'.;0.
60 ?I.64
1.00 0.00
1.7 i.:'_,. =
r '.1. ,,, tc;
11.00 2.76
.17.00 -2.1
1.60 :'.:U. =
r!'....
20.00
e.,)0
1170.01
::0.
20.00
17.00
77.99
7/
SI (.11-):_:
1.79
-0.2
SLY.!PE-
1.61
-0.90
'11.[::.00
1.00
.:().
11.00
17.00
69
2.79
0.1,:1
.Lp.1
2.40
0.00
L.'.1
=
1.00
6.00
1.00
0.00
"u.
20.00
0.00
i.i.J.i..AT
2.05 9.00
9.006.3,'.,

Lt) 7.,7.- DUT-: !,:0, TC
ti.X. 2.06 17.00 1.1P
OFC 0.00 0.00 0.00
::11: = 9.95 SDV =;Li Plii-, DU.( NO. TO
Fir. .2.75 4.00 1.85
OFT. 2.90 2.00 1.9,i
1JiAi.: = ,10.47 S0V =
P:-L'ST 2 f)t.; NO. JC1;T. 2.03 6.00 n.F,1
1F''.' 0.79 1.00 0.19
i:IEA;1 = 9.22 SDV =
70
TABLE 2 Concluded
NO. 1.1A6 HD.
17.00 1.88 20.00
0.00 0.00 0.00
1.58 N'..). = 1156.99
NO. V./4G i..:0.
4.00 2.70 5.00
2.00 -1.46 2.00
1.42 NO. = 785.00
NO. ViAG NO. ,
6.00 1.20 6.00
1.00 -1.33 1.00
0.91 :113. = 1800.00

TABLE 2 Concluded
NO. ;1A6 ilD. SLUPE i'W. LAT Ju:17.00
0.00
1.88
0.00
1.'3it .,.J. =
20.00
0.00
115i-.99
1.44
0.00
20.00
.0.00
2.29
0.00
19.00
0.00
NO. V;AG i'.',0. SLOPE NO. LAT LU.4.00 2.70 5.00 2.01 4.00 6.17 4.002.00 -1.46 2.00 -0.84 2.00 0.00 0.00
1.42
V.O.
i.10. =
kAG
7U5.00
i,!L. SLUP7--
NO. LAT i:O.
6.00 1.20 6.00 /~l` 6.00
1.00 -1.33 1.00 ' -1.42 1.:K)
0.q1 =

TABLE 3
SUMMARY OUTPUT FOR OPERANT CONDITIONING
VARIABLE 7 RESPIRATION
REST DUR NO. TC NO. MAG NO.
INC 1.66 316.00 0.49 323.00 0.63 323.00DEC . 1.63 324.00 0.55 329.00 -0.63 326.00
MEAN = 1.87 SDV = 0.64 NO. = 11699.09HI-RA ISE DUR NO. TC NO. MAG NO.
INC 1.49 161.00 0.41 166.00 0.51 166.00DEC 1.62 166.00 0.59 167.00 -0.52 167.00
MEAN = 1.82 SDV = 0.47 NO. = 5377.99LO-LONER OUR NO. TC NO. NAG NO.
INC , 1.57 142.00 0.47 144.00 0.39 144.00DEC 1.59 141.00 0.55 144.00 -0.39 141.00
MEAN = 1.85 SOV = 0..35 NO. = 5111.99

TABLE 3
UTPUT FOR OPERANT CONDITIONING
NO.
323.00
329.00
NO.
166.00
167.00
NO.
144.00
.144.00
MAG
0.63
-0.63
0.64 NO. =
MAG
NO.
323.00
326.00
11699.09
NO.
SLOPE:
0.83
-0.78
SLOPE
NO.
337.00
331.00
NO.
DI/DC
0.505
DI/DC0.51 166.00 0.75 . 170.00 0.479
-0.52 167.00 -0.68 168.00
0.47 NO. = 5377.99
MAG NO. SLOPE NO. DI/DC
0.39 144.00 -0.48 152.00 0.496
-0.39 141.00 "-0..; 144.00
0..35 NO. = 5111.99
71

VARIABLE - HEART RATE TABLE 3 Concluded
REST DUR NO. TC NO. MAG NO.
INC 1.48 314.00 0.75 635.00 19.15 321.00.
DEC 1.99 306.00 0.99 623.00 -19.20 313.00
MEAN = 90.58 SDV = 12.99 NO. = 11634.09
HI-RAISE DUR NO.NO. TC MAG NO. .
INC 1.49 0.78148.00 1131.00 16.61 150.00
DEC 144.00 1.04 148.00 146.001.97 -16.80
MEAN = 94.42 SDV = 10.22 NO. = 5377.99
LO-LOWER DUR NO. IC NO. MAG NO.
INC 150.00 0.67 18.11 150.001.34 150.00
DEC 1.94 145.00 0.95 1.49.00 -18.68 148.00
MEAN = 85.88 SDV = 9.99 NO. = 5111.99
72

TABLE 3 Concluded
NO. MAG NO. SLOPE NO. LAT NO.
-635.00 19.15 321.00. 44.22 323.00623.00 -19.20 313.00 -45.73 322.00
12.99 NO. = 11634.09NO. NAG NO. SLOPE NO. LAT NO.
151.00 16.61 150.00 38.97 152.00 0.00 0.00148.00 -16.80 146.00 -38.60 148.00
10.22 NO. = 5377.99NO. MAG NO. SLOPE NO. LAT NO.
150.00 18.11149.00 -18.68
9.99 NO. =
150.00148.005111.99
43.45-44.43
150.00151.00
0.00 0.00
Cx

TABLE 4
FACTOR LOADINGS.FOR FA3B*
Description * ** Rotated Factor Loadings
Var-iable (1) 3 1 2 3
1 173 HR R1- MAG D. 024 q36 -079 ..961
2 174 HR R1 . MAG D N -059 '137'- 928 201
3 165 HR R1 MAG I -026 233 126 957
4 166 HR R1 MAG I N -003 '121 951 043
5 790 SC R1 MAG I N 161 851''*055 '189*
6 974 SP R1 MAG D N 090 837 115 138
7 966 SP R1 MAG I N 002 854 129 134
8 825 SC OR Tone Standard Dev. 958 087 -065 -026
9 848 SC OR Pain Standard Dev. 792 116 -029 -044
10' 1647. MT PAIN -MAG** I 630 -101 005 005
11 1637 SC PAIN MAG** I 530. 117 006' 016
12 808 SC OR Tone MAG I 937 118 -106 -026
13 831 SC OR Pain MAG I 492 070 057 -128
14 847 SC OR Pain SUM 645 445. 022 132
15 887 SC PAIN S NAG -D' 458 '-154 '436 -026
008
001
'-009
-030
-090
003
-183
-155
-340
-176
-635
-195
-440
-004
687
All variables are from the classical conditioning session.
** These magnitude means were computed with absence of response in an epoch
treated as a response of zero (0.0) magnitude.
*** (1) Physiological variable name; (2) epoch type from which measurement was
taken; (3) parameter measured: MAG is mean response magnitude for an
epoch type, SUM is mean level of the variable over all epochs of a type,
D indicates decrement, I indicates increment, N indicates frequency of
I or D. 73

TABLE 5 FACTORDESCRIPTION*
LOADINGS FOR FAN.
VARIABLE (1) (2) (3) (4) 1 2 3 4
1. 1401 OC HR SUM HI-LO 258 -204 -037 206
2 1461 OC. FP D N HI-LO 312 002 133 -3183 1466 OC FP I N. R-LO -175 210 005 -2064 1460 OC FP SUM R-LO -129 -014 -328 3375 1443 OC SC I N HI-LO 925 039 -146 -0126 .1479 .00 SC D N HI-LO 902 044 -127 '045
7 1482 OC SP I N HI-LO 879 -083 -147 0058 1484 OC SP I N R-LO 065 060 -086 -0739 1487 OC SP D N R-LO -066 118 064 -007
10 1448 OC FP SUM R 031 981 -136 -076
11. 1452 OC FP SUM HI 025 982 -134 -08012 1456 OC FP SUM LO 035 981 -128 -08413 790 OC SC I N R 109 159 -053 007.14 809 OC SC I N HI 533 088 -161 04015 842 OC SC D N LO 211 079 -075 056.
.16 966 OC SP I N R 137 -015 -031 -09417 977 OC SP SUM. R -162 -126 968 073
18 998 OC SP SUM HI -176 -141 959 06019 1037 OC SP SUM LO -150 -140 963 044
20 283 CC HR MAGD HI TONE (CR/) 045 159 -104 -01721 1517 CC SP MAGI HI-LO TONE
(Discr.) -036 -006 -319 -06622 1514 CC SP MAGD HI-LO TONE
(Discr.) -033 -054 -279 -125
23- 1301 16PF-L Suspiciousness -036 110 -130 05424 1369 EPI-A Motivation to succeed -072 035 093 81925. 1372 EPI-D Plans work efficiently 081 -189 110 80426 1375 EPI-G Articulate 118 -;112 086 46927 1376 EPI-H Feels Superior -099 082 -047 -05528 1379 EPI-K Self-Lentered 028 099 046 09029 1381 Independence of Opinbn 123 -093 086 -07530 1382 EPI-N Hard Worker 028 -077 004 77931 1383 EPI.-0 Neat in Dress -102 054 -043 521
ROTATED FACTOR LOADINGS
-048 -235 -185087 070 229-051 079 126-396 -110 -110032 -131 002-051 -259 036015 -167 -110818 -063 .-106836 -108 046058 -052 045063 -047 050'
068 -049 048098 -914 105-193 -759 062-198 -861 116262 -699 -129098 024 016086 012 044
092 038 040
-111
-474
108
263 029
-003 ; 061
055 171
169 -169 438-024 025. 077-025 049 001
034, 013 -088-102 060 657-006 105 703.
,190 -111 526047 060 027-078 -096 016
*(1) OC indicates operant and CC indicates classical conditioning; (2) Physiological variablename; (3) Parameter measured: MAG is mean response magnitude for epoch type, SUM is meanlevel of variable over all epochs o.f a type, J indicates decrement, I indicates increment, Nindicates frequency of I lor D. (4) HI, LO, and R indicate epoch types, singly; or incombination, e.g., HI minus LO.
.74

TABLE f
LO ACHIEVERS
(GROUP 1, M . 50)
S NO. RESIDUAL
HIGH ACHIEVERS
(GROUP 2, N = 49)
S NO. RESIDUAL
1 .1 -1.27 1 2 .879
2 11 - .598 2 3 .5863 14 - .427 3 4 .9944 16 - .817 4 .5' '.814
5 17 - .0794 5 6 .8506 18 - .8 6 7 .9567 29 - .157 7 .8 1.418 32 - .0703 8 9 .3729 33 - .110 9 10 .914
10 34 -1.34 10 12 .10811 35 -1.28 11 13 .063112 36 - .341 12 15 .092413 38 - .310 13 19 .46214 41 - .303 14 20 .84315 43 -1.25 15 21 .381
16 45 - .364 16 22 .36917 49 - .195 17 23 .28818 51 -1.12 18 24 .15919 58 .711 19 25 .30820 60 .522 20 26 .521
21 61 - .290 21 27 1.0622 63 .262 22 28 .504
23 64 - .684 23 30 .117
24 65 - .144 24 31 .0817
25 66 .253 25 42 .530
26 69 .693 26 44 .558
27 70 .693 27 46 1.0128 71 - .333 28 47 .516
29 75 .00787 29 48 .329
30 77 .816 30 50 1.46
31 79 - .101 31 52 ,36532 80 -1.10 32 53 .248
33 81 - .703 33 54 1.44
34 .82 - .532 34 55 .50835 84 - .958 35 56 .874-*
36 85 - .510 36 57 .910.37 87 - .464 37 59 .53638 92 - .253 38 62 .431.
39 93 - .887 39 72 .355
40 96 -1.10 40 73 .245
41 97 - .424 41 76 .715
42 98 -1.32 42 78 .482
43 100 - .276 43 83 .351
44 101. - .205 .44 88 .475
45 102 - .465 45 90 .0676
46 103 - :369 46 91 .113
47 104 - .413 47 94 .308
48 105 - .925 48 95 .736
49 106 - .294 49 99 .0381An AAn , 1A1
75
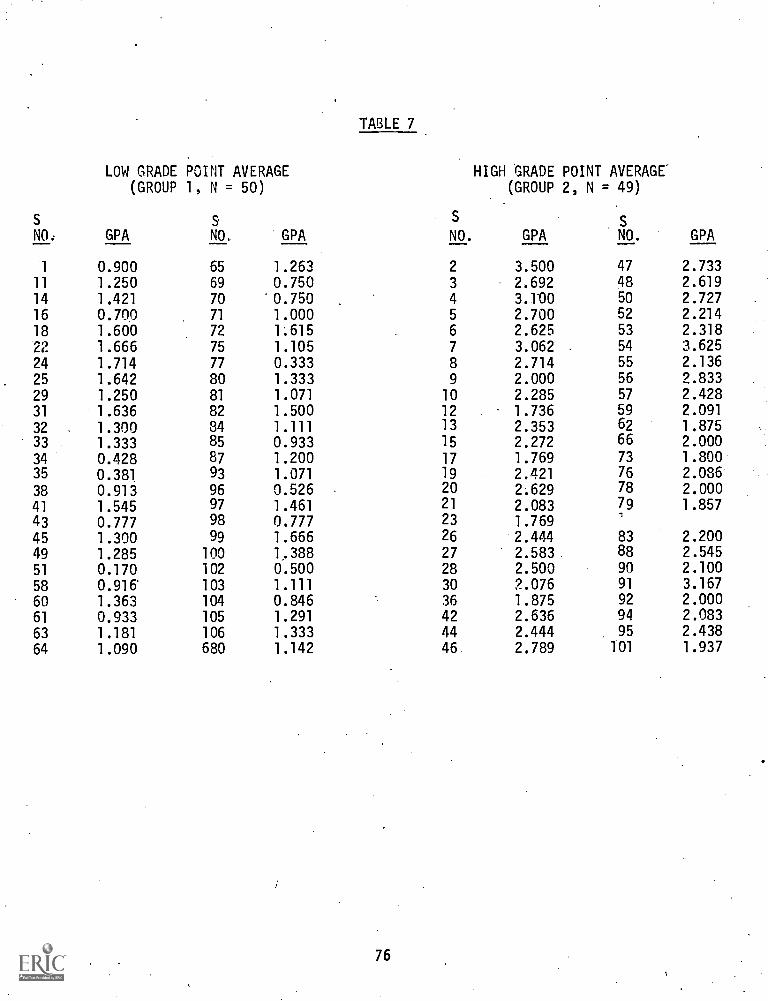
TABLE 7
S
NO
LOW GRADE(GROUP
GPA
POINT AVERAGE1, N = 50)
S
NO. GPA
S
NO.
HIGH GRADE POINT(GROUP 2,
GPA
AVERAGEN = 49)
.
SNO. GPA
1 0.900 65 1.263 2 3.500 47 2.733
11 1.250 69 0.750 3 2.692 48 2.619
14 1.421 70 0.750 4 3.100 50 2.727
16 0.700 71 1.000 5 2.700 52 2.214
18 1.600 72 1.615 6 2.625 53 2.318
22 1.666 75 1.105 7 3.062 54 3.625
24 1.714 77 0.333 8 2.714 55 2.136
25 1.642 80 1.333 9 2.000 56 2.833
29 1.250 81 1.071 10 2.285 57 2.42831 1.636 82 1.500 12 1.736 59 2.091
32 1.300 84 1.111 13 2.353 62 1.87533 1.333 85 0.933 15 2.272 66 2.000
34 0.428 87 1.200 17 1.769 73 1.80035 0.381 93 1.071 19 2.421 76 2.086
38 0.913 96 0.526 20 2.629 78 2.000
41 1.545 97 1.461 21 2.083 79 1.85743 0.777 98 0.777 23 1.769
45 1.300 99 1.666 26 2.444 83 2.200
49 1.285 100 1,388 27 2.583 88 2.545
51 0.170 102 0.500 28 2.500 90 2.100
58 0.916 103 1.11 1 30 2.076 91 3.167
60 1.363 104 0.846 36 1.875 92 2.000
61 0.933 105 1.291 42 2.636 94 2.083
63 1.181 106 1.333 44 2.444 95 2.438
64 1.090 680 1.142 46. 2.789 101 1.937
76

TABLE 8
VARIABLES WITH SIGNIFICANT ACHIEVEMENT GROUP MEAN DIFFERENCES
VAR. NO. VARIABLE NAME LO HI t PROB.
PSYCHOLOGICAL VARIABLES
1301 :16PF-L Suspiciousness 4.23 3.47 2.065 .05
1369 EPI-A Motivation to succeed 17.30 20.22 2.670 .01
1372 EPI-D Plans work efficiently 18.88 22.50 2.508 .01
1375 EPI-G Articulate 10.16 11.93 1.788 .05*1376 EPI-H Feels superior 11.62 9.93 2.194 .05
1379 EPI-K Self-centered 8.68 6.74 2.527 .01
1381 EPI-M Independent in opinion 5.26 4.56 1.804 .05
1382 EPI-N Is a hard worker 15.82 17.64 1.924 .05
1383 EPI-O Neat in dress 7.42 8.25 2.20 .05
1292 McClelland N-ACH 3.28 4.29 .884 NS**1384 Object Sort Pathological Signs 2.17 2.67 1.299 NS**FA5B-1 EPI Motivation A B C D E F I N -.27 .27 2.681 .01
FA5B-4 EPI B-Status, C-Recog, F-Compet, K-Self Cent. .17 -.17 2.327 .05
FA9B-4 EPI Motivation A D N 0 -.30 .31 3.207 .01
FA9B-7 EPI H feels superior, M-Indep, 16PF-L Suspicious .34. -.37 3.487 .01
PHYSIOLOGICAL VARIABLES FROM C.C.
283 HRD High Tone, CR+ (Dec Scored Neg.) C.C. -8.63 -9.93 1.777 .05*
1514 SP-D1 H-L Tone Disc. C.C. ;07 -.45 2.160 .05
1517 SP-I1 H-L Tone Disc. C.C. .19 1.41 1.701 .05*
FA1-3 Respiration Period (CR -CR0) Disc. C.C. -.22 .23 1.898 .05*
PHYSIOLOGICAL VARIABLES FROM OP.C.
435 FP.I (Time Constant Rest) 2.18 2.47 2.488 .01
790 SC I N R 49.45 33.82 2.007 .05
798 SC D N R 28.76 13.21 2.385 .05
809 SC I N H 29.34 19.52 2.110 .05
819 SC D N H 19.39 8.73 2.532 .01
842 SC.D N L 11.97 6.50 1.914 .05*
966 S P I N R 25.37 17.26 1.764 .05*
977 SP SUM R -26.49 -21.21 1.998 .05*
998 SP SUM H -26.96 -21.51 2.046 .05
1037 SP SUM L -26.58 -21.15 2.061 .05
1448 FP SUM R . -367.89 -1039 27 2.902 .01
1452 FP SUM H -372.34 -1047.34 2.919 .01
1443 SC I N H-L .75 .29 2.140 .05
1456 FP SUM L -360.56 -1041.89 2.947 .01
1460. FP SUM R-L 7.31 2.62 2.128. .05
1461 FP D N H-L .18 -.07 2.353 .05
77

TABLE 8 (continued)
VAR. NO. VARIABLE NAME LO HI t PROB.
PHYSIOLOGICAL VARIABLES FROM OP.C.
1466 FP I N R-L .27 .04 2.080 .05
1479 SC D N H-L .75 .20 2.514 .01
1482 SP I N H-L .57 .28 1.757 .05*
1484 SP I N R-L .10 -.10. 1.988 .05
1487 SP D N R-L .27 .01 2.228 .05
FA7B-1 SC N R,H,L .17 -.17 1.819 .05*
FA7B-9 SP SUM R,H,L -.28 .31 1.987 .05
FA8B-3 SC I N, D N; SP I N, D R-L .23 -.22 3.372 .01
FA9B-1 SC I N, D N; SP I N H-L .21 -.20 2.176 .05
FA9B-3 SP SUM R,H,L -.05 .06 2.840 .01
FA9B-5 SP I, D N R-L .11 -.12 1.739 .05
1401 HR SUM H-L 1.84 2.74 1.658 NS**
*Starred variables are significant at the 105 null prob. level for a 1 tailed t-test
**These 3 variables were included to show the trend of the group differences althoughthey were not statistically significant.
78

TABLE 9
VARIABLES WITH CORRELATIONS SIGNIFICANT WITH EITHER GPA OR ACH
Psychological Variables
No. ofVar.
13681369137213821383FA9B-413791381
1302FA9B-71291
1412
Name of VariableGPAr
ACH
Ph siolo
701
808877FA3B-51514
AchievementFull WAIS I.Q.Edwards Personality Inventory (EPI) A. motiv. to succ.EPI-D Plans Work EfficientlyEPI-N Is a hard workerEPI-O Neat in dressEPI - A D N 0
EPI-K SelfcenteredEPI-M Independent in opinion16PF-M ImaginationEPI-H,K,M, 16PF-L Suspicious (H =feels superior)Locus of Control C E
Awareness of contengercy in C.C.
ical Variables from Classical Conditioning
MT Mag I pain C.C.SC Mag I O.R. to C.S. C.C.SC Mag I Pain C.C.SC Low Mag I to painSP Mag D. Disc.(CR4.-CR0) (Dec Scored neg;
(Table 9 continued on next sheet)
79
. 856
. 451
. 169*
.247
.249
.152*
. 273
-.308-.286-.161*-.311.215
. 228
-.195-.210
-.225. 217
-.093*
-.023*.204. 262.234.197
.312-.222-.162*-.200-.246
dIM
. 203-.203

Table 9(continued)
Physiological Variables from Operant Conditioning
No. ofVar. Name of Variable
GPAr
ACHr
1037 SP SUM R .223- .223998 SP SUM H .233 .231
FA9B-3 SP SUM R, H, L -.204 '.271
1448 FP SUM R -.304 7-.349
1452 FP SUM H -.308 .352
1456 FP SUM L -.309. -.3541460 FP SUM R - L (FP scored neg) .277 273790 SC IN R -.216 229809 SC IN H -.261 -.265832 SC IN L -.2121443 SC Mag. I N H-L -.220 -.2591479 SC Mag. D N H-L 7.253 .257
1482 SP Mag. I N H-L -.195' ,,172*1487. SP Mag. D N R-L '.166* -.220FA9B-1 SC + SP N H-L -.2221401 HR SUM H-L .186* .190*
* * Achievement scores are residuals of GPA regressed on I.Q.Correlations starred are not significant but filled in for comparison.All other correlations in table are significant at least at the null
probability of .05 or less with 2 tailed test.Indicates, that particular correlation has not been computed..

TABLE 10
VarOrder
VarNo.
REGRESSION ANALYSIS FOR ACHIEVEMENT
Variable NameCUMR2
1 ACH -- Dependent Variable2 1456 FP SUM L OPC .10873 1460 . FP SUM R OPC .16614 809 SC IN H OPC .22375 FA9B-7 EPI-H,K,M; 16PF-L (Removed) .25726 998 SP SUM H OPC .23767 1302 16PF-M Imaginative .3086
FA9B-4 EPI-A, D, N, 0 MOTIV. .33809 1487 SP D N R-L OPC .3538
10 1379 EPI-K Self-centered .363011 FA9B-3 SP SUM R, H, L OPC .372812 790 SC N I R OPC .385813 1382 EPI-N Hard worker .395914 FA3B-5 SC - Low Mag I, Pain OPC .404415 1383 EPI-O Neat in dress .410016. 1369 EPI-A Motivation to succeed .411517 1443 SC Mag I N H-L 'OPC .412818 FA9B-1 SC + SP N H-L OPC .413319 1514 SP DI Hi-Low Tone cc (not used).20 1372 EPI-D Plans work efficiently (not used)
A R2
PHYS PSY
.1087
.0574
.0576
.0304
.0158
.0098
.0130
.0085
.0013.
.0005
.0335
.0210
.0294
.0092
.0101
.0056,
.0015
Percent variance of ACH accounted for by OP Cond. Phys.. Var. 30.3%
Percent variance of ACH accounted for by Psychol. Var. 11.0%
81

TABLE 11
REGRESSION ANALYSIS FOR GPA
VarOrder
VarNo. Variable Name
1 G.P.A.2 1368 I.Q. Full WAIS3 1456 FP SUM L OPC4 1460 FP SUM R-L OPC5 FA9B-7 EPI- H,K,M, 16PF-L Removed)6 1479 SC ND H-L OPC7 1382 EPI Hard worker8 . FA3B-5 SC Low mag to pain OPC9, 998 SP SUM H OPC10 FA93- 3 SP SUM R,I1,L OPC11 1379 EPI. Self centered12 1381 EPI Independence in opinion13 832 SC NI L OPC14 790 SC NI R OPC15 809 SC NI H OPC16 1372 EPI Plcns work efficiently17 FA9B-4 EPI- A D N 0 Motivation18 1443 SC NI H-L OPC (not used)19 1482 SP NI H-L OPC (not used)20 FA9B-1 SC + SP N H-L OPC (not used)
.2044
.2790
. 3316
. 3847
. 4192
. 4422
.4689
.4837
. 4892
.4968
.5033
.5055
. 5080
. 5083
. 5085
.5089
Psychological, variables accounted for 29.52% of thevariance in GPA of which 20.44% was I.Q. and 9.08% wasEPI scales. Physiological variables accounted for 21.37%of the variance in GPA of which 18.70% was from OperantConditioning and 2.67% was from Classical Conditioningvariables.

DISCRIMINANT FUNCTILOW ACHIEVEMENT GROUP
L-GP H-GPPREDICTION PREDICTION
TABLE 12
ON ANALYSIS FOR ACHIEVEMENTHIGH ACHIEVEMENT
L-CAP
PREDICTIONS-No.
GROUPH-OPPREDICTION
.371* .628 1 .431 .5682 .939 .060 2 .129 '.8703 .508 .491 3 .015 :9844 .786 .213 4 .002 .9975 .429* .570 5 .368 .6136 .466* .533 6 .013 .9687 .578 .421 7 .062 .9378 .731 .268 8 .043 .9569 .207* .792 9 .212 .78710 .727 .272 10 .543* .456*11 .991 .008 11 .190 .80912 .556 .443 12 .161 .83813 .765 .234 13 .433 .56614 .824 .175 14 .053 .94615 .802 .197 15 .145 .85416 .852 .147 16 .158 .84117 .425* .574 17 .423 .57618 .241* .758 18 .228 .77119 .766 .233 19 .387 .61220 .388* .611 20 .506 .493*21 .682 .317 21 .046 :95322 .255* .744 22 .950. .049*23 .983 .016 23 .413 .58624 .649 .350 24 .640 .359*25 .929 .070 25 .113 .88626 .717 .282 26 .335 .66427 .957 .042 27 .227 .77228 .783 .216 28 .346 .65329 .979 .020 29 .540 .459*30 .929 .070 30 .011 .98831 .977 .022 31 .089 .91032 .910 .089 32 .184 .81533 .759 .240 33 . .012 .98734 .767 .232 34 .475 .52435 .925 .074 35 .758 .241*36 .200* .799 36 .327 .672.37 .586 .413 37 .121 .87838 .708 .291 38 .388 .61139 .685 .314 39 .470 .52940 .812 .187 40 .449 .55041 .976 .023 41 .152 .84742 .765 .234 42 .343 .65643 .761 .238 43 .284 .71544 .685 .314 44 .473 .52645 .741 .258 45 .450 .54946 .875 .124 46 .503 .496*47 .504 .495 47 .694 .305*48 .589 .410 48 .792 .207*49 .826 .173 49 .207* .85050 .783 .216
41 of Low GP Correct
81 Subjects Correctly Predicted as to Achievement Groupsupplied to the Regression Analysis.
83
40 of High GP Correctis S2.4% correct by the 19 variahles

TABLE #13DISCRIMINANT FUNCTION ANALYSIS FOR GPA
S-No.
LOW GPA GROUPS-No.
HIGH GPA GROUPL.OW GP
PREDICTIONHIGH GPPREDICTION
1 .132* 1 .961
2 .924 2 .984
3 .605 3 .992
4 .590 4 .711
5 .192* 5 .917
6 .791 6 .986
7 .911.
7 .941
8 .738 8 .666
9 .996 9 .667
10 .936 10 .36111 .520 11 .718
12 ..546 12 .704
13 .992 13 .913
14 .834 14 .981
15 .942 15 .886
16 .725 16 .848
17 .834 17 .307*
18 .636 18 .908
19 .425* 19 .036*
20 .831 20 .394*
21 .201* 21 .617
22 .925 22 .896
23 .638 23 .958
24 .942 24 .518
25 .669 25 .953
26 .648 26 .945
27 .900 27 .736
28 .799 28 .898
29 .893 29 .975
30 .994 30 .912
31 .936 31 .991
32 .140* 32 .789
33 .713 33 .567
34 .437* 34 .511
35 .941 35 .544
36 .559 36 .597
37 .782 37 .651
38 .558 38 .400*
39 .913 39 .196*
40 .907 40 .659
41 .343* 41 .569
42 .827 42 .856
43 .729 43 .708
44 .971 44 .900
45 .963 45 .824
46 .650 46 .716
47 . &59 47 .395*
48 .956 48 .118*
49 .938 49 .857
50 .381*
42 of low GPA GP correct. 42 of High GPA GP Correct.84 subjects of 99 were correctly predicted as to GPA GP by the 19 variables supplied to
the regression analysis. 84.34% correct.
84

APPROVAL FOR RESEARCH BY LAFAYETTE CLINIC COMMITTEE ON
HUMAN AND, ANIMAL EXPERIMENTATION
TO WHOM IT MAY CONCETTI:
The experimental procedure(s) involvinu human subject(0 outlinnriin this application, entitled ' "Autonomic Learning Aptitude as a Factor in tinder -
have boon thoroughly evaluated an:i approved.by the Committee, on (and otHuman and Animal Experimentation of the Way°. tte Clinic, following Won topolicies and proze,dures establinir.ci by the Clinic entitled (Achievement*Guidelines for Research investigations Involving Hurnan Subjects"(copy attached) .
The Committee is 'compo:,ed of (nItmt.:rr) members, who reprr.nontthe Yollowing disciplines and int-rests: Mrs. Irene OksheaDr. Albert Ax ,Dr. Charles FrohmanDx,Alexander. Lucas, Dr. Elliot D. Luby
(21-61,i -/ 046Signature of Principal Invostigator
Dr. Albert Ax
Name of Principal Investigator
/fitie°: (z..te?,,,,--/4,
Signature of Chairman of Committeeor his designate
Name of Chairman of Committee orhis designate
,ci -1C
Signature of 'Director of Lafayette Clinicor his designate
Dr. Jacques S. GottliebName of Directcr of Lafayette Clinic orhis designate
( I l /I:- ./(/ /(..' 41
Signature of Official authorized yb signfor institution
Mr. Abraham TakahashiNemo of Official authorized to sign forInstitution
85

LETTER OF PEMISSION TO CONDUCT THIS STUDY BY THERESEARCH AND DEVELOPMENT DEPARTMENT OF THE DETROIT PUBLIC SCHOOLS.
SUBJECT: Approved Reflarch Stud:r Research Studyilo.69059
"4.
rRom : Robert S. bankton, Divisional Director, Research and Development Dept.
TO , Principal, School
DATE May 2, 1969
The research study identified below has been reviewed and approved by theResearch and Development Department in accordance with the statement ofpolicy in the Administrative Handbook. Participation by individuals or byschools in this project is entirely voluntary.
If you desire further informL.tion, please call Dr. Ferdinand Galante of LheResearch Department, 833-7900, ext. 2502, Schools Center Bv:iding.
Name of research -sr!e2r:
Dr. Albert F. Ax, Head, Psychophysiolo7y Division, The Lafayette Clinic,951 E. Lafayette, Detroit, Michigan 48207
Title of project:
Emotional Learning Aptitude and. Achievement Motive in Underachievers
Purpose:
The Psychophysiology Laboratory at the Lafayette Clinic is continuingresearch into the problem of the underachiever and school dropout. Purposeof this study is to establish evidence for emotional learning aptitude and torelate it with the achievement motive and underachievement.
Grant-in-Aid from:
Office of Education, United States Public Health Service
Pupils and. Schools involved:
About 100 pupils selected by !principal and teachers for either under or normalachievement from one or two ef the following schools: Cooley, Soup` heastern,
Pershing, Vorthwestern, Horthern, Martin Luther King Senior High.
Procedures:
Y. The principals of these three high schools (Cooley, Southeastern, andPershing) have already shown interest and have indicated tentativeapproval to participate in the study. Only one or two schools will beused.
2. Participation or pupils ill be entirely voluntary. Each subject willbe paid forbis time (approximately $2.00 per hour). Students will heasked to report to Lafayette clinic for a series of tests includingautonomic conditioning, fantasy tests of achievement motivation, levelof aspiration, intelligence and personality tests. No drugs or blooctemples will be' used.
3. After agreement is obtained from students (70 underachievers and 30normal achievers), their parents' permission, in written form, will
86

LETTER OF PERMISSION TO CONDUCT THIS STUDY BY THE
RESEARCH AND DEVELOPMENT DEPARTMENT OF THE DETROIT PUBLIC SCHOOLS
Coif 'A.
Research Study No. 69059Page 2May 2, 1969
be required for students to participate. About six to eight hours oftime will be required for, the full battery of tests and.this willnecessitate the students' being excused from school for one day.
4. The subjects and the schools will be assured in writing that students'participation and the findings will be kept strictly confidential,nor will these findings be used for any other purpose than for scien-tific. research publication. Anonymity of students and schools willbe preserved.
5. About one year later, Dr. Ax and/or his staff will interview thesubjects, which will require about one hour, to find out theiremployment or school status at that time.
6. Approximate starting date: October, 1969.
TEAR SHEET
SUBJECT: Research Study No. 69059
I am willing to cooperate with The Lafayette Clinic in the proposed. study as outlined in this letter.
aff CLAM )I(
(Mrs.) M. Montgomelty, PrinciipalSoutheastern High School e
87

LETTER OF PERMISSION BY PARENTS FOR STUDENT TO PARTICIPATE
THE LAFAYpTTE CLINICDETR6IT
The Lafayette Clinic is nicking a study of healthy young people
and adults. We have described this study to your child and asked
if he would help the Clinic. When he comes to the Clinic he will
be interviewed, given some standami tests of personalit. where body
functions such as heart rate, sweating and so on will be measured
by means of sensors on the skin. These measures include reactions
to sound and to mild electrically produced heat sensation. No
drugs or injections will be given and no blood samples will be
taken. In any scientific publication of the results of this study,
the identity of the participants will in all instances remain con-
fidential.
Your cooperation is requested and your child will be paid for
his participation in the study which will take about 6 hours. If
you are willing to help in this way, please sign th:;,s slip at the
bottom.
I am willing fOr my child to participate in this study at
The Lafayette Clinic for the purpose described above. I have had
an opportunity to fully discuss what he will be doing.
Parent Child
Address
Witness Date
88

LETTER OF PERMISSION BY STUDENT TO PARTICIPATE
T flELAFAYETTE CLINIC
DETROIT
The Lafayette Clinic is making a study of healthy young people
and adults. We have described this study to you and asked if you
would help the Clinic. When you come to the Clinic you will be
interviewed, given some standard tests of personality where body
functions such as heart rate, sweating and so on will be measured
by mans of sensors on the skin. These measures include reactions
to sound and to mild electrically produced heat sensation. No
drugs or injections will be given and no blood samples will be
taken. In any scientific publication of the results of this study,
the identity of the participants will in all instances remain con-
fidential.
Your cooperation is requested and you will be paid for your
participation in the study which will take about 6 hours. If you
are willing to help in this way, please sign this slip at the bottom.
I am willing to participate in this study at The Lafayette
Clinic for the purpose described above. I have had an opportunity
to fully discuss what I will be doing.
Witness
Signed.
Address
89
Date